Stormwater Quality Benefits of Permeable Pavement Systems with Deep Aggregate Layers


1
Vision Engineering, Lexington, KY 40517, USA
2
Center for Infrastructure Research, Department of Civil and Environmental Engineering, University of Louisville, Louisville, KY 40292, USA
3
Louisville Parks and Recreation, Louisville, KY 40213, USA
*
Author to whom correspondence should be addressed.
Environments 2018, 5(6), 68; https://doi.org/10.3390/environments5060068
Submission received: 17 May 2018
/
Revised: 30 May 2018
/
Accepted: 3 June 2018
/
Published: 5 June 2018
Abstract
:Green infrastructure (GI) stormwater control measures (SCMs), such as permeable pavement systems, are common practices used for controlling stormwater runoff. In this paper, two permeable pavement strips were studied to quantify their water quality performance. The quality monitoring was coupled with comprehensive rainfall analysis to investigate the effects of common rainfall characteristics on the quality performance of the systems. The pavements utilized deep aggregate layers to promote higher infiltration, and were installed in parking lanes of an urban neighborhood. Water quality samples were collected from upgradient stormwater runoff and from stormwater captured by the permeable pavements. In addition to total suspended solids (TSS), nutrients, and dissolved metals, this research also investigated bacterial contamination (Escherichia coli, E. coli). The results indicated that the two permeable pavement systems significantly reduced concentrations of TSS, E. coli, total phosphorus, and ammonia. The average reductions of TSS and E. coli between the two systems were 47% and 69%, respectively. It was also observed that pollutant loadings in the stormwater runoff, as well as pollutant reductions, were affected by the intensity of sampled rainfall events. Thus, it is suggested to consider the effects of rainfall characteristics when reporting the water quality benefits of stormwater GIs.
Keywords:
stormwater; runoff; water quality; permeable pavement; green infrastructure; TSS; nutrient; E. coli1. Introduction
The development of urban areas and the associated expansion of impermeable surfaces result in an increase in runoff volumes and peak discharges, as well as pollutant loadings [1,2,3,4,5,6,7]. Stormwater runoff can carry pollutants such as suspended solids, phosphorus, nitrogen, oils, heavy metals, and pathogens into receiving surface waters and groundwater supplies [8,9,10,11]. These pollutants are expected to cause water quality degradation in local rivers and streams, thereby impairing the quality of aquatic life, as well as contaminating drinking water resources [12]. According to the United States Environmental Protection Agency (USEPA), approximately 46% of identified cases of water quality impairment in the United States were due to stormwater runoffs [13].
Green infrastructure (GI) stormwater control measures (SCMs), such as bioretention areas, dry and wet ponds, and infiltration practices (infiltration trenches and permeable pavements), are frequently used to remediate stormwater quantity concerns. These systems may also be a solution to the quality issues caused by stormwater runoff [14]. GI systems are expected to reduce pollutant loadings, including phosphorus, nitrogen, suspended solids, and pathogenic bacteria, from stormwater runoff [15,16,17,18,19].
A common GI SCM used within urban environments to help mitigate stormwater flow is a permeable pavement. A permeable pavement system is defined as a paved surface that allows the runoff to infiltrate into a reservoir structure constructed below the pavement surface, which ultimately exfiltrates into the surrounding and underlying in situ soil layers [20]. These pavements are usually installed in areas with low traffic loads, such as parking lots, walkways, and the parking lanes of streets.
Previous studies showed the effectiveness of permeable pavements in both improving stormwater quality and reducing runoff volume [2,15,16]. The efficiency of pollutant removal for permeable pavements and infiltration trenches, presented in the National Pollutant Removal Performance Database (2006), indicated high removal rates for total suspended solids (TSS), total phosphorus (TP), zinc (Zn), and copper (Cu). However, the removal of nitrogen oxides (NOx) was reported as close to zero [14]. Similarly, Brattebo and Booth (2003) observed lower concentrations of dissolved metals such as zinc and copper in exfiltrated samples when compared with those from the runoff [15]. Another study by Bean et al. (2007) reported significant removal rates of total Kjeldahl nitrogen (TKN), ammonia, and total phosphorus for permeable pavements [2]. A recent study by USEPA, published following the conclusion of this research, investigated the reductions of indicator organisms for three types of permeable pavements (pervious concrete, porous asphalt, and permeable interlocking concrete pavements (PICPs)) with shallow underlying reservoirs [21]. Escherichia coli (E. coli) reductions greater than 90% were observed for porous asphalt and pervious concrete, but the PICPs only showed a 39% reduction in E. coli.
While the previous studies indicated that permeable pavement systems may reduce the concentrations of various pollutants, there is currently limited research available on the benefits of bacterial contamination removal for these systems, or on the effect of rainfall characteristics (intensity, antecedent conditions, etc.) on their water quality performances.
This study investigates the pollutant removal performances of two permeable pavements applied in an urban environment, while also considering the effect of rainfall characteristics. To achieve the objectives of this study, samples from stormwater runoff and from the captured volume at the bottom of the base-course layer of permeable pavements were collected during the first flush of 19 rainfall events. These samples were analyzed for (1) Escherichia coli (E. coli), a known indicator of fecal contamination; (2) pollutants, such as TSS, nitrate, nitrite, and total phosphorus; and (3) dissolved metals, including zinc, copper, and iron.
2. Materials and Methods
2.1. Project Background and Monitoring Site
Within Louisville, and many similar communities, combined sewer systems (CSS) are used to convey sewage and stormwater runoff within one piping system. During heavy and intense rainfall events, in which the stormwater runoff exceeds the capacity of the CSS, the excess volume is released into surface waters. The Louisville and Jefferson County Metropolitan Sewer District (MSD) is working to mitigate the volume and frequency of these combined sewer overflows (CSOs) in a small (approximately 11 hectares) urban sewershed, by using GI systems. To achieve this objective, the MSD installed a suite of GI SCMs in 2011 and 2013, including 14 permeable pavement systems, four infiltration trenches, and 27 tree boxes. Two of the permeable pavement systems (identified as GIs 17G and 17H) were selected for the monitoring efforts of water quality performance.
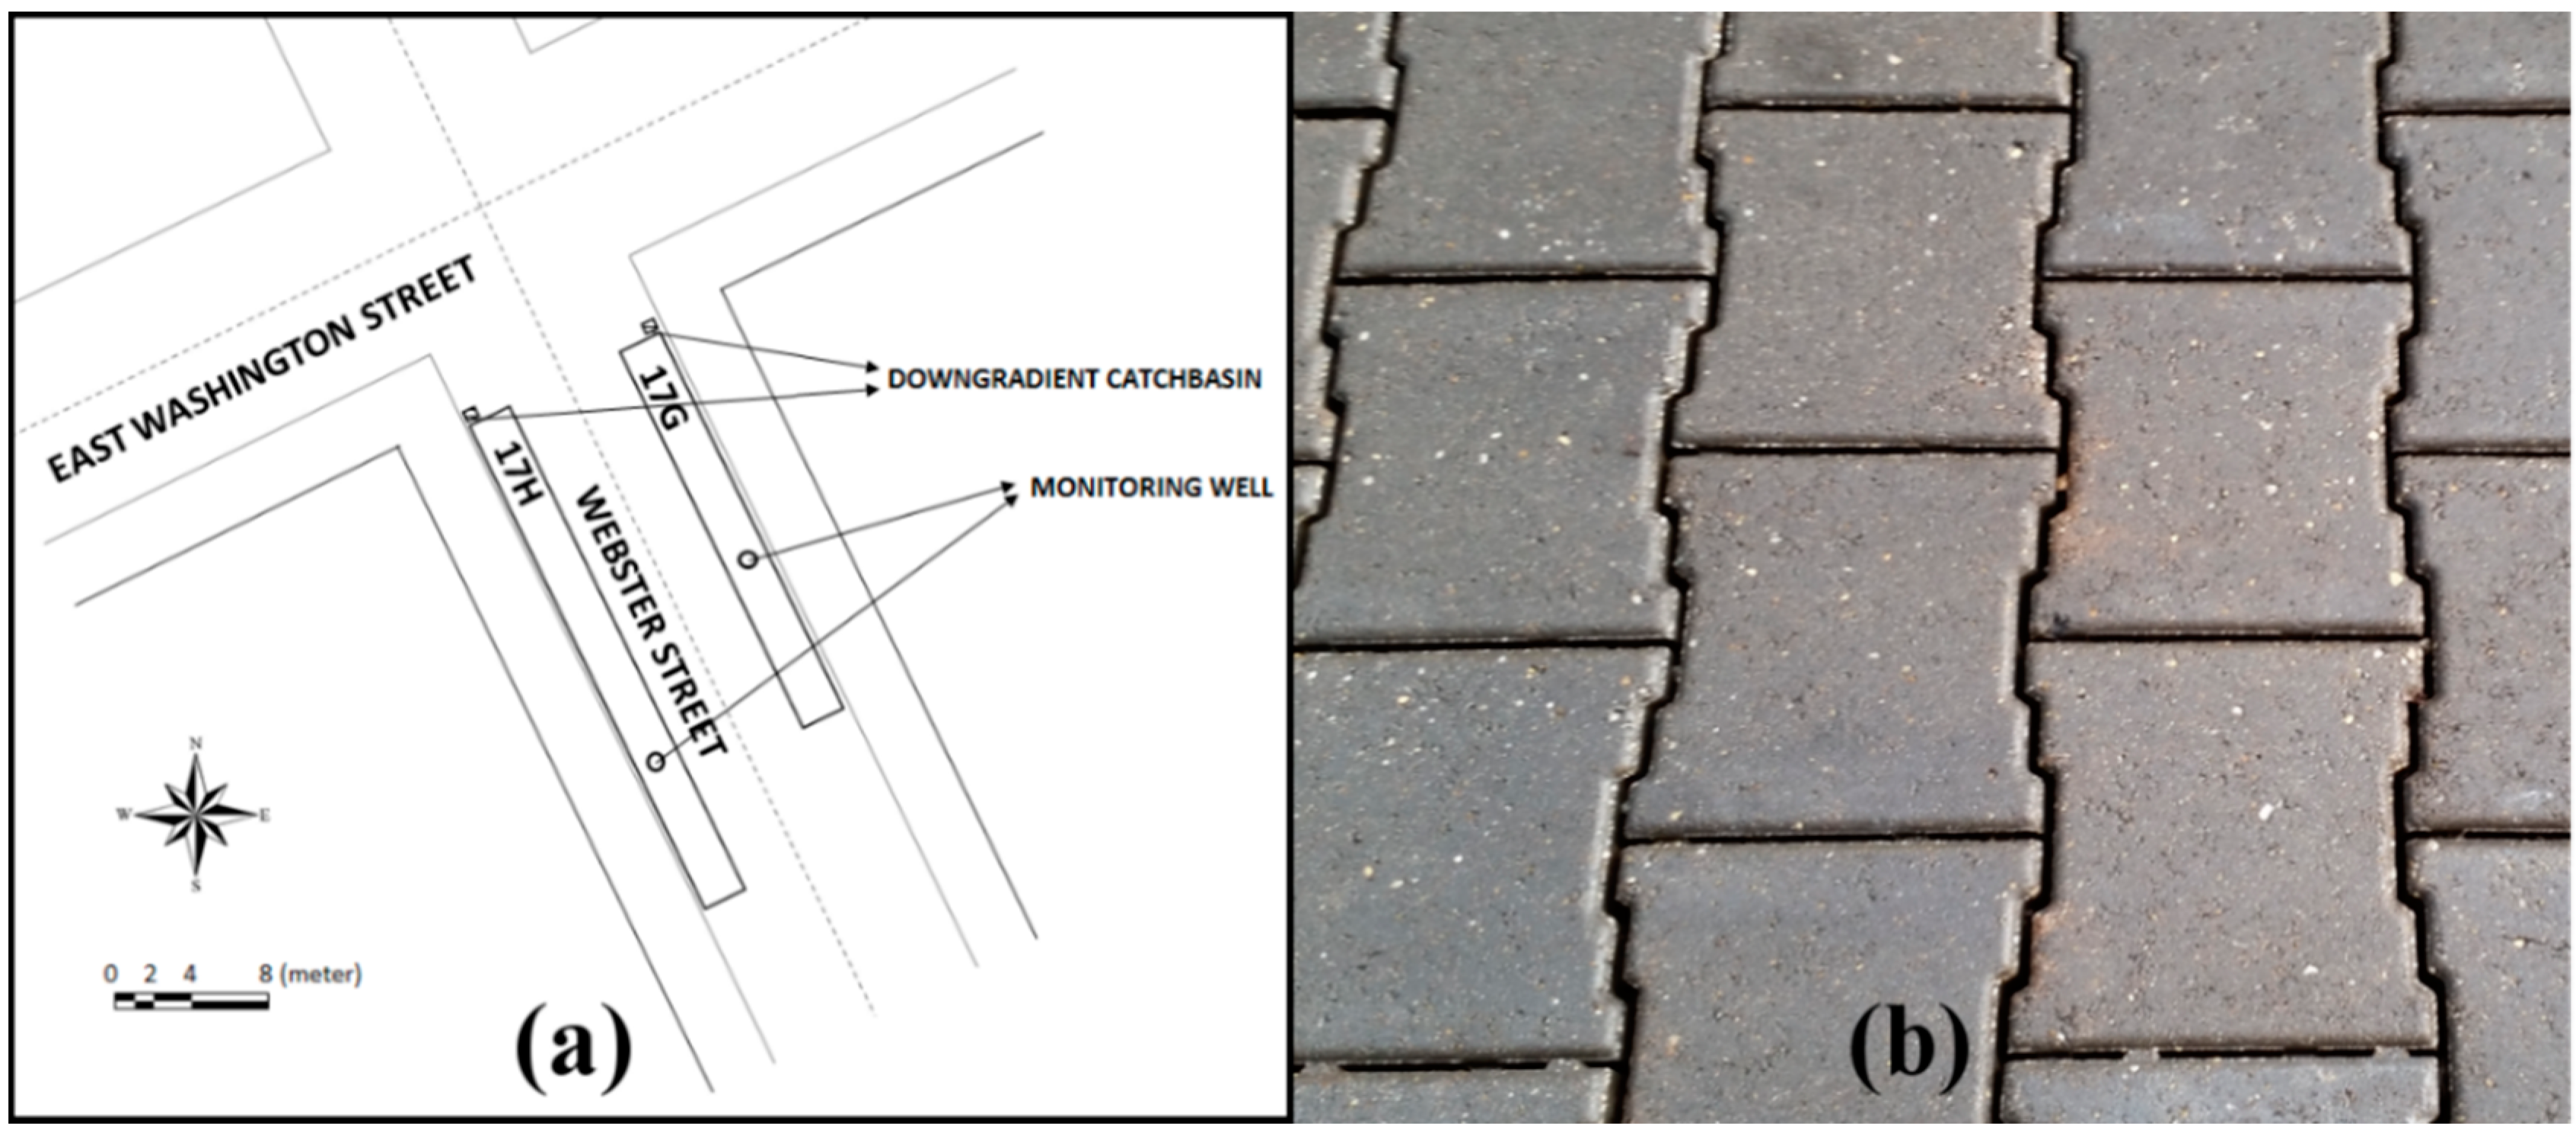
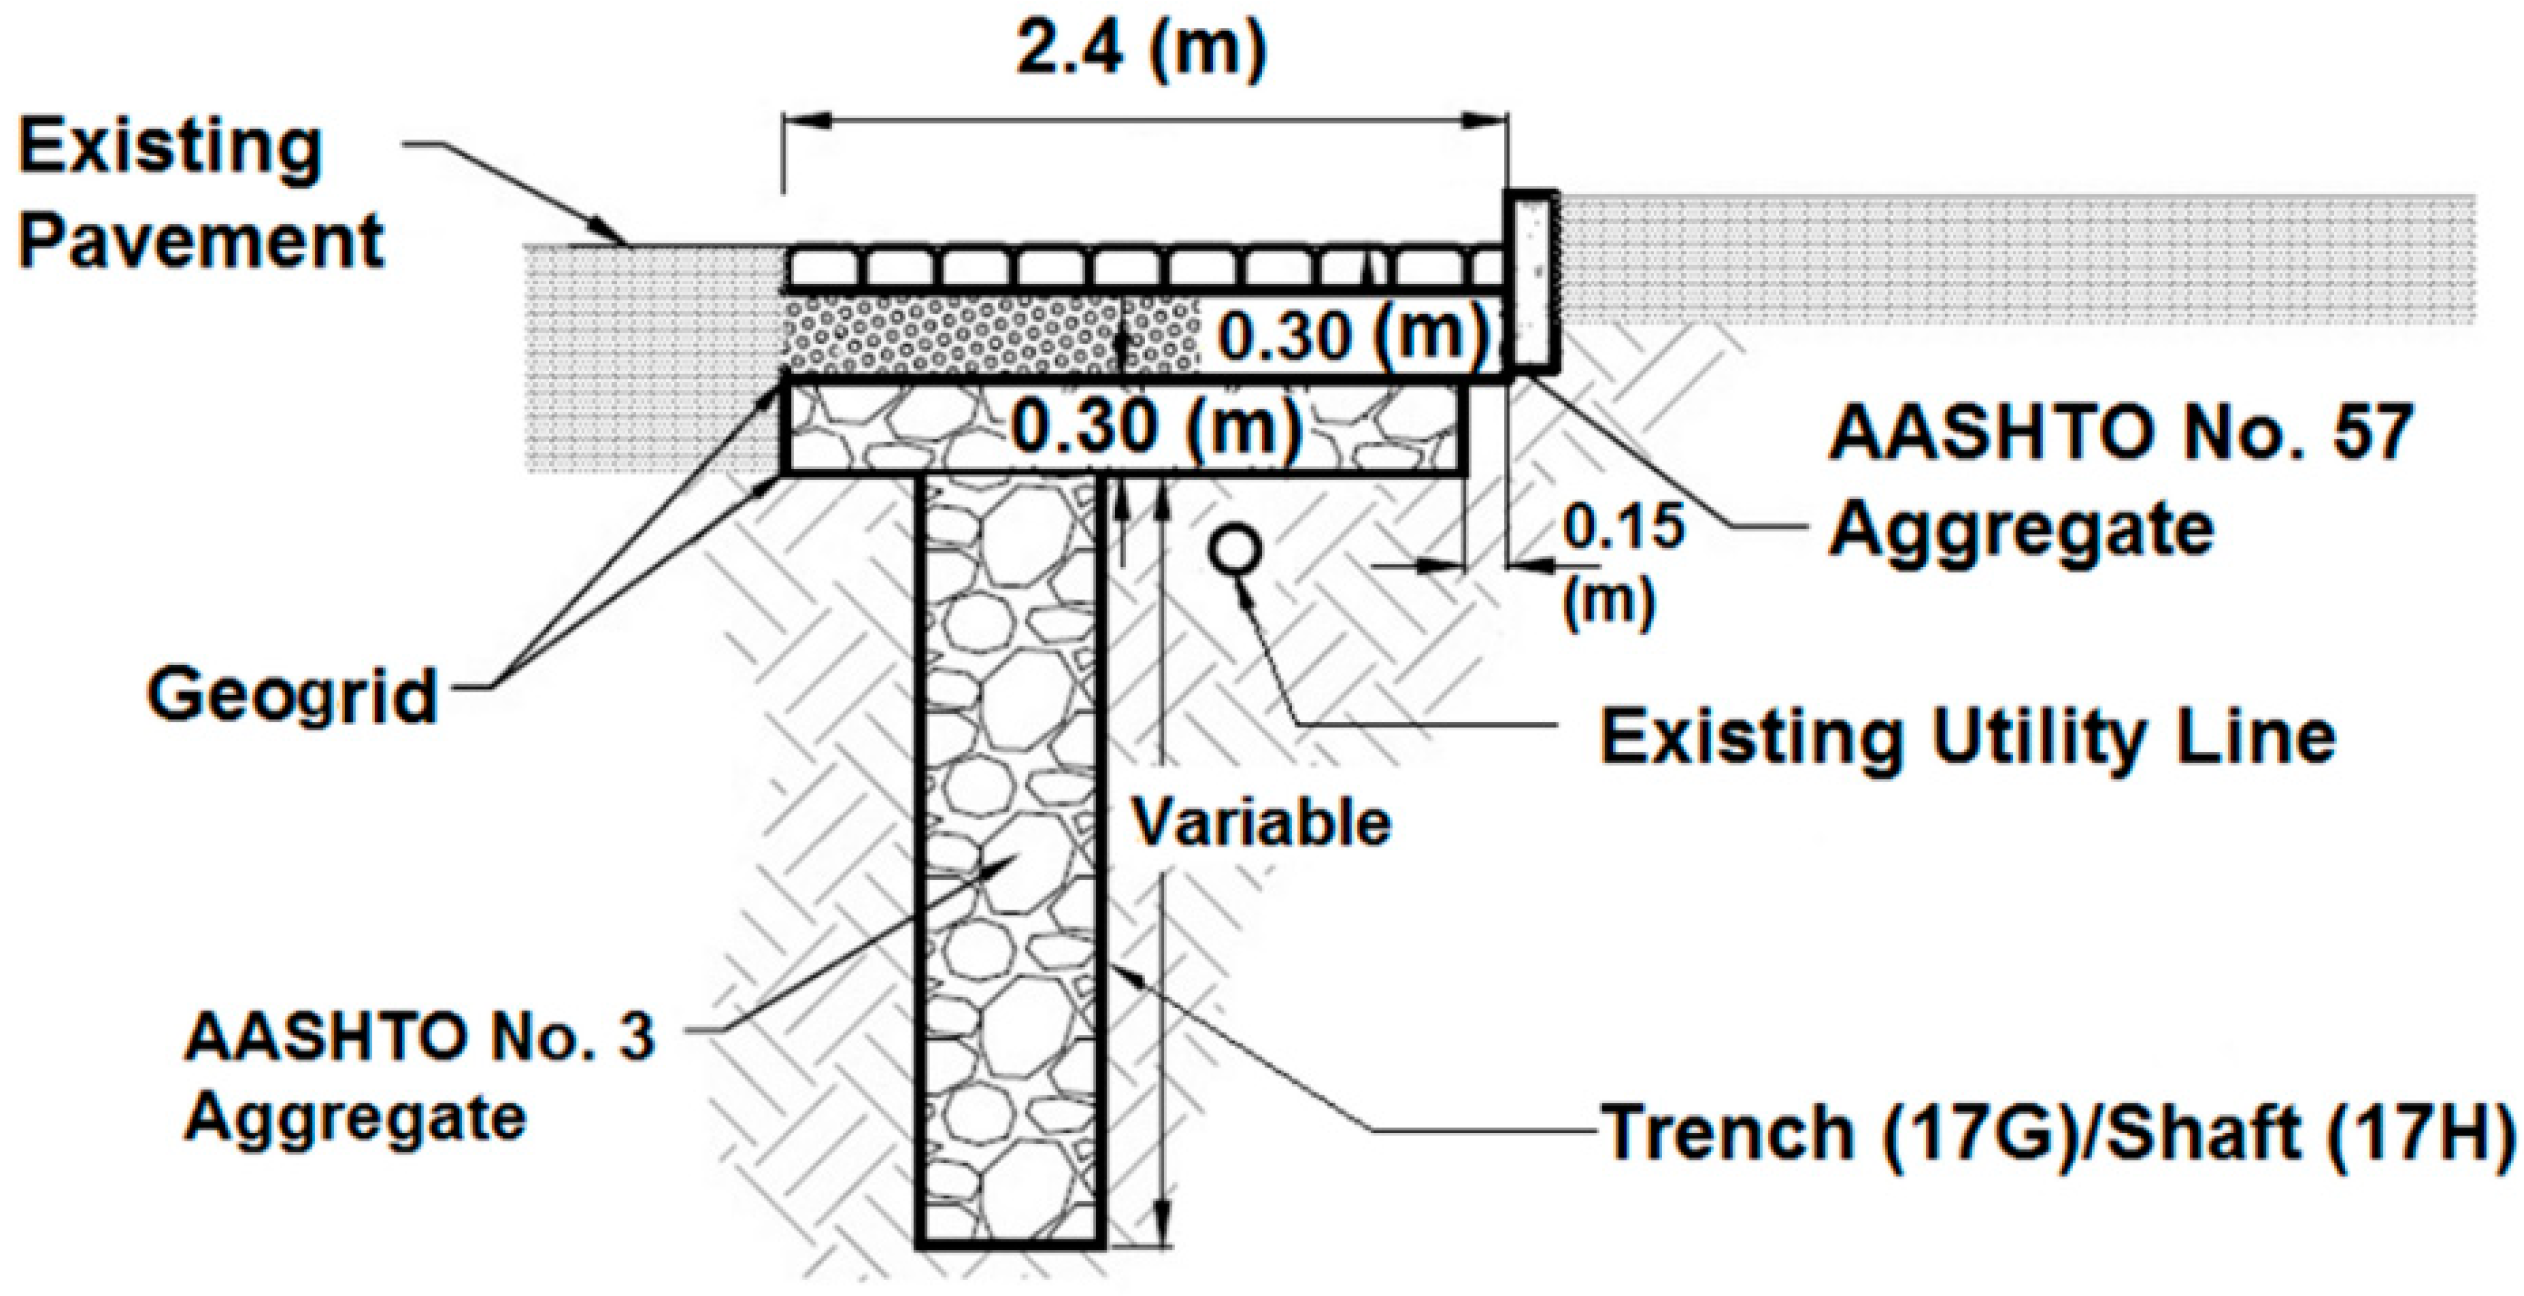
The two monitored permeable pavement systems were installed along the parking lanes of a two-lane street, upgradient of the existing sewer system’s catch basins (Figure 1). The specific dimensions of both systems are presented in Figure 2 and Table 1. Each permeable pavement system included the following:
- -
- A layer of 14.35-cm articulating concrete blocks/mats (ACBM) on top, leveled with the existing asphalt. The ACBMs, unlike permeable interlocking concrete pavements (PICPs), do not require fine aggregates between their joints.
- -
- A 61-cm deep storage gallery, filled with 30.5 cm of American Association of State Highway and Transportation (AASHTO) #3 stone on the bottom, and 30.5 cm of AASHTO #57 aggregate on top. A geogrid was installed between the two aggregate layers.
- -
- Either a series of drilled shafts (17H) or a trench (17G) was excavated underneath and along the storage gallery as additional storage, as well as an access method to deeper permeable sandy soils, which were backfilled with AASHTO #3 aggregate.
The trench and the shafts were off-centered to avoid existing utility lines, and had varied depths. The shaft casings in 17H were 46 cm in diameter, and ranged from 2 m to 4 m in depth. All shaft casings had slotted sections on their sides to allow for additional lateral exfiltration as well as exfiltration through the bottom area. The GI 17G had a 76-cm-wide trench excavated along its full length, with a sloping depth of 4.6 m at the upgradient edge and 1 m at the downgradient edge (Table 1).
2.2. Sampling and Testing Methods
The sampling from runoffs and captured stormwater volumes was conducted during the first 1.27 cm (0.5 inch) of precipitation, which was assumed to be representative of the “first flush”. The first flush runoff might represent a small portion of a storm’s total discharge but it includes a large percentage of the total contaminant loadings [22]. According to the National Stormwater Quality Database, the first flush concentrations of TSS, copper, lead, zinc, and total Kjeldahl nitrogen (TKN) are significantly higher than those in composite samples collected during the entire rain event [23]. Collecting samples during the first flush required extensive preparation prior to the onset of the storm event, which made weather forecasting an important aspect of the sampling effort. The National Weather Service (NWS) was used for long-term (five-day) forecasts when preparing the sampling equipment. The sampling procedure was scheduled in cases that the NWS forecasted a possibility of precipitation greater than 50%.
Three individual grab samples of equal volume (250 mL) were collected at equal time increments (10 min) during the first flush of each storm event. The individual samples were then mixed to form a single time-weighted composite sample for laboratory and on-site analyses. Since the runoff flowing into both systems was observed to be concentrated along the curbside, the samples were collected at the upgradient curbside location of the permeable pavements. The sampling procedure included the collection of duplicate samples in the field, and the analysis of replicate samples in the laboratory. Duplicate samples were taken for every 10 samples collected on the field. The replicate samples, which referred to samples that were split into subsamples, were created at the laboratory, and were tested for TSS, E. coli, and nutrients. The pollutant concentrations in the duplicate and replicate samples were compared with those of the original samples, in an effort to evaluate the relative percent difference (RDP). A threshold of 20% was used for the RDP values between the original samples and the duplicate and replicate samples.
To assess the pollutant removal performances of the GIs, samples were also collected from the bottom of the storage layers of 17G and 17H. Similar to the runoff sampling, time-weighted composite samples were collected from the bottom of the trench (17G) and shaft (17H) through pre-installed monitoring wells, using a mechanical bladder pump (model MB470, Geoprobe Systems, Salina, KS, USA) during the first flush. The sampling pump was specifically designed for the collection of high-quality and low-turbidity samples from groundwater monitoring wells.
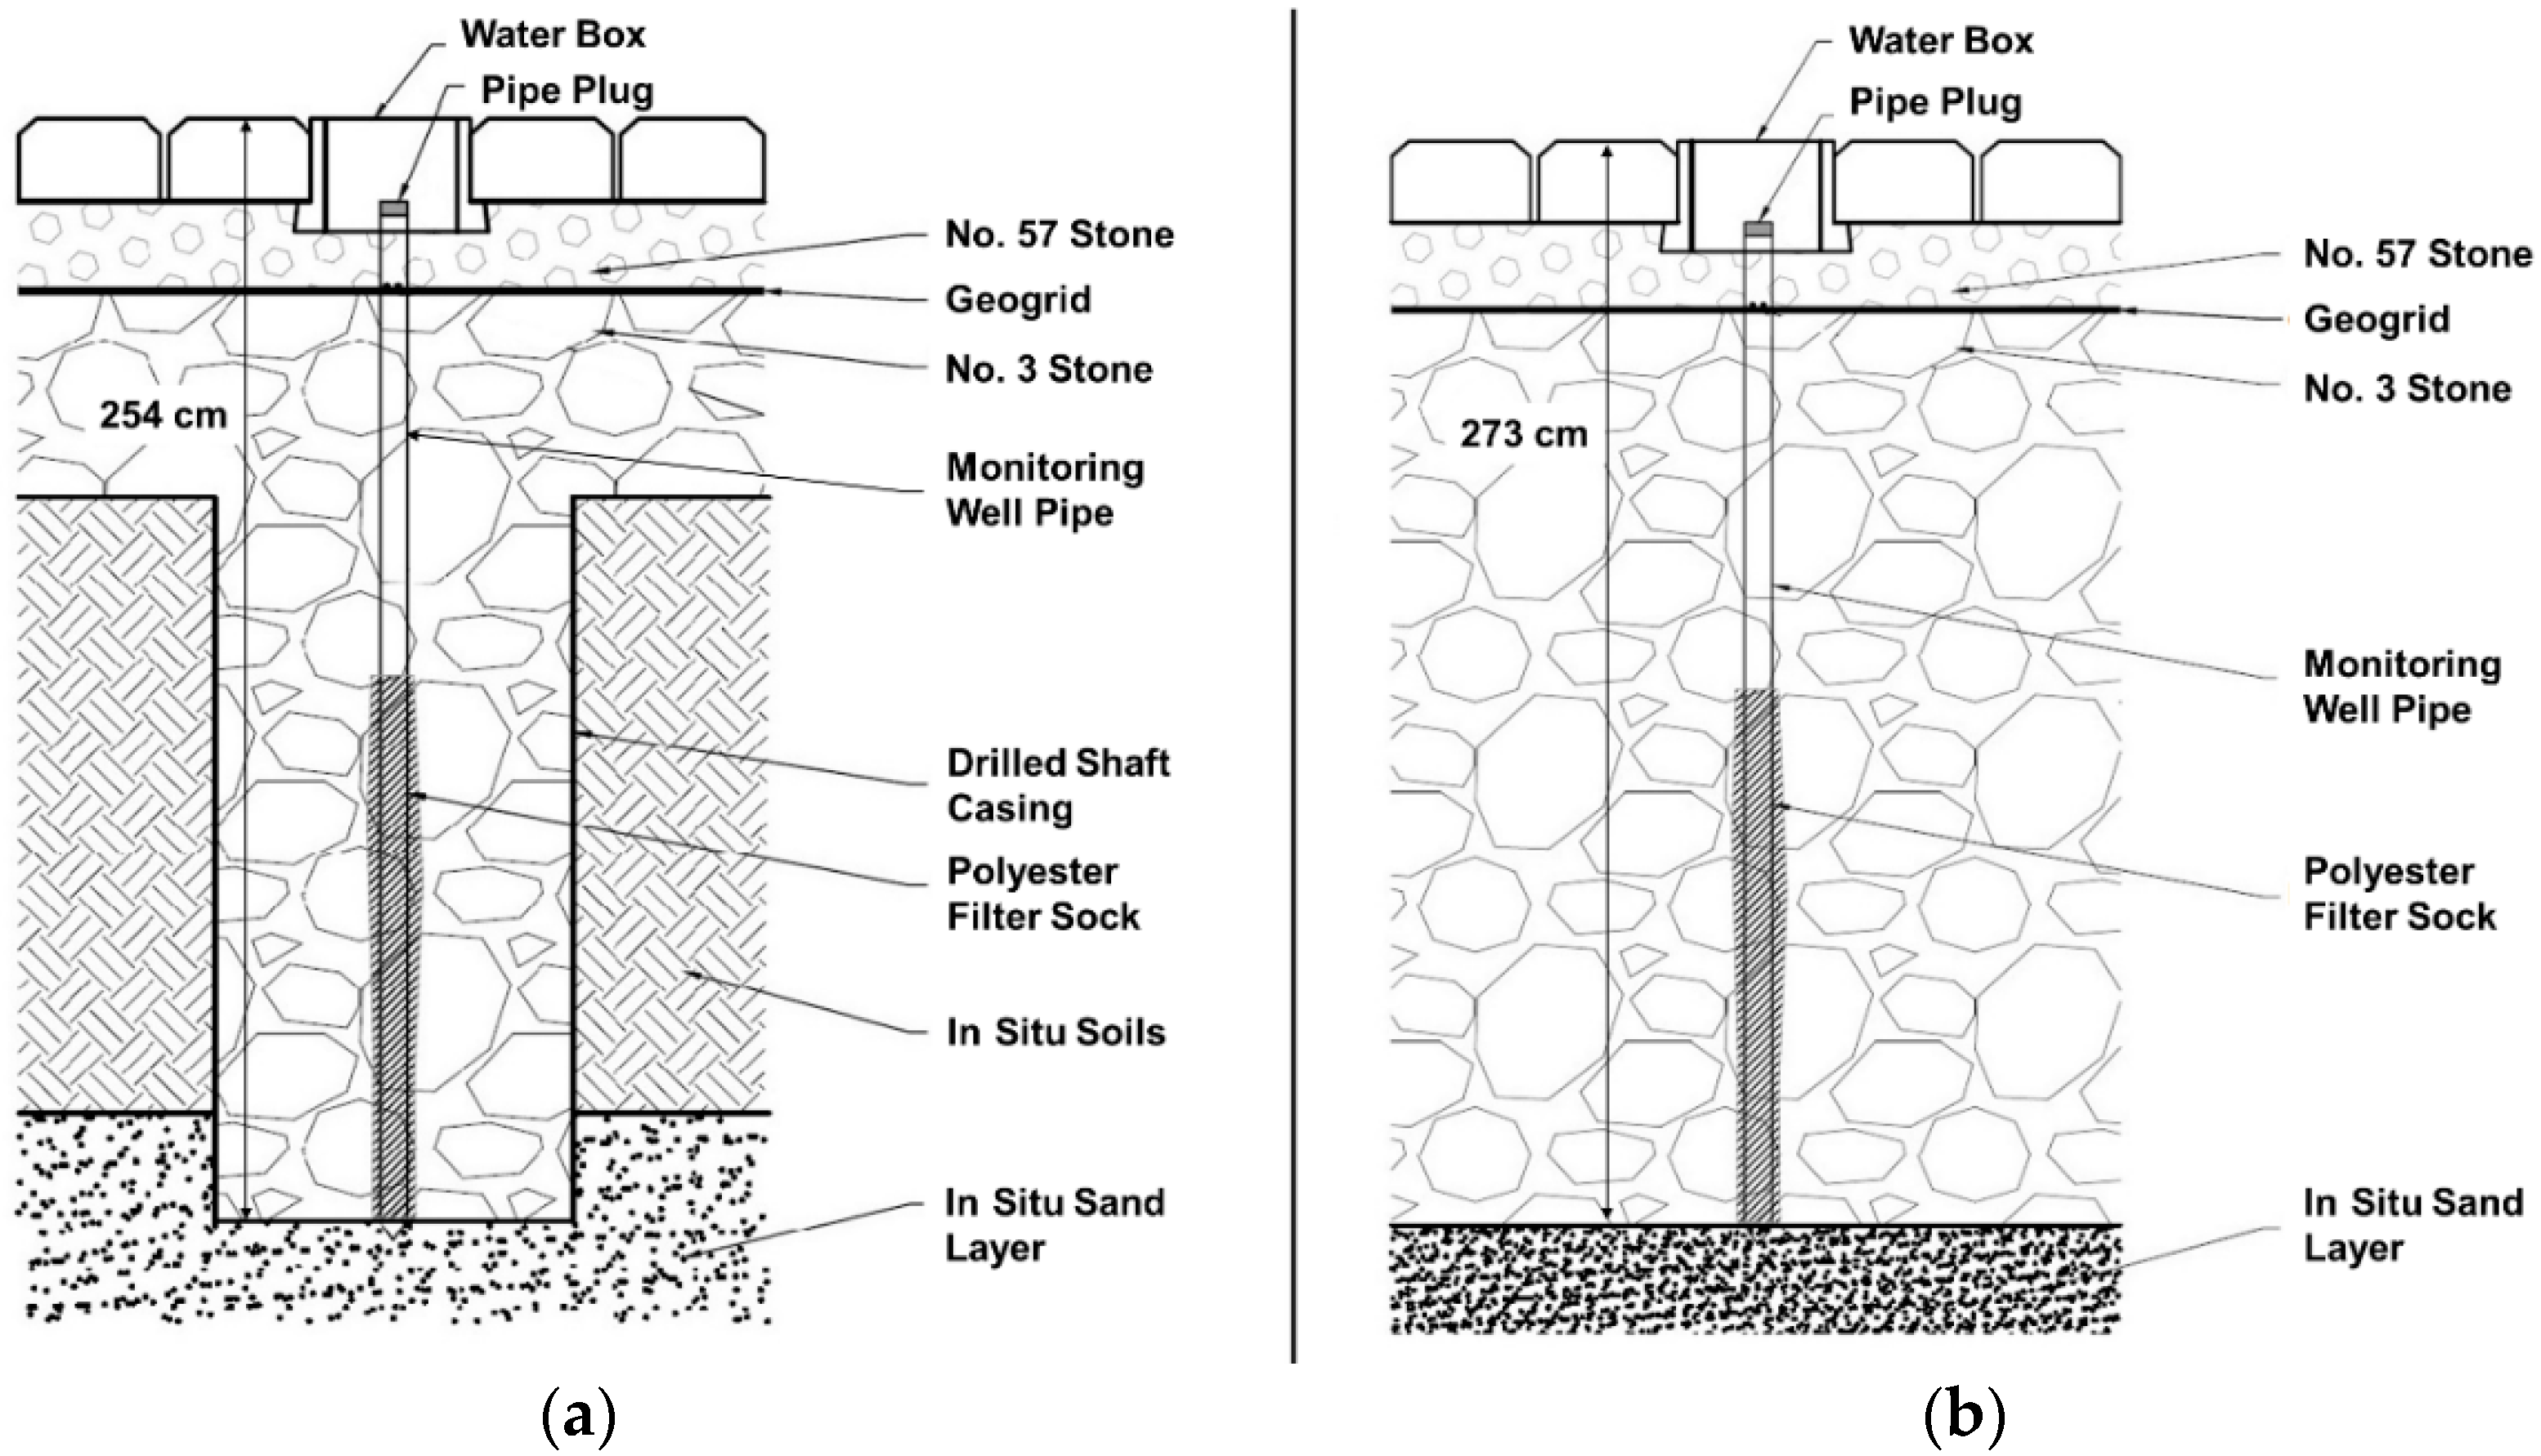
The 2.5-cm-diameter monitoring wells had a 1.5-m slotted screen at the bottom, which was covered with a groundwater polyester filter sock (pore size of 250 microns). The monitoring pipes were installed at 7.9 m and 9.1 m from the upgradient edges of GIs 17H and 17G, respectively (Figure 3).
2.3. Field and Laboratory Analysis
Some of the quality parameters, including water temperature, specific conductivity, and pH, were measured in the field and immediately after sample collections, using a YSI Professional Plus portable temperature/conductivity/pH meter (YSI Inc., Yellow Springs, OH, USA). For pH measurements, the electrode was calibrated before each sampling event by using buffer solutions (Fondriest Environmental Inc., Beavercreek, OH, USA) of pH 4, 7, and 10. The conductivity electrode was calibrated with a 1413-μS/cm-conductivity standard solution (Fondriest Environmental Inc., Beavercreek, OH, USA).
The laboratory samples were collected in high-density polyethylene (HDPE) bottles, and were placed in a cooler partially filled with ice to keep the temperature below 4 °C. The samples were delivered to the laboratory within six hours for bacterial analysis. The nutrients were tested within a 24-h period after sampling, except for those that followed special sample-preservation protocols recommended by the Center for Watershed Protection (CWP) [24]. The standard methods used in this study, and their minimum detection levels (MDLs) are summarized in Table 2. In samples with concentrations below the MDL, the concentrations were assumed as half of the MDL for statistical purposes.
2.4. Statistical Analysis
The collected data were statistically analyzed to compare the pollutant concentrations between runoff and captured volume samples. Paired Student’s t-tests with a criterion of 95% confidence (p < 0.05) were used to determine the statistical significance of changes in pollutant concentrations after passing through the permeable pavement layers. All paired data were tested for the assumption of normality prior to using the t-tests. If the assumption was found to be invalid, the data were logarithmically transformed, and tested again.
Correlation analyses were used to evaluate the strength of the relationships between various pollutant concentrations and rainfall characteristics. The Pearson’s correlation coefficient (PCC) was calculated to determine the strength of the correlations, if any, and p-values were subsequently calculated to investigate the significance of the relationships between the parameters. Higher values of PCC indicate stronger correlations between the tested parameters.
3. Results and Discussion
The water quality data collected during the one-year monitoring period (May 2014–May 2015), including 15 and 13 sampling events for 17G and17H, respectively, were analyzed to determine the performances of the GI systems. Along with this data, the rainfall characteristics of each sampled event, as provided by the radar data, were also determined. The following sections present and discuss the results from the conducted analyses.
3.1. Rainfall Characterstics
The continuous rainfall data was delineated into separate rainfall events by using a minimum 6-h antecedent dry period. During the course of this study, a total of 19 rainfall events were sampled (runoff and captured volume) and tested for a variety of pollutants. Table 3 includes the rainfall characteristics for these events, as well as the antecedent rainfall depth values, which indicate the rainfall depth prior to the start of each rainfall for a 7-day period. The sampled storms included a variety of events, ranging from 5.6 mm to 110.8 mm, with an average of 21.7 mm.
3.2. In Situ Measurements
The field measurements were conducted to determine pH, temperature, and specific conductivity (SC) values of composite samples during rainfall events 2–19 (15 for 17G, and 13 for 17H), as shown in Table 4. The results from both systems showed that measured temperatures of the captured stormwater in the reservoir structure of the pavements were slightly lower when compared with those of the runoff during warm months, and slightly higher during cold weather. No significant differences between the temperatures of runoff and captured stormwater samples were observed in either GI practice. The average pH values from the captured volume samples were slightly higher when compared with those from the runoff samples in both systems. The pH differences between the runoff and captured volume samples were found to be statistically significant (p-value < 0.05). Although the SC measurements in the captured volume were higher than those in the runoff, the differences were not determined as significant. The higher values of SC in the effluent samples were also reported in previous studies [15,19,25].
3.3. Pollutant Concentrations
Mean pollutant concentrations in the samples collected from runoff and captured stormwater volume, observed reduction percentages, and determined p-values at 95% confidence levels (p-value < 0.05) are presented for both systems in Table 5 and Table 6. The results indicated reductions in several pollutant concentrations in both permeable pavements, as discussed below.
Nutrient reductions were not significant except for nitrite (NO2) in 17G, ammonia (NH3) in 17H, and total phosphorous (TP) in both GI practices. Changes in nitrate (NO3) concentration were not found to be significant in either of the GIs. Nitrate concentrations in the captured samples were higher than those in the runoff for eight of the 15 monitored events for 17G, and seven of the 13 monitored events for 17H. Low, and sometimes negative, reduction percentages of nitrate and nitrite were reported in similar previous studies [2,26], and were expected since nitrate removal typically takes place with vegetated filtration and biofilters [25]. All samples from the captured stormwater showed lower concentrations of ammonia when compared with the runoff samples in both GIs, except for three events in 17G, for which the captured samples had slightly higher concentrations of NH3. Due to the nitrification process, a portion of the ammonia filtered by the aggregate media could be transformed to nitrite and nitrate under aerobic conditions. This process explains the higher concentrations of nitrite and nitrate in the captured volume samples when compared with the runoff samples.
The dissolved metal measurements during the first four events showed high mean reduction percentages (81% for Cu, 90% for Zn, and 60% for Fe) between runoff and captured volume samples; however, their differences were not determined as statistically significant. This could be a result of the small sample size (four) of dissolved metal measurements, which may have weakened the power of the parametric test [27]. These results for heavy metals were in agreement with previous similar studies, which found permeable pavements to effectively reduce Cu and Zn concentrations [2,28].
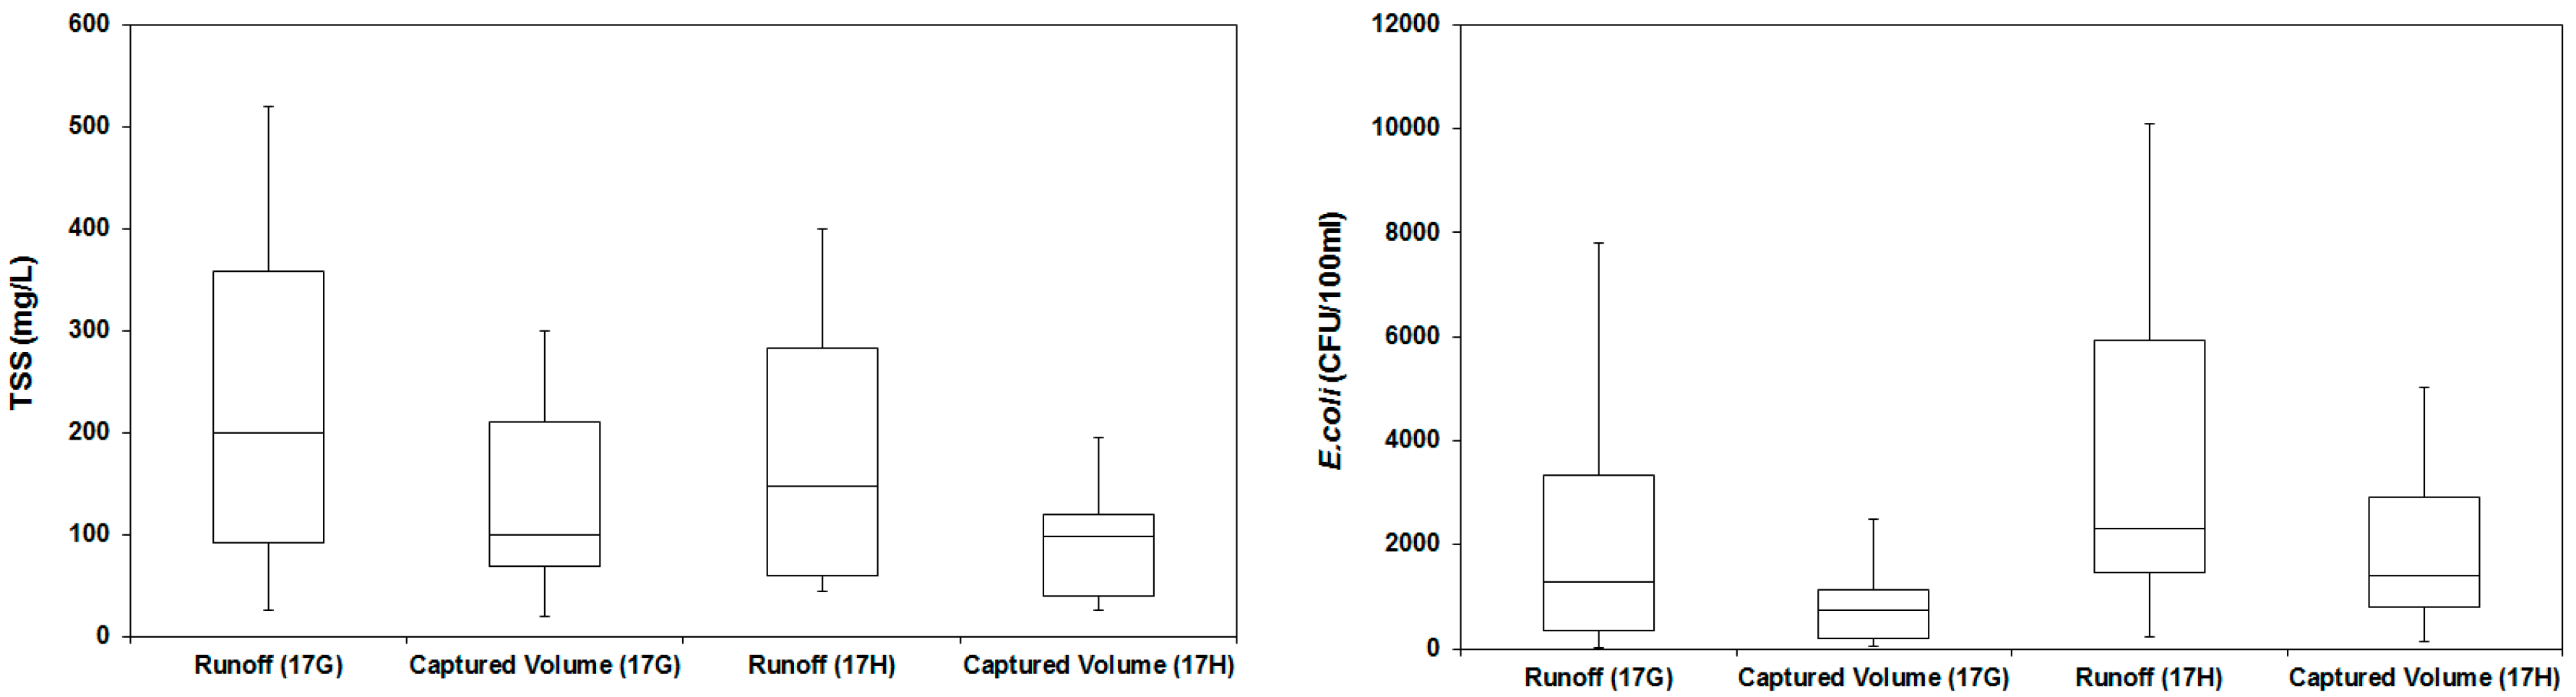
The samples from the captured stormwater volume showed significantly lower concentrations of E. coli and TSS when compared with the runoff in both systems. The mean reductions in TSS were 43% and 51% for 17G and 17H, respectively. The E. coli mean reduction percentages were 60% for 17G, and 78% for 17H. The measured concentrations of these two parameters are presented in Figure 4 as box plots for better comparison between the runoff and captured volume samples. The observed E. coli reductions were considerably greater than those seen in the PICP application studied by the USEPA [21] (60% and 78% versus 39%). The difference between both studies could be attributed to varying depths of underlying aggregate layers. The depth from the PICP surface to the sampling point was 40 cm [21], while in this study, the sampling depths were 254 cm and 273 cm for 17H and 17G, respectively (Figure 3).
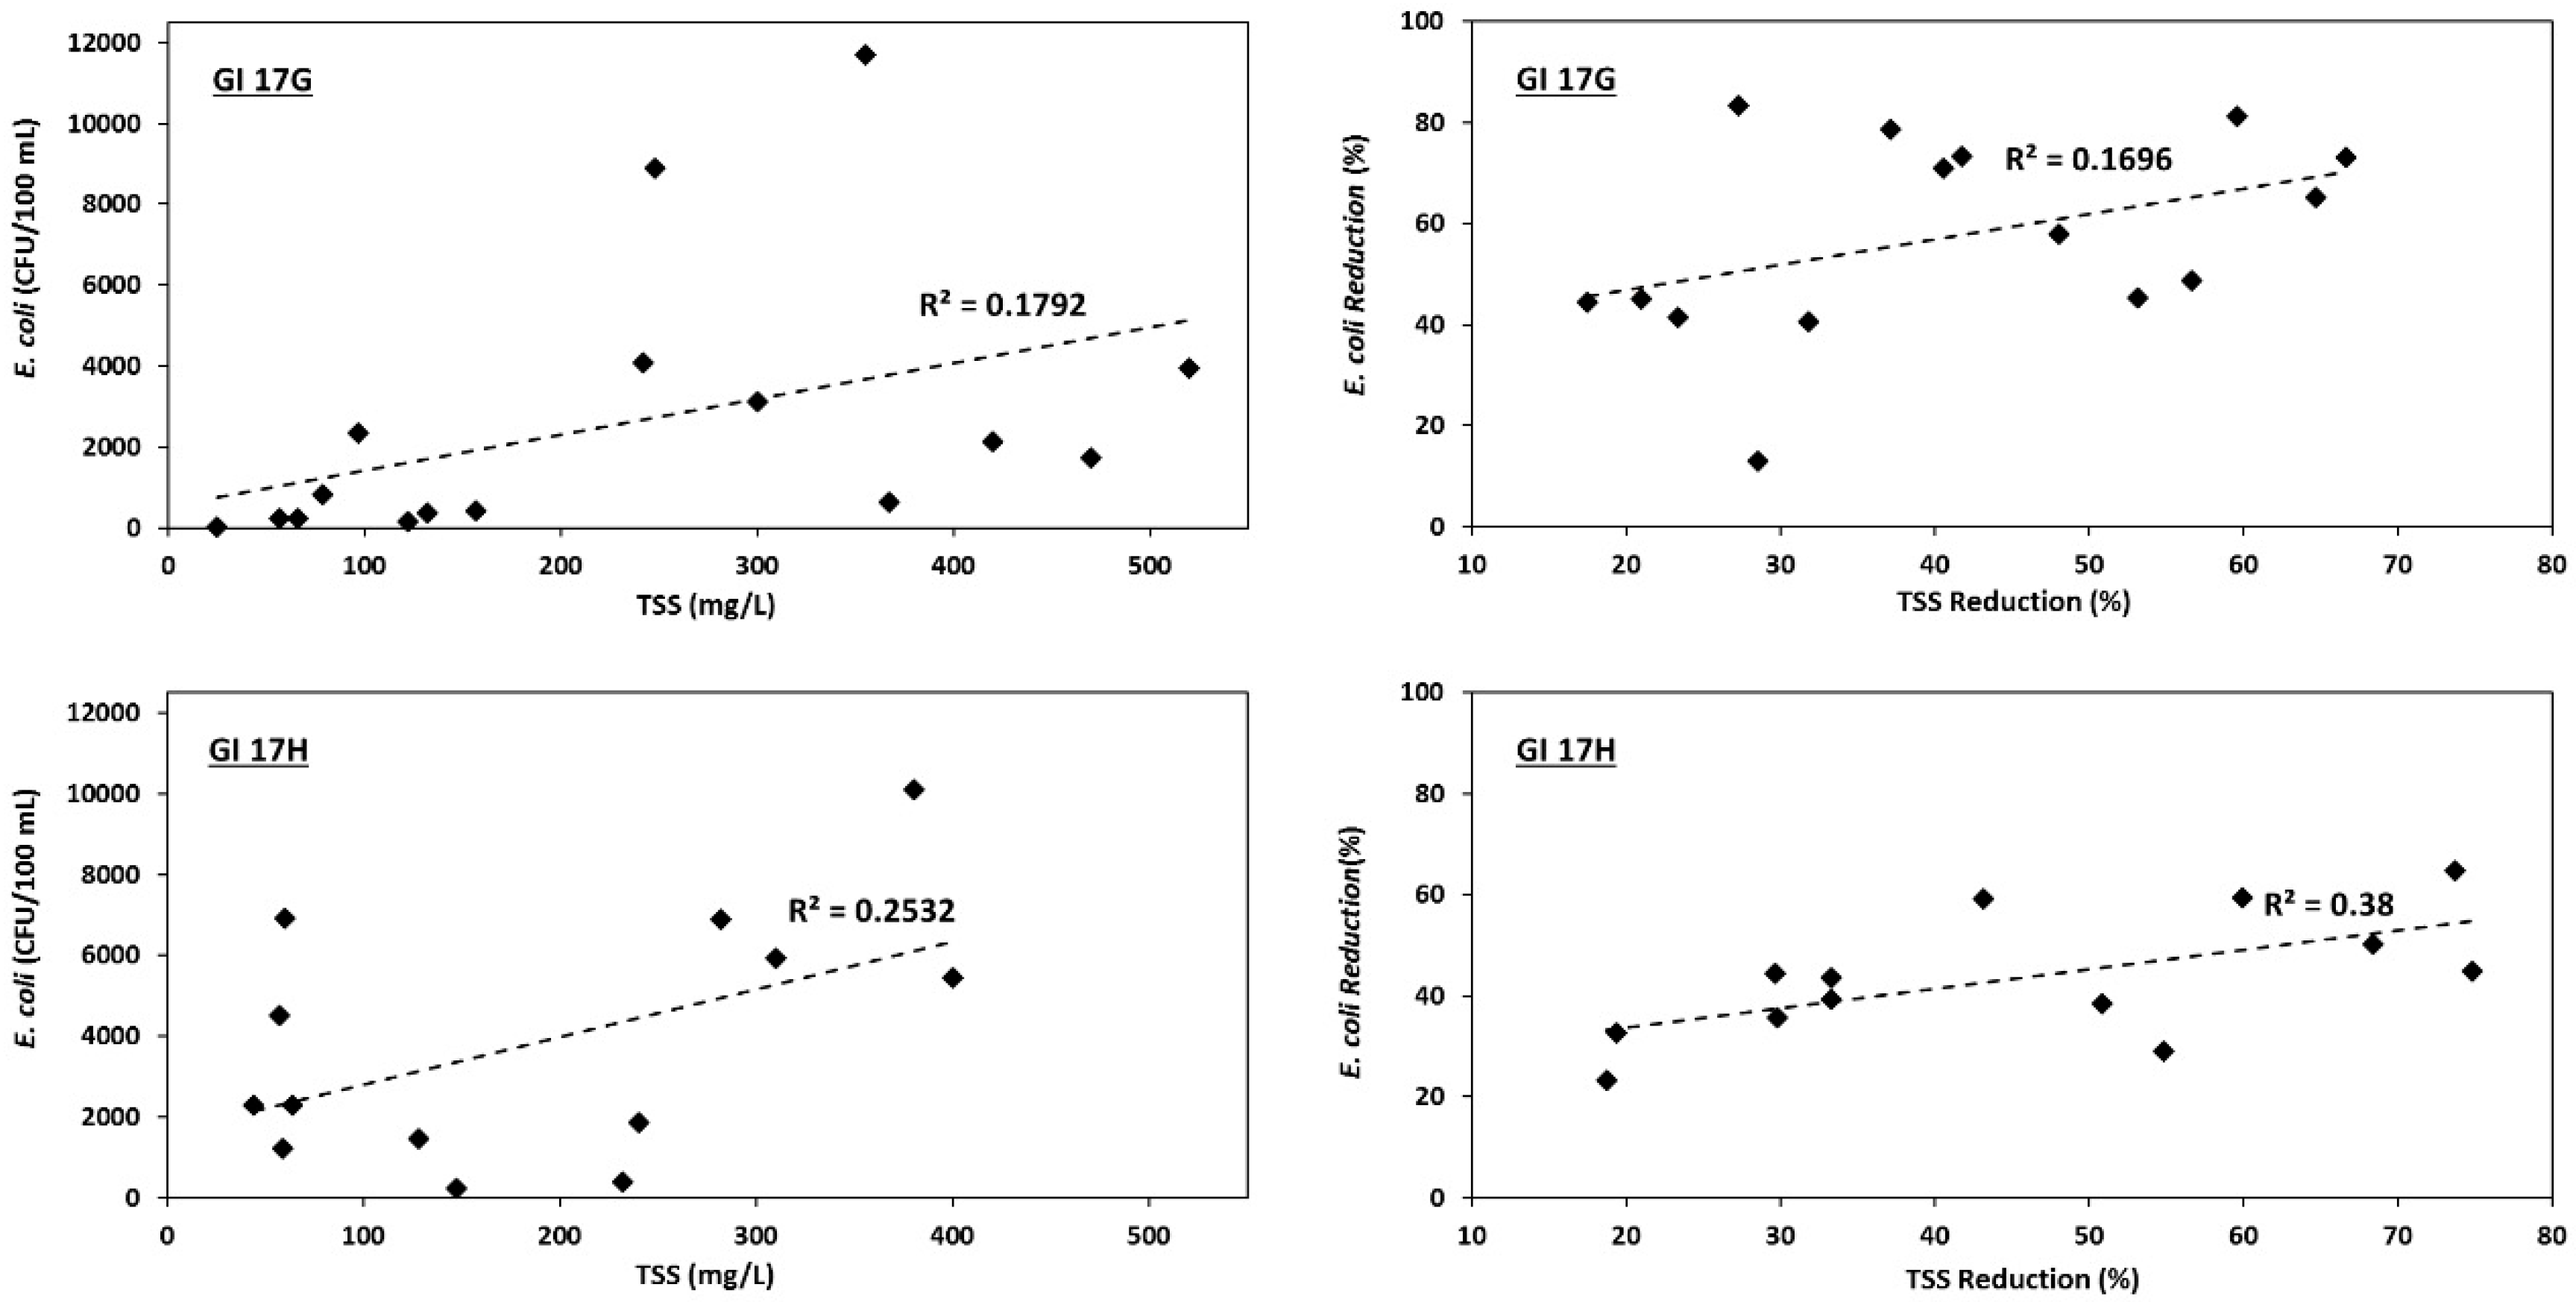
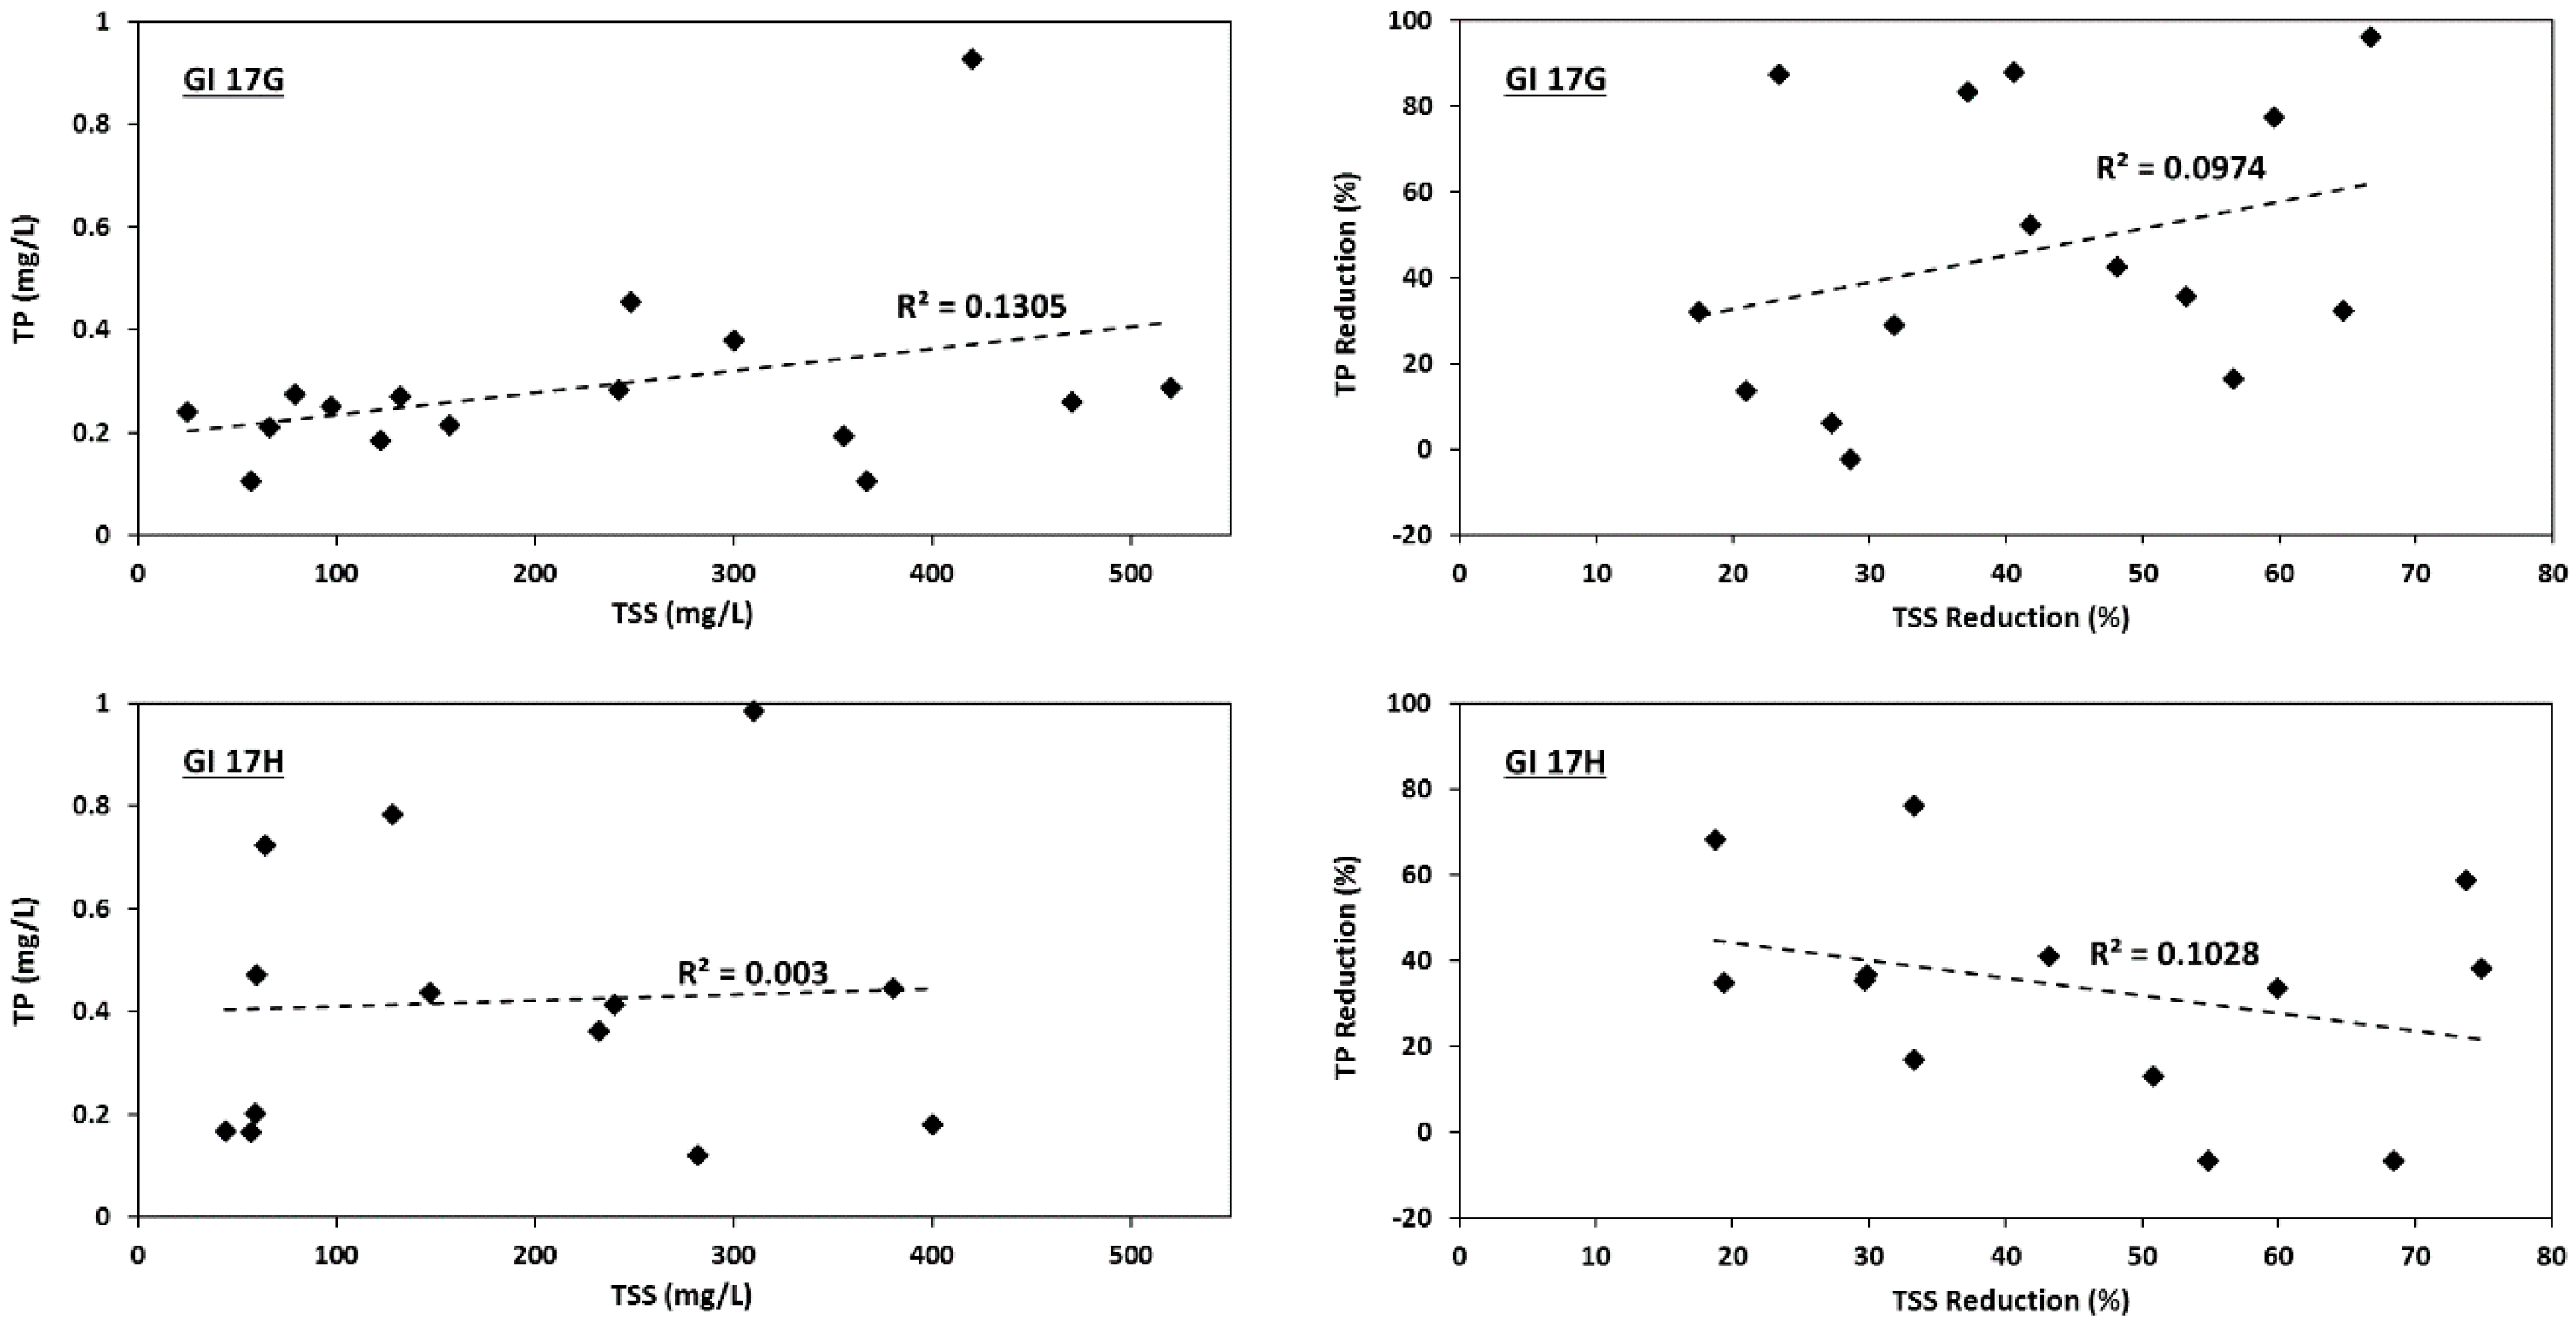
Positive relationships were observed between E. coli counts and TSS concentrations in the runoff samples, and also between their reduction percentages in both permeable pavement systems (Figure 5). This suggested that the removal processes of these two pollutants are affected by the same mechanism. Similar correlations were also reported, explaining that E. coli cells in streams are commonly associated with particulate materials and suspended solids [29,30,31]. The correlations between E. coli and TSS were stronger in 17H when compared with 17G (PCC17H > PCC17G), and even significant for the E. coli and TSS mean reductions (p-value = 0.025). Weak to moderate positive correlations were observed between TP and TSS concentrations, and between their reductions for 17G. However, similar trends were not observed for 17H (Figure 6).
3.4. Effect of Rainfall Characteristics
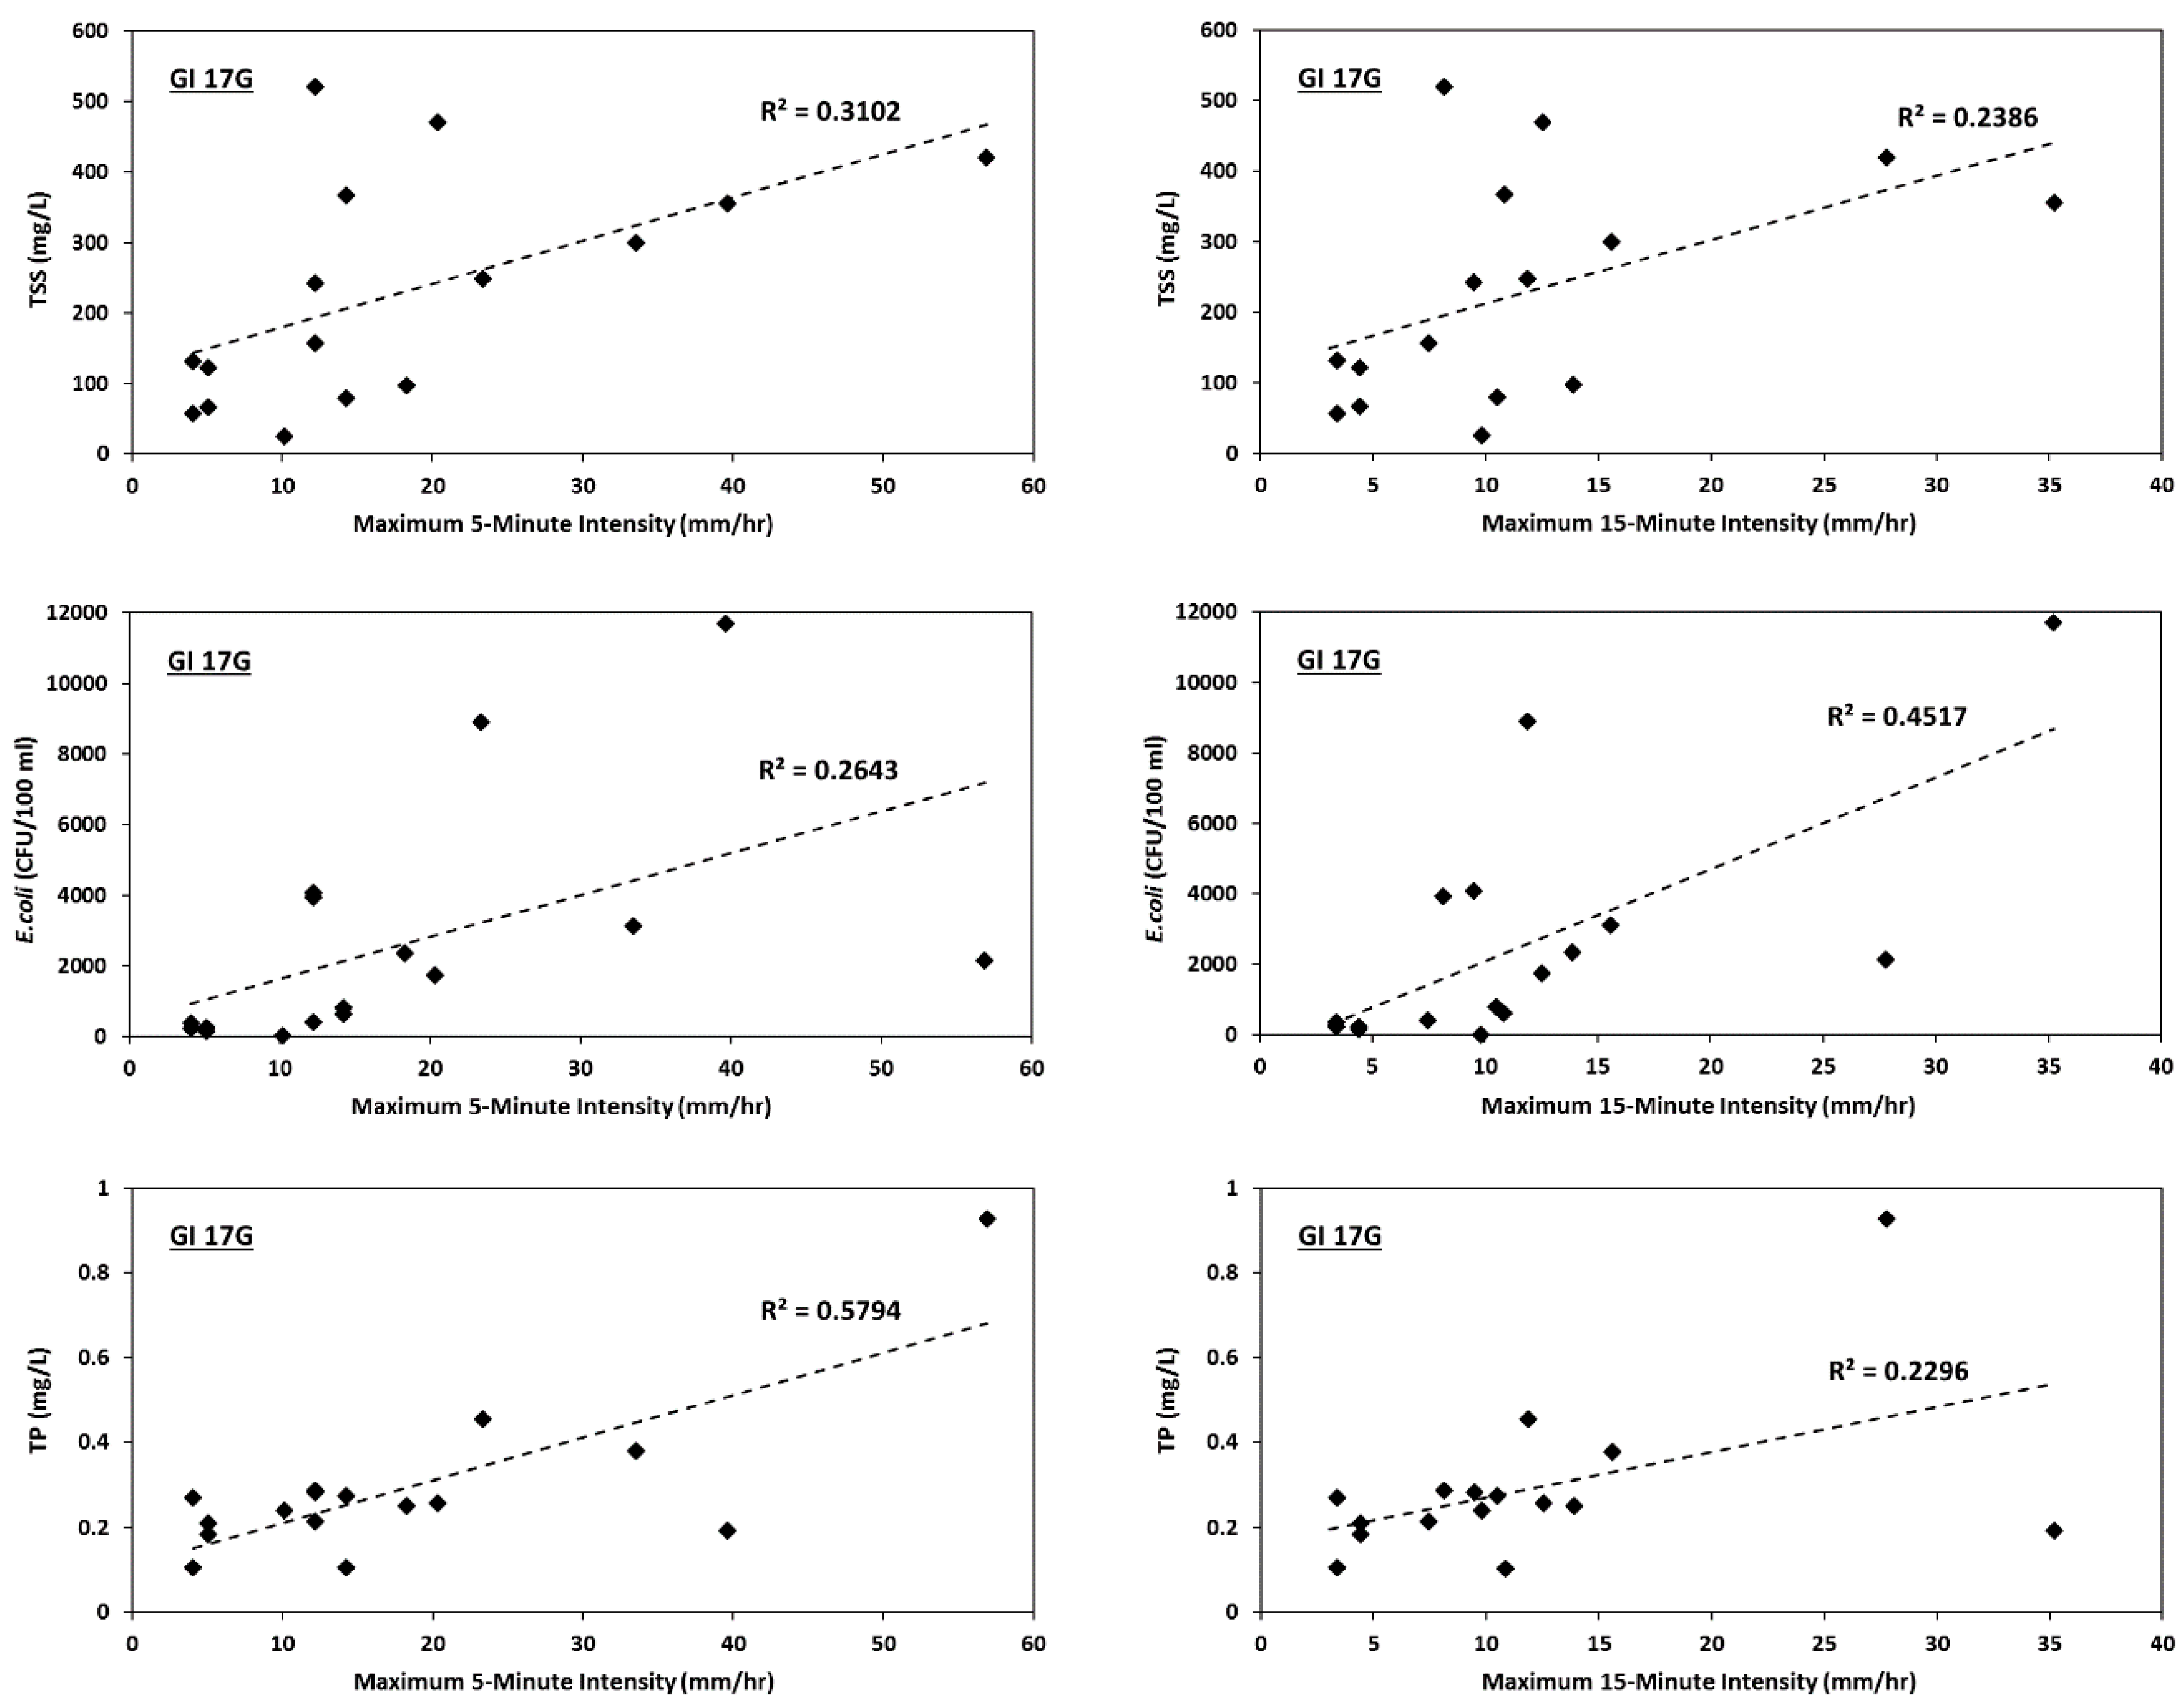
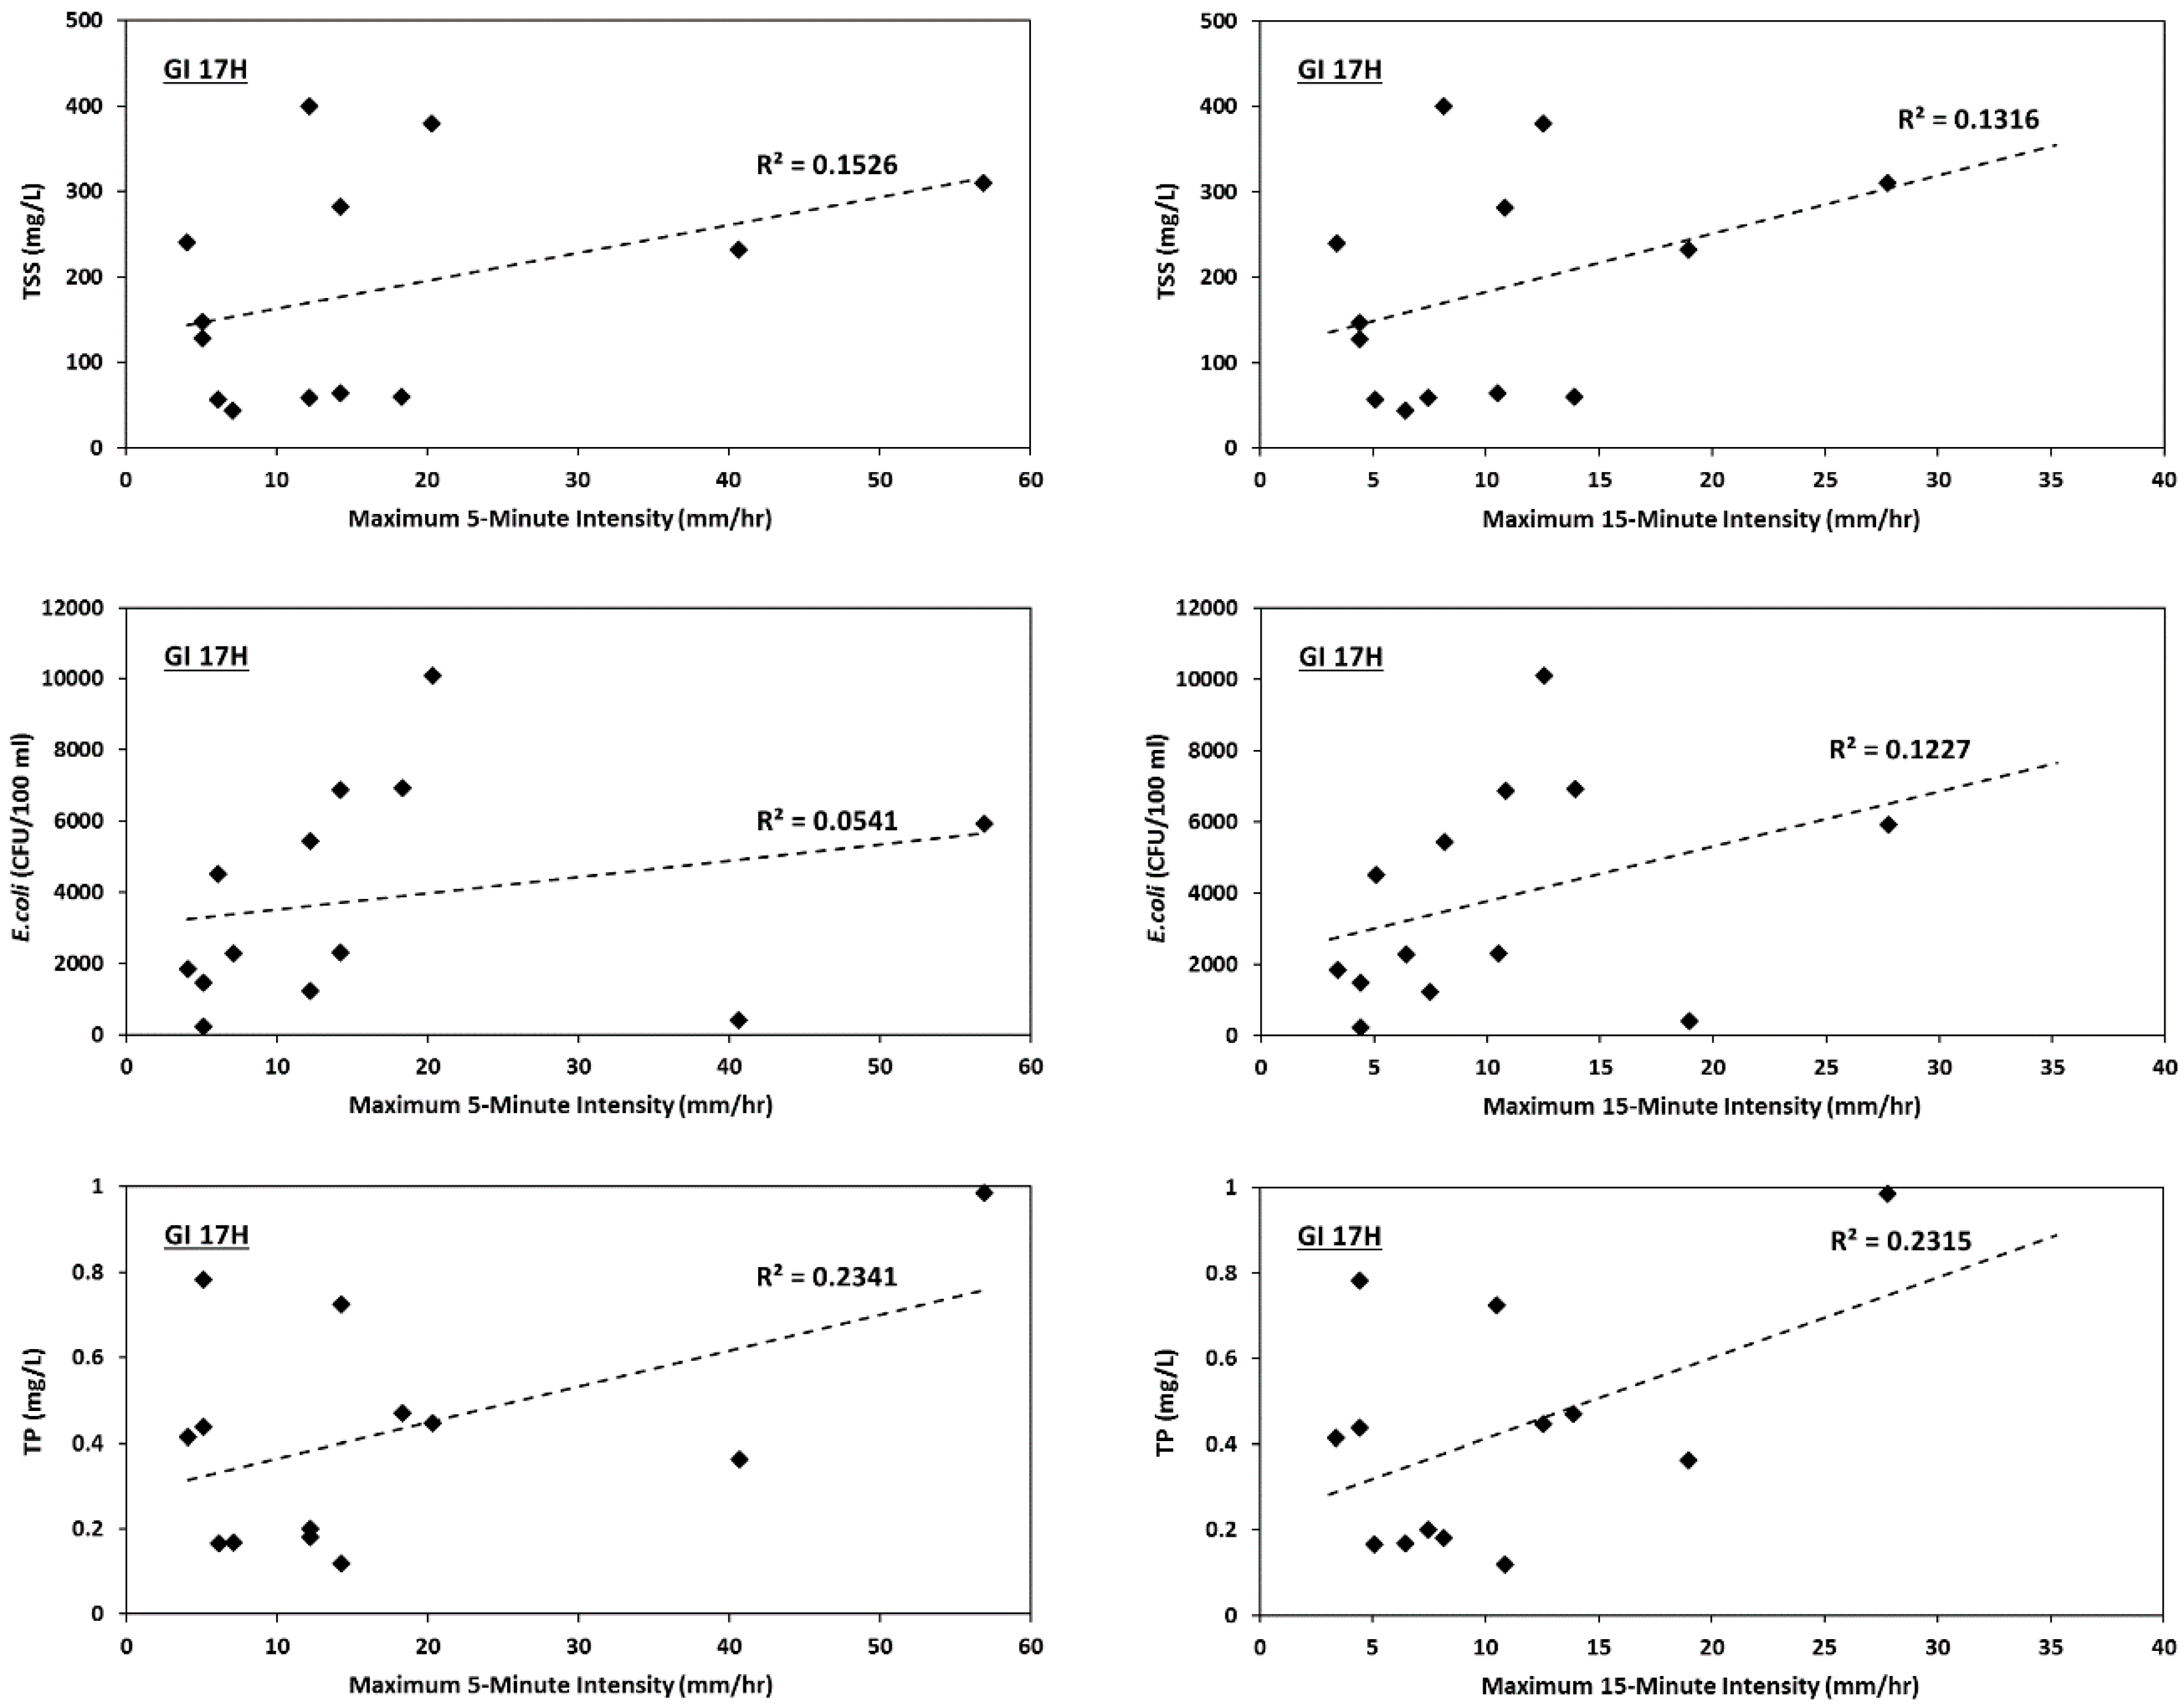
The relationships of E. coli and TSS concentrations in the runoff, and their reduction percentages, with rainfall characteristics (intensity and antecedent conditions), were also investigated. The concentrations of TSS, E. coli, and TP in runoff samples flowing into 17G and 17H were plotted against the maximum 5- and 15-min intensities (Figure 7 and Figure 8). The results showed that runoff concentrations of these pollutants increased during higher rainfall intensities. The direct relationship between pollutant concentrations in stormwater runoff and rainfall intensities was also reported in literature, and may be explained by the higher mobility of pollutants associated with solids during more intense rainfall events [32,33,34].
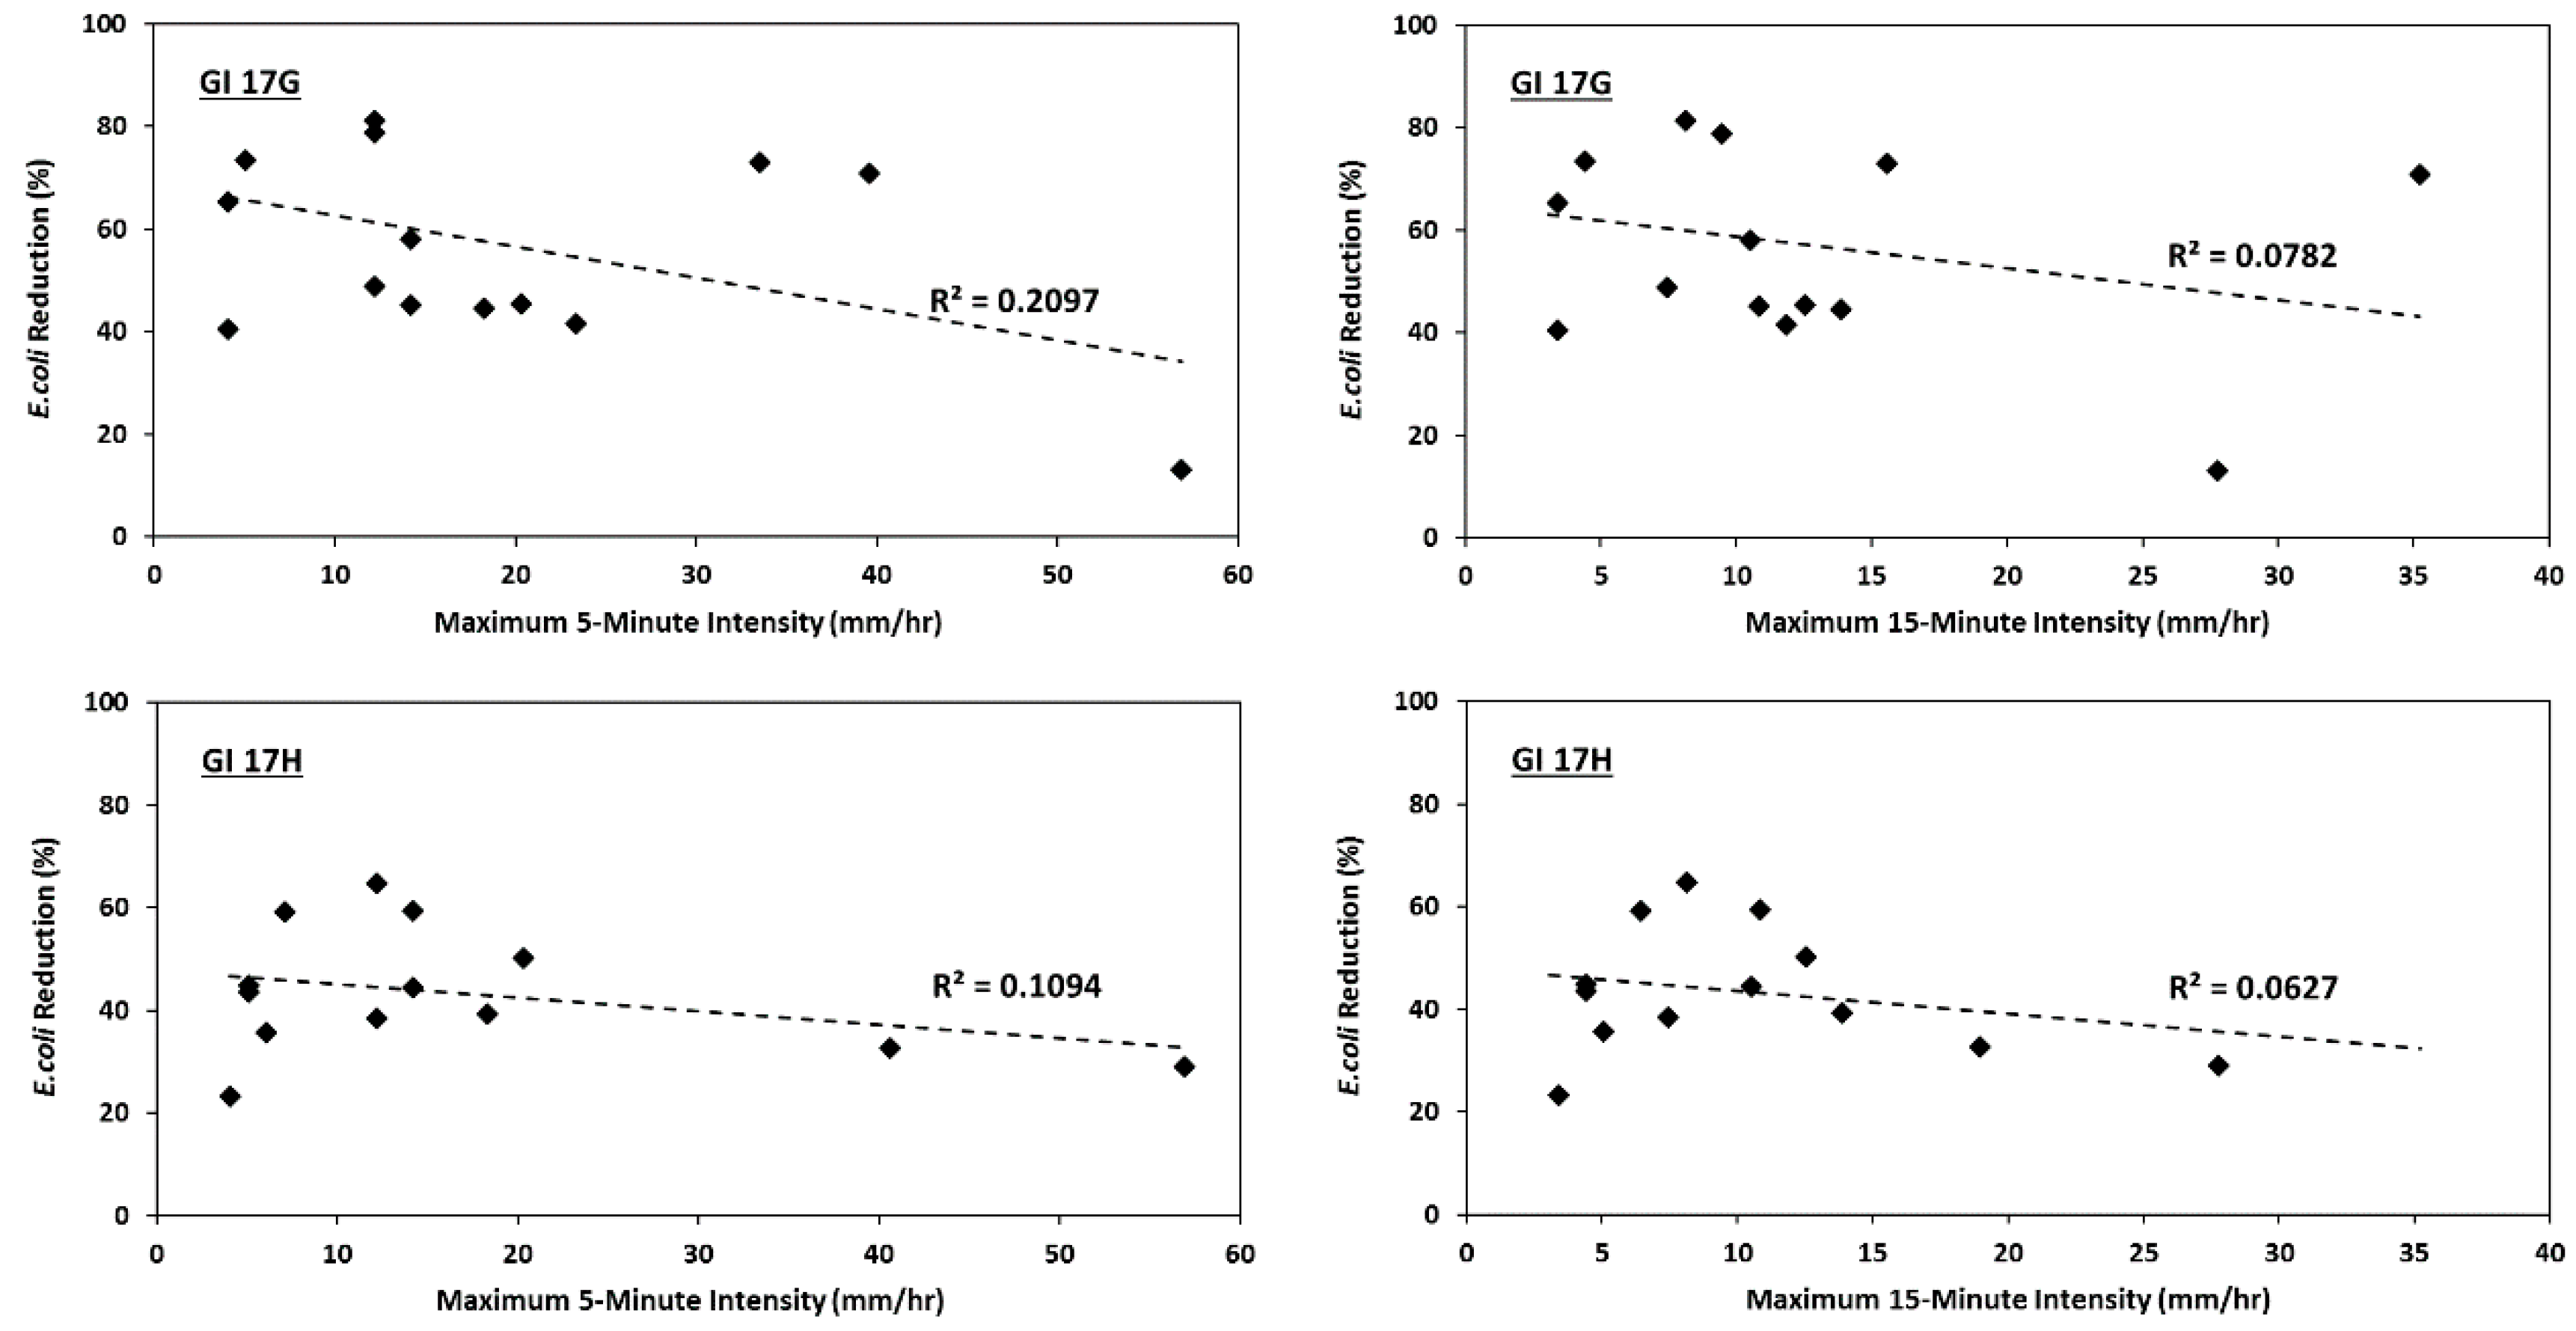
The reduction percentages of E. coli decreased with an increase in maximum intensity rates in both GI systems (Figure 9). This behavior of E. coli cells with flow velocity was reported in previous studies, and is known to be a result of the increased movement of water through macropores. The increased movement of water results in greater distances between the bacterial cells and the filter media, and therefore a shorter contact time, which decreases the chance of bacterial adsorption into the aggregate layers [35,36]. No meaningful correlations between TSS reductions and maximum intensity values were observed.
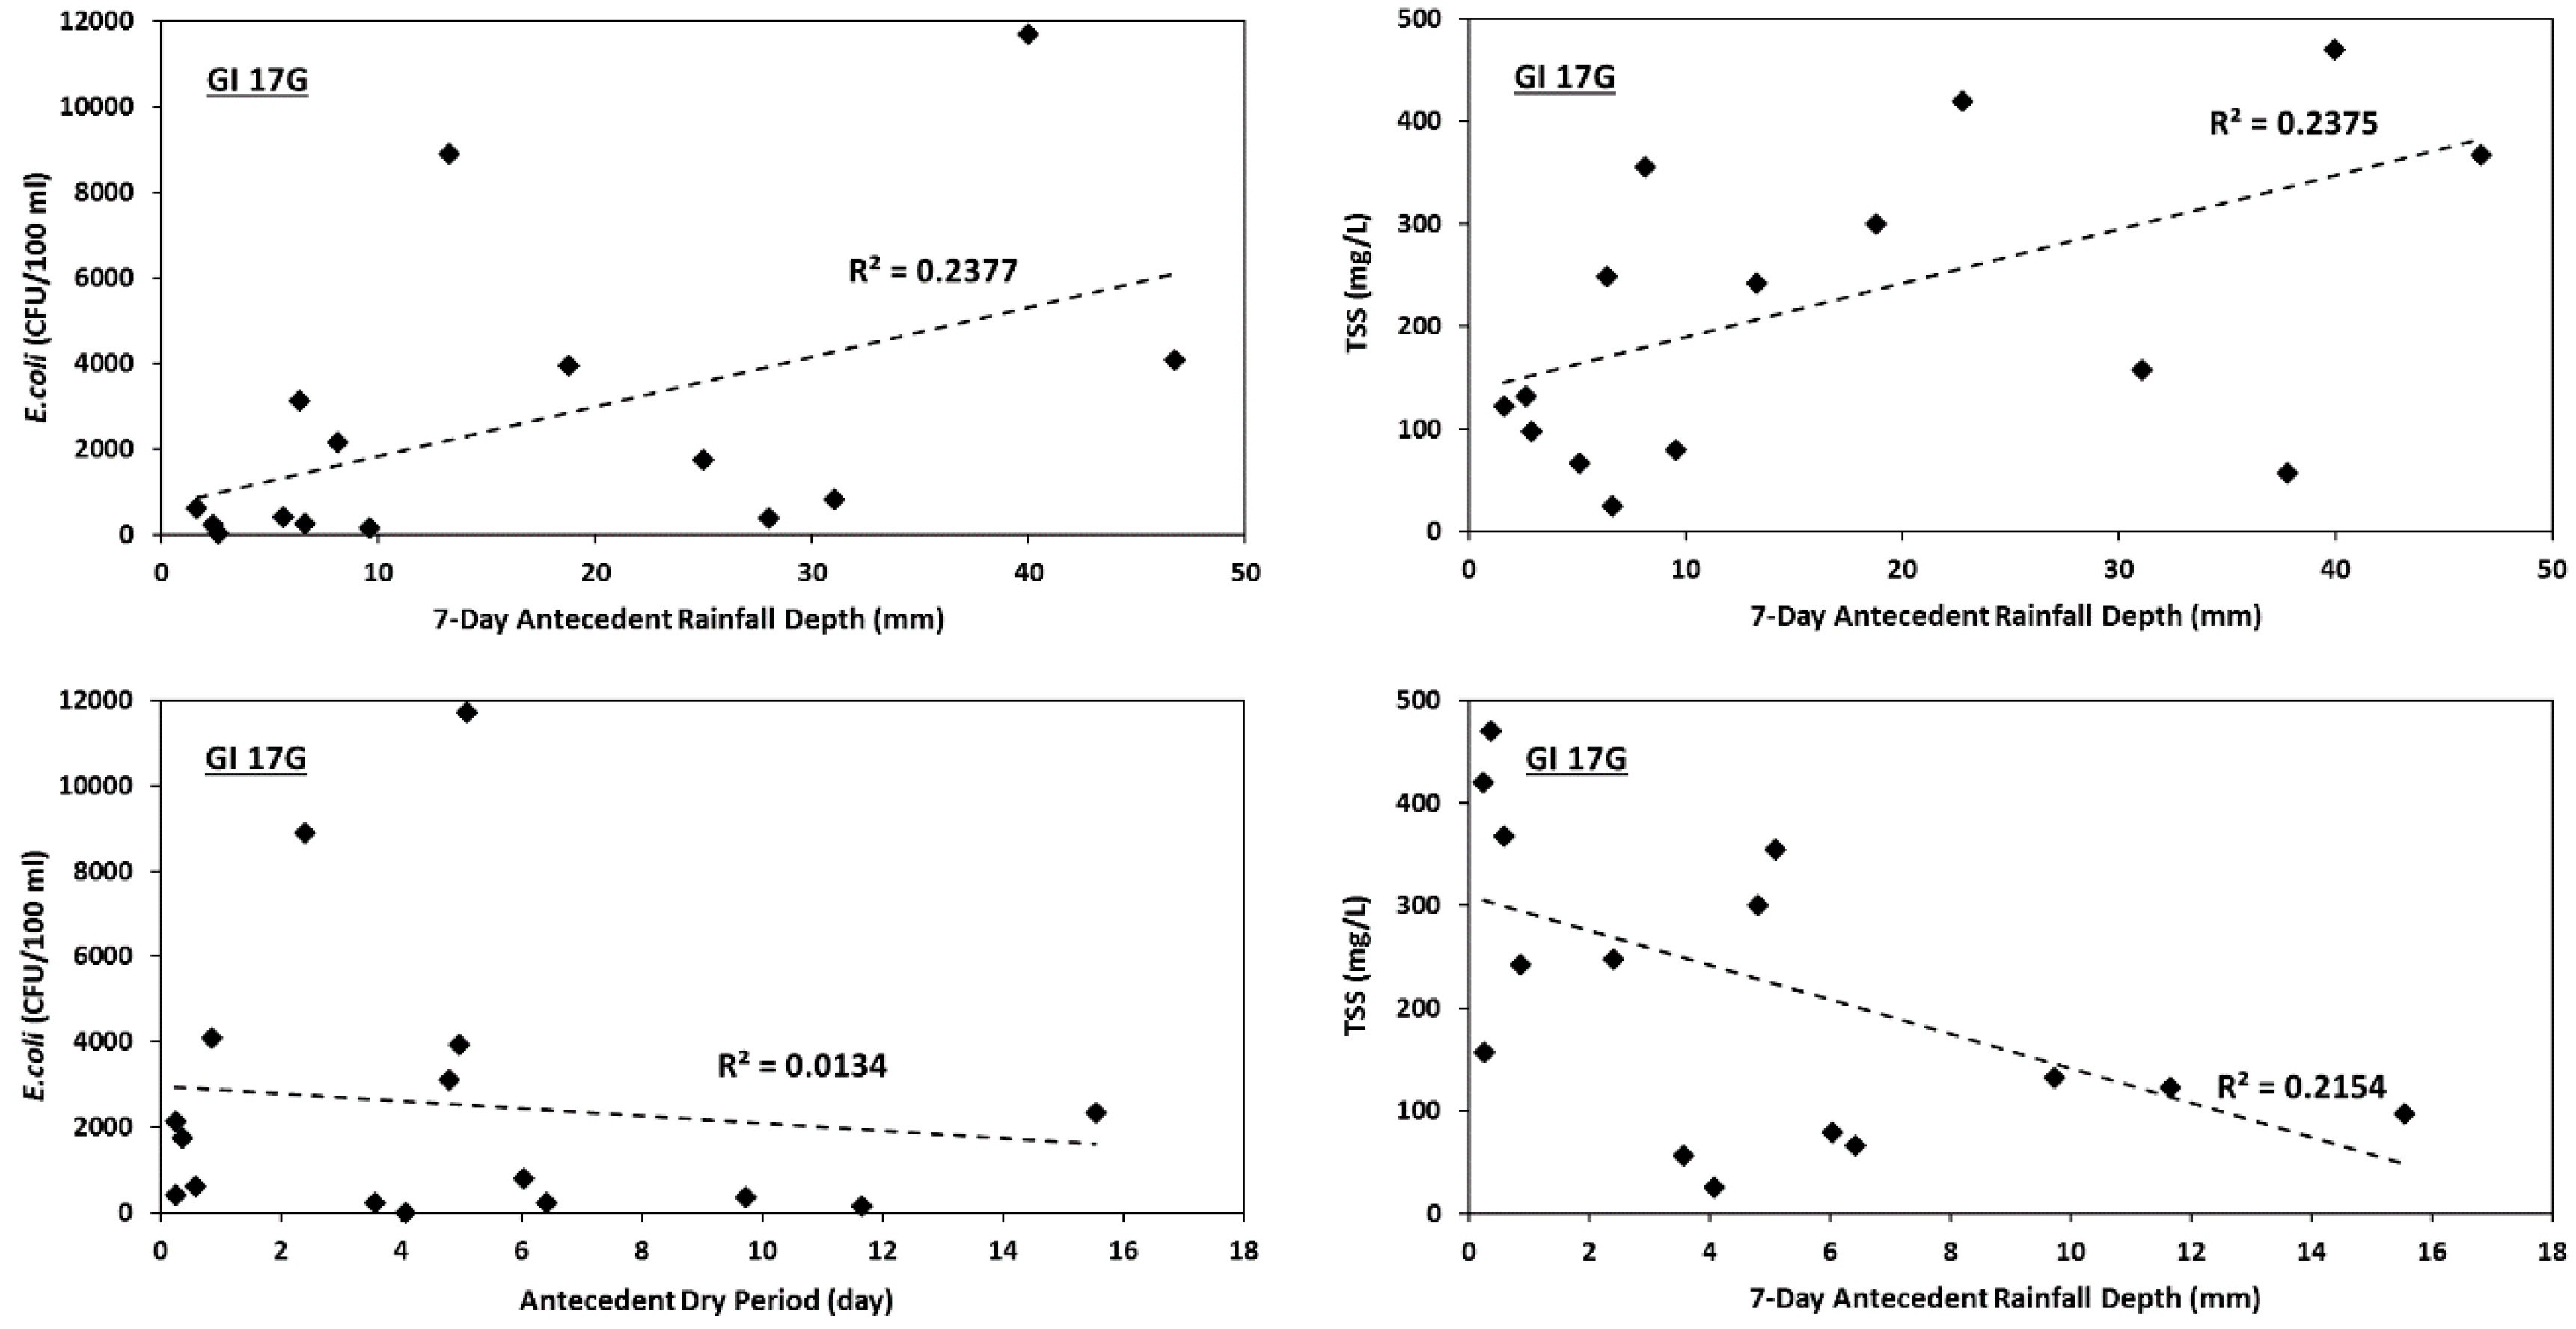
High concentrations of pollutants were expected in runoff samples with extended antecedent dry periods. However, such a relationship was not observed in any of the runoff sampling series. Additionally, it was hypothesized that an increase in rainfall depth prior to the onset of a storm event would reduce the pollutant concentrations in the runoff, but data analysis showed weak relationships between pollutant concentrations and the 7-day antecedent rainfall depths. These weak correlations could be the result of other contributing factors, such as road construction activities in the area, wind, and traffic, which may have affected the accumulation of pollutants during dry periods [10,37,38].
As an example, E. coli and TSS concentrations in the runoff samples of GI 17G were plotted against the antecedent dry period and the 7-day antecedent rainfall depth values (Figure 10). Contrary to the original hypothesis, the E. coli and TSS concentrations showed an increasing trend for higher 7-day antecedent rainfall depth values, and a decreasing trend for longer dry periods.
3.5. Limitations of This Study
Although the observed TSS reductions (42–50%) were found to be statistically significant, these rates were lower than the median TSS removals for porous pavement systems reported in the USEPA’s National Pollutant Removal Performance Database, and in the Stormwater Best Management Practices Design Guide [14,39]. Both documents indicated more than 90% reductions in TSS for permeable pavement systems. The observed difference between the estimated reductions in this research and the values from literature was attributed to a few limitations of the conducted study, which are discussed below.
The physical structure and design of the installed GI systems and the natural variability of the sampled storm events created challenges for the sampling efforts. In rigorous stormwater sampling, the preferred method for acquiring samples is the redirection of the captured stormwater into an outflow box, equipped with a weir and automatic samplers to determine the event mean concentrations (EMCs) of pollutants. Due to the mentioned constraints, samples were collected manually through the pre-installed monitoring wells during the first flush of rainfall events. Thus, the presented pollutant concentrations were not fully representative of true concentrations throughout the storm events.
Additionally, the inclusion of filter socks at the bottom of the perforated monitoring pipes may have resulted in an overestimation of pollutant concentrations, especially TSS. The openings of the filter socks (250 microns) were designed to allow the passing of particulate pollutants into the pipe. However, during the exfiltration of captured stormwater into the surrounding and underlying soil layers, the pressure loss across the filter sock may have prevented the complete flushing of these fine sediments. An incomplete flushing could have resulted in an accumulation of TSS at the bottom of the sampling pipes.
The authors would like to mention that, despite the mentioned limitations, the results from this study are considered beneficial for the determination of the stormwater quality benefits of permeable pavement systems.
4. Conclusions
Although the two monitored GI systems used different designs (shaft and trench) to access deeper underlying soil layers, they both had similar water quality performances. Unlike most similar previous studies, this study investigated the bacteria removal performance of the systems by measuring the E. coli concentrations. The E. coli reductions were found to be significant in both GI practices, but were slightly greater in GI 17H with the shaft system. The reductions in E. coli were greater than those in TSS; thus, in addition to the straining and physical removal of the bacterial cells attached to the suspended solids, the adsorption process was determined as another mechanism responsible for the E. coli removal. The positive relationship observed between E. coli and TSS reductions supports the idea that suspended solids serve as a transport method for bacterial cells in stormwater runoff.
The results indicated that TSS and TP reductions observed following the passing through the aggregate layers were statistically significant, and showed minor differences between the trench and shaft systems. Similar to previous studies, negative and almost zero reduction rates were observed for nitrate concentrations in both systems, and they were attributed to the nitrification process resulting in nitrate leaching, and the transformation of the filtered ammonia to nitrate.
The effect of rainfall characteristics on the pollutant concentrations and reduction percentages were also investigated in this study. The results indicated positive relationships between maximum rainfall intensities and the concentrations of E. coli, TSS, and TP in the runoff. Higher intensity rainfall events generally resulted in lower reduction percentages of E. coli contents. These findings indicate that the rainfall characteristics not only affect the pollutant concentrations in stormwater runoff, but may also have an impact on water quality performances of permeable pavement systems. Thus, it is suggested to consider local rainfall characteristics during the performance assessment of GI practices.
Author Contributions
Conceptualization: S.A., T.R. and H.K. Methodology: S.A. and H.K. Validation: S.A., H.K. and T.R. Formal Analysis: S.A. Investigation: S.A. and V.G. Resources: T.R. Data curation: S.A. and V.G. Writing (original draft preparation): S.A. and H.K. Writing (review and editing): T.R. and H.K. Visualization: H.K. Supervision: T.R. Project administration: T.R. Funding acquisition: T.R.
Acknowledgments
The reported research in this paper is the result of a collaborative effort between the USEPA Office of Research and Development (ORD), the Louisville and Jefferson County Metropolitan Sewer District (MSD), the AECOM Corporation, and the University of Louisville Center for Infrastructure Research. We thank Michael Borst, Robert Brown, and the Louisville MSD for their input and suggestions in this paper. The authors would also like to acknowledge Qian Zhao, Deborah Yoder-Himes, and Jagannadh Satyavolu for their cooperation during the laboratory analysis efforts of this study.
Conflicts of Interest
The authors declare no conflict of interest. Any opinions expressed in this paper are those of the authors and do not reflect the views of the Louisville and Jefferson Country MSD or the USEPA; thus, no official endorsement should be inferred. Any mention of trade names or commercial products does not constitute endorsement or recommendation for use.
References
- United States Department of Agriculture, Natural Resource Conservation Service (USDA NRCS). Urban Hydrology for Small Watersheds: TR-55; USDA NRCS: Washington, DC, USA, 1986.
- Bean, E.Z.; Hunt, W.F.; Bidelspach, D. Evaluation of four permeable pavement sites in eastern North Carolina for runoff reduction and water quality impacts. J. Irrig. Drain. Eng. 2007, 133, 583–592. [Google Scholar] [CrossRef]
- Goonetilleke, A.; Thomas, E.; Ginn, S.; Gilbert, D. Understanding the role of land use in urban stormwater quality management. J. Environ. Manag. 2005, 74, 31–42. [Google Scholar] [CrossRef] [PubMed] [Green Version]
- VanWoert, N.D.; Rowe, D.B.; Andresen, J.A.; Rugh, C.L.; Fernandez, R.T.; Xiao, L. Green roof stormwater retention: Effects of roof surface, slope, and media depth. J. Environ. Qual. 2005, 34, 1036–1044. [Google Scholar] [CrossRef] [PubMed]
- Aryal, R.; Vigneswaran, S.; Kandasamy, J.; Naidu, R. Urban stormwater quality and treatment. Korean J. Chem. Eng. 2010, 27, 1343–1359. [Google Scholar] [CrossRef]
- Moglen, G.E. Hydrology and impervious areas. J. Hydrol. Eng. 2009, 14, 303–304. [Google Scholar] [CrossRef]
- Todeschini, S. Hydrologic and environmental impacts of imperviousness in an industrial catchment of northern Italy. J. Hydrol. Eng. 2016, 21, 05016013. [Google Scholar] [CrossRef]
- Shaver, E.; Horner, R.; Skupien, J.; May, C.; Ridley, G. Fundamentals of Urban Runoff Management; North American Lake Management Society (NALMS): Madison, WI, USA, 2007; pp. 44–52. [Google Scholar]
- Schueler, T. Impacts of Impervious Cover on Aquatic Systems; Center for Watershed Protection: Ellicott City, MD, USA, 2003. [Google Scholar]
- Burns, S.E. Stormwater Controls for Pollutant Removal on GDOT Right-of-Way; GDOT Project No. 07-27; Georgia Department of Transportation, Office of Materials and Research: Forest Park, GA, USA, 2012.
- Granata, F.; Papirio, S.; Esposito, G.; Gargano, R.; de Marinis, G. Machine Learning Algorithms for the Forecasting of Wastewater Quality Indicators. Water 2017, 9, 105. [Google Scholar] [CrossRef]
- United States Environmental Protection Agency (US EPA). Stormwater Phase II Final Rule: Small MS4 Stormwater Program Overview. Factsheet 2.0.; EPA 833/F-00-002; US EPA: Washington, DC, USA, 2000.
- US EPA. Overview of the Stormwater Program; EPA 833/R-96-008; US EPA: Washington, DC, USA, 1996.
- Winer, R. National Pollutant Removal Performance Database for Stormwater Treatment Practices; Center for Watershed Protection: Ellicot City, MD, USA, 2000. [Google Scholar]
- Brattebo, B.O.; Booth, D.B. Long-term stormwater quantity and quality performance of permeable pavement systems. Water Res. 2003, 37, 4369–4376. [Google Scholar] [CrossRef]
- Legret, M.; Colandini, V. Effects of a porous pavement with reservoir structure on runoff water: Water quality and fate of heavy metals. Water Sci. Technol. 1999, 39, 111–117. [Google Scholar] [CrossRef]
- Kaseva, M. Performance of a sub-surface flow constructed wetland in polishing pre-treated wastewater—A tropical case study. Water Res. 2004, 38, 681–687. [Google Scholar] [CrossRef] [PubMed]
- Hunt, W.; Smith, J.; Jadlocki, S.; Hathaway, J.; Eubanks, P. Pollutant removal and peak flow mitigation by a bioretention cell in urban Charlotte, NC. J. Environ. Eng. 2008, 134, 403–408. [Google Scholar] [CrossRef]
- Kazemi, F.; Hill, K. Effect of permeable pavement basecourse aggregates on stormwater quality for irrigation reuse. Ecol. Eng. 2015, 77, 189–195. [Google Scholar] [CrossRef]
- US EPA. Stormwater Technology Fact Sheet: Porous Pavement; US EPA: Washington, DC, USA, 1999.
- Selvakumar, A.; O’Connor, T.P. Organism detection in permeable pavement parking lot infiltrates at the Edison Environmental Center, New Jersey. Water Environ. Res. 2018, 90, 21–29. [Google Scholar] [CrossRef] [PubMed]
- Prince Georges County. Low-Impact Development Hydrologic Analysis; Prince Georges County Department of Environmental Resources: Largo, MD, USA, 1999.
- Maestre, A.; Pitt, R. The National Stormwater Quality Database, Version 1.1, a Compilation and Analysis of NPDES Stormwater Monitoring Information; Center for Watershed Protection: Ellicott City, MA, USA, 2005. [Google Scholar]
- Law, N.L.; Fraley-McNeal, L.; Cappiella, K.; Pitt, R. Monitoring to Demonstrate Environmental Results: Guidance to Develop Local Stormwater Monitoring Studies Using Six Example Study Designs; Center for Watershed Protection: Ellicott City, MD, USA, 2008. [Google Scholar]
- Roseen, R.M.; Ballestero, T.P.; Houle, J.J.; Avelleneda, P.; Wildey, R.; Briggs, J. Storm water low-impact development, conventional structural, and manufactured treatment strategies for parking lot runoff: Performance evaluations under varied mass loading conditions. Transp. Res. Rec. J. Transp. Res. Board 2006, 1984, 135–147. [Google Scholar] [CrossRef]
- Roseen, R.M.; Ballestero, T.P.; Houle, J.J.; Briggs, J.F.; Houle, K.M. Water quality and hydrologic performance of a porous asphalt pavement as a storm-water treatment strategy in a cold climate. J. Environ. Eng. 2011, 138, 81–89. [Google Scholar] [CrossRef]
- Helsel, D.; Hirsch, R. Statistical methods in water resources. In Techniques of Water-Resources Investigations of the United States Geological Survey, Book 4: Hydrologic Analysis and Interpretation; US Geological Survey: Reston, VA, USA, 2002. [Google Scholar]
- Pagotto, C.; Legret, M.; Le Cloirec, P. Comparison of the hydraulic behaviour and the quality of highway runoff water according to the type of pavement. Water Res. 2000, 34, 4446–4454. [Google Scholar] [CrossRef]
- Schillinger, J.E.; Gannon, J.J. Bacterial adsorption and suspended particles in urban stormwater. J. Water Pollut. Control Fed. 1985, 57, 384–389. [Google Scholar]
- Mallin, M.A.; Williams, K.E.; Esham, E.C.; Lowe, R.P. Effect of human development on bacteriological water quality in coastal watersheds. Ecol. Appl. 2000, 10, 1047–1056. [Google Scholar] [CrossRef]
- Anderson, C.W.; Rounds, S.A. Phosphorus and E. coli and Their Relation to Selected Constituents during Storm Runoff Conditions in Fanno Creek, Oregon, 1998–99; 02-4232; US Geological Survey: Denver, CO, USA, 2003.
- Barrett, M.E.; Irish, L.B.; Malina, J.F.; Charbeneau, R. Characterization of highway runoff in Austin, Texas, area. J. Environ. Eng. 1998, 124, 131–137. [Google Scholar] [CrossRef]
- Chui, P. Characteristics of stormwater quality from two urban watersheds in Singapore. Environ. Monit. Assess. 1997, 44, 173–181. [Google Scholar] [CrossRef]
- Horner, R.; Guedry, J.; Kortenhof, M.H. Improving the Cost Effectiveness of Highway Construction Site Erosion and Pollution Control; Washington State Department of Transportation: Olympia, WA, UAS, 1990.
- Stevik, T.K.; Aa, K.; Ausland, G.; Hanssen, J.F. Retention and removal of pathogenic bacteria in wastewater percolating through porous media: A review. Water Res. 2004, 38, 1355–1367. [Google Scholar] [CrossRef] [PubMed]
- Rutter, P.; Vincent, B. Physicochemical interactions of the substratum, microorganisms, and the fluid phase. In Microbial Adhesion and Aggregation; Springer: Berlin, Germany, 1984; pp. 21–38. [Google Scholar]
- Horner, R.R.; Burges, S.J.; Ferguson, J.F.; Mar, B.W.; Welch, E.B. Highway Runoff Monitoring: The Initial Year; WA-RD-39.3; Washington State Department of Transportation, Public Transportation and Planning: Olympia, WA, USA, 1979.
- Barrett, M.E.; Zuber, R.D.; Collins, E.R.; Malina, J.F.; Charbeneau, R.J.; Ward, G.H. A Review and Evaluation of Literature Pertaining to the Quantity and Control of Pollution from Highway Runoff and Construction; Center for Research in Water Resources, Bureau of Engineering Research, the University of Texas at Austin: Austin, TX, USA, 1995. [Google Scholar]
- Clar, M.L.; Barfield, B.J.; O’Connor, T.P. Stormwater Best Management Practice Design Guide. Volume 2: Vegatative Biofilters; EPA/600/R-04/121A; The US Environmental Protenction Agency: Cincinatti, OH, USA, 2004.
Figure 1.
(a) Location of green infrastructures (GIs) 17G and 17H along parking lanes of Webster Street, Louisville, KY, USA. (b) The articulating concrete blocks/mats (ACBM) application.
Figure 1.
(a) Location of green infrastructures (GIs) 17G and 17H along parking lanes of Webster Street, Louisville, KY, USA. (b) The articulating concrete blocks/mats (ACBM) application.

Figure 2.
Cross-sectional view of the permeable pavement systems 17G and 17H. AASHTO: American Association of State Highway and Transportation.
Figure 2.
Cross-sectional view of the permeable pavement systems 17G and 17H. AASHTO: American Association of State Highway and Transportation.

Figure 3.
The monitoring pipes installed in (a) the shaft of 17H; and (b) the trench of 17G.

Figure 4.
The total suspended solids (TSS) and Escherichia coli (E. coli) concentrations for runoff and captured volume samples between the trench (17G) and shaft (17H) systems. Each box illustrates the 25th percentile, the median, and the 75th percentile. The highest and lowest values are represented by the top and bottom whiskers.

Figure 5.
Correlations between E. coli and TSS concentrations, and their reduction percentages.

Figure 6.
Correlations between total phosphorus (TP) and TSS concentrations, and their reduction percentages.
Figure 6.
Correlations between total phosphorus (TP) and TSS concentrations, and their reduction percentages.

Figure 7.
TSS, E. coli, and TP concentrations in the runoff versus maximum 5-min and 15-min intensity values in GI 17G.
Figure 7.
TSS, E. coli, and TP concentrations in the runoff versus maximum 5-min and 15-min intensity values in GI 17G.

Figure 8.
TSS, E. coli, and TP concentrations in the runoff versus maximum 5-min and 15-min intensity values in GI 17H.
Figure 8.
TSS, E. coli, and TP concentrations in the runoff versus maximum 5-min and 15-min intensity values in GI 17H.

Figure 9.
E. coli reduction percentages versus maximum 5- and 15-min intensity values.

Figure 10.
Runoff concentrations of E. coli and TSS versus antecedent rainfall conditions in GI 17G.
Figure 10.
Runoff concentrations of E. coli and TSS versus antecedent rainfall conditions in GI 17G.


Table 1.
Design and drainage characteristics of monitored permeable pavement systems.
| Green Infrastructure Identifier (GI ID) | Length (m) | Width (m) | Method to Access Deep Soils | Trench Width (m) or Number of Shafts | Total Drainage Area (ha) 1 | Percent Imperviousness 1 | Impervious Drainage Area (ha) | Impermeable Area: Pavement Surface Area |
|---|---|---|---|---|---|---|---|---|
| 17G | 21.3 | 2.4 | Trench | 0.7 m | 0.43 | 65% | 0.28 | 53:1 |
| 17H | 27.4 | 2.4 | Shafts | 10 | 0.36 | 65% | 0.25 | 37:1 |
1 Drainage and impervious areas were estimated and provided by AECOM Corp. (Louisville, KY, USA), using 6-inch LiDAR data. GI: green infrastructure.
Table 2.
Standard test methods and minimum detection levels (MDLs).
| Parameter | Standard Method | MDL |
|---|---|---|
| Total suspended solids (TSS) | Standard Methods procedure 2540D | 1.0 mg/L |
| Escherichia coli (E. coli) | EPA Method 1604 | 1 CFU/100 mL |
| Total phosphorus (TP) | Hach TNT843, Equivalent to EPA 365.1 | 0.05 mg/L |
| Nitrate (NO3) | Hach, TNT835 Approved by EPA | 0.23 mg/L |
| Nitrite (NO2) | Hach TNT839, Equivalent to EPA 353.2 | 0.015 mg/L |
| Ammonia (NH3) | Hach TNT831, Equivalent to EPA 353.2 | 0.015 mg/L |
| Copper dissolved (Cu) | ICP-OES Spectrometer EPA Method 200.7 | 5.4 μg/L |
| Iron dissolved (Fe) | ICP-OES Spectrometer EPA Method 200.7 | 6.2 μg/L |
| Zinc dissolved (Zn) | ICP-OES Spectrometer EPA Method 200.7 | 1.8 μg/L |
EPA: Environmental Protection Agency; ICP-OES: Inductively coupled plasma-optical emission spectrometry.
Table 3.
Rainfall characteristics of storm events sampled for water quality analysis.
| Event Number | Date | Total Rainfall Duration (h) | Total Rainfall Depth (mm) | Sampled Maximum Rainfall Intensity (mm/h) 1 | Antecedent Dry Period (Day) | 7-Day Antecedent Rainfall Depth (mm) | |
|---|---|---|---|---|---|---|---|
| 5-min Duration | 15-min Duration | ||||||
| 1 | 9 May 2014 | 12.00 | 20.8 | 46.7 | 21.3 | 9.68 | 1.9 |
| 2 | 10 May 2014 | 3.00 | 21.8 | 56.9 | 27.7 | 0.25 | 22.8 |
| 3 | 7 July 2014 | 0.67 | 12.4 | 39.6 | 35.3 | 5.09 | 8.1 |
| 4 | 14 July 2014 | 1.58 | 9.1 | 20.3 | 12.4 | 0.38 | 40.0 |
| 5 | 16 August 2014 | 29.25 | 18.0 | 12.2 | 8.1 | 4.97 | 25.0 |
| 6 | 22 August 2014 | 3.33 | 6.6 | 33.5 | 15.5 | 4.80 | 18.8 |
| 7 | 6 October 2014 | 6.58 | 6.4 | 23.4 | 11.9 | 2.40 | 6.4 |
| 8 | 7 October 2014 | 2.50 | 5.6 | 12.2 | 9.4 | 0.86 | 13.3 |
| 9 | 13 October 2014 | 13.42 | 22.9 | 17.3 | 10.9 | 0.59 | 46.7 |
| 10 | 16 November 2014 | 14.00 | 8.8 | 5.1 | 4.3 | 11.65 | 1.6 |
| 11 | 23 November 2014 | 14.42 | 18.9 | 14.2 | 10.4 | 6.04 | 9.6 |
| 12 | 5 December 2014 | 34.42 | 38.4 | 12.2 | 3.0 | 0.26 | 31.1 |
| 13 | 23 December 2014 | 3.92 | 25 | 6.1 | 7.5 | 0.48 | 5.6 |
| 14 | 1 February 2015 | 8.92 | 10.2 | 5.1 | 5.1 | 6.43 | 5.1 |
| 15 | 3 March 2015 | 50.58 | 43.9 | 4.1 | 9.8 | 9.73 | 2.6 |
| 16 | 13 March 2015 | 28.17 | 45.1 | 7.1 | 3.4 | 2.61 | 28.0 |
| 17 | 2 April 2015 | 33.42 | 110.8 | 40.6 | 6.4 | 6.63 | 4.1 |
| 18 | 13 April 2015 | 22.50 | 10.1 | 4.1 | 19.0 | 3.56 | 37.8 |
| 19 | 16 May 2015 | 14.17 | 11.0 | 18.3 | 3.0 | 15.55 | 2.9 |
1 Maximum rainfall intensity values were calculated for the sampling period during the first flush, and do not represent the entire rainfall event.
Table 4.
In situ water quality measurements.
| Parameter | 17G (Trench) | 17H (Shaft) | ||||
|---|---|---|---|---|---|---|
| Runoff | Captured | p-Value | Runoff | Captured | p-Value | |
| Average Temperature (°C) | 16.8 (n = 15) | 17.3 (n = 15) | 0.315 | 14.9 (n = 13) | 15.5 (n = 13) | 0.270 |
| Average pH | 7.3 (n = 15) | 7.4 (n = 15) | 0.001 | 7.0 (n = 13) | 7.1 (n = 13) | 0.001 |
| Average Specific Conductivity (μS/cm) | 120 (n = 15) | 185 (n = 15) | 0.196 | 114 (n = 13) | 120 (n = 13) | 0.509 |
Table 5.
Measured pollutant concentrations and observed mean reductions, GI 17G (trench system).
| Pollutant | Number of Rainfall Events Sampled | Events Sampled | Mean Concentration Values | Median Concentration Values | Mean Reduction % | p-Value 1 | ||
|---|---|---|---|---|---|---|---|---|
| Runoff | Captured | Runoff | Captured | |||||
| E. coli (CFU/100 mL) | 15 | 2–12, 14, 15, 18, 19 | 2719 | 1095 | 1740 | 740 | 59.7 | <0.0012 |
| TSS (mg/L) | 15 | 2–12, 14, 15, 18, 19 | 242.1 | 139.4 | 242.1 | 100.3 | 42.6 | <0.0012 |
| Nitrate (mg/L) | 15 | 2–12, 14, 15, 18, 19 | 0.667 | 0.671 | 0.606 | 0.499 | −0.6 | 0.965 |
| Nitrite (mg/L) | 15 | 2–12, 14, 15, 18, 19 | 0.073 | 0.043 | 0.043 | 0.031 | 41.1 | 0.0462 |
| Ammonia (mg/L) | 15 | 2–12, 14, 15, 18, 19 | 0.229 | 0.124 | 0.153 | 0.112 | 45.9 | N/A 3 |
| TP (mg/L) | 15 | 2–12, 14, 15, 18, 19 | 0.293 | 0.164 | 0.258 | 0.091 | 44.0 | 0.002 |
| Cu dissolved (μg/L) | 4 | 1–4 | 5.80 | 1.06 | 2.96 | 0.92 | 81.7 | N/A 4 |
| Zn dissolved (μg/L) | 4 | 1–4 | 51.40 | 4.76 | 32.61 | 2.94 | 90.7 | N/A 4 |
| Fe dissolved (μg/L) | 4 | 1–4 | 23.01 | 9.16 | 16.92 | 9.02 | 60.2 | N/A 4 |
1p-values indicating a significant decrease of pollutant concentrations are highlighted in black. 2 Since the concentrations were not normally distributed, log-transformed data were used in the paired t-test. 3 Differences between the runoff and captured volume concentrations were not normally or lognormally distributed. 4 Results from paired t-tests are not presented due to the small sample sizes.
Table 6.
Measured pollutant concentrations and observed mean reductions, GI 17H (shaft system).
| Pollutant | Number of Rainfall Events Sampled | Events Sampled | Mean Concentration Values | Median Concentration Values | Mean Reduction % | p-Value 1 | ||
|---|---|---|---|---|---|---|---|---|
| Runoff | Captured | Runoff | Captured | |||||
| E. coli (CFU/100 mL) | 13 | 2, 4, 5, 9–14, 15–17, 19 | 3810 | 845 | 2300 | 1400 | 77.8 | 0.002 |
| TSS (mg/L) | 13 | 2, 4, 5, 9–14, 15–17, 19 | 184.8 | 89.9 | 147.2 | 98.1 | 51.4 | <0.0012 |
| Nitrate (mg/L) | 13 | 2, 4, 5, 9–14, 15–17, 19 | 0.723 | 0.685 | 0.550 | 0.521 | 5.3 | 0.586 |
| Nitrite (mg/L) | 13 | 2, 4, 5, 9–14, 15–17, 19 | 0.040 | 0.027 | 0.036 | 0.025 | 32.5 | N/A 3 |
| Ammonia (mg/L) | 13 | 2, 4, 5, 9–14, 15–17, 19 | 0.168 | 0.139 | 0.077 | 0.045 | 17.3 | <0.001 |
| TP (mg/L) | 13 | 2, 4, 5, 9–14, 15–17, 19 | 0.420 | 0.297 | 0.414 | 0.175 | 29.3 | 0.005 |
1p-values indicating a significant decrease of pollutant concentrations are highlighted in black. 2 Since the concentrations were not normally distributed, log-transformed data were used in the paired t-test. 3 Differences between the runoff and captured volume concentrations were not normally or lognormally distributed.
© 2018 by the authors. Licensee MDPI, Basel, Switzerland. This article is an open access article distributed under the terms and conditions of the Creative Commons Attribution (CC BY) license (http://creativecommons.org/licenses/by/4.0/).
Share and Cite
MDPI and ACS Style
Abdollahian, S.; Kazemi, H.; Rockaway, T.; Gullapalli, V. Stormwater Quality Benefits of Permeable Pavement Systems with Deep Aggregate Layers. Environments 2018, 5, 68. https://doi.org/10.3390/environments5060068
AMA Style
Abdollahian S, Kazemi H, Rockaway T, Gullapalli V. Stormwater Quality Benefits of Permeable Pavement Systems with Deep Aggregate Layers. Environments. 2018; 5(6):68. https://doi.org/10.3390/environments5060068
Chicago/Turabian StyleAbdollahian, Sam, Hamidreza Kazemi, Thomas Rockaway, and Venkata Gullapalli. 2018. "Stormwater Quality Benefits of Permeable Pavement Systems with Deep Aggregate Layers" Environments 5, no. 6: 68. https://doi.org/10.3390/environments5060068
Note that from the first issue of 2016, this journal uses article numbers instead of page numbers. See further details here.