An Exploratory Analysis of Sound Field Characteristics using the Impulse Response in a Car Cabin

1
Biomedical Research Institute, National Institute of Advanced Industrial Science and Technology (AIST), Ikeda 563-8577, Japan
2
Suzuki Motor Corporation, Hamamatsu 432-8611, Japan
*
Author to whom correspondence should be addressed.
Environments 2018, 5(4), 44; https://doi.org/10.3390/environments5040044
Submission received: 28 February 2018
/
Revised: 20 March 2018
/
Accepted: 22 March 2018
/
Published: 24 March 2018
(This article belongs to the Special Issue Sound Environments)
Abstract
:Sound environments in cars are becoming quieter and receiving attention because of the prevalence of low-noise engines such as hybrid and electric engines and the manifestation of automated driving. Although the car cabin has potential as a listening space, its acoustic quality has not been examined in detail. The present study investigated sound field characteristics in the car cabin using acoustic parameters obtained by impulse response analysis. In particular, effects of the passenger position, open windows and the use of an air conditioner on acoustic parameters were investigated. The passenger position affected the sound strength at low frequencies. Rear seats, except for the rear central seat, had lower interaural correlation than the front seats, suggesting that rear seats have more diffused sound fields. The opening of windows and use of air conditioners attenuated the ratio of early- and late-arriving energy at high frequencies, suggesting a loss of clarity for music.
1. Introduction
Sound environments in cars are becoming quieter because of technological advances in active noise control [1], acoustic insulation and absorption, as in the case of a rubberized road surface [2] and the prevalence of low-noise engines such as hybrid and electric engines [3]. In the near future, automated driving will change the roles of sounds in cars and sound will be able to be used to improve the in-car sound environment. A car cabin therefore has appreciable potential to be a safer environment through the reduction of background noise and the emphasis of informative signals and to be a listening space.
Many sounds are heard in a car cabin such as sounds generated by interaction of the road pavement and rolling tires, the engine, gears, brakes and wind. These sounds affect a passenger’s safety and comfort. Many studies have therefore evaluated the sound quality in car cabins, considering sounds of the engine [4,5], doors closing [6,7], power windows [8,9,10], switch buttons [11], hard disk drives [12], heating, ventilation and air-conditioning [13,14,15], tires [16] and wind [17]. An objective sound quality evaluation model for the cabin noise of cars idling or moving at constant speed and cars accelerating and decelerating has been constructed on the basis of sound metrics used in psychoacoustics and an artificial neural network technique [18,19,20,21]. Dimensions of vehicle sound perception have been investigated by conducting an online survey [22]. The important dimensions are timbre, loudness and roughness/sharpness. These three dimensions are consistent with the three dimensions of more general human perception of sound [23]. The quality and design of sound in car cabins are thus receiving much attention. However, previous studies have not paid much attention to the sound field characteristics of car cabins.
There has been much research on the reproduction of the sound field in car cabins. The majority of studies acquired impulse responses in a car cabin using microphones, typically dummy-head microphones. The obtained signals were then used to reproduce the binaural field over headphones or loudspeakers [24,25]. An extension to the method has been proposed, allowing for natural head movement during evaluation by dynamically updating the appropriate measurement angle [26]. The analysis and synthesis of microphone array measurements provide more accurate spatial sound reproduction when compared with dummy-head measurements [27,28,29]. Using such sound field reproduction methods with higher accuracy, the effects of physical characteristics of a sound field in the car cabin on human perception have been investigated [29,30,31,32]. Perceptual attributes, such as the bass, brightness and envelopment, have been proposed as important attributes for acoustic evaluation in the car cabin. In addition, binaural measurements have been made to identify unwanted sounds in the environment [33,34]. Such sounds should also be avoided inside a car while studying noise attenuation from the outside to inside to ensure a better listening environment for music.
The relationships between human perception and physical acoustic characteristics in car environments are not well understood. Although studies investigated the acoustic characteristics in a car cabin [35,36], basic characteristics, such as the reverberation time (RT) and balance between early- and late-arriving energy (Cx), have not been clarified. In addition, the effects of passenger position, open windows and the operation of an air conditioner on the sound field have not yet been clarified. Understanding acoustic characteristics in the car cabin could aid the development of the evaluation and optimization of automotive audio.
The present study found factors that change the sound field characteristics in car cabins. To understand the present situations of drivers and passengers, the effects of the passenger position, absorption by passengers, open windows and use of an air conditioner were specifically investigated as a first step although there are many other factors that may affect sound field characteristics, such as the characteristics of loudspeakers, settings of car audio systems and interior materials. The present study investigated sound fields for only two car cabins. The findings of the study are but a starting point for the investigation of a wide variety of car cabins.
2. Methods
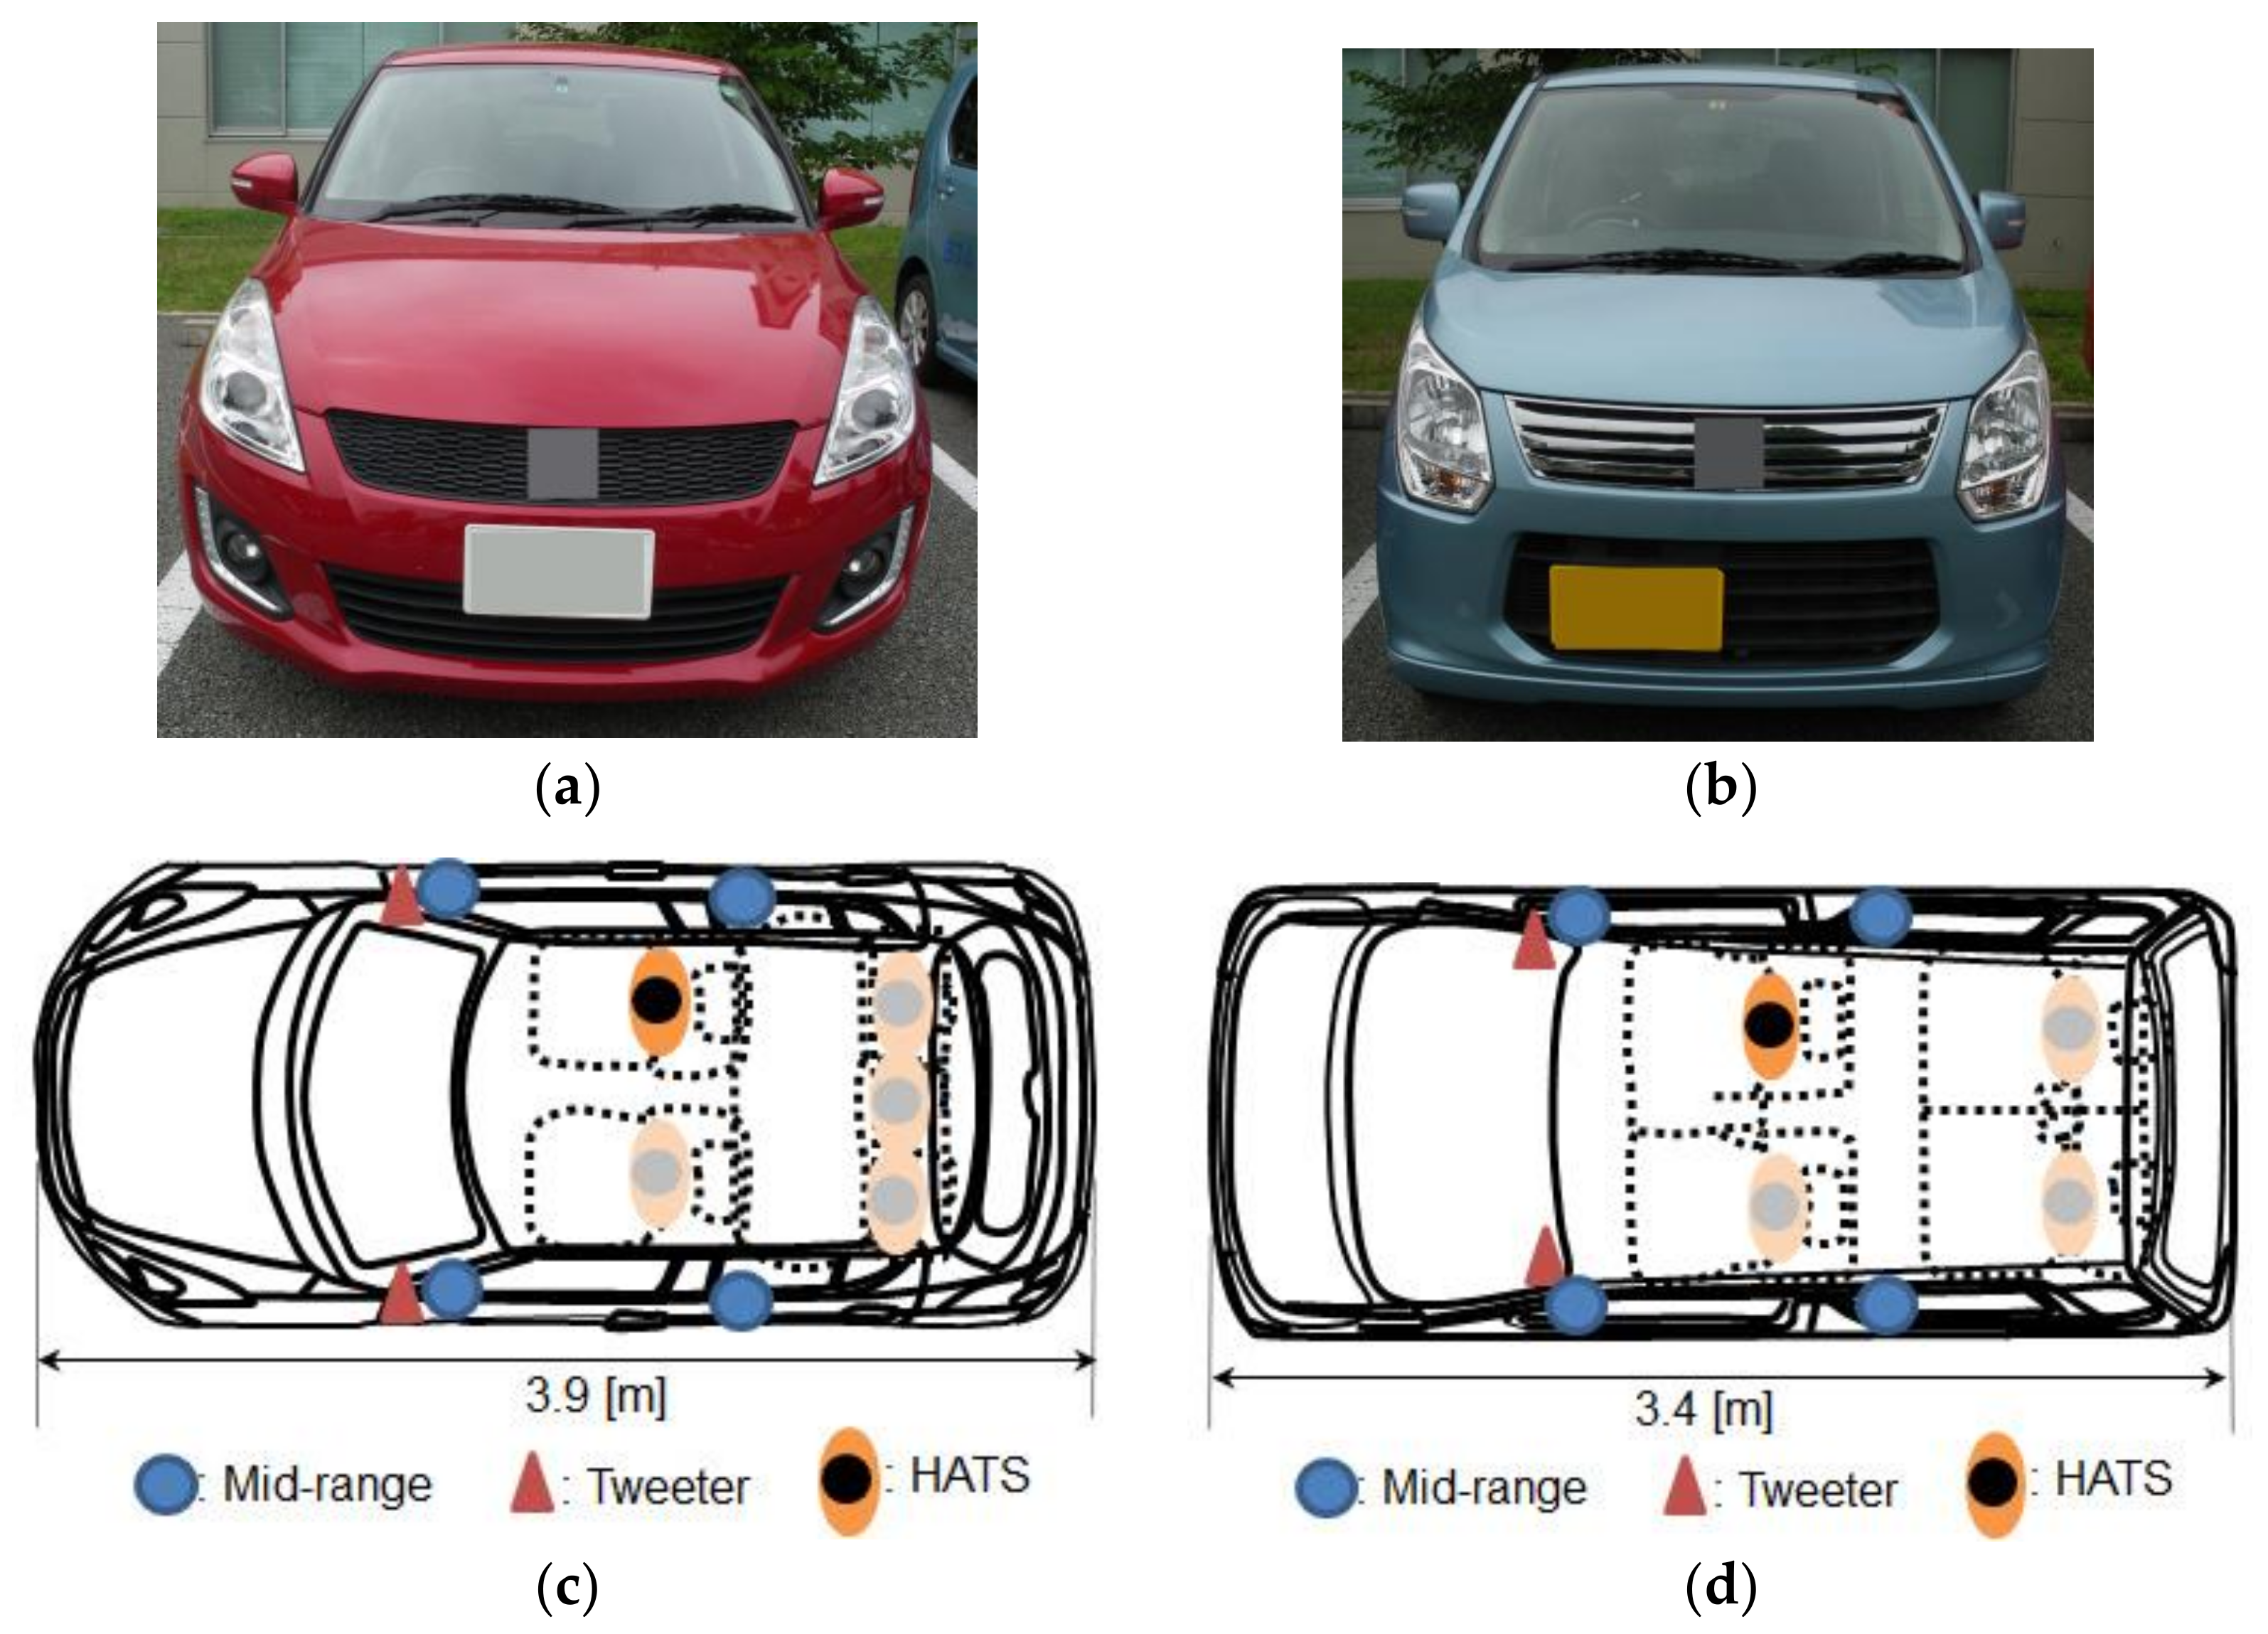
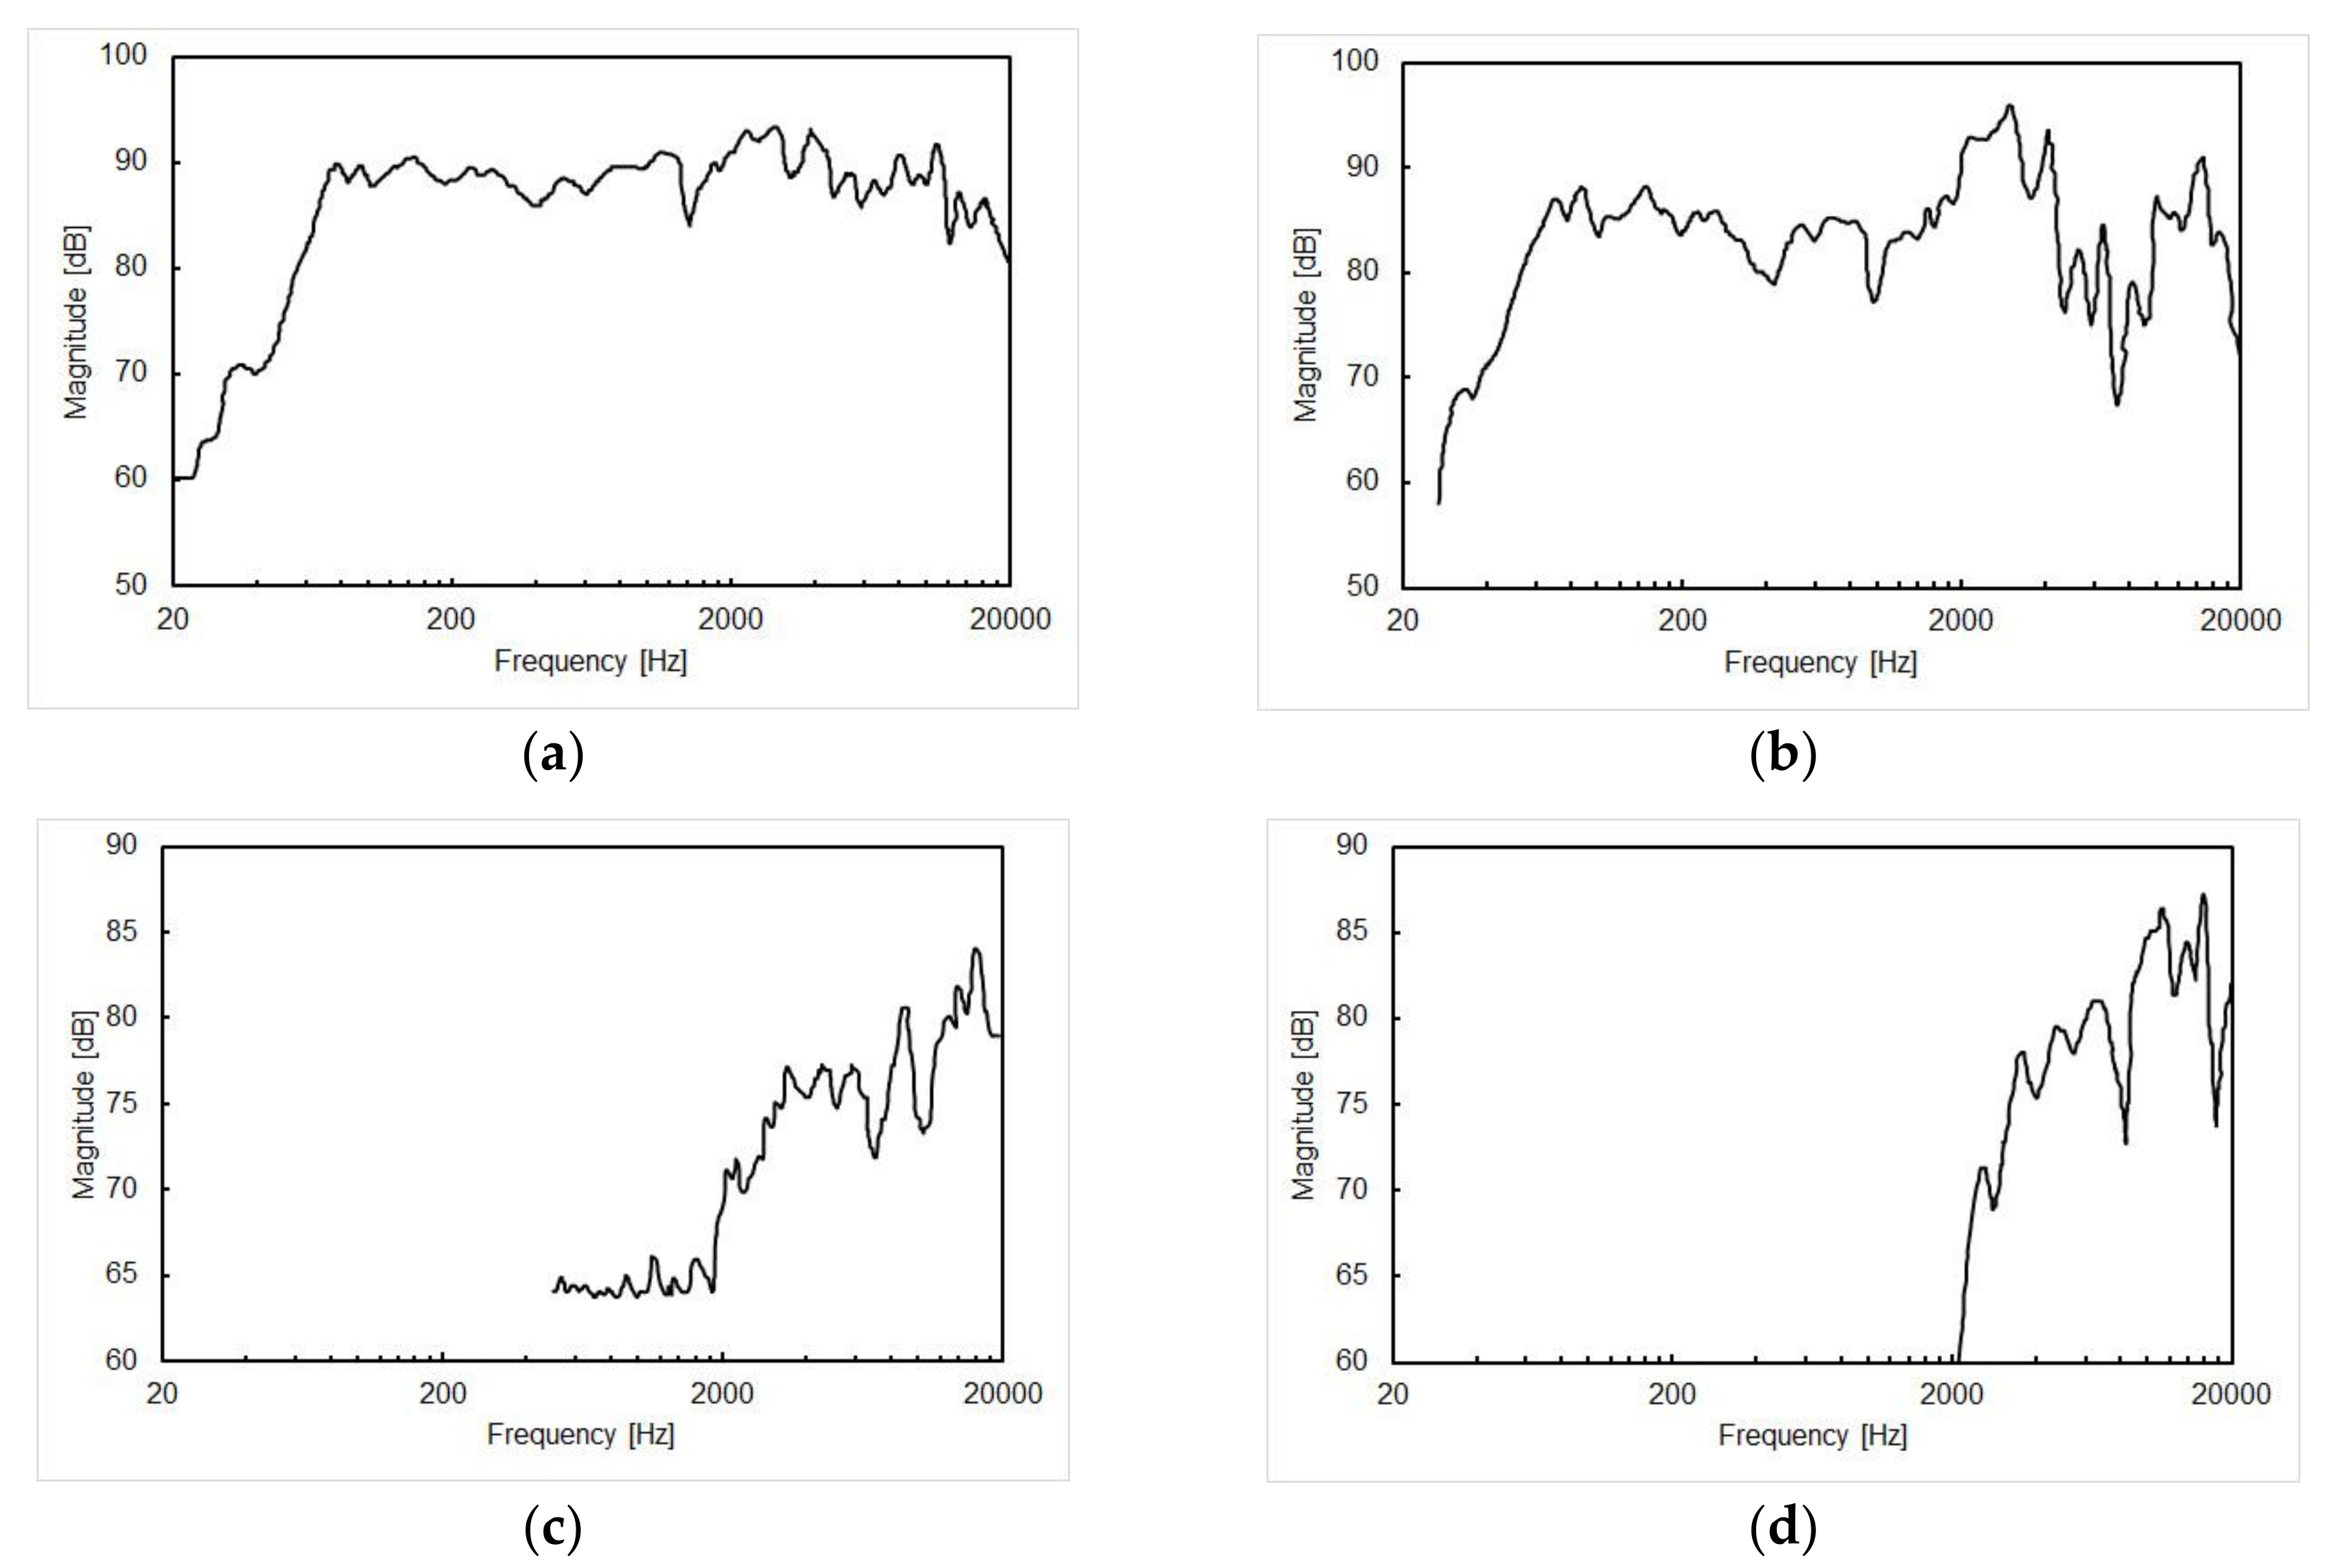
Two cars equipped with normally tuned audio systems were chosen for the measurement. Car A was a sedan while car B was a small car. Six loudspeakers were installed in each car as shown in Figure 1. Midrange loudspeakers were installed at the bottom of the left and right front and rear doors in both cars. Tweeters were installed at the left and right A pillars in car A and at the dashboard in car B. The frequency characteristics of the loudspeakers in car A and B are shown in Figure 2.
Impulse responses were measured three times for each setting in each car. A sinusoidal signal with an exponentially varying frequency sweeping from 20 Hz to 20 kHz over a period of 20 s, recorded on a compact disc, was sent through the installed loudspeakers and recorded by a laptop computer at a sampling rate of 48 kHz and a sampling resolution of 24 bits via a head and torso simulator (HATS, Type 4128C, Brüel & Kjær, Nærum, Denmark) and an AD/DA converter (Fireface UCX, RME, Haimhausen, Germany). The recorded signals from the HATS were deconvolved to obtain the impulse responses [37].
To clarify the effect of the position in the car, the HATS was located on the driver, passenger, or rear seat in Experiment 1. The HATS always faced forward. The effects of an open window, air conditioner and absorption by a person were investigated in Experiment 2. The HATS was fixed on the driver seat. All windows were open and the air conditioner was turned off in the open-window setting. The effect of the air conditioner was investigated by setting the air-conditioning mode to off, weak and strong. To clarify the effects of the absorption by a human, passenger and rear seats were occupied by a person for one experimental setting. When all seats were occupied, the air conditioner was set off in car A and set to weak in car B. The background noise level was measured according to the A-weighted equivalent continuous sound pressure level (LAeq) and is summarized in Table 1. The car was in an idling state and stationary during the measurement.
Orthogonal parameters obtained from the binaural impulse responses in a sound field have been proposed to evaluate the subjective preference at each seat in a concert hall [38,39]. The four orthogonal parameters are the sound pressure level (SPL), initial time delay gap between the direct sound and first reflection (ITDG), reverberation time (RT) and magnitude of the interaural cross-correlation function (IACC). Three subjectively different aspects of an objective parameter have been proposed to describe the properties of a sound field [40]: loudness (sound strength (G), which corresponds to the SPL), reverberance clarity (RT, early decay time (EDT) and balance between early- and late-arriving energy (Cte)) and spaciousness (IACC). te denotes the time limit of either 50 or 80 ms while C80 denotes the clarity for music. To evaluate sound fields in car environments, we calculated G, ITDG, RT, EDT, C80 and IACC from the impulse response according to the ISO 3382 standard [41] although we could not comply with some rules such as those of the sound sources. G values were normalized by all-pass values. RT was derived from the times at which the decay curve first reaches 5 and 25 dB below the initial level and is denoted T20. G, RT, EDT, C80 and IACC values were obtained at one-octave band enter frequencies between 125 Hz and 4 kHz. Sharpness was also calculated to evaluate the high-frequency content of the impulse response [42]. The sharpness of the impulse response was calculated via the addition of a weighting function to the specific loudness spectrum. The values obtained for the binaural impulse response were calculated as arithmetic means for the two ears. The analyses were conducted using a Matlab based analysis program (Mathworks, Natick, MA, USA). The effect of the position in the car, an open window, air conditioner, the absorption by a human and the type of a car on G, ITDG, RT, EDT, C80, IACC and Sharpness values were statistically analyzed using a repeated-measures analysis of variance (ANOVA). The analyses were carried out using SPSS statistical analysis software (SPSS version 24.0, IBM, New York, NY, United States).
3. Results
Figure 3a,b shows G values at each position in cars A (Figure 3a) and B (Figure 3b). Repeated-measures-ANOVA indicated significant effects of the seat position and the type of a car on G values (p < 0.01). The driver and passenger seats had smaller G values than other seats at 125 and 250 Hz in car A. Figure 3c,d shows G values for open-window, air-conditioner and multiple passenger settings in cars A (Figure 3c) and B (Figure 3d). The G values between 125 and 1000 Hz were lower than those at 2000 and 4000 Hz. One-way ANOVA indicated significant effects of the frequency on G values (p < 0.01). This attenuation at lower frequency has not been observed in concert halls, churches, or temples [43,44,45] although the attenuation at lower limited frequency by seat dip effect was observed in concert halls and theaters [46,47,48].
Table 2 and Table 3 gives the ITDG values in each setting. Repeated-measures-ANOVA indicated the ITDG values for car B were significantly longer than those for car A (p < 0.05). The positions in the car, open windows, use of the air conditioner and the absorption by a human did not have significant effects on ITDG values.
Figure 4a,b shows RT values at each position in cars A (Figure 4a) and B (Figure 4b). Repeated-measures-ANOVA indicated significant effects of the seat position and the type of a car on RT values (p < 0.01). RT values were lowest for the driver seat at 125 and 250 Hz and highest for the back-right seat at 125, 250 and 500 Hz in car B. Figure 4c,d shows RT values for open-window, air-conditioner and multiple passenger settings in cars A (Figure 4c) and B (Figure 4d). Repeated-measures-ANOVA indicated significant effects of the air conditioner on RT values (p < 0.01). RT values were longest for the strongest air-conditioning setting at 125 and 250 Hz in car A and at 125 Hz in car B.
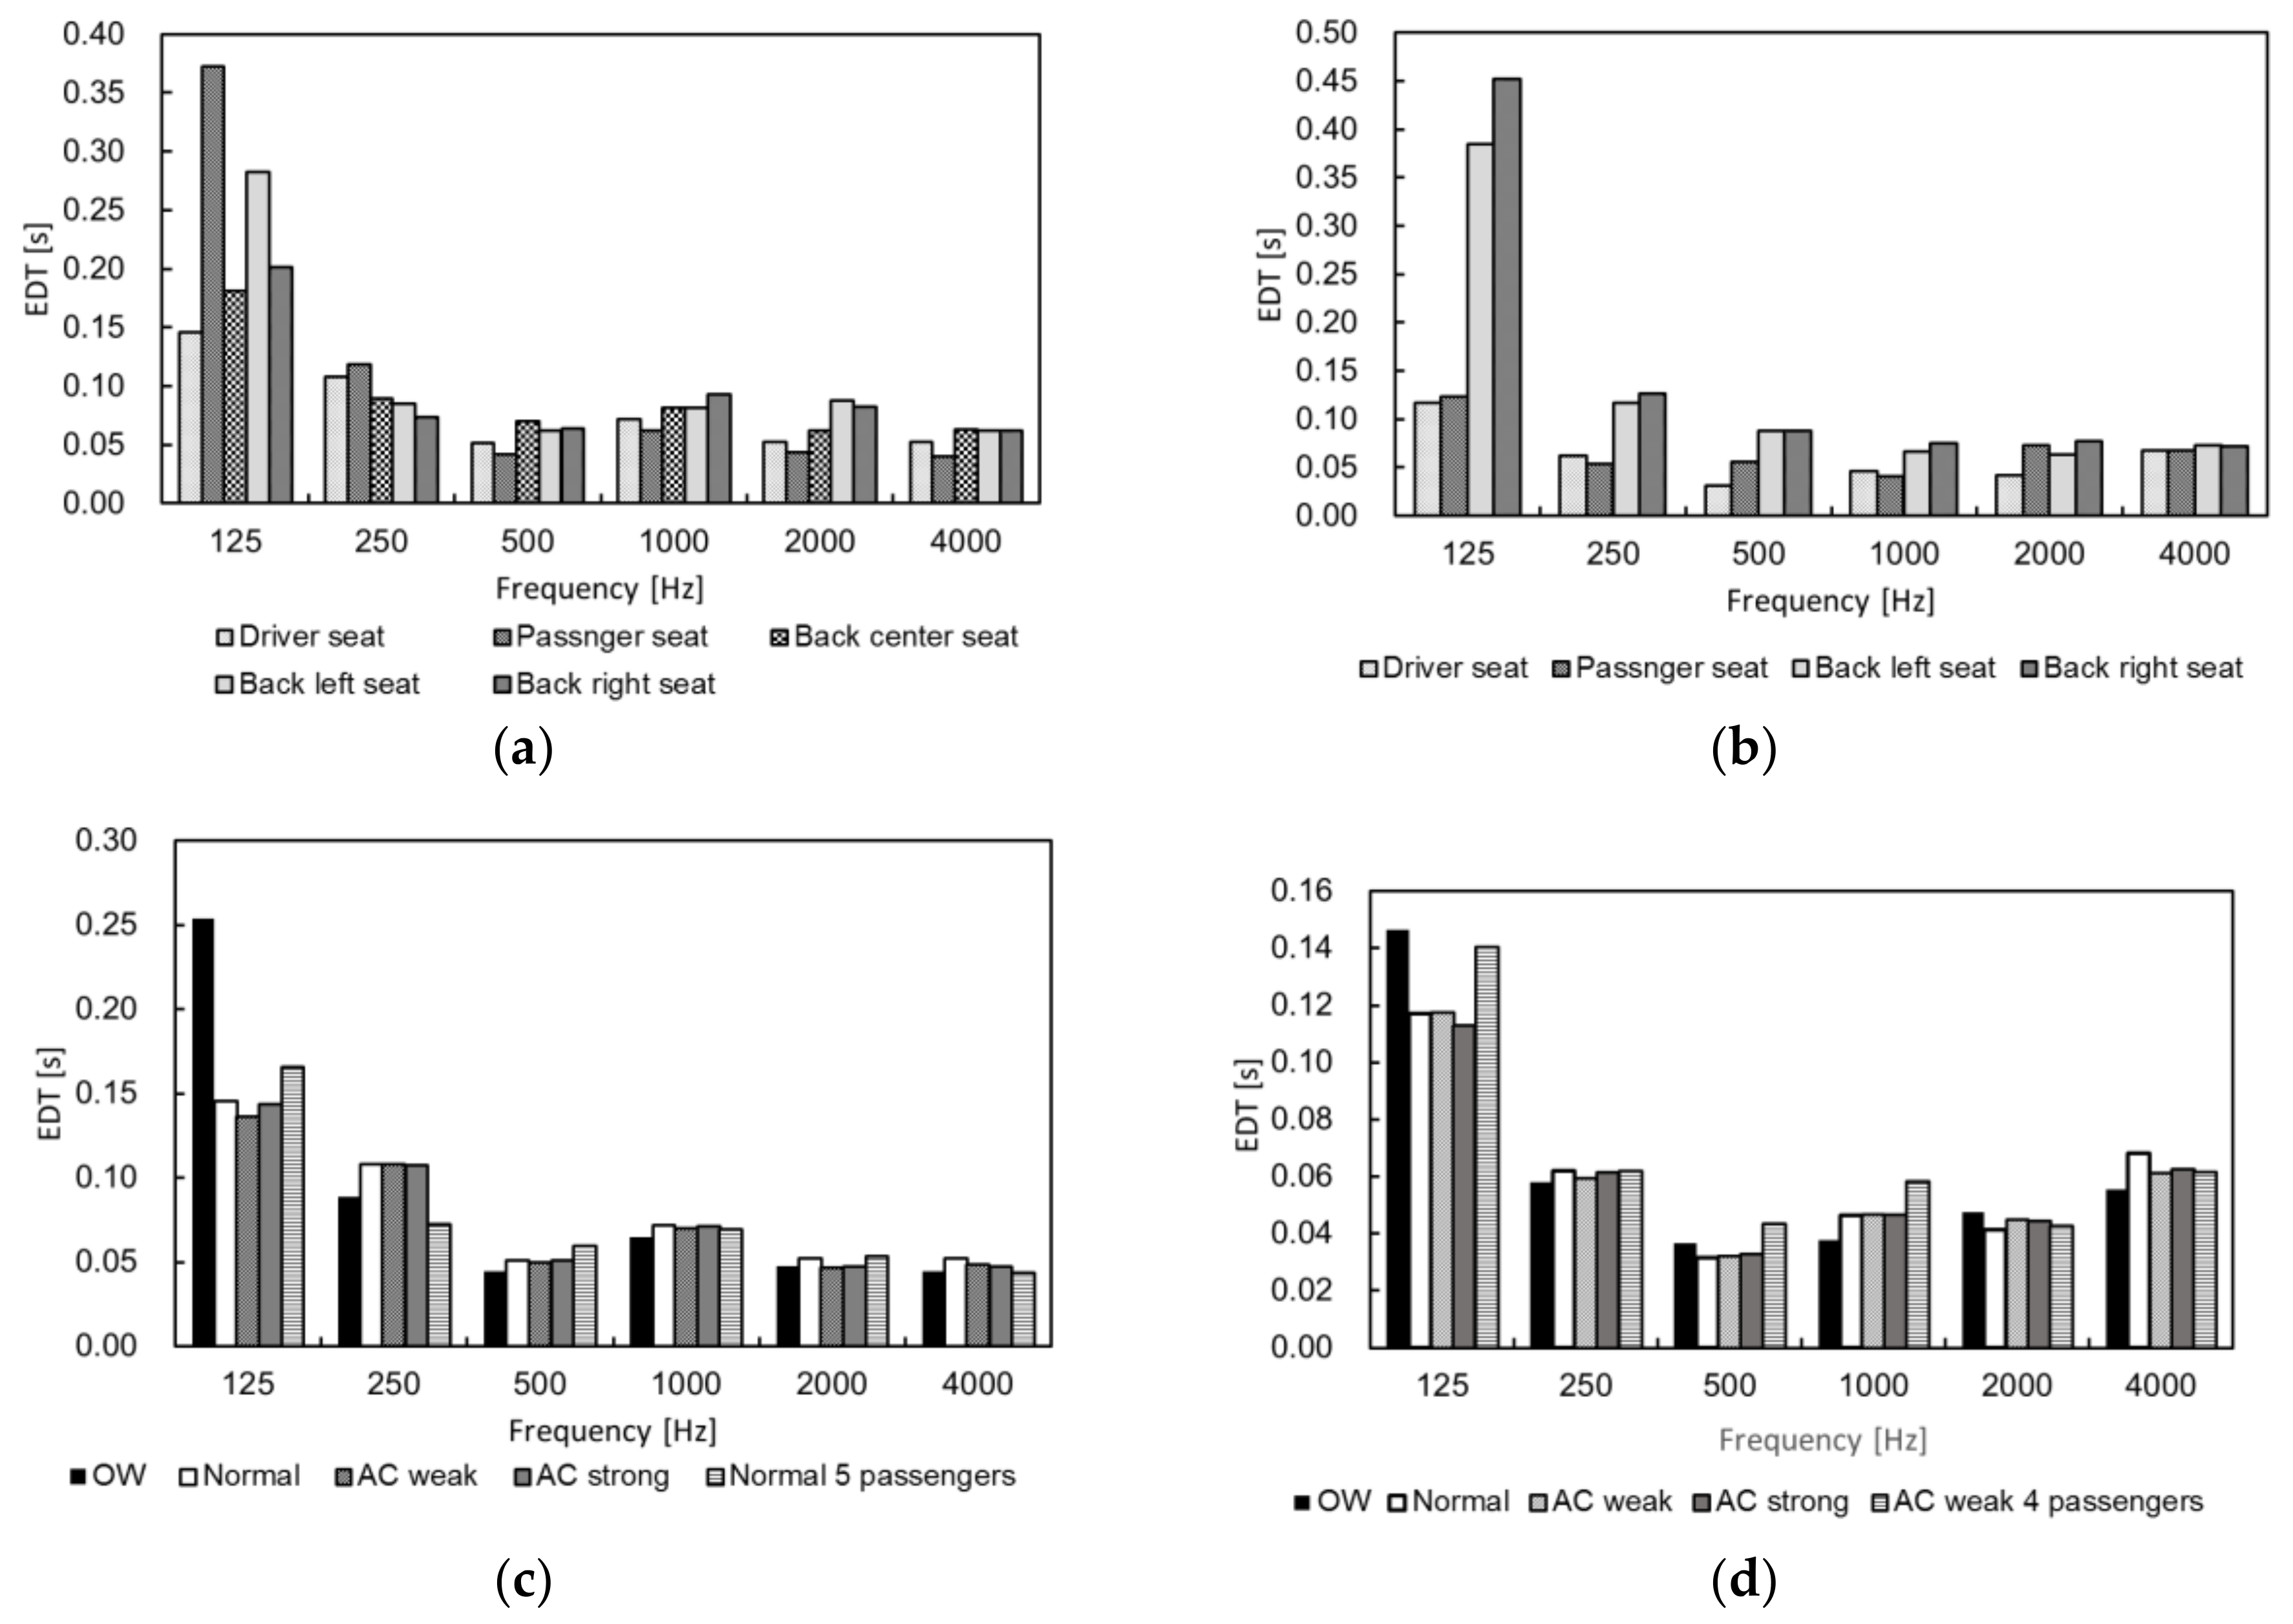
Figure 5a,b shows EDT values at each position in cars A (Figure 5a) and B (Figure 5b). Repeated-measures-ANOVA indicated significant effects of the seat position on EDT values (p < 0.01). The passenger seat had the highest EDT values at 125 and 250 Hz and lowest between 500 and 4000 Hz in car A. The back seat had longer values between 125 and 1000 Hz in car B. Figure 5c,d shows EDT values for open-window, air-conditioner and multiple passenger settings in cars A (Figure 5c) and B (Figure 5d). Repeated-measures-ANOVA indicated only the effect of the type of a car on EDT values was significant (p < 0.01).
Figure 6a,b shows C80 values at each position in cars A (Figure 6a) and B (Figure 6b). Repeated-measures-ANOVA indicated significant effects of the seat position on C80 values (p < 0.01). The passenger seat had the maximum values between 1000 and 4000 Hz and the back-left seat had the minimum values at 2000 and 4000 Hz in car A. The driver seat had the maximum values between 500 and 4000 Hz and the back-right seat had the minimum values between 500 and 4000 Hz in car B. Figure 6c,d shows C80 values under open-window, air-conditioner and multiple passenger settings in cars A (Figure 6c) and B (Figure 6d). Repeated-measures-ANOVA indicated significant effects of the open window, air conditioner and the absorption by a human on C80 values (p < 0.01). The strong air-conditioner setting reduced C80 by more than 3 dB between 250 and 8000 Hz in car A and between 500 and 8000 Hz in car B. The weak air-conditioner setting reduced C80 by more than 3 dB between 1000 and 4000 Hz in cars A and B. The open-window setting reduced C80 between 1000 and 4000 Hz; in particular, there was a reduction of more than 30 dB at 4000 Hz.
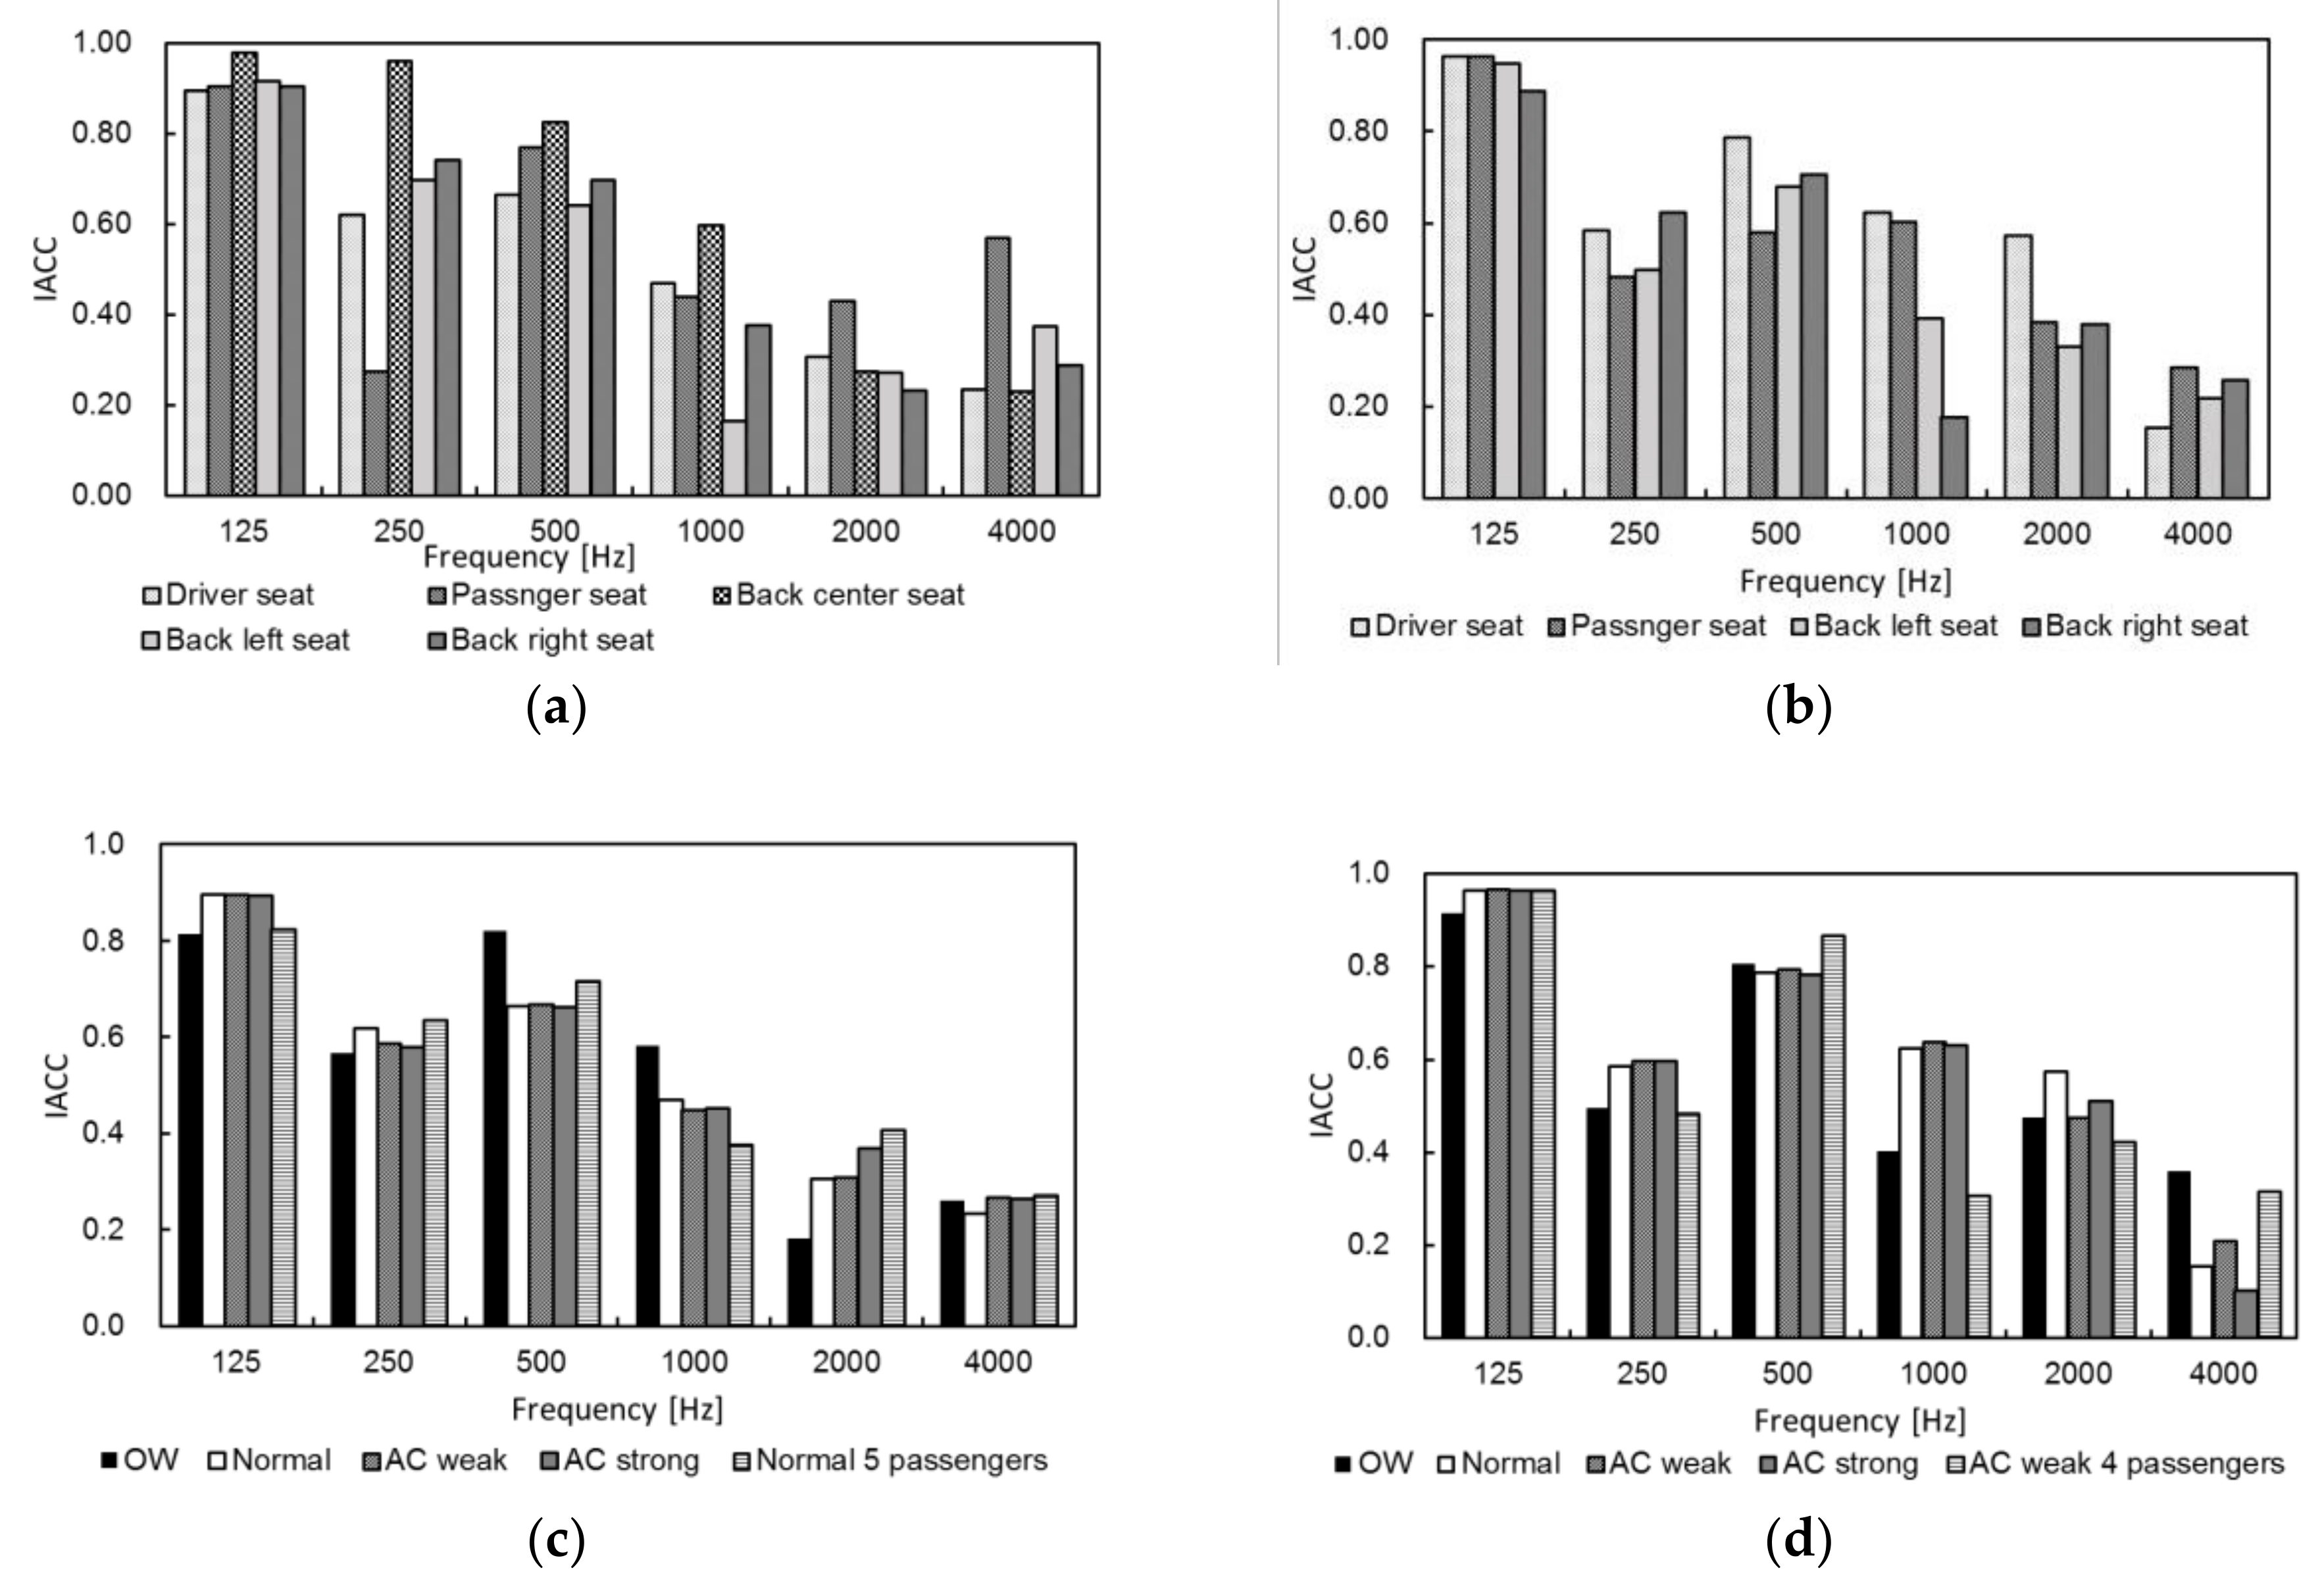
Figure 7a,b shows IACC values at each position in cars A (Figure 7a) and B (Figure 7b). Repeated-measures-ANOVA indicated significant effects of the seat position on IACC values (p < 0.01). The back center seat had the highest IACC values between 250 and 1000 Hz in car A. The back-left and back-right seats had lower values at 1000 and 2000 Hz than the driver and passenger seats in both cars. Figure 7c,d shows IACC values under open-window, air-conditioner and multiple passenger settings in cars A (Figure 7c) and B (Figure 7d). Repeated-measures-ANOVA indicated significant effects of the open window on IACC values (p < 0.05). Under the open-window condition, IACC values increased at 500 and 1000 Hz and reduced at 2000 Hz in car A and increased at 4000 Hz and decreased at 1000 Hz in car B. The air-conditioner settings and the absorption by a human had no significant effects on IACC values.
4. Discussion
Effects of the passenger position on G, EDT, C80 and IACC were observed yet the effects were not always the same for cars A and B because of differences in, for example, the volume and upholstery. G values between 125 and 1000 Hz were different between front and rear seats, although the tendency was not same in cars A and B. EDT values were longer in the passenger and rear-left seats of car A and rear seats of car B. C80 values decreased around 2 kHz in the rear seats of cars A and B. IACC values were high below 1 kHz in the rear central seat of car A because of the strong direct and reflected sounds received from the front direction. IACC values averaged in the range from 125 to 4000 Hz octave bands in rear-left and rear-right seats were smaller than those in front seats, suggesting more complex reflections and diffused sound fields in rear seats. No effects of passenger position on ITDG were observed.
Opening windows attenuated G values at 125 and 250 Hz and C80 values above 1 kHz, suggesting that lower-frequency components of the reflections emitted from windows and higher-frequency components of the reflections were delayed. Opening the windows increased sharpness, confirming the emission of lower-frequency components. IACC values at 500 Hz increased under the open-window condition. A prominent increment was also observed when there were multiple passengers. Open windows and absorption by passengers, in combination with small volumes and differences in upholstery, affect the IACC behavior in a car cabin. No effects of opening windows on ITDG, RT and EDT were observed.
A fluctuation in SPL due to the use of the air conditioner was observed in the frequency domain above 2 kHz in a large space [49]. This is explained as the result of the combination of the direct wave (regular) and the changing delay time of reflected sound (irregular). In this study, the use of an air conditioner reduced C80 values from 1 kHz under the weak mode and from 500 Hz under the strong mode, suggesting that noise generated by the air conditioner blurred high-frequency components. RT values became slightly longer under the strong air-conditioning mode, although the increment was less than a threshold [50]. No effects of using the air conditioner on G, ITDG, EDT and IACC were observed.
5. Conclusions
Factors that affect sound field characteristics in a car cabin were investigated. An effect of the passenger position on sound strength, G, was found between 125 and 500 Hz. The rear central seats had the highest magnitude of the interaural cross-correlation function, IACC. Opening windows and using an air conditioner attenuated the balance between early- and late-arriving energy, C80, above 1 kHz, resulting in a loss of clarity of music.
In the field of architectural acoustics [38,39,51], theory proposes optimal ranges of acoustical factors, such as the reverberation time, RT, early decay time, EDT and balance between early- and late-arriving energy, C80 and is used in the actual design of concert halls, opera houses and churches [44,52]. The theory can also be applied to sound fields in car cabins although the optimal ranges of acoustical factors may be different. The present study is part our investigation of the optimal ranges of acoustical factors in car cabins.
The optimal range of an acoustic factor is affected by the type of music [38,39,51] and the characteristics of the music source [53,54]. Sound field characteristics in the car cabin can affect which music is suited to the car cabin. It is possible to harmonize music to the car cabin using the acoustic factors used in this study and factors calculated for the music source. These results will be helpful in understanding sound fields, guiding improvements to the sound field and finding appropriate music for car cabins. The presented study thus provides results that are needed to commence further studies.
Acknowledgments
We thank Glenn Pennycook from Edanz Group (www.edanzediting.com/ac) for editing a draft of this manuscript.
Author Contributions
Yoshiharu Soeta and Yoshisada Sakamoto conceived and designed the experiments; Yoshiharu Soeta performed the experiments analyzed the data; Yoshisada Sakamoto contributed the adjustments of the cars; Yoshiharu Soeta wrote the paper.
Conflicts of Interest
The authors declare no conflict of interest.
References
- Samarasinghe, P.N.; Zhang, W.; Abhayapala, T.D. Recent advances in active noise control inside automobile cabins: Toward quieter cars. IEEE Signal Process Mag. 2016, 33, 61–73. [Google Scholar] [CrossRef]
- Licitra, G.; Cerchiai, M.; Teti, L.; Ascari, E.; Fredianelli, L. Durability and variability of the acoustical performance of rubberized road surfaces. Appl. Acoust. 2015, 94, 20–28. [Google Scholar] [CrossRef]
- Garay-Vega, L.; Hastings, A.; Pollard, J.K.; Zuschlag, M.; Stearns, M.D. Quieter Cars and the Safety of Blind Pedestrians: Phase I (DOT HS 811 304); National Highway Traffic Safety Administration: Washington, DC, USA, 2010. [Google Scholar]
- Lee, S.K. Objective evaluation of interior sound quality in passenger cars during acceleration. J. Sound Vib. 2008, 310, 149–168. [Google Scholar] [CrossRef]
- Shin, S.H.; Ih, J.G.; Hashimoto, T.; Hatano, S. Sound quality evaluation of the booming sensation for passenger cars. Appl. Acoust. 2009, 70, 309–320. [Google Scholar] [CrossRef]
- Malen, D.; Scott, R. Improving automobile door-closing sound for customer preference. Noise Control Eng. J. 1993, 41, 261–271. [Google Scholar] [CrossRef]
- Parizet, E.; Guyader, E.; Nosulenko, V. Analysis of car door closing sound quality. Appl. Acoust. 2008, 69, 12–22. [Google Scholar] [CrossRef]
- Lim, T.C. Correlations between deficiencies in power window systems influencing sound quality and some psychoacoustic metrics. Appl. Acoust. 2001, 62, 1025–1047. [Google Scholar] [CrossRef]
- Nykanen, A.; Sirkka, A. Specification of component sound quality applied to automobile power windows. Appl. Acoust. 2009, 70, 813–820. [Google Scholar] [CrossRef]
- Volandri, G.; Puccio, F.D.; Forte, P.; Mattei, L. Psychoacoustic analysis of power windows sounds: Correlation between subjective and objective evaluations. Appl. Acoust. 2018, 134, 160–170. [Google Scholar] [CrossRef]
- Gaspar, J.; Fontul, M.; Henriques, E.; Ribeiro, A.; Silva, A.; Valverde, N. Psychoacoustics of in-car switch buttons: From feelings to engineering parameters. Appl. Acoust. 2016, 110, 280–296. [Google Scholar] [CrossRef]
- Ma, Y.; Chin, C.S.; Woo, W.L.; Gao, B. An acoustic annoyance study of hard disk drive for laptop. IEEE Trans. Magn. 2016, 52, 1–9. [Google Scholar] [CrossRef]
- Leite, R.P.; Paul, S.; Gerges, S.N.Y. A sound quality-based investigation of the HVAC system noise of an automobile model. Appl. Acoust. 2009, 70, 635–645. [Google Scholar] [CrossRef]
- Yoon, J.H.; Yang, I.H.; Jeong, J.E.; Park, S.G.; Oh, J.E. Reliability improvement of a sound quality index for a vehicle HVAC system using a regression and neural network model. Appl. Acoust. 2012, 73, 1099–1103. [Google Scholar] [CrossRef]
- Soeta, Y.; Nakagawa, S.; Kamiya, Y.; Kamiya, M. Subjective preference for air-conditioner sounds inside a car in summer and winter. J. Ergon. 2016, 6, 1–7. [Google Scholar] [CrossRef]
- Frank, E.C.; Pickering, D.J.; Raglin, C. In-Vehicle Tire Sound Quality Prediction from Tire Noise Data. SAE Tech. Pap. 2007. [Google Scholar] [CrossRef]
- Otto, N.; Feng, B.J. Wind noise sound quality. SAE Tech. Pap. 1995. [Google Scholar] [CrossRef]
- Lee, H.H.; Lee, S.K. Objective evaluation of interior noise booming in a passenger car based on sound metrics and artificial neural networks. Appl. Ergon. 2009, 40, 860–869. [Google Scholar] [CrossRef] [PubMed]
- Wang, Y.S.; Shen, G.Q.; Xing, Y.F. A sound quality model for objective synthesis evaluation of vehicle interior noise based on artificial neural network. Mech. Syst. Signal Process 2014, 45, 255–266. [Google Scholar] [CrossRef]
- Xing, Y.F.; Wang, Y.S.; Shi, L.; Guo, H.; Chen, H. Sound quality recognition using optimal wavelet-packet transform and artificial neural network methods. Mech. Syst. Signal Process 2016, 66–67, 875–892. [Google Scholar] [CrossRef]
- Huang, H.B.; Li, R.X.; Yan, M.L.; Lim, T.C.; Ding, W.P. Evaluation of vehicle interior sound quality using a continuous restricted Boltzmann machine-based DBN. Mech. Syst. Signal Process 2017, 84, 245–267. [Google Scholar] [CrossRef]
- Wagner, V.; Kallus, K.W.; Foehl, U. Dimensions of vehicle sounds perception. Appl. Ergon. 2017, 64, 41–46. [Google Scholar] [CrossRef] [PubMed]
- Ma, K.W.; Wong, H.M.; Mak, C.M. A systematic review of human perceptual dimensions of sound: Meta-analysis of semantic differential method applications to indoor and outdoor sounds. Build Environ. 2018, 133, 123–150. [Google Scholar] [CrossRef]
- Granier, E.; Kleiner, M.; Dalenbäck, B.I.; Svensson, P. Experimental auralization of car audio installations. J. Audio Eng. Soc. 1996, 44, 835–849. [Google Scholar]
- Bozzoli, F.; Armelloni, E.; Ugolott, E.; Farina, E. Effects of the background noise on the perceived quality of car audio systems. In Proceedings of the 112th Convention of the Audio Engineering Society, München, Germany, 10–13 May 2002; Convention Paper 5540. Audio Engineering Society: New York, NY, USA, 2002. [Google Scholar]
- Christensen, F.; Martin, G.; Minnaar, P.; Song, W.K.; Pedersen, B.; Lydolf, M. A listening test system for automotive audio-Part 1: System description. In Proceedings of the 118th Convention of the Audio Engineering Society, Barcelona, Spain, 28–31 May 2005; Convention Paper 6358. Audio Engineering Society: New York, NY, USA, 2005. [Google Scholar]
- Farina, A.; Ugolotti, E. Subjective comparison between Stereo Dipole and 3D ambisonics surround systems for automotive applications. In Proceedings of the AES Conference: 16th International Conference on Spatial Sound Reproduction, Rovaniemi, Finland, 10–12 April 1999; Paper Number: 16-048. Audio Engineering Society: New York, NY, USA, 1999. [Google Scholar]
- Tervo, S.; Pätynen, J.; Kuusinen, A.; Lokki, T. Spatial decomposition method for room impulse responses. J. Audio Eng. Soc. 2013, 61, 16–29. [Google Scholar]
- Kaplanis, N.; Bech, S.; Tervo, S.; Pätynen, J.; Lokki, T.; Waterschoot, T.V.; Jensen, S.H. A rapid sensory analysis method for perceptual assessment of automotive audio. J. Audio Eng. Soc. 2017, 65, 130–146. [Google Scholar] [CrossRef]
- Hegarty, P.; Choisel, S.; Bech, S. A listening test system for automotive audio-Part 3: Comparison of attribute ratings made in a vehicle with those made using an auralization system. In Proceedings of the 123th Convention of the Audio Engineering Society, New York, NY, USA, 5–8 October 2007; Convention Paper 7224. Audio Engineering Society: New York, NY, USA, 2007. [Google Scholar]
- Martin, G.; Bech, S. Attribute identification and quantification in automotive audio—Part 1: Introduction to the descriptive analysis technique. In Proceedings of the 118th Convention of the Audio Engineering Society, Barcelona, Spain, 28–31 May 2005. [Google Scholar]
- Kaplanis, N.; Bech, S.; Tervo, S.; Pätynen, J.; Lokki, T.; Waterschoot, T.V.; Jensen, S.H. Perceptual aspects of reproduced sound in car cabin acoustics. J. Acoust. Soc. Am. 2017, 141, 1459–1469. [Google Scholar] [CrossRef] [PubMed]
- Jeon, J.Y.; Lee, P.J.; You, J.; Kang, J. Perceptual assessment of quality of urban soundscapes with combined noise sources and water sounds. J. Audio Eng. Soc. 2010, 127, 1357–1366. [Google Scholar] [CrossRef] [PubMed]
- Cassina, L.; Fredianell, L.; Menichini, I.; Chiari, C.; Licitra, G. Audio-visual preferences and tranquillity ratings in urban areas. Environments 2018, 5, 1. [Google Scholar] [CrossRef]
- Kleiner, M.; Lindgren, C. Objective characterization of audio sound fields in automotive spaces. In Proceedings of the 15th International Conference, Copenhagen, Denmark, 31 October–2 November 1998; Convention Paper 15-007. Audio Engineering Society: New York, NY, USA, 1998. [Google Scholar]
- Choi, C.; Kim, L.H.; Doo, S.; Oh, Y.; Sung, K.M. Assessment of sound field in a car. In Proceedings of the 113rd Convention of the Audio Engineering Society, Los Angeles, CA, USA, 5–8 October 2002; Convention Paper 5701. Audio Engineering Society: New York, NY, USA, 2002. [Google Scholar]
- Berkhout, A.J.; de Vries, D.; Boone, M.M. A new method to acquire response in concert halls. J. Acoust. Soc. Am. 1980, 68, 179–183. [Google Scholar] [CrossRef]
- Ando, Y. Calculation of subjective preference at each seat in a concert hall. J. Acoust. Soc. Am. 1983, 74, 873–887. [Google Scholar] [CrossRef]
- Ando, Y. Concert hall acoustics based on subjective preference theory. In Springer Handbook of Acoustics; Rossing, T.D., Ed.; Springer: New York, NY, USA, 2007; pp. 351–385. ISBN 978-1-4939-0754-0. [Google Scholar]
- Gade, A.C. Acoustics in halls for speech and music. In Springer Handbook of Acoustics; Rossing, T.D., Ed.; Springer: New York, NY, USA, 2007; pp. 301–350. ISBN 978-1-4939-0754-0. [Google Scholar]
- International Organization for Standardization. Acoustics—Measurement of the Reverberation Time—Part 1: Performance Spaces: ISO 3382-1; International Organization for Standardization: Geneva, Switzerland, 2003. [Google Scholar]
- Zwicker, E.; Fastl, H. Psychoacoustics: Facts and Models; Springer: Berlin, Germany, 1999. [Google Scholar]
- Beranek, L.B. Concert Halls and Opera Houses: Music, Acoustics, and Architecture, 2nd ed.; Springer: New York, NY, USA, 2004; ISBN 978-0-387-95524-7. [Google Scholar]
- Soeta, Y.; Ito, K.; Shimokura, R.; Sato, S.; Ohsawa, T.; Ando, Y. Effects of sound source location and direction on acoustical parameters in Japanese churches. J. Acoust. Soc. Am. 2012, 131, 1206–1220. [Google Scholar] [CrossRef] [PubMed]
- Soeta, Y.; Shimokura, R.; Kim, Y.H.; Ohsawa, T.; Ito, K. Measurement of acoustic characteristics of Japanese Buddhist temples in relation to sound source location and direction. J. Acoust. Soc. Am. 2013, 133, 2699–2710. [Google Scholar] [CrossRef] [PubMed]
- Schultz, T.J.; Watters, B.G. Propagation of sound across audience seating. J. Acoust. Soc. Am. 1964, 36, 885–896. [Google Scholar] [CrossRef]
- Bradley, J.S. Some further investigations of the seat dip effect. J. Acoust. Soc. Am. 1991, 90, 324–333. [Google Scholar] [CrossRef]
- Sessler, G.M.; West, J.E. Sound transmission over theatre seats. J. Acoust. Soc. Am. 1964, 36, 1725–1732. [Google Scholar] [CrossRef]
- Ueda, Y.; Ando, Y. Effects of air conditioning on sound propagation in a large space. J. Acoust. Soc. Am. 1997, 102, 2771–2775. [Google Scholar] [CrossRef]
- Niaounakis, T.I.; Davies, W.J. Perception of reverberation time in small listening rooms. J. Audio Eng. Soc. 2002, 50, 343–350. [Google Scholar]
- Ando, Y. Subjective preference as an overall impression of the sound field. In Architectural Acoustics: Blending Sound Sources, Sound Fields, and Listeners, 1st ed.; Ando, Y., Ed.; Springer: New York, NY, USA, 1998; pp. 26–47. ISBN 978-0-387-98333-2. [Google Scholar]
- Martellotta, F. Subjective study of preferred listening conditions in Italian Catholic churches. J. Sound Vib. 2008, 317, 378–399. [Google Scholar] [CrossRef]
- Shimokura, R.; Soeta, Y. Listening level of music through headphones in train car noise environments. J. Acoust. Soc. Am. 2012, 132, 1407–1416. [Google Scholar] [CrossRef] [PubMed]
- Shimokura, R.; Tronchin, L.; Cocchi, A.; Soeta, Y. Subjective diffuseness of music signals convolved with binaural impulse responses. J. Sound Vib. 2011, 330, 3526–3537. [Google Scholar] [CrossRef]
Figure 1.
Photographs of (a) car A, (b) car B and the position of the loudspeakers used in the measurements in (c) car A, (d) car B. The position of the head and torso simulator (HATS) is shown at the driver’s position.
Figure 1.
Photographs of (a) car A, (b) car B and the position of the loudspeakers used in the measurements in (c) car A, (d) car B. The position of the head and torso simulator (HATS) is shown at the driver’s position.

Figure 2.
Frequency characteristics of the midrange loudspeaker in cars (a) A, (b) B and the tweeters in cars (c) A, (d) B.
Figure 2.
Frequency characteristics of the midrange loudspeaker in cars (a) A, (b) B and the tweeters in cars (c) A, (d) B.

Figure 3.
Measured G [dB] at each passenger position in cars (a) A and (b) B and under open-window (OW), air-conditioner (AC) and multiple passenger settings in cars (c) A and (d) B.
Figure 3.
Measured G [dB] at each passenger position in cars (a) A and (b) B and under open-window (OW), air-conditioner (AC) and multiple passenger settings in cars (c) A and (d) B.
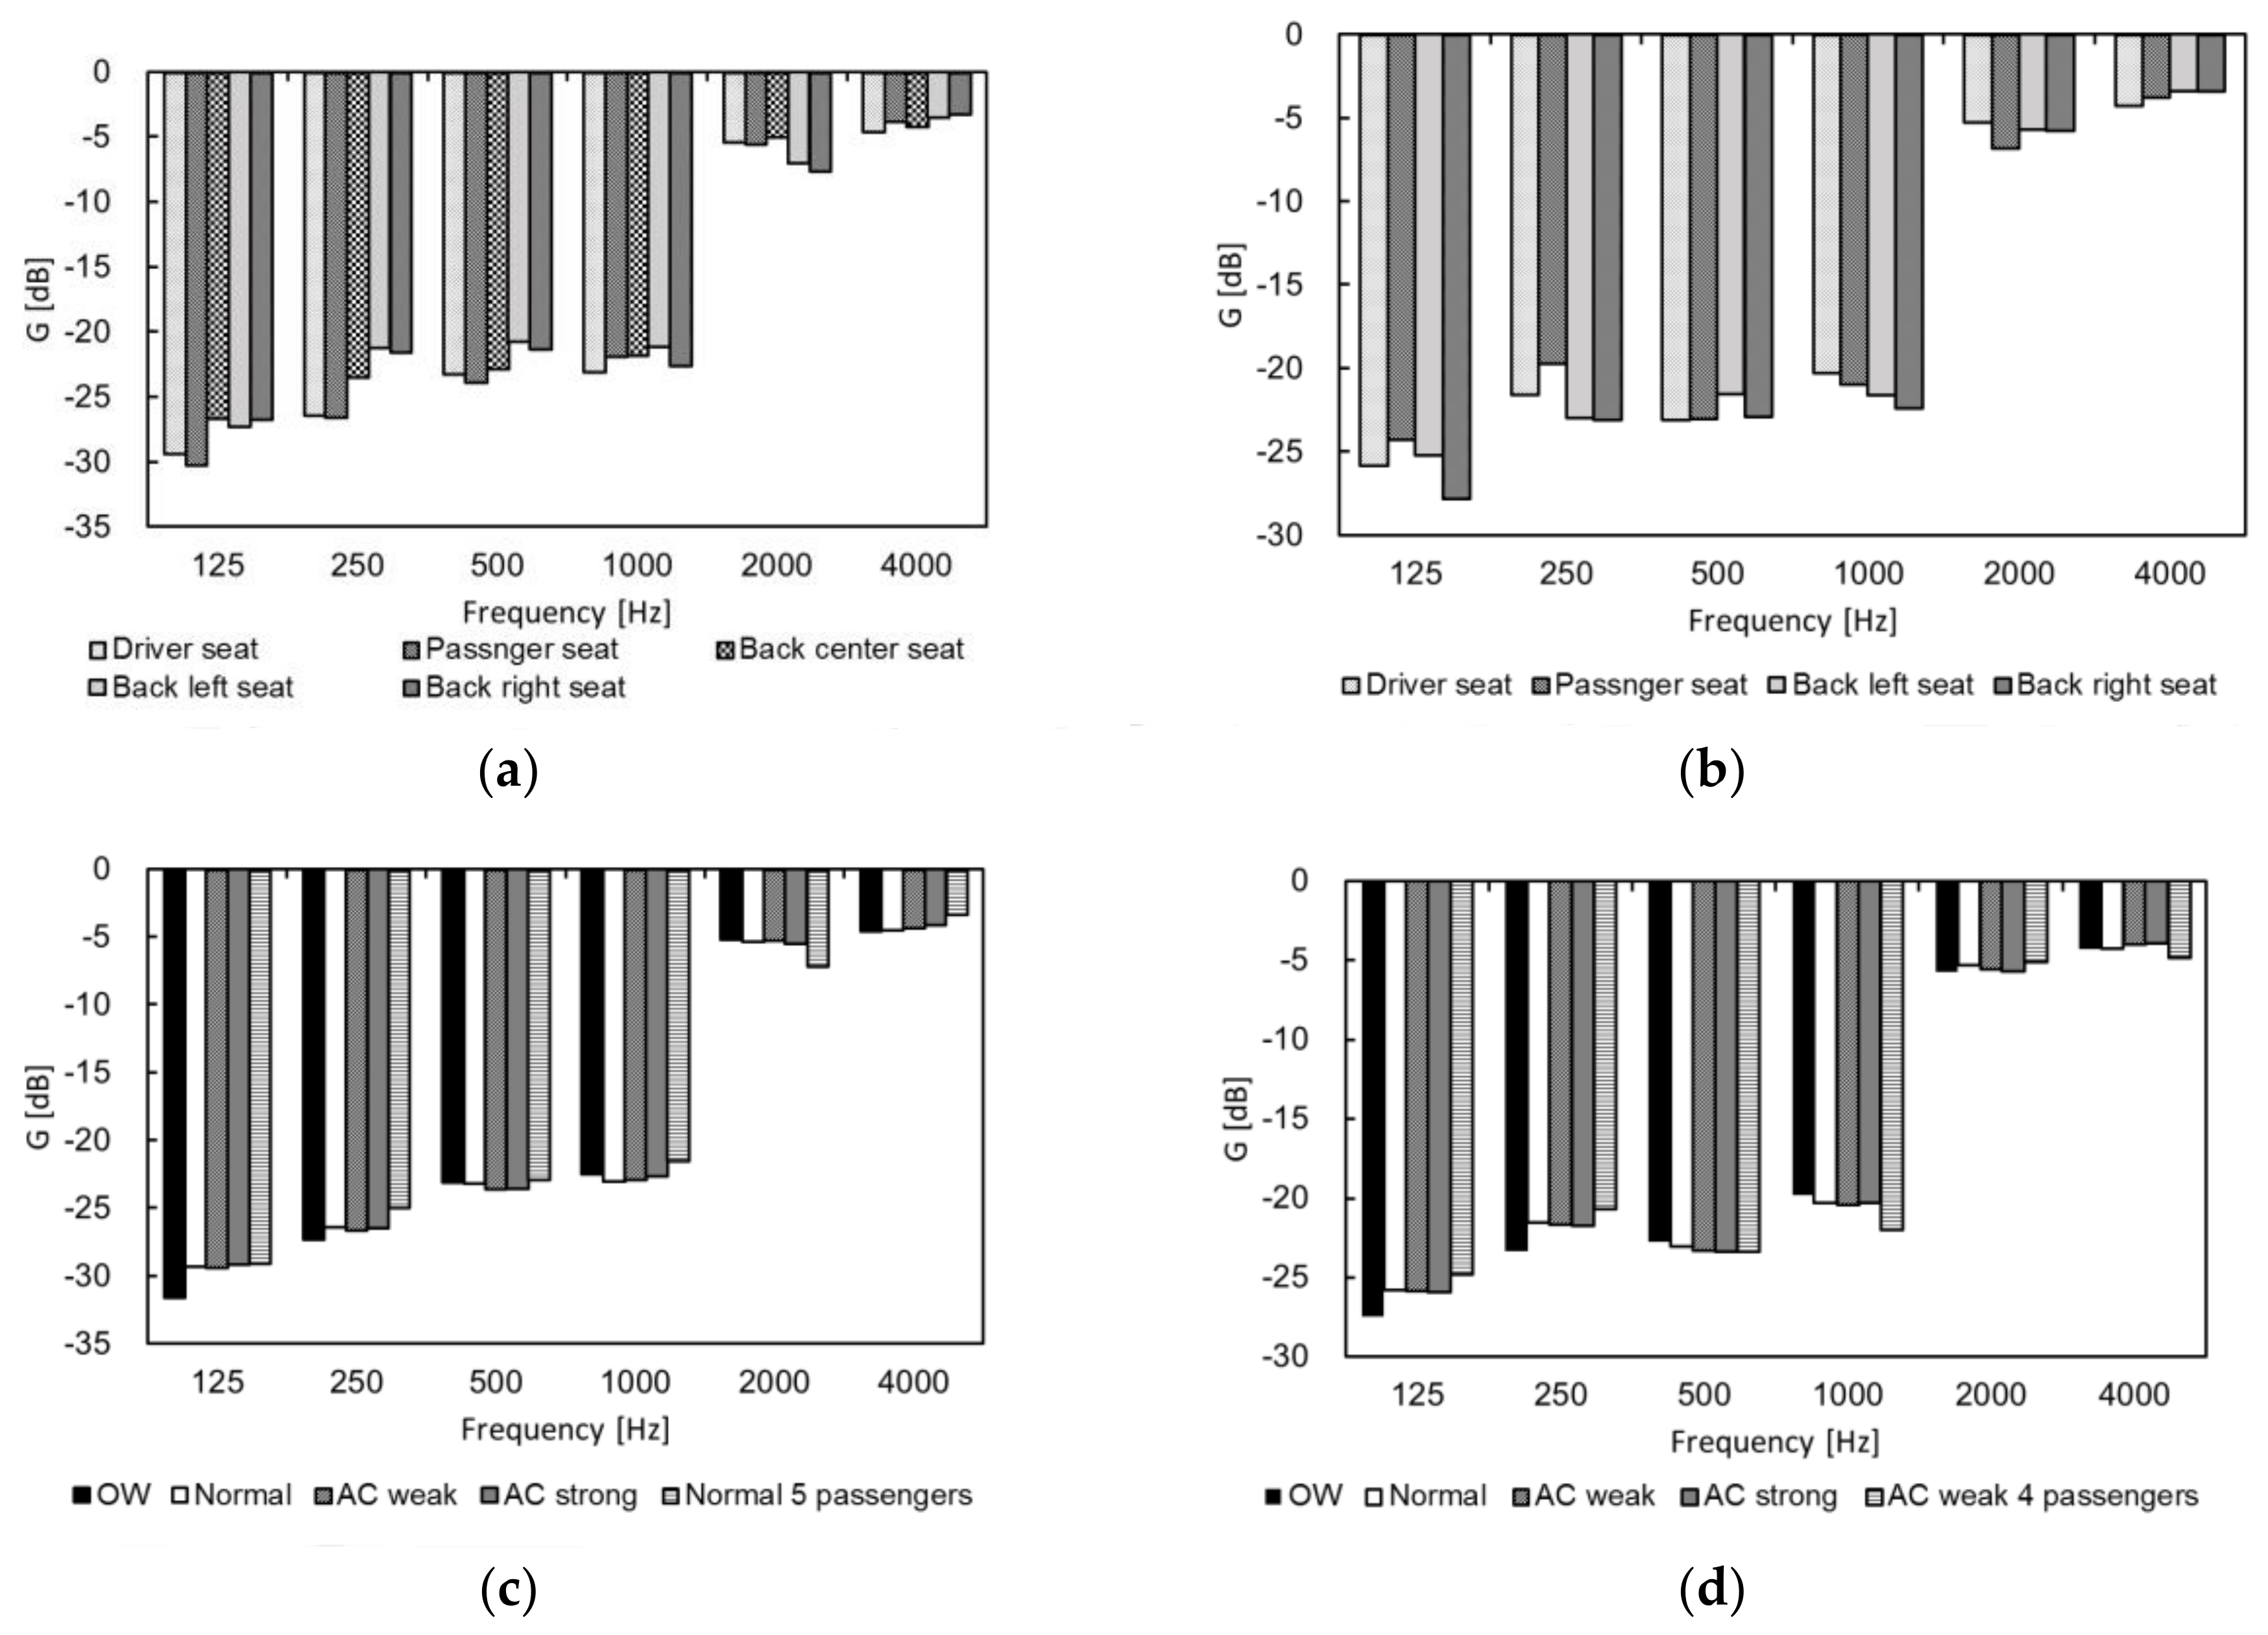
Figure 4.
Measured reverberation time (RT) [s] at each passenger position in cars (a) A and (b) B and under open-window (OW), air-conditioner (AC) and multiple passenger settings in cars (c) A and (d) B.
Figure 4.
Measured reverberation time (RT) [s] at each passenger position in cars (a) A and (b) B and under open-window (OW), air-conditioner (AC) and multiple passenger settings in cars (c) A and (d) B.
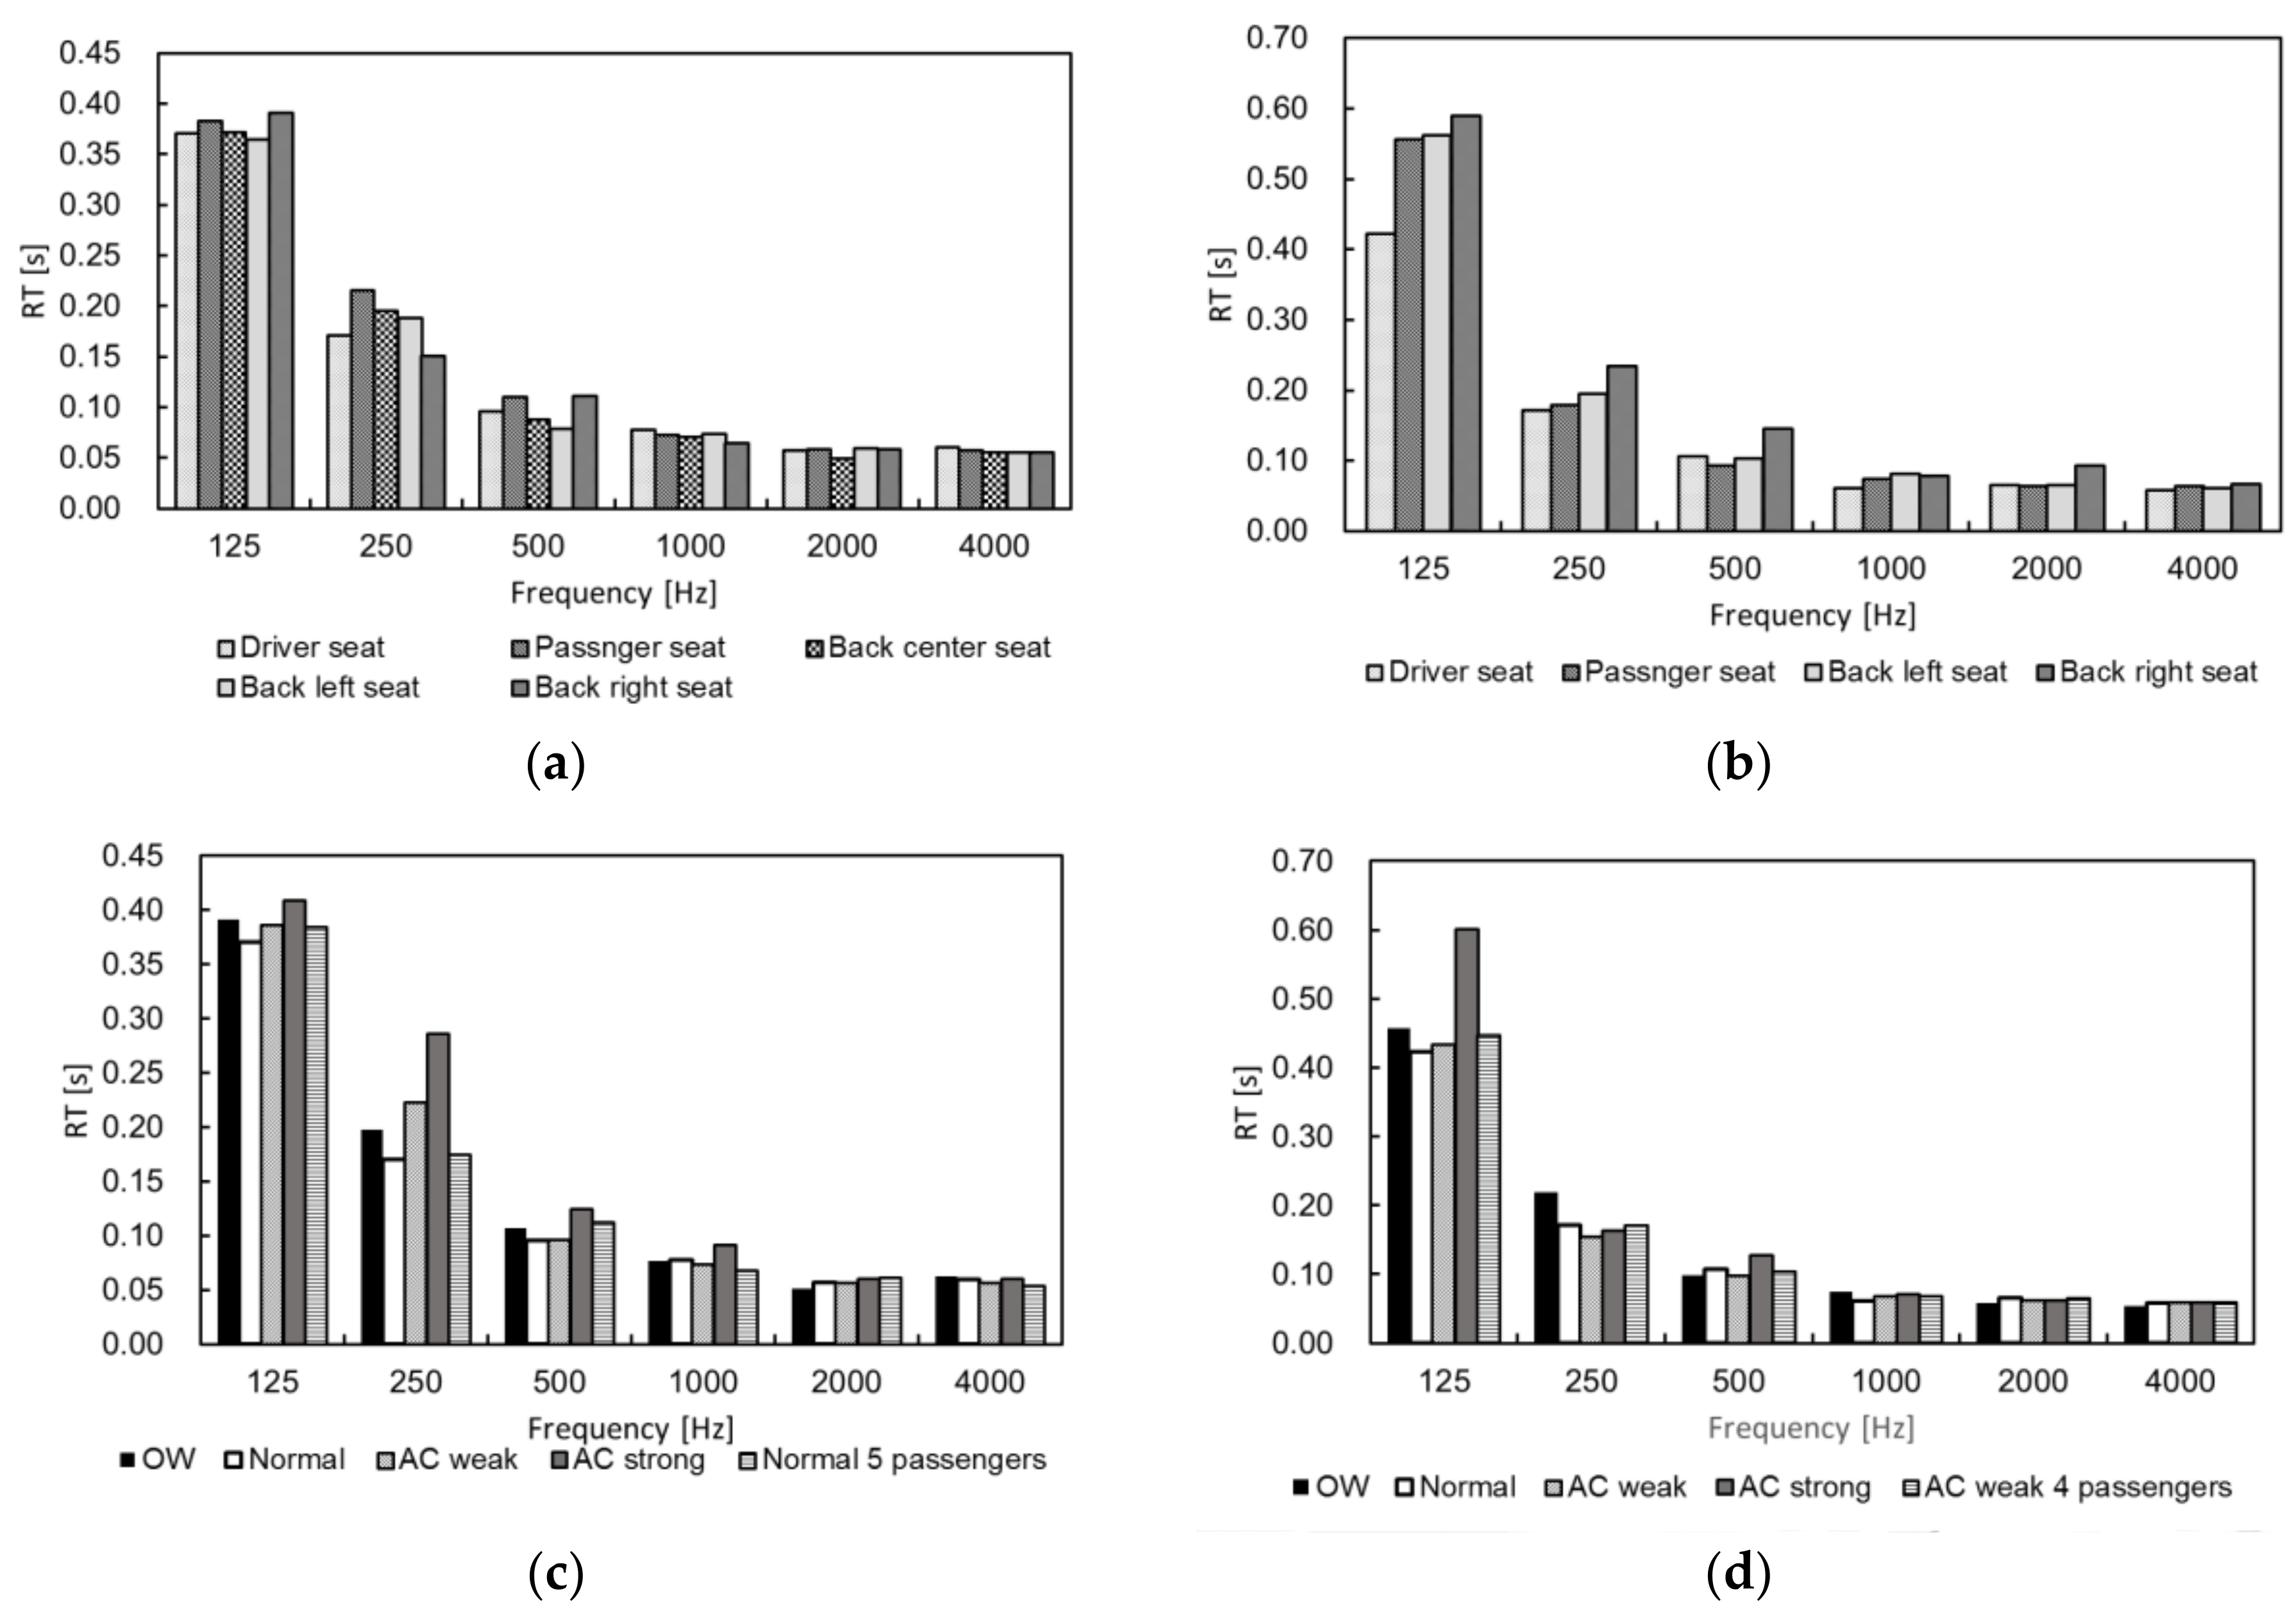
Figure 5.
Measured early decay time (EDT) [s] at each passenger position in cars (a) A and (b) B and under open-window (OW), air-conditioner (AC) and multiple passenger settings in cars (c) A and (d) B.
Figure 5.
Measured early decay time (EDT) [s] at each passenger position in cars (a) A and (b) B and under open-window (OW), air-conditioner (AC) and multiple passenger settings in cars (c) A and (d) B.

Figure 6.
Measured C80 [dB] at each passenger position in cars (a) A and (b) B and under open-window (OW), air-conditioner (AC) and multiple passenger settings in cars (c) A and (d) B.
Figure 6.
Measured C80 [dB] at each passenger position in cars (a) A and (b) B and under open-window (OW), air-conditioner (AC) and multiple passenger settings in cars (c) A and (d) B.
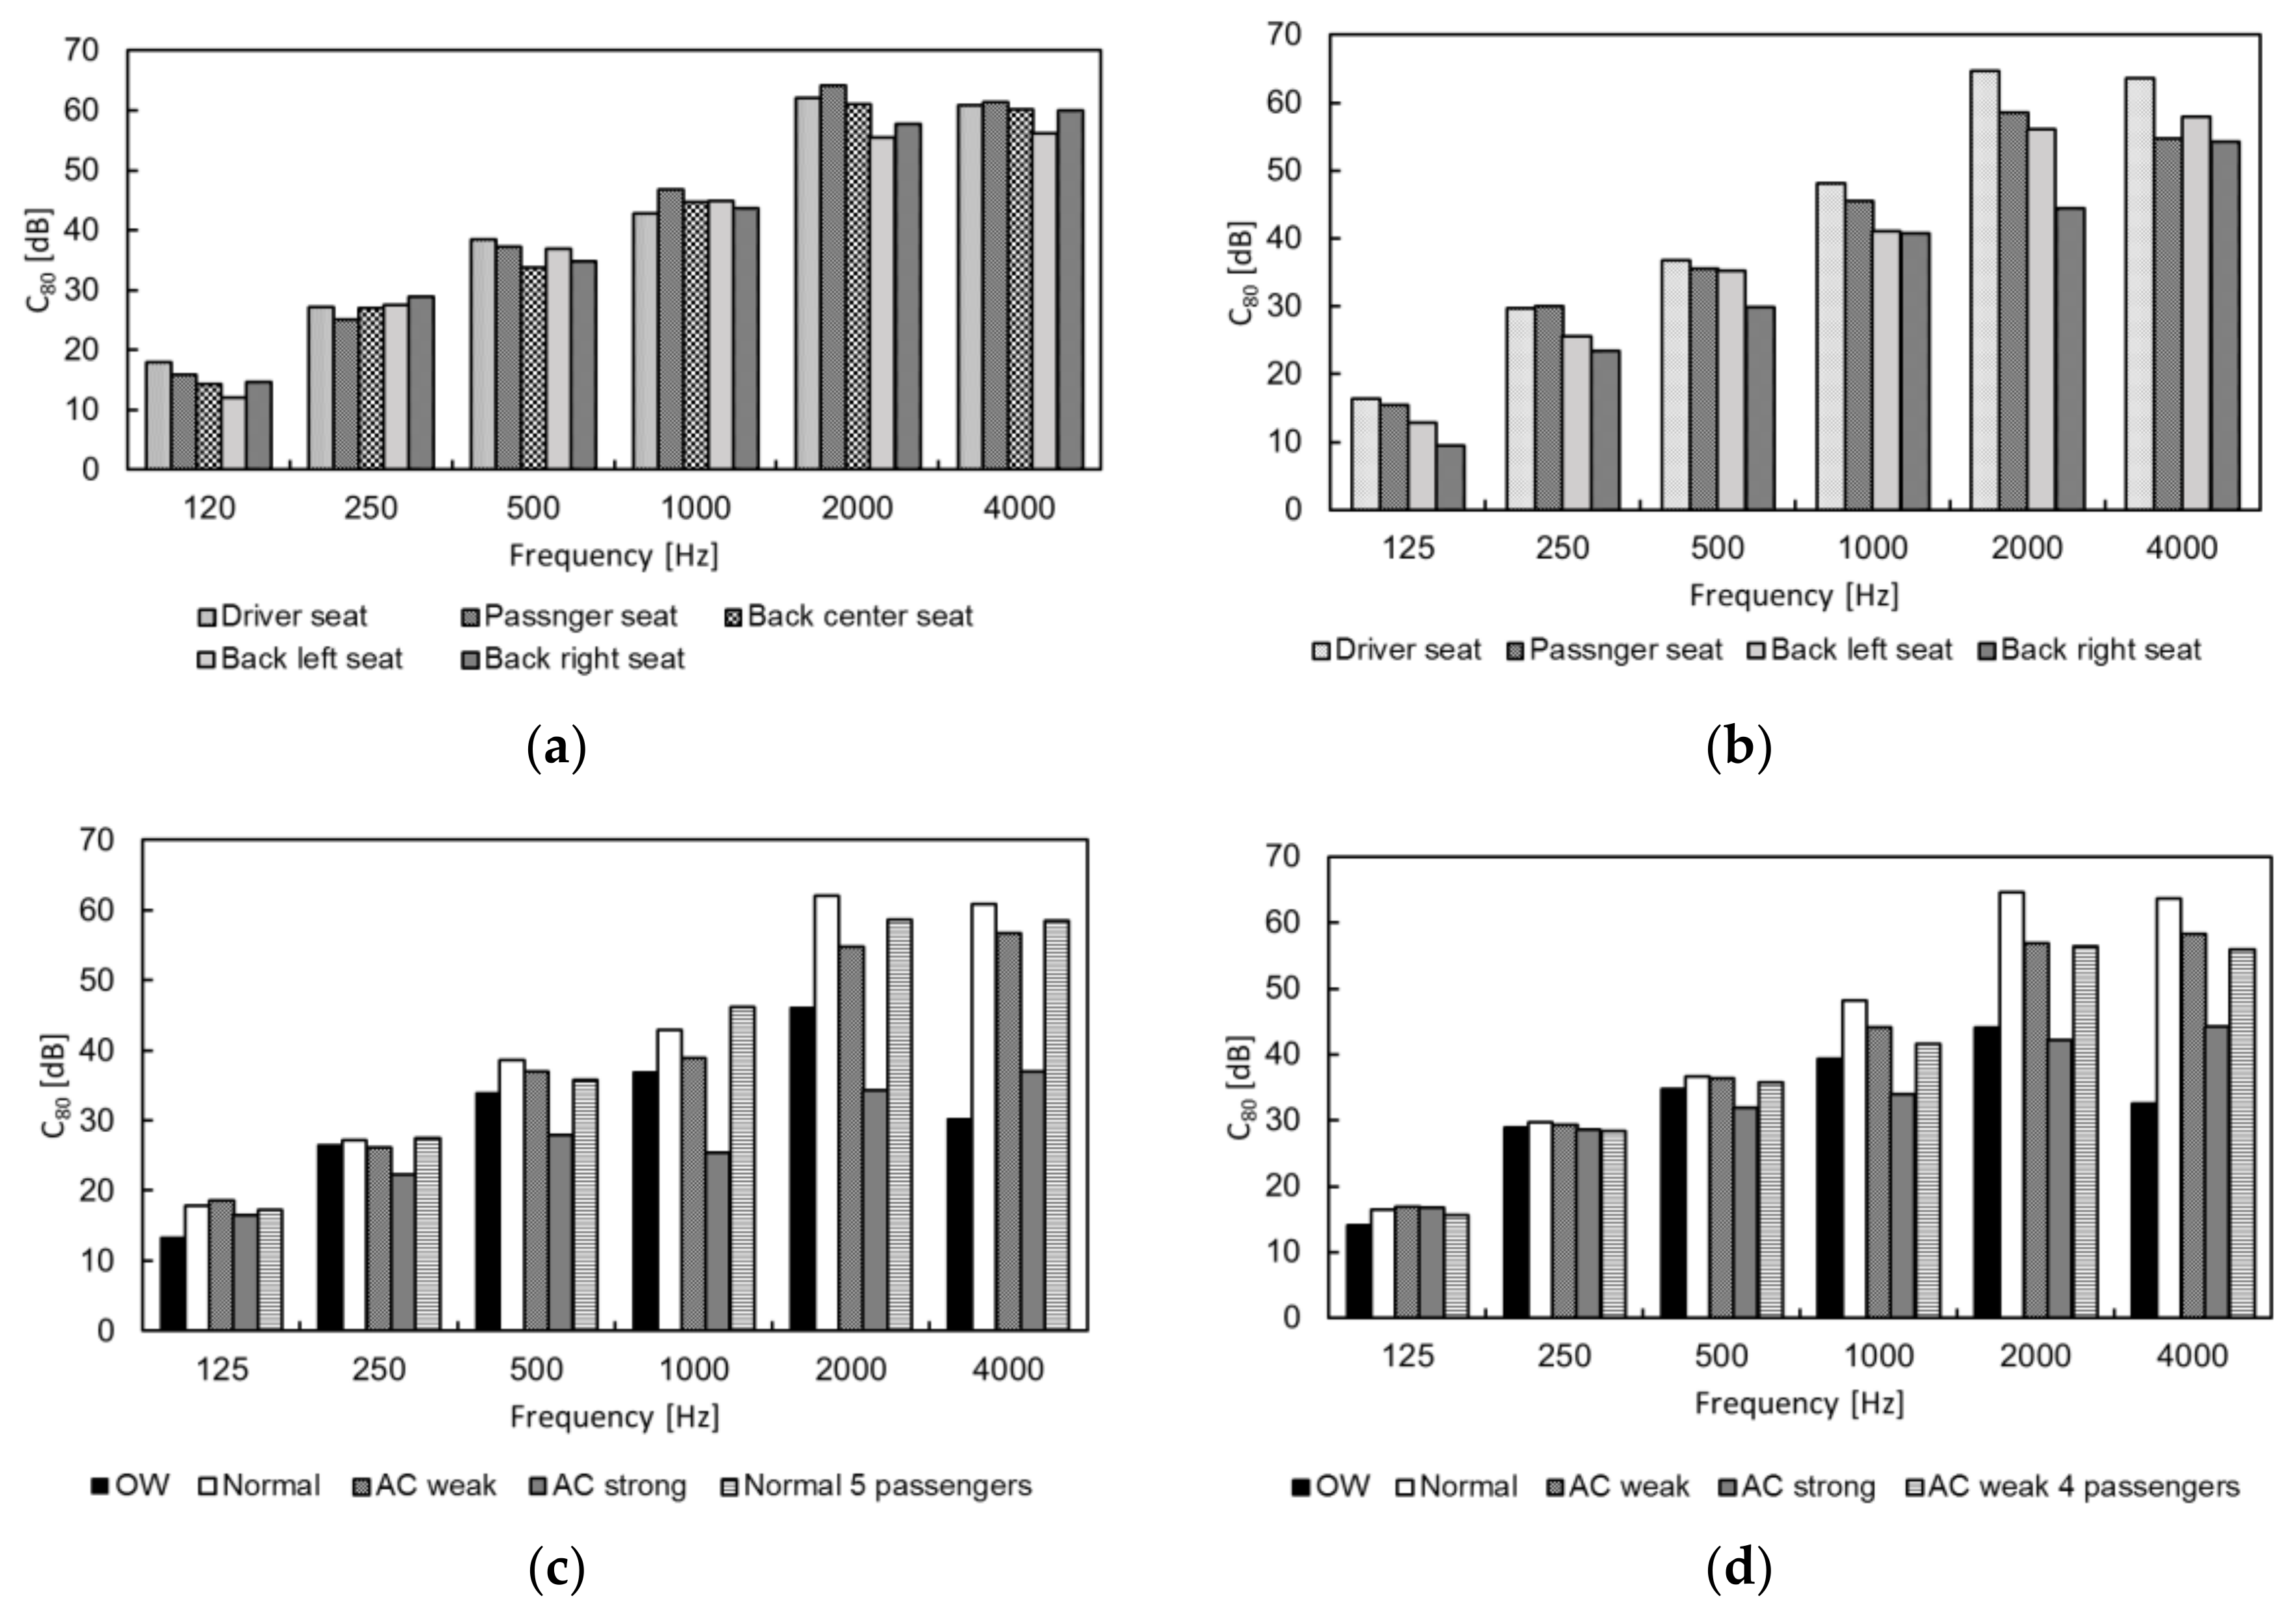
Figure 7.
Measured inter-aural cross correlation (IACC) at each passenger position in cars (a) A and (b) B and under open-window (OW) and air-conditioner (AC) settings in cars (c) A and (d) B.
Figure 7.
Measured inter-aural cross correlation (IACC) at each passenger position in cars (a) A and (b) B and under open-window (OW) and air-conditioner (AC) settings in cars (c) A and (d) B.


Table 1.
Background noise level, LAeq [dB], for each setting.
| Setting | Window Open, Air Conditioner Off | Air Conditioner Off | Air Conditioner Weak | Air Conditioner Strong |
|---|---|---|---|---|
| Car A | 59.2 | 37.2 | 46.3 | 60.6 |
| Car B | 52.6 | 40.5 | 49.2 | 60.3 |
Table 2.
Measured initial time delay gap (ITDG) [ms] for Experiment 1.
| Seat Position | Driver | Passenger | Back Center | Left | Right |
|---|---|---|---|---|---|
| Car A | 5.3 | 5.7 | 6.0 | 6.6 | 5.3 |
| Car B | 7.8 | 6.5 | 8.4 | 7.8 |
Table 3.
Measured initial time delay gap (ITDG) [ms] for Experiment 2.
| Setting | Window Open, Air Conditioner Off | Air Conditioner Off | Air Conditioner Weak | Air Conditioner Strong | Four or Five Passengers |
|---|---|---|---|---|---|
| Car A | 5.4 | 5.3 | 5.3 | 5.6 | 5.0 |
| Car B | 6.3 | 7.8 | 7.4 | 8.6 | 6.4 |
Table 4.
Measured sharpness [acum] for Experiment 1.
| Seat Position | Driver | Passenger | Back Center | Left | Right |
|---|---|---|---|---|---|
| Car A | 2.2 | 2.2 | 1.2 | 2.6 | 2.2 |
| Car B | 2.2 | 2.5 | 2.1 | 2.2 |
Table 5.
Measured sharpness [acum] for Experiment 2.
| Setting | Window Open, Air Conditioner Off | Air Conditioner Off | Air Conditioner Weak | Air Conditioner Strong | Four or Five Passengers |
|---|---|---|---|---|---|
| Car A | 3.5 | 2.2 | 2.2 | 1.9 | 2.2 |
| Car B | 3.5 | 2.2 | 2.2 | 2.0 | 2.2 |
© 2018 by the authors. Licensee MDPI, Basel, Switzerland. This article is an open access article distributed under the terms and conditions of the Creative Commons Attribution (CC BY) license (http://creativecommons.org/licenses/by/4.0/).
Share and Cite
MDPI and ACS Style
Soeta, Y.; Sakamoto, Y. An Exploratory Analysis of Sound Field Characteristics using the Impulse Response in a Car Cabin. Environments 2018, 5, 44. https://doi.org/10.3390/environments5040044
AMA Style
Soeta Y, Sakamoto Y. An Exploratory Analysis of Sound Field Characteristics using the Impulse Response in a Car Cabin. Environments. 2018; 5(4):44. https://doi.org/10.3390/environments5040044
Chicago/Turabian StyleSoeta, Yoshiharu, and Yoshisada Sakamoto. 2018. "An Exploratory Analysis of Sound Field Characteristics using the Impulse Response in a Car Cabin" Environments 5, no. 4: 44. https://doi.org/10.3390/environments5040044
Note that from the first issue of 2016, this journal uses article numbers instead of page numbers. See further details here.