Article

Combining Co-Benefits and Stakeholders Perceptions into Green Infrastructure Selection for Flood Risk Reduction

1
UNESCO-IHE, Institute for Water Education, Westvest 7, 2611 AX Delft, The Netherlands
2
School of Engineering and Technology, Asian Institute of Technology, P.O. Box 4 Klong Luang, Pathumthani 12120, Thailand
3
College of Engineering, Mathematics and Physics, University of Exeter, EX4 4QF Exeter, UK
4
Faculty of Civil Engineering, Department of Hydraulic and Environmental Engineering, University of Belgrade, Bulevar kralja Aleksandra 73, 11000 Beograd, Serbia
5
Hydro and Agro Informatics Institute (HAII), Khwaeng Thanon Phaya Thai, Khet Ratchathewi, Krung Thep Maha Nakhon, Bangkok 10400, Thailand
*
Author to whom correspondence should be addressed.
Environments 2018, 5(2), 29; https://doi.org/10.3390/environments5020029
Submission received: 12 December 2017 / Revised: 6 February 2018 / Accepted: 9 February 2018 / Published: 18 February 2018

Abstract

:
An important increase in flood risk levels is expected in future decades in many areas around the globe. In addition, the traditional approaches for flood management offer options with low sustainability. As a response, the use of non-traditional drainage measures, also called green infrastructures, has been increasingly suggested in the last years. One important reason for their increasing popularity has been the co-benefits that they offer to the environment. The development of an efficient planning for sustainable urban drainage systems is a complex process that needs the involvement of multiple stakeholders. Moreover, the measures to be adopted should be evaluated considering their potential to achieve multiple benefits related to human well-being, rather than just to flood risk management. In this work, we propose a framework for the selection of green infrastructures on the basis of a co-benefits analysis. The aim is to include the achievement of co-benefits and human well-being into decision-making for flood management, considering the stakeholders’ perceptions to define the most important benefits to be enhanced. The application of the framework presented here to a case study in Ayutthaya, Thailand, shows the importance of including different stakeholder’s opinions. In addition, it shows that decision makers should consider locally defined co-benefits as well as flood risk reduction when defining which green infrastructures to apply.

1. Introduction

In the last decades, flood management systems have been under growing pressure because of the population growth and its associated impervious surface expansion. Moreover, as a result of climate change, a higher rainfall intensity is expected in many regions around the globe. The combined effects of these two drivers and their tendency suggest an important increase in future flood risk levels [1,2]. Traditional approaches for flood management offer options with low sustainability and flexibility, which are needed to cope with an uncertain future. As a response, the use of non-traditional drainage measures, also called green infrastructure (GI), has been increasingly suggested in the last years. One important reason for GI increasing popularity has been the co-benefits that they offer to the environment [3]. These benefits include environmental and socioeconomic aspects, such as the reduction of energy and water consumption, biodiversity enhancement, and health benefits, among many others [3,4,5].
The development of an efficient planning and design framework for sustainable urban drainage systems is a complex process. This process needs an interdisciplinary approach and the involvement of multiple stakeholders, who have often conflicting interests [6]. To develop effective strategies for future scenarios, it is important to identify the best measures to be applied in each context. To accomplish this, the measures should be evaluated considering their potential to achieve multiple benefits related to human well-being, rather than just to the management of stormwater [7].
According to Lundy and Wade [8], multifunctional landscapes designed for ecosystem service (ES) provision can help to be more sustainable and more resilient to the changing future conditions. Since ecosystem services, human well-being, and the achievement of co-benefits are intrinsically related, the pursuit of multiple benefits appears as an important element when planning sustainable stormwater management systems.
Several methodologies have been developed to help green infrastructure selection for stormwater management [9,10,11,12,13]. While these works have considered co-benefits when selecting measures, the definition of the main co-benefits is not based on stakeholders’ preferences. Meerow and Newell [14] performed a stakeholders survey to prioritize benefits for different landscapes and locate where these benefits were needed. Schifman et al. [15] developed a framework to integrate networks of organizations into GI projects to achieve multiple benefits. This work is centred on the combination of inputs from organizations to reach collaborative decision-making. Other works compared different solutions using more complex analyses [16,17]. Considering co-benefits and stakeholders’ perceptions appears to be effective in performing a preselection of measures before applying more complex methods, enhancing their effectiveness.
In this work, we propose a framework for the evaluation and selection of green infrastructures based on co-benefits analysis. The aim is to include the achievement of co-benefits and human well-being into the decision-making processes related to flood management, considering both local aspects and stakeholders preferences when defining the most important benefits to be enhanced. We focus on the identification of key benefits through stakeholders’ perceptions analysis as a central aspect to select flood risk reduction strategies.

2. Linking Green Infrastructure, Co-Benefits, Ecosystem Services, and Human Well-Being

It has been proved that GI are effective in reducing flood risk [18,19,20]. The traditional approach for GI selection is based on runoff reduction assessment, cost minimisation, and suitability. However, more and more decision makers are expected to consider other factors when choosing flood management strategies. For instance, GI offer different co-benefits which contribute to cope with other problems of urban environments besides flood risk [3], helping to improve the quality of life of the citizens. Examples of these problems are air pollution and heat stress.
Moreover, GI impact positively on the health of ecosystems through the provision of ecosystem functions and services, which offer the environmental conditions needed to improve human well-being. Different components of human well-being are physical, psychological, social, and community benefits [21]. In summary, ES and co-benefits are provided by GI promoting healthy environments, and contribute to environmental, social, and economic benefits to people in contact with them (Figure 1).
Ecosystem services are seen here as necessary services to achieve ecosystem health and human well-being, and they can be provided by natural or constructed environments (GI in the latter case). Co-benefits are seen as the benefits that can be achieved by applying constructed GI. Consequently, ES are seen here as a much broader and general concept than co-benefits. For instance, wetlands and green areas (natural or built) will contribute to the regulation and maintenance of biota and ecosystems mediation (Table 1). Meanwhile, the construction of urban wetlands and green spaces offer the co-benefits of air and water pollution abatement, besides flood risk reduction.

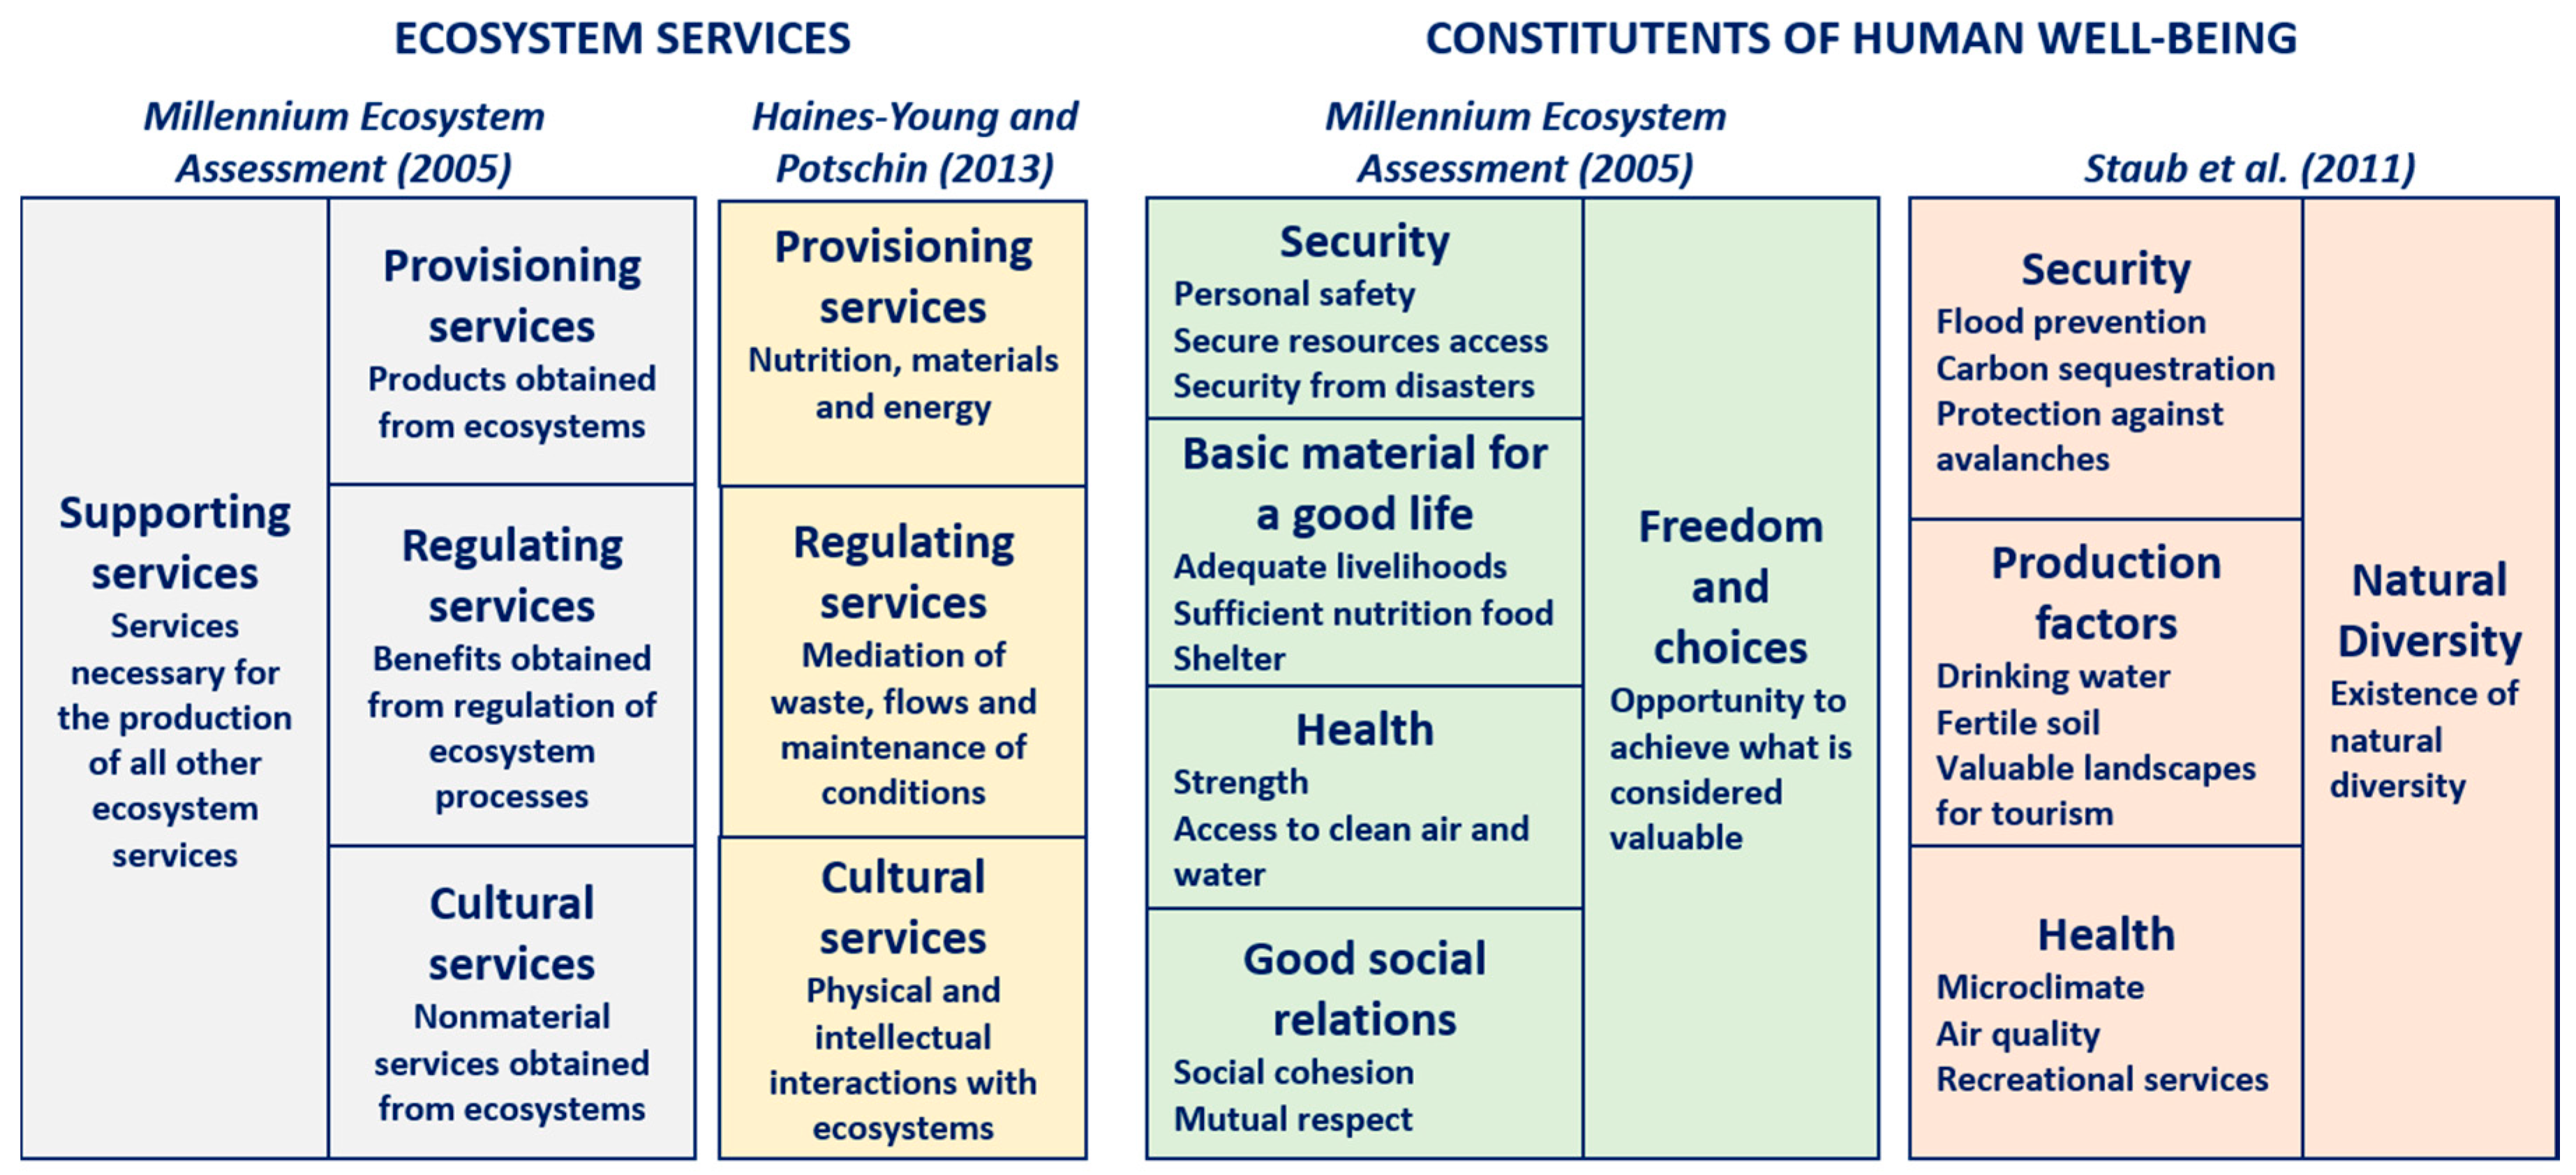
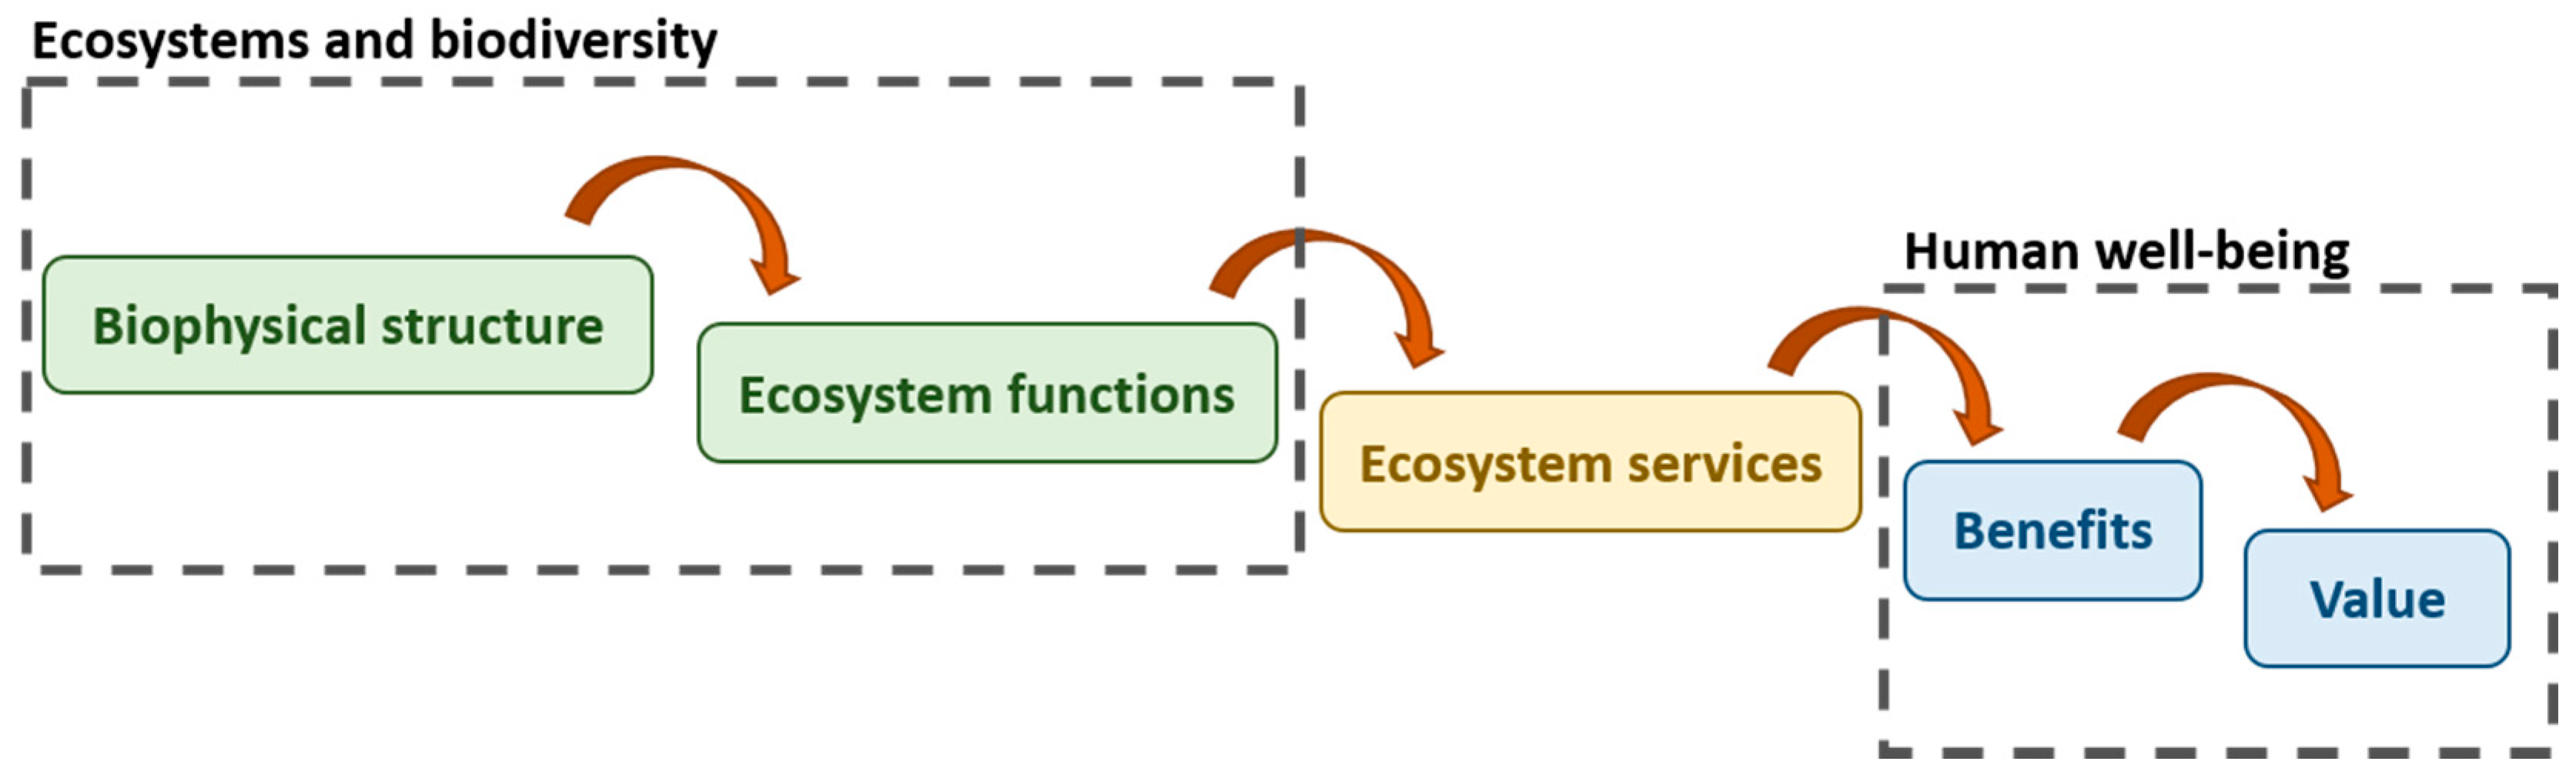
2.1. Ecosystem Services and Human Well-Being

The enhancement of co-benefits is intrinsically related to the achievement of human well-being. Meanwhile, the achievement of human well-being is closely connected with the provision of ecosystem services (ES), which are defined as the benefits that people obtain from ecosystems (see [23,24,25]).
One of the first frameworks for the evaluation of ES was proposed by de Groot [26], where ES were grouped in four categories: regulation, habitat, production, and information. This framework was later used by the Millennium Ecosystem Assessment [23] as the basis for its classification in provisioning, regulating, cultural, and supporting services. In this classification, supporting services are considered as necessary to produce all other services, having an indirect impact over people.
The Millennium Ecosystem Assessment framework for the assessment and integration of services, goods, and benefits produced by ecosystems continues to have a significant impact [8]. However, Haines-Young and Potschin [25] applied the typology of ES suggested by Millennium Ecosystem Assessment framework to develop a more explicitly hierarchical structure. The authors considered the same three categories used by Millennium Ecosystem Assessment: provisioning, regulating, and cultural services, though supporting services are not considered to avoid double counting.
The importance of describing and classifying ES is founded on the close connection between this concept and human well-being, since the enhancement of ES is the basis to achieve human well-being. The components of human well-being have been classified in three groups: security, basic materials and production factors, and health and good social relations and health [23,27] (see Appendix A, Figure A1).
Haines-Young and Potschin [22] developed an approach linking ES, ecosystem functions, human well-being, and related benefits. In this scheme, ES are generated by ecosystem functions, which are based on biophysical structures (the services considered as supporting in the Millennium Ecosystem Assessment framework). Afterwards, the effect of ES on the sociocultural context is achieved through the impact on human well-being by the release of benefits and their associated values (see Appendix A, Figure A2).

2.2. Ecosystem Services and Green Infrastructure

According to Tzoulas et al. [21], green infrastructure includes all natural, seminatural, and artificial networks of ecological systems at all spatial scales, which have important multifunctional and habitat interconnection roles, contributing to biological diversity conservation and maintaining the integrity of habitats. Consequently, these infrastructures have an impact on human health and well-being by improving the health of ecosystems. Since different GI affect different ecosystem services, it is important to understand the linkage between them to understand the impact that GI application would have on ES and well-being (Table 1).
Conforming to Lovell and Taylor [31], the development of multifunctional GI which integrate the achievement of different ES is essential to obtain resilient cities in front of future challenges, such as climate change. The implementation of multifunctional GI helps the development of adaptive strategies to cope with unknown future conditions. Furthermore, it is crucial to reach a holistic urban planning process, involving different stakeholders’ groups into the decision-making stage.

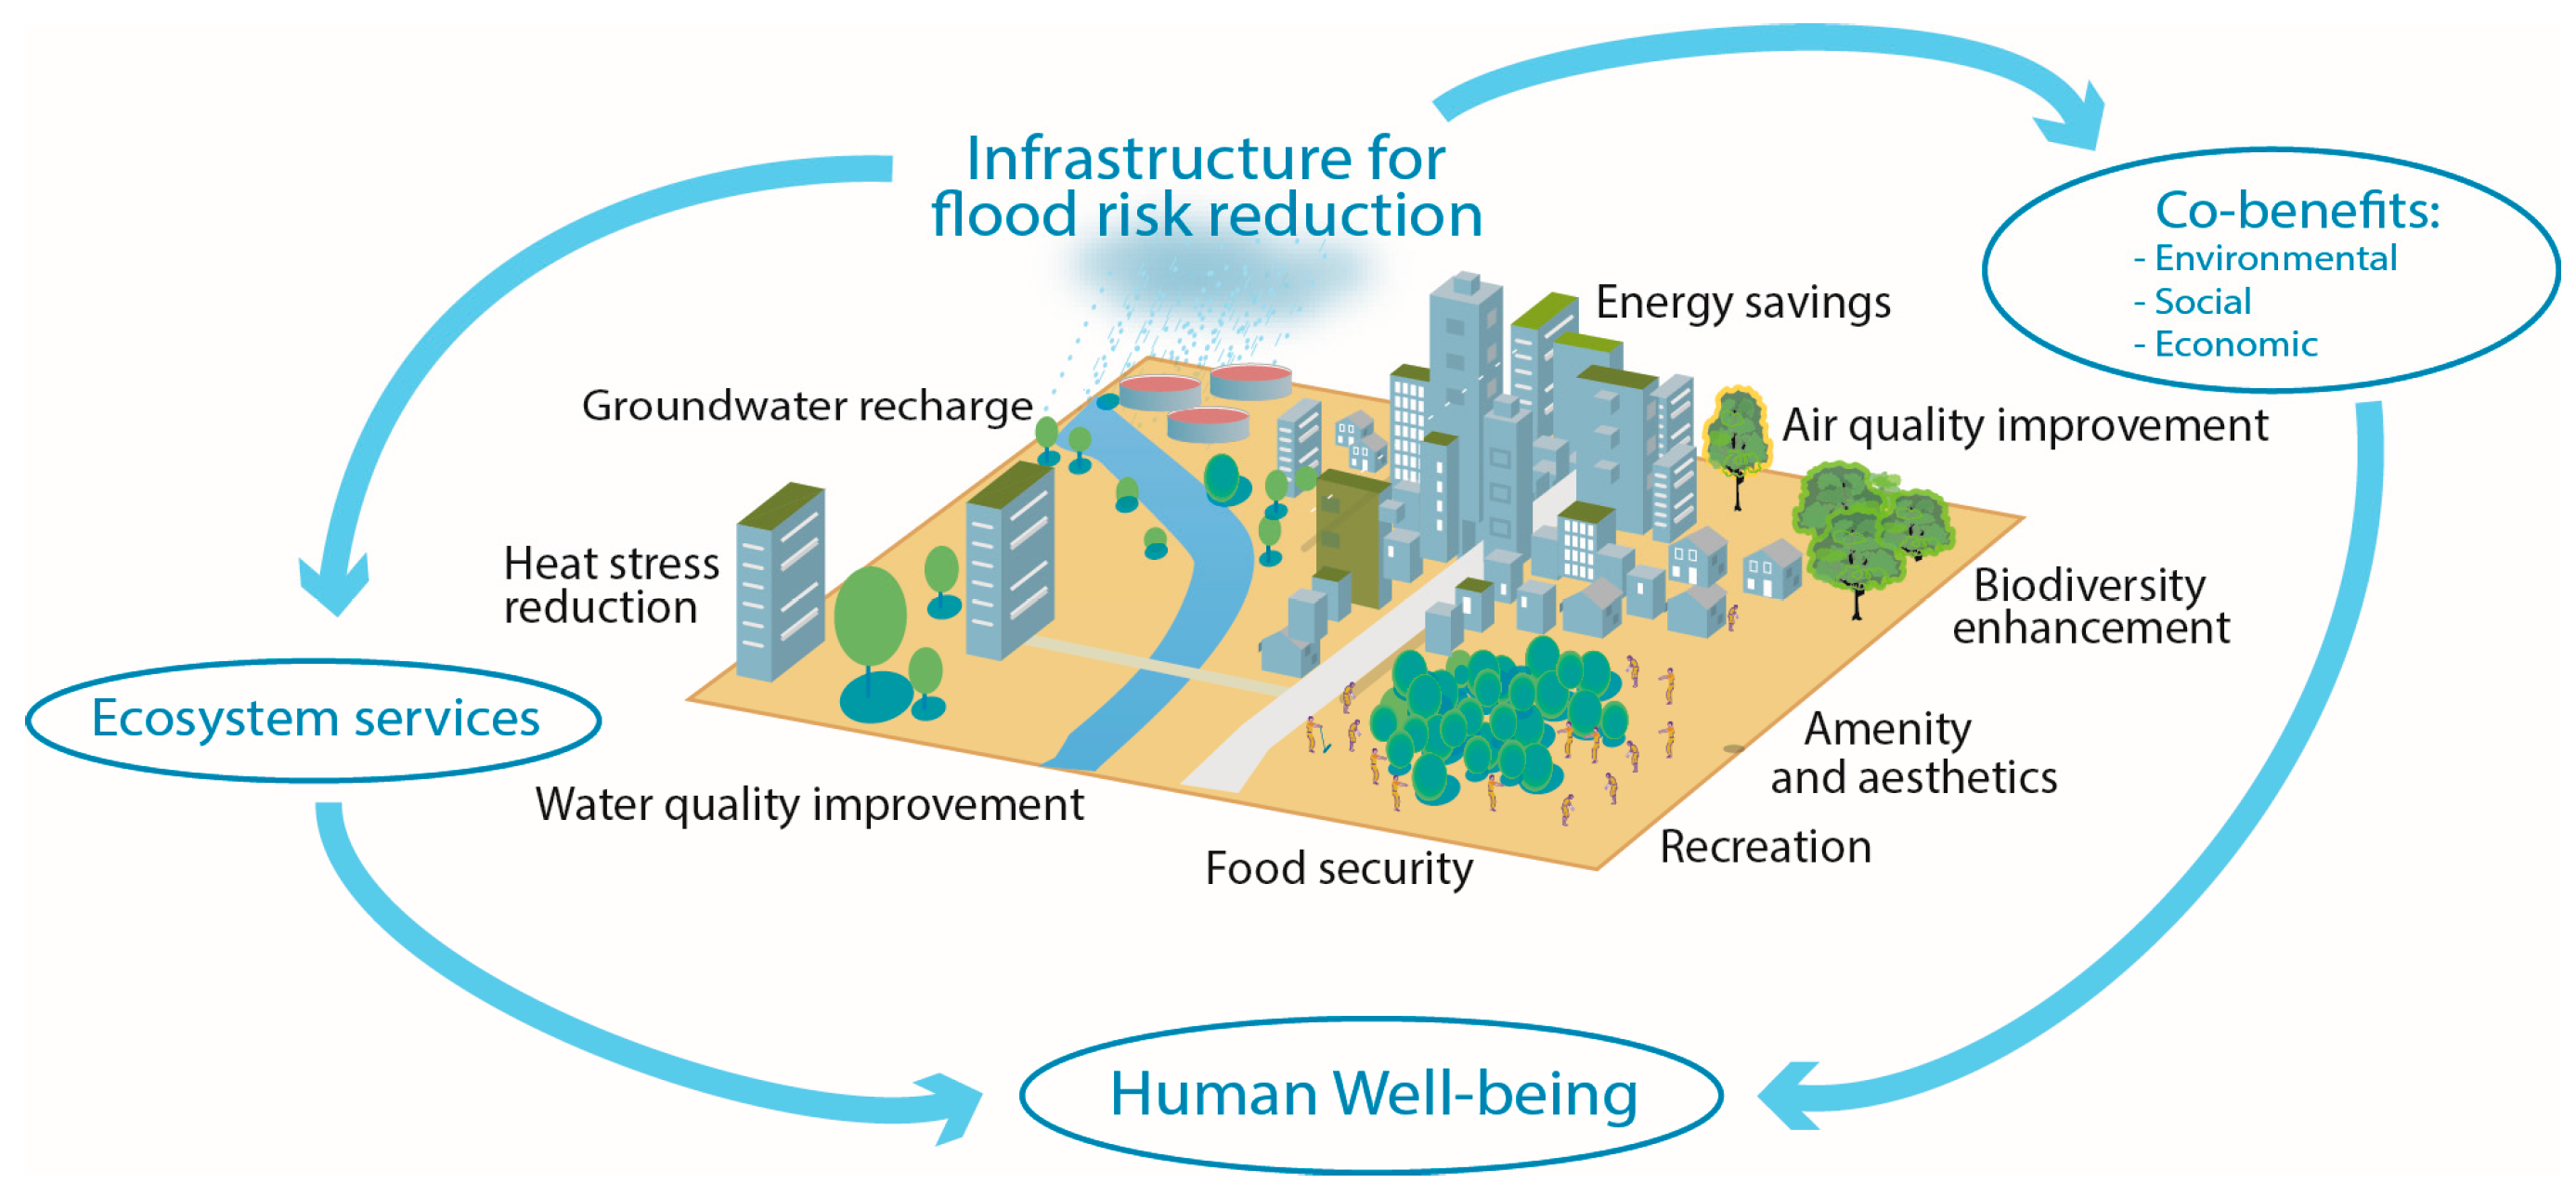
2.3. Green Infrastructure and Co-Benefits

Co-benefits are seen here as the benefits that can be obtained from applying GI, besides flood management. Several co-benefits can be achieved through green infrastructure implementation. Next, we will present some of these co-benefits and examples of green measures that are capable to deliver them.
  • Water quality of the receiving bodies: stormwater runoff carries pollutants to the receiving waters. GI, such as bio-swales and pervious pavements, use vegetation and soil to filtrate this runoff [29,30].
  • Groundwater recharge: GI that allow infiltration provide groundwater recharge, which is important where groundwater levels are reduced because of over abstraction or dry conditions [30].
  • Biodiversity and ecology enhancement: the vegetation provides a habitat for many animals. Large-scale green infrastructures, such as parks and wetlands, help wildlife restoration [5,28,30].
  • Heat stress reduction: green areas and water spots, such as lakes, rivers, and fountains, moderate the temperatures and help to mitigate the urban heat stress effect [5,32].
  • Air quality improvement: trees and green areas produce oxygen and help to filter harmful air pollutants [5,32].
  • Amenity and aesthetics: vegetation, water, and wildlife give more natural and beautiful environments where people feel more comfortable [5,32].
  • Recreation: green spaces are important for human recreation in open spaces. Having access to green spaces reduces health issues and improves well-being [32].
  • Health: WHO [32] recommends at least 10 m2 of green spaces per inhabitant in urban areas. Physical activity in natural environments helps to reduce mental health issues.
  • Food security: the creation of urban farming spaces in green areas and green roofs is considered a strategy to improve food security in the cities [5].
  • Rainwater harvesting: water collected through rainwater barrels can be used for outdoor irrigation, reducing significantly the use of potable water [30].
  • Pumping and treatment reduction: by reducing the runoff, the amount of water to combined drainage networks is reduced, decreasing the pumping and wastewater treatment costs [30].
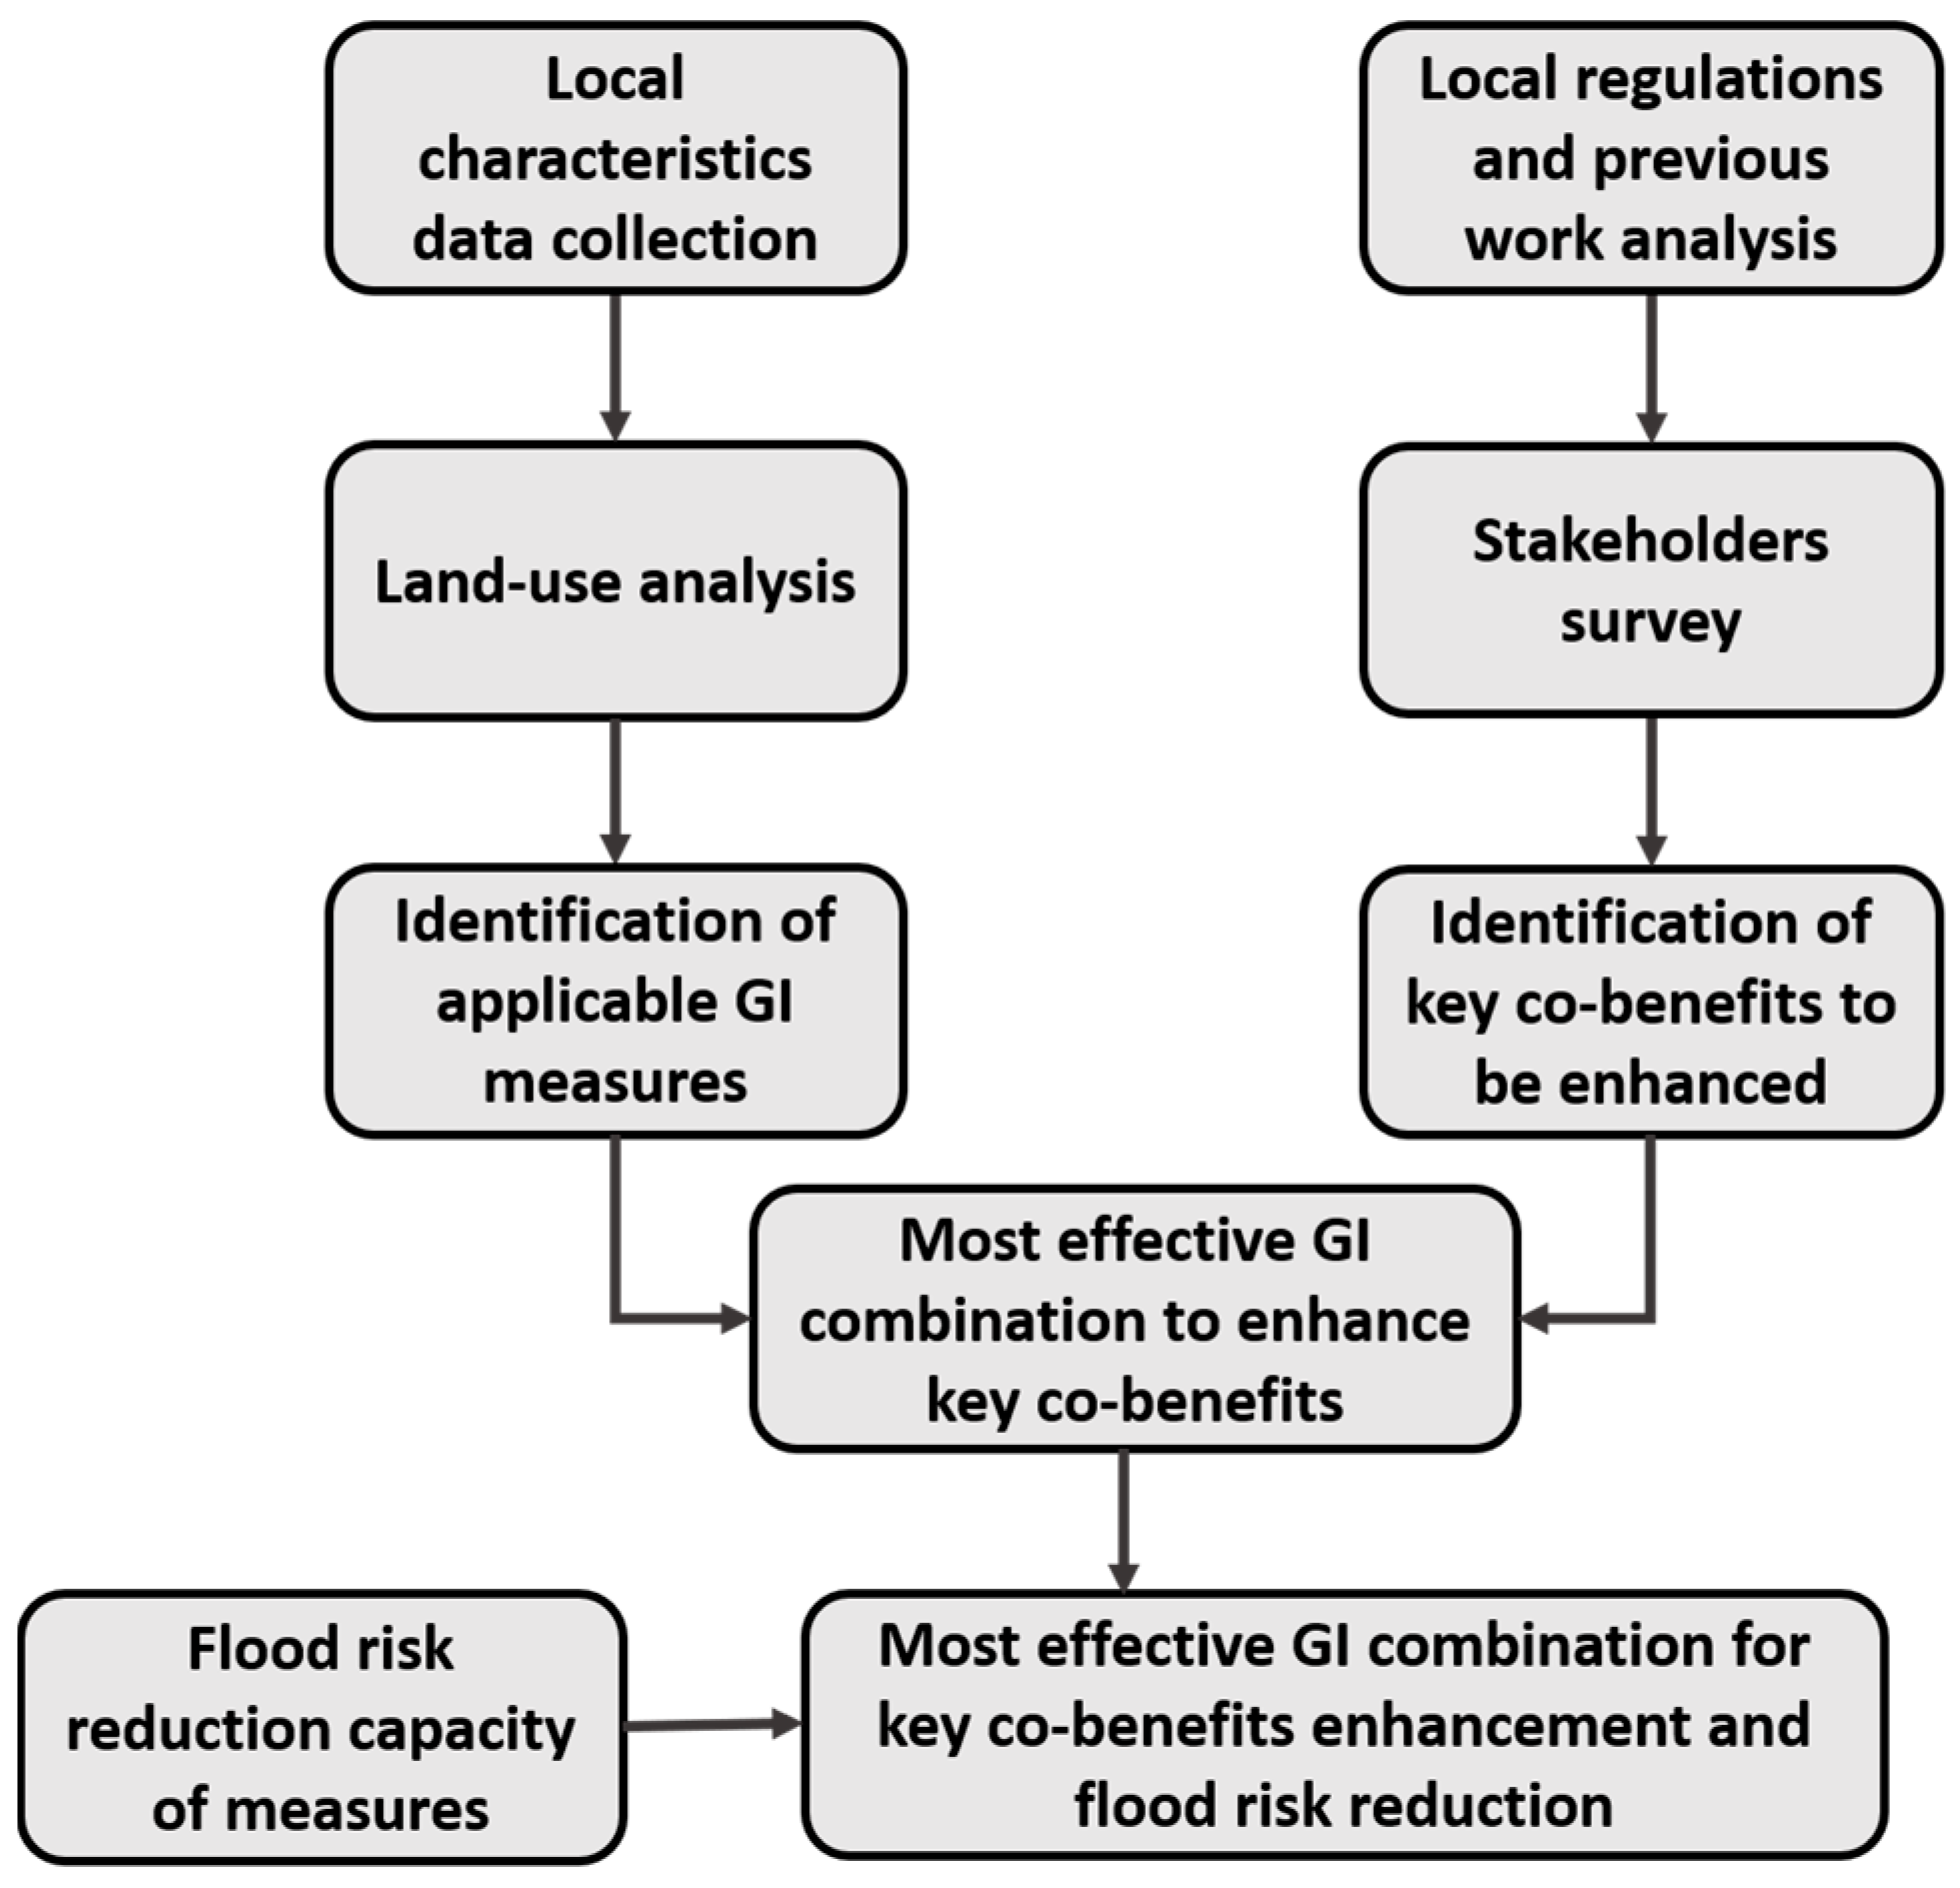
  • Saving energy in buildings: some technologies like green roofs or vertical gardens in buildings work as temperature isolation layers, reducing the necessity of cooling and heating [5,33].
  • Real estate value appreciation: increasing the vegetation and trees cover increases property values in an area, benefiting both developers and homeowners [26,34].

3. Methodology

The objective of the framework presented here is the selection of GI combinations according to local conditions and preferences expressed by stakeholders. This is achieved following several steps, some of them focused on local physical conditions and other based on local preferences (Figure 2).
The first step consists in finding and analysing relevant information about the local characteristics and current situation of the area under study. The output of this step is an inventory with the amount and type of potential sites for the application of GI measures, reached through land use analysis. The main objective is to assess the feasibility of the potential GI applicability in the area, according to local land use. This analysis is particularly relevant for areas that are starting to develop plans using GI measures. Through this analysis, the local potential for GI measures usage can be determined.
The second step is to identify the most important benefits to be enhanced in the study area according to the local needs and stakeholders’ preferences. The importance of this step lies on the complexity of the decision-making processes resulting from the variety of the stakeholders’ points of view. While there is no agreed method for estimating the benefits of GI, it is recommended to perform this process from a large-scale to a site-specific perspective [3,35]. In order to achieve this, two stages are needed. Firstly, attention is paid to the local regulations and previous studies developed in the area under study. Secondly, the analysis is focused on the local stakeholders to confirm or correct the information found in the previous steps [36].
The expected result is the identification of the measures that are applicable and that represent the main concerns in terms of social, environmental, and economic aspects in the area. From this analysis, a list of preferred measures to enhance key co-benefits for each land use type is obtained. As a final step, the capacity of different GI measures to reduce flood risk is considered before defining the final strategy of GI measures combination for the area under study.

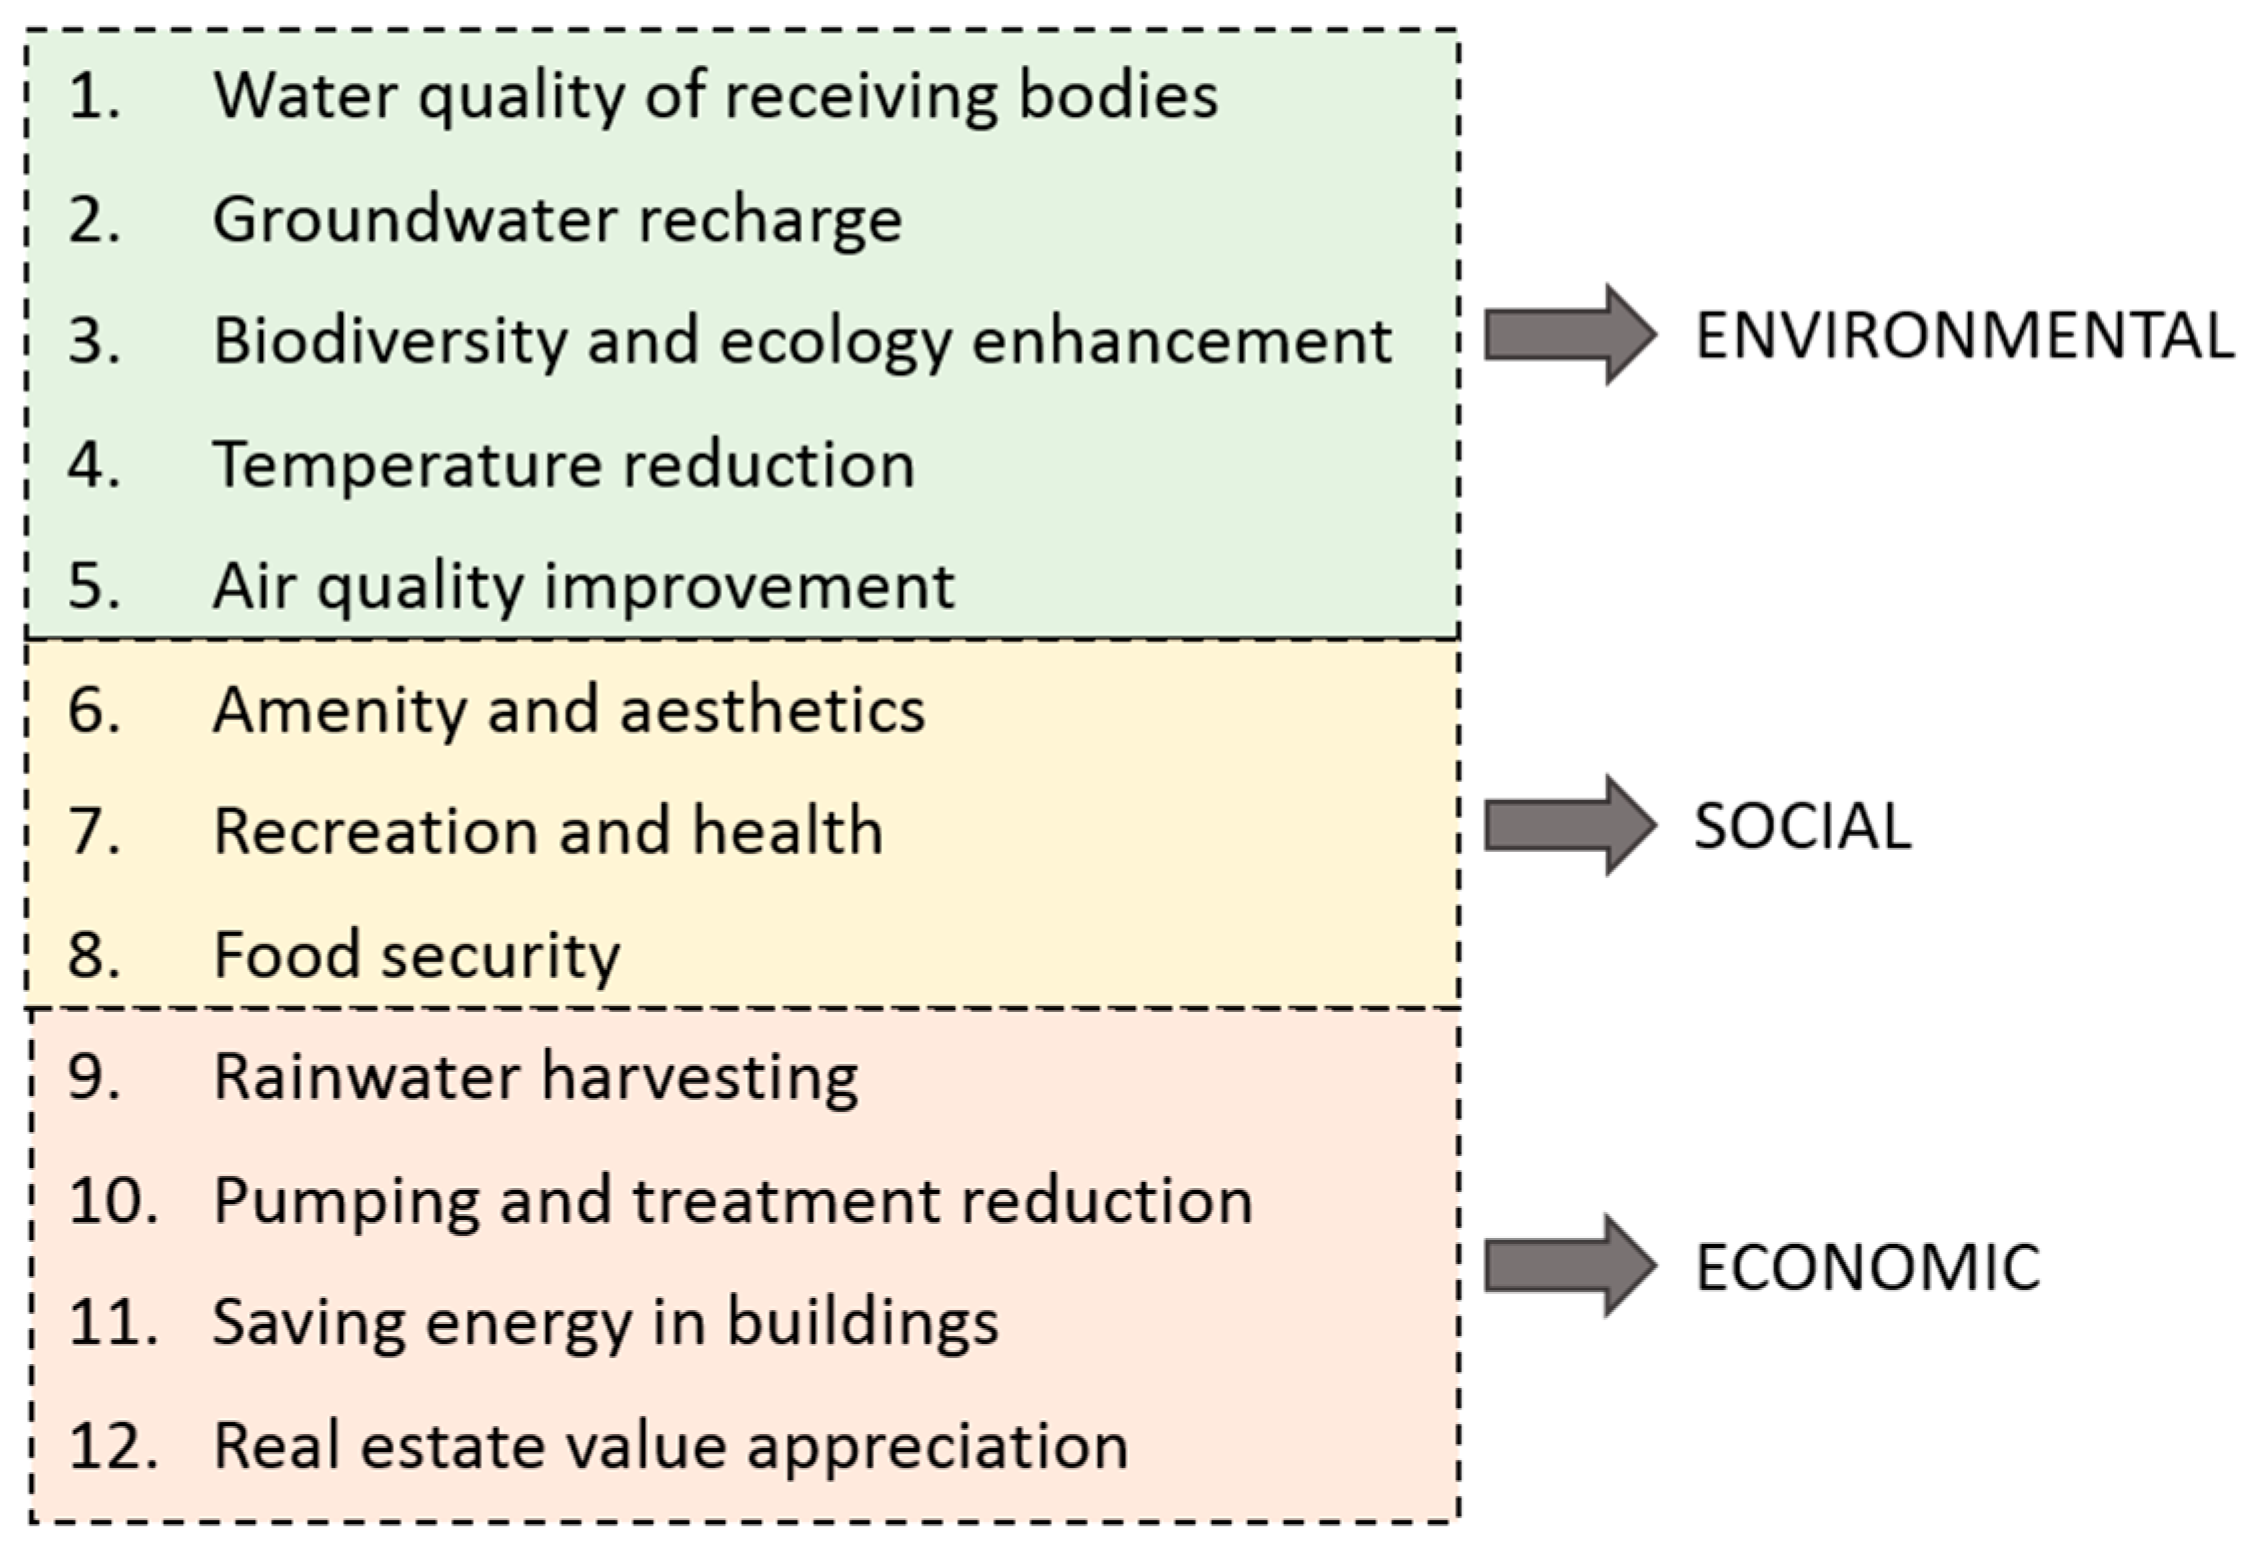
3.1. Co-Benefits Classification

With the objective of making clearer the analysis and help stakeholders' understanding, the co-benefits presented in Section 2.3 are divided in three groups for the analysis of perceptions. These groups represent three sustainability dimensions: environmental, social, and economic benefits (Figure 3).
Among the environmental benefits of GI are water quality improvement of receiving water bodies, infiltration to recharge aquifers, heat stress or temperature reduction, creation of better places for nature, enhancement of biodiversity, and air quality improvement [28,32].
GI measures improve life quality by making the living environments more vibrant and visually attractive and by delivering recreation and education opportunities [28]. Furthermore, urban parks and gardens provide sites for physical activity, social interaction, and recreation [32]. Consequently, amenity and aesthetics, recreation and health, and food security are considered as social benefits.
The use of green infrastructure brings economic benefits by storing water for reuse or reducing energy consumption for cooling or heating buildings, while aesthetics and amenity enhancement add value to the surrounding buildings [5,30]. Besides, reducing the runoff flow going into the pipe systems reduces pumping and wastewater treatment costs [30]. These four benefits are considered as economic co-benefits.

3.2. Establishing Indicators to Assess the Co-Benefits

In this section, we present indicators as numerical descriptors which represent the capacity of different GI to provide the co-benefits introduced in Section 2.3. These indicators were estimated using different sources of literature [3,5,12,28,29,37,38,39]. For instance, pervious pavements have a good performance in improving water quality and a medium performance in groundwater recharge [5]. Woods-Ballard et al. [28] affirmed that infiltration trenches have medium to low amenity potentiality. Jia et al. [12] declared that rain barrels have high performance in providing the benefit of rainwater reuse, while bio-retention areas are a good option to enhance ecological and aesthetic benefits.
In this work, the information from these sources was combined to develop numerical descriptors which estimate the level of impact of each measure in improving each co-benefit (Table 2a–c). Defining these indicators is necessary in order to develop a ranking of GI. This ranking will aid the decision makers to choose among options.
Here, we introduce the indicators for the measures that are going to be used in the case study later presented. Some GI are rather similar but were differentiated in this case to consider different application possibilities. For instance, bio-retention areas and rain gardens are seen as a bigger and smaller scale of the same measure. While bio-retention areas can be applied in parks and other large green areas, rain gardens are more suitable for parking lots and transport corridors. Similarly, extensive and intensive green roofs could be grouped as only green roofs, but both give different co-benefits, and their applicability depends on roof characteristics, among other factors [28].

4. Study Area

Ayutthaya is located about 80 km north of Bangkok, the capital city of Thailand. It is an island of 7 km2, surrounded by three rivers: Chao Phraya River, Pasak River, and Lop Buri River.
The city includes a World Heritage Site (WHS) area, selected by UNESCO because of the importance of its historic and cultural sites. This WHS area covers around 289 ha. The remaining areas are used for residential, educational, commercial, and government facilities.
The island has soils composed of clay and sand. Because of groundwater resources overexploitation, aquifers and the overlying clay layer are under significant stress, leading to land subsidence in the region [40]. Bangkok exhibits the most critical situation, but the study area is only 80 km away and has also faced this issue. Other studies describe that the WHS area has been also affected by this issue, putting under risk the cultural and architectural value of this area [41,42].
The area is under high flood risk, caused by high water levels of the surrounding rivers and, directly, by heavy rainfalls. Moreover, relatively low ground levels, at approximately 4 m Above Mean Sea Level (AMSL), contribute to the high risk of inundation [41].
The current flood protection system of the island is formed by dykes at 5.3 m AMSL to prevent fluvial floods. However, even under this protection, the city suffered from severe fluvial floods in 1995 and 2011. Additionally, because of the vicinity of the estuary and the Bay of Thailand, storm surges cause increased water levels in the area, resulting from the impediment of the discharges throughout the outfall [42]. Furthermore, climate change is expected to contribute to the increment of flood risk in the area, as a consequence of a higher number and increased intensity of tropical rains [43].
The main drainage network inside the island consists of canals and combined drainage systems, which drain combine waste and storm water to pumping stations. GI measures are proposed to improve stormwater management in the area, reducing the quantity of runoff conveyed by the drainage system. The measures considered were selected on the basis of the local characteristics and of a feasibility analysis.

5. Results and Discussion

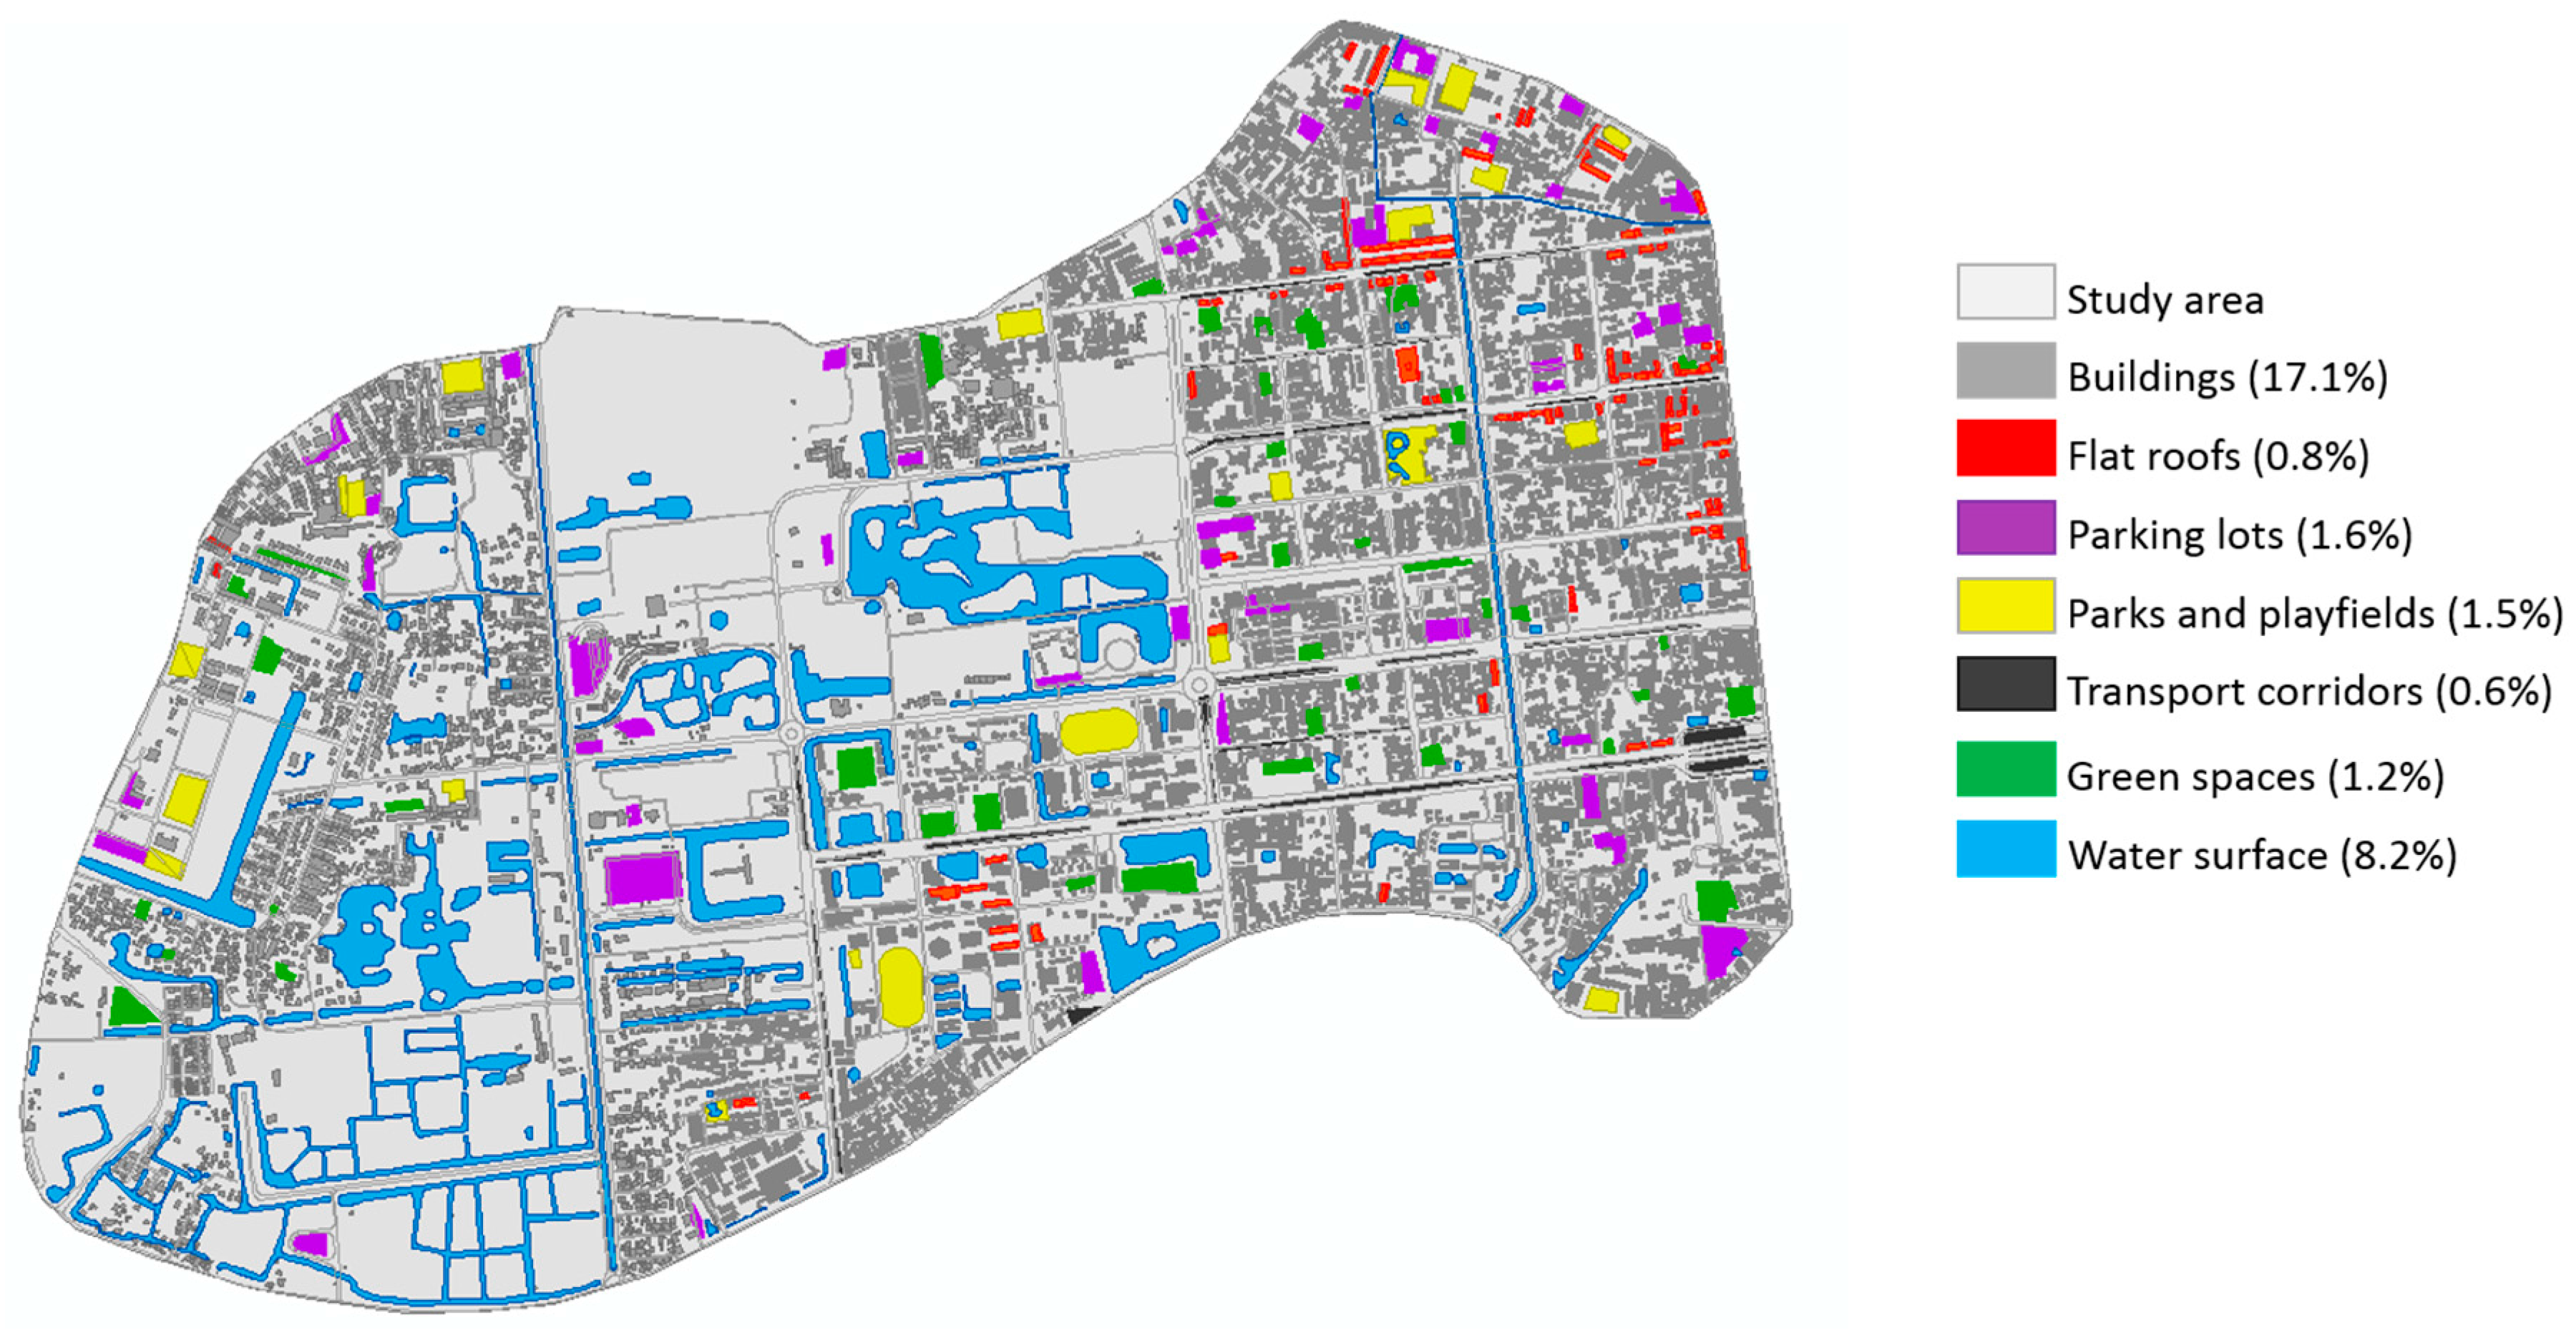
5.1. Land Use Analysis and Applicable GI Measures

The land use analysis has been performed using previous works in the area [36,41], satellite image analysis, and visits to the area. About half of the island is conserved as a World Heritage Site. The other half of the island is mostly covered by a low-density residential zone, with some medium- and high-density residential zones, while education and government areas are dispersed.
An inventory of potential location sites was developed with the objective of analysing the implementation possibilities for green measures. Potential sites to place GI are defined according to land use in the island, covering a maximum of 30% of the total case-study area. These potential sites are well distributed over the total area (Figure 4). Through a suitability analysis, it was defined which measures can be applied in each site type [28,29] (Table 3).

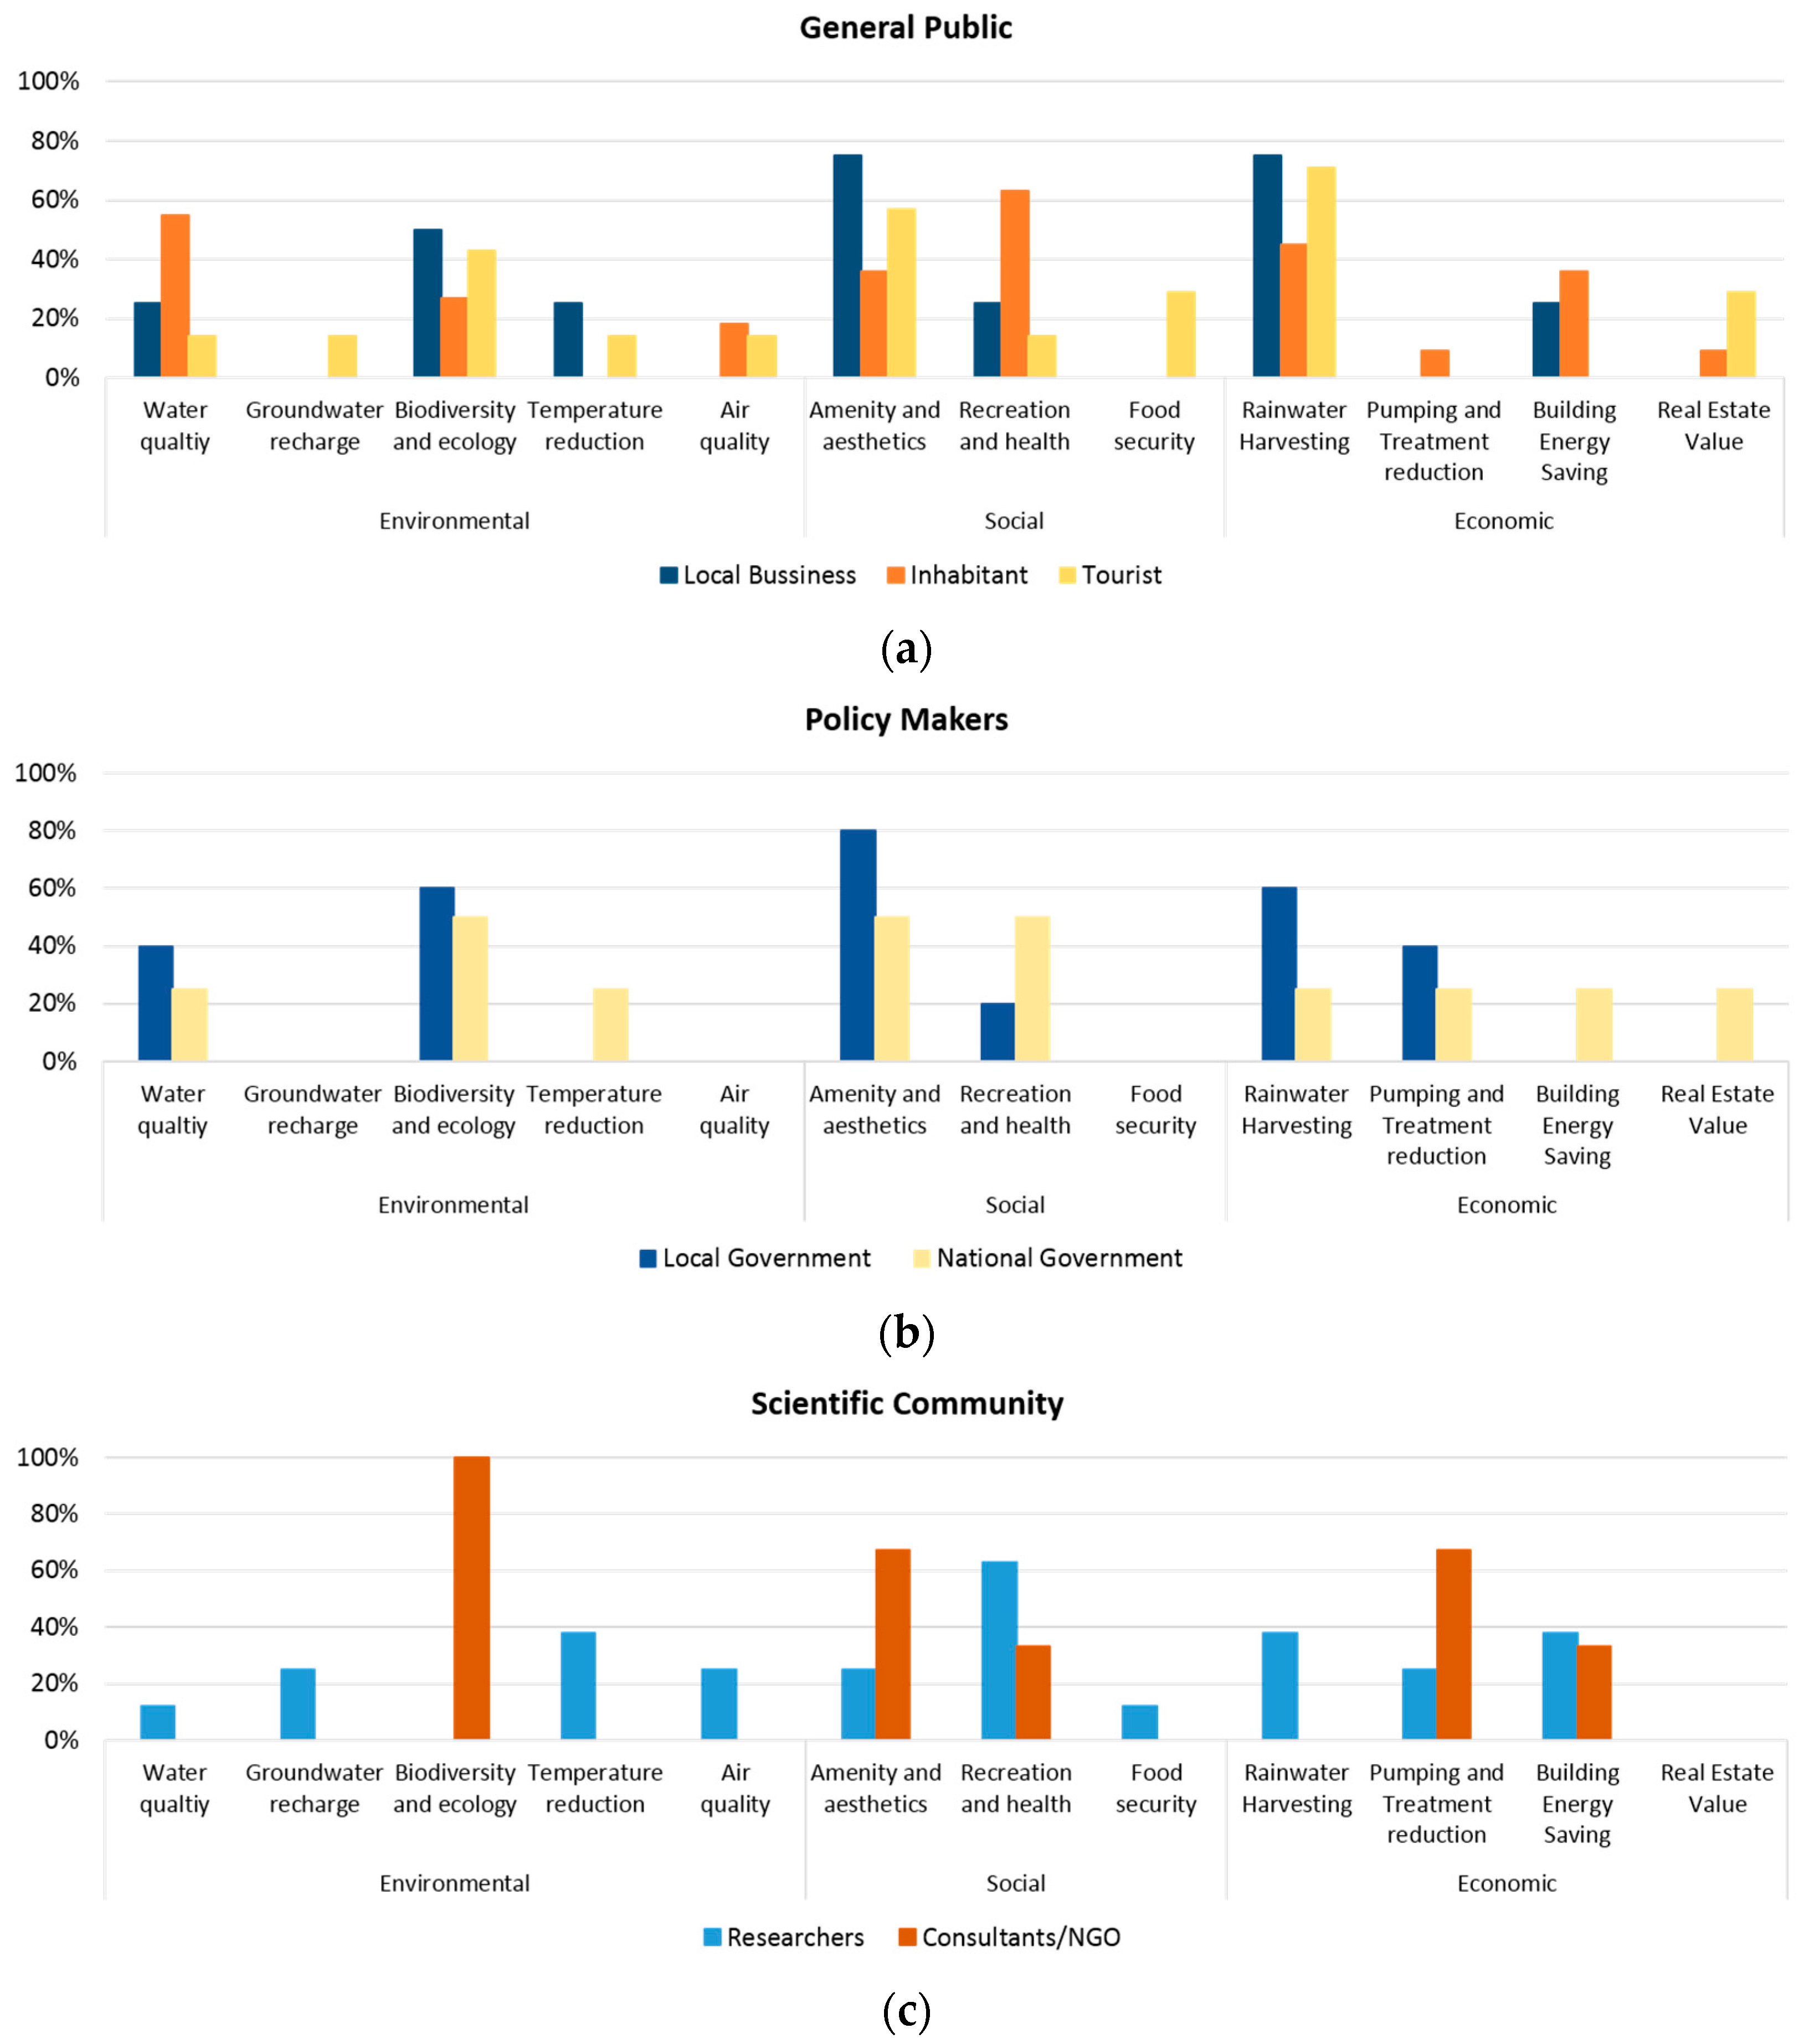
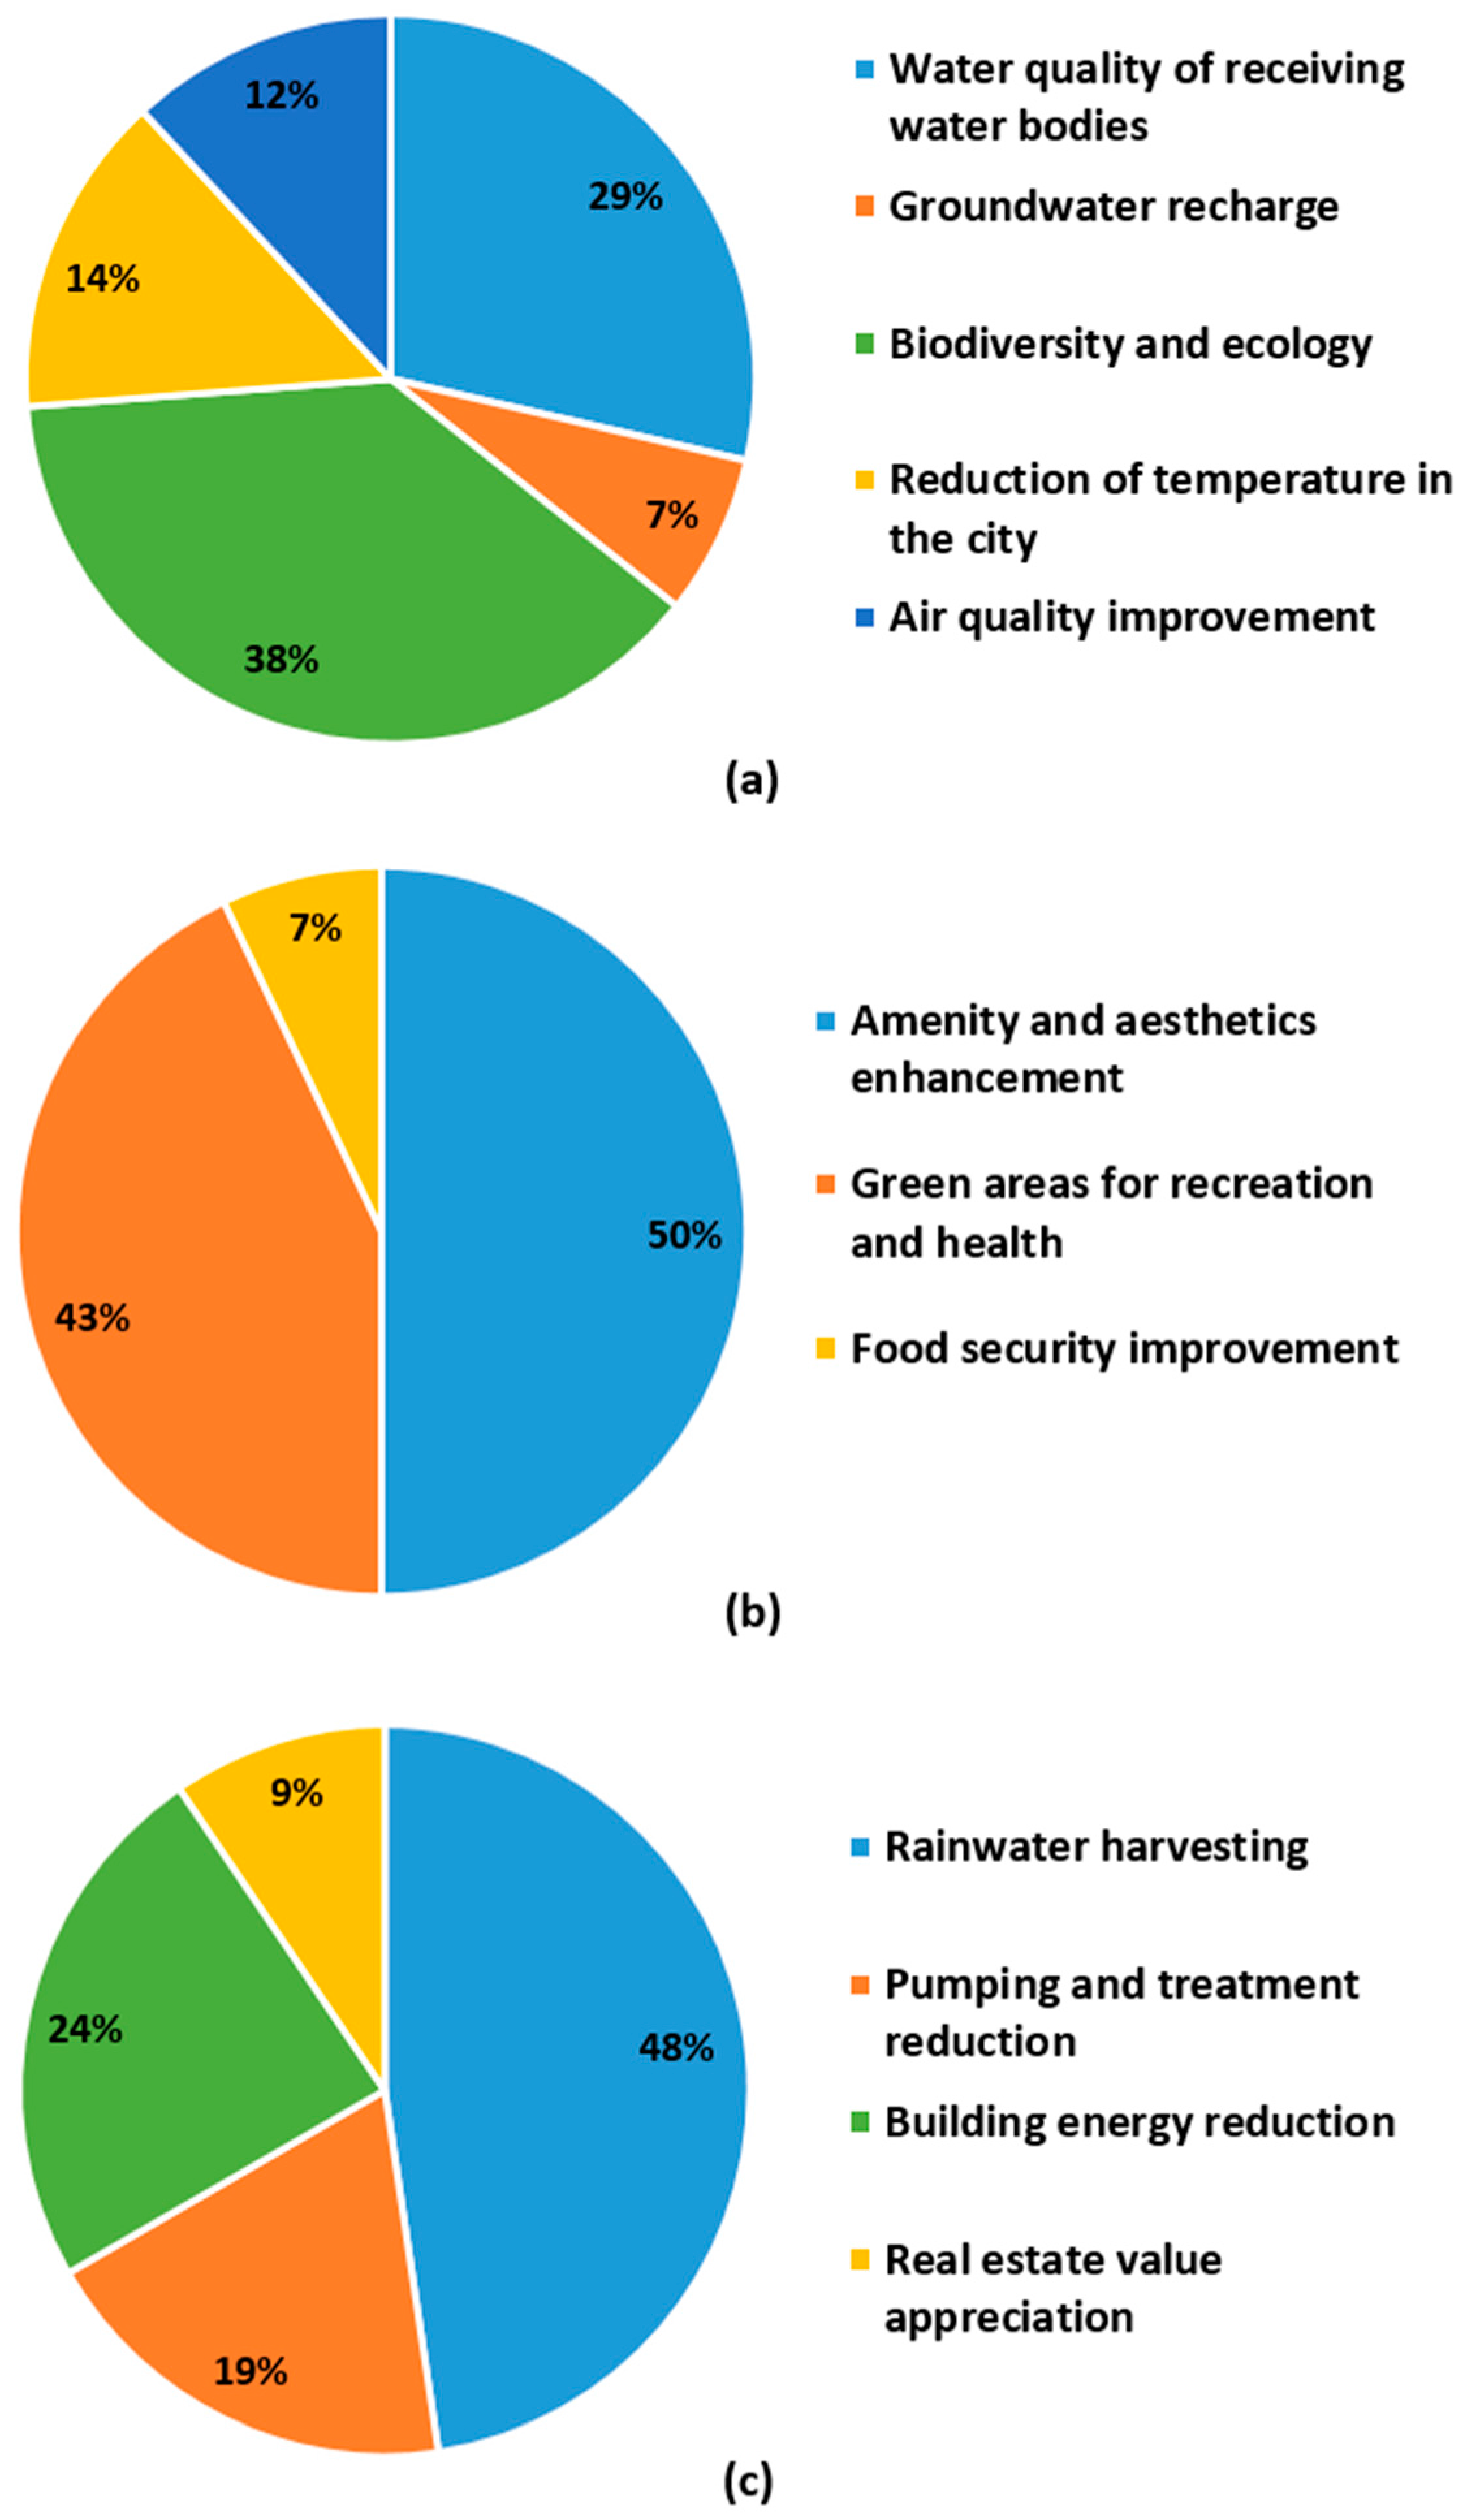
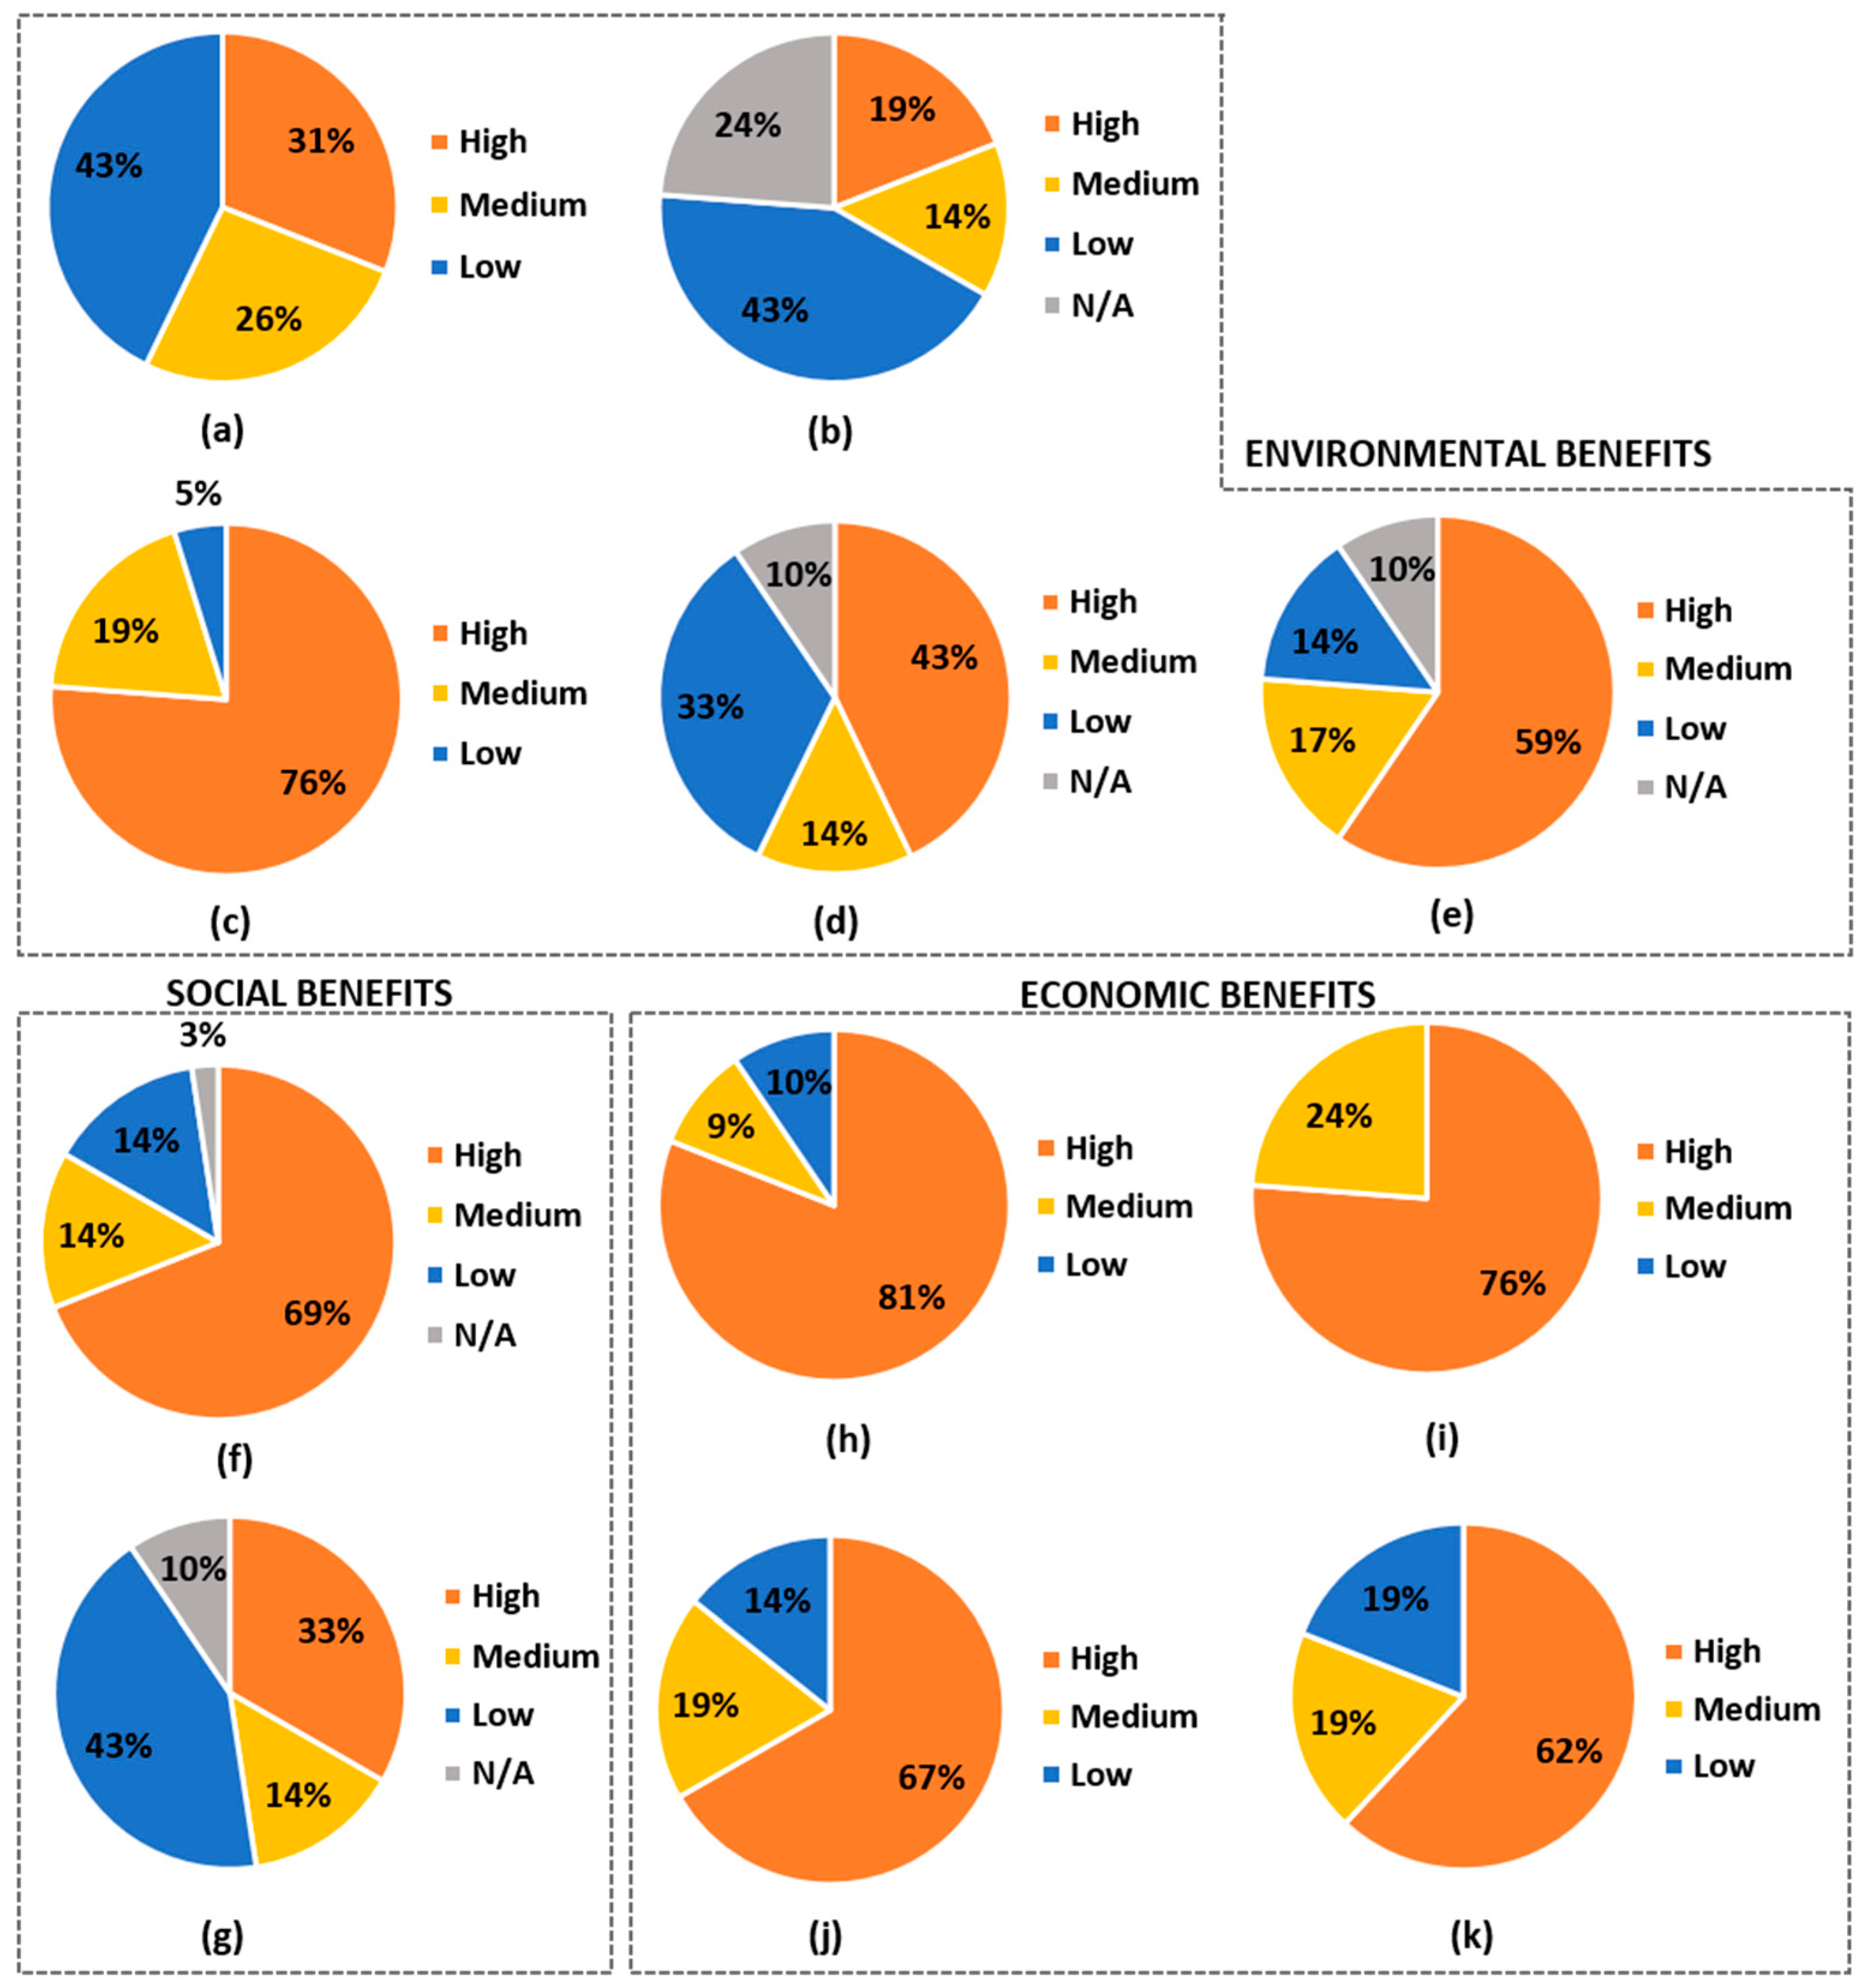
5.2. Identification of the Main Co-Benefits to be Enhanced

To identify the most important co-benefits to be addressed in the area, two data sources were used. Firstly, the revision of previous studies developed in the area to identify local needs. Secondly, a participatory analysis with stakeholders, using a questionnaire to collect data about stakeholders’ perceptions. The aim of this analysis was to establish stakeholders’ opinion about what are the most important benefits that should be enhanced in the area.
Ayutthaya is an important touristic and cultural city, hence several previous studies have been performed in the area. By reviewing these works, the need of flood risk reduction was identified as a main concern [44]. Although the work presented here is about the selection of strategies for flood risk reduction, the focus is on co-benefits enhancement. A parallel or posterior analysis must be done before making a final decision, to define the impact of different strategies on reducing flood risk.
Vojinovic [45] studied different measures combining ecosystem services enhancement with flood modelling and cost-benefits analysis. Although this work focused mainly on fluvial floods reduction through centralised measures, it identified aesthetics and recreation as pertinent services for the study area. We also used the conclusions and recommendations of Golub [42] and Keerakamolchai [41] to identify the most important needs. Both studies applied participatory approaches to conclude that the focus should be on the enhancement of the landscape, achieved by adding flood management measures, with a positive impact on benefits like biodiversity and ecology, amenity and aesthetics, tourism and water management. These studies also remarked the problems in the WHS area due to land subsidence, which is originated by groundwater table depletion. Consequently, groundwater recharge is seen as another important benefit that should be enhanced.
In 1997, the study of the Public Works Department, Ministry of Interior, defined flood protection measures for Ayutthaya. These measures were based on engineering solutions and a cost benefit analysis, without considering public perception, environment, or aesthetics. Consequently, the proposed solution was controversial, creating arguments in the community, which at the end resisted the plan [41]. This experience serves as an example of the importance of including the stakeholders’ perception when planning the implementation of measures. Besides, participatory planning processes are seen as useful tools when stakeholders perceive opposing main goals, helping them to accept plans that aim at a variety of goals, such as the multiple benefits delivered by GI [46].
This area has been the focus of several workshops and consultation meetings on this topic [41,42,44,45]. In order to avoid over questioning or exhaustion of the stakeholders, we chose to apply a simple and short questionnaire (see Appendix B). In addition, this method avoids attendance problems and allows to reach a broader diversity of people, including inhabitants and tourists. The questionnaire includes fifteen questions, which were developed based on CIRIA works [3,28]. The benefits included were divided in the three categories described in Section 3.1: environmental, social, and economic benefits.
The questionnaire was answered by 42 stakeholders from different backgrounds: public authorities, international agencies and groups, private sector, citizens, and visitors. A diversity of methods to apply the questionnaire were used. The main method used was a Google form that was filled and submitted online. Another method used consisted of one-to-one interviews, applied in the case of commercial owners, citizens, and tourists around the study area (for further details see [36]). The main groups that answered the survey were people living in the area (inhabitants), researchers, tourists, and people from the local government (see Figure 5).
The first questions were related to the most important benefit that should be enhanced in each category (Figure 6). By analysing the results, it was concluded that these benefits are: biodiversity and ecology (with 38% of answers), amenity and aesthetics (with 50% of answers), and rainwater harvesting (with 48% of answers). Previous studies obtained similar results regarding the benefits that should be improved in the area [41,42].
The remaining questions focused on the importance of each benefit separately (Figure 7). In this case, the most important benefits for each category were maintained with respect to the ones shown in Figure 6. However, the second most important benefits were different in the cases of environmental and economic benefits. This is important because the objective here was to choose the first and second preferred benefits as key co-benefits for the case under study.
Water quality improvement was the benefit chosen as the second most important when participants were asked to compare among environmental benefits, with 29% of answers (Figure 6a). However, when participants were asked to evaluate each benefit separately, water quality improvement fell to the fourth place. This is because 59% of the participants classified as “high” the relevance of air quality improvement and only 31% chose water quality improvement (Figure 7a–e).
Regarding the economic benefits, the second most important benefit was reduction of building energy consumption, with 24% of answers (Figure 6c). However, the second most important benefit when the stakeholders had to evaluate the benefits one by one, was reduction of stormwater pumping and treatment, with 76% of answers choosing it as a high-importance benefit, while 67% of respondents chose reduction of building energy consumption (Figure 7h–k).
In this work, we consider that the direct comparison among benefits gives a clearer understanding and a more reliable result. Consequently, the environmental benefit selected as second most important is the improvement of the water quality of the receiving bodies. In the case of economic benefits, the reduction of energy consumption in buildings was chosen as the second most important benefit.
In summary, biodiversity and ecology and water quality of the receiving bodies were identified as key environmental benefits. Amenity and aesthetics enhancement and green areas increase were selected as the main social benefits. In the case of economic benefits, rainwater harvesting and building energy reduction were identified as the most important.
Another analysis performed focuses on the answers given by different stakeholder’s types. The objective was to understand how different actors perceive different necessities. The stakeholders were divided in three groups. The first one represents the general public, including inhabitants, local commercial owners, and tourists. The second one represents policy makers and is formed by people from national government and local government levels. The last one includes people from the scientific community, such as researchers, consultants, and non-governmental organizations (NGO).
Among the three actors included into the general public group, inhabitants and local business owners selected the same benefits already identified as the first and second options in the previous analysis (Figure 8a). In contrast, tourists answered differently when choosing the second most important benefits, selecting food security and real estate value as second options for social and economic benefits respectively.
Regarding the policy makers, both subgroups chose the previously identified first and second most important benefit in the cases of environmental and social benefits (Figure 8b). However, in the case of economic benefits, people from the national government did not show a preference, whereas for people from the local government level, the second preferred option was pumping and treatment reduction.
Finally, the results from the third group showed that consultants and NGO people chose biodiversity and ecology improvement as the only important environmental benefit, while researchers selected temperature reduction as the most important environmental benefit (Figure 8c). In the case of social benefits, both groups selected the already identified first and second most important benefits. Regarding the case of economic benefits, researchers selected the key benefits defined from the general analysis, while consultants and NGO people indicated pumping and treatment reduction as the most important benefit.
These results confirm how the common practice of making decision from a unilateral point of view, by the scientific community or policy makers, does not allow to consider the preferences of residents or visitors who have a much more local perspective. For instance, in this case, if the general public perceptions are not considered, temperature reduction could be chosen as a key environmental benefit in place of water quality improvement, or, in the case of economic benefits, pumping and treatment reduction could be perceived as more important than building energy savings. This analysis shows the importance of including different types of stakeholders when making decisions, and, in particular, residents and visitors, to consider the local perceptions.

5.3. Definition of the Most Effective Combinations of GI

Based on the most important co-benefits identified from the analysis of stakeholders’ perceptions and the indicators defined in Section 3.2, a ranking of GI measures was developed (Table 4). The ranking considered only the key co-benefits identified by the analysis of stakeholders’ answers. For each measure, the indicators for each one of these co-benefits were added to obtain a final score. According to this ranking, the most convenient drainage GI measures to enhance the selected co-benefits in Ayutthaya are: retention ponds, intensive green roofs, bio-retention areas, rain gardens, and bio-swales.
Combining the results obtained from this ranking with the results from the land use and measures suitability analyses, the preferred measures for each type of land use were defined (Table 5a). For each land-use type, the most preferred and second preferred GI measures were considered in this analysis.
Through these results, we identified potential measures to apply in each land-use type of Ayutthaya. The most convenient GI measures to apply at the building level are green roofs, preferably intensive green roofs, applicable in flat-roof buildings. In parking lots and transport corridors, the most effective GI to achieve the selected co-benefits are bio-swales and rain gardens. In the cases of parks and playfields and green places, bio-retention areas appear as the most adequate GI to be used. Finally, retention ponds are recommended as effective GI measures to be applied to water surfaces.
In this work we focused on the identification of key co-benefits as the central aspect to select flood risk reduction strategies. Nevertheless, the capacity of GI measures to reduce flood risk should be included in the analysis from the very beginning of the decision-making processes. To achieve this, a qualitative analysis of this aspect was introduced. The selection of a qualitative analysis was based on its simplicity, since in this case the objective was to see how the preferred measures changed when this aspect was introduced. However, a flood risk reduction analysis should be based on a more complex study including hydrodynamic modelling.
Woods-Ballard et al. [28] described in qualitative terms the capacity of different GI measures to reduce the peak flow and the runoff volume (Table 6). According to this information, the most effective measures to reduce flood risk, among the ones considered for this case, are pervious pavements, rain barrels, and detention and retention ponds. However, not all these measures appear as the preferred ones to enhance the key co-benefits identified for this case study.
If flood risk reduction capacity is included into the analysis as a main objective to select GI measures, pervious pavements should be included in the preferred measures to apply in parking lots, parks and playfields, and transport corridors. Likewise, detention ponds should be considered for green spaces, parks, and playfields, and rain barrels for flat and non-flat roofs. Table 5b presents the addition of these options to the most preferred measures previously identified for co-benefits enhancement.
The results presented in Table 5 show that measures which were not preferred when only co-benefits were considered appear as favourite for flood risk reduction, and vice versa. Consequently, if only flood reduction capacity is considered, as is common during decision-making for stormwater management, the improvement of co-benefits would be neglected. Also, if only co-benefits are considered, the reduction of the flood risk would be minimal. This demonstrates the importance of considering both objectives. In the case presented here, decision makers should consider the mixture of measures marked in green and blue in Table 5b to achieve sustainable strategies to decrease flood risk and enhance co-benefits.
When these results are analysed from an ecosystem services point of view, it can be observed that provisioning, regulating, and cultural services are improved through the implementation of the selected measures. Provisioning of native plants, birds, and insects can be improved by implementing green roofs, bio-retentions, rain gardens, and bio-swales. The regulation and maintenance services such as baseline flow maintenance, flood protection, combined sewer overflows, and air quality improvement, are achieved using infiltration and vegetated measures. Water pollution removal is reached using bio-retentions areas, while mediation of smell, noise, and visual impacts are improved using green measures in transport corridors. Pollination and seeds dispersal, creation of habitats for plants and animals, climate regulation through carbon sequestration, and local temperature reduction are achieved by implementing green infrastructures such as green roofs, rain gardens, bio-retention areas, and bio-swales. Finally, cultural services such as physical interactions, watching birds and plants, as well as intellectual interactions with scientific and educational opportunities and aesthetic improvements of heritage areas are enhanced by applying the different measures selected for this case.

6. Conclusions

This paper presents a methodological framework for the selection of green infrastructures combinations based on the improvement of co-benefits, besides the reduction of flood risk. The achievement of co-benefits is introduced here as a consequence of green infrastructure implementation, which also allows ecosystem services enhancement and the consequent enhancement of human well-being.
The framework presented here combines a land use analysis with the identification of locally needed co-benefits, achieved through a stakeholders’ survey. As a new concept, the framework includes the consideration of key co-benefits into decision-making processes to select flood risk reduction strategies. Furthermore, the method takes into account participatory planning and stakeholder’s perceptions analysis to identify these key benefits.
The framework was applied to a case study in Ayutthaya, Thailand. The results obtained show the importance of participatory planning processes, which help decision makers to develop sustainable solutions based on local necessities, particularly in cases where the stakeholders have different objectives. In this case, different stakeholder’s types showed different perceptions about key benefits to be enhanced, confirming that unilateral decision-making processes from policy makers or the scientific community, could focus on benefits different to the ones identified as the most important by the local residents.
Moreover, the results show the importance of considering co-benefits when designing strategies to reduce flood risk. Significant differences are observed when comparing the preferred measures identified when considering only key co-benefits enhancement with those identified when considering only flood risk reduction. This remarks the importance of taking into account both objectives from the very beginning of the decision-making processes to achieve sustainable flood reduction strategies. Using this approach, a complete range of benefits achievable by combining different green infrastructures can be capitalized.
The methodology presented in this work does not pretend to be conclusive. Several steps in this method are based on a qualitative analysis, in particular the evaluation of measures for flood risk reduction. Future work is needed to combine the framework presented in this work with a complete flood risk reduction analysis of green measures combinations.

Acknowledgments

This research has received funding from the European Union Seventh Framework Programme (FP7/2007–2013) under Grant agreement No. 603663 for the research project PEARL (Preparing for Extreme and Rare events in coastaL regions). The study reflects only the authors’ views and the European Union is not liable for any use that may be made of the information contained herein.

Author Contributions

Alida Alves wrote the article and contributed to the research process by generating the conceptual framework and by processing the results. Jose Patiño Gómez contributed to the framework, ranking development, and stakeholder analysis. The research process was performed under close supervision and received contributions from Zoran Vojinovic, Arlex Sanchez and Sutat Weesakul.

Conflicts of Interest

The authors declare no conflict of interest.

Appendix A

Figure A1. Classification of ecosystem services and components of human well-being according to the Millennium Ecosystem Assessment [23], Haines-Young and Potschin [25], and Staub et al. [27].
Environments 05 00029 g0a1
Figure A2. Relation between ecosystem functions, services, benefits, and value (adapted from [22]).
Environments 05 00029 g0a2

Appendix B

Questionnaire to stakeholders:
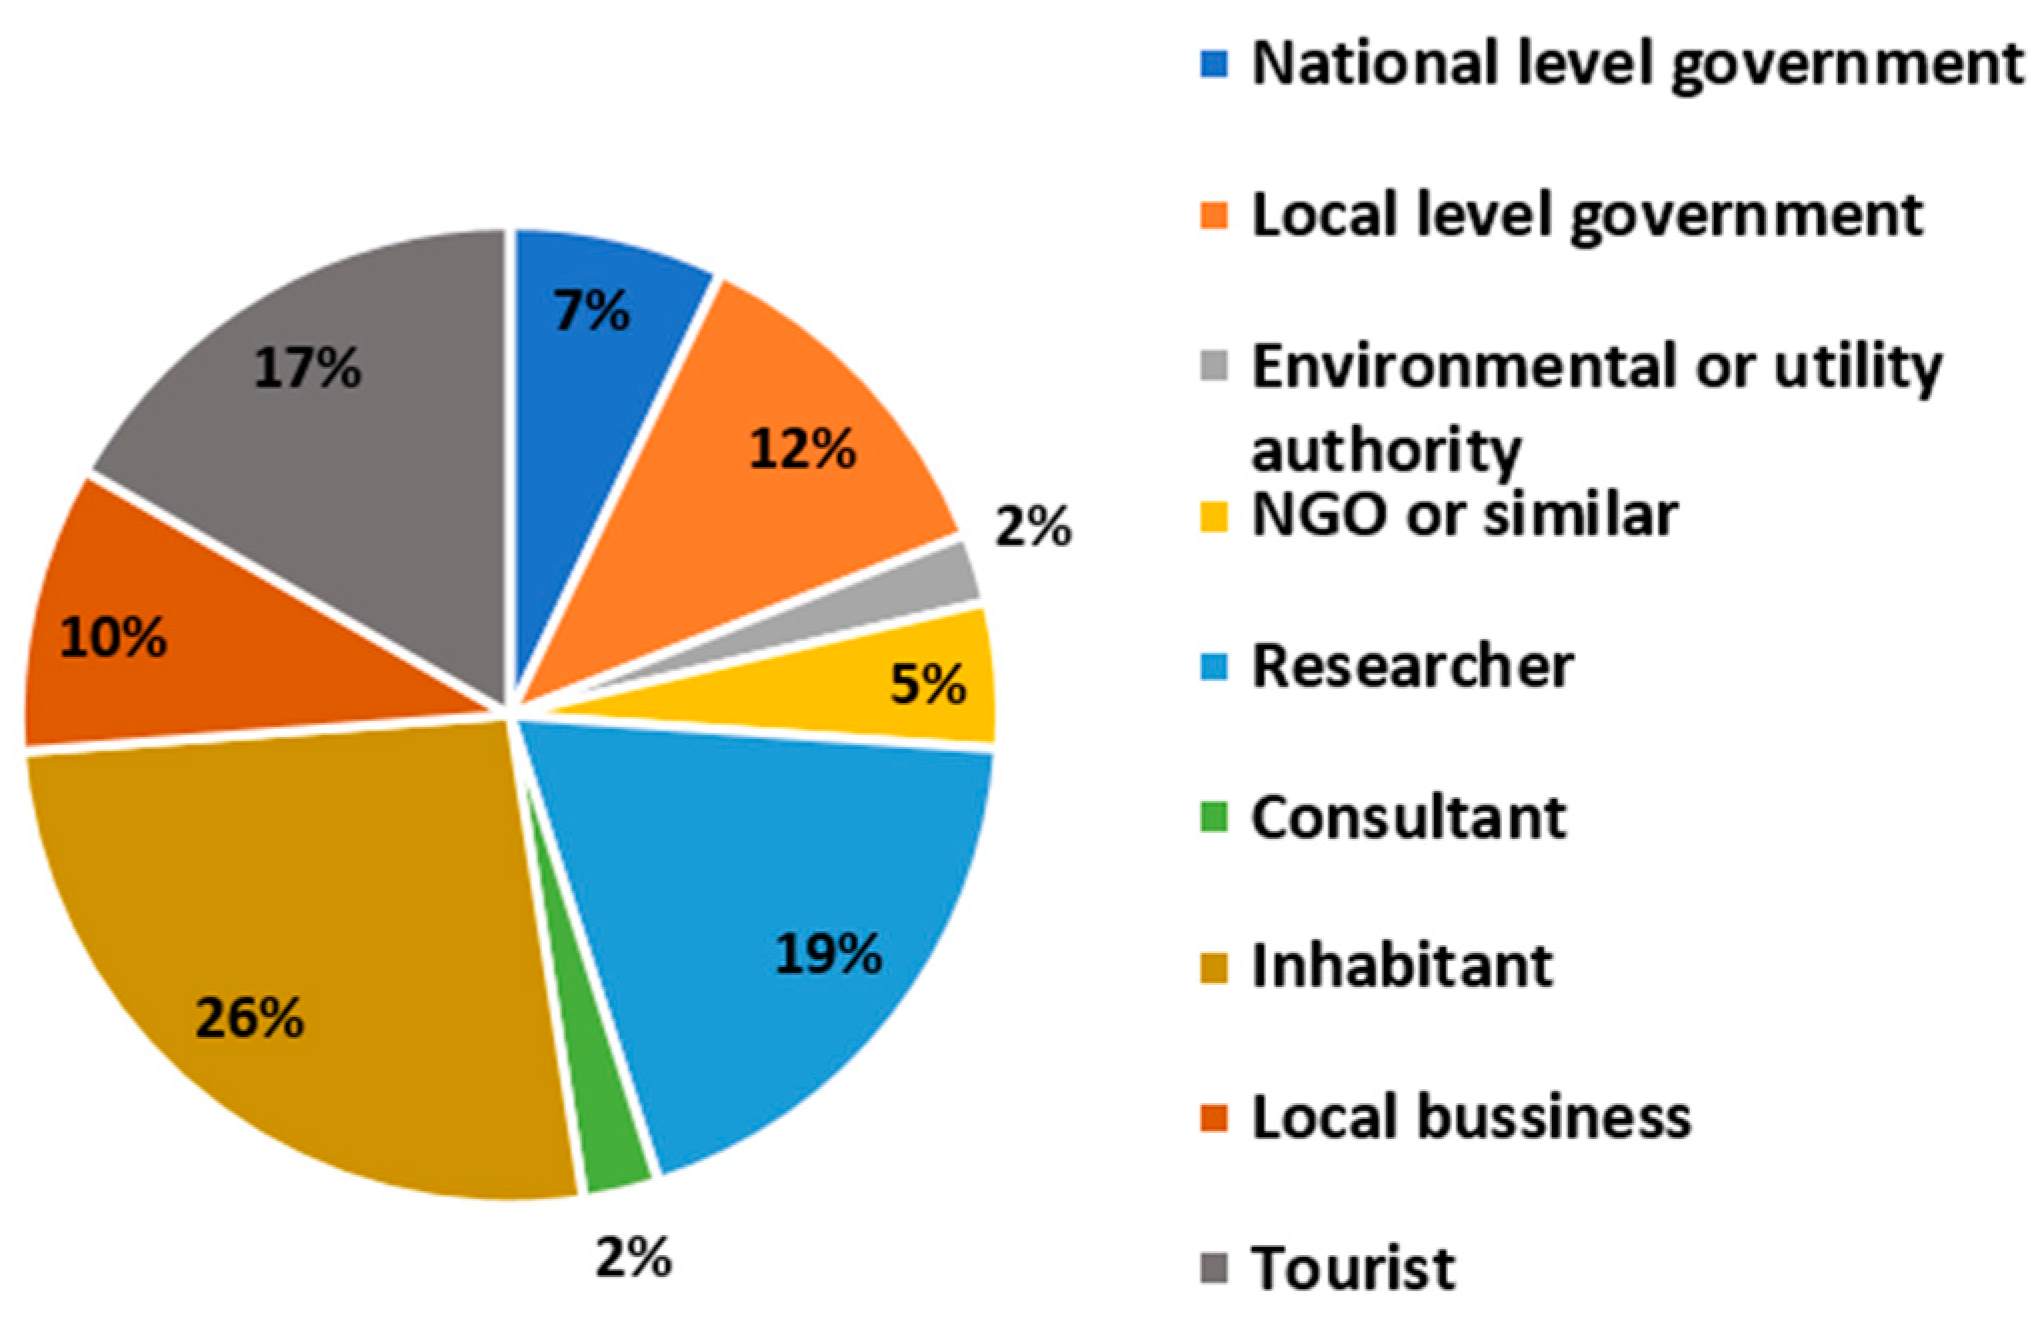
  • Select the type of stakeholder that best describes your position
    • National level government
    • Local level government
    • Environmental or utility authority
    • NGO or similar
    • Researcher
    • Consultant
    • Inhabitant
    • Commercial owner
    • Tourist
  • Which is the most important environmental benefit that should be enhanced in the area by the application of green infrastructure?
    • Water quality of receiving bodies
    • Groundwater recharge
    • Biodiversity and ecology enhancement
    • Temperature reduction (heat stress reduction)
    • Air quality improvement
  • Which is the most important social benefit that should be enhanced in the area by the application of green infrastructure?
    • Amenity and aesthetics
    • Recreation and health (increment of green area per inhabitant)
    • Food security
  • Which is the most important economic benefit that should be enhanced in the area by the application of green infrastructure?
    • Rainwater harvesting
    • Pumping and treatment reduction
    • Saving energy in buildings
    • Real estate value appreciation
  • What is the level of contribution of stormwater runoff to the pollution and degradation of water bodies?
    • High
    • Medium
    • Low
    • Not applicable
  • What is the current usage of groundwater extraction and water table depletion?
    • High
    • Medium
    • Low
    • Not applicable
  • What is the need of enhancement of biodiversity and ecology in the urban area?
    • High
    • Medium
    • Low
    • Not applicable
  • What is the level of impact of heat stress effect on the population in the urban area?
    • High
    • Medium
    • Low
    • Not applicable
  • What is the importance of improving air quality in the urban area?
    • High
    • Medium
    • Low
    • Not applicable
  • What is the requirement of landscape improvement by including more natural spaces to enhance amenity and livability of the community?
    • High
    • Medium
    • Low
    • Not applicable
  • What is the importance of producing food in the area to enhance food security?
    • High
    • Medium
    • Low
    • Not applicable
  • What is the importance of reducing water demand by using alternative water sources such as rainwater harvesting?
    • High
    • Medium
    • Low
    • Not applicable
  • What is the importance of reducing pumping and treatment of stormwater in the area?
    • High
    • Medium
    • Low
    • Not applicable
  • What is the importance of reducing energy consumption in buildings by reducing air conditioner and ventilation systems demand?
    • High
    • Medium
    • Low
    • Not applicable
  • What is the importance of increasing real estate value in the urban area?
    • High
    • Medium
    • Low
    • Not applicable

References

  1. Intergovernmental Panel on Climate Change (IPCC). Managing the Risks of Extreme Events and Disasters to Advance Climate Change Adaptation. A Special Report of Working Groups I and II of the Intergovernmental Panel on Climate Change; Field, C.B., Barros, V., Stocker, T.F., Qin, D., Dokken, D.J., Ebi, K.L., Mastrandrea, M.D., Mach, K.J., Plattner, G.-K., Allen, S.K., et al., Eds.; Cambridge University Press: Cambridge, UK; New York, NY, USA, 2012.
  2. Mynett, A.E.; Vojinovic, Z. Hydroinformatics in multi-colours—Part red: Urban flood and disaster management. J. Hydroinform. 2009, 11, 166. [Google Scholar] [CrossRef]
  3. CIRIA. Demonstrating the Multiple Benefits of SuDS—A Business Case. Available online: http://www.susdrain.org/files/resources/ciria_guidance/ciria_rp993_literature_review_october_2013_.pdf (accessed on 22 November 2015).
  4. European Commission. The Multifunctionality of Green Infrastructure, In-depth Report; European Commission’s Directorate-General Environment: Brussels, Belgium, 2012. [Google Scholar]
  5. Center for Neighborhood Technology & American Rivers. The Value of Green Infrastructure: A Guide to Recognizing Its Economic, Environmental and Social Benefits; Center for Neighborhood Technology: Chicago, IL, USA, 2010. [Google Scholar]
  6. Yazdanfar, Z.; Sharma, A. Urban drainage system planning and design—Challenges with climate change and urbanization: a review. Water Sci. Technol. 2015, 72, 165–179. [Google Scholar] [CrossRef] [PubMed]
  7. Vojinovic, Z. Flood Risk: The Holistic Perspective. From Integrated to Interactive Planning for Flood Resilience; IWA Publishing: London, UK, 2015. [Google Scholar]
  8. Lundy, L.; Wade, R. Integrating sciences to sustain urban ecosystem services. Prog. Phys. Geogr. 2011, 35, 653–669. [Google Scholar] [CrossRef]
  9. Martin, C.; Ruperd, Y.; Legret, M. Urban stormwater drainage management : The development of a multicriteria decision aid approach for best management practices. Eur. J. Oper. Res. 2007, 181, 338–349. [Google Scholar] [CrossRef]
  10. Cheng, M.; Zhen, J.X.; Shoemaker, L. BMP decision support system for evaluating stormwater management alternatives. Front. Environ. Sci. Eng. China 2009, 3, 453–463. [Google Scholar] [CrossRef]
  11. Young, K.D.; Dymond, R.L.; Asce, M.; Kibler, D.F.; Asce, M. Development of an Improved Approach for Selecting Storm-Water Best Management Practices. J. Water Resour. Plan. Manag. 2011, 137, 268–275. [Google Scholar] [CrossRef]
  12. Jia, H.; Yao, H.; Tang, Y.; Yu, S.L.; Zhen, J.X.; Lu, Y. Development of a multi-criteria index ranking system for urban runoff best management practices ( BMPs ) selection. Environ. Monit. Assess. 2013, 185, 7915–7933. [Google Scholar] [CrossRef] [PubMed]
  13. Chow, J.; Savic, D.; Fortune, D.; Kapelan, Z.; Mebrate, N. Translating legislative requirements and best practice guidance into a systematic, multi-criteria decision support framework for effective sustainable drainage design evaluation. In Proceedings of the 2013 IAHR World Congress, Chengdu, China, 8–13 September 2013. [Google Scholar]
  14. Meerow, S.; Newell, J.P. Spatial planning for multifunctional green infrastructure: Growing resilience in Detroit. Landsc. Urban Plan. 2016, 159, 62–75. [Google Scholar] [CrossRef]
  15. Schifman, L.A.; Herrmann, D.L.; Shuster, W.D.; Ossola, A.; Garmestani, A.; Hopton, M.E. Situating Green Infrastructure in Context: A Framework for Adaptive Socio-Hydrology in Cities. Water Resour. Res. 2017, 1–16. [Google Scholar] [CrossRef]
  16. Alves, A.; Sanchez, A.; Vojinovic, Z.; Seyoum, S.; Babel, M.; Brdjanovic, D. Evolutionary and holistic assessment of green-grey infrastructure for CSO reduction. Water 2016, 8, 402. [Google Scholar] [CrossRef]
  17. Jia, H.; Lu, Y.; Yu, S.L.; Chen, Y. Planning of LID–BMPs for urban runoff control: The case of Beijing Olympic Village. Sep. Purif. Technol. 2012, 84, 112–119. [Google Scholar] [CrossRef]
  18. Fratini, C.F.F.; Geldof, G.D.; Kluck, J.; Mikkelsen, P.S. Three Points Approach (3PA) for urban flood risk management: A tool to support climate change adaptation through transdisciplinarity and multifunctionality. Urban Water J. 2012, 9, 317–331. [Google Scholar] [CrossRef] [Green Version]
  19. Moura, N.C.B.; Pellegrino, P.R.M.; Martins, J.R.S. Best management practices as an alternative for flood and urban storm water control in a changing climate. J. Flood Risk Manag. 2016, 9, 243–254. [Google Scholar] [CrossRef]
  20. Recanatesi, F.; Petroselli, A.; Ripa, M.N.; Leone, A. Assessment of stormwater runoff management practices and BMPs under soil sealing: A study case in a peri-urban watershed of the metropolitan area of Rome (Italy). J. Environ. Manage. 2017, 201, 6–18. [Google Scholar] [CrossRef] [PubMed]
  21. Tzoulas, K.; Korpela, K.; Venn, S.; Yli-pelkonen, V.; Ka, A.; Niemela, J.; James, P. Promoting ecosystem and human health in urban areas using Green Infrastructure : A literature review. Landsc. Urban Plan. 2007, 81, 167–178. [Google Scholar] [CrossRef]
  22. Haines-Young, R.H.; Potschin, M.B. The links between biodiversity, ecosystem services and human well-being. In Ecosystems Ecology: A New Synthesis, Chapter Six; Cambridge University Press: Cambridge, UK, 2010. [Google Scholar]
  23. Millennium Ecosystem Assessment. Ecosystems and Human Well-Being: Synthesis; Island Press: Washington, DC, USA, 2005; Volume 5. [Google Scholar]
  24. Department for Environment, Food and Rural Affairs (Defra), UK. An Introductory Guide to Valuing Ecosystem Services; Department for Environment, Food & Rural Affairs: London, UK, 2007.
  25. Consultation on CICES (Common International Classification of Ecosystem Services) Version 4, August–December 2012 and CICES-V4-3 Spreadsheet. Available online: https://cices.eu/resources/ (accessed on 12 December 2017).
  26. De Groot, R.S.; Wilson, M.A.; Boumans, R.M.J. A typology for the classification, description and valuation of ecosystem functions, goods and services. Ecol. Econ. 2002, 41, 393–408. [Google Scholar] [CrossRef]
  27. Staub, C.; Ott, W.; Heusi, F.; Klingler, G.; Jenny, A.; Häcki, M.; Hauser, A. Indicators for Ecosystem Goods and Services: Framework, Methodology and Recommendations for a Welfare-Related Environmental Reporting; Federal Office for the Environment (FOEN): Bern, Switzerland, 2011. [Google Scholar]
  28. Woods-Ballard, B.; Kellagher, R.; Martin, P.; Jefferies, C.; Bray, R.; Shaffer, P. The SUDS Manual; CIRIA: London, UK, 2007. [Google Scholar]
  29. UDFCD. Urban Storm Drainage Criteria Manual Volume 3, Stormwater Best Management Practice; Urban Drainage, Flood Control District, Eds.; Water Resources Publications: Denver, CO, USA, 2010.
  30. Horton, B.; Digman, C.J.; Ashley, R.M.; Gill, E. BeST (Benefits of SuDS Tool) W045c BeST—Technical Guidance Release Version 3; CIRIA: London, UK, 2016. [Google Scholar]
  31. Lovell, S.T.; Taylorm, J.R. Supplying urban ecosystem services through multifunctional green infrastructure in the United States. Landsc. Ecol. 2013, 1447–1463. [Google Scholar] [CrossRef]
  32. WHO. Health and Sustainable Development. Available online: http://www.who.int/sustainable-development/cities/health-risks/urban-greenspace/%0Aen/ (accessed on 5 December 2015).
  33. Macmullan, E.; Reich, S. The Economics of Low-Impact Development: A Literature Review; ECONorthwest: Eugene, OR, USA, 2007. [Google Scholar]
  34. Derkzen, M.L.; Van Teeffelen, A.J.A.; Verburg, P.H. Quantifying urban ecosystem services based on high-resolution data of urban green space : An assessment for Rotterdam, The Netherlands. J. Appl. Ecol. 2015, 52, 1020–1032. [Google Scholar] [CrossRef]
  35. Jia, H.; Yao, H.; Tang, Y.; Yu, S.L.; Field, R.; Tafuri, A.N. LID-BMPs planning for urban runoff control and the case study in China. J. Environ. Manag. 2015, 149, 65–76. [Google Scholar] [CrossRef] [PubMed]
  36. Patiño Gómez, J. Assessment of Green Infrastructure Measures to Reduce Stormwater Runoff and Enhance Multiple Benefits in Urban Areas; Asian Institute of Technology: Bangkok, Thailand; UNESCO–IHE: Delft, The Netherlands, 2017. [Google Scholar]
  37. Shoemaker, L.; Riverson, J.J.; Alvi, K.; Zhen, J.X.; Paul, S.; Rafi, T. SUSTAIN—A Framework for Placement of Best Management Practices in Urban Watersheds to Protect Water Quality; National Risk Management Research Laboratory Office of Research and Development U.S. Environmental Protection Agency: Cincinnati, OH, USA, 2009.
  38. DEFRA. Local Action. Available online: http://urbanwater-eco.services/toolbox/ (accessed on 18 December 2016).
  39. Berghage, R.; Beattie, D.; Jarrett, A.R.; Thuring, C.; Razaei, F.; O’Connor, T.P. Green Roofs for Stormwater Runoff Control Green Roofs for Stormwater Runoff Control; National Risk Management Research Laboratory Office of Research and Development U.S. Environmental Protection Agency: Cincinnati, OH, USA, 2009.
  40. Lorphensri, O.; Ladawadee, A.; Dhammasarn, S. Review of groundwater management and land subsidence in Bangkok, Thailand. In Groundwater and Subsurface Environments; Taniguchi, M., Ed.; Springer: Tokyo, Japan, 2011. [Google Scholar]
  41. Keerakamolchai, W. Towards a Framework for Muntifunctional Flood Detention Facilities Design in a Mixed Land Use Area: The Case of Ayutthaya World Heritage Site, Thailand. Master's Thesis, Asian Institute of Technology, Bangkok, Thailand, UNESCO–IHE, Delft, The Netherlands, 2014. [Google Scholar]
  42. Golub, D. Towards a Framework for Participatory Flood Risk Assessment in Urban Areas with Cultural Heritage: The Case of the Historic City of Ayutthaya, Thailand; UNESCO-IHE Institute for Water Education: Delft, The Netherlands, 2014. [Google Scholar]
  43. Roachanakanan, T. Changing in drainage pattern and increasing flood risk in Thailand. In Proceedings of the Asia Flood Conference, Bangkok, Thailand, 29–31 October 2013. [Google Scholar]
  44. Vojinovic, Z.; Hammond, M.; Golub, D.; Hirunsalee, S.; Weesakul, S.; Meesuk, V.; Medina, N.; Sanchez, A.; Kumara, S.; Abbott, M. Holistic approach to flood risk assessment in areas with cultural heritage: A practical application in Ayutthaya, Thailand. Nat. Hazards 2016, 81, 589–616. [Google Scholar] [CrossRef]
  45. Vojinovic, Z.; Keerakamolchai, W.; Weesakul, S.; Pudar, R.S.; Medina, N.; Alves, A. Combining ecosystem services with cost-benefit analysis for selection of green and grey infrastructure for flood protection in a cultural setting. Environments 2016, 4, 3. [Google Scholar] [CrossRef]
  46. Cheng, C.; Ryan, R.L.; Warren, P.S.; Nicolson, C. Exploring Stakeholders’ Perceptions of Urban Growth Scenarios for Metropolitan Boston (USA): The Relationship Between Urban Trees and Perceived Density. Cities Environ. 2017, 10, 7. [Google Scholar]
Figure 1. Links between green infrastructure for flood risk reduction, ecosystem services, human well-being, and co-benefits [21,22].
Environments 05 00029 g001
Figure 2. Methodological steps for the selection of the most effective green infrastructure (GI) combination.
Environments 05 00029 g002
Figure 3. Selected co-benefits classified in the three sustainability dimensions.
Environments 05 00029 g003
Figure 4. Location of different land uses in the study area.
Environments 05 00029 g004
Figure 5. Type of stakeholders that answered the questionnaire (N = 42).
Environments 05 00029 g005
Figure 6. Most important benefits from stakeholders’ interviews: (a) environmental benefits; (b) social benefits; (c) economic benefits.
Environments 05 00029 g006
Figure 7. Answers obtained to the question of how important each benefit is: (a) pollution of water bodies; (b) Groundwater recharge; (c) enhancement of biodiversity and ecology; (d) heat stress reduction; (e) improvement of air quality; (f) increment of green spaces and amenity improvement; (g) food production; (h) water harvesting; (i) reduction of water pumping and treatment; (j) reduction of buildings energy consumption; (k) real estate value increment.
Environments 05 00029 g007
Figure 8. Answers to the questionnaire by different stakeholders’ types: (a) general public: local business owners, inhabitants, and tourists; (b) policy makers: people form local and national government; (c) scientific community: researches and consultants, and NGO people.
Environments 05 00029 g008
Table 1. Ecosystem service (ES) classification (based on [25]) and examples of green infrastructure providing these services ([3,5,28,29,30].
SectionDivisionGroupClassGreen Infrastructure
ProvisioningNutritionBiomassCultivated cropsGreen spaces, green walls, green roofs
Wild PlantsGreen spaces, wetlands, rain gardens
Wild AnimalsGreen spaces, wetlands, retentions ponds
Plants and algae from in-situ aquacultureRetention ponds, open channels, wetlands
Animals from in-situ aquacultureRetention ponds, open channels, urban wetlands
WaterSurface water for drinking usesRainwater harvesting, retention ponds
Groundwater for drinking usesInfiltration surfaces, pervious pavements
NutrientsNutrients for plantsUrban agriculture, trees and parks, wetlands
MaterialsBiomassFibres and other materialsUrban trees, green spaces and green roofs
WaterSurface water for non-drinking usesRainwater harvesting, retention ponds, open channels
Groundwater for non-drinking usesInfiltration surfaces and trenches, pervious pavements
EnergyBiomass-based energy sourcesPlant-based sourcesUrban trees, green spaces, green roofs
Waste water-based sourcesWetlands, green spaces fertilization
Regulating and maintenanceMediation of waste, toxics and other nuisancesMediation by biotaBio-remediation, filtration, sequestration, storageUrban wetlands, retention ponds, buffering and bioretention areas
Mediation by ecosystemsFiltration/sequestration/storage by ecosystemsUrban wetlands, retention ponds, bio-swales, buffering and bioretention areas
Enhancement of pollutants removal systemsGreen spaces, rain gardens, bio-swales, infiltration surfaces, retention ponds, wetlands
Mediation of smell, noise, visual impactGreen walls/facades, green spaces, green noise barriers, urban trees
Mediation of flowsLiquid flowsHydrological cycle and water flow maintenanceInfiltration areas, trenches and pavements, rainwater disconnection, open channels
Flood protectionGreen measures allowing storage, infiltration, convey and imperviousness reduction
Combined Sewer Overflow reductionGreen measures allowing storage, infiltration and runoff flow reduction in general
Gaseous/air flowsStorm/wind protectionGreen barriers, urban trees and forest
Ventilation and transpirationUrban parks and forest, green spaces, rain gardens, green roofs and walls
Maintenance of physical, chemical, biological conditionsHabitat protectionPollination and seed dispersalGreen spaces, green roofs and walls, wetlands
Maintaining nursery populations and habitatsGreen spaces, retention ponds, open channels, wetlands and buffering areas
Pest and disease controlPest controlNegative impact of wetlands, retention ponds
Disease controlNegative impact of wetlands, retention ponds
Soil formation and compositionWeathering processesUrban wetlands, bio-swales, retention ponds
Decomposition and fixing processesUrban wetlands, bio-swales, rain gardens, retention ponds, buffering areas
Water conditionsChemical condition of freshwatersInfiltration surfaces and trenches, wetlands, pervious pavements, buffering and bioretention.
Atmospheric composition and climate regulationGlobal climate regulation by reduction of greenhouse gas Green spaces, green roofs and walls, wetlands, rain gardens, urban trees, bio-swales
Micro and regional climate regulationGreen spaces, green roofs and walls, pervious pavements, retention ponds, open channels
CulturalPhysical and intellectual interactions with biota, ecosystems, and land-/seascapesPhysical and experiential interactionsExperiential use of plants, animals and land/seascapesGreen spaces, green roofs and walls, wetlands, retention ponds, open channels
Physical use of land/seascapesGreen spaces, retention ponds, open channels
Intellectual and representative interactionsScientificMeasures allowing monitoring of flow and other co-benefits
EducationalAll visible green measures
Heritage, culturalOpen detention basins with multifunctional uses
EntertainmentGreen spaces, multifunctional detention basins
AestheticGreen spaces, retention ponds, open channels,
Spiritual interactions with biota and ecosystems Spiritual and/or emblematicSymbolicGreen spaces and parks, retention ponds
Sacred and/or religiousGreen spaces and water surfaces
Other cultural outputsExistenceGreen spaces, water surfaces
BequestGreen spaces, water surfaces, buffering measures
Table 2. (a) Impact of each measure on environmental benefits (data derived from [12,28,36,38,39]). The values of the indicators are: 0 none/depreciable, 1 very low, 2 low, 3 medium, 4 high, and 5 very high. (b) Impact of each measure on social benefits (data derived from [12,28,36,38]). The values of the indicators are: 0 none/depreciable, 1 very low, 2 low, 3 medium, 4 high, and 5 very high. (c) Impact of each measure on economic benefits (data derived from [12,36,38]). The values of the indicators are: 0 none/depreciable, 1 very low, 2 low, 3 medium, 4 high and 5 very high.
(a)
(a)
Environmental Benefits
NameWater QualityGroundwater RechargeBiodiversity and EcologyTemperature ReductionAir Quality
Bio-retention area42432
Rain garden41322
Pervious pavement53130
Rain barrel03010
Detention pond22210
Retention pond52420
Green roof extensive20333
Green roof intensive30444
Bio-swale42332
Infiltration trench54122
(b)
(b)
Social Benefits
NameAmenity and AestheticsRecreation and HealthFood Security
Bio-retention area512
Rain garden512
Pervious pavement210
Rain barrel000
Detention pond331
Retention pond433
Green roof extensive320
Green roof intensive445
Bio-swale330
Infiltration trench310
(c)
(c)
Economic Benefits
NameRainwater HarvestingPumping and TreatmentBuilding Energy ConsumptionReal Estate Value
Bio-retention area1303
Rain garden1203
Pervious pavement2101
Rain barrel5402
Detention pond3502
Retention pond5404
Green roof extensive0032
Green roof intensive0043
Bio-swale1001
Infiltration trench2202
Table 3. Suitability analysis of GI placement sites.
Type of SiteGreen Roof in.Bio-RetentionRain GardenGreen Roof ex.Bio-SwaleInfiltration TrenchPervious PavementDetention PondRetention PondRain Barrel
Non-flat roofs
Flat roofs
Parking lots
Transport corridors
Green spaces
Parks and playfields
Water
Table 4. Ranking of GI measures according to their impact on selected co-benefits.
GI MeasuresSelected Co-Benefits
Biodiversity and EcologyWater Quality EnhancementAmenity and AestheticsRecreation and HealthRainwater HarvestingBuilding Energy ReductionTotal Benefits Score
Retention pond45435021
Green roof intensive43440419
Bio-retention area44511015
Rain garden34511014
Bio-swale34331014
Green roof extensive32320313
Detention pond22333013
Infiltration trench15312012
Pervious pavement15212011
Rain barrel0000505
Table 5. (a) Preferred measures according to co-benefits for each land-use category (preferred: dark green; second preferred: medium green); (b) preferred measures according to co-benefits (preferred: dark green; second preferred: medium green) and flood risk reduction (preferred: blue) for each land use category.
(a)
(a)
Type of SiteGreen Roof in.Bio-RetentionRain GardenGreen Roof ex.Bio-SwaleInfiltration TrenchPervious PavementDetention PondRetention PondRain Barrel
Non-flat roofs
Flat roofs
Parking lots
Transport corridors
Green spaces
Parks and playfields
Water
(b)
(b)
Type of SiteGreen Roof in.Bio-RetentionRain GardenGreen Roof ex.Bio-SwaleInfiltration TrenchPervious PavementDetention PondRetention PondRain Barrel
Non-flat roofs
Flat roofs
Parking lots
Transport corridors
Green spaces
Parks and playfields
Water
Table 6. Flood risk reduction capacity of selected GI measures [28].
GI MeasuresFlood Risk Reduction Capacity
Peak Flow ReductionVolume Reduction
Green roof intensiveMediumMedium
Bio-retention areaMediumMedium
Rain gardenMediumMedium
Green roof extensiveMediumMedium
Bio-swaleMediumMedium
Pervious pavementGoodGood
Infiltration trenchMediumMedium
Detention pondGoodLow
Retention pondGoodLow
Rain barrelGoodGood

