1. Introduction
In environmental education, generally, educational methods and materials that encourage the learner’s behavior toward the resolution of environmental issues are required. However, taking action towards resolution of climate change problems is considered to be difficult for people, owing to the uncertainty surrounding these issues [
1,
2,
3]. Nevertheless, it is desirable not to hide the uncertainty but to face it because there is a concern that many students have misconceptions regarding climate change [
4,
5,
6,
7]. In such situations, selecting events that are already encountered by people as teaching materials is deemed effective.
One climate change-related phenomenon that satisfies this condition is plant phenology. The temporal occurrence of the life cycle phases or activities of plants and animals throughout the year is an important indicator of the impact of climate change on ecosystems [
8,
9]. Computer-based analysis of time-lapse images of plant communities from a fixed point leads us to a quantitative understanding of leaf phenology on a time scale of decades [
10,
11,
12,
13,
14]. However, examining the results of image analysis are not direct encounters for children. It is necessary for them to observe time-lapse images themselves in order to fully grasp the concepts of plant phenology.
Although the possibility of using time-lapse images as materials in teaching climate change has been previously highlighted, there are only a few studies that aim to verify its validity [
15]. Furthermore, previous research using phenology as a teaching aid has been limited in the extent to which it has highlighted its possible application in this context [
16,
17,
18]. In the present study, we focused on school-based education, which is an important source of information for children on climate change [
19]. We postulated that creating an environment where time-lapse images can be used to observe plant phenology in the classroom would allow more children to enhance the readiness of behavior toward resolution of climate change issues. In this context, an important baseline is to verify how adequately children can observe tree phenology using time-lapse images.
In order to achieve this, we released certain time-lapse images on a website for use in school education; we then analyzed the results to assess the adequacy of students’ plant phenology observations.
2. Materials and Methods
2.1. Time-Lapse Images and Release on the Internet
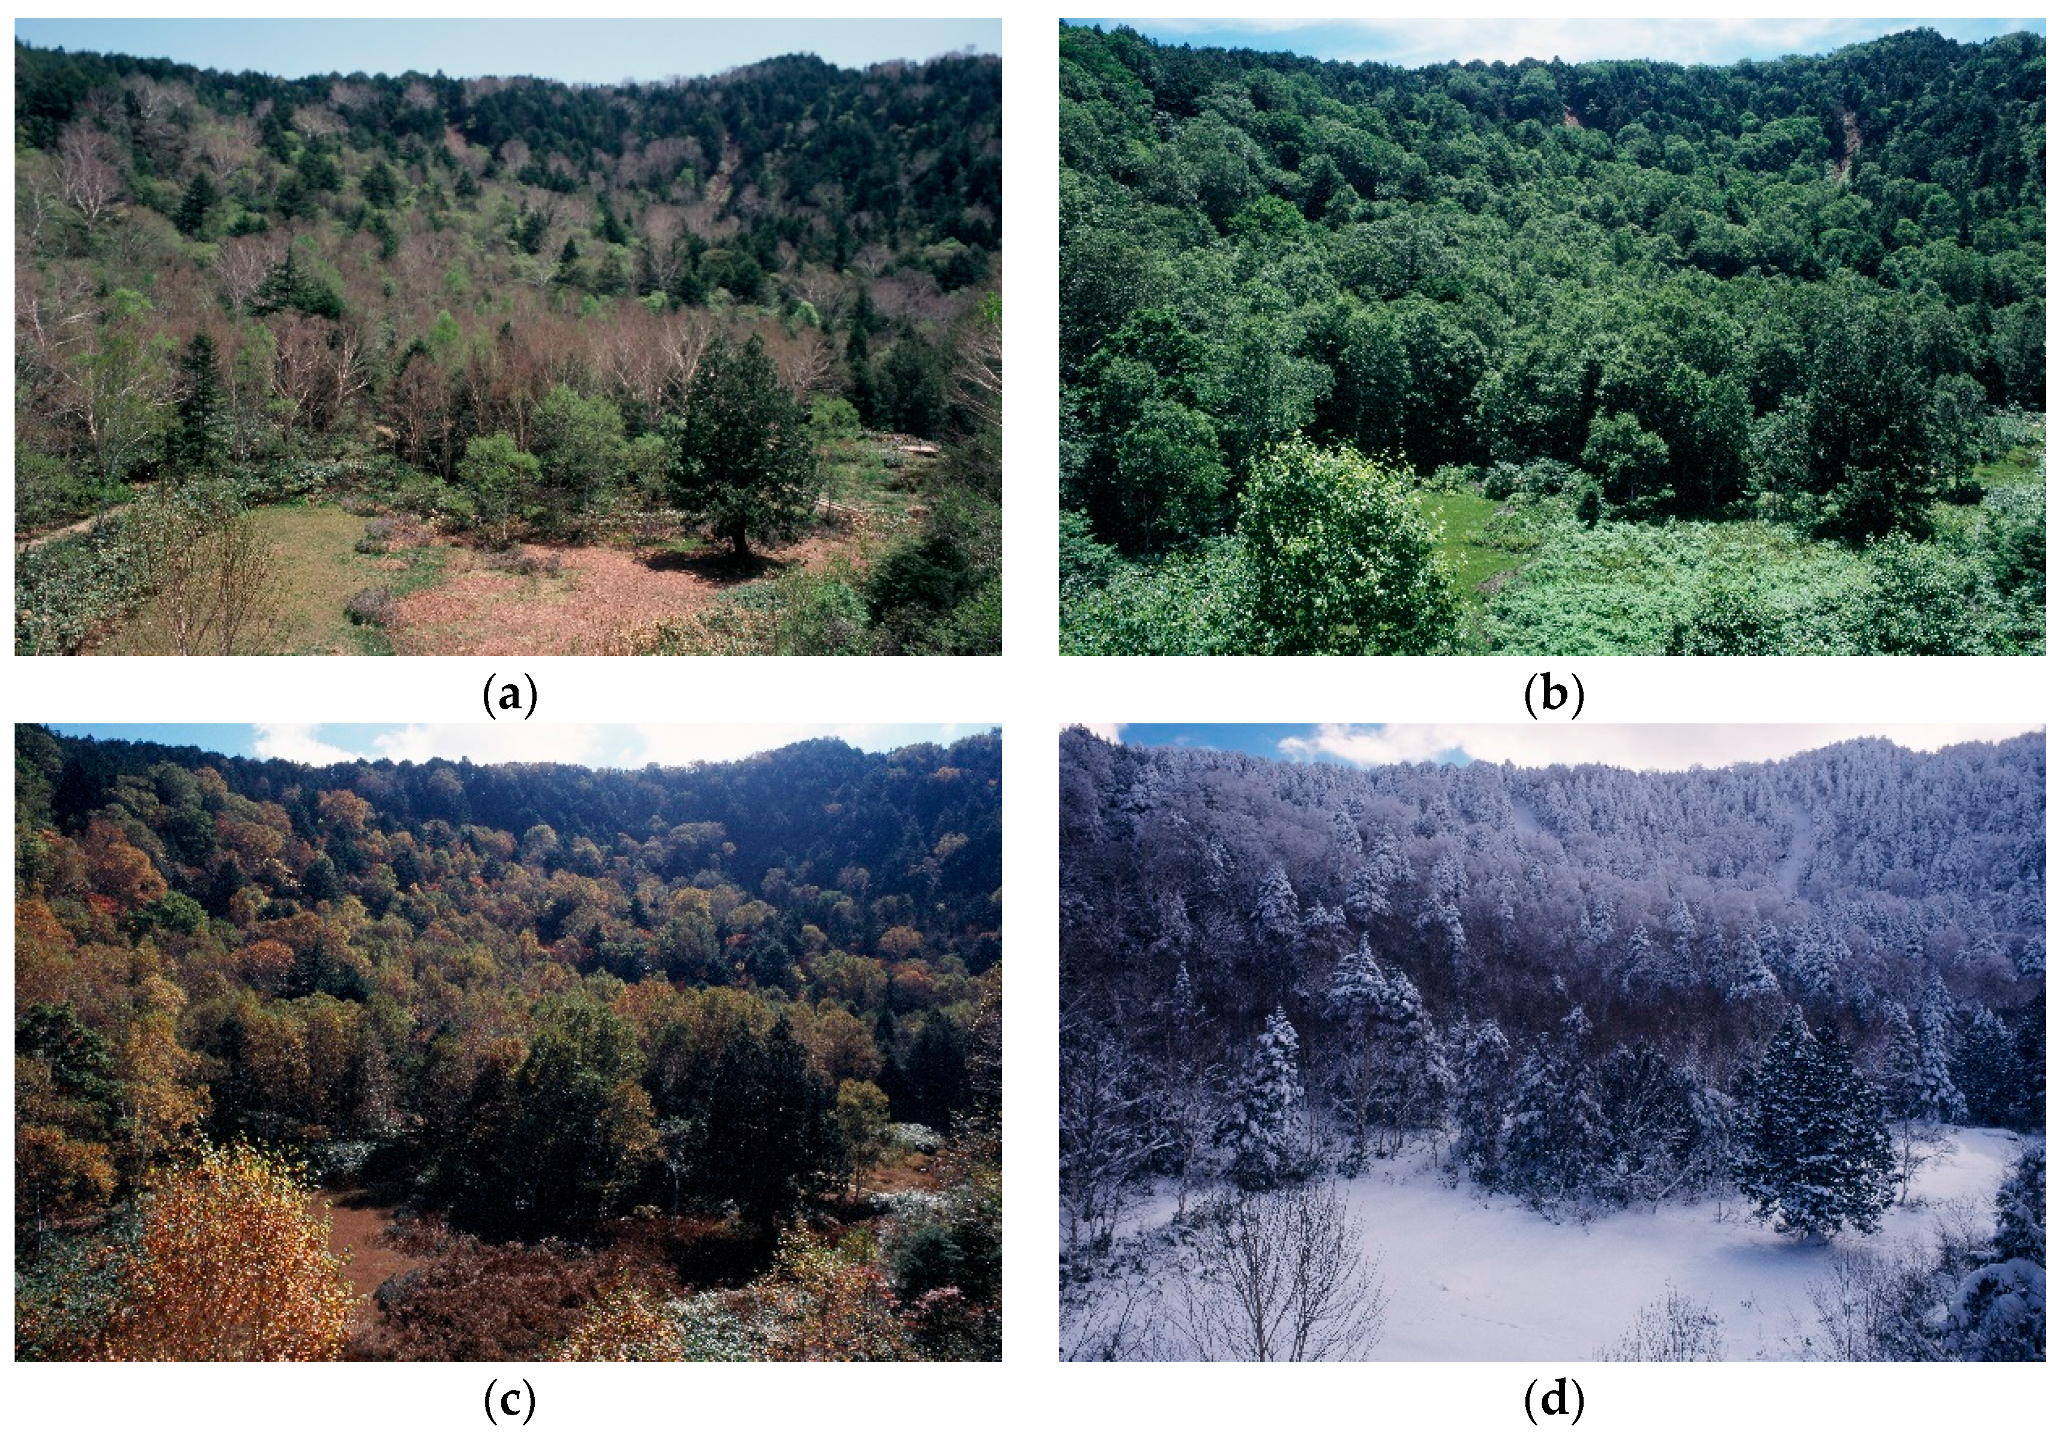
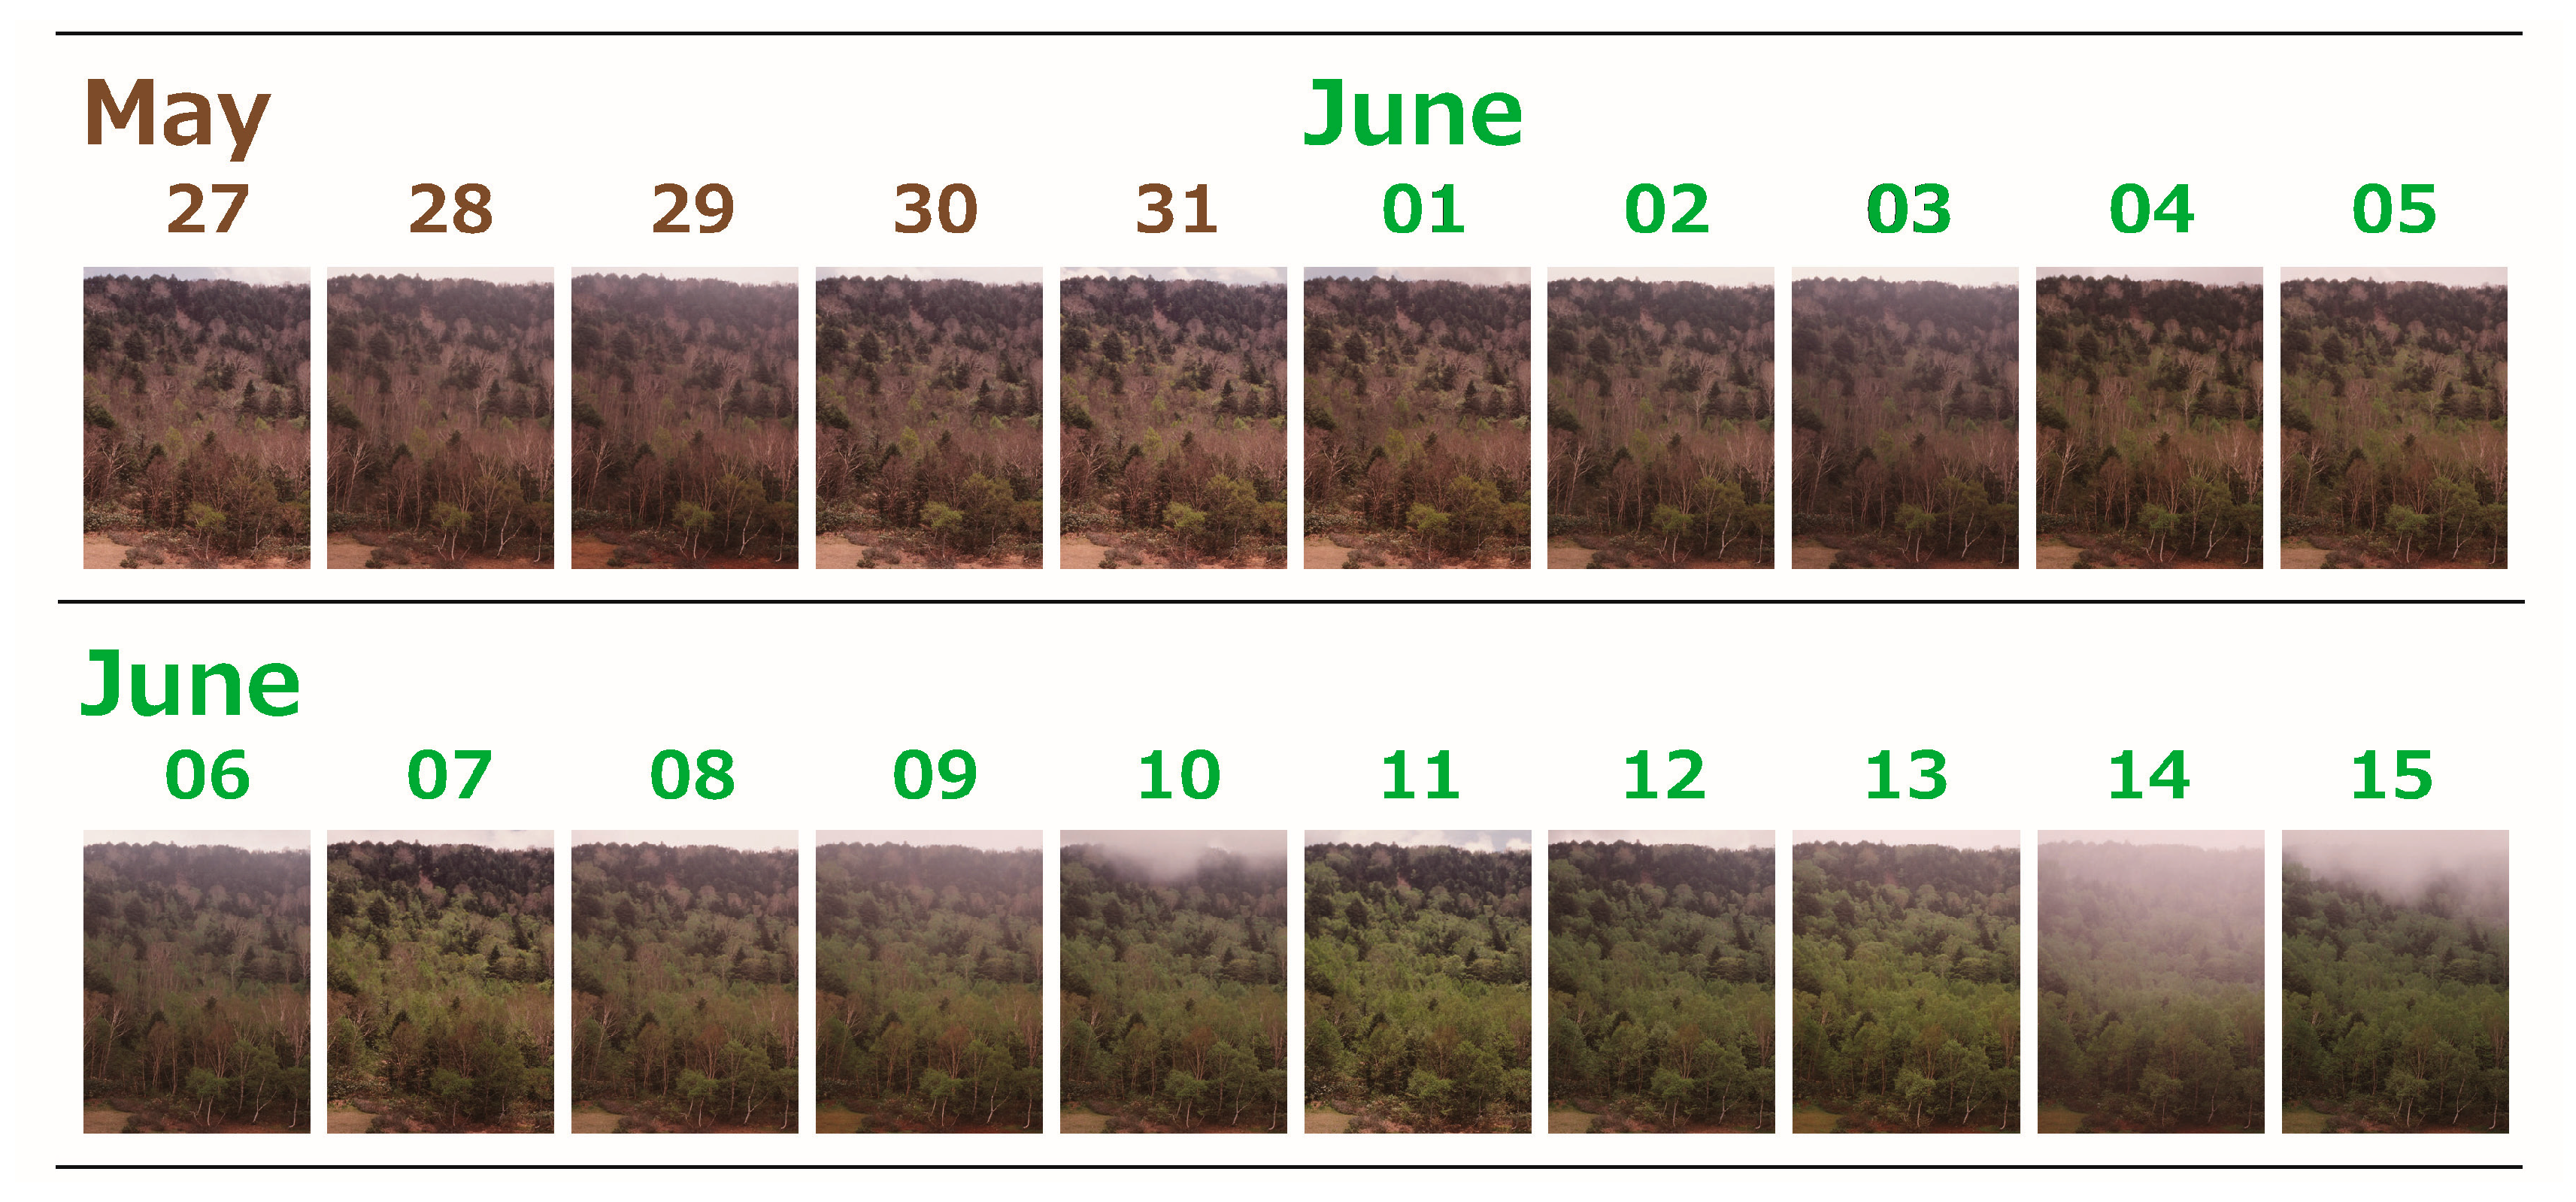
We used time-lapse images taken from 1987 to 2004 at the Nature Education Park (in Shiga Heights, Nagano prefecture, Japan; see
Figure 1 for examples of images). The images were taken automatically at around 11:30 a.m. each day throughout the year, and show both deciduous trees (e.g.,
Betula ermanii,
Betula platyphylla, and
Quercus crispula Blume) and evergreen trees (e.g.,
Tsuga diversifolia,
Thuja standishii, and
Abies mariesii). Since there is a precedent case in which phenology experts visually observed plant phenology using these images [
20], we considered their use appropriate in our research.
From 2005 onward, The Shiga Heights images were not taken owing to a system fault and absence of an administrator. Subsequently, in 2011, the Shiga Heights images became a part of the wider Cyberforest research project [
21]. Time-lapse imaging, which is controlled by the staff of the Cyberforest project team, was restarted from 2011, from the same location as the 1987 to 2004 series mentioned above. Currently, images are taken every 30 min, and then immediately made publicly available on the
Cyberforest for Environmental Education (CF4EE) website (
http://www.cf4ee.jp/), which also includes links to past image archives. The most recent image can be viewed live (
http://www.cf4ee.jp/otanomo_live); this page also provides a link to the image archive from 2011. Similar time-lapse images are also taken in other locations as part of the Cyberforest project. This includes the University of Tokyo Chichibu Forest (Saitama prefecture, Japan), which also provides time-lapse images appropriate for observing various aspects of tree phenology, from 1995 to the present. Students are therefore able to compare tree phenology between different locations, as well as through time.
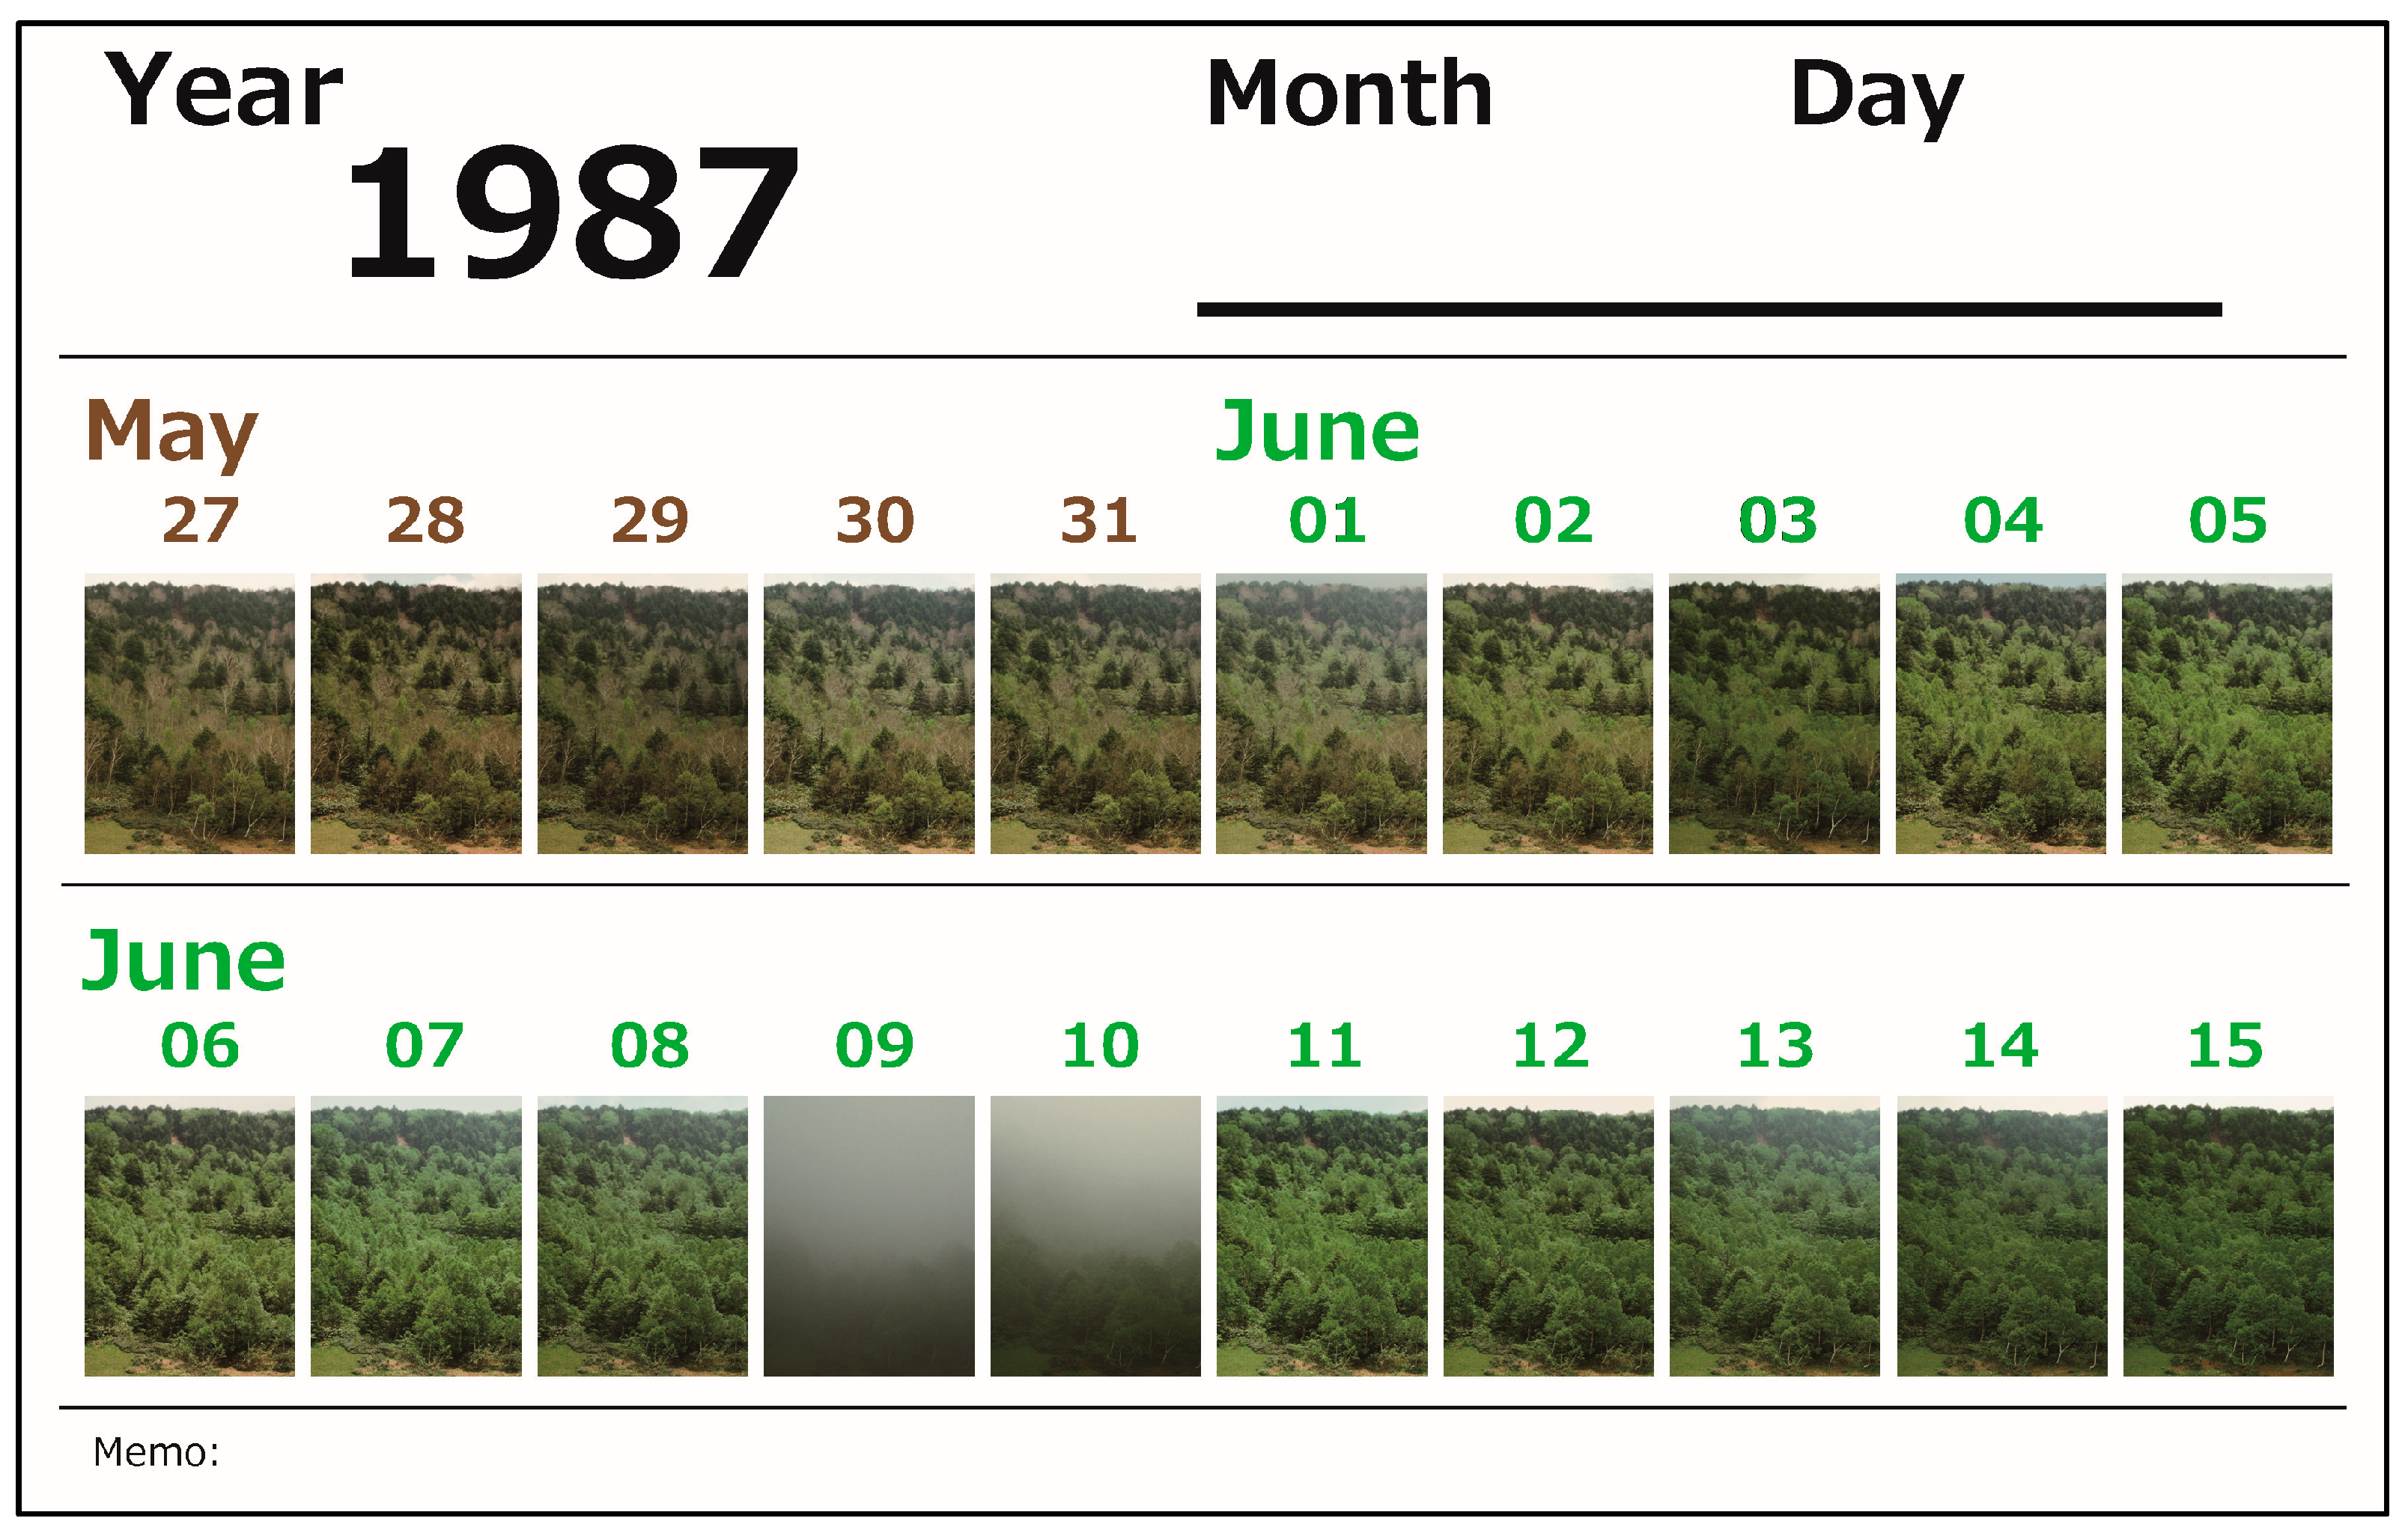
In our research, we used time-lapse images from the 1987 to 2004 series from Shiga Heights. On the CF4EE website, we released the images taken from 27 May to 15 June every year during which the deciduous trees in Shiga Heights open their leaves in an average year. Additionally, we also created and released observation sheets (see
Figure 2 for an example) for use in observing leafing phenology; these could be used immediately in schools. For this purpose, the images were trimmed so that a 20-day image set (from 27 May to 15 June, relating to a single year within the series) could be fitted onto a single A4 sheet.
2.2. Observations of Leafing Phenology by Students
In this research, we selected one junior high school (approximately 160 km airline distance from Shiga Heights) and one high school (approximately 125 km airline distance from Shiga Heights). A total of 208 junior high school students and 335 high school students observed leafing phenology in the classroom of their school using the observation sheets released on the CF4EE website. Each participating student observed leafing phenology related to a single year included in the 1987 to 2004 series. We distributed the observation sheets (
Figure 2) randomly between students. The students determined the leafing date according to the criterion of “the day when more than half of the deciduous trees have become green”, and recorded it on the observation sheet.
Both sessions lasted for approximately 5 min, as part of a lesson about Shiga Heights conducted by one of the authors. We set the 5 min timeframe to ensure that the exercise could be incorporated easily within the time-limited curriculum of schools, although it is preferable to spend more time explaining to students about the observation, if possible. After the 5 min observation period, the students were presented with examples of observations made by the authors. We explained to them that the data series from 1987 to 2004 was too short a period to be able to observe climate change trends, and that it is important to take and store time-lapse images for a longer period, such as 50 or 100 years.
2.3. Analysis of Observation Results by Students
In order to examine the adequacy of the observation results by the students, we compared them with an analysis of results based on the RGB color model of the time-lapse images, in which a vegetation green excess index of 2G-RBi was used [
10]. The 2G-RBi index was determined based on the pixel values for each image channel (R_
DN, G_
DN, B_
DN), extracted and averaged for each time-lapse image, calculated using the GD library (
https://www.libgd.org/) in the PHP (version 5.5) language:
Furthermore, we calculated the mean and sample variance for the leafing dates for each year determined by the students. There were no data for 1997, as no images were taken in this year at Shiga Heights. Furthermore, the 1998 data were excluded from the analysis because leafing in this year was much earlier than in other years included in the series, as it had a leafing date earlier than 27 May (the first day included on the observation sheet). The leafing date was represented in the calculations by the figure for the number of days after 1 May on which it was observed to occur in each year, e.g., leafing date of 5 June would be recorded as 36 days. Means and variances were calculated separately for the two groups of students (junior high, and high school), and also for a combination of both sets of students. In order to examine whether the observation result is influenced by students’ age, the difference in mean between the junior high school and high school students was tested by a Mann–Whitney U test, and the difference in variance between the two groups was tested using an F-test.
3. Results
3.1. Release of the Time-Lapse Images and Observation Sheets on the Internet
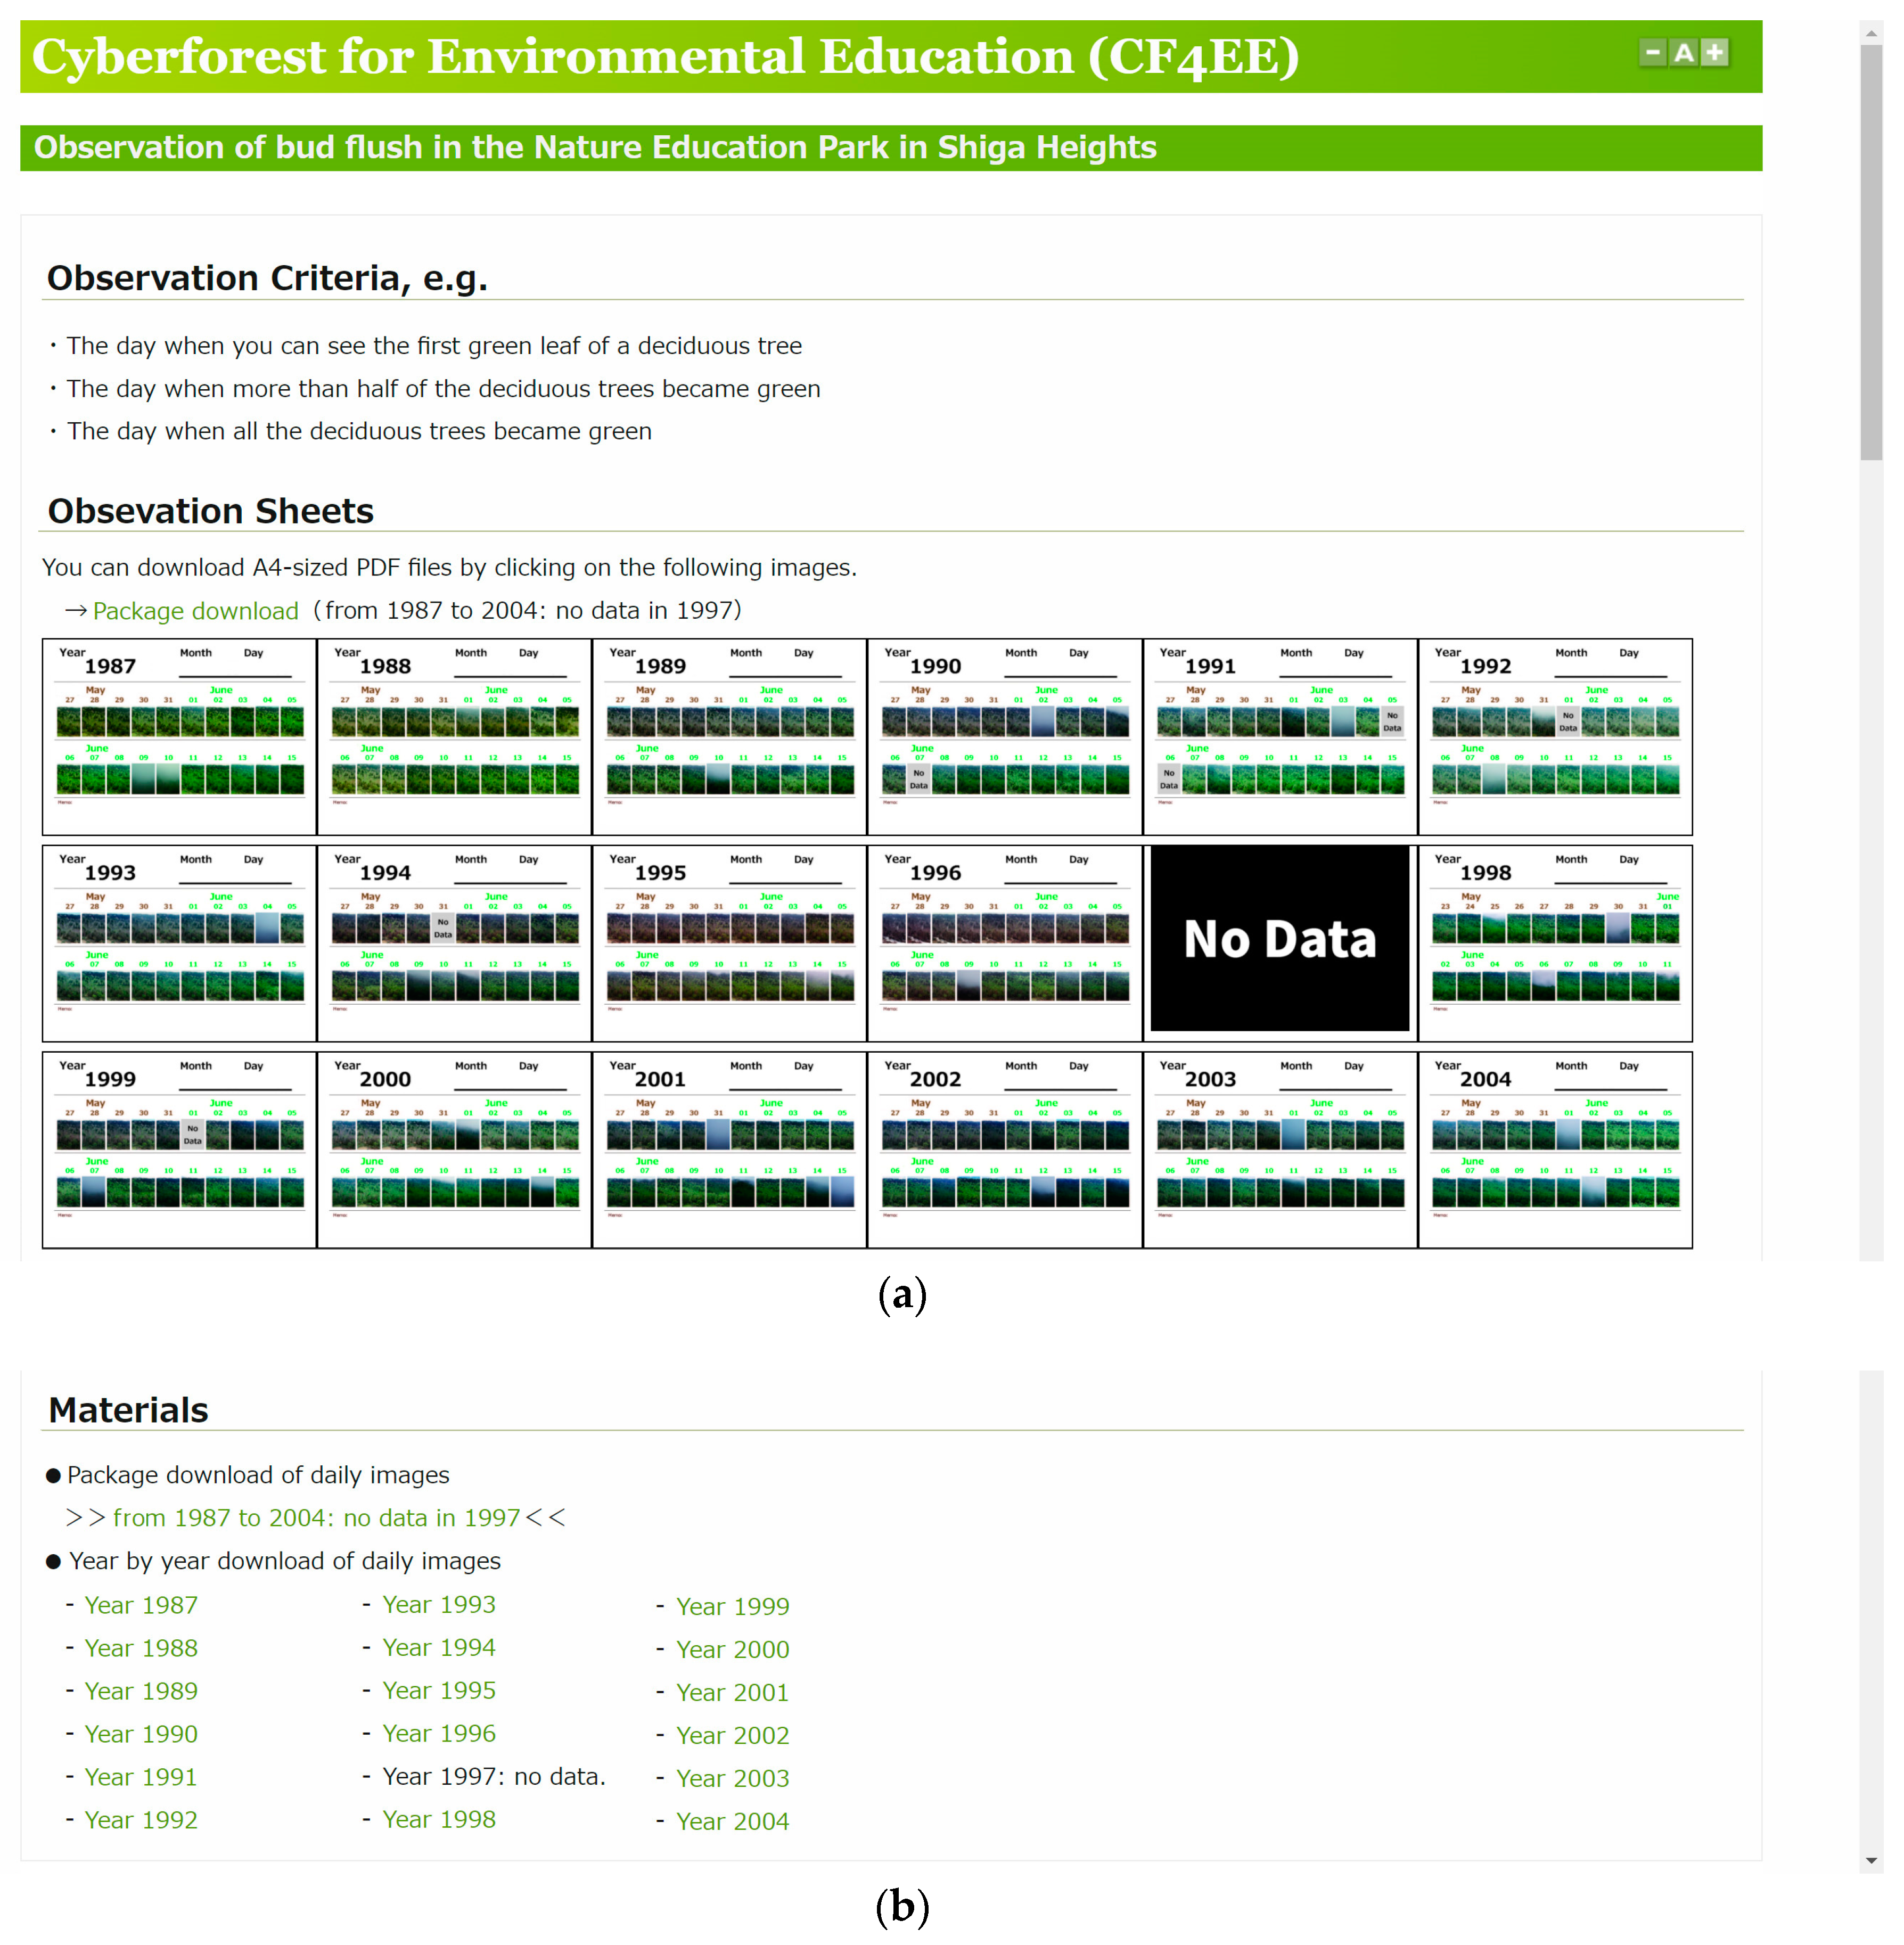
The time-lapse images from 1987 to 2004 (except 1997) from Shiga Heights and the observation sheets for recording leafing phenology at that location were released on the Internet (
http://www.cf4ee.jp/eeotanomo;
Figure 3 shows the website appearance). Users can download observation sheets from the website either individually or collectively in the form of A4-size PDF files, and time-lapse images by year or collectively in the form of JPEG files. A Creative Commons “Attribution-ShareAlike” license was applied to the contents.
3.2. Results of Observations by Students
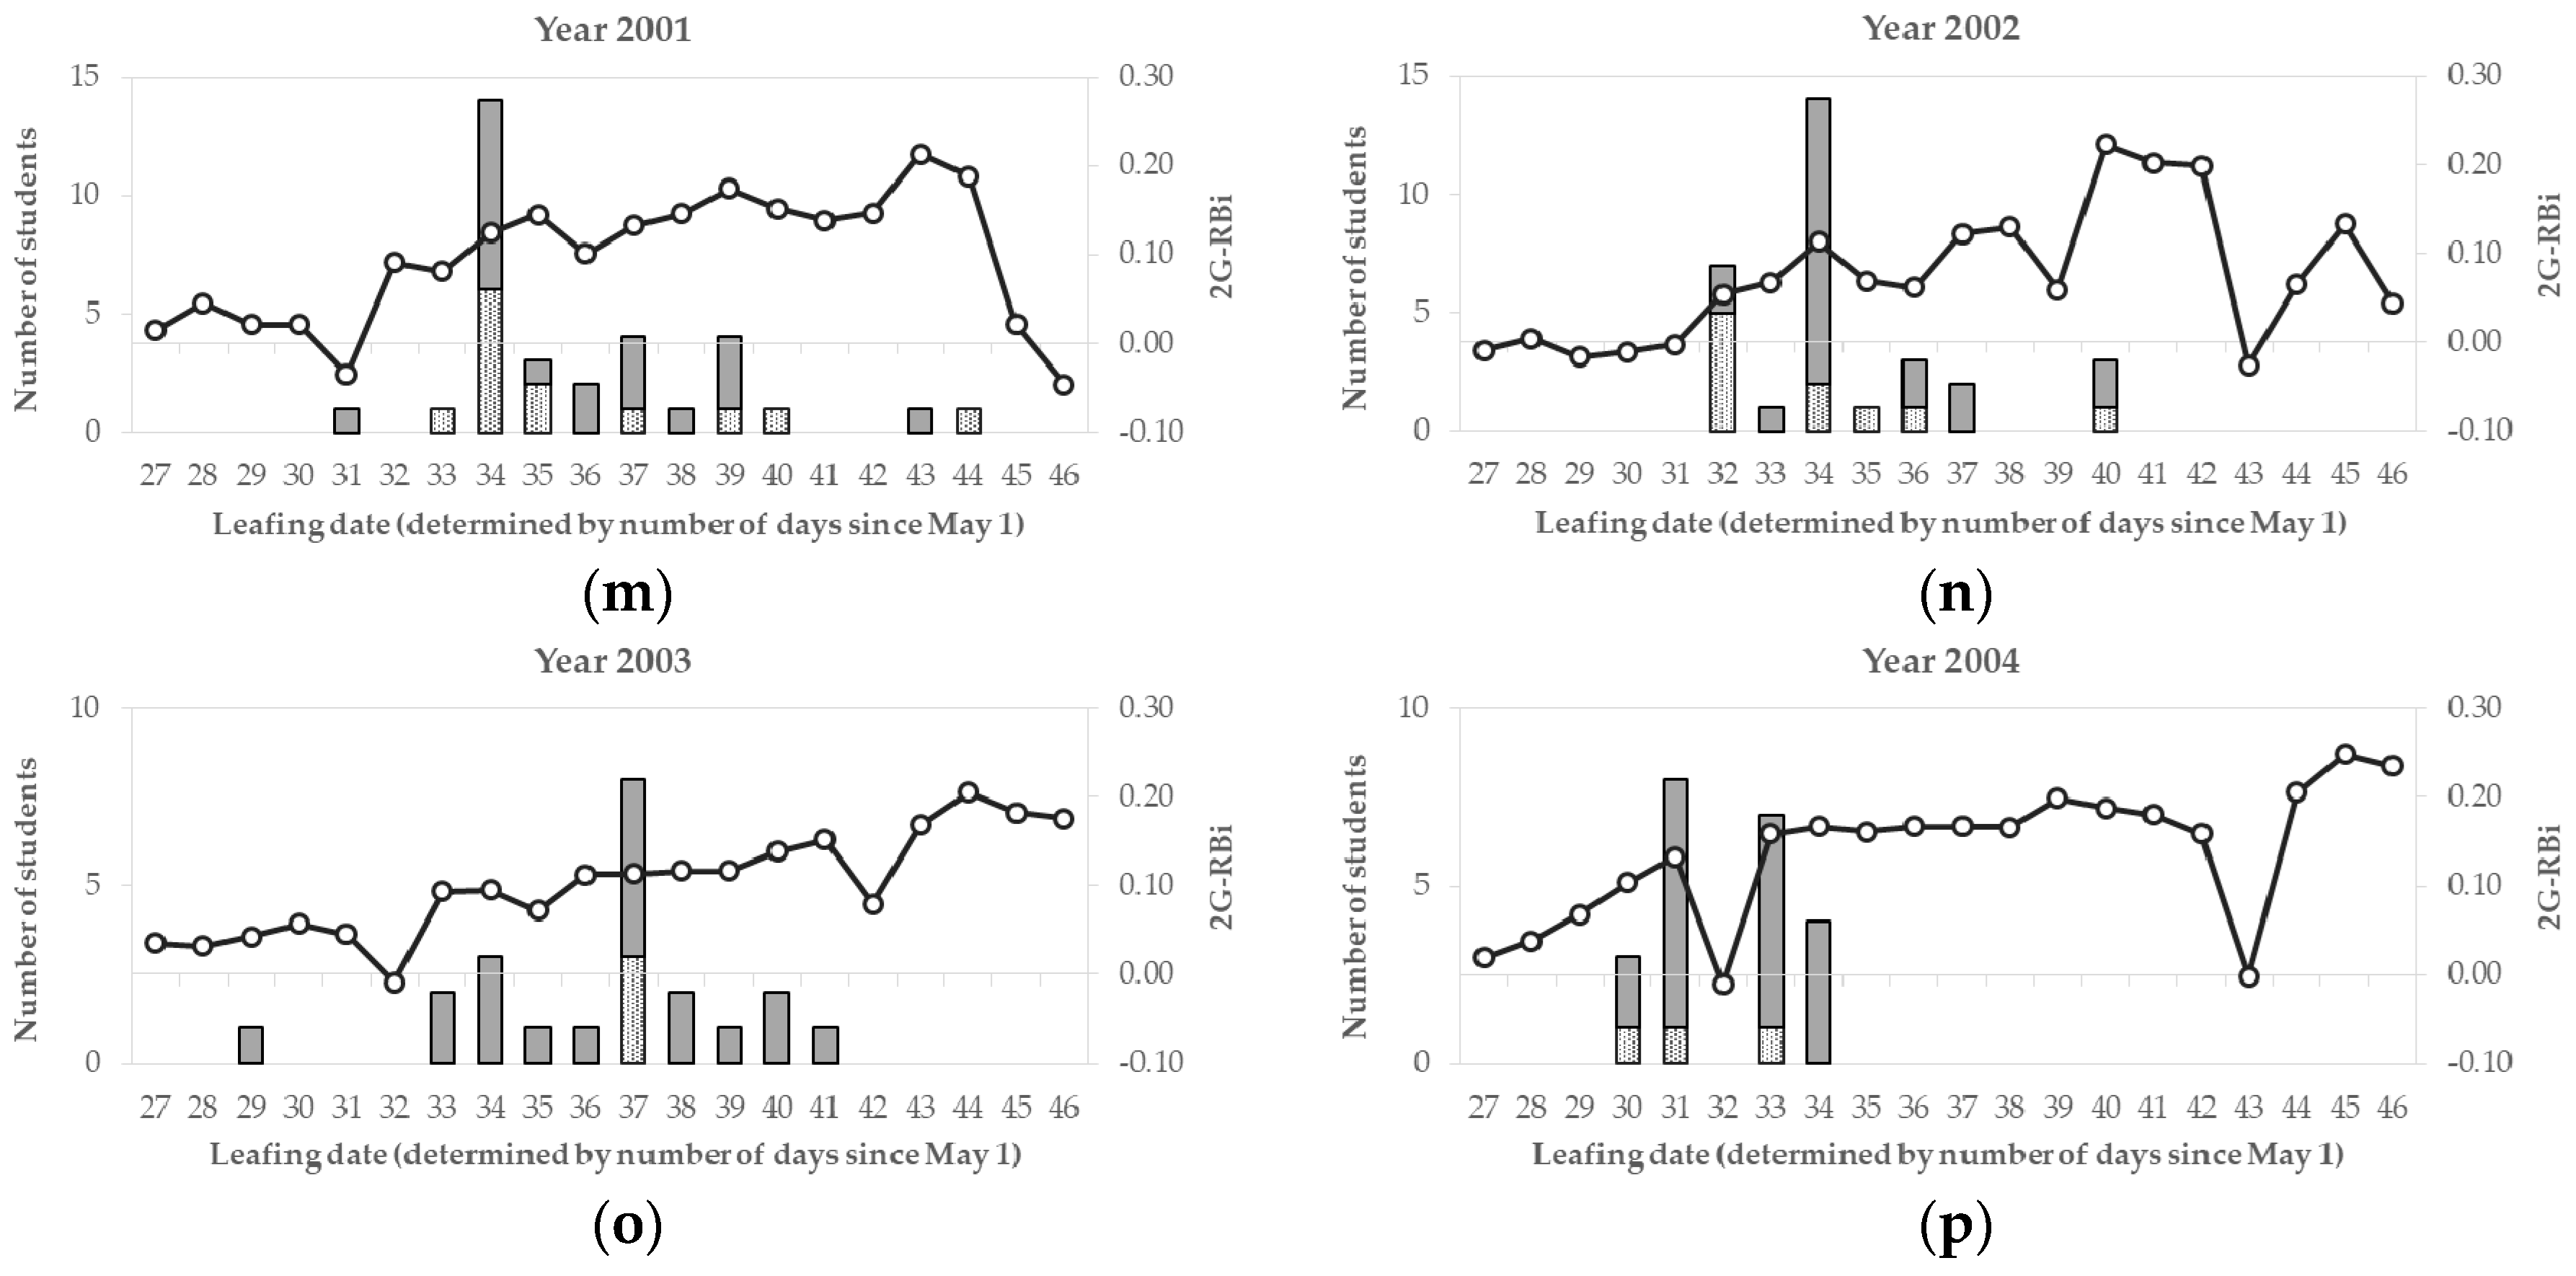
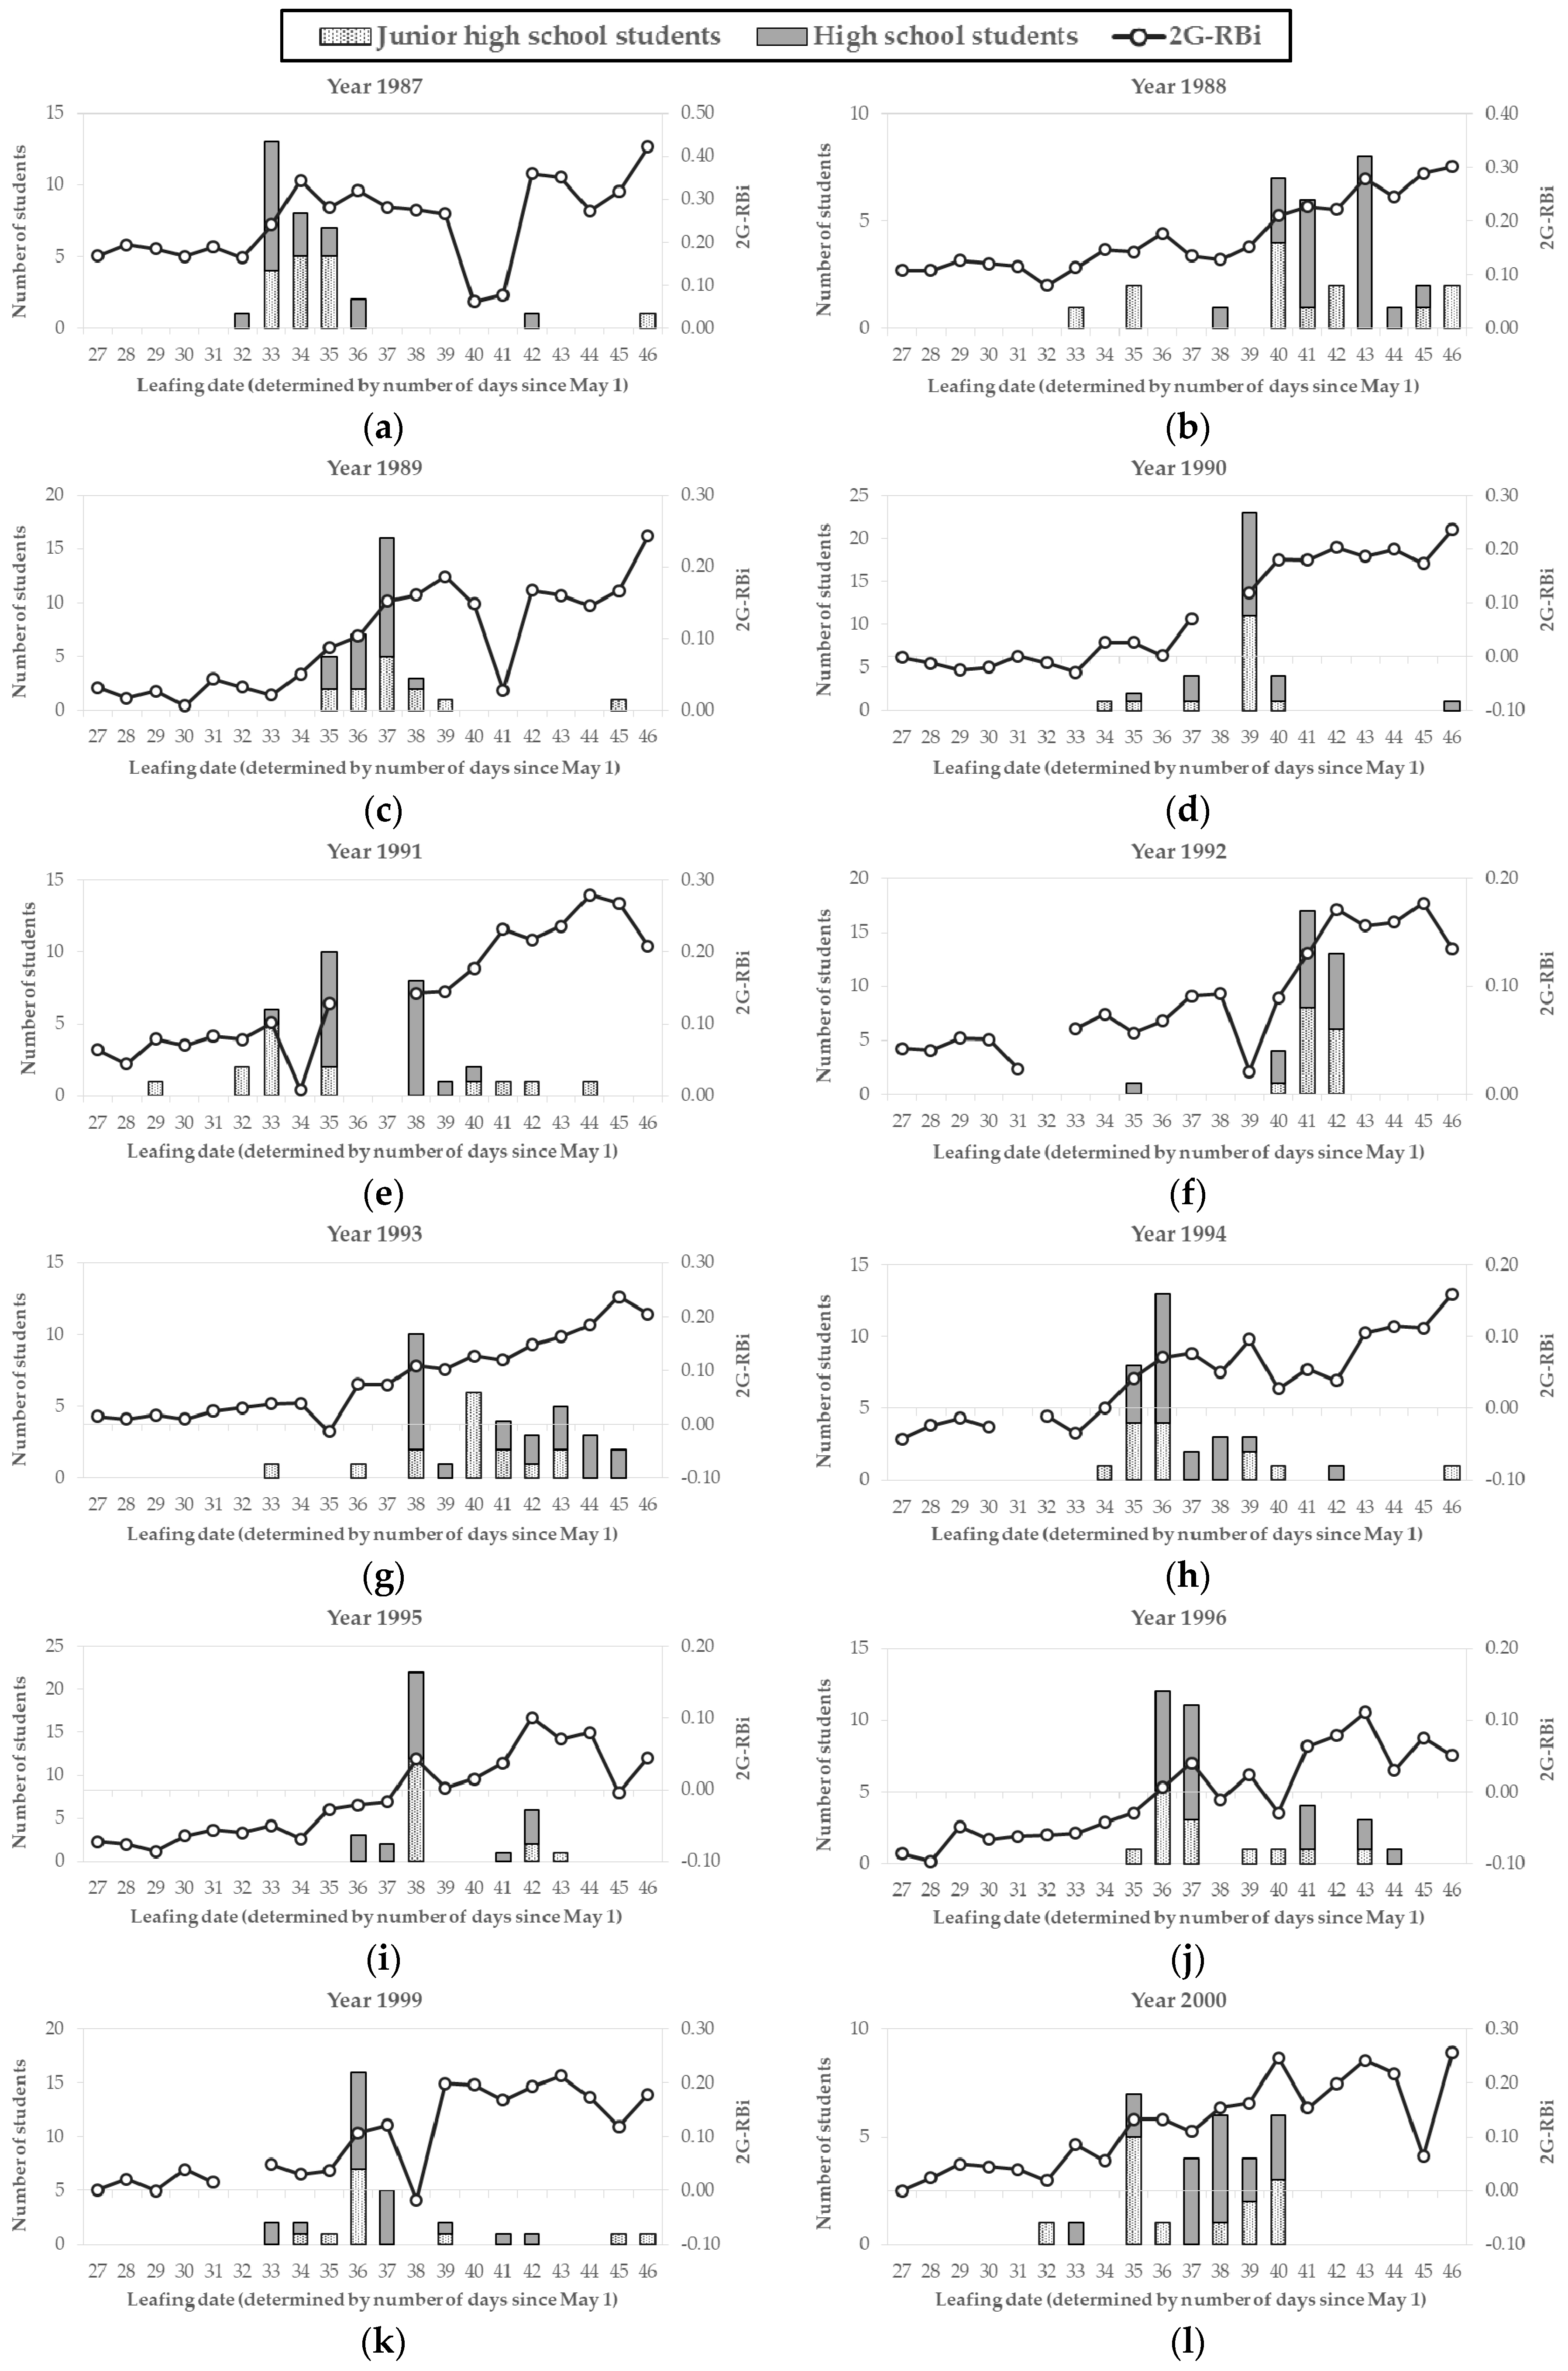
The leafing date observations determined by students and 2G-RBi analysis results are shown in
Figure 4. It is necessary to note that the 2G-RBi value decreases on cloudy, foggy, or rainy days. The mean and sample variance of the leafing dates determined by students are shown in
Table 1.
Years when the variance was small (in 1989, 1990, 1992, 2004 etc.) contained a period when the value of 2G-RBi rose within a short span of time, indicating a rapid advancement of leafing, with many students determining the leafing date to be within this period (cf.
Figure 4c,d,f,p). The small variance in 1995 was because many students determined two specific sunny days (7 June and 11 June) to be the leafing date (cf.
Figure 4i and
Figure 5). In the years when the variance was large, this is explained by either a slow rise in the value of 2G-RBi (in 1991, 1993, 2001, 2003 etc.; cf.
Figure 4e,g,m,o), or by some students having an insufficient understanding of the observation method (in 1987, 1999 etc.; cf.
Figure 4a,k).
In 1988, 1989, 1991, and 1992, the F-test revealed a significant difference (p = 0.01) in sample variance between junior high school and high school students. There was also a significant difference (p = 0.05) in sample variance in 1994 and 1999. In 1992, the results for high school students showed a larger variance, probably because one of the students in that group did not properly understand the observation method; the variance was therefore caused by individual error, and did not indicate a difference between the two student groups. In other years with significant differences, the junior high school students had a larger variance, suggesting that observing leafing phenology was somewhat difficult for this younger group of students. However, the Mann–Whitney U test revealed no significant difference in the mean values between junior high school and high school students in any year; the larger variances recorded for junior high school students compared to the high school students did not therefore affect the mean values.
4. Discussion
In making observations of leafing phenology, many students determined the leafing date to fall within the period in which the value of 2G-RBi rose. This suggests a certain level of adequacy for the observation results. It is at least sufficiently accurate for students to confirm that the leafing period varies from year to year, and is therefore useful as a trigger in considering the relationship with climate change. Some students did not however seem to have an adequate understanding of the methodology; this highlights that it is important for the supervising teacher to confirm whether individual students are using the observation method correctly, especially for younger students, and that a longer time than 5 min might be required for making the observations.
Making the observation sheets available on the Internet facilitates undertaking plant phenology observations in a school classroom setting. Preparation only involves printing A4-size PDF files in color, which can be easily implemented in many schools. When observations are carried out using the same method as described in this research, the time required is about 5–10 min, which can easily be incorporated within a lesson. It is also desirable for the teacher to present aggregated observation results to the participating students later, to complete the exercise. On the other hand, if more time can be secured, an even better learning opportunity would be provided if students can aggregate the observation results themselves, enabling them to have a more in-depth discussion of the use of phenology observation in determining leafing dates. In this latter case, it would be effective to print the observation sheets or individual time-lapse images released in this research in a larger format, so that multiple students can observe them at the same time.
In the present study, the educational outcomes of making plant phenology observations were not considered. However, the data series in Shiga Heights is definitely important for studies on the recent climate change, especially in 1998, as the extraordinary weather conditions seemed to alter the plant phenology during this year. Furthermore, it is also probably important to compare the results obtained during 1987–2004 with those obtained in the recent years (from 2011). In this way, our research indicated that using time-lapse imaging for plant phenology observations is feasible in education. The possibility of similar visualization methods promoting action in problem-solving has been previously highlighted [
22,
23]. In addition, the methods of the present study are contributive to the training requirement in the citizen science network that asks volunteers to identify phenology from photos captured by time-lapse cameras [
24]. By examining the educational outcomes from the viewpoints of both environmental education and citizen science, the importance of the role played by plant phenology observation using time-lapse images will be established.
Acknowledgments
This work was supported by JSPS KAKENHI Grant Numbers JP26750065, JP15H02722, and JP16K16304.
Author Contributions
Kazuhiko W. Nakamura conceived, designed and provided the experiments, analyzed the data, and wrote the paper. Ryuichi Watanabe, Akio Fujiwara, Kaoru Saito, Hill Hiroki Kobayashi, and Kaoru Sezaki contributed materials.
Conflicts of Interest
The authors declare no conflict of interest. The funding sponsors had no role in the design of the study; in the collection, analyses, or interpretation of data; in the writing of the manuscript; or in the decision to publish the results.
References
- Fortner, R.W.; Lee, J.-Y.; Corney, J.R.; Romanello, S.; Bonnell, J.; Luthy, B.; Figuerido, C.; Ntsiko, N. Public Understanding of Climate Change: Certainty and willingness to act. Environ. Educ. Res. 2000, 6, 127–141. [Google Scholar] [CrossRef]
- Hayden, M. Pedagogies of Empowerment in the Face of Climate Change Uncertainty. J. Act. Sci. Technol. Educ. 2011, 3, 118–130. [Google Scholar]
- Otieno, C.; Spada, H.; Liebler, K.; Ludemann, T.; Deil, U.; Renkl, A. Informing about climate change and invasive species: How the presentation of information affects perception of risk, emotions, and learning. Environ. Educ. Res. 2014, 20, 612–638. [Google Scholar] [CrossRef]
- Daniel, B.; Stanisstreet, M.; Boyes, E. How can we best reduce global warming? School students’ ideas and misconceptions. Int. J. Environ. Stud. 2004, 61, 211–222. [Google Scholar] [CrossRef]
- Shepardson, D.P.; Niyogi, D.; Choi, S.; Charusombat, U. Seventh grade students’ conceptions of global warming and climate change. Environ. Educ. Res. 2009, 15, 549–570. [Google Scholar] [CrossRef]
- Shepardson, D.P.; Niyogi, D.; Roychoudhury, A.; Hirsch, A. Conceptualizing climate change in the context of a climate system: Implications for climate and environmental education. Environ. Educ. Res. 2012, 18, 323–352. [Google Scholar] [CrossRef]
- McNeill, K.L.; Vaughn, M.H. Urban High School Students’ Critical Science Agency: Conceptual Understandings and Environmental Actions Around Climate Change. Res. Sci. Educ. 2012, 42, 373–399. [Google Scholar] [CrossRef]
- Menzel, A. Phenology: Its importance to the global change community—An editorial comment. Clim. Chang. 2002, 54, 379–385. [Google Scholar] [CrossRef]
- Sparks, T.H.; Menzel, A. Observed changes in seasons: An overview. Int. J. Climatol. 2002, 22, 1715–1725. [Google Scholar] [CrossRef]
- Richardson, A.D.; Jenkins, J.P.; Braswell, B.H.; Hollinger, D.Y.; Ollinger, S.V.; Smith, M.-L. Use of digital webcam images to track spring green-up in a deciduous broadleaf forest. Oecologia 2007, 152, 323–334. [Google Scholar] [CrossRef] [PubMed]
- Crimmins, M.A.; Crimmins, T.M. Monitoring plant phenology using digital repeat photography. Environ. Manag. 2008, 41, 949–958. [Google Scholar] [CrossRef] [PubMed]
- Graham, E.A.; Yuen, E.M.; Robertson, G.F.; Kaiser, W.J.; Hamilton, M.P.; Rundel, P.W. Budburst and leaf area expansion measured with a novel mobile camera system and simple color thresholding. Environ. Exp. Bot. 2009, 65, 238–244. [Google Scholar] [CrossRef]
- Ide, R.; Oguma, H. Use of digital cameras for phenological observations. Ecol. Inform. 2010, 5, 339–347. [Google Scholar] [CrossRef]
- Nijland, W.; Coops, N.C.; Coogan, S.C.P.; Bater, C.W.; Wulder, M.A.; Nielsen, S.E.; Mcdermid, G.; Stenhouse, G.B. Vegetation phenology can be captured with digital repeat photography and linked to variability of root nutrition in Hedysarum alpinum. Appl. Veg. Sci. 2013, 16, 317–324. [Google Scholar] [CrossRef]
- Brownlee, M.T.J.; Powell, R.B.; Hallo, J.C. A review of the foundational processes that influence beliefs in climate change: Opportunities for environmental education research. Environ. Educ. Res. 2013, 19, 1–20. [Google Scholar] [CrossRef]
- Bombaugh, R.; Sparrow, E.; Mal, T. Using GLOBE Plant Phenology Protocols To Meet the National Science Education Standards. Am. Biol. Teach. 2003, 65, 279–285. [Google Scholar] [CrossRef]
- Nolan, V.P.; Weltzin, J.F. Phenology for Science, Resource Management, Decision Making, and Education. Eos Trans. Am. Geophys. Union 2011, 92, 15. [Google Scholar] [CrossRef]
- Van Vliet, A.J.H.; Bron, W.A.; Mulder, S. Communicating phenology through education, outreach and training. In Proceedings of the Phenology 2012, Future Climate and the Living Earth, Milwaukee, WI, USA, 10–13 September 2012; p. 10. [Google Scholar]
- Dupigny-Giroux, L.-A.L. Exploring the Challenges of Climate Science Literacy: Lessons from Students, Teachers and Lifelong Learners. Geogr. Compass 2010, 4, 1203–1217. [Google Scholar] [CrossRef]
- Watanabe, R.; Ohokubo, A.; Ida, H. Effects of global warming on leaf phenology of Betula ermanii in Shiga Heights, central Japan. Bull. Inst. Nat. Educ. Shiga Heights Shinshu Univ. 2006, 43, 13–16. [Google Scholar]
- Saito, K.; Nakamura, K.; Ueta, M.; Kurosawa, R.; Fujiwara, A.; Kobayashi, H.H.; Nakayama, M.; Toko, A.; Nagahama, K. Utilizing the Cyberforest live sound system with social media to remotely conduct woodland bird censuses in Central Japan. Ambio 2015, 44, 572–583. [Google Scholar] [CrossRef] [PubMed]
- Nicholson-Cole, S.A. Representing climate change futures: A critique on the use of images for visual communication. Comput. Environ. Urban Syst. 2005, 29, 255–273. [Google Scholar] [CrossRef]
- Wibeck, V. Enhancing learning, communication and public engagement about climate change—Some lessons from recent literature. Environ. Educ. Res. 2014, 20, 387–411. [Google Scholar] [CrossRef]
- Kosmala, M.; Crall, A.; Cheng, R.; Hufkens, K.; Henderson, S.; Richardson, A. Season spotter: Using citizen science to validate and scale plant phenology from near-surface remote sensing. Remote Sens. 2016, 8, 726. [Google Scholar] [CrossRef]
© 2018 by the authors. Licensee MDPI, Basel, Switzerland. This article is an open access article distributed under the terms and conditions of the Creative Commons Attribution (CC BY) license (http://creativecommons.org/licenses/by/4.0/).

 ,
, 


