Prediction of Reservoir Sediment Quality Based on Erosion Processes in Watershed Using Mathematical Modelling


1
Faculty of Civil Engineering, Institute of Environmental Engineering, Technical University of Košice, 042 00 Košice, Slovakia
2
Faculty of Civil Engineering, Institute of Construction Technology and Management, Technical University of Košice, 042 00 Košice, Slovakia
*
Author to whom correspondence should be addressed.
Environments 2018, 5(1), 6; https://doi.org/10.3390/environments5010006
Submission received: 30 November 2017
/
Revised: 25 December 2017
/
Accepted: 27 December 2017
/
Published: 29 December 2017
(This article belongs to the Special Issue Advances in Environmental Engineering)
Abstract
:Soil erosion, as a significant contributor to nonpoint-source pollution, is ranked top of sediment sources, pollutants attached to sediment, and pollutants in the solution in surface water. This paper is focused on the design of mathematical model intended to predict the total content of nitrogen (N), phosphorus (P), and potassium (K) in bottom sediments in small water reservoirs depending on water erosion processes, together with its application and validation in small agricultural watershed of the Tisovec River, Slovakia. The designed model takes into account the calculation of total N, P, and K content adsorbed on detached and transported soil particles, which consists of supplementing the soil loss calculation with a determination of the average nutrient content in topsoils. The dissolved forms of these elements are neglected in this model. Validation of the model was carried out by statistical assessment of calculated concentrations and measured concentrations in Kľušov, a small water reservoir (Slovakia), using the t-test and F-test, at a 0.05 significance level. Calculated concentrations of total N, P, and K in reservoir sediments were in the range from 0.188 to 0.236 for total N, from 0.065 to 0.078 for total P, and from 1.94 to 2.47 for total K. Measured nutrient concentrations in composite sediment samples ranged from 0.16 to 0.26% for total N, from 0.049 to 0.113% for total P, and from 1.71 to 2.42% for total K. The statistical assessment indicates the applicability of the model in predicting the reservoir’s sediment quality detached through erosion processes in the catchment.
1. Introduction
Soil erosion, as a significant contributor to nonpoint-source pollution, is ranked the top of sediment source [1], pollutants attached to sediment [2], and pollutants in the solution of surface water [3].
Worldwide, soil erosion by water affects 1094 million hectares of arable land [4]. Across Europe, data on trends in soil erosion are lacking and erosion estimates are based on modelling studies. In the 1990s, water erosion affected 105 million hectares of soil or 16% of Europe’s total land area (excluding Russia) [5]. In 2006, it was estimated that the surface area affected by water erosion in the EU-27 was 130 million hectares [6]. In 2014–2015, approximately 11.4% of the EU territory was affected by moderate to high level water erosion rate (more than five tons per hectare per year). The reduction of this rate against 1990s by 4.6% is mainly due to the application of water erosion control practices which have been applied during the last decade in the EU [7].
A significant amount of global sediment flux is retained in reservoirs [8]. It is estimated that the global annual loss in storage capacity of the world’s reservoirs due to sediment deposition is approximately 0.5–1% [9], and for individual reservoirs these values can be as high as 4–5% [10]. The useful lifetime of the reservoirs is thus reduced to only 22 years on average [11]. Other studies found in the literature [12,13] have reported that worldwide rivers carry approximately 15 billion tons of sediments to the sea annually. Walling and Webb [14] have given an overview of mean annual total suspended sediment transport to the oceans that ranged from 8 to 51 billion tons of sediments.
Together with the small fraction of sediment, pollutants including nutrients are transported via surface runoff [15] from arable land in the catchment [16] and are deposited in reservoirs [17]. The quantity of nutrient concentrations in water reservoir sediments, associated with nonpoint source pollution from agricultural catchments, is regarded as the environmental pollution index. As published by Qian et al. [18] the easier transformation of nitrogen and phosphorus from agricultural soils to freshwater bodies contributes to their accelerated eutrophication. Nutrient concentrations in runoff are affected by many factors including climate, soil characteristics, relief, land use, and chemical application [19]. Typically, the eroded soils contain about three times more nutrients per unit weight than are left in the remaining soil [20]. Pimentel and Burgess [21] summarized, that a ton of fertile topsoil averages 1 to 6 kg of nitrogen, 1 to 3 kg of phosphorus, and 2 to 30 kg of potassium, whereas the topsoil on the eroded land has an average nitrogen content of only 0.1 to 0.5 kg per ton. As reported in literature [22,23], sediments act as an efficient trap for both nutrients (nitrogen and phosphorus). For example, sediments from Gulf of Finland trap 20–50% of P and 40–65% of N in the Neva estuary and in the open Gulf, and up to 100% in the Neva Bay are buried within the accumulating sediment. The rest is released to the overlying water [22]. Similarly, [23] showed that finer sediment particles (silt and clay) transported by rivers carry the major part of nutrient loads by absorption and thus, sediment settling can remove nutrients from the water column. On the other hand, the sediment accumulation in Iron Gate reservoir (Romania) on the Danube River corresponded to 5% of total nitrogen and 12% of total phosphorus of the incoming loading [24].
In order to protect surface water resources and optimize their use, soil and nutrient losses from catchment areas must be controlled [25] and minimized [26]. Conventional methods to assess soil erosion [27] and sediment-associated chemical runoff are expensive, time-consuming, and need to be collected over many years [28,29]. Nowadays, preference is given to predict [30] and control sediment and nutrient yields from agricultural nonpoint source runoff using mathematical models [31]. Soil erosion models can assess and simulate the extent and magnitude of erosion processes in watershed. To predict soil erosion rates by water, several models exist which differ greatly in terms of complexity, inputs, and spatial and temporal scale [32]. Most have been developed for large agricultural areas and are designed to predict annual rates of soil loss from land under various cropland and rangeland management techniques [33,34]. To estimate sediment yields into small reservoirs, regression models can also be used. Most of these models are site-specific and do not permit the land and water managers to assess the impact of agronomic and mechanical changes on sediment yields [35] much less on sediment quality. Thus, there is a pressing need to extend such models to provide sediment quality prediction by integrating already available research methods with new generalization and integration techniques. Better predicting of small water reservoirs’ sediment quantity and quality is necessary, of all things, with regard to utilization or application of dredged sediment from water reservoirs [36,37].
The objective of this study is to design a mathematical model intended to predict the total content of nitrogen, phosphorus, and potassium in bottom sediments in small water reservoirs, with its application and validation in the small agricultural watershed of the Tisovec River, Slovakia. Specification of sediment quality in the reservoir depending on the main periods of the cropping cycle and distribution of erosivity during a year is the novelty of this article. Also, an average plant nutrient uptake for chosen crops divided into five crop-stage periods during growing season was devised.
2. Materials and Methods
2.1. Study Area
A prediction model was designed on the basis of the nutrient transport study carried out in the small agricultural catchment of the Tisovec River (northeast of Slovakia, the district of Bardejov) covering an area of 6.0 km2. The catchment falls into the drainage basin of the Topl’a River. The average annual air temperature is 8 °C and the average annual rainfall is about 670 mm with a maximum in the summer months. Planosols, cambisols, and albic luvisols are the dominant major soil groups of the Tisovec basin with the presence of medium-textured soils (sandy loam). Non-point sources of pollution from agricultural production areas are the leading cause of the sediment and water quality degradation in this catchment. Different land uses occur within the catchment.
The upper and middle zone of the catchment consists mainly of forests (39.2%) and pastures (21.7%), 21.4% of downstream areas are covered with agricultural land. The rest of the catchment is for other uses.
For irrigation of surrounding agricultural land and accumulation of water, the Kl’ušov small water reservoir with total capacity of 72,188 m3 was built in the Tisovec River in 1986. At present, it is also used for retention of high water, suburban recreation, and as a fishery. It has a surface area of 2.2 ha, a length of about 494 m, and a mean depth of 3.5 m. At the dam, the reservoir reaches a maximum water depth of 9.57 m [38].
Because of the rough terrain, climatic conditions, and soil types, this catchment is exposed to water erosion. Eroded soil particles in this catchment greatly affect the quantity and quality of sediments in the Kl’ušov reservoir. This reservoir trapped approximately 24,500 m3 of sediments delivered from the upper catchment during 19 years of its operation and its total storage capacity decreased by about 33% [38].
2.2. Sampling Procedure and Chemical Analysis
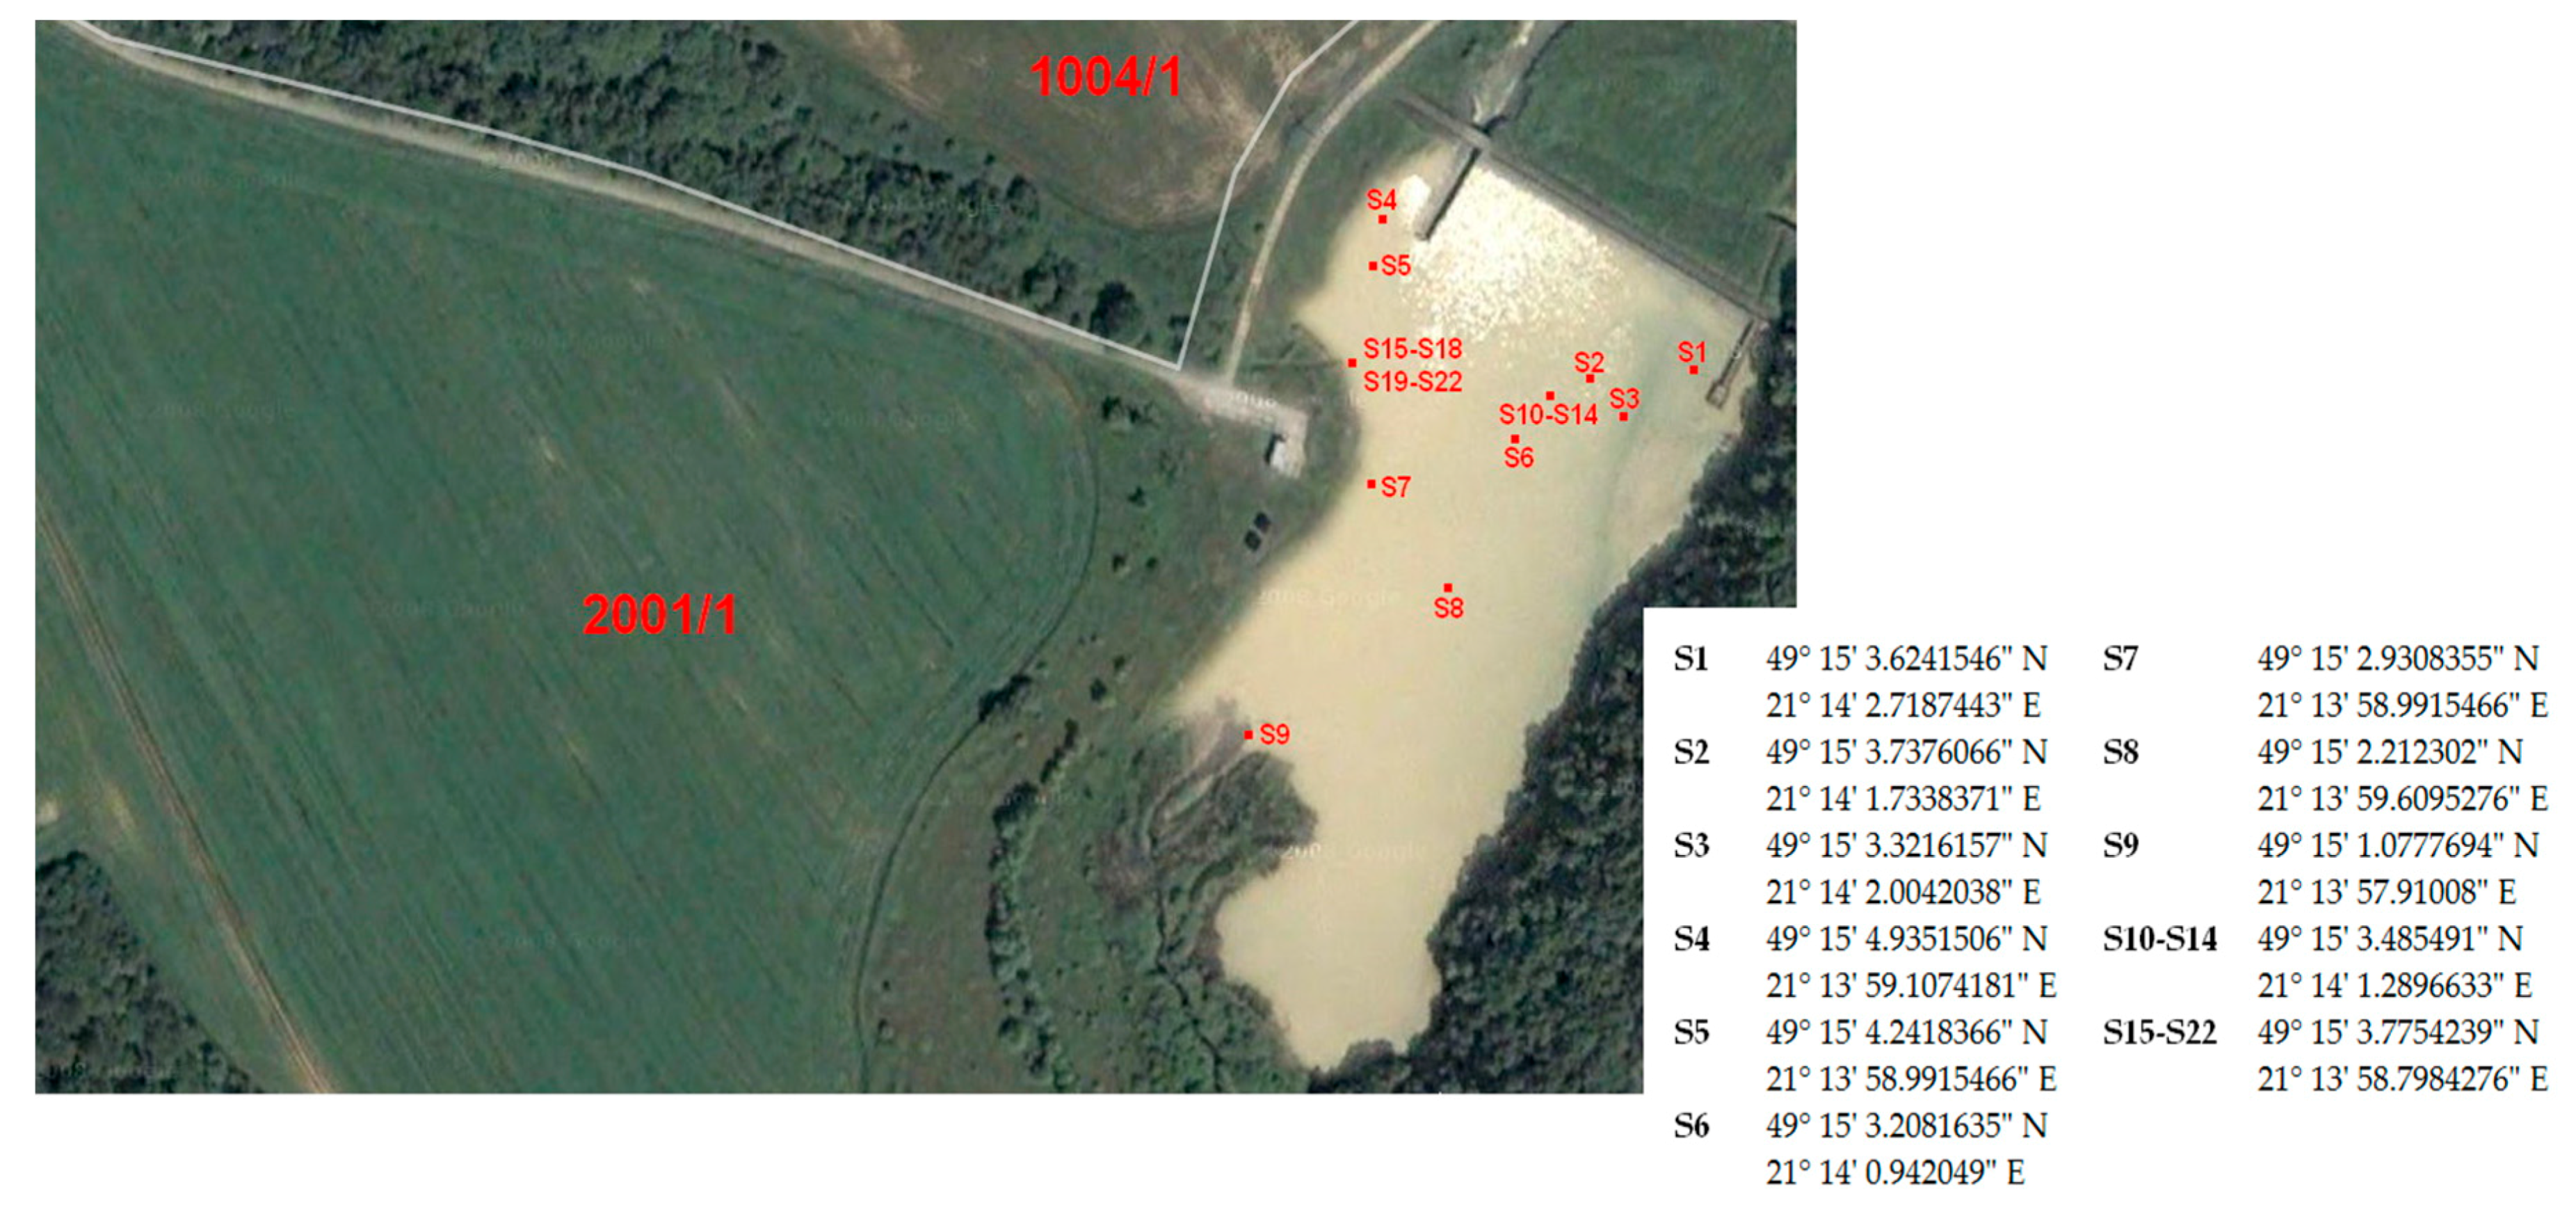
To determine the total N, P, and K content in eroded soil particles, soil samples were collected from two parcels (1004/1 and 2001/1) of arable land situated next to the reservoir (Figure 1). Within each parcel, about 30 to 40 soil subsamples were taken and mixed into one composite sample. Considering the fact that the highest nutrient levels occur in the surface layers, sampling depth was set at 0.30 m [39].
Together with soil sampling, 21 composite (disturbed) reservoir sediment samples were taken from the drained reservoir to determine total N, P, and K content. Sampling methodology was as follows. Part of the composite sediment samples were taken from a location in proximity to the dam due to deposition of fine-grained particles (<63 µm) washed away through water erosion and preferentially attaching the nutrients [40]. Other samples were collected along the reservoir and others in different sampling depths from one location. A S9 sample was taken from the Tisovec stream.
Composite soil and sediment samples were collected in buckets; the weight of the composite samples was about 3 kg for sediment and 5 kg for soil. In laboratory conditions, the samples were air dried at room temperature, any coarse lumps were crushed and samples were homogenized.
Adsorbed forms of nutrients in soil and sediment samples were determined for total nitrogen content by elemental analysis (LECO CHN628) and for total phosphorus and potassium using an inductively coupled plasma-atomic emission spectrometry technique (Agilent 5100 ICP-OES).
To determine the amount of dissolved N and P in soil samples, laboratory leaching experiments were conducted. Leachates were prepared in a 1 to 10 proportion of soil sample to distilled water. After 24 h, leachates were subsequently filtered and total N and P contents were determined using a DR 890 (Hach Lange) portable colorimeter.
2.3. Model
The model works on the calculation of total nutrient (N, P, and K) concentrations in detached eroded soil particles in dissolved and adsorbed form of these elements.
Calculation of total N, P, and K in adsorbed form consists of supplementing the soil loss calculation with a determination of the average nutrient content in topsoils.
Soil loss from arable land is computed using the Universal Soil Loss Equation (USLE) [41] which is expressed as
where Gr,i is the potential long term average annual soil loss (tons per hectare per year); R is the rainfall erosivity factor in MJ ha−1 cm h−1; K is the soil erodibility factor in t ha h ha−1 MJ−1 mm−1; L, S is the topographical factor; Cr,i is the average plant cover factor in i-year calculated as a sum of divided Ci factors; and P is the support practice factor. The generalized plant cover (C) factor values resulting from the USLE are specified and modified by their dividing into five crop-stage periods (Ci) according to Wischmeier and Smith [41] (seedbed preparation, establishment, development, maturing crop, stubble field) to take into account the height of plant cover from the ground [42] and annual rainfall distribution. To compute Cr,i, partial Ci factor is weighted according to distribution of erosivity during a year.
The calculation of average nutrient concentrations in topsoils is expressed by deducting nutrient input from fertilizer use from plant nutrient uptake (output). As in soil loss calculation, even in this case, the calculation is divided into five crop-stage periods.
Finally, the total N, P, and K content in transported soil particles from arable land to reservoir is calculated through the modification of the average N, P, and K concentrations in eroded soil particles in adsorbed form detached through water erosion by sediment enrichment ratio (SER) [43] using the proposed equation
where CX is an average annual concentration of total N, P, K in transported soil particles from the studied parcel (kg N,P,K ha−1 or mg N,P,K kg soil−1); Gi is partial soil loss in individual crop-stage periods (t ha−1); Gr,i is an average soil loss from parcel in i-year (t ha−1 year−1); Xi is residual concentration of total N, P, K in soil in i-period (kg N,P,K ha−1). The total concentrations of N, P, K in reservoir bottom sediments are computed as a weighted mean of the calculated average annual concentration of total N, P, K in transported soil particles from parcels in the watershed.
2.4. Statistical Methods
The validation of the proposed prediction model was carried out via a statistical assessment of the total N, P, and K concentrations in reservoir sediments calculated during the 10-year crop rotation system and determined nutrient concentrations in the Kl’usov small water reservoir.
It is natural to suppose that the random variables CXy—representing pertinent concentrations with X being N, P, or K, and y being either v for the values calculated by the proposed model or m for the measured data—exhibit a lognormal distribution. Thus the data should be logarithmically transformed.
In order to infer the proposed distribution a conformity test can be performed. The inference about the normality can be done using the Shapiro–Wilk (SW) test [44] for the transformed data. The hypothesis H0: CXy ~ (μ(CXy),σ2(CXy)) is tested with respect to the alternative H1: CXy ~ non (μ(CXy),σ2(CXy)). The test statistic W for the used test is given as
where the values in a pertinent dataset are denoted xi the parameters of the test ai are obtained from the table data for the SW test [45], which in the present case of n = 20 samples are
ai = −a21−i, i = 1, 2, … 10, a11 = 0.0140, a12 = 0.0422, a13 = 0.0711, a14 = 0.1013, a15 = 0.1334, a16 = 0.1686, a17 = 0.2085, a18 = 0.2565, a19 = 0.3211, a20 = 0.4734.
The critical value for the test statistic with a significance level 0.05 is Wcrit = 0.905. If W is less than Wcrit, the null hypothesis is rejected.
If, as assumed, the normality is not rejected at the 0.05 significance level, the random variables’ means for each element can be compared—i.e., the calculated v and measured m—using the two-sample t-test (with the hypotheses H0:μv = μm vs. H1:μv ≠ μm), while for a comparison of the variances the two-sample F-test (with the hypotheses H0:σv2 = σm2 vs. H1:σv2 ≠ σm2) is applied [46,47]. In all the cases, the significance level is set to the value 0.05. The parameters μ and σ are estimated by the sample mean đx̄ and sample standard deviation S, respectively.
3. Results and Analysis
3.1. Field Measurements
Chemical analyses showed that measured N, P, and K concentrations in collected average soil samples from parcel 1004/1 ranged from 0.11 to 0.22% for total N, from 0.055 to 0.082% for total P, and from 1.72 to 1.91 for total K depending on collection period (different rates and date of fertilizer application, plant cover, crop uptake rates). Determined (measured) concentrations in soil samples from parcel 2001/1 ranged from 0.12 to 0.23% for total N, from 0.049 to 0.065% for total P, and from 1.67 to 1.85 for total K.
Measured N, P, and K concentrations in composite sediment samples are given in Table 1.
3.2. Model
The dissolved concentrations of total N and P in solution from soil samples were very low (at levels 0.22–0.43% of total N and 0.45–0.86% of total P) and therefore the dissolved forms of the following elements were neglected in this model.
The proposed model takes into account the calculation of total N, P, and K content adsorbed on detached and transported soil particles via water erosion.
The individual factors entering the equation are as follows. For the whole investigated territory (Bardejov district), it is considered with the constant value of factor R = 22.43 MJ ha−1 cm h−1 derived by Malisek [48]. K factor data is determined considering the soil texture in watershed and range from 0.25 to 0.40 t ha h ha−1 MJ−1 mm−1. LS factor is determined for each outflow profile. The average Cr,i values calculated are 0.25 for winter oilseed rape, 0.27 for triticale, 0.57 for corn silage, 0.17 for winter wheat, and 0.31 for spring barley. The P values are set at 1.0.
Based on the determination of a ‘divided’ Ci factor, partial soil loss Gi in individual crop-stage periods from studied parcels (1004/1 and 2001/1) are calculated and the results are given in Table 2 and Table 3. Average annual soil loss ranged from 1.9 to 17.7 t ha−1 year−1 from 1004/1 parcel and from 5.34 to 27.7 t ha−1 year−1 for 2001/1 parcel according to used crop and management practices during the season. However, long term average annual soil loss is 8.3/14.3 t ha−1 year−1 from 1004/1; 2001/1 parcels depending on the crop and parcel length and slope gradient.
In terms of land management, the Tisovec River catchment falls under the authority of the Kľušov agricultural cooperative and all parcels within the catchment, with similar topographical and soil characteristics, are managed in a similar way. Consequently, calculations of total N, P, and K concentrations in eroded soil particles in adsorbed form are realized for the same (two) parcels of arable land situated next to the Kľušov reservoir.
Information about nutrient inputs is provided by the agricultural cooperative in the studied area. The fertilizers used in the watershed are primarily NPK fertilizers (8.5% or 15% N) and ammonium nitrate (27% N). Data about plant nutrient uptake are calculated according to the average yield in the Tisovec catchment’s area and the mean plant nutrient uptake values provided by The Central Control and Testing Institute in Agriculture. For crops commonly grown in our conditions, partial (divided into five periods) and average plant nutrient uptake during the crop-stage periods was designed (Table 4).
The total N, P, and K content in transported soil particles from arable land to reservoir is calculated. The background concentrations of the modelled elements in topsoils from parcels 1004/1 and 2001/1 were 0.16/0.18% for N, 0.068/0.054% for P, and 1.81/1.80 for K. The values of SER ranged from 0.97 to 1.63 depending on an average soil loss from parcels in i-year.
Finally, the total nutrient contents in reservoir sediments CXv (Table 5) are then computed as a weighted mean of the calculated average annual total nutrient concentrations in transported soil particles from investigated parcels. The area of 1004/1 parcel is 15.63 ha and 2001/1 parcel area is 18.46 ha.
3.3. Statistical Tests and Interpretation
Calculated concentrations of total N, P, and K in reservoir sediments (CXv) were compared with chemical analyses obtained from collected average sediment samples (CXm).
First, the SW test is used to surmise the normality of the distributions. The SW test statistic W (4) is calculated for each set of the logarithmic data. The results are summarized in Table 6, where also the comparison with critical value set at a 0.05 Wcrit significance level is introduced. In each case, the null hypothesis of the SW test is not rejected so that the samples of transformed data can be considered to have a normal distribution.
The results of the comparison of two samples for each element are shown in Table 7, the test statistics T are compared with critical percentages of the pertinent distributions F and t, respectively [44,46].
The results imply that for the case of nitrogen the hypothesis H0 should be rejected, because the value of the test statistic is larger than the critical percentage. For phosphorus and potassium, however, the hypothesis H0 cannot be rejected. This result influences the mode of the t-test for comparing the means: For N it is used with an assumption of unequal variances, while for P and K equal variances are assumed.
The results in Table 7 do not permit the rejection of the hypothesis H0 for any of the concentrations considered. Thus, it can be supposed that the means of both results sets—i.e., measured and calculated according to the model (2)—N, P and K do not vary significantly in total concentrations. This result is also confirmed by finding the two-sided confidence intervals (CI) for distribution means μ.
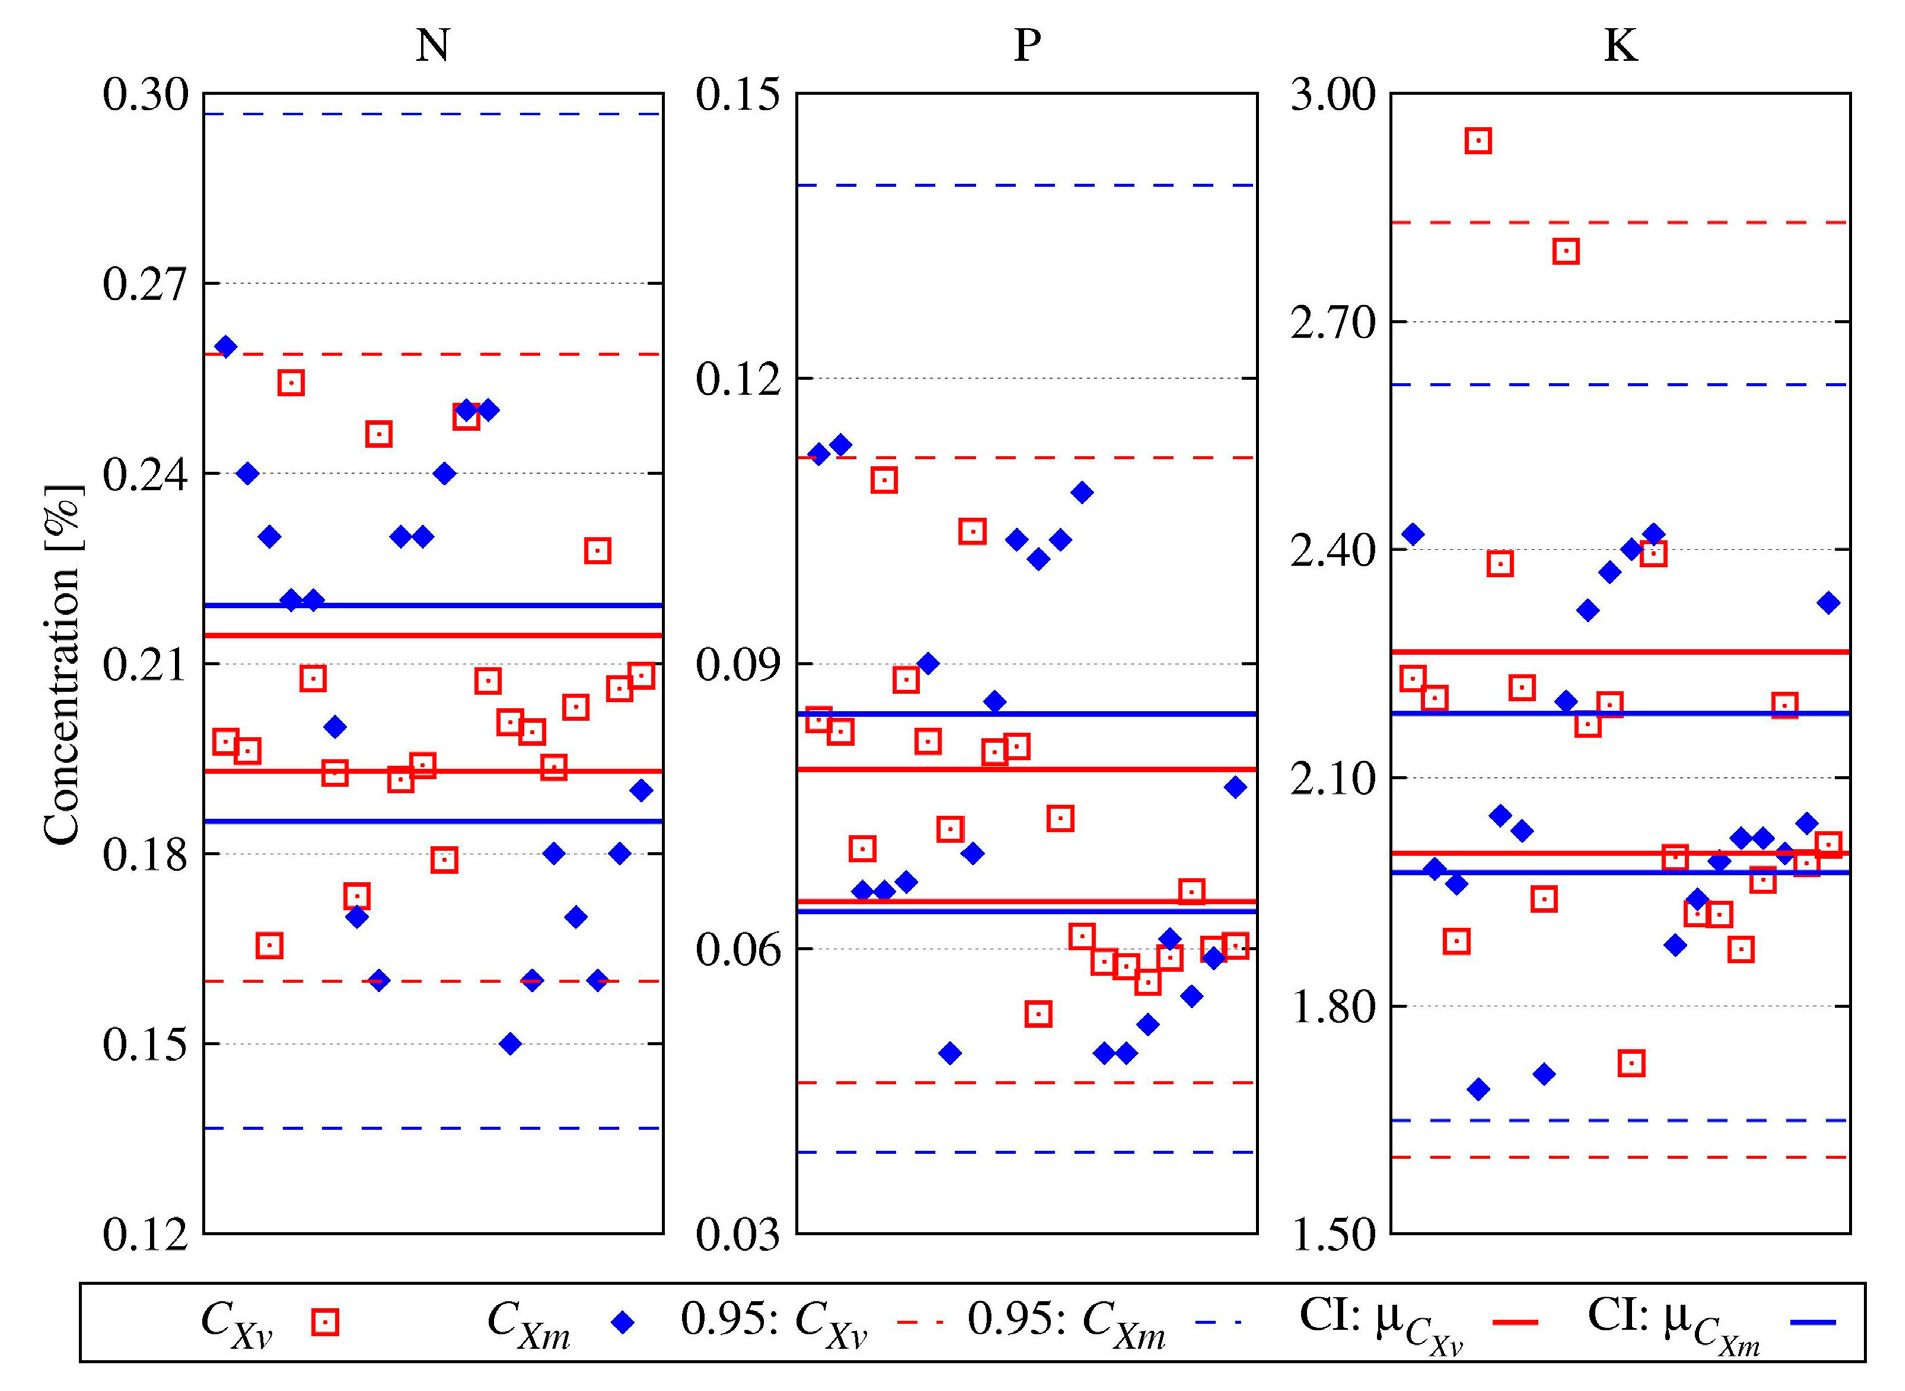
The CIs obtained for a 0.95 confidence level both for transformed and untransformed random variables were calculated. Numerical data is supported by graphs in Figure 2 which show calculated and measured concentrations of all elements and which also include CIs of pertinent distribution means.
It can be observed that the CIs are overlapping for nitrogen and phosphorus even when CIv is inside CIm, while for potassium it is reversed. The explanation of this strict inclusion takes into account the errors caused by the sample collection and its determination. The reversed situation for potassium seems to be caused by the two extreme data obtained by the model.
4. Conclusions
This paper summarizes the results of a study aimed at the design of a mathematical model to predict the nitrogen, phosphorus, and potassium concentrations in reservoir bottom sediments. The proposed model has been developed and validated for the agricultural watershed of the Tisovec River in northeast of Slovakia, where the Kľušov reservoir is located. Based on the results described above, following conclusions can be summarized:
- Prediction model of sediment quality in the reservoir was specified depending on the main five periods of the cropping cycle and distribution of erosivity during a year.
- Total N, P, and K contents in bottom sediments were calculated considering soil loss using USLE equation supplemented with a determination of the average soil nutrient concentration in topsoils.
- The generalized plant cover factor value given in the USLE calculation was modified by its dividing into five crop-stage periods. To compute C, soil loss ratios were weighted according to annual distribution of erosivity.
- For selected crops (spring barley, winter wheat, triticale, winter rye, winter oilseed rape, corn silage, potatoes, and pea) an average plant nutrient uptake during five crop-stage periods was devised.
- Validation of the proposed model using t-test and F-test at a 0.05 significance level has shown that the suggested model can be used for predicting the content of total nitrogen, phosphorus, and potassium in reservoir sediments.
The study also reveals that the model may be considered a predictor for water management enterprises and agriculturists in the future.
Acknowledgments
This research has been supported by the Slovak Grant Agency for Science (Grant No. 1/0563/15) and the Slovak Cultural and Education Grant Agency (contract No. 073TUKE-4/2015).
Author Contributions
Natalia Junakova and Jozef Junak collected the samples; Natalia Junakova and Magdalena Balintova designed the model; Roman Vodicka performed validation of the designed model via a statistical assessment; Natalia Junakova wrote and edited the paper. All authors read and approved the final manuscript.
Conflicts of Interest
The authors declare no conflict of interest.
References
- Boardman, J.; Poesen, J. (Eds.) Soil erosion in Europe: Major processes, causes and consequences. In Soil Erosion in Europe; Wiley: Chichester, UK, 2006; pp. 479–487. ISBN 978-047-085-9209. [Google Scholar]
- Šestinova, O.; Findorakova, L.; Hančuľak, J.; Fedorova, E.; Špaldon, T. The Water Reservoir Ružín—Accumulation of Priority pollutants in Sediments in the Years 2010–2014. Procedia Earth Planet. Sci. 2015, 15, 844–848. [Google Scholar] [CrossRef]
- Noor, H.; Fazli, S.; Alibakhshi, S.M. Evaluation of the relationships between runoff-rainfall-sediment related nutrient loss (A case study: Kojour Watershed, Iran). Soil Water Res. 2013, 8, 172–177. [Google Scholar]
- Berc, J.; Bruce, J.; Easterling, D.; Groisman, P.Y.; Hatfield, J.; Hughey, B.; Johnson, G.; Kellogg, B.; Lawford, R.; Mearns, L.; et al. Conservation Implications of Climate Change: Soil Erosion and Runoff from Cropland; A Report from the Soil and Water Conservation Society: Ankeny, IA, USA, 2003. [Google Scholar]
- European Environment Agency, Joint Research Centre. The State of Soil in Europe—A Contribution of the JRC to the European Environment Agency’s Environment; State and Outlook Report—SOER 2010; Publications Office of the European Union: Luxembourg, 2012. [Google Scholar] [CrossRef]
- European Environment Agency. Climate Change, Impacts and Vulnerability in Europe 2012; An Indicator-Based Report; European Environment Agency: Copenhagen, Denmark, 2012; ISBN 978-92-9213-346-7. [Google Scholar]
- Eurostat. Agri-Environmental Indicator—Soil Erosion. Available online: http://ec.europa.eu/eurostat/statistics-explained/index.php?title=Agri-environmental_indicator_-_soil_erosion&oldid=263533#cite_note-1 (accessed on 20 November 2017).
- Wisser, D.; Frolking, S.; Hagen, S.; Bierkens, M.F.P. Beyond peak reservoir storage? A global estimate of declining water storage capacity in large reservoirs. Water Resour. Res. 2013, 49, 5732–5739. [Google Scholar] [CrossRef]
- World Commission on Dams. Dams and Development: A New Framework for Decision Making; Report of the World Commision on Dam; Earthscan Publications: London, UK, 2000. [Google Scholar]
- Verstraeten, G.; Bazzoffi, P.; Lajczak, A.; Rãdoane, M.; Rey, F.; Poesen, J.; Vente, J. Reservoir and Pond Sedimentation in Europe. In Soil Erosion in Europe; Boardman, J., Poesen, J., Eds.; John Wiley and Sons Ltd.: Chichester, UK, 2006; pp. 757–774. ISBN 978-0-470-85910-0. [Google Scholar]
- Batuca, D.G.; Jordaan, J.M. Silting and Desilting of Reservoirs; CRC Press: Rotterdam, The Netherlands, 2000; ISBN 90-5410-477-5. [Google Scholar]
- Syvitski, J.P.M.; Milliman, J.D. Geology, geography, and humans battle for dominance over the delivery of fluvial sediment to the coastal ocean. J. Geol. 2007, 115, 1–19. [Google Scholar] [CrossRef]
- Koc, C. A study on sediment accumulation and environmental pollution of Fethiye Gulf in Turkey. Clean Technol. Environ. Policy 2012, 14, 97–106. [Google Scholar] [CrossRef]
- Walling, D.E.; Webb, B.W. Erosion and Sediment Yield: A global overview. In Erosion and Sediment Yield: Global and Regional Perspectives; Walling, D.E., Webb, B.W., Eds.; IAHS Publications: Wallingford, UK, 1996; pp. 3–20. ISBN 978-0947571894. [Google Scholar]
- Li, X.; Wang, B.; Yang, T.; Zhu, D.; Nie, Z.; Xu, J. Identification of soil P fractions that are associated with P loss from surface runoff under various cropping systems and fertilizer rates on sloped farmland. PLoS ONE 2017, 12, e0179275. [Google Scholar] [CrossRef] [PubMed]
- Niu, X.Y.; Wang, Y.H.; Yang, H.; Zheng, J.W.; Zou, J.; Xu, M.N.; Wu, S.S.; Xie, B. Effect of Land Use on Soil Erosion and Nutrients in Dianchi Lake Watershed, China. Pedosphere 2015, 25, 103–111. [Google Scholar] [CrossRef]
- Liu, X.; Li, Z.; Li, P.; Zhu, B.; Long, F.; Cheng, Y.; Wang, T.; Lu, K. Changes in carbon and nitrogen with particle size in bottom sediments in the Dan River, China. Quat. Int. 2015, 380–381, 305–313. [Google Scholar] [CrossRef]
- Qian, J.; Zhang, L.P.; Wang, W.Y.; Liu, Q. Effects of Vegetation Cover and Slope Length on Nitrogen and Phosphorus Loss from a Sloping Land under Simulated Rainfall. Pol. J. Environ. Stud. 2014, 23, 835–843. [Google Scholar]
- Zeng, S.C.; Su, Z.Y.; Chen, B.G.; Wu, Q.T.; Ouyang, Y. Nitrogen and phosphorus runoff losses from orchard soils in South China as affected by fertilization depths and rates. Pedosphere 2008, 18, 45–53. [Google Scholar] [CrossRef]
- Young, R.A.; Onstad, C.A.; Bosch, D.D.; Anderson, W.P. Agricultural non-point source pollution model for evaluating agricultural watersheds. J. Soil Water Conserv. 1989, 44, 168–173. [Google Scholar]
- Pimentel, D.; Burgess, M. Soil Erosion Threatens Food Production. Agriculture 2013, 3, 443–463. [Google Scholar] [CrossRef]
- Ignatieva, N.V. Nutrient exchange across the sediment-water interface in the eastern Gulf of Finland. Boreal Environ. Res. 1999, 4, 295–305. [Google Scholar]
- Estigoni, M.V.; Miranda, R.B.; Mauad, F.F. Hydropower reservoir sediment and water quality assessment. Manag. Environ. Qual. Int. J. 2017, 28, 43–56. [Google Scholar] [CrossRef]
- Teodoru, C.; Wehrli, B. Retention of Sediments and Nutrients in the Iron Gate I Reservoir on the Danube River. Biogeochemistry 2005, 76, 539–565. [Google Scholar] [CrossRef]
- Ongley, M. Sediment measurements. In Water Quality Monitoring: A Practical Guide to the Design and Implementation of Freshwater Quality Studies and Monitoring Programmes; Bartram, J., Balance, R., Eds.; UNEP/WHO: London, UK, 1996; Chapter 13; pp. 1–15. ISBN 0-419-22320-7. [Google Scholar]
- Zeleňáková, M.; Čarnogurská, M.; Šlezingr, M.; Słys, D.; Purcz, P. A model based on dimensional analysis for prediction of nitrogen and phosphorus concentrations at the river station Ižkovce, Slovakia. Hydrol. Earth Syst. Sci. 2013, 17, 201–209. [Google Scholar] [CrossRef]
- Ganasri, B.P.; Ramesh, H. Assessment of soil erosion by RUSLE model using remote sensing and GIS—A case study of Nethravathi Basin. Geosci. Front. 2016, 7, 953–961. [Google Scholar] [CrossRef]
- Saha, S.K. Water and wind induced soil erosion assessment and monitoring using remote sensing and GIS. In Satellite Remote Sensing and GIS Applications in Agricultural Meteorology; Sivakumar, M.V.K., Roy, P.S., Harmsen, K., Saha, S.K., Eds.; World Meteorological Organization: Geneva, Switzerland, 2004; pp. 315–330. [Google Scholar]
- Baudron, F.; Thierfelder, C.; Nyagumbo, I.; Gérard, B. Where to Target Conservation Agriculture for African Smallholders? How to Overcome Challenges Associated with its Implementation? Experience from Eastern and Southern Africa. Environments 2015, 2, 338–357. [Google Scholar] [CrossRef]
- Diodato, N.; Guerriero, L.; Bellocchi, G. Modeling and Upscaling Plot-Scale Soil Erosion under Mediterranean Climate Variability. Environments 2017, 4, 58. [Google Scholar] [CrossRef]
- Ma, L.; Bu, Z.H.; Wu, Y.H.; Kerr, P.G.; Garre, S.; Xia, L.Z.; Yang, L.Z. An integrated quantitative method to simultaneously monitor soil erosion and non-point source pollution in an intensive agricultural area. Pedosphere 2014, 24, 674–682. [Google Scholar] [CrossRef]
- Bosco, C.; de Rigo, D.; Dewitte, O.; Poesen, J.; Panagos, P. Modelling soil erosion at European scale: Towards harmonization and reproducibility. Nat. Hazards Earth Syst. Sci. 2015, 15, 225–245. [Google Scholar] [CrossRef] [Green Version]
- Huang, T.C.C.; Lo, K.F.A. Effects of Land Use Change on Sediment and Water Yields in Yang Ming Shan National Park, Taiwan. Environments 2015, 2, 32–42. [Google Scholar] [CrossRef]
- Mokhtar, N.H.; Gofar, N.; Kassim, A. Combining Design Methodologies for the Development of a Practical and Effective Approach to Erosion Control Systems; Project Report Vot 74179; Universiti Teknologi Malaysia: Johor Bahru, Malaysia, 2006. [Google Scholar]
- National Research Council (Committee on Long-Range Soil and Water Conservation, Board on Agriculture). Soil and Water Quality: An Agenda for Agriculture; National Academy Press: Washington, DC, USA, 1993; p. 542. ISBN 978-0-309-04933-7. [Google Scholar]
- Junakova, N.; Junak, J. Sustainable Use of Reservoir Sediment through Partial Application in Building Material. Sustainability 2017, 9, 852. [Google Scholar] [CrossRef]
- Michalec, B. Qualitative and quantitative assessment of sediments pollution with heavy metals of small water reservoirs. In Soil Health and Land Use Management; Hernandez-Soriano, M.C., Ed.; InTech: Rijeka, Croatia, 2012; pp. 255–278. ISBN 978-953-307-614-0. [Google Scholar]
- Slovak Water Management Enterprise. Operational Manual of the Klusov Water Reservoir (in Slovak); Slovak Water Management Enterprise: Trebišov, Slovak Republic, 2005. [Google Scholar]
- Mahler, R.L.; Tindall, T.A. Soil sampling. Bulletin 704 (Revised); College of Agriculture, University of Idaho: Moscow, ID, USA; U.S. Department of Agriculture: Washington, DC, USA, 1994. [Google Scholar]
- Ministry of the Environment of the Slovak Republic. Methodological Instruction No. 549/98-2 for Risk Assessment Posed by Contaminated Sediments in Streams and Water Reservoirs (in Slovak); Ministry of the Environment of the Slovak Republic: Bratislava, Slovak Republic, 1998. [Google Scholar]
- Wischmeier, W.H.; Smith, D.D. Predicting Rainfall Erosion Losses—A Guide to Conservation Planning. In Agriculture Handbook No. 537; US Department of Agriculture: Beltsville, MD, USA, 1978. [Google Scholar]
- Karaburun, A. Estimation of C factor for soil erosion modeling using NDVI in Buyukcekmece watershed. Ozean J. Appl. Sci. 2010, 3, 77–85. [Google Scholar]
- Menzel, R.G. Enrichment ratios for water quality modeling. In CREAMS, A Field Scale Model for Chemicals, Runoff, and Erosion from Agricultural Management Systems; Knisel, W., Ed.; US Department of Agriculture: Phoenix, AZ, USA, 1980; Volume 3: Supporting Documentation, Conservation Report No. 26; pp. 486–492. [Google Scholar]
- Shapiro, S.S.; Wilk, M.B. An analysis of variance test for normality (complete samples). Biometrika 1965, 52, 591–611. [Google Scholar] [CrossRef]
- Zaiontz, C. Real Statistics Using Excel. Available online: http://www.real-statistics.com/tests-normality-and-symmetry/statistical-tests-normality-symmetry/shapiro-wilk-test/ (accessed on 14 December 2016).
- Chakravarti, I.M.; Laha, R.G.; Roy, J. Handbook of Methods of Applied Statistics; John Wiley and Sons: New York, NY, USA, 1967; ISBN 978-1135545802. [Google Scholar]
- Bhattacharya, G.K.; Johnson, R.A. Statistical Concepts and Methods; John Wiley and Sons: New York, NY, USA, 1977; ISBN 9780471072041. [Google Scholar]
- Malisek, A. Evaluation of the rainfall and runoff factor by geographic location. Geogr. Čas. 1990, 42, 410–422. [Google Scholar]
Figure 1.
Particle size distribution measured for original and mechanically activated sediments.

Figure 2.
Graphical view of the statistical assessment of calculated (CXv) and measured (CXm) concentrations in sediments for X = N, P, or K.
Figure 2.
Graphical view of the statistical assessment of calculated (CXv) and measured (CXm) concentrations in sediments for X = N, P, or K.

Table 1.
Measured concentrations of total N, P, and K in reservoir sediments.
| Sample | N | P | K | Sample | N | P | K |
|---|---|---|---|---|---|---|---|
| (%) | (%) | (%) | (%) | (%) | (%) | ||
| S1 | 0.260 | 0.112 | 2.420 | S12 | 0.240 | 0.101 | 2.400 |
| S2 | 0.240 | 0.113 | 1.980 | S13 | 0.250 | 0.103 | 2.420 |
| S3 | 0.230 | 0.066 | 1.960 | S14 | 0.250 | 0.108 | 1.880 |
| S4 | 0.220 | 0.066 | 1.690 | S15 | 0.150 | 0.049 | 1.940 |
| S5 | 0.220 | 0.067 | 2.050 | S16 | 0.160 | 0.049 | 1.990 |
| S6 | 0.200 | 0.090 | 2.030 | S17 | 0.180 | 0.052 | 2.020 |
| S7 | 0.170 | 0.049 | 1.710 | S18 | 0.170 | 0.061 | 2.020 |
| S8 | 0.160 | 0.070 | 2.200 | S19 | 0.160 | 0.055 | 2.000 |
| S10 | 0.230 | 0.086 | 2.320 | S20 | 0.180 | 0.059 | 2.040 |
| S11 | 0.230 | 0.103 | 2.370 | S21 | 0.190 | 0.077 | 2.330 |
Table 2.
Partial and average annual soil losses from 1004/1 parcel.
| Year/Crop | Gi (t ha−1) | Gr,i (t ha−1 Year−1) | ||||
|---|---|---|---|---|---|---|
| Crop-Stage Period * | ||||||
| 1 | 2 | 3 | 4 | 5 | ||
| 1/winter oilseed rape | 3.74 | 1.88 | 0.14 | 1.22 | 0.78 | 7.75 |
| 2/triticale | 5.41 | 0.36 | 0.08 | 1.55 | 0.75 | 8.16 |
| 3/corn silage | 3.41 | 3.50 | 5.35 | 5.47 | - | 17.73 |
| 4/winter wheat | - | 0.03 | 0.06 | 1.75 | 0.07 | 1.91 |
| 5/winter oilseed rape | 1.96 | 1.34 | 0.11 | 1.26 | 0.77 | 5.45 |
| 6/winter wheat | 5.24 | 0.19 | 0.06 | 1.46 | 0.75 | 7.71 |
| 7/potatoes | 3.85 | 1.44 | 4.40 | 5.52 | - | 15.22 |
| 8/winter wheat | 0.04 | 0.15 | 0.08 | 1.42 | 0.76 | 2.44 |
| 9/spring barley | 4.17 | 0.96 | 2.39 | 0.85 | 0.21 | 8.58 |
| 10/winter oilseed rape | 3.74 | 2.24 | 0.15 | 1.15 | 0.78 | 8.06 |
* 1—seedbed preparation; 2—establishment; 3—development; 4—maturing crop; 5—stubble field.
Table 3.
Partial and average annual soil losses from 2001/1 parcel.
| Year/Crop | Gi (t ha−1) | Gr,i (t ha−1 Year−1) | ||||
|---|---|---|---|---|---|---|
| Crop-Stage Period | ||||||
| 1 | 2 | 3 | 4 | 5 | ||
| 1/corn silage | 0.55 | 3.67 | 10.57 | 12.88 | 0.06 | 27.73 |
| 2/spring barley | 0.10 | 0.20 | 1.85 | 2.91 | 0.28 | 5.34 |
| 3/triticale | 5.88 | 3.99 | 0.21 | 3.07 | 0.14 | 13.28 |
| 4/winter oilseed rape | 2.94 | 8.31 | 0.48 | 2.60 | 1.59 | 15.93 |
| 5/triticale | 10.29 | 0.87 | 0.18 | 2.98 | 1.55 | 15.86 |
| 6/pea | 8.24 | 1.70 | 4.43 | 1.87 | 1.57 | 17.81 |
| 7/winter wheat | 8.74 | 0.61 | 0.14 | 4.39 | 0.10 | 13.99 |
| 8/spring barley | 0.49 | 0.82 | 2.73 | 2.42 | 1.55 | 8.02 |
| 9/winter rye | 7.57 | 0.67 | 0.15 | 2.88 | 1.85 | 13.12 |
| 10/winter oilseed rape | 7.35 | 0.79 | 0.21 | 2.32 | 1.61 | 12.28 |
Table 4.
Proposed partial and average plant nutrient uptake during the crop-stage periods.
| Crop | (kg ha−1) | Crop-Stage Period | |||||
|---|---|---|---|---|---|---|---|
| 1 | 2 | 3 | 4 | 5 | |||
| spring barley | N | 0.00 | 15.90 | 17.75 | 20.00 | 0.00 | 53.65 |
| P | 0.00 | 2.05 | 2.50 | 3.70 | 0.00 | 8.25 | |
| K | 0.00 | 18.65 | 21.80 | 19.55 | 0.00 | 60.00 | |
| winter wheat, triticale, winter rye | N | 0.00 | 0.00 | 19.10 | 71.35 | 0.00 | 90.45 |
| P | 0.00 | 0.00 | 1.25 | 10.75 | 0.00 | 12.00 | |
| K | 0.00 | 0.00 | 9.55 | 67.50 | 0.00 | 77.05 | |
| winter oilseed rape | N | 0.00 | 9.90 | 68.90 | 30.00 | 0.00 | 108.80 |
| P | 0.00 | 1.40 | 15.90 | 5.00 | 0.00 | 22.30 | |
| K | 0.00 | 6.20 | 88.10 | 7.70 | 0.00 | 102.00 | |
| pea | N | 0.00 | 18.30 | 17.70 | 26.30 | 0.00 | 62.30 |
| P | 0.00 | 1.90 | 1.80 | 2.60 | 0.00 | 6.30 | |
| K | 0.00 | 8.50 | 8.20 | 12.10 | 0.00 | 28.80 | |
| potatoes | N | 0.00 | 18.27 | 17.66 | 53.00 | 0.00 | 88.93 |
| P | 0.00 | 2.61 | 2.52 | 7.58 | 0.00 | 12.71 | |
| K | 0.00 | 23.49 | 22.71 | 68.15 | 0.00 | 114.35 | |
| corn silage | N | 0.00 | 16.35 | 16.89 | 50.18 | 0.00 | 83.42 |
| P | 0.00 | 2.18 | 2.19 | 6.75 | 0.00 | 11.12 | |
| K | 0.00 | 13.62 | 13.67 | 42.22 | 0.00 | 69.51 | |
Table 5.
Calculated concentrations of total N, P, and K in reservoir sediments.
| Year | CXv in Reservoir (%) | ||
|---|---|---|---|
| N | P | K | |
| 1 | 0.188 | 0.067 | 1.956 |
| 2 | 0.225 | 0.078 | 2.307 |
| 3 | 0.188 | 0.066 | 1.944 |
| 4 | 0.225 | 0.082 | 2.387 |
| 5 | 0.203 | 0.072 | 2.131 |
| 6 | 0.193 | 0.068 | 2.032 |
| 7 | 0.189 | 0.065 | 1.954 |
| 8 | 0.236 | 0.083 | 2.469 |
| 9 | 0.199 | 0.069 | 2.071 |
| 10 | 0.202 | 0.070 | 2.096 |
Table 6.
The values of test statistic W (v for calculated, m for measured data) in testing of H0 and H1 hypotheses using the SW test of conformity and their comparison with the critical value.
Table 6.
The values of test statistic W (v for calculated, m for measured data) in testing of H0 and H1 hypotheses using the SW test of conformity and their comparison with the critical value.
| Element | SW Test | |||||
|---|---|---|---|---|---|---|
| Wv | Wcrit | Wm | Wcrit | |||
| N | 0.9255 | > | 0.905 | 0.9088 | > | 0.905 |
| P | 0.9346 | > | 0.905 | 0.9064 | > | 0.905 |
| K | 0.9145 | > | 0.905 | 0.9138 | > | 0.905 |
Table 7.
The test statistics and the F-test and t-test critical percentages for a comparison of variances in N, P, and K concentrations.
Table 7.
The test statistics and the F-test and t-test critical percentages for a comparison of variances in N, P, and K concentrations.
| Element | Variance | Mean | ||||
|---|---|---|---|---|---|---|
| T | Percentage | T | Percentage | |||
| N | 2.7161 | > | 2.5089 | 0.4956 | < | 2.0345 |
| P | 2.2073 | < | 2.5089 | 0.0863 | < | 2.0227 |
| K | 0.7173 | < | 2.5089 | 0.4078 | < | 2.0227 |
© 2017 by the authors. Licensee MDPI, Basel, Switzerland. This article is an open access article distributed under the terms and conditions of the Creative Commons Attribution (CC BY) license (http://creativecommons.org/licenses/by/4.0/).
Share and Cite
MDPI and ACS Style
Junakova, N.; Balintova, M.; Vodička, R.; Junak, J. Prediction of Reservoir Sediment Quality Based on Erosion Processes in Watershed Using Mathematical Modelling. Environments 2018, 5, 6. https://doi.org/10.3390/environments5010006
AMA Style
Junakova N, Balintova M, Vodička R, Junak J. Prediction of Reservoir Sediment Quality Based on Erosion Processes in Watershed Using Mathematical Modelling. Environments. 2018; 5(1):6. https://doi.org/10.3390/environments5010006
Chicago/Turabian StyleJunakova, Natalia, Magdalena Balintova, Roman Vodička, and Jozef Junak. 2018. "Prediction of Reservoir Sediment Quality Based on Erosion Processes in Watershed Using Mathematical Modelling" Environments 5, no. 1: 6. https://doi.org/10.3390/environments5010006
Note that from the first issue of 2016, this journal uses article numbers instead of page numbers. See further details here.