1. Introduction
The bluegill (
Lepomis macrochirus) is the most angled and harvested fish in many areas of North America [
1,
2,
3,
4]. Moreover, bluegills have been exported worldwide to propagate sport fisheries and aquaculture, as well as to provide a forage base for larger predatory fishes [
3,
5,
6]. Improving management of sport fisheries for bluegills has been the focus of numerous scientific investigations [
1,
2,
7,
8,
9,
10,
11]. In addition, the bluegill has been the subject of many fish behavior studies, because cuckoldry and other variations in life history characteristics have been documented [
12,
13,
14,
15,
16]. For example, some males mimic females in coloration to “sneak” access to fertilization of eggs in nests guarded by parental males that build the nests and care for the eggs; these parental males typically represent the bulk of the adult male population.
Mercury has become a globally dispersed pollutant via atmospheric emissions, notably from the burning of coal, and the subsequent transport through the atmosphere [
17]. Through a complex series of linked environmental processes that are not completely understood, mercury contamination can lead to exposure levels in aquatic and terrestrial food webs of toxicological concern in even the most remote locations. Mercury contamination has received much attention from environmental health managers, who have ranked mercury as one of the 10 chemicals of major public health concern worldwide [
18]. Mercury biomagnifies in food webs, and top predator species, including humans, may therefore exhibit relatively high mercury concentrations [
17]. A sufficiently high exposure to mercury can lead to impairment of the proper functioning of their nervous systems, deformities in neonates, and liver damage [
19,
20,
21]. The brain of fetal humans is more susceptible to mercury-induced damage than the brain of adult humans [
22]. Mercury can inhibit the division and migration of neuronal cells in the brain of a human fetus, thereby disrupting the cytoarchitecture of the developing brain. Mercury exposure has also been linked to subclinical autoimmunity among reproductive-age women [
23]. Mercury contamination in fish is of special concern, because consumption of contaminated fish is the predominant source of mercury exposure to humans and fish-eating wildlife [
19,
24]. Determinations of mercury concentrations in fish are essential to developing fish consumption advisories and to assessing risk to humans and wildlife consuming contaminated fish [
19,
25,
26,
27,
28,
29].
Two apparent patterns have recently emerged with regard to whole-fish contaminant concentrations in males
versus whole-fish contaminant concentrations in females of various fish species [
30,
31]. First, polychlorinated biphenyl (PCB) concentrations in males have been shown to exceed PCB concentrations of females by 15%–45%. This difference has been primarily attributed to a higher rate of energy expenditure, stemming from greater activity and a higher resting metabolic rate (or standard metabolic rate, SMR), in males. The higher rate of energy expenditure leads to a higher rate of food consumption, which, in turn, leads to a faster rate of PCB accumulation. Second, with the exception of sea lamprey (
Petromyzon marinus), the ratio of total mercury (Hg) concentration in males to Hg concentration in females is substantially lower than the ratio of PCB concentration in males to PCB concentration in females. This phenomenon has been attributed to males eliminating Hg from their bodies at a faster rate than females, whereas long-term elimination of PCBs is negligible for both sexes of fish. Hg-elimination rate appears to be enhanced by androgens such as testosterone and 11-ketotestosterone [
31,
32]. The sea lamprey, a very primitive fish, lacks these two androgens, and this would explain the ratio of Hg concentration in males to Hg concentration in females equaling the ratio of PCB concentration in males to PCB concentration in females [
31].
Although Nicoletto and Hendricks [
33] reported significantly greater Hg concentrations in females compared with males for four species of sunfishes, including bluegill, these differences were based on sampling just a small (about 0.5 g) plug from the dorsal region of the white muscle tissue from each fish. Females were found to be 40%–50% higher in Hg concentration than males. However, to the best of our knowledge, differences in whole-fish Hg concentrations between the sexes of bluegill have yet to be investigated. When comparing contaminant concentration in males with that in females, caution must be exercised in using concentrations in muscle tissue or liver tissue as a surrogate for whole-fish concentrations [
34]. The relative difference in muscle or liver tissue contaminant concentrations between the sexes may accurately reflect the relative difference in whole-fish contaminant concentrations between the sexes in some cases but not in others. Several other researchers have determined Hg concentrations in bluegills, but differences in concentrations between the sexes were not addressed [
35,
36,
37,
38]. Becker and Bigham [
35] reported that the skin-on fillet Hg concentrations were 1.6 times greater than whole-fish Hg concentrations in bluegill.
The overall goal of our study was to characterize Hg accumulation in bluegills from Squaw Lake, a small lake in southeastern Michigan (USA). The specific objectives were to: (1) estimate the mean skin-off fillet and whole-fish Hg concentrations for bluegills from Squaw Lake, (2) quantify the difference between the sexes of bluegills for both skin-off fillet Hg concentrations and whole-fish Hg concentrations, (3) use bioenergetics modeling to assess the effect of growth dilution on the observed difference in Hg concentrations between the sexes, (4) identify the factors most likely responsible for the observed difference in Hg concentrations between the sexes, and (5) discuss the implications of our results with regard to revising fish consumption advisories for southeastern Michigan.
2. Materials and Methods
2.1. Field Methods
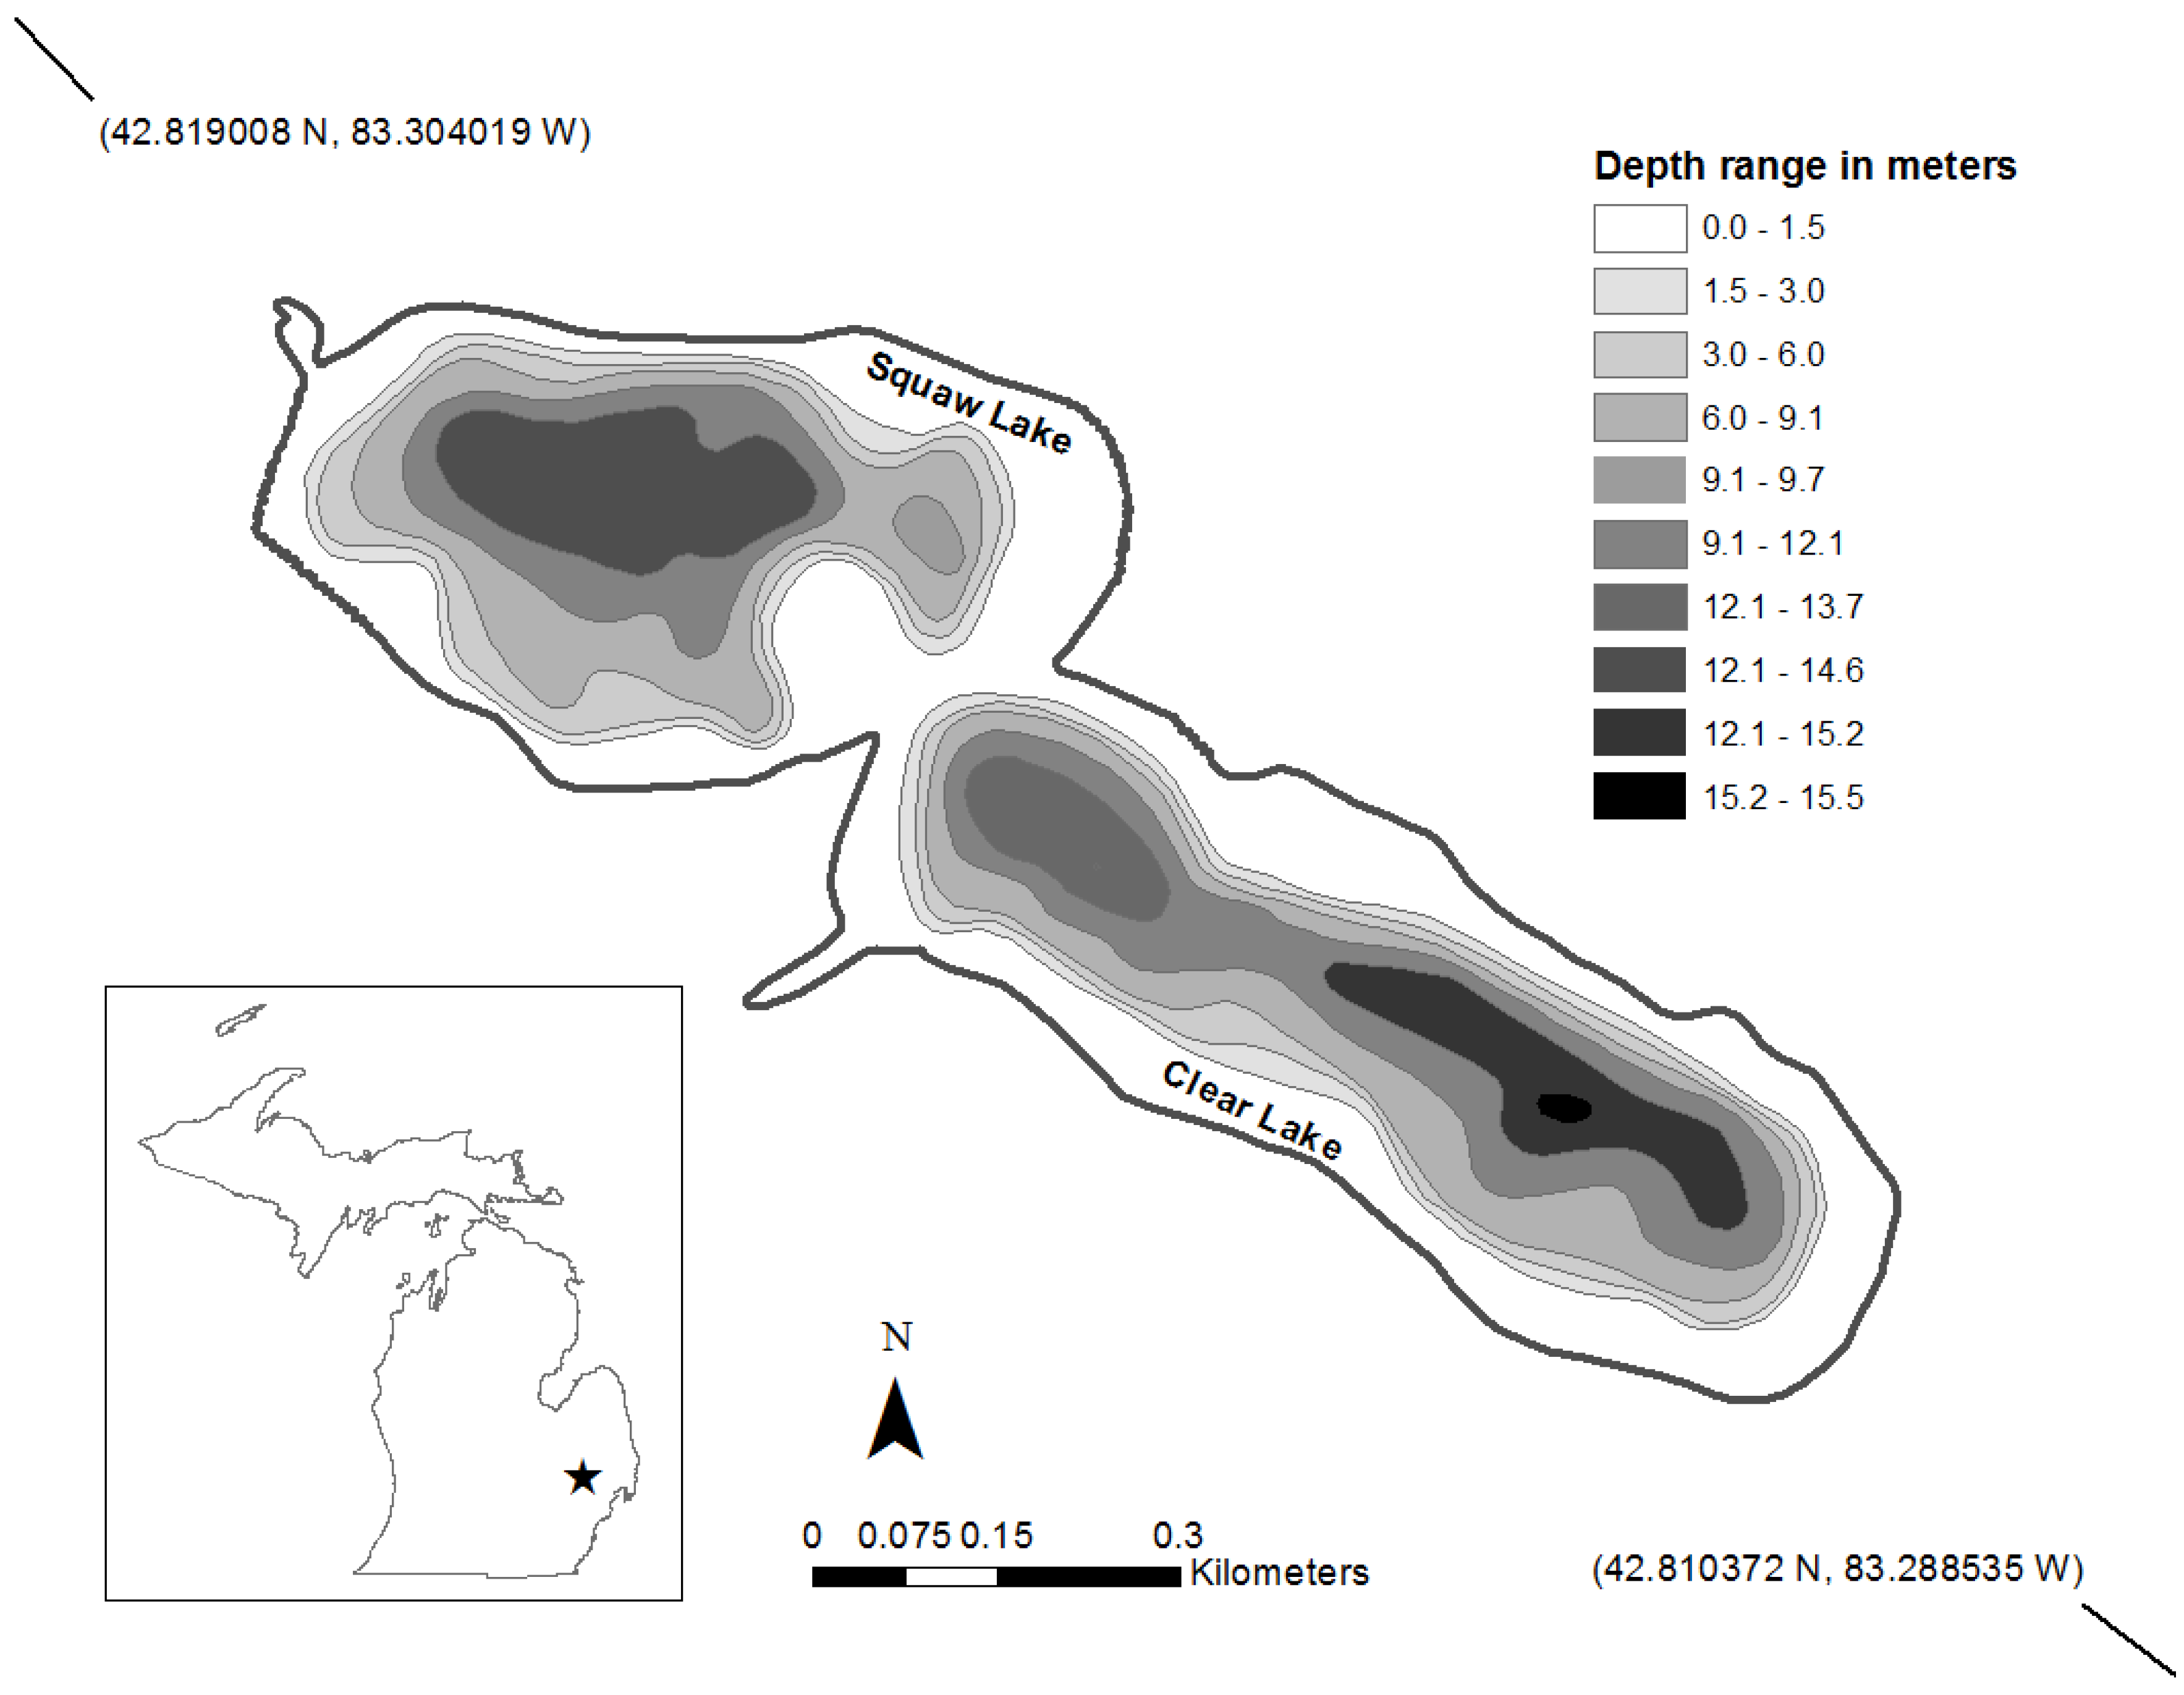
Squaw Lake is a shallow lake located in southeastern Michigan (
Figure 1). Three fyke nets, each with 38-mm mesh (stretched-measure) in the pot and a 30.5-m lead, were set at randomly selected locations in Squaw Lake on 28 May 2013, according to procedures contained in the survey methods manual [
39]. The lead extended from shore to the opening of the fyke net located in water between 0.6 and 1.2 m deep. Fyke nets were lifted on 29 May 2013 and 30 May 2013, and the catches were randomly subsampled to select 27 apparently female bluegills and 27 apparently male bluegills for Hg determinations. Bluegills were sexed in the field based on their coloration pattern and abdomen width [
40], and then later the assignment of sex in the field was verified in the laboratory via visual examination of the gonads. All fish were in ripe or nearly ripe condition. All fish were measured to the nearest 2.5 millimeters and weighed to the nearest gram, and aging structures (scales and dorsal spines) were taken from each fish. Scales and spines were processed according to standard methods in the survey manual [
41]. Scales were pressed onto plastic slides to create growth ring impressions, and spines were sectioned for direct reading of growth rings. Ages were assigned based on enumeration of annuli; scales were used to age bluegills less than 153 mm total length (TL), and dorsal spines were used to age bluegills ≥153 mm in TL [
41]. Bluegills were individually bagged in plastic bags, with each bag containing a cardboard tag with a unique identification number, frozen at −20 °C, and later transported to Bureau of Laboratories in Lansing, MI for further processing.
Figure 1.
Map of Squaw Lake, Oakland County, MI, USA.
Figure 1.
Map of Squaw Lake, Oakland County, MI, USA.
2.2. Hg Determinations
At the Bureau of Laboratories, bluegills were partially thawed, and skin-off fillets were prepared. Each bluegill was sexed in the laboratory via visual inspection of the gonads. For each bluegill, the skin-off fillet portion of the fish was homogenized in a commercial food processor with dry ice. A 0.1-g sample of the skin-off fillet homogenate was placed in a clean vial for total mercury (Hg) determination. All of the remaining skin-off fillet homogenate was added to the rest of the bluegill, and then homogenized in a commercial food processor with dry ice. A 0.1-g sample of this whole-fish homogenate was placed in a clean vial for Hg determination.
Total mercury (Hg) concentration was determined in both the skin-off fillet and whole-fish homogenates using U.S. Environmental Protection Agency Method 7473 [
42]. Homogenized fish tissue samples were weighed to the nearest 0.1 milligrams in ceramic boats, and then introduced into the furnace of the Direct Mercury Analyzer (DMA) (Nippon MA-3000, Tokyo, Japan). In the furnace, the samples were dried and then thermally and chemically decomposed. Absorbance was measured twice at a wavelength of 253.65 nm, using two different sensitivities. All Hg concentrations were reported on a wet-weight basis. Although the mercury found in the bluegills can be either methylmercury (MeHg) or in the inorganic form, previous research has shown that nearly all (>95%) of the mercury in bluegills from Lake Onondaga (New York, USA) is MeHg [
35].
The DMA instrument was calibrated by an eight-point curve with a minimum correlation coefficient of 0.997. Daily calibration check standards (5 ng and 50 ng) were analyzed with a minimum accuracy of ±10%. Quality control samples consisting of blanks, duplicates, and two certified reference materials (CRMs) from the National Research Council of Canada were analyzed with each set of homogenate samples to validate the accuracy and precision of the method. TORT-3 (lobster hepatopancreas) was the CRM used for accuracy in the long-path cell, while DORM-4 (fish protein reference material) was used for accuracy in the short-path cell. Duplicates were run with a frequency of one per 20 samples, and the mean relative percent difference between duplicates was 5.4%. The method detection limit was calculated to be 0.4 ng/g.
2.3. Data Analyses for Hg Concentrations
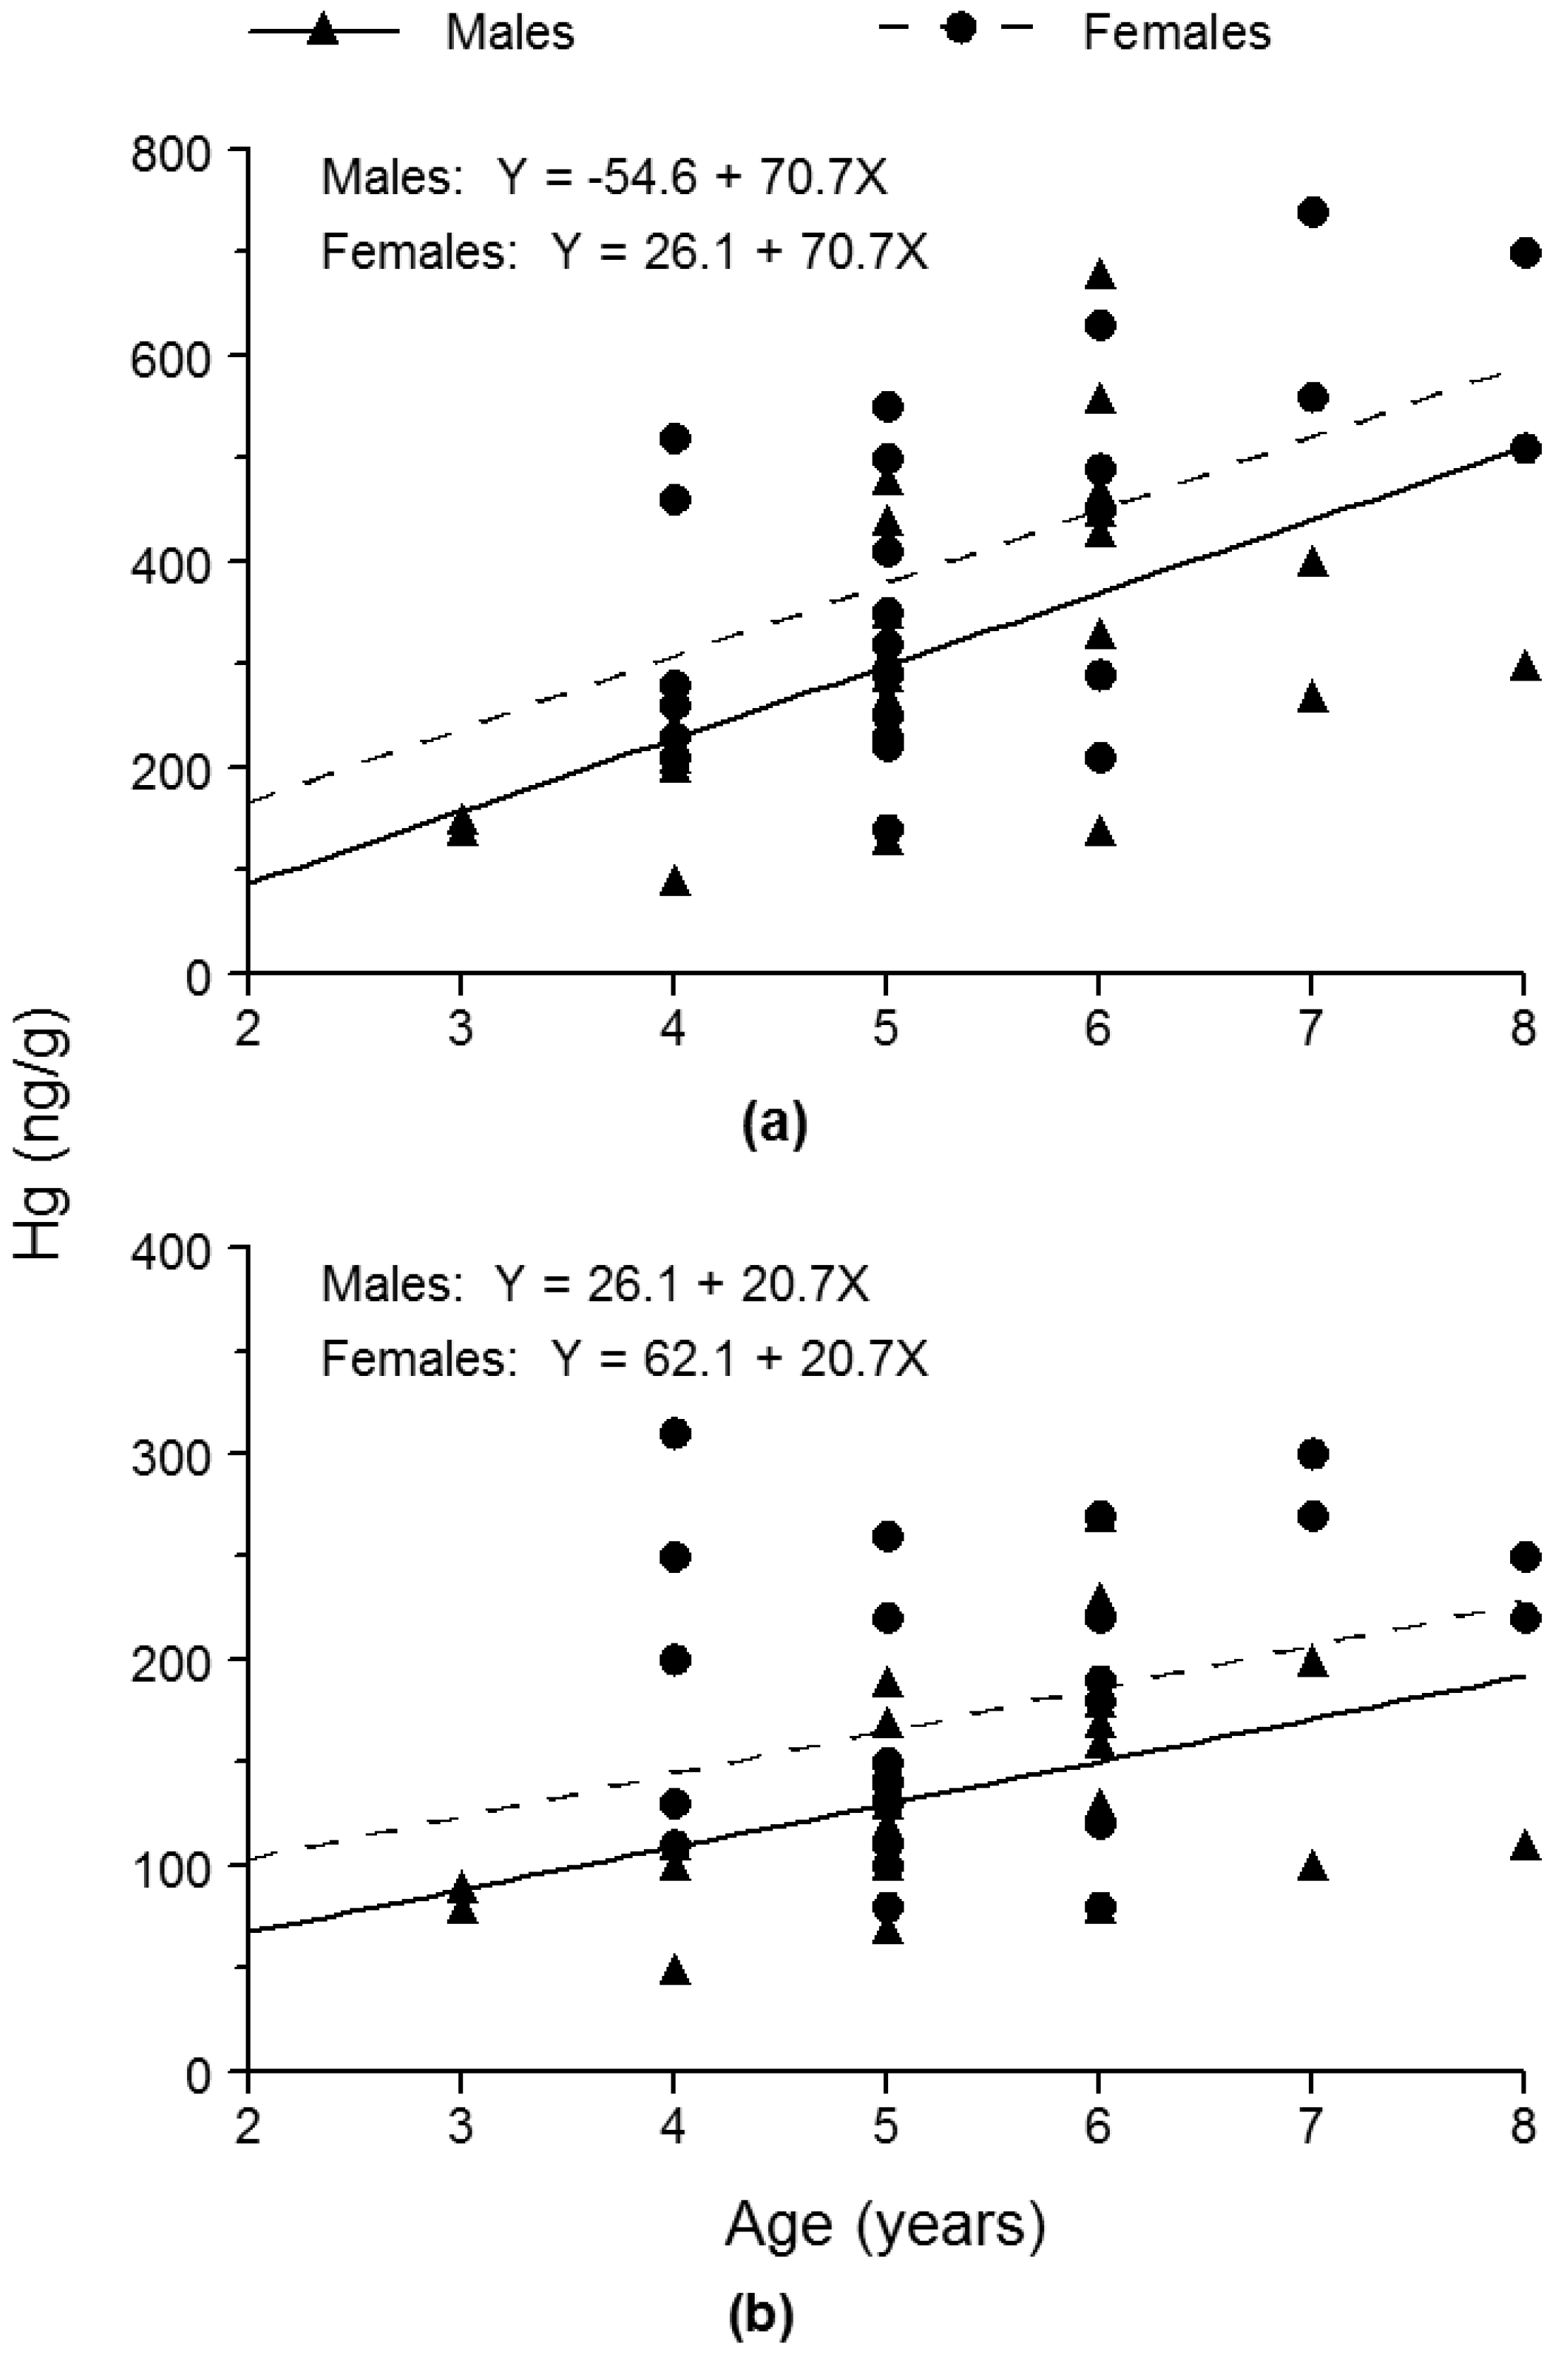
To test whether sex had a significant effect on Hg concentration, we applied analysis of covariance (ANCOVA), with Hg concentration as the dependent variable, sex as the main effect, and age as the covariate. One ANCOVA was performed for Hg concentration in the skin-off fillets and a second ANCOVA was performed for whole-fish Hg concentration. For both skin-off fillets and whole fish, we substituted the grand mean value for age into the fitted ANCOVA model to estimate the mean Hg concentration for both females and males. We then calculated the ratio of the estimate of mean Hg concentration of females to the estimate of mean Hg concentration of males. Equality of slopes of the regression line of Hg concentration as a function of age for males and that for females was a key assumption of the ANCOVA. Therefore, we performed the F test for equality of slopes to ensure that this assumption was met. We set α = 0.05 for all of our statistical testing.
To determine whether skin-off fillet Hg concentration was significantly different from whole-fish Hg concentration, we applied a t test for paired comparisons by pairing each skin-off fillet Hg concentration with its corresponding whole-fish Hg concentration, subtracting the whole-fish Hg concentration from the skin-off fillet Hg concentration, and then ascertaining whether the mean difference was significantly different from zero. Sexes were pooled for this statistical testing. We also calculated the ratio of mean Hg concentration in the skin-off fillets to mean whole-fish Hg concentration.
2.4. Bioenergetics Modeling
Bioenergetics modeling was used to assess the effect of growth dilution on the difference in Hg concentrations between the sexes of bluegill; please refer to Madenjian [
34] for more details on this approach. In brief, gross growth efficiency (GGE) is defined as the amount of growth by a fish divided by the amount of food consumption needed to achieve that growth, and Hg concentration is inversely proportional to GGE. Thus, if the difference in Hg concentration was entirely due to a difference in GGEs between the sexes, then the ratio of Hg concentration in females to Hg concentration in males should equal the ratio of GGE for males to GGE for females. According to the Madenjian [
34] approach, bioenergetics modeling is used to quantify the relative difference in GGEs between the sexes that is solely due to a difference in growth rates between the sexes, and this quantification represents the magnitude of the growth dilution effect. Thus, SMR and activity did not vary between the sexes in performing this bioenergetics modeling.
Growth trajectories were developed for both female and male bluegills, based on our weight and age data. Age was reported in years. Sample sizes were relatively low for ages 3, 4, 7, and 8, but were relatively high for ages 5 and 6. Thus, we assigned the weights of age-5 and age-6 females and males values equal to the mean weights of age-5 and age-6 females and males, respectively, in our sample. We assumed that both female and male age-2 bluegills weighed 15 g in late May [
41]. We further assumed that bluegill weight increased linearly between ages 2 and 5 for both sexes. Our data indicated that bluegill weight in Squaw Lake showed an annual increase of 22 g after age 5 for both sexes, and this information was used to complete growth trajectories over ages 2–8 for both sexes. Diet composition data were insufficient to estimate food consumption by age-0 and age-1 bluegills, and therefore we assigned cumulative GGE for age-2 bluegill the value of 0.1875, which is an average GGE for age-0 and age-1 fish from two previous studies on bloater (
Coregonus hoyi) and walleye (
Sander vitreus) [
43,
44]. The bluegills used in our study were caught on 29–30 May 2013, and therefore we designated 30 May as the starting day in our bioenergetics model simulations.
A modified version of the bluegill bioenergetics model, which was originally developed by Kitchell
et al. [
45] and coded into a computer program by Hewett and Johnson [
46], was applied to the above-mentioned bluegill growth trajectories to estimate food consumption by an average female bluegill and an average male bluegill from Squaw Lake. Our modification was to change the value of the exponent for effect of weight on metabolism, RB, from −0.200 to −0.269, as recommended by Breck [
47]. The bluegill bioenergetics model represented an energy budget for the bluegill. Energy losses were calculated as functions of water temperature, bluegill size (weight), and food consumption, and the amount of food consumption needed to obtain the observed size (weight) at a given age was estimated via balancing of the energy budget. The bluegill’s energy budget can be written as:
where
C = consumption,
G = growth,
R = respiration,
Eg = egestion,
Ex = excretion, and
S = spawning losses. Respiration was modeled as a function of bluegill weight and water temperature. Egestion of fecal matter and excretion of nitrogenous wastes were modeled as functions of food consumption, bluegill weight, and water temperature. Spawning was simulated by bluegills losing the appropriate amount of weight on the spawning day. Based on gonadosomatic index (GSI) determinations of bluegills nearing spawning time [
48], mature females and mature males were assumed to lose 9.3% and 1.5%, respectively, of their body weight on the spawning day. In most years, peak bluegill spawning in Squaw Lake occurs during the last week of May, but peak spawning may be delayed to the first week of June during years of relatively slow spring warming. Because 2013 was a year of relatively slow spring warming, we designated 1 June as the spawning day in our bioenergetics model simulations. Based on age determinations of the bluegills from our study, we assumed that females and males became mature at ages 4 and 3, respectively, in our bioenergetics model simulations.
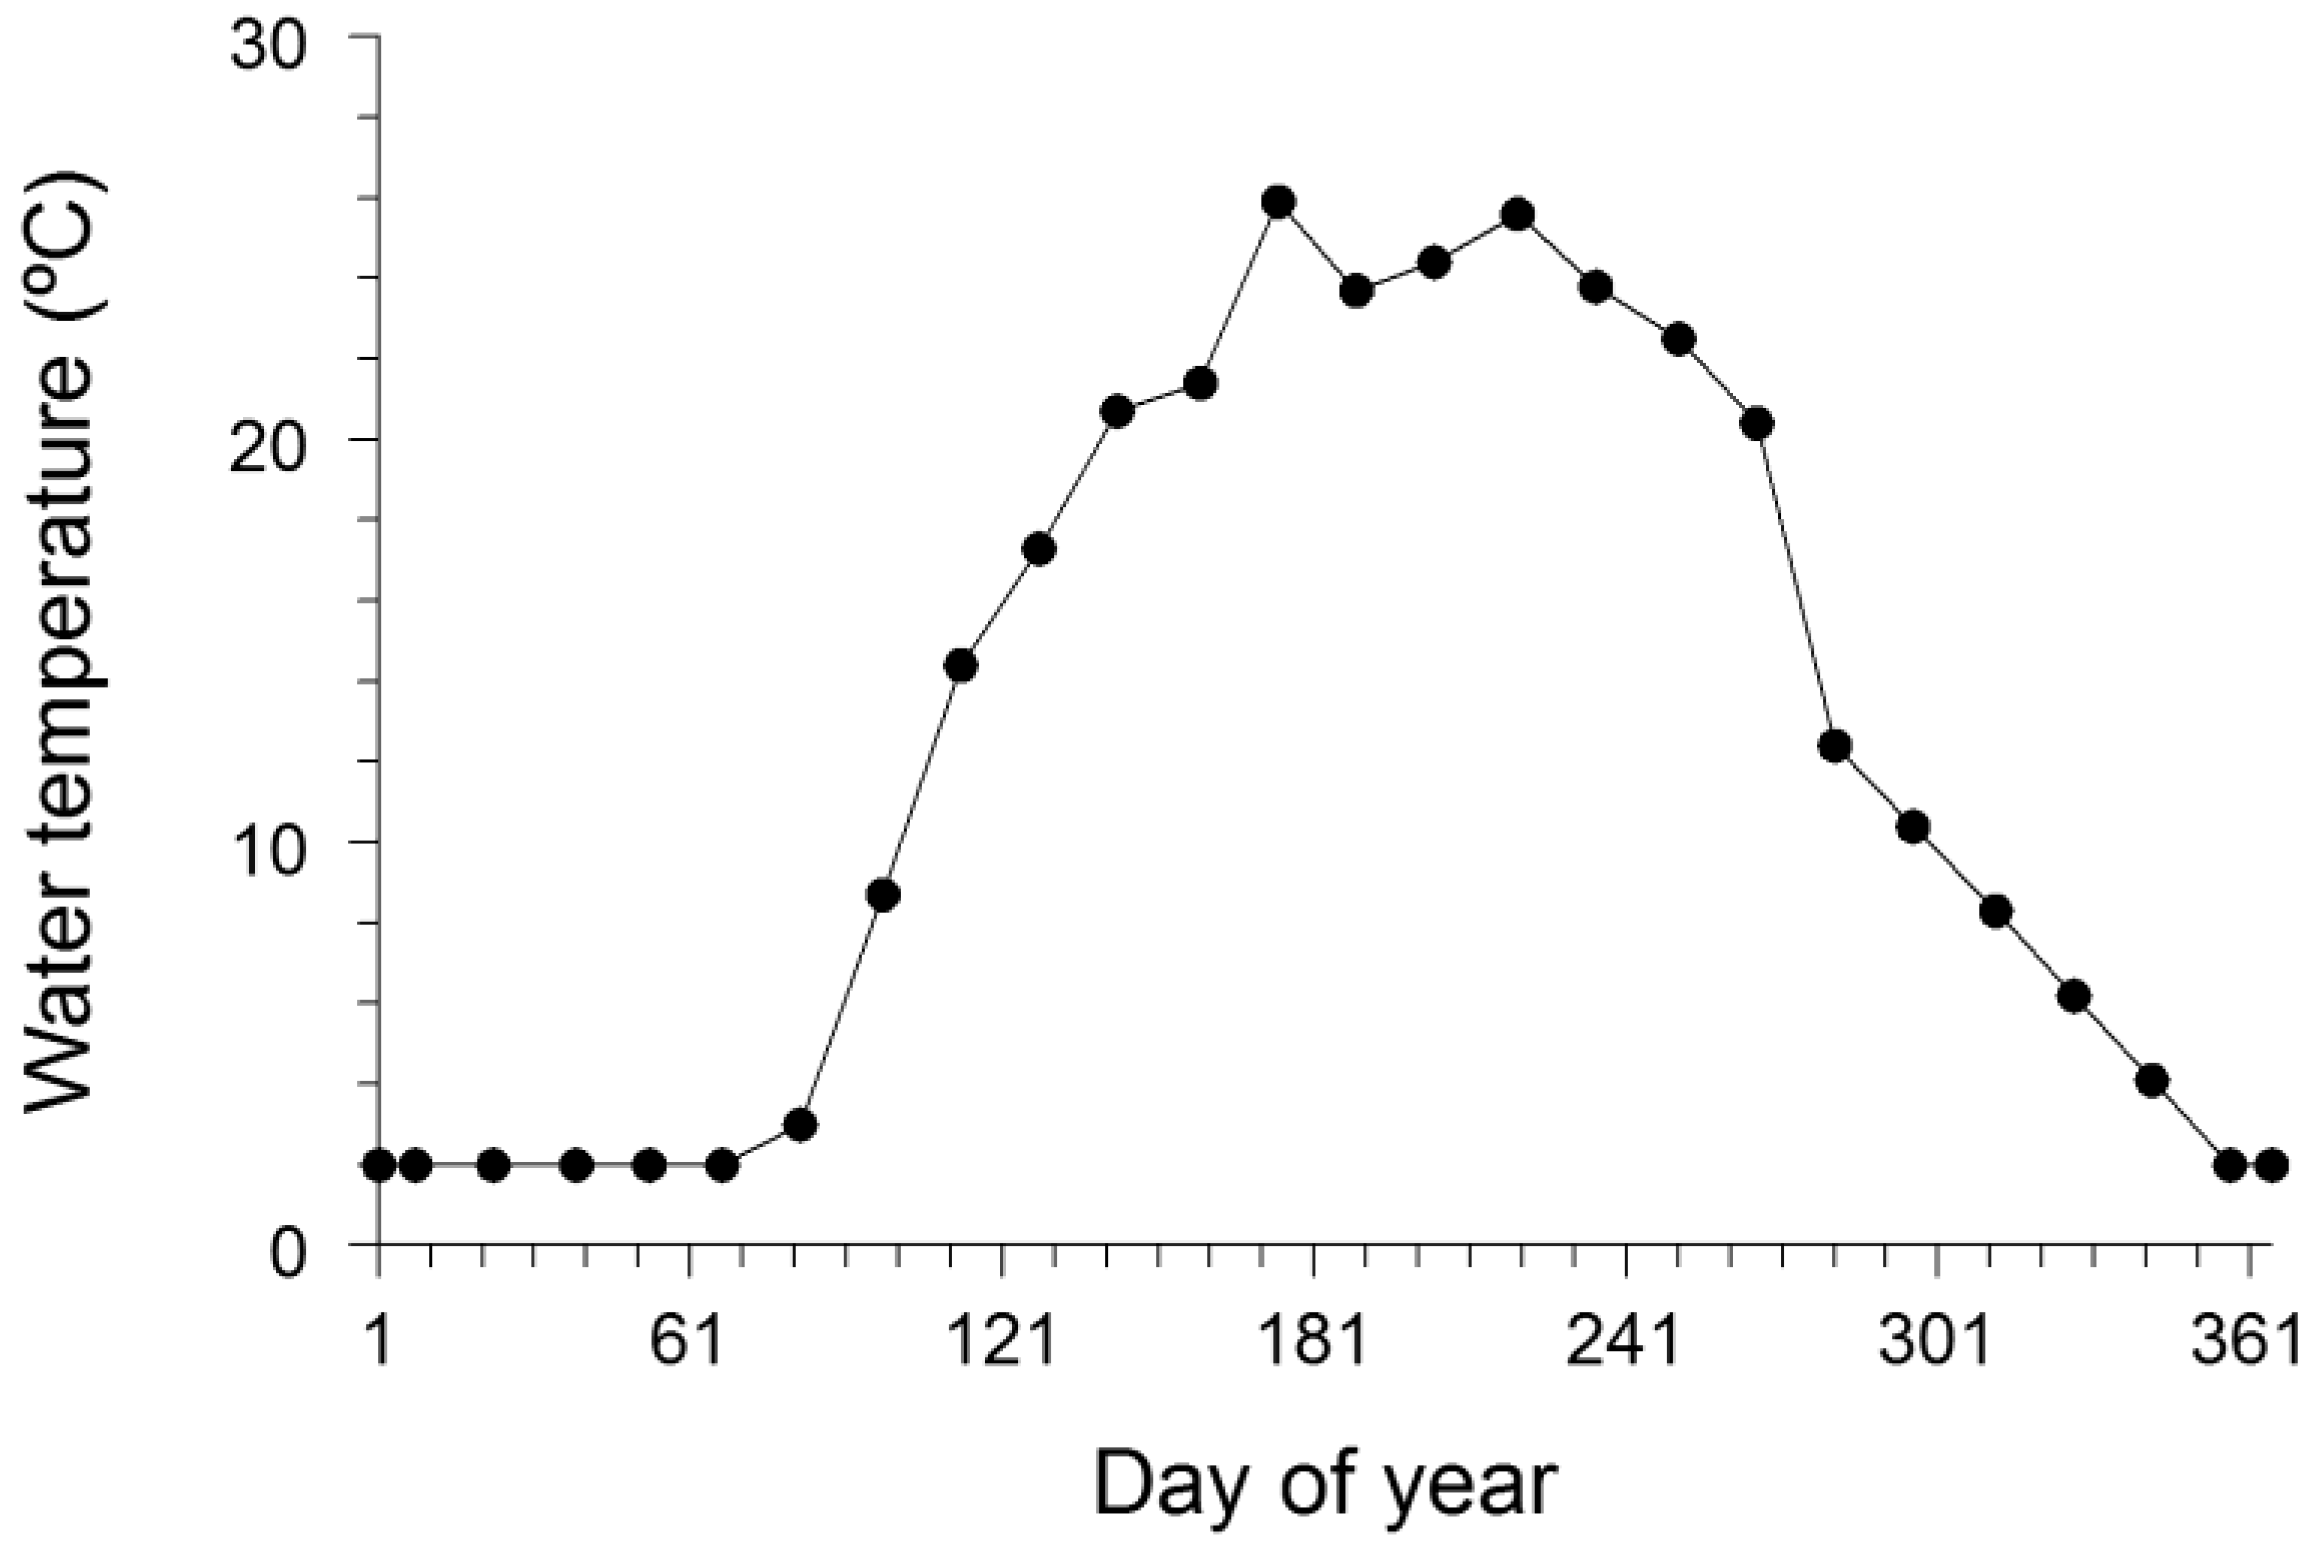
Input data, including the water temperature regime experienced by the bluegills, diet composition, and energy densities of both prey and the bluegill, for the bioenergetics model simulations were taken from a variety of sources. Daily water temperature data for Greens Lake, a shallow lake in Oakland County, MI, were available from the Michigan Department of Natural Resources (Waterford Fisheries Office, Waterford, MI) for late April through late October 2009, and we used these water temperatures for developing a water temperature regime for bluegills in Squaw Lake. Daily water temperatures were averaged by half-month period, and then each average water temperature was assigned to the midpoint of the half-month period (
Figure 2). This same methodology was used in a walleye bioenergetics modeling study [
44]. To complete the water temperature regime, water temperature from late December through early March was assumed to be 2 °C and water temperature in late March was assumed to be 3 °C [
49,
50]. Further, water temperature was assumed to linearly increase from late March to late April and to linearly decrease from late October to late December. Diet composition data for bluegills were taken from Laarman and Schneider [
51], who identified the major prey categories (percent of diet on a wet-weight basis enclosed within parentheses) as terrestrial insects (39%), chironomids (20%), cladocerans (19%), other aquatic insects (13%), aquatic plants (8%), and fish (1%). Energy densities of terrestrial insects, chironomids, cladocerans, other aquatic insects, aquatic plants, and fish were assigned values of 6019, 3138, 1674, 4150, 2978, and 2300 J/g wet weight, respectively, based on published data [
47,
52,
53,
54,
55,
56]. Bluegill energy density was assigned a value of 4186 J/g wet weight [
46].
Figure 2.
Water temperature regime used in the bioenergetics model application to growth data for bluegills in Squaw Lake (Oakland County, MI, USA). This water temperature regime was primarily based on daily water temperatures observed in Greens Lake (Oakland County, MI, USA) during 2009. Day 1 was 1 January, and day 365 was 31 December. See text for more details.
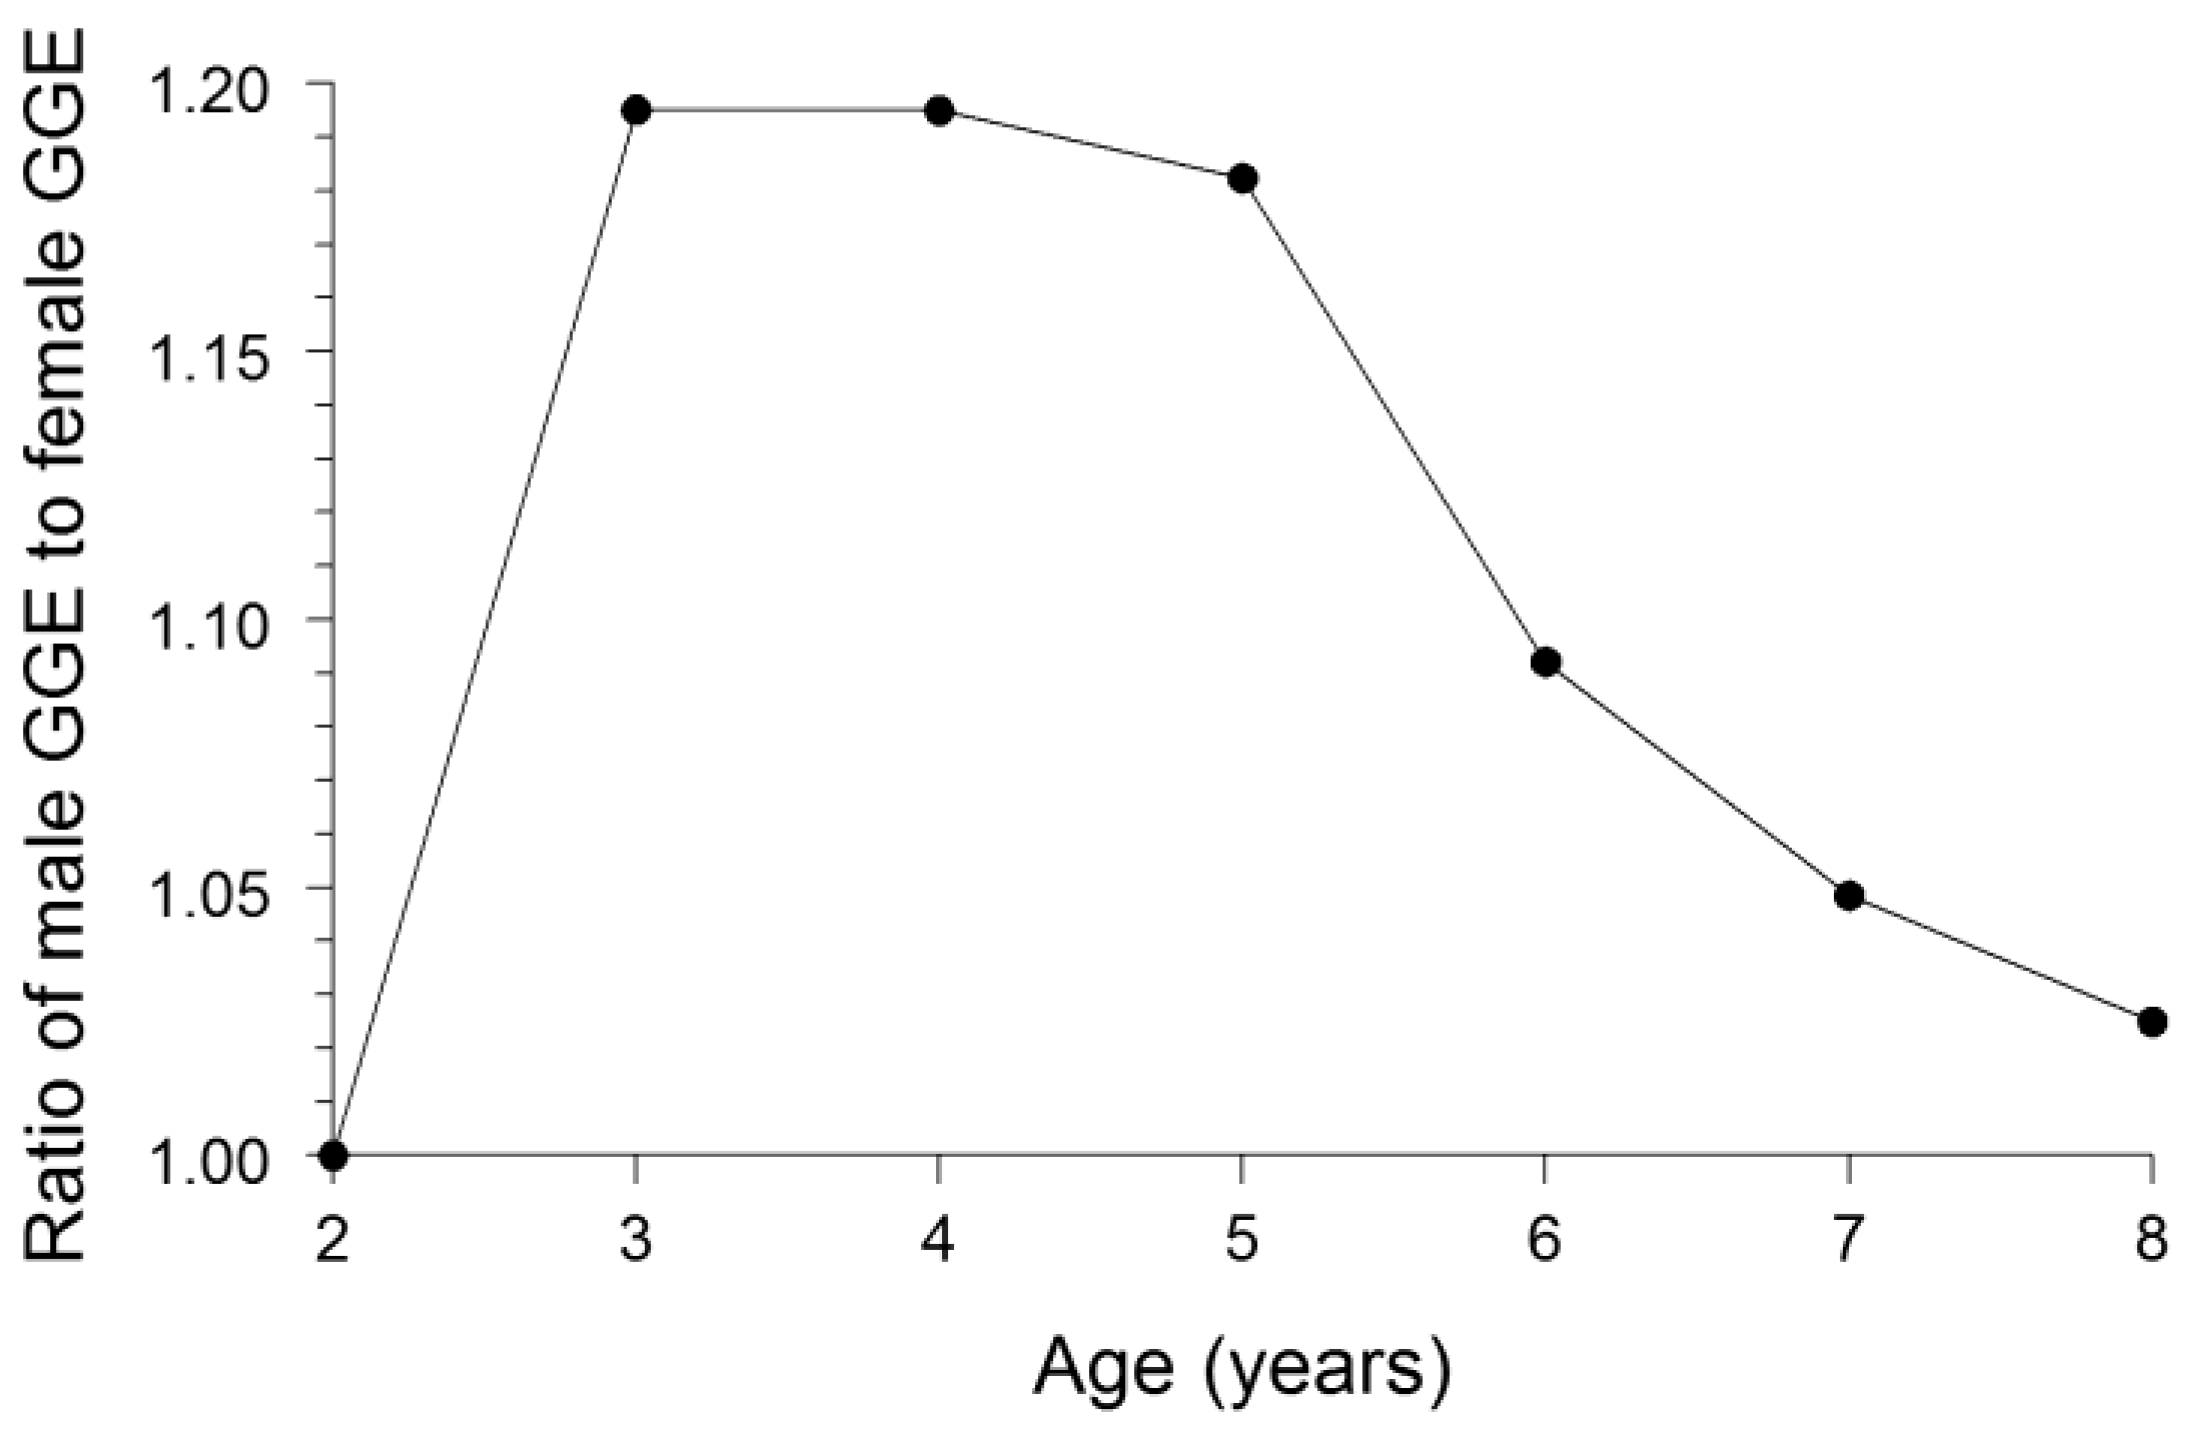
Cumulative GGE for each sex of bluegill was calculated by dividing the increase in bluegill weight by the cumulative amount of food consumption, as estimated by the bioenergetics modeling, needed to attain the observed growth. The ratio of cumulative GGE for males to cumulative GGE for females for each of the bluegill ages 2–8 was then calculated. If the growth dilution effect were to fully explain the difference in Hg concentrations between the sexes, then the ratio of GGE for males to GGE for females would equal the ratio of Hg concentration in females to Hg concentration in males.
4. Discussion
We conclude that the most plausible explanation for the female bluegills having whole-fish Hg concentrations 27% greater than that of male bluegills was: (1) males grew substantially faster than females, and (2) males eliminated Hg from their bodies at a faster rate than females. The faster growth in males resulted in a greater dilution of the accumulated Hg in males. Our bioenergetics modeling results indicated that the growth dilution effect could account for females being 14% higher in Hg concentration than males. Thus, the growth dilution effect was responsible for most of the observed difference in Hg concentrations between the sexes. Nonetheless, a substantially faster rate of Hg elimination by males compared with females was likely another important factor driving the difference in Hg concentrations between the sexes. Given that male bluegills probably ingested food (and Hg) at a higher rate than female bluegills owing to a higher rate of energy expenditure by males [
30], the growth dilution effect and the higher Hg-elimination rate in males compared with females more than compensated for this presumably higher rate of Hg ingestion by males. Thus, female bluegills were higher in Hg concentration than males.
Our results indicated that the bluegill can be added to the list of fish species in which females exhibit higher whole-fish Hg concentrations than males. Female burbot (
Lota lota) were found to be 22% greater in Hg concentration than male burbot [
31]. Similarly, we documented that female bluegills were 27% higher in Hg concentration than male bluegills. However, the growth dilution effect made no contribution whatsoever to the observed difference in Hg concentrations between the sexes of burbot [
31], whereas we concluded that the growth dilution effect was the primary driver of the observed difference in Hg concentrations between the sexes of bluegill. Thus, these results suggested that the relative difference in Hg-elimination rates between the sexes of burbot exceeded the relative difference in Hg-elimination rates between the sexes of bluegill. Androgens such as testosterone and 11-ketotestosterone may enhance Hg-elimination rate in male teleost fishes [
31].
We found that female bluegills were significantly higher in Hg concentration than male bluegills. Similarly, Nicoletto and Hendricks [
33] concluded that females were significantly greater in Hg concentration than males in four species of sunfishes, including bluegill. However, we estimated the relative difference in Hg concentrations between the sexes to be 26.6%, whereas Nicoletto and Hendricks [
33] reported the relative difference between the sexes to be as high as 45%. A plausible explanation for this difference between our results and the results from the Nicoletto and Hendricks [
33] study was that our results were based on whole-fish Hg determinations, whereas the Nicoletto and Hendricks [
33] study was based on determinations of Hg concentration in a small (about 0.5 g) plug of white muscle. Perhaps, use of a small plug of white muscle tissue inflated the relative difference in Hg concentrations between the sexes. Alternatively, other factors may have been responsible for this difference between our results and those of Nicoletto and Hendricks [
33]. Nonetheless, our findings also indicated that skin-off fillet Hg concentrations accurately reflected the relative difference in whole-fish Hg concentrations between the sexes of bluegill. Females were 25.4% and 26.6% higher in skin-off fillet and whole-fish Hg concentrations, respectively, than males.
Whole-fish Hg determinations are useful in ecological studies in which Hg is used as a tracer of food consumption by fish [
57,
58], whereas fillet Hg determinations are used in developing fish consumption advisories [
28,
29]. Becker and Bigham [
35] concluded that for most fish species, fillet Hg concentrations are just 10% greater, on average, than whole-fish Hg concentrations. Thus, fillet Hg concentration has been used as a surrogate for whole-fish Hg concentration in food tracer studies [
57,
58]. However, Becker and Bigham [
35] noted that in the case of bluegill, fillet Hg concentration was substantially greater than whole-fish Hg concentration. Similarly, we found that skin-off fillet Hg concentration exceeded whole-fish Hg concentration by a factor of 2.3, on average, in bluegills.
Our findings should prove useful in revising consumption advisories for bluegills caught in small inland lakes in southeastern Michigan. The Michigan Department of Health and Human Services (MDHHS), U.S. Environmental Protection Agency (EPA), Ontario Ministry of the Environment (OMOE), and U.S. Food and Drug Administration (FDA) have set thresholds of 70, 300, 610 (for the general public), and 1000 ng/g, respectively, for Hg concentrations in fish eaten by people, and these agencies advise either restricted consumption or no consumption when these thresholds are exceeded [
29,
59,
60]. Mean skin-off fillet Hg concentration of Squaw Lake bluegill was estimated to be 363 ng/g, which exceeds the EPA guideline. Further, all 53 skin-off fillet Hg concentrations determined in our study exceeded the MDHHS threshold, 28 exceeded the EPA guideline, and four exceeded the OMOE guideline. Based on the observed Hg concentrations, the MDHHS would advise restricting consumption of Squaw Lake bluegills to no more than two meals per month, guidance that is more restrictive than the agency’s recommendation of eight meals per month for bluegills from untested waters [
60]. Clearly, bluegills in at least some of the small inland lakes in southeastern Michigan have elevated Hg concentrations relative to the state average. As such, additional monitoring of fish tissue Hg concentrations in these small lakes would be very useful in revising consumption advisories.
Our findings will also be useful in refining the mercury mass balance models used to estimate food consumption by fish. Use of mercury mass balance models to estimate food consumption by fish has dramatically increased since 2000 [
57,
58,
61,
62]. The mercury elimination submodel used in these mass balance models does not allow for the Hg-elimination rate to vary by fish species or sex [
63]. However, recent research has shown that Hg-elimination rates may vary substantially between fish species, as well as between the sexes of a particular species of fish [
31,
32]. Concentrations of certain androgens appear to play an important role in regulating Hg-elimination rate. Our Hg determinations can be used to further refine the mercury mass balance model for bluegills.
Conclusions from our bioenergetics modeling were robust to uncertainties in the model inputs. We have defined the growth dilution effect as the relative difference in GGEs between the sexes solely due to a difference in growth rates between the sexes. The degree of bias in GGE estimates arising from inaccuracies in the values used for model inputs should be similar for both sexes. Thus, the ratio of GGE in males to GGE in females should be relatively unaffected by these biases. In addition, results from sensitivity analyses for fish bioenergetics models in previous studies have indicated that model estimates of food consumption are relatively insensitive to perturbations in the values of most of the model parameters [
64,
65]. Further, the remaining model parameters, for which perturbations in their values have a relatively large effect on food consumption estimates, are often associated with a high degree of confidence in their estimated values. Finally, laboratory evaluations of fish bioenergetics model performance have revealed that bioenergetics model estimates of cumulative food consumption by fish over an extended period of time (3–14 months) are typically within 10% of the observed cumulative food consumption [
66,
67].
We may expect the relative differences in PCB concentrations between the sexes of bluegill from Squaw Lake to be somewhat lower than the relative differences in PCB concentrations between the sexes of other fish populations previously documented. Based on data for six fish species (other than bluegill), mature males were 15%–45% higher in PCB concentrations than mature females, and these higher PCB concentrations in the males were primarily attributable to a greater rate of energy expenditure in males, stemming from higher activity and a greater SMR [
30]. Thus, not only do males apparently exceed females in swimming activity, but males apparently expend energy at a higher rate than females when both sexes are at rest. Averaging across these six fish species, males were 25%–30% greater in PCB concentration compared with females. For two of these six fish species, growth did not vary between the sexes. For the other four fish species, females grew faster than males. However, the growth dilution effect was found to make a substantial contribution to the observed difference in PCB concentrations between the sexes in only one of these four species [
34,
44]. Given the results of our study indicating that the growth dilution effect would lead to female bluegills being 14% higher in PCB concentration than male bluegills, we may expect that PCB concentration in male bluegills would exceed PCB concentration in female bluegills by only 10%–15%. Release at eggs by females at spawning was considered to be a potential factor contributing to the higher PCB concentrations observed in males, but was concluded to be an unimportant contributor to the relative difference in PCB concentrations between the sexes in most cases [
30,
34]. One of the main reasons for this conclusion was that two of the six above-mentioned fish species were semelparous. That is, for these two species, the fish spawned only once during their lifetime and died soon thereafter. Moreover, the fish were caught prior to spawning. Thus, release of eggs at spawning could not, in any way, account for the higher PCB concentrations in the males because the fish had never spawned prior to capture. In addition, determinations of PCB concentrations in both the ovaries and the somatic tissue of ripe females have shown that in several species of fish, the PCB concentration in the somatic tissue exceeds the PCB concentration in the ovaries [
30,
34]. Thus, when the female releases her eggs, her PCB concentration actually increases. An increase in the PCB concentration of the females immediately after spawning due to release of eggs could not, in any way, explain the higher PCB concentrations in males. Note that even though the PCB body burden of females decreases immediately after spawning due to release of eggs, PCB concentration of females will actually increase immediately after spawning if the PCB concentration of the eggs is lower than the PCB concentration of the somatic tissue [
34].
5. Conclusions
Squaw Lake, a small and shallow lake in southeastern Michigan (USA), was the site of our study. Adult female bluegills from Squaw Lake averaged 171 ng/g in whole-fish Hg concentration, whereas adult male bluegills from Squaw Lake averaged 135 ng/g in whole-fish Hg concentration. Thus, females were 26.6% greater in whole-fish Hg concentration than males. We conclude that this difference between the sexes was most likely attributable to: (1) males growing at a substantially faster rate than females, and (2) males eliminating Hg from their bodies at a substantially faster rate than females. Bioenergetics modeling results indicated that the faster growth by males could account for females being 14.4% higher in Hg concentration compared with males. Thus, this growth dilution effect accounted for most of the difference in Hg concentrations between the sexes. Previous research results have indicated that Hg-elimination rate for males is considerably faster than that for females in teleost fishes, and this presumed difference in Hg-elimination rates between the sexes could explain the remaining portion of the difference in whole-fish Hg concentrations between the sexes of the bluegills.
Determinations of skin-off fillet Hg concentrations in the bluegills showed that the relative difference in skin-off fillet Hg concentrations between the sexes was similar to the relative difference in whole-fish Hg concentrations between the sexes. Skin-off fillet and whole-fish Hg concentrations were 25.4% higher and 26.6% higher, respectively, in females than in males, on average. Nevertheless, mean skin-off fillet Hg concentration (363 ng/g) was 2.3 times greater than mean whole-fish Hg concentration (155 ng/g).
Our findings should be useful for revising consumption advisories for bluegills caught in small inland lakes in southeastern Michigan, as well as for refining mercury mass balance models used to estimate food consumption by fish. Mean skin-off fillet Hg concentration for Squaw Lake bluegills was 363 ng/g, which was considerably higher than the average concentration for bluegills in the Michigan Department of Health and Human Services (MDHHS) database. At this elevated level, the MDHHS would advise restricting consumption of Squaw Lake bluegills to no more than two meals per month. In contrast, the agency’s recommendation would be eight meals per month for untested waters in Michigan. Additional monitoring of fish tissue Hg concentrations in these small lakes would also be very useful in revising fish consumption advisories. At present, the mercury elimination submodel used in mercury mass balance models does not allow for the Hg-elimination rate to vary by fish species or sex. Yet, results from recent research have indicated that Hg-elimination rates can differ between species and sexes. Our results can be used to further refine the mercury mass balance model for bluegills, thereby leading to more accurate estimates of food consumption by bluegills.


