Article

Alteration of Water Pollution Level with the Seasonal Changes in Mean Daily Discharge in Three Main Rivers around Dhaka City, Bangladesh

1
Department of Environmental Biology and Chemistry, Graduate School of Science and Engineering for Research, University of Toyama, Gofuku 3190, Toyama 930-8555, Japan
2
Department of Environmental Sciences, Jahangirnagar University, Dhaka-1342, Bangladesh
3
School of Bioscience, The University of Nottingham, Malaysia, Jalan Broga, 43500 Semenyih, Selangor, Malaysia
4
Group of Environmental Adaptation Science, Faculty of Environmental Earth Science Hokkaido University, Sapporo 060-0810, Japan
5
Environmental Health Sciences, Faculty of Health Sciences, Hokkaido University, Sapporo 060-0812, Japan
*
Author to whom correspondence should be addressed.
Environments 2015, 2(3), 280-294; https://doi.org/10.3390/environments2030280
Submission received: 30 March 2015 / Revised: 27 May 2015 / Accepted: 4 June 2015 / Published: 26 June 2015

Abstract

:
A study based on the physicochemical parameters and dissolved metals levels from three main rivers around Dhaka City, Bangladesh, was conducted in order to determine the present pollution status and their alteration trends with the seasonal change of discharge amount. The water samples were collected from the rivers Buriganga, Turag, and Shitalakkhya during both dry and monsoon seasons. Physicochemical analyses revealed that most of the water quality parameters exceeded the recommended levels set by the Department of Environment (DoE), Bangladesh, during both the dry and monsoon seasons. A very strong positive correlation was found between biochemical oxygen demand (BOD) and chemical oxygen demand (COD) in all sampling points. Both BOD and COD values had a strong negative correlation with dissolved oxygen (DO) in the Shitalakkhya River. Most of the dissolved metals concentrations in the water samples were similar. However, the concentrations of different physicochemical properties varied with the seasons. The dry season had significantly higher contamination loads, which were decreased during the monsoon season. Anthropogenic activities, as well as the variation in river water flow during different seasons were the main reasons for this high degree of water pollution.

Graphical Abstract

1. Introduction

The surface water quality of a region is determined by the local topography, hydrology, and hydrogeology in the catchment area, along with climatic factors and anthropogenic influences [1,2]. Rivers constitute major inland surface water sources for domestic, agricultural and industrial purposes and are essential for the development of human civilization. However, surface water has the highest susceptibility to pollution because of waste and wastewater accessibility [3]. In recent years, the river systems in Bangladesh have become more polluted as a consequence of rapid population growth, uncontrolled development on the riverbanks, urbanization, unplanned industrialization, and agricultural operations [4]. Industries are prime polluters because they utilize a huge amount of water and release untreated wastewater throughout the production cycle of a product. Newly booming processing industries such as tanneries, steel plants, battery producers, engineering, and textiles also contribute to this problem [5]. The careless disposal of untreated wastewater and solid waste to the water system significantly contributes to the poor quality of the water. Tanneries and textile industries are among the largest surface water polluters, and their wastewater alters the physicochemical and biological properties of the aquatic ecosystem in Bangladesh. Rivers are also being polluted with the leachate from solid waste as rainwater sweeps through where it is dumped. In addition to industrial sources, human feces also extensively contaminate surface water when sanitation is generally poor [6].
Dhaka City, the capital of Bangladesh, is one of the most overcrowded cities in the world with a population of more than 16 million. It is located on the northern bank of the Buriganga River and is surrounded by some other rivers: the Turag, Dhaleshwari, Tongi canal, Balu, and Shitalakkhya. Most of the industries and factories are situated on the banks of these rivers or close to the river system. There are more than 7000 industries located mostly in three main areas of the Hazaribagh, Tejgaon and Dhaka-Narayanganj-Demra dam areas in Dhaka City beside these rivers [7]. The rivers around Dhaka City are increasingly being polluted as a result of a huge volume of toxic wastes from industrial areas and sewage lines [8] and also petroleum discharge from ships, launches, cargoes, boats, etc. [9]. The Buriganga and linked rivers (Turag, Tongi Khal, Balu, Sitalakkhya and Dhaleswari) receives about 60,000 m3/day of toxic wastes discharged mainly from nine major industrial clusters (Tongi, Hazaribagh, Tejgaon, Tarabo, Narayanganj, Savar, Gazipur, DEPZ, Ghorashal) [10]. Bangladesh Poribesh Andolon (BAPA) reported that a total of 6000 tons of liquid waste is dumped into the Buriganga every day, half of which comes from Hazaribagh tanneries [11]. Another study revealed that Hazaribagh tanneries generate 7.7 million L of liquid waste and 88 million tons of solid waste everyday [12]. Moreover, at least 7000 tons of solid wastes are generated in and around the Dhaka City Corporation area every day [13]. A schematic of contamination loads to the rivers around Dhaka City from different sources is shown in Figure 1. The pollution load increases with annual increases in the population. The physicochemical and metal parameters beyond threshold level can represent potential health and environmental risks to the people living around these rivers, and during the dry season the pollution level becomes even higher due to the reduced mean daily discharges (MDD) of these rivers.
Figure 1. The schematic diagram of river pollution around Dhaka City from different pollution sources. The main sources include industrial untreated wastewater, tannery waste, municipal solid waste, household waste, etc.
Environments 02 00280 g001
The aim of the present study was to investigate the physicochemical properties and heavy metal content of three rivers around Dhaka City. The water quality parameters were compared with the inland surface water quality standards for waste from industries recommended by the Department of Environment (DoE), Ministry of Environment and Forest, Bangladesh [14]. The study also investigated the seasonal changes in the contaminant loads with the changes in river flow. It is important to analyze the seasonal variation in contaminant loads in Bangladesh because the fluvial environment is largely controlled by seasonal fluctuations [15]. Some of the previously reported studies described only the physicochemical properties and biochemistry of the river water [15,16,17,18,19] and a few others have dealt with the seasonal and spatial distribution of heavy metals [20,21]. However, research that correlates the physicochemical parameters and metal concentrations with river flow has not yet been reported.

2. Materials and Methods
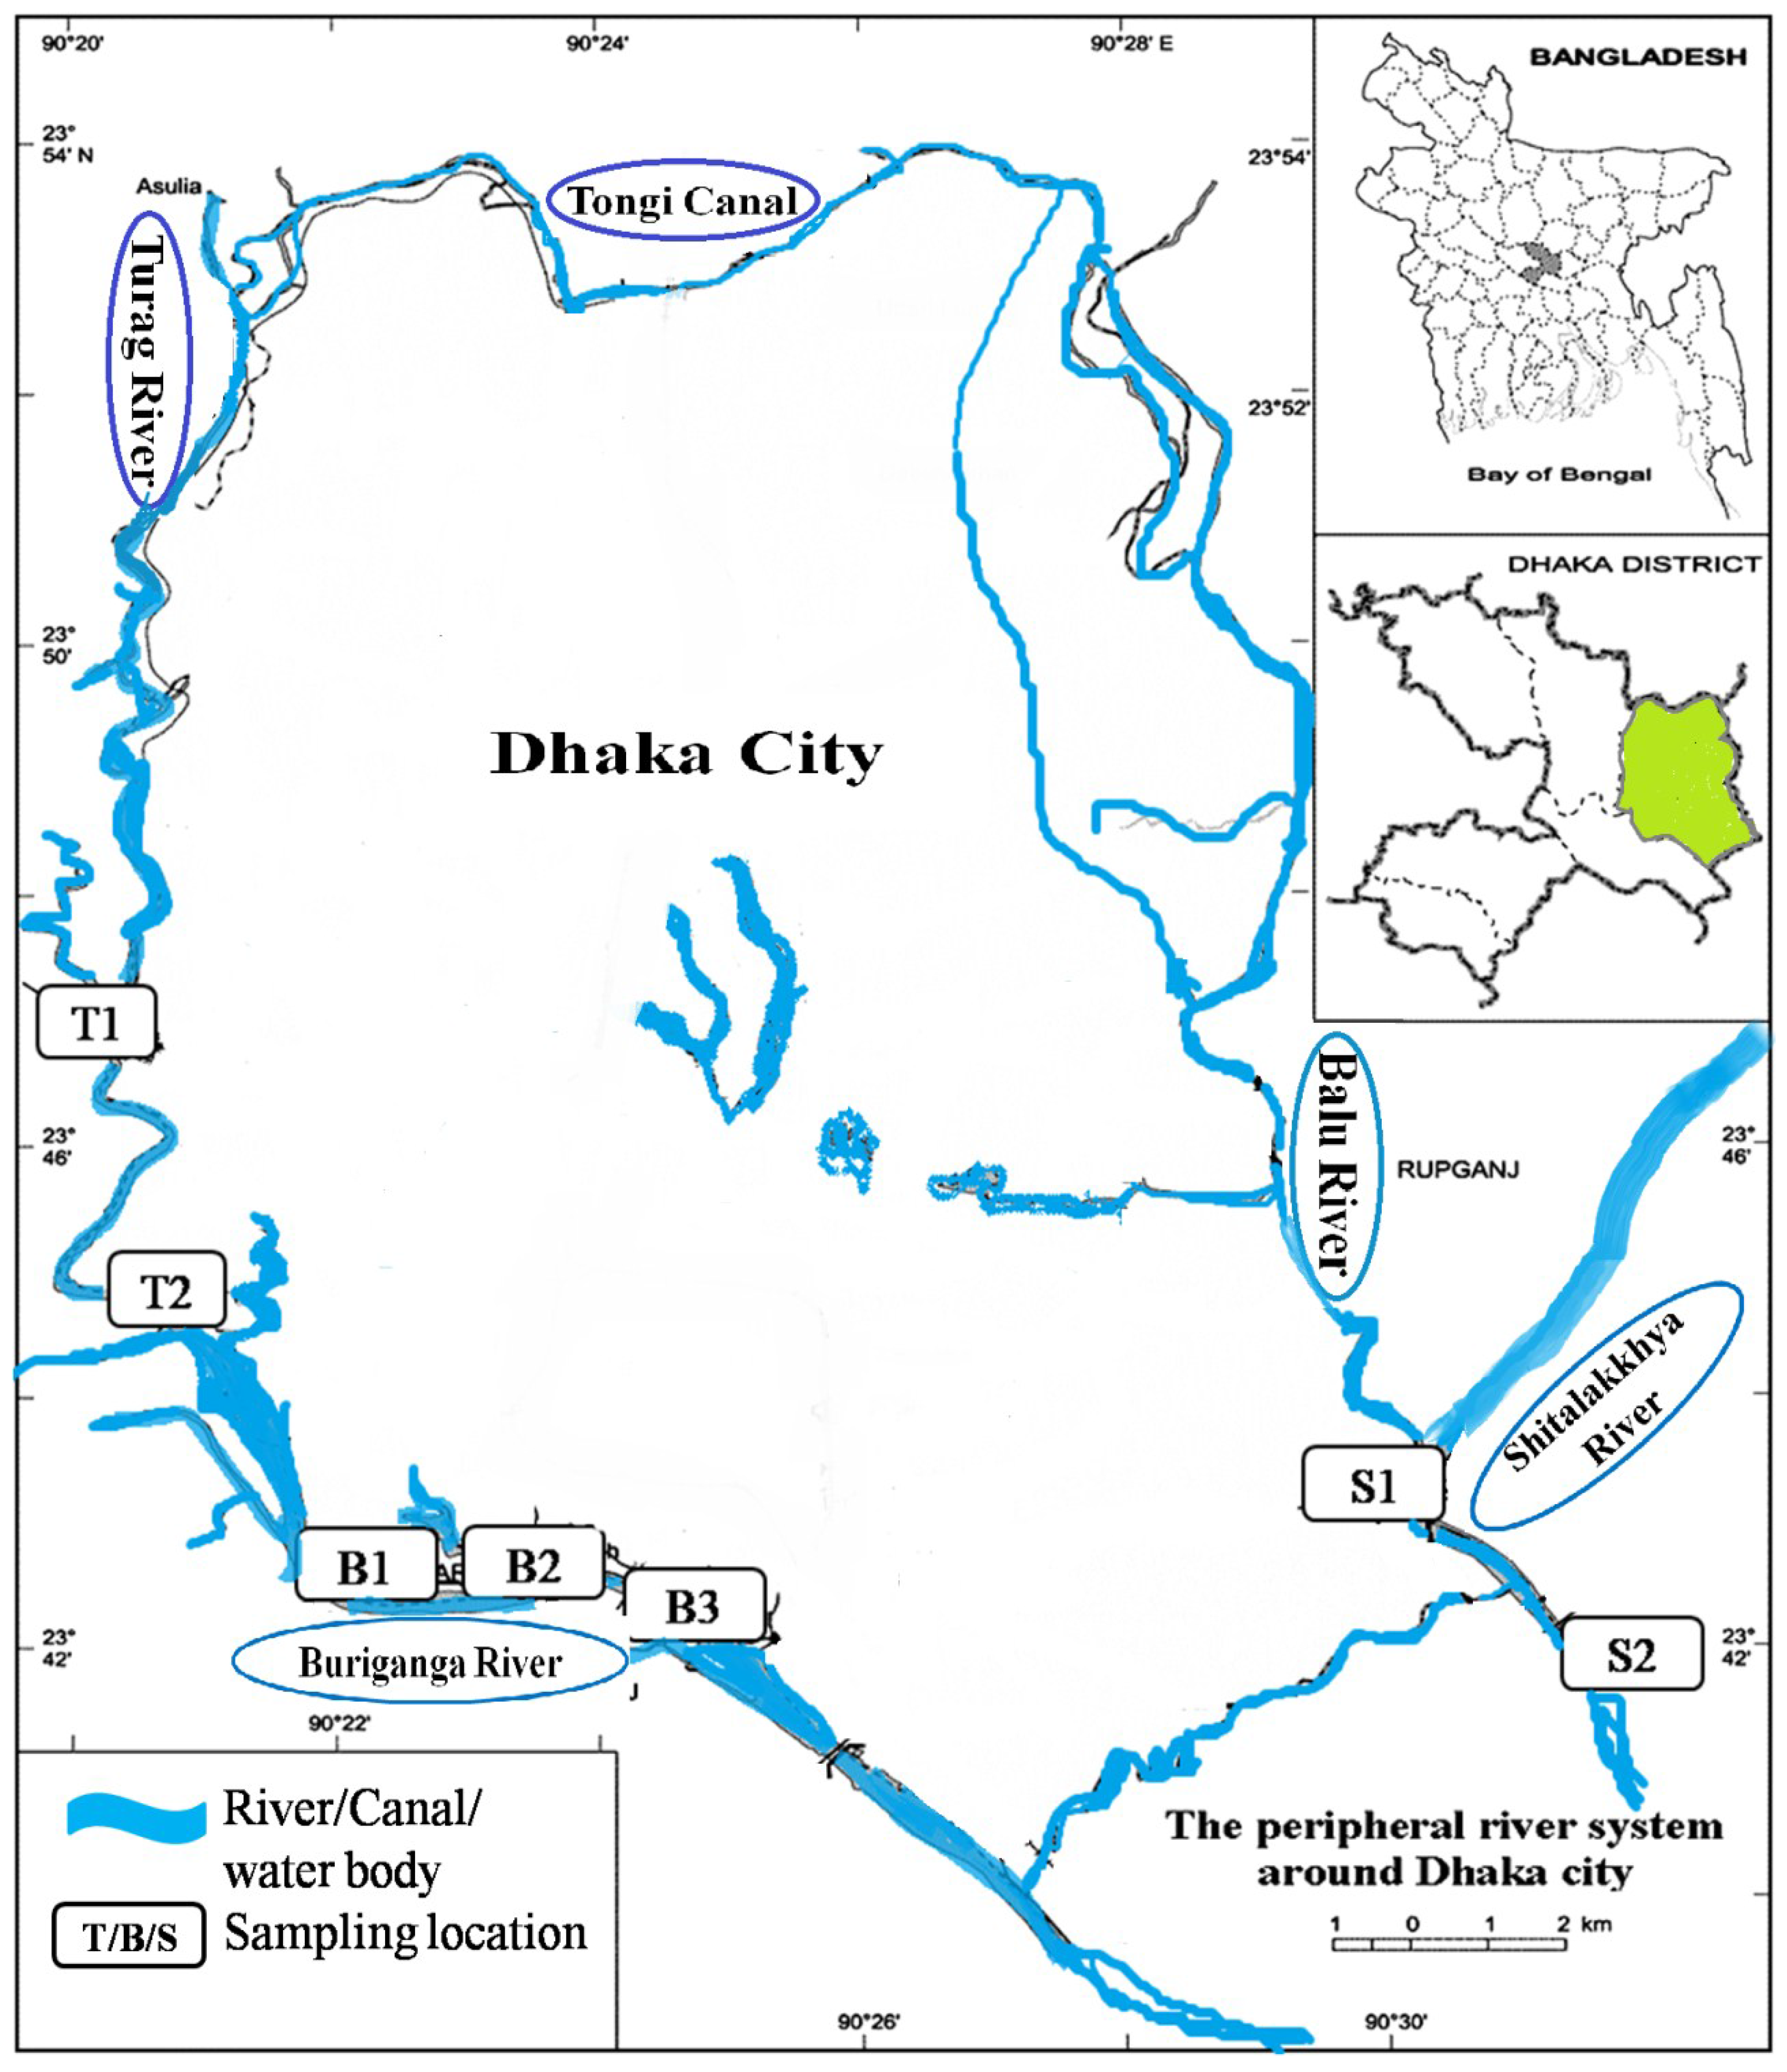
2.1. Study Area

The water samples were collected from the Buriganga, Shitalakkhya, and Turag Rivers. The Buriganga River is one of the most important rivers for Dhaka City. It originates from the Dhaleshwari River and is a tide-influenced river flowing west and then south of Dhaka City. It is only 27 km long and its average width and depth are 400 and 10 m, respectively. Its catchment area is 253 km2. Most of the industries in Dhaka City are located around the Buriganga, and they release their wastewater into this river and hence it is becoming one of the most polluted rivers in Bangladesh. The indiscriminate disposal of domestic and industrial wastes, combined with the failure of authorities to enforce existing regulations to protect the ecological health of the river, has aggravated the situation to the point where the state of the Buriganga River has worsened both biologically and hydrologically. The second most polluted river is the Shitalakkhya, which links with the Buriganga River on the northwestern side of the capital. The length and average width of this river is 110 km and 300 m, respectively, and the average depth is 21 m. The Turag River is an upper tributary of the Buriganga River and originates from the Bangshi River that flows through Gazipur and joins with the Buriganga River at Mirpur, Dhaka. The catchment area of the Turag is located in the southern part of Modhupur, which covers 999.74 km2 [22]. In September 2009, the DoE declared the Turag River to be in an ecologically critical condition based on the heavy pollution discharged by the industries in the area. The Turag represents an important feature of the Dhaka City lifestyle because of the abundance of fish. Unfortunately, the uncontrolled dumping of industrial waste from the industries located along the banks of the river has greatly increased the river water pollution to a very dangerous level. The majority of the industries have made little effort to follow environmental law, and the water has become visibly discolored [23].

2.2. Sample Collection and Preservation

A total of 56 water samples were collected from August 2011 to July 2012 to observe the seasonal and spatial variations of the pollution load of the three rivers. Sampling was carried out during August, November and December in 2011; and February, March, April, May and July in 2012 from seven sampling locations as shown in Figure 2. The sampling time was chosen randomly, taking into consideration the dry and monsoon season representativeness. The designations T1 and T2 indicated the two sampling points in the Turag River; B1, B2, B3 are the three sampling points of the Buriganga River; and, S1, S2 are the sampling points in the Shitalakkhya River. The samples were collected from the river surface level during day time. At each point, a minimum of three samples were collected. The sampling sites were selected due to their extensive industrial and agricultural operations with several point sources and non-point sources of pollution. The point sources include numerous industries like leathers, textiles, metals processing, paper mills, electronic goods, power plant, fertilizers, pharmaceuticals, dyeing, battery manufacturing, ink manufacturing, metals melting, etc. In addition, disposal of solid wastes, untreated sewage, terminal and landing stations also contribute contaminant loads as point sources. The slothful flow throughout the year is characteristic of these rivers, except during the monsoon when rainfall causes a massive increase in the river flow.
The water samples were collected in sterilized containers with caps (500 mL) according to APHA method [24]. They were thoroughly cleaned by rinsing with 20% HNO3 and deionized water, followed by repeated washing with river water to avoid contamination in the bottle.
Figure 2. The sampling points in three main rivers around Dhaka City. The designations T1, B1, S1 represent the upstream and T2, B2, B3, S2 represent the downstream of each river.
Environments 02 00280 g002

2.3. General Water Quality Analyses

The physicochemical parameters such as pH (pHep, HANNA), electrical conductivity (EC) (HI 8033, HANNA), and dissolved oxygen (DO) (H19143, HANNA) of the samples were measured insitu. Aeration during sampling was avoided as much as possible. Total dissolved solid (TDS) was measured using a gravimetric method [24]. Chemical oxygen demand (COD) was measured via a Closed Reflux, Titrimetric Method [24] and biochemical oxygen demand (BOD) of the collected effluent samples was measured [24] using a HANNA Auto Cal. DO meter (HI 9143 microprocessor). In order to ensure analytical quality, three replicates of each sample were prepared and analyzed simultaneously.

2.4. Determination of Metals

In order to carry out the dissolved metal analysis, first, the river water samples were filtered using Millipore membrane filters (JHWP04700, Omnipore™, Carrigtwohill, Ireland) composed of mixed cellulose with 0.45 μm pores to remove the insoluble materials followed by acid digestion with concentrated ultra pure HNO3 for 1.5 h [24]. The pH of the samples was measured to keep it below 2. The digested samples were transferred into a volumetric flask to analyze metal ions with inductively coupled plasma-mass spectrometry (ICP-MS, Seiko SPQ-6500, Tokyo, Japan), using measurement conditions that were specific for metals [25].
The concentrations of dissolved metals were determined at the μg/L (ppb) level. The detection limits of ICP-MS were Al (0.005 μg/L), Mn (0.03 μg/L), Fe (0.005 μg/L), Cr (0.03 μg/L), Zn (0.05 μg/L), Cu (0.005 μg/L), Cd (0.03 μg/L), and Pb (0.005 μg/L). Standard solutions were prepared from 1000 mg/L stock solutions of different metals of interest (Wako Pure Chemicals Industries, Kyoto, Japan) by dilution with ultrapure water. The glassware was washed with nitric acid followed by distilled water. All the experiments were carried out in triplicate. The results were reproducible within an error limit of ±5%.

2.5. Statistical Analysis

The changing trends of physicochemical parameters and metal concentrations were calculated along with the variable mean daily discharge (MDD) values. The MDD values were originally collected from the Bangladesh Water Development Board (BWDB). To analyze the trends of change in contamination loads, a Microsoft Excel spreadsheet was applied. Spearman’s rank correlation matrix was also calculated for all physicochemical parameters to trace the correlation among the parameters with river flow. The significance level in this study was p < 0.05.

3. Results and Discussion

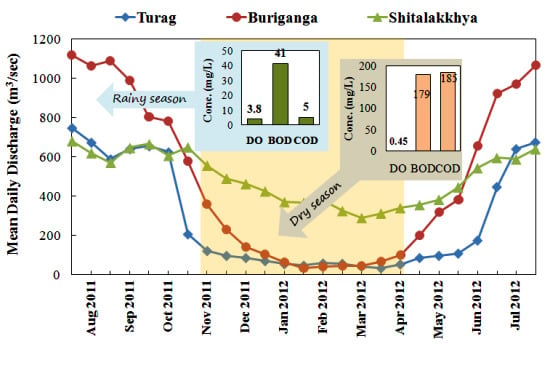
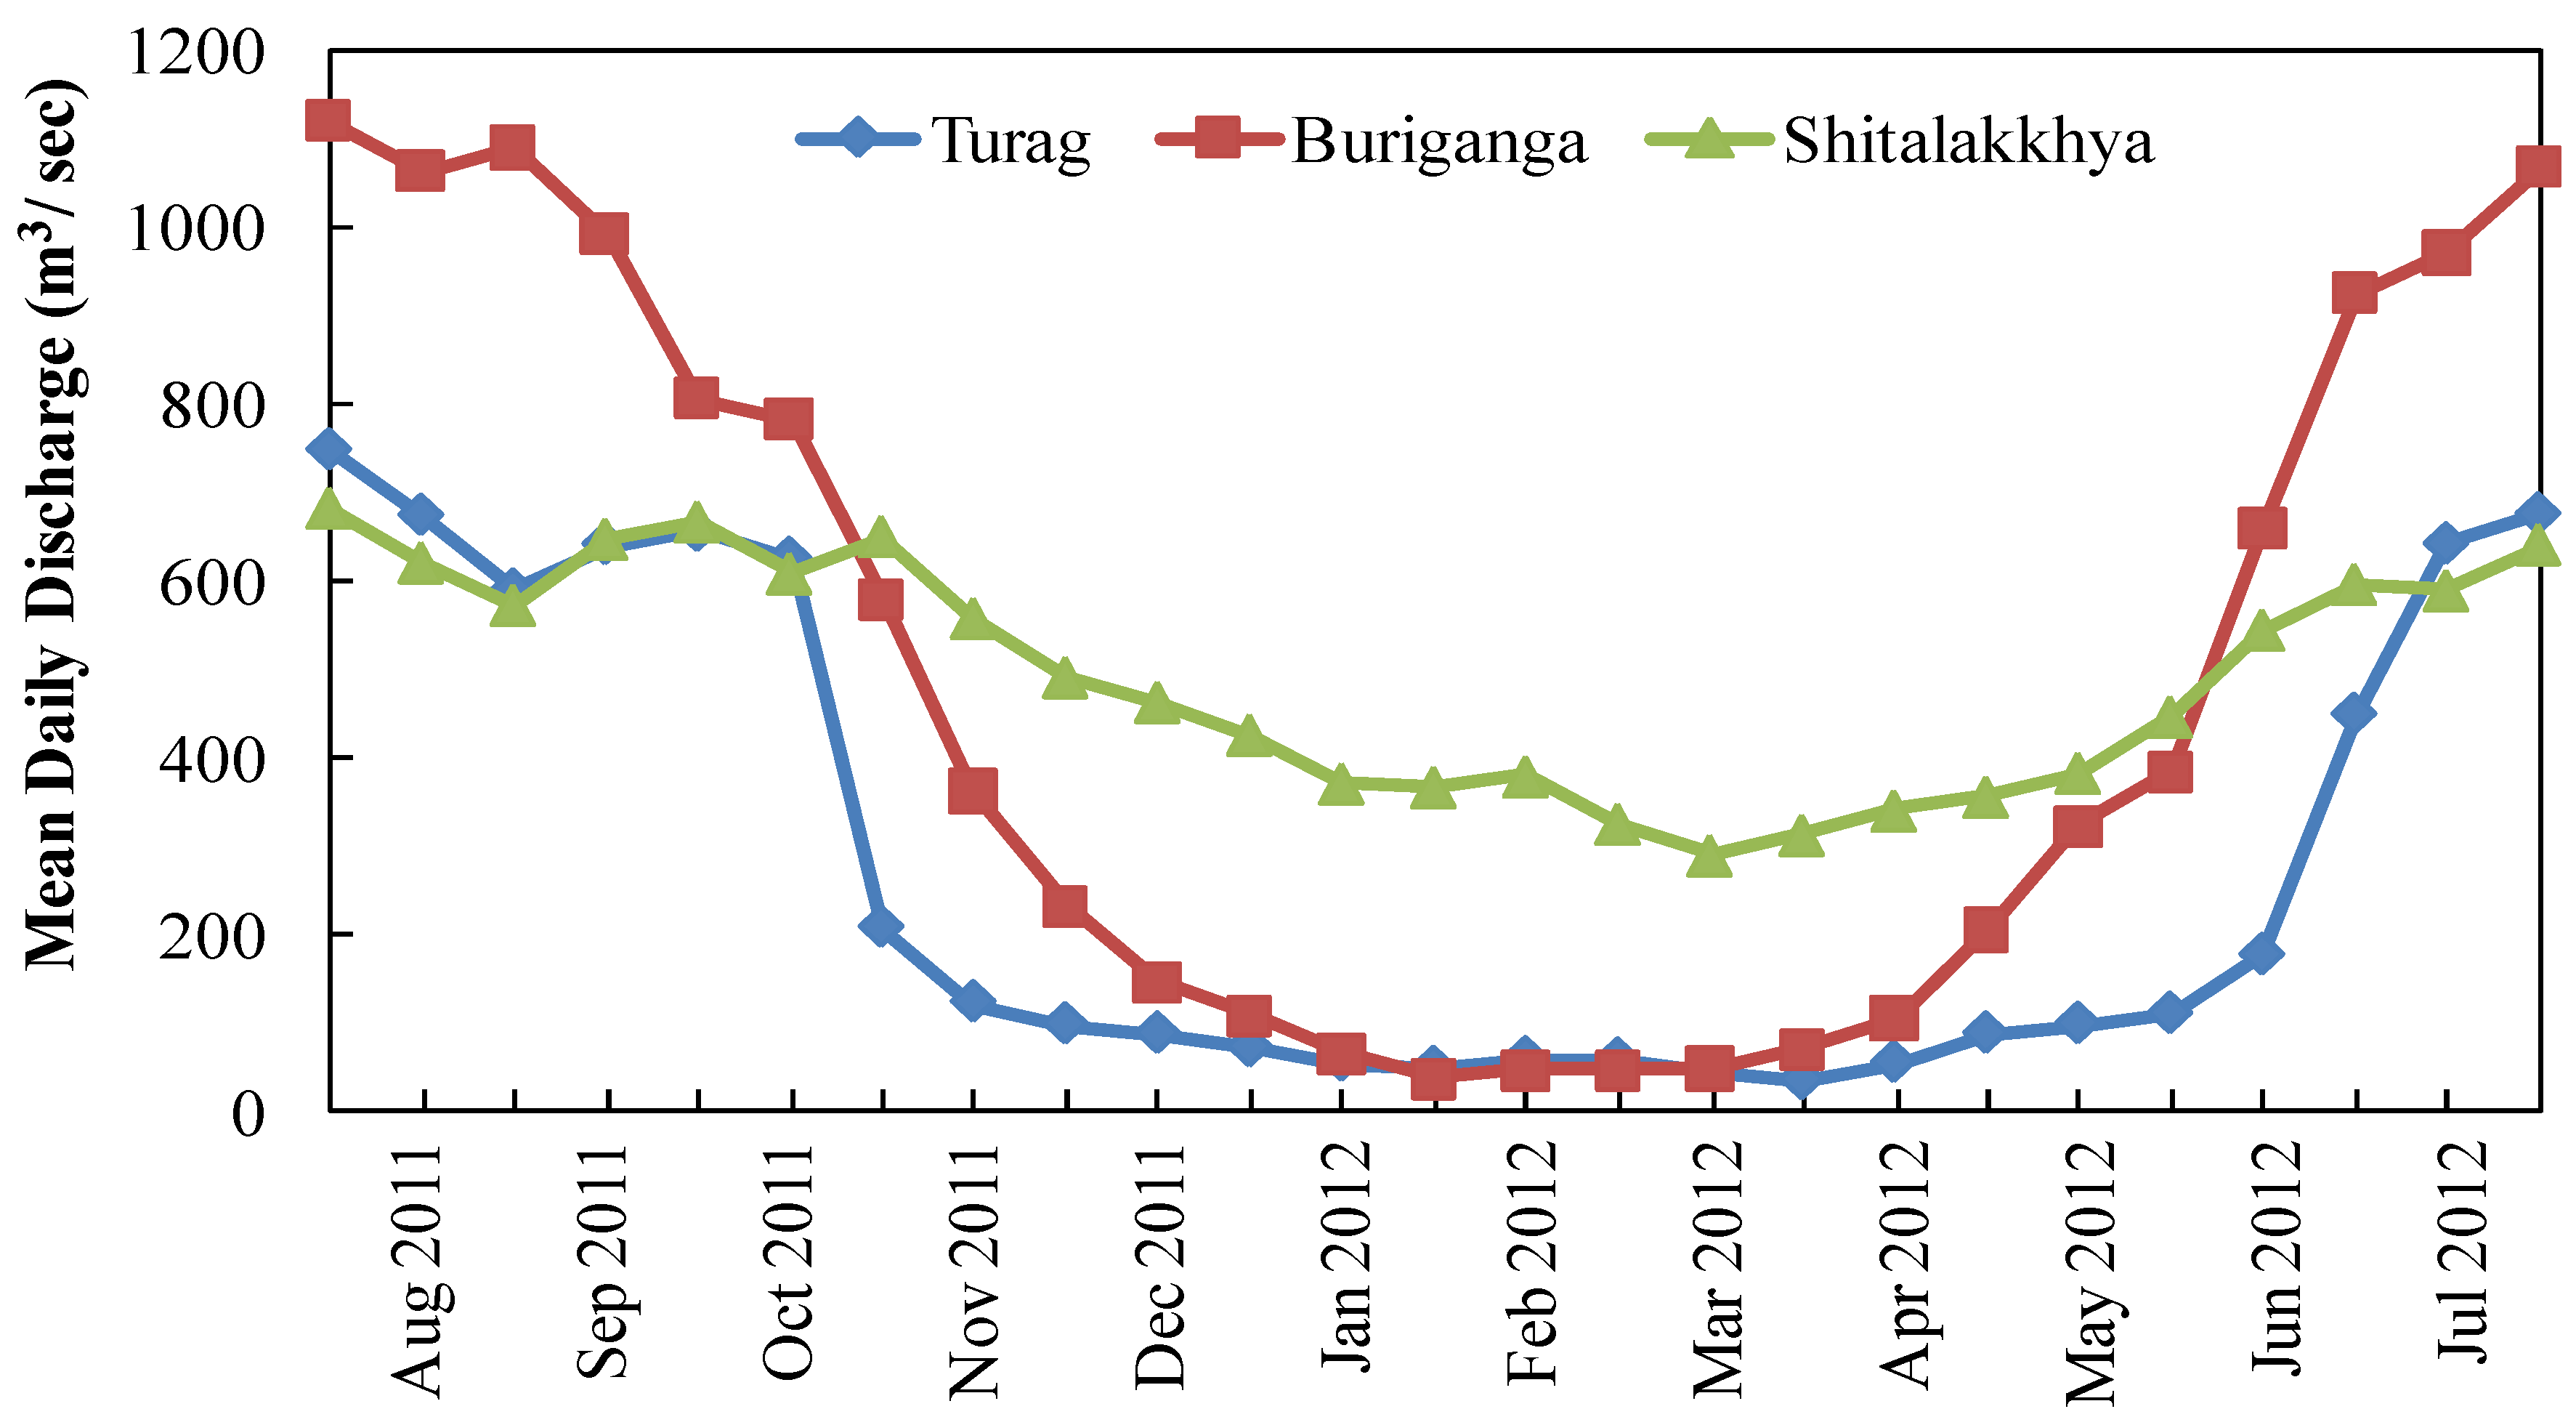
3.1. Average Discharge of the Rivers around Dhaka City

MDD value is the average discharge of any specified calendar day. The MDD value is vital for the measurement of contamination loads in a river because moving water dilutes and decomposes pollutants more rapidly than standing water. The MDD data of the three rivers around Dhaka City were calculated as shown in Figure 3. Each of the plots in the figure represents MDD averages for 15 days. The discharge rate increased during the wet season (May to October) and decreased during the dry season (November to April). The MDD value reached its peak during the months of July and August in the monsoon season. The main sources of the river water discharge are the upland water flow and rain.
The Turag and Shitalakkhya Rivers have a smaller catchment area than the Buriganga River, and the amount of discharge also differs. The highest MDD of the Buriganga River found during the study period was 1119 m3/s, which accounted for the duration of August 2011. It decreased to 36.5 m3/s during the first half of February, accumulating only 3.3% of the MDD amount of August. The Turag River showed a similar pattern of discharge reduction, 33.5 m3/s (4.5%) during the month of April from the highest value of 748.5 m3/s during August. The discharge did not fall below 290 m3/s in the case of the Shitalakkhya River and remained at 42.5% of its highest value collected in August (682 m3/s). The ratio for the decrement rate was higher for the Buriganga River than it was for the other two rivers. This may have been due to a decrease in the upstream flow from other rivers and canals. The Shitalakkhya River showed a gradually decreasing pattern over time whereas the trend observed for the other two rivers was different. The Buriganga and Turag Rivers had a gradual decrement until October followed by a rapid reduction in MDD. The recovery rate was also very high for the Buriganga River. This could be related to the shorter length of this river compared with the others.
Figure 3. Themean daily discharge (MDD) data of the three main rivers around Dhaka City, Bangladesh. Each of the plots represents a 15-day average MDD value.
Environments 02 00280 g003

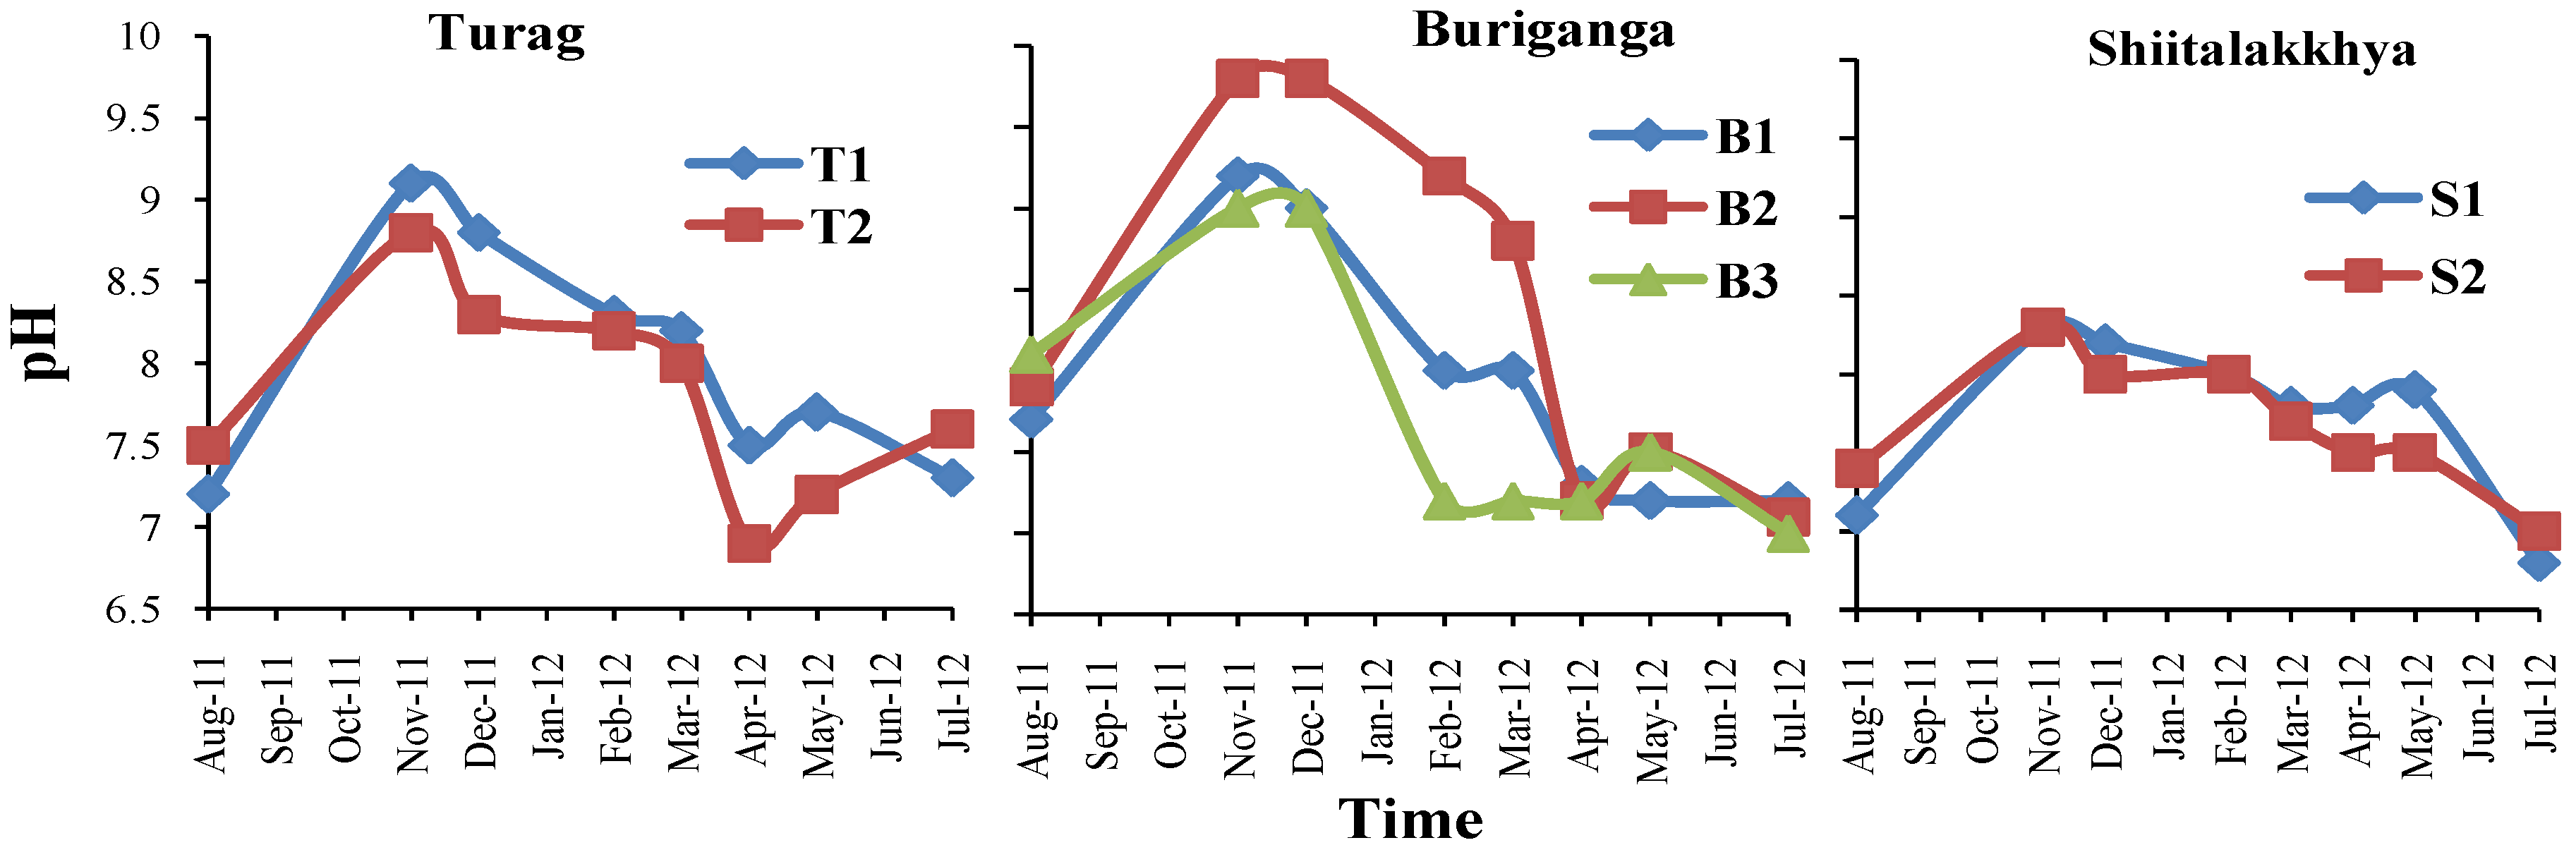
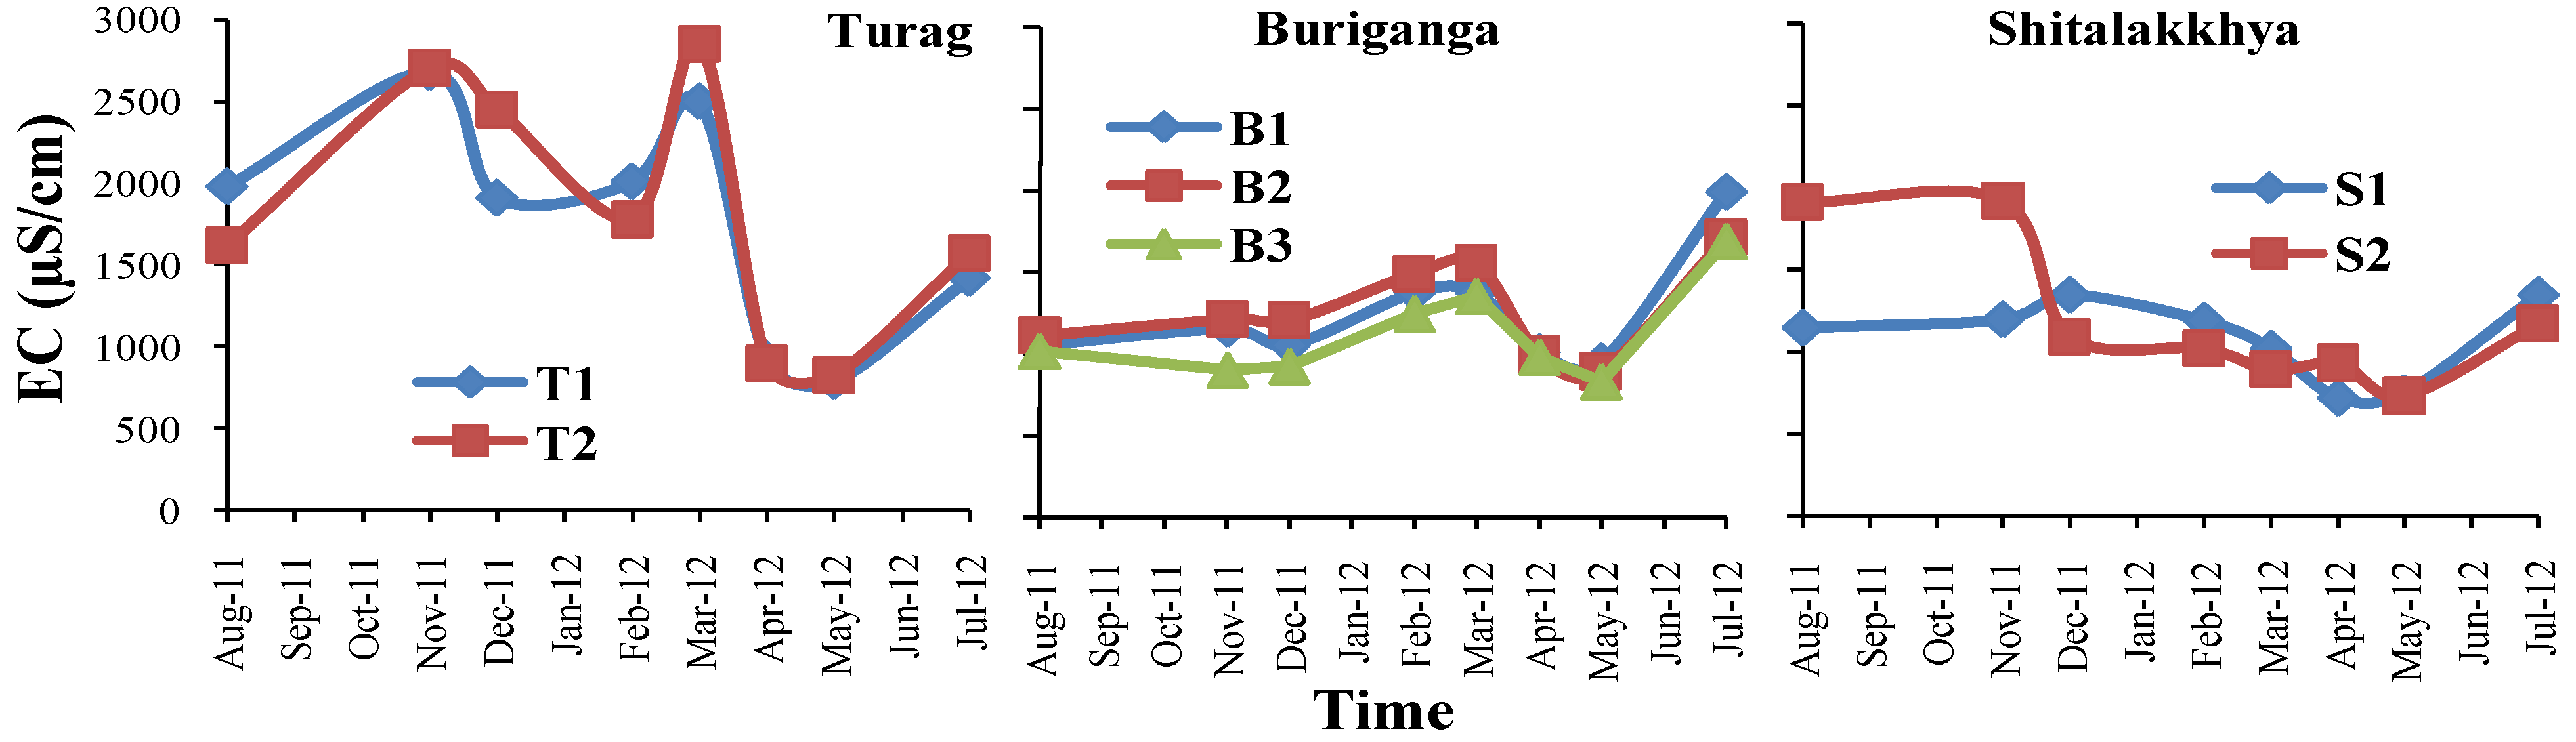
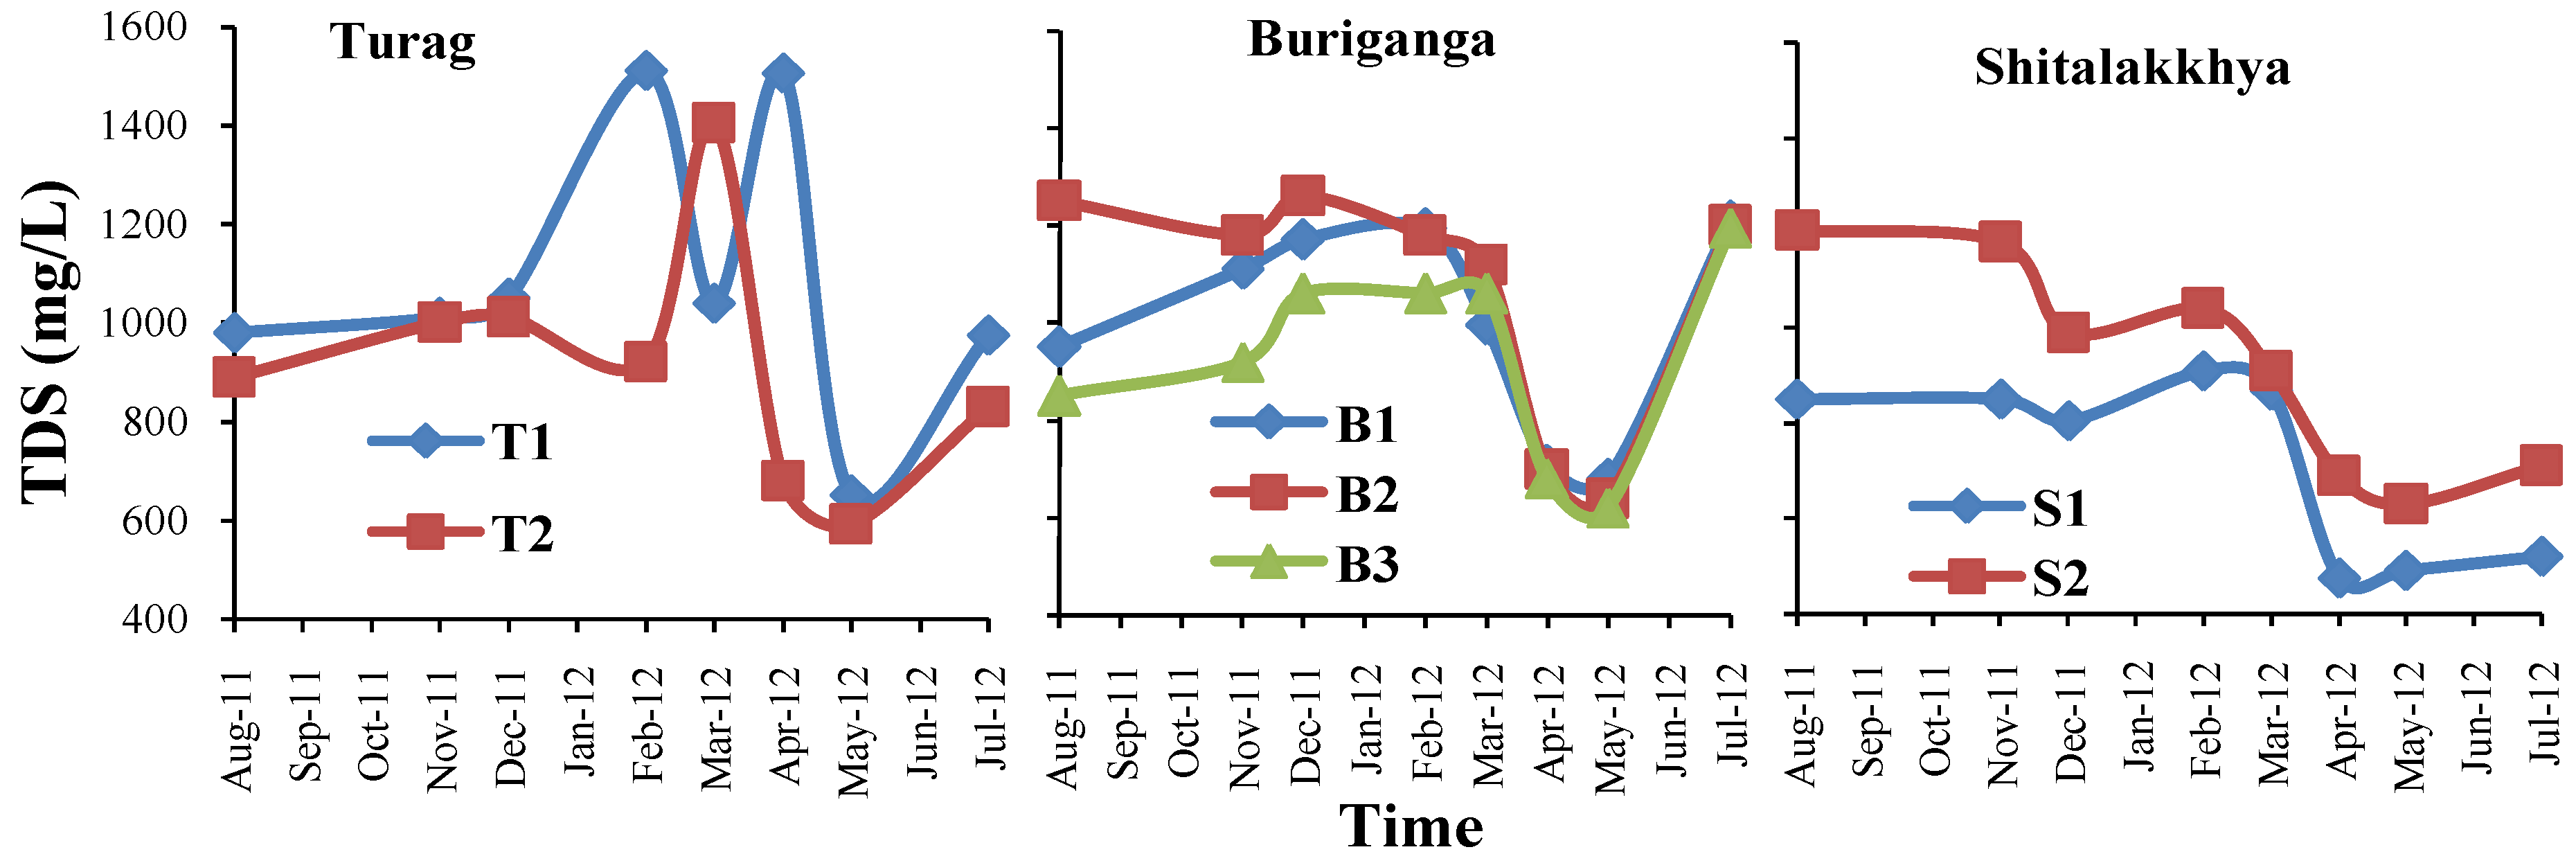
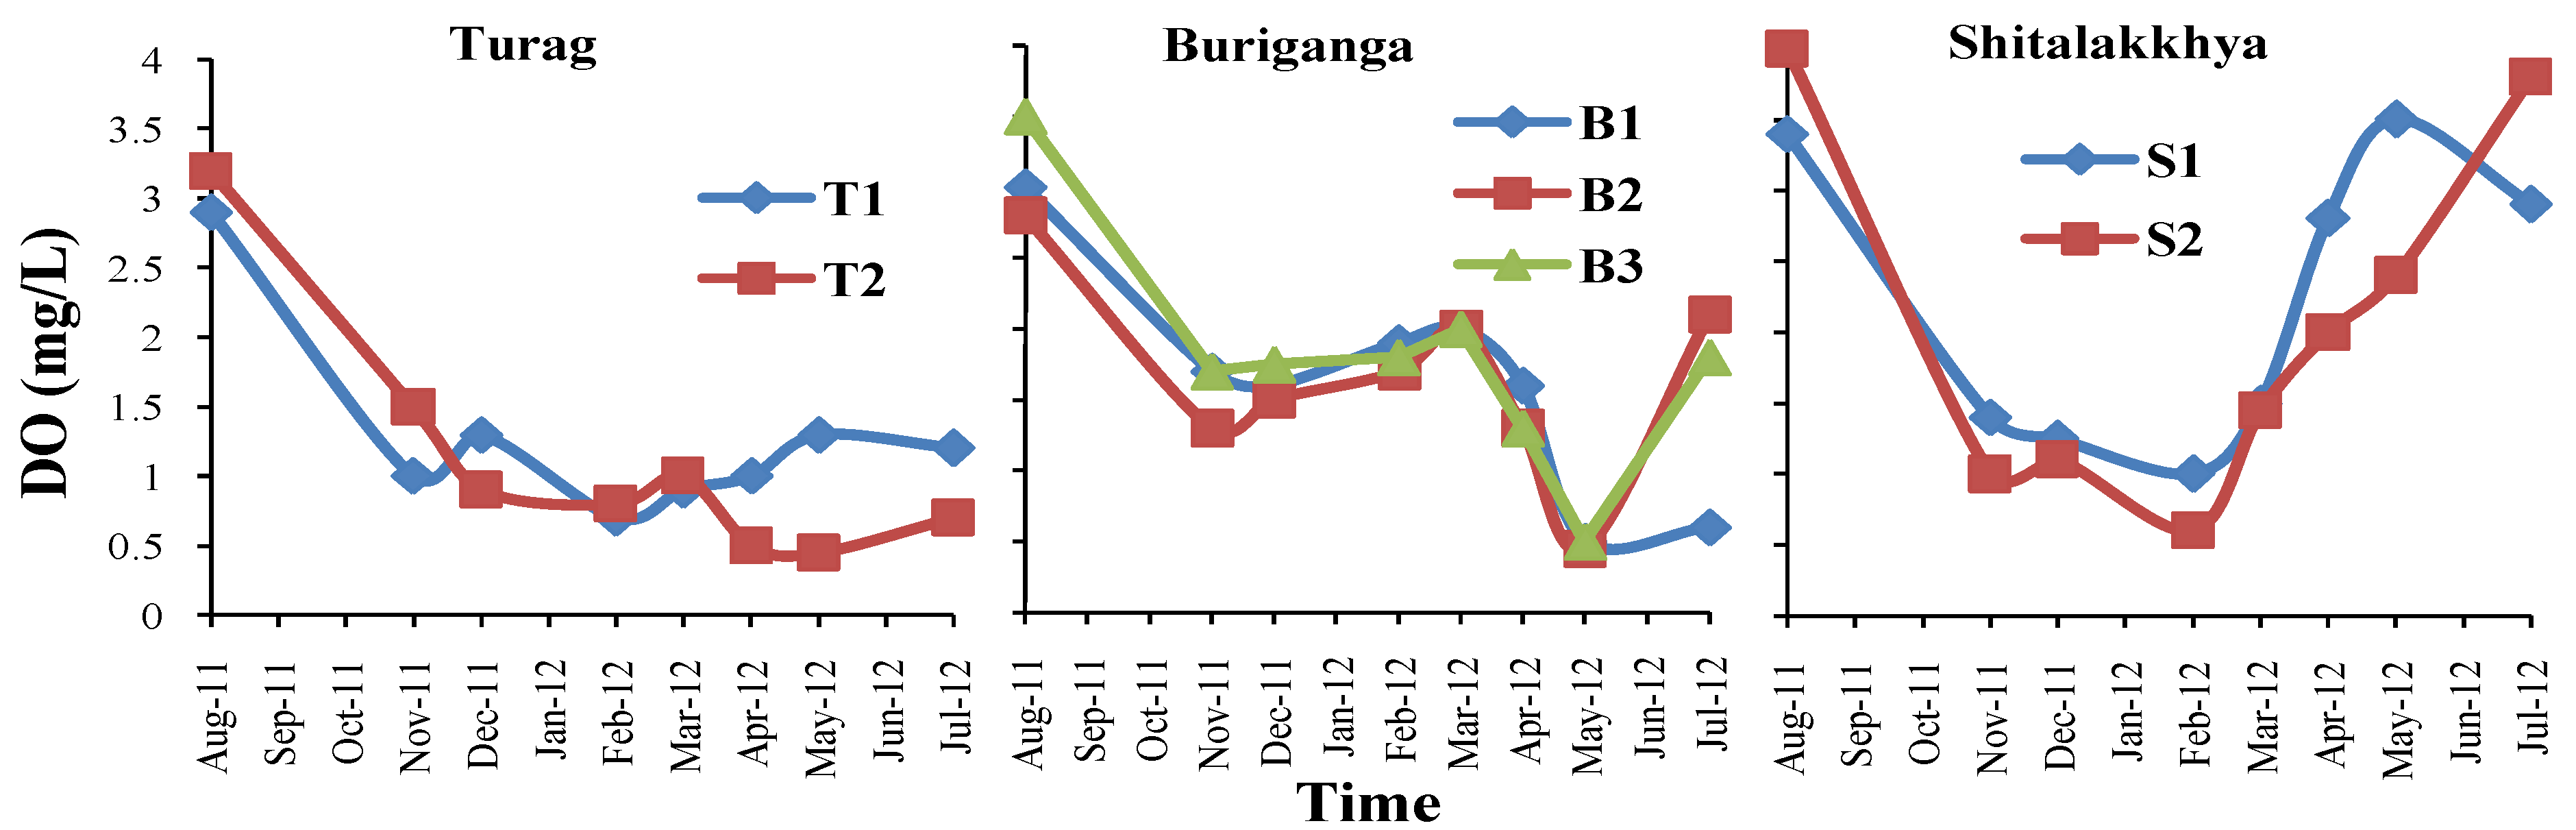
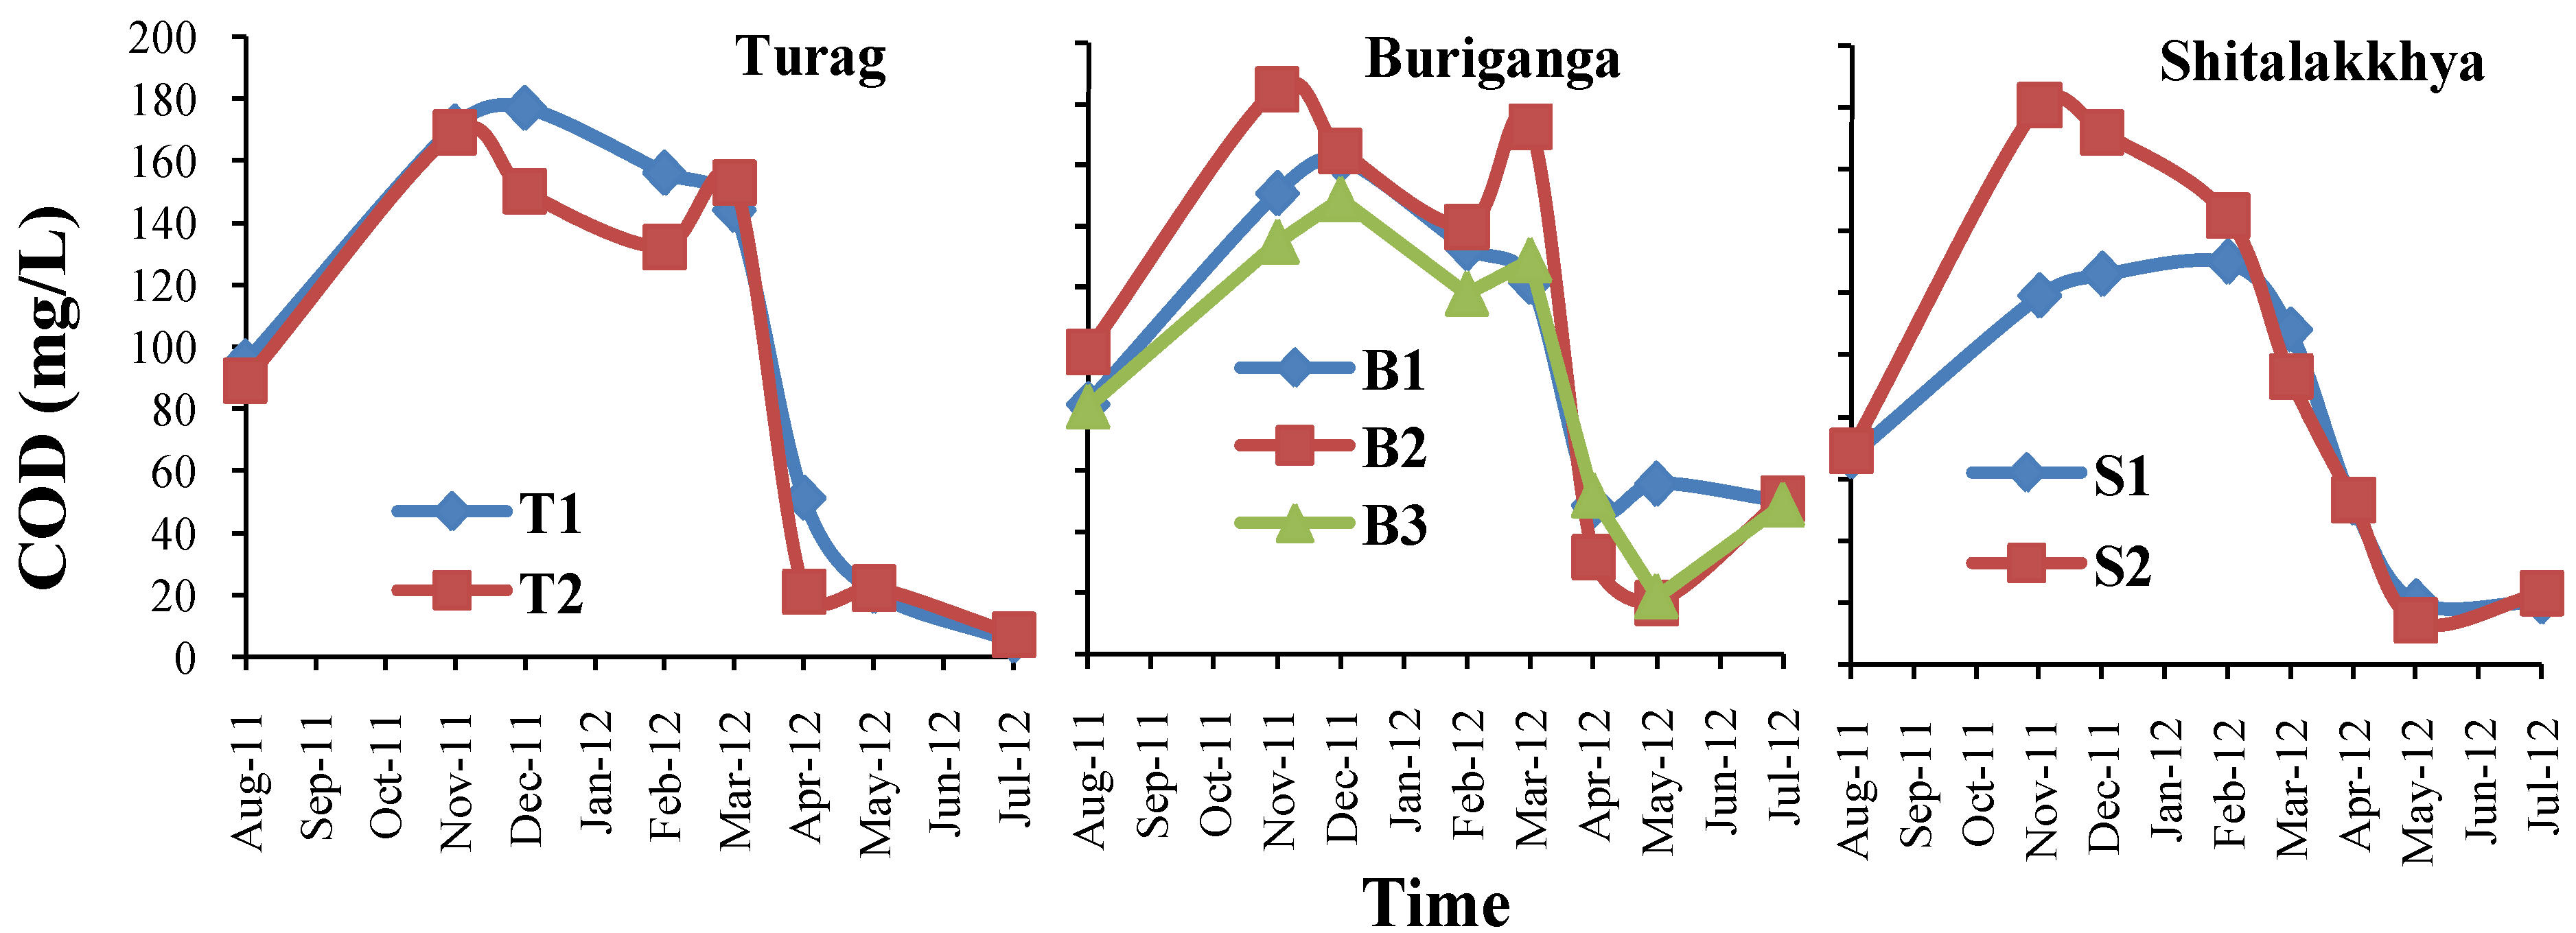
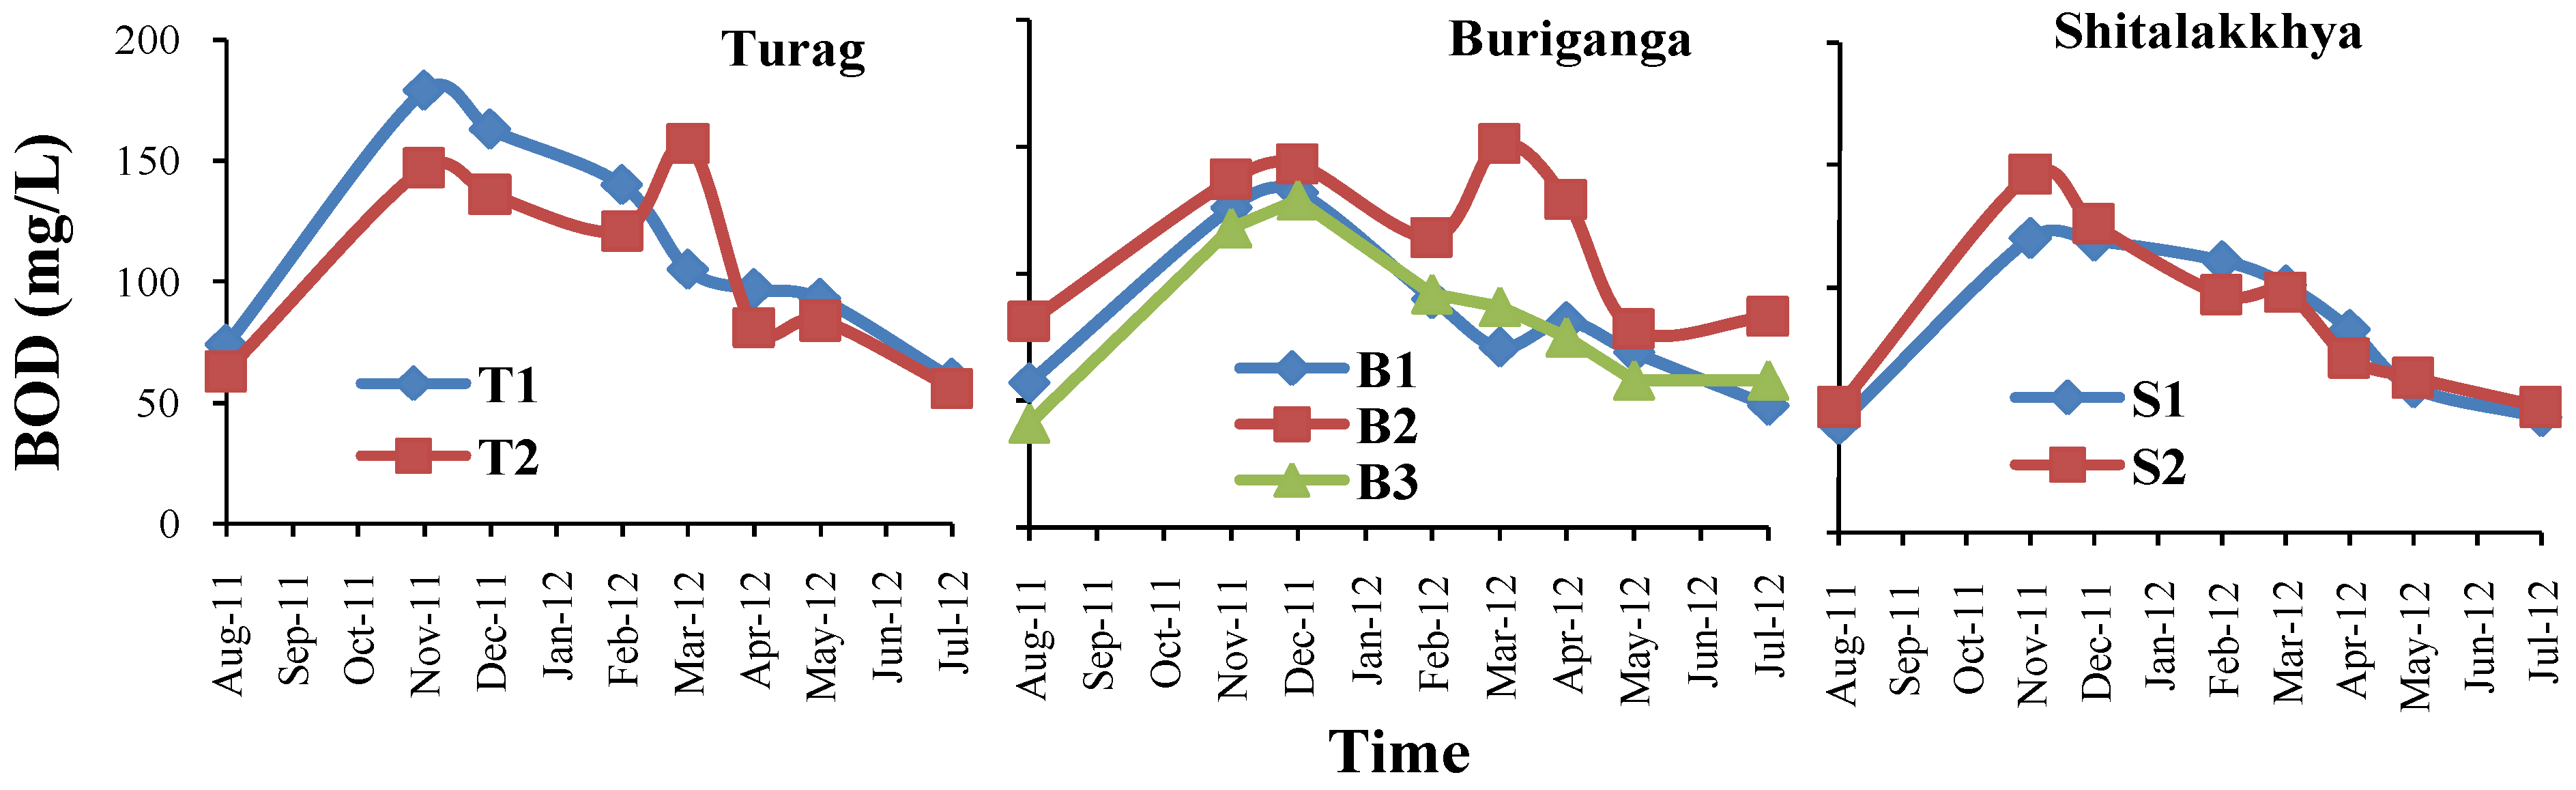
3.2. Physicochemical Parameters

The ranges of the physicochemical parameters, their means for all three rivers during the whole sampling period are given in Table 1. The water quality of the three different rivers around Dhaka City revealed a high level of water pollution when compared with the DoE recommended values.
The pH values found in the three rivers ranged from 6.5 to 9.8 throughout the year, as shown in Figure 4. All the pH values of the Shitalakkhya River and some of the values of the Buriganga (except B2) and Turag Rivers were within the recommended range (6–9) suggested by the DoE. The pH of the water was slightly high during the dry season (November to March) which makes the water alkaline. Additionally, the pH of the water was lower during the wet season due to a dilution effect. The drastic change in the river flow was the reason for pH change. The pH value also varied for each sampling point in the same river, which may have been due to the different source of wastes, rates of input and flow rates of the rivers. The spatial variation of pH values was lesser than temporal variation. The relative change in pH for the Buriganga River during different seasons was higher than it was for the other two rivers.
Table 1. General water quality of the three rivers around Dhaka City, Bangladesh.
DoE * StandardTuragBurigangaShitalakkhya
MeanRangeMeanRangeMeanRange
pH6–97.96.9–9.18.07.1–9.87.76.5–8.3
EC (μS/cm)12001807790–28501209830–19901150720–1920
TDS (mg/L)21001003650–1510999620–1260820475–1180
DO (mg/L)≥4.5–8.01.20.45–3.21.70.45–3.52.10.6–3.8
BOD (mg/L)5011056–17993.741–15186.744–146
COD (mg/L)20097.75–17710017–1858714–172
* DoE: Department of Environment, Ministry of Environment and Forest, Bangladesh [14].
Figure 4. The pH values of the samples from the water of three different rivers around Dhaka City.
Environments 02 00280 g004
High EC values that ranged from 790–2850 µS/cm for the Turag River, 830–1990 µS/cm for the Buriganga River, and 720–1920 µS/cm for the Shitalakkhya River indicated a high level of ionic pollution in these rivers based on the DoE guidelines (1200 µS/cm). As indicated in Figure 5, the Turag River showed higher EC values than the other two. Like the pH values, EC (Turag River) was also higher during the dry season because of various industrial and urban activities and a low volume of water. During the wet season, an increase in MDD may have diluted the salinity of the water and decreased the value. The relationship between EC and MDD was inversely proportional. The EC of the water expresses the total concentration of saline substances and is also an indicator of salinity [26]. Elevated levels of EC can have certain physiological effects on food plants and on the habitat that forms plant species. Nevertheless, these values indicate that the Rivers could be receiving wastewater (industrial and sewage effluent) that contains high ionic concentrations, which is ultimately harmful for aquatic biodiversity.
Figure 5. The electrical conductivity (EC) values of the samples from the water of three different rivers around Dhaka City.
Environments 02 00280 g005
The TDS value is a common indicator of the presence of different minerals and metallic substances in water that are in colloidal and dissolved conditions and also is an important chemical parameter of water [27]. The measured TDS values found in the three different rivers ranged from 475 to 1510 mg/L, and all the values are within the maximum level recommended by the DoE (2100 mg/L). Among the three rivers, the Turag had the highest maximum TDS value (1560 mg/L) of all examined rivers, as this river is the recipient of many sources of pollution. During the monsoon season, the average value was lower than the dry season due to the dilution effect. The values are presented in Figure 6.
Figure 6. The total dissolved solids (TDS) values of the samples from the water of three different rivers around Dhaka City.
Environments 02 00280 g006
A DO value of less than 2 mg/L may pose serious threats to an aquatic ecosystem [28]. In the present study, the DO values (Figure 7) for all the sampling stations ranged between 0.45 and 3.8 mg/L during different seasons which are much lower than the recommended value by DoE (4.5–8 mg/L), which suggested significant amounts of organic substances were being released into rivers with a high oxygen demand. During the dry season with a low MDD, the DO values became extremely low and the most severe conditions were found in the Turag River. During the wet season (April to August), the situation improved slightly (perhaps because of high flow conditions), but it remained lower than the acceptable level.
Figure 7. The dissolved oxygen (DO) values of the samples from the water of three different rivers around Dhaka City.
Environments 02 00280 g007
With lower DO values, the BOD levels are high due to available oxygen consumption by microorganisms [29]. The highest BOD value found was 179 mg/L for the Turag during the month of November 2011, and the lowest value was 41 mg/L for the Buriganga during August 2011. Almost all BOD values during both dry and monsoon seasons exceeded the standard set by the DoE (50 mg/L). As shown in Figure 8, the Turag River had a higher BOD throughout the year compared with the other two because this river flows through the densest urbanized and industrial areas. The BOD value was higher during the dry season as a result of higher concentrations of organic substances. As for the rainy season, the BOD value remained at one-third that of the dry season value. The BOD value reached 31.3% of the dry season value for the Turag and those for the Buriganga and Shitalakkhya Rivers were 33.6 and 32.2%, respectively. However, for the Turag and Buriganga Rivers this trend was not the same for all sampling points. Towards the rainy season the BOD value of points T2 and B2 decreased and, despite this decreasing trend, they suddenly increased during February-March. This may have been due to a sudden input of organic waste from some industries and from municipal domestic waste. During this time, the river flow remained very low and even a small amount of waste addition can drastically increase the value.
Figure 8. The biochemical oxygen demand (BOD) values of the samples from the water of three different rivers around Dhaka City.
Environments 02 00280 g008
Figure 9 shows the COD values ranged from 5 mg/L in the Turag River during July 2012 to 185 mg/L for the Buriganga River in November 2011. The values found during both dry and monsoon season were within the DoE standards (200 ppm). The decreasing pattern of COD and BOD values were the same but, during the rainy season, the COD reached almost zero whereas the BOD remained about 50 mg/L. This result indicates that biodegradable organic compounds predominate throughout the year. Besides that, the COD value decreased about 4.0% compared with that during the dry season for the Turag River; it decreased 9.2% for the Buriganga River and 7.7% for the Shitalakkhya River, all of which were also much below the ratio of BOD reduction. To calculate dry and wet season ratios, the highest value during the rainy season and lowest value during the dry season were compared. With an increase in the river flow, the DO value was increased and inversely the COD value was decreased. In the case of rapid change in the DO value, as shown in Figure 7, the COD values expressed a small change from April to July. This means more than only the pollutants from Dhaka City had an effect on the COD value. A similar COD value was observed for all three rivers, but the pattern of change differed with the flow rates of the different seasons. Thus, it can be argued that the river flow has a strong influence over the COD values.
Figure 9. The chemical oxygen demand (BOD) values of the samples from the water of three different rivers around Dhaka City.
Environments 02 00280 g009

3.3. Concentrations of Metals

The concentrations of metals in the three rivers around Dhaka City during both dry and wet seasons are listed in Table 2. The month of August (2011) is considered to be representative of wet, or rainy, season whereas February (2012) is considered to be representative of dry season. These two months were selected based on their MDD as the highest and lowest months of daily discharge, respectively. Aluminum concentrations during both seasons, iron in the dry season, and cadmium concentration during the rainy season: all were higher. The concentration of manganese in the Shitalakkhya River during the dry season became higher. The higher concentration of iron and manganese during the dry season could be attributed to the effluent from a distillery and the runoff from an agricultural field with a lower value of MDD. During the rainy season these concentrations decreased considerably due to the dilution from a higher river flow.
Table 2. The metal concentration during wet and dry seasons in three different rivers around Dhaka City, Bangladesh.
Parameters(ppb)DoE * Standard (ppb)TuragBurigangaShitalakkhya
WetDryWetDryWetDry
Al20092.65294.3879.62152.27113.24116.61
Mn50009.776.446.1277.33.27258.99
Fe200012.67380.759.82358.6811.19341.21
Cu5002.527.394.136.751.9715.83
Zn50002.59ND2.4923.121.89ND
Cd5005.46ND5.47ND5.45ND
Pb1004.75ND4.87ND4.721.86
ND: value not detected.* DoE: Department of Environment, Ministry of Environment and Forest, Bangladesh [14].
In general, the concentrations of all dissolved metals are low during wet seasons and high during dry seasons. The dilution during higher water flow decreases the concentration. Deviations from these trends could be attributed to site-specific activities, source of waste, and the velocity of the river flow. The results of the present study indicated a discrete heavy metal status (source and distribution). One reason could be that, during the monsoon season, polluted sediment particles may be suspended in the bottom sediment layer, which could lead to lower concentrations of heavy metals. The pH value also plays a key role in metal pollution and a higher pH retains a low concentration of metals in the rivers of Dhaka City. During the dry season, with a higher pH value, some metals form insoluble hydroxide compounds and precipitate into the sediment. This could be the reason for the unavailability of zinc, cadmium and lead during the dry season. Urban runoff could be a source of metals for river water, particularly during the rainy seasons, and all the sampling regions had high annual rainfall.

4. Conclusions

The river system around Dhaka City, Bangladesh, is subjected to an estimated high degree of pollution from the waste of many industrial, municipal and agricultural sources. The pollutants enter into the river system by direct discharges or surface runoff. The results of the present study showed that the overall levels of pollution in these rivers are beyond the threshold limits in terms of physicochemical properties. The pH, TDS, and COD values were within the DoE recommended values, while EC, DO, and BOD were above the standard. The concentrations of metals were found to be within the recommended values. However, the pollution levels showed a seasonal pattern of change. The values of almost all the parameters remained high during the dry season with a lower river flow as compared to the rainy season. Alternatively, during the rainy season the concentration was diluted from the higher water flow. Therefore, river pollution is largely dependent on the upstream river flow, which indicates that the control of different upstream rivers in India and China indirectly controls the river pollution in Bangladesh. The pressure and impact on the rivers is also due to high population density and to industrial and agricultural activities that emit organic and inorganic substances at a high level. In order to determine the actual level and severity of the pollution, it is important to measure the organic matter content together with the humic substances in the river water. Microbial status is another important aspect of Bangladesh’s river pollution.

Acknowledgments

The authors are thankful to the Japan Society for the Promotion of Science (JSPS) and University Grants Commission (UGC) Bangladesh for their funding. This research work was under the JSPS-UGC joint research project No. 11037811-000101. The authors are also thankful to the HEIWA NAKAJIMA foundation.

Author Contributions

Shunitz Tanaka, Masaaki Kurasaki, Takeshi Saito, M. Khabir Uddin and Shafi M. Tareq developed the initial idea of the research and designed the whole experiment. Mashura Shammi, Md. Saiful Islam, Tomohiro Sugano and Abdul Kadir Ibne Kamal undertook the fieldwork data collection, statistical analyses, and geo-spatial analysis. Hideki Kuramitz provided a critical review of the manuscript before submissions.

Conflicts of Interest

The authors declare no conflict of interest.

References

  1. Carpenter, S.R.; Caraco, N.F.; Correll, D.L.; Howarth, R.W.; Sharpley, A.N.; Smith, V.H. Nonpoint pollution of surface waters with phosphorus and nitrogen. Ecol. Appl. 1998, 8, 559–568. [Google Scholar] [CrossRef]
  2. Jarvie, H.P.; Whitton, B.A.; Neal, C. Nitrogen and phosphorus in east coast British rivers: Speciation, sources and biological significance. Sci. Total Environ. 1998, 210, 79–109. [Google Scholar] [CrossRef]
  3. Ahmed, K.; Das, M.; Islam, M.M.; Akter, M.S.; Islam, S.; Al-Mansur, M.A. Physico-chemical properties of tannery and textile effluents and surface water of River Buriganga and Karnatoli, Bangladesh. World Appl. Sci. J. 2011, 12, 152–159. [Google Scholar]
  4. Tiwari, T.N.; Ali, M. Water quality index for Indian rivers. In Ecology and Pollution of Indian Rivers; Trivedi, R.K., Ed.; Ashish publishing House: New Delhi, India, 1988; pp. 271–286. [Google Scholar]
  5. Islam, F.; Sharmin, R.; Junait, J. A Detailed Analysis on Industrial Pollution in Bangladesh; Workshop Discussion Paper; The World Bank Dhaka Office: Dhaka, Bangladesh, 1997. [Google Scholar]
  6. Mizan, R.K. Banglapedia: National Encyclopedia of Bangladesh; Asiatic Society of Bangladesh: Dhaka, Bangladesh, 2006. [Google Scholar]
  7. Roy, M. Planning for sustainable urbanization in fast growing cities: Mitigation and adaptation issues addressed in Dhaka, Bangladesh. Habitat Int. 2009, 33, 276–286. [Google Scholar] [CrossRef]
  8. Islam, M.M.; Akhtar, M.K.; Masud, M.S. Prediction of environmental flow to improve the water quality in the river Buriganga. In Proceedings of the 17th IASTED International Conference on Modeling and Simulation, Montreal, QC, Canada, 24–26 May 2006.
  9. Khan, M.A.I.; Hossain, A.M.; Huda, M.E.; Islam, M.S.; Elahi, S.F. Physico-chemical and biological aspects of monsoon waters of Ashulia for economic and aesthetic applications: Preliminary studies. Bangladesh J. Sci. Indus. Res. 2007, 42, 377–396. [Google Scholar]
  10. River Pollution Mitigation Committee (RPMC). Mitigation of River Pollution of Buriganga and Linked Rivers-Turag, Tongi Khal, Balu, Sitalakhya and Dhaleswari; A report of RPMC; River Pollution Mitigation Committee (RPMC): Dhaka, Bangladesh, 2008. [Google Scholar]
  11. The Daily Star. Polluters Must Pay, 19 September 2010. A News Report. Available online: http://archive.thedailystar.net/newDesign/news-details.php?nid=155050 (accessed on 12 May 2015).
  12. Blacksmith Institute. The World’s Worst Polluted Places: The Top Ten of the Dirty Thirty; Blacksmith Institute: New York, NY, USA, 2007; Available online: http://wwww.blacksmithinstitute.org/wwpp2007/finalReport2007.pdf (accessed on 10 February 2013).
  13. The Daily Star. River Pollution Discussion: A Wake up Call to Industrialists, 8 May 2009. A Round Table Discussion at the Daily Star. Available online: http://archive.thedailystar.net/newDesign/news-details.php?nid=87288 (accessed on 12 May 2015).
  14. DoE (Department of Environment). The Environment Conservation Rules; Ministry of Environment and Forest, Government of the People’s Republic of Bangladesh: Dhaka, Bangladesh, 1997.
  15. Bhuiyan, M.A.; Rakib, M.A.; Dampare, S.B.; Ganyaglo, S.; Suzuki, S. Surface water quality assessment in the central part of Bangladesh using multivariate analysis. KSCE J. Civ. Eng. 2011, 15, 995–1003. [Google Scholar] [CrossRef]
  16. Sikder, M.T.; Yasuda, M.; Yustiawati, S.S.; Saito, T.; Tanaka, S.; Kurasaki, M. Comparative Assessment of Water Quality in the Major Rivers of Dhaka and West Java. Int. J. Environ. Protec. 2012, 2, 8–13. [Google Scholar]
  17. Sikder, M.T.; Kihara, Y.; Yasuda, M.; Mihara, Y.; Tanaka, S.; Odgerel, D.; Mijiddorj, B.; Syawal, S.M.; Saito, T.; Kurasaki, M. River water pollution in developed and developing countries: Judge and assessment of physicochemical characteristics and selected dissolved metal concentration. CLEANSoil Air Water 2013, 41, 60–68. [Google Scholar] [CrossRef]
  18. Ali, M.Y.; Amin, M.N.; Alam, K. Ecological Health Risk of Buriganga River, Dhaka, Bangladesh. Hydro Nepal J. Water Energy Environ. 2008, 3, 25–28. [Google Scholar] [CrossRef]
  19. Moniruzzaman, M.; Elahi, S.F.; Jahangir, M.A.A. Study on Temporal Variation of Physico-chemical Parameters of Buriganga River Water through GIS (Geographical Information System) Technology. Bangladesh J. Sci. Ind. Res. 2009, 44, 327–334. [Google Scholar] [CrossRef]
  20. Alam, A.M.S.; Islam, M.A.; Rahman, M.A.; Siddique, M.N.; Matin, M.A. Comparative study of the toxic metals and non-metal status in the major river system of Bangladesh. Dhaka Univ. J. Sci. 2003, 51, 201–208. [Google Scholar]
  21. Ahmad, M.K.; Islam, S.; Rahman, S.; Haque, M.R.; Islam, M.M. Heavy Metals in Water, Sediment and Some Fishes of Buriganga River, Bangladesh. Int. J. Environ. Res. 2010, 4, 321–332. [Google Scholar]
  22. Uddin, H.M. Initial Environmental Impact Assessment of the Turag-Buriganga Naval Transport. Master Thesis, Department of Geography and Environment, Jahangirnagar University, Dhaka, Bangladesh, 10 July 2005. [Google Scholar]
  23. Talha, B.H. Pollution Sounds the Death Knell of Turag. The Independent. Available online: http://www.theindependent-bd.com/ (accessed on 28 September 2007).
  24. APHA-AWWA (American Public Health Association, American Water Works Association). Standard Methods for the Examination of Water and Wastewater, 20th ed.; American Public Health Association, American Water Works Association: Washington, DC, USA, 1998. [Google Scholar]
  25. Hanada, T.; Isobe, H.; Saito, T.; Ogura, S.; Takekawa, H.; Yamazaki, K.; Tokuchi, Y.; Kawakami, Y. Intracellular Accumulation of Thallium as a Marker of Cisplatin Cytotoxicity in Nonsmall Cell Lung Carcinoma. Cancer 1998, 83, 930–935. [Google Scholar] [CrossRef]
  26. Brady, N.C.; Well, R.R. The Nature and Properties of Soils, 12th ed.; Pearson Education, Inc.: New Delhi, India, 2002; pp. 261–269. [Google Scholar]
  27. Kabir, E.S.; Kabir, M.; Islam, S.M.; Mia, C.M.; Begum, N.; Chowdhury, D.A.; Sultana, S.M.; Rahman, S.M. Assessment of effluent quality of Dhaka export processing zone with special emphasis to the textile and dying industries. Jahangirnagar Univ. J. Sci. 2002, 25, 137–138. [Google Scholar]
  28. EGIS II (Environment and GIS Support Project for Water Sector Planning). Water Quality Approach: Draft Final Report; Ministry of Water Resources, Government of Bangladesh: Dhaka, Bangladesh, 2002.
  29. Sawyer, C.N.; McCarty, P.L.; Parkin, G.F. Chemistry for Environmental Engineering and Science, 5th ed.; McGraw-Hill: New York, NY, USA, 2003. [Google Scholar]

