Article

Tsunami Vulnerability Criteria for Fishery Port Facilities in Japan

1
Japan Agency for Marine-Earth Science and Technology, 3173-25, Showa-machi, Kanazawa, Yokohama 236-0001, Japan
2
Wakayama Prefecture, 1-1, Komatsubara-dori, Wakayama 640-8585, Japan
3
Alpha Hydraulic Engineering Consultants Co., Ltd., 516-336, 9 Jou-14 Chome Hassamu, Nishi-ku, Sapporo Hokkaido 063-0829, Japan
*
Author to whom correspondence should be addressed.
Geosciences 2019, 9(10), 410; https://doi.org/10.3390/geosciences9100410
Submission received: 25 July 2019 / Revised: 11 September 2019 / Accepted: 18 September 2019 / Published: 21 September 2019
(This article belongs to the Special Issue Interdisciplinary Geosciences Perspectives of Tsunami Volume 2)

Abstract

:
Business continuity plans (BCPs) can be effective and proactive countermeasures to respond flexibly to crises caused by unexpected natural disasters such as large tsunamis. BCP guidelines for fisheries are being issued by the Fisheries Agency (Japan) and the utilization of such BCPs has been spreading in Japan. Despite the need to promote the social implementation of BCPs in the fisheries industry, there is a lack of quantitative criteria for the tsunami damage threshold of various fishing ports and facilities. In this research, we surveyed the damage to the fishing facilities from the tsunami generated by the 2011 Tohoku-oki earthquake. Data were collected on the tsunami damage for various fishery facilities and used to establish criteria for tsunami damage thresholds. In addition, tsunami damage inferred from 1506 scenarios of tsunami computations was predicted probabilistically for a model region as the Nachi Katsu’ura Fishery Port in Wakayama Prefecture. The method we developed in this research makes it possible to assess the probabilistic tsunami damage by combining a tsunami hazard assessment method with criteria for damage occurrence for fishery port facilities and equipment.

1. Introduction

Advanced preparation of business continuity plans (BCPs) can facilitate effective and flexible responses to sudden natural disasters such as tsunamis. For example, the Hachinohe Port BCP [1] and other plans have been implemented together with regional management disaster plans. Similarly, the Japan Fisheries Agency has prepared BCP Guidelines for the fisheries industry [2]. In addition to addressing human casualties and property damage in preparation of a BCP for the fisheries industry, the Fisheries Agency advises that it is important to identify factors that would be bottlenecks for business continuity due to damage to specific fishing-port facilities and equipment. Comparison of the cost of economic impacts caused by sudden disasters versus the economic costs of advanced preparation to mitigate such impacts would facilitate realistic mitigation measures. Such reviews should enable preparation of practical and persuasive BCPs.
Of the fundamental information required for preparation of the fisheries industry BCPs, currently lacking are evaluation criteria for quantitatively assessing inundation damage to fisheries facilities and equipment caused by tsunamis and storm surges. Although there are some reviews for aquaculture enclosures [3,4] and fishing boats being lifted ashore [5,6], there are no examples of reviews for other types of impacts. Such reviews are necessary to develop damage occurrence criteria to assess the vulnerability of fishery industry facilities and equipment to tsunamis and storm surges. If detailed criteria for damage occurrence for fishery industry facilities and equipment were developed, it would be possible to predict damage to such facilities. In addition to facilitating detailed evaluation of the economic impacts of anticipated damage for BCP drafting, the results would be useful also for determining the scale of implementation for disaster prevention and mitigation measures.
A deterministic approach [7,8] and a probabilistic approach [9,10] have been proposed to determine the conditions under which buildings are damaged by tsunamis. Since the 2004 Indian Ocean earthquake and tsunami, fragility function for structures have been developed to evaluate building damage by tsunami probabilistically [9]. The several tsunami damages caused by the 2011 Tohoku-oki Earthquake Tsunami was not limited to the tsunami fluid force was also caused by the impact of tsunami debris. Therefore, an evaluation for assessment that takes into account the effects of uncertainty is desirable. It is considered that probabilistic examination is also appropriate for the damage criteria conditions of fishery port facilities.
In this research, damage to fishery industry facilities and equipment due to the 2011 Tohoku earthquake and tsunami were investigated. Data were collected on the damage conditions for various types of facilities and equipment with the objective of building criteria for damage occurrence for fishery industry facilities and equipment related to continuity of the fishery industry. In addition, the building of criteria for inundation damage for fishery industry facilities and equipment was considered to examine the applicability of vulnerability assessment methods to storm surge or tsunami inundation of fishery industry facilities and equipment. The criteria for damage occurrence were used to consider implementation of a damage prediction method.

2. Field Survey of Damage to Fishery Industry Facilities and Equipment

We conducted a field survey to clarify the details of damage to fishery ports caused by the 2011 Tohoku earthquake and tsunami. The survey excluded fishery port infrastructure (seawalls, breakwaters, roads facilities) and covered fishery industry facilities and equipment (it could refer to the relevant literature [11,12]) for damage to fishing grounds, fishing boats, and fishing-port infrastructure.

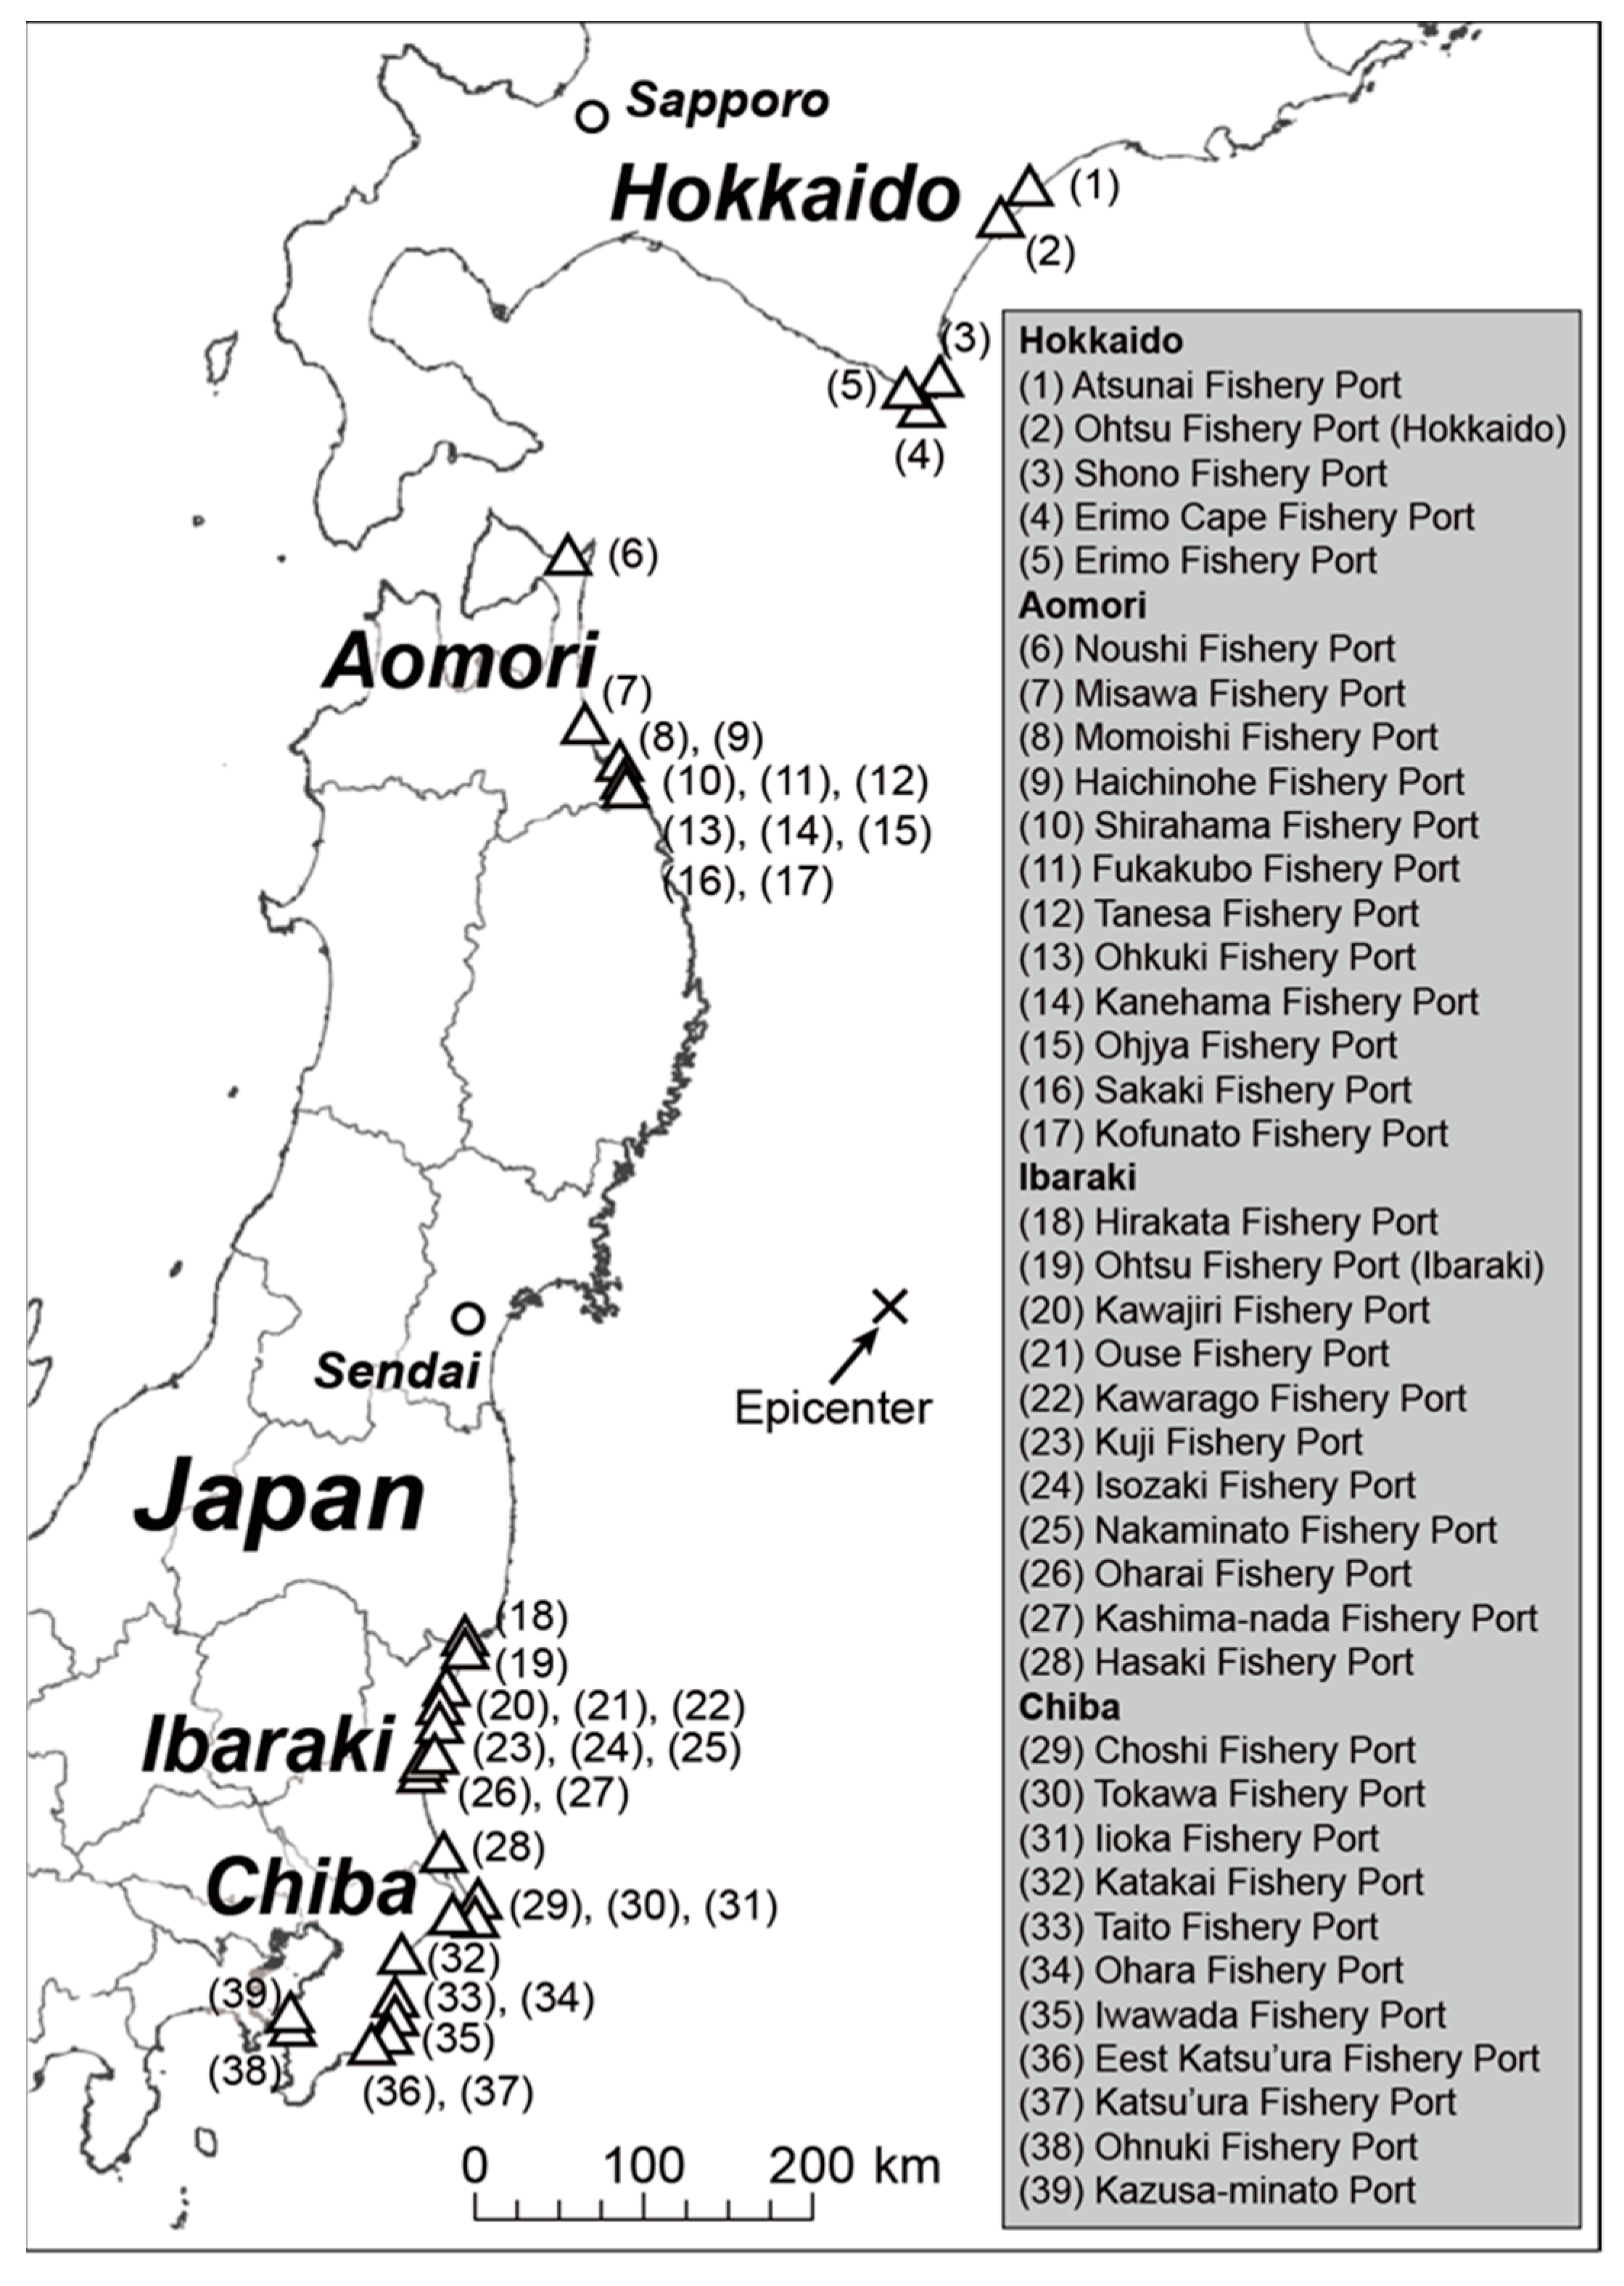
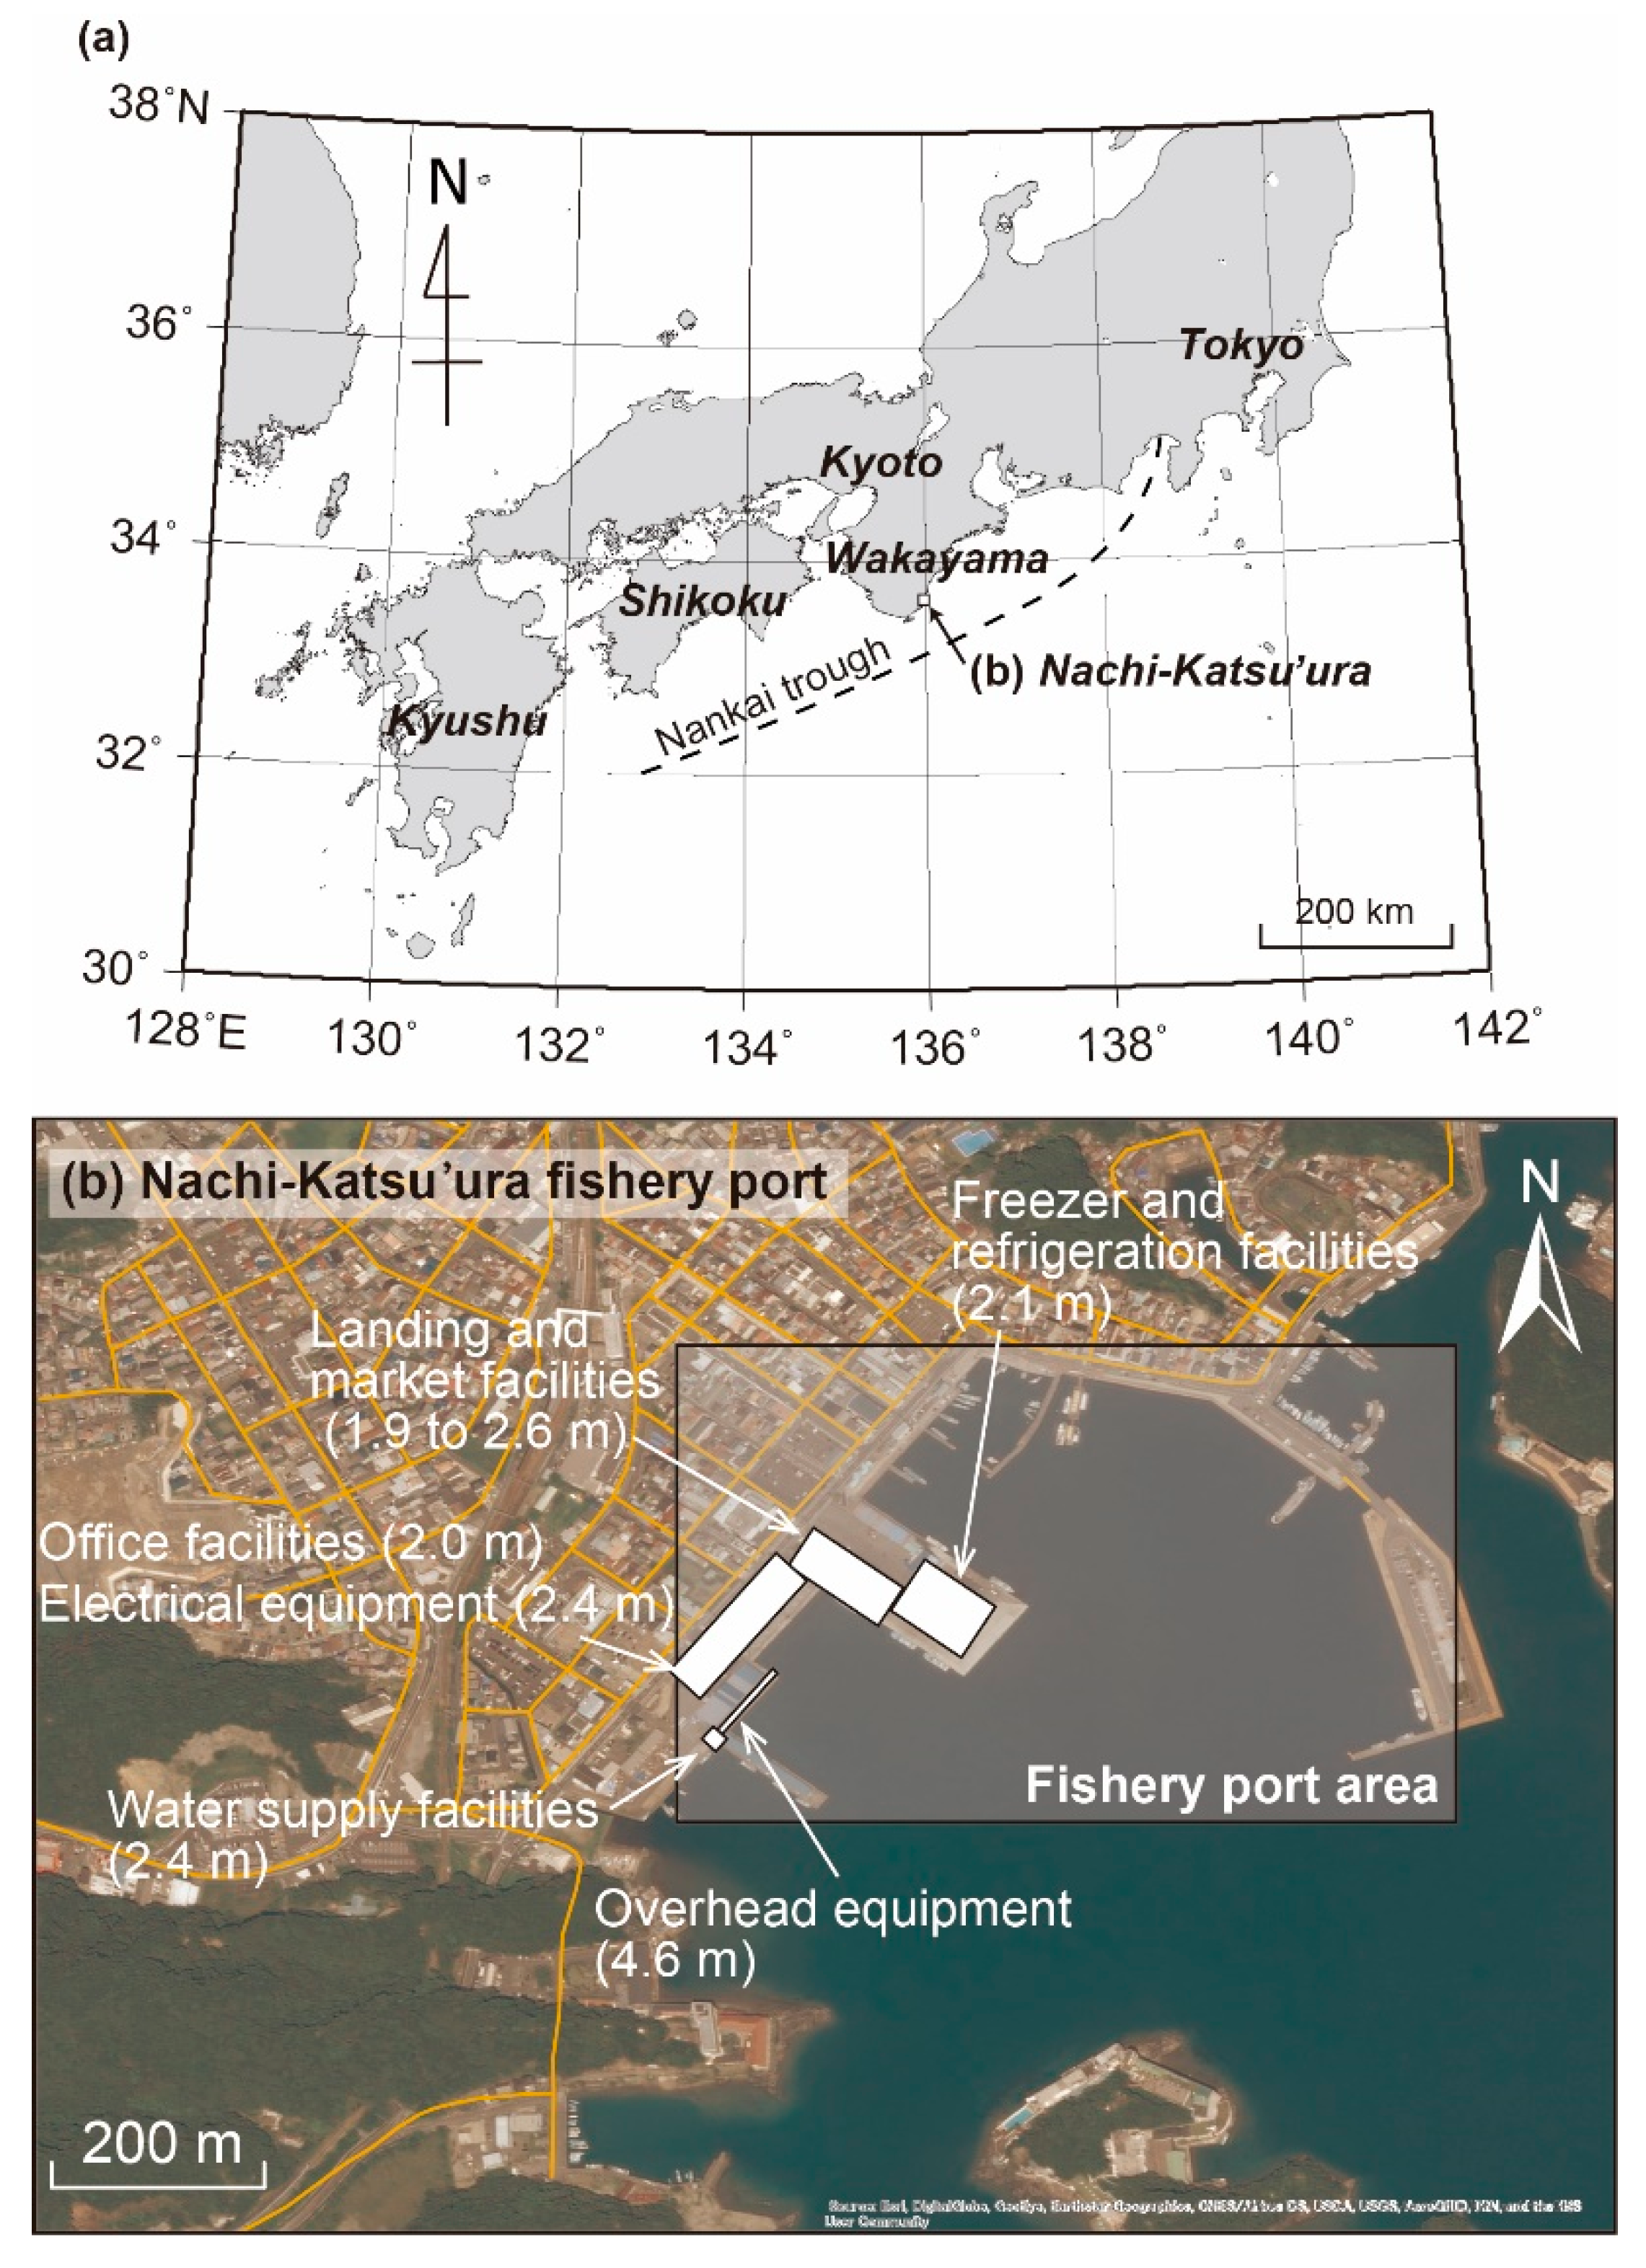
2.1. Surveyed Fishery Ports

The regions covered by the field study (Figure 1) were selected based on whether damage to fishery industry facilities and equipment caused by the 2011 Tohoku tsunami could be identified. Fishery ports on the Pacific Ocean coasts of Hokkaido (5 locations), Aomori (12 locations), Ibaraki (11 locations), and Chiba prefectures (11 locations) were studied.

2.2. Methods

The study was carried out starting with interviews with the fishery cooperatives responsible for the investigated fishery ports regarding the status of fishery industry facilities and equipment and damage caused by the tsunami. The interviews were used to understand facility and equipment locations, ground elevation, damage status, and tsunami inundation depth. Measurement methods used included site location information from handheld GPS, ground elevation from global navigation satellite systems (GNSS) ranging with or without offset from a laser range finder. Inundation depths due to the tsunami were based on information from interviews, and measurements were conducted when possible where clear traces of inundation remained at the time of study. For locations where the depth of inundation was unknown due to movement of buildings or other objects, tsunami inundation height in the same fishery port was used along with ground elevation at the research location to indirectly evaluate inundation depth.
The tsunami trace height (from mean sea level) distribution close to Noushi Fishery Port was about 2.6 to 5.1 m and inundation depth about 1.4 m on Figure 2a. Fishing gear and automobiles were pushed by the water at the port site on Figure 2b, landing facility shutters were damaged by displaced forklifts on Figure 2c, fishing gear was scattered in the warehouse on Figure 2d, and electric devices failed due to tsunami inundation in the office. Thus, fishery facilities damage due to the tsunami occurred at inundation depth of 1.4 m, it is possible to stagnation of fisheries industry due to a slightly frequent tsunami.

2.3. Kind of Fishery Port Facilities and Equipment

Fishery port facilities and equipment were divided into the following 16 types.

2.3.1. General Electrical Equipment

Many fishery facilities and equipment rely on electricity, the electrical systems are extremely vulnerable to inundation.

2.3.2. Building Shutter Doors

Shutter doors are widely used for entrances to warehouses, landing and market facilities, and freezing/refrigeration facilities.

2.3.3. Warehouse Facilities etc.

Fishing gear warehouses and supply storage warehouses are mostly single story wooden or concrete buildings.

2.3.4. Landing and Market Facilities

Landing facilities and market facilities have large open areas.

2.3.5. Office Facilities and Related Facilities

For fishery cooperative offices and related facilities, these structures were similar in building strength to general wooden houses.

2.3.6. Freezer and Refrigeration Facilities

In many cases, the floor of the entrance to these buildings is relatively high at around 1 m to allow for direct loading of trucks. Although freezer and refrigeration facilities are relatively robust and airtight structures due to the need for insulation.

2.3.7. Ice-Making Equipment

Similar to freezer and refrigeration facilities, buildings housing ice-making equipment are robust structures because of their insulation. Electrical equipment is often located in high locations so that fishing vessels can directly load ice.

2.3.8. Water Supply Equipment

As water supply equipment is often installed alongside landing and market facilities near the ground.

2.3.9. Fueling Equipment

Fuel oil tanks are often fixed to the ground, and there are cases where the tanks are surrounded by an oil fence about 1 m high. Almost all facilities use pumps to deliver fuel.

2.3.10. Overhead Equipment

As this equipment lifts fishing boats or catch, almost all are water resistant.

2.3.11. Fishing Gear

It is a tool used for fishing or aquaculture, as fish boxes, nets, tanks, containers and pallets, often to left on seawalls.

2.3.12. Forklifts

It is a tool used for carrying fishing gear and boxes. There are engine-type and electric-type systems, and recently it is almost electric type in Japan.

2.3.13. Truck Scales

It could measure the weight of the catch loaded on the truck, as the equipment is installed in the ground.

2.3.14. Belt Conveyors

It is a tool used for sorting and transporting fish. It is mainly used at the landing and market facility.

2.3.15. Wastewater Treatment Equipment

This is equipment to treat the wastewater discharged by the fishery port. Due to the nature of the equipment, it is frequently installed underground.

2.3.16. Aquaculture Equipment on Land

Aquariums are placed to breed fry and seeds in the facility. In many cases, it is a brittle structure, as most buildings are prefabricated structures.

3. Survey Results and Occurrence Criteria of Fishery Facilities and Equipment

The damage was classified as: no damage, repairable, and total loss. Here, no damage covers cases where inundation occurred, but repairs were not required; repairable refers to cases where parts of the electrical system etc. were damaged but the systems were usable after repairs; total loss refers to cases where the repair was not possible. The electrical systems of many facilities and equipment are extremely vulnerable to inundation. The results of this study show that there were many cases in which problems occurred with only slight inundation. Repairs or replacement was necessary for electrical equipment that had not been waterproofed or moisture-proofed (e.g., scales and washing machines).

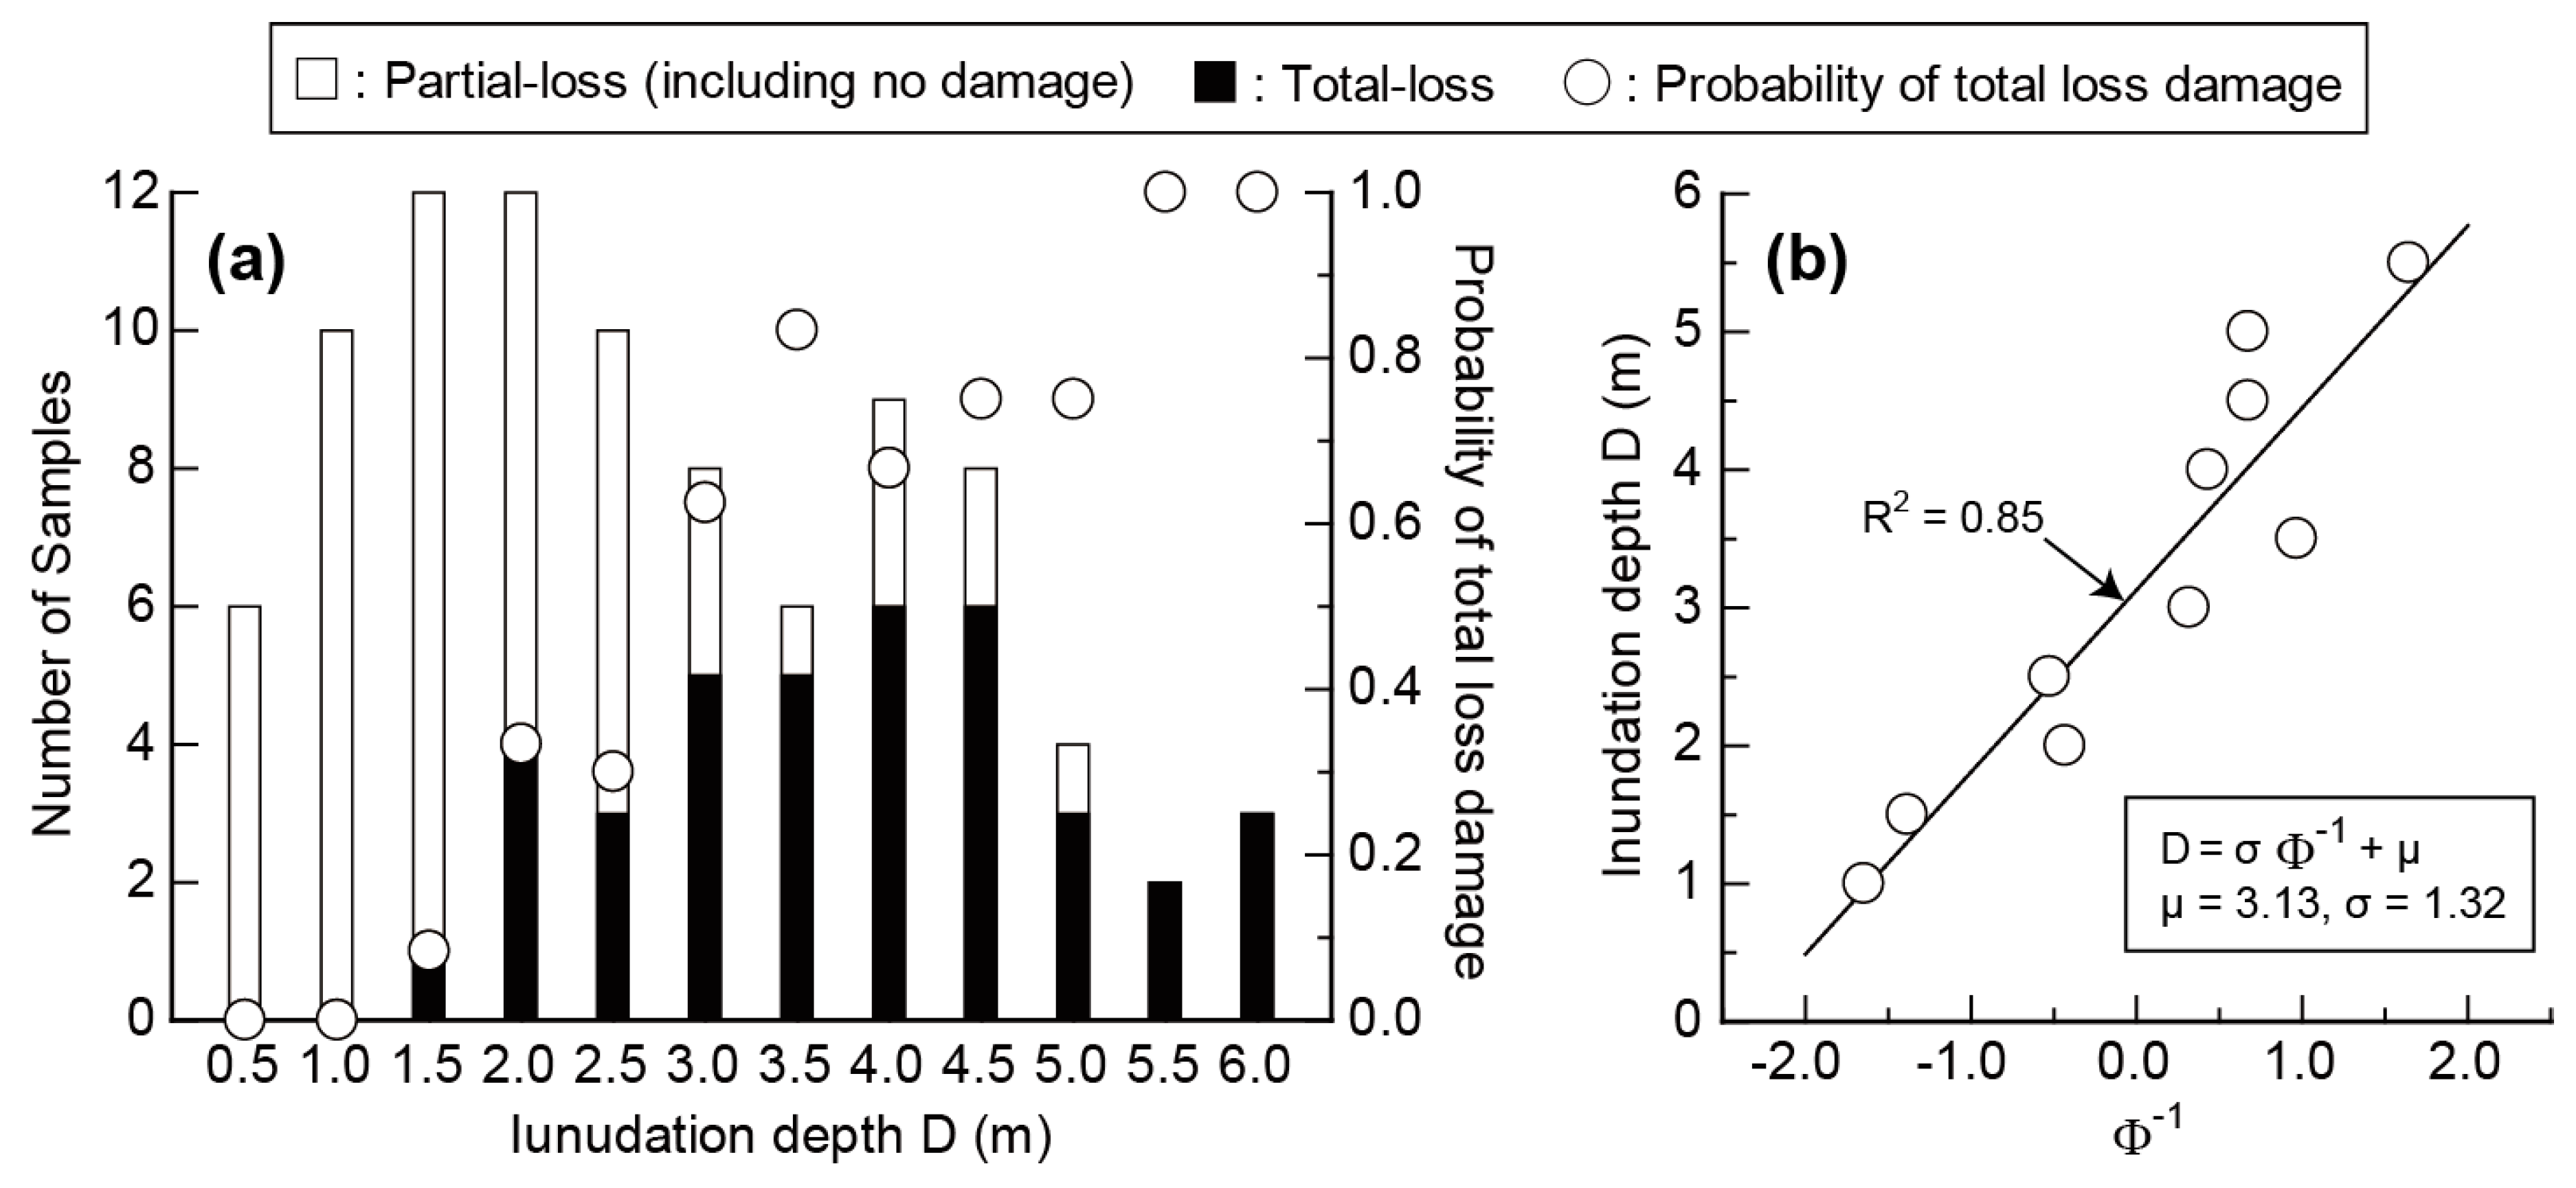
3.1. Evaluation Method for the Criteria as Total Loss Occurrence

Based on the results of the study of damage to fishery port facilities and equipment, we developed criteria for damage occurrence. Using tsunami inundation depth as an external force index, for damage type we focused and developed criteria for damage occurrence for total-loss damage.
The criteria for total loss, we developed fragility functions for facility and equipment types where 10 or more samples of total damage cases had been collected. The fragility function follows the form of that for earthquake motion and is defined by Equation (1) based on a normal distribution [8].
P D ( x ) = Φ [ x μ σ ] = x 1 2 π σ exp { ( t μ ) 2 2 σ 2 } d t
Here, PD is the probability of total-loss damage, and x is the external force index, which we selected as tsunami inundation depth, t as variable of integration. μ and σ are the average and standard deviation of x. μ corresponds to the inundation depth for 50% damage probability. The method of determining the statistical variables as μ and σ followed conventional method [9]. An example of a process for determining the variables as μ and σ on fragility function for fishery warehouse was shown in Figure 3. We made a histogram for the number of the repairable class including no damage and total loss class of fishery warehouse, as shown in Figure 3a. The class of the inundation depth was made to be the 0.5 m interval, and the repairable including no damage and total loss within the range were counted. Though there is a scattering in the sample number in each inundation depth class, it is proven that the total loss number increases as the inundation depth increases and that the total loss number becomes over the half when the inundation depth exceeds 3 m. The relationship between the probability of total loss damage and the median value of inundation depth based on sample data was also shown in Figure 3a. The statistical variables as μ and σ were evaluated regressively on normal probability paper. An example of the plot on normal probability paper rerated Φ-1 and inundation depth was shown in Figure 3b. The slope and intercept of the regression line were 3.17 and 1.32, respectively, corresponding to the statistical variables as μ and σ. In this case, the coefficient of determination R2 due to the least-squares fitting as 0.85.

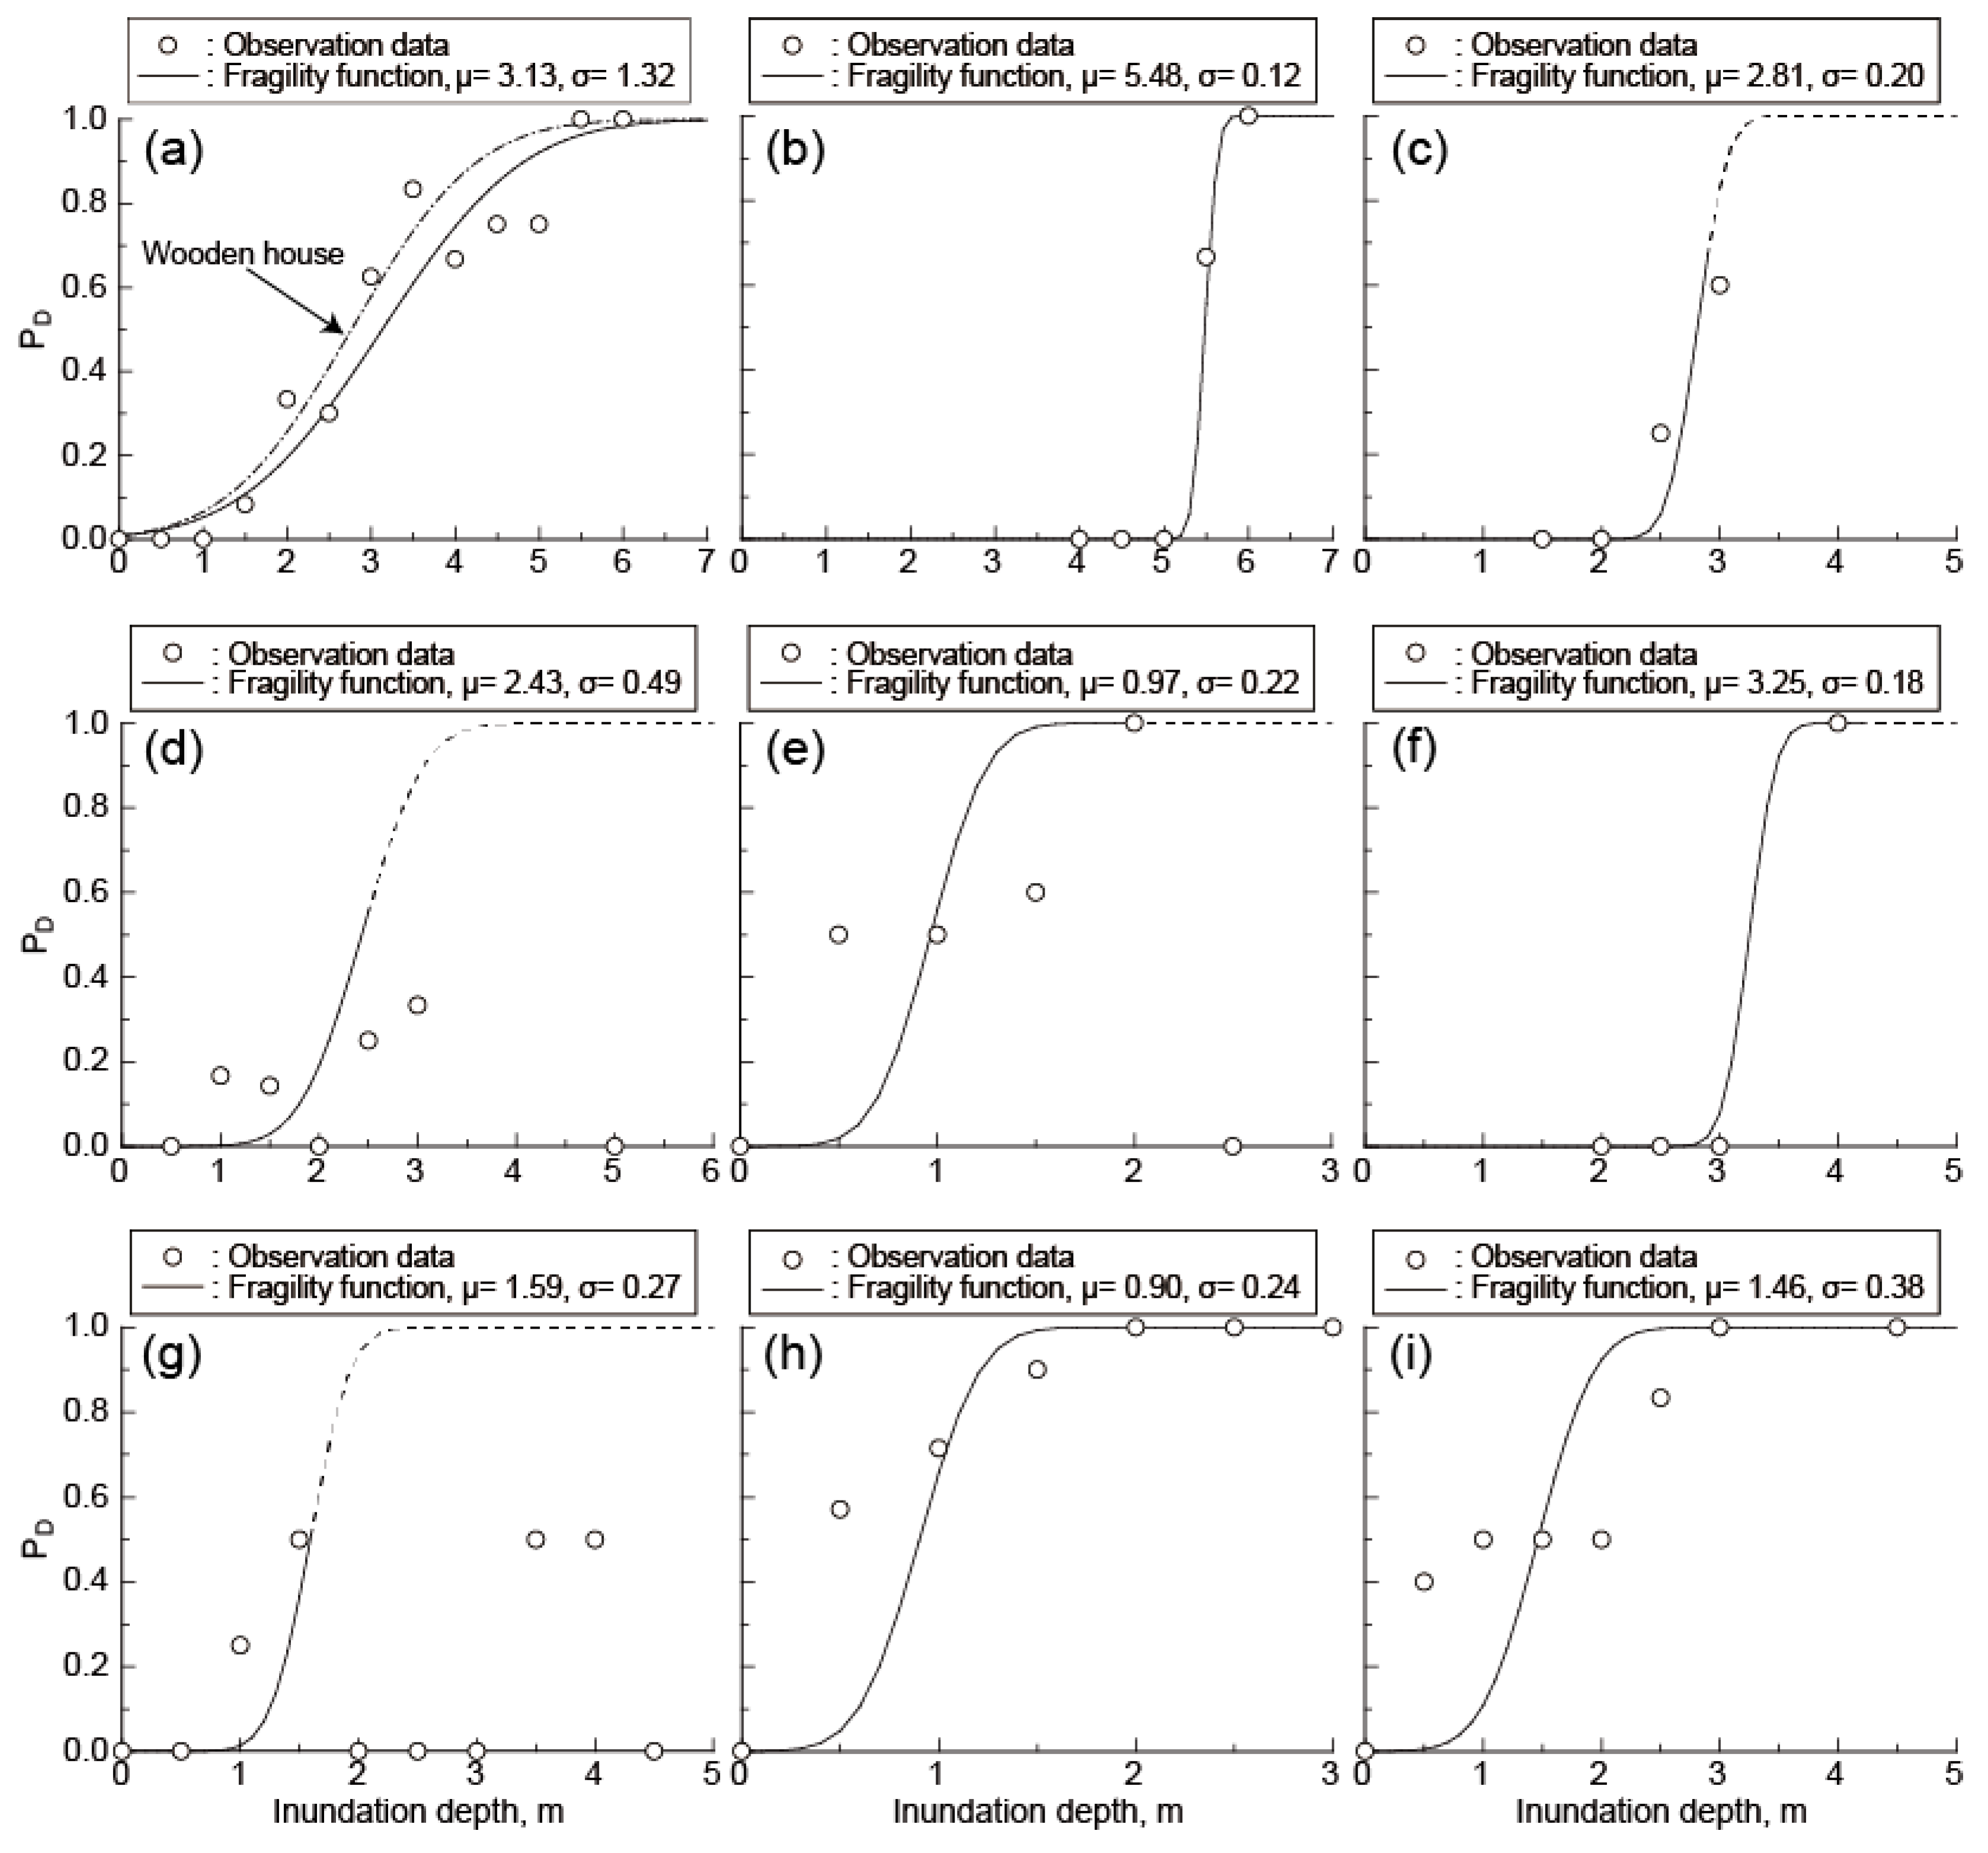
3.2. Result of the Criteria for Damage Occurrence

Table 1 shows the criteria for damage occurrence for fishery port facilities and equipment. The partial-loss (repairable) column in the table shows the minimum depth of tsunami inundation above which samples for each object were damaged. In the case of total loss, a fragility function based on Equation (1) corresponding to Figure 4. The electrical systems for many facility and equipment types are extremely vulnerable to inundation. For this research, there were many cases in which electrical system problems occurred with even slight inundation. Thus, if inundation occurred, repair was necessary for electrical equipment that was not waterproofed or moisture proofed.
The inundation depth exceeds 0.5 m, shutter door damage occurs, since the shutters are repairable in most cases, the partial loss was decided on the depth 0.5 m in Table 1.
The inundation depth at which repair of warehouse facilities becomes necessary is 0.5 m, and the total-loss probability for an inundation depth of 2 m is about 20% (Figure 4a). The total-loss probability for an inundation depth of about 3 m is 50%. The major damage fragility function for wooden houses located along straight coasts for the 2011 Tohoku earthquake [13] (dot-dash line in Figure 4a) is similar to that for warehouses.
For landing and market facilities, the depth at which repair becomes necessary is 0.7 m. From the total-loss function for landing and market facilities, when inundation depth exceeds 5 m, the probability of total-loss damage rises, and the inundation depth corresponding to PD of 50% is about 5.5 m (Figure 4b). However, as the number of total-loss examples is few, the reliability of the fragility function must be increased by inclusion of more data from severely damaged areas. However, these results are only from the case of Hirono in Iwate Prefecture [14]. It will be necessary to take into account examples from severe disaster areas.
For office facilities, electrical equipment damage requiring repairs occurred for inundation depth 0.5 m or greater with concern that total loss of office personal computers and other equipment has occurred. The strength of buildings is estimated to be about the same as for the major damage fragility function for wooden house [13,15]. Based on this result, total-loss probability is about 30% for inundation depth of 2 m and about 50% for inundation depth of 2.8 m.
For freezer and refrigeration facilities, the inundation depth threshold for repairs is about 0.9 m because of the floor height above the ground relatively high at around 1 m to allow for direct loading of trucks. The total-loss damage rate increases when the inundation depth exceeds 2 m, and the tsunami inundation depth corresponding to PD of 50% is about 2.8 m (Figure 4c); however, since we observed very few cases of total-loss damage, these are used as provisional values. The fragility function for total loss is provisional because the number of damage cases observed is about 10. The reliability of the damage function must be increased based on more data from severely damaged areas.
The threshold inundation depth that requires repairs is about 0.9 m for ice-making equipment similar case of the freezer and refrigeration facilities. Although the number of cases of observed damage is only 10, which makes the fragility function for total loss provisional, the tsunami inundation depth corresponding to PD of 50% is about 2.4 m. Since the relationship between the inundation depth and the probability of total loss for ice-making equipment is not clear (Figure 4d), the reliability of the damage function must be improved by taking into account further data for extremely severe disaster areas along the coast of Iwate to Miyagi Prefecture.
For water supply facilities, the repair measures are required for inundation of about 0.2 m. The tsunami inundation depth corresponding to PD of 50% for the water supply system is about 1.0 m (Figure 4e). As the observed data for the relationship between inundation depth and total-loss damage varies widely, more data are needed.
For fueling equipment, the repairable damage to electrical equipment for pumps occurs at an inundation depth of about 0.6 m. The tsunami inundation depth corresponding to 50% total-loss probability was about 3.2 m (Figure 4f). As Misawa Fishing Port was the only example of total loss (washing away) that we observed, more data from severely damaged regions are required along the coast of Iwate to Miyagi Prefecture.
Since most of the overhead equipment like winches, repair measures are required for inundation depths from about 0.8 m. Although the fragility function for total loss of overhead equipment is unclear, the tsunami inundation depth corresponding to PD of 50% is about 1.6 m (Figure 4g).
If stored outdoors, fish boxes, nets, tanks, containers, and barrettes are washed away at an inundation depth of 0.2 m. Even in the case of storage in a warehouse, PD is 50% for an inundation depth of 0.9 m (Figure 4h).
For both electric and engine driven forklifts, repair is required for inundation depths of about 0.8 m. Although the relationship between inundation depth and observed total loss was not clear for inundation depth of 2 m or less, total loss was observed for inundation depths exceeding 3 m. The tsunami inundation depth corresponding to PD of 50% is about 1.5 m.
Track scales as the equipment is installed in the ground, even for inundation depths of about 1 m, there were many cases of total loss.
For belt conveyors, although there were cases in which units that had been washed away were recovered and reused, inundation depths exceeding 1.7 m resulted in total loss.
There were many cases of total loss with inundation depths of 1 m and greater for wastewater treatment equipment.
Outer walls of and electrical equipment for aquaculture equipment were damaged with inundation depths of about 0.1 m or greater in some cases. The data for total loss damage not been collected, more data from severely damaged regions are required along the coast of Iwate to Miyagi Prefecture.

4. Damage Prediction for Fishing-Port Facilities and Equipment: Extending the Conventional Tsunami Analytical Tools

4.1. Damage Prediction for Katsu’ura Fishery Port of Wakayama Prefecture

As the target for prediction of tsunami damage to fishery facilities, we selected Nachi-Katsu’ura Fishery Port in Wakayama Prefecture: it is a good natural harbor that has been known since ancient times and is protected from the rough waters of the Kumano Nada (Figure 5). The fishery there is strongly affected by the Kuroshio Current that flows offshore and has prospered because of the concentration of migratory fish in the area [16]. The port is one of main fishing ports for the fishery industry in Wakayama Prefecture and the types of fishing include longline fishing for tuna, trolling, pole and line fishing, trawling, gill-netting, drift-netting, other longline fishing, and shellfish harvesting. In this region, the Nankai Trough Megathrust Earthquake has caused severe tsunami damage. The tsunami inundation height was 7 m in the Hoei Earthquake in 1707, the height of 6 m in the Ansei-Tokai Earthquake in 1854 [17], each earthquake and tsunami caused catastrophic damage. It is important to predict tsunami disasters caused by future Nankai trough earthquake tsunamis on the fishery port. Similarity, it is possible to reference information of fishery BCPs can be presented from the damage prediction result of fishery facilities.
The location and elevation of the fishery port facilities of the port are shown in Figure 6. The site elevation for each facility and equipment was measured by using GNSS. In addition to a landing and market facility and office facilities, the port is equipped with a freezer and refrigeration facility, ice-making equipment, fueling equipment and overhead equipment. Small scales, a truck scale, forklifts, and fishing gear are located on the flat area of the landing and market facility at site elevations of 1.9 to 2.6 m. The water supply equipment is located adjacent to the landing and market facility, and the pump and electrical panel is located on the first floor (2.4 m). The refrigeration facility is a reinforced concrete building with the electrical panel located on the first floor (2.1 m). The ice-making equipment is located in a 4-story reinforced concrete building; the pump on the first floor is installed 0.5 m above ground level (2.2 m) and the electrical panel is located on the 4th floor (10 m above ground level). The site elevation of the office is 2.0 m and the electrical panel is installed about 0.4 m above ground level.

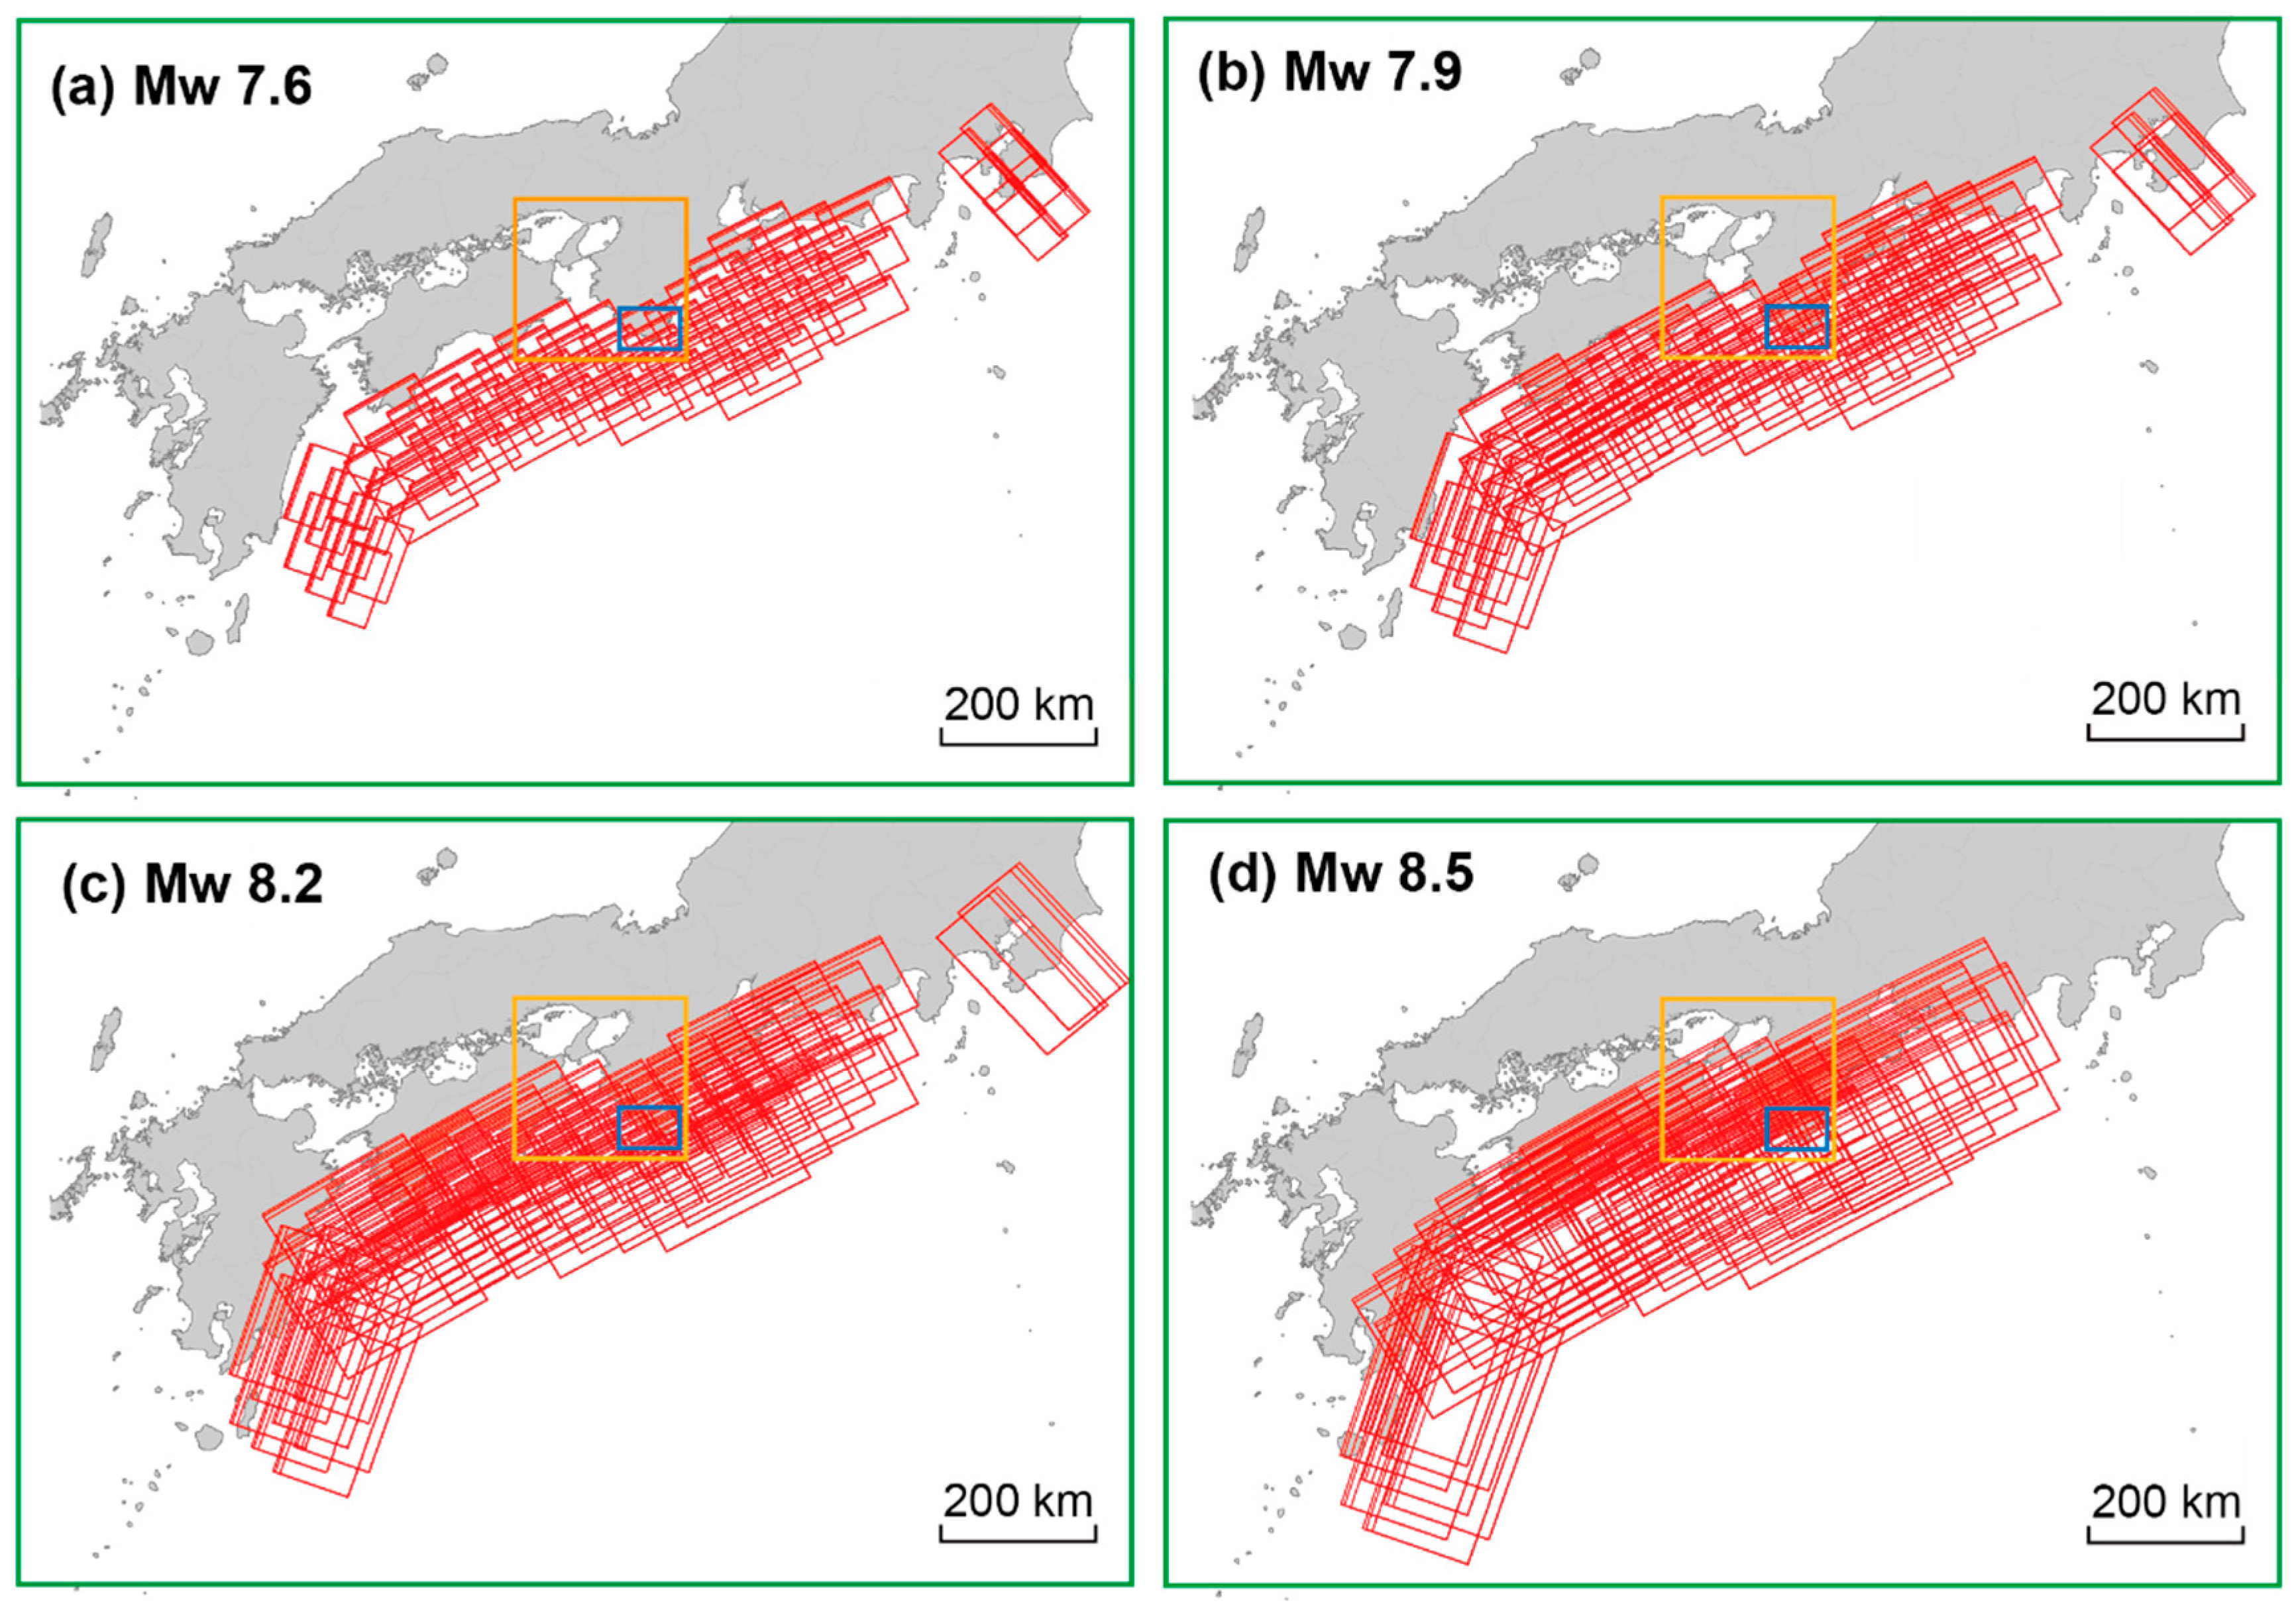
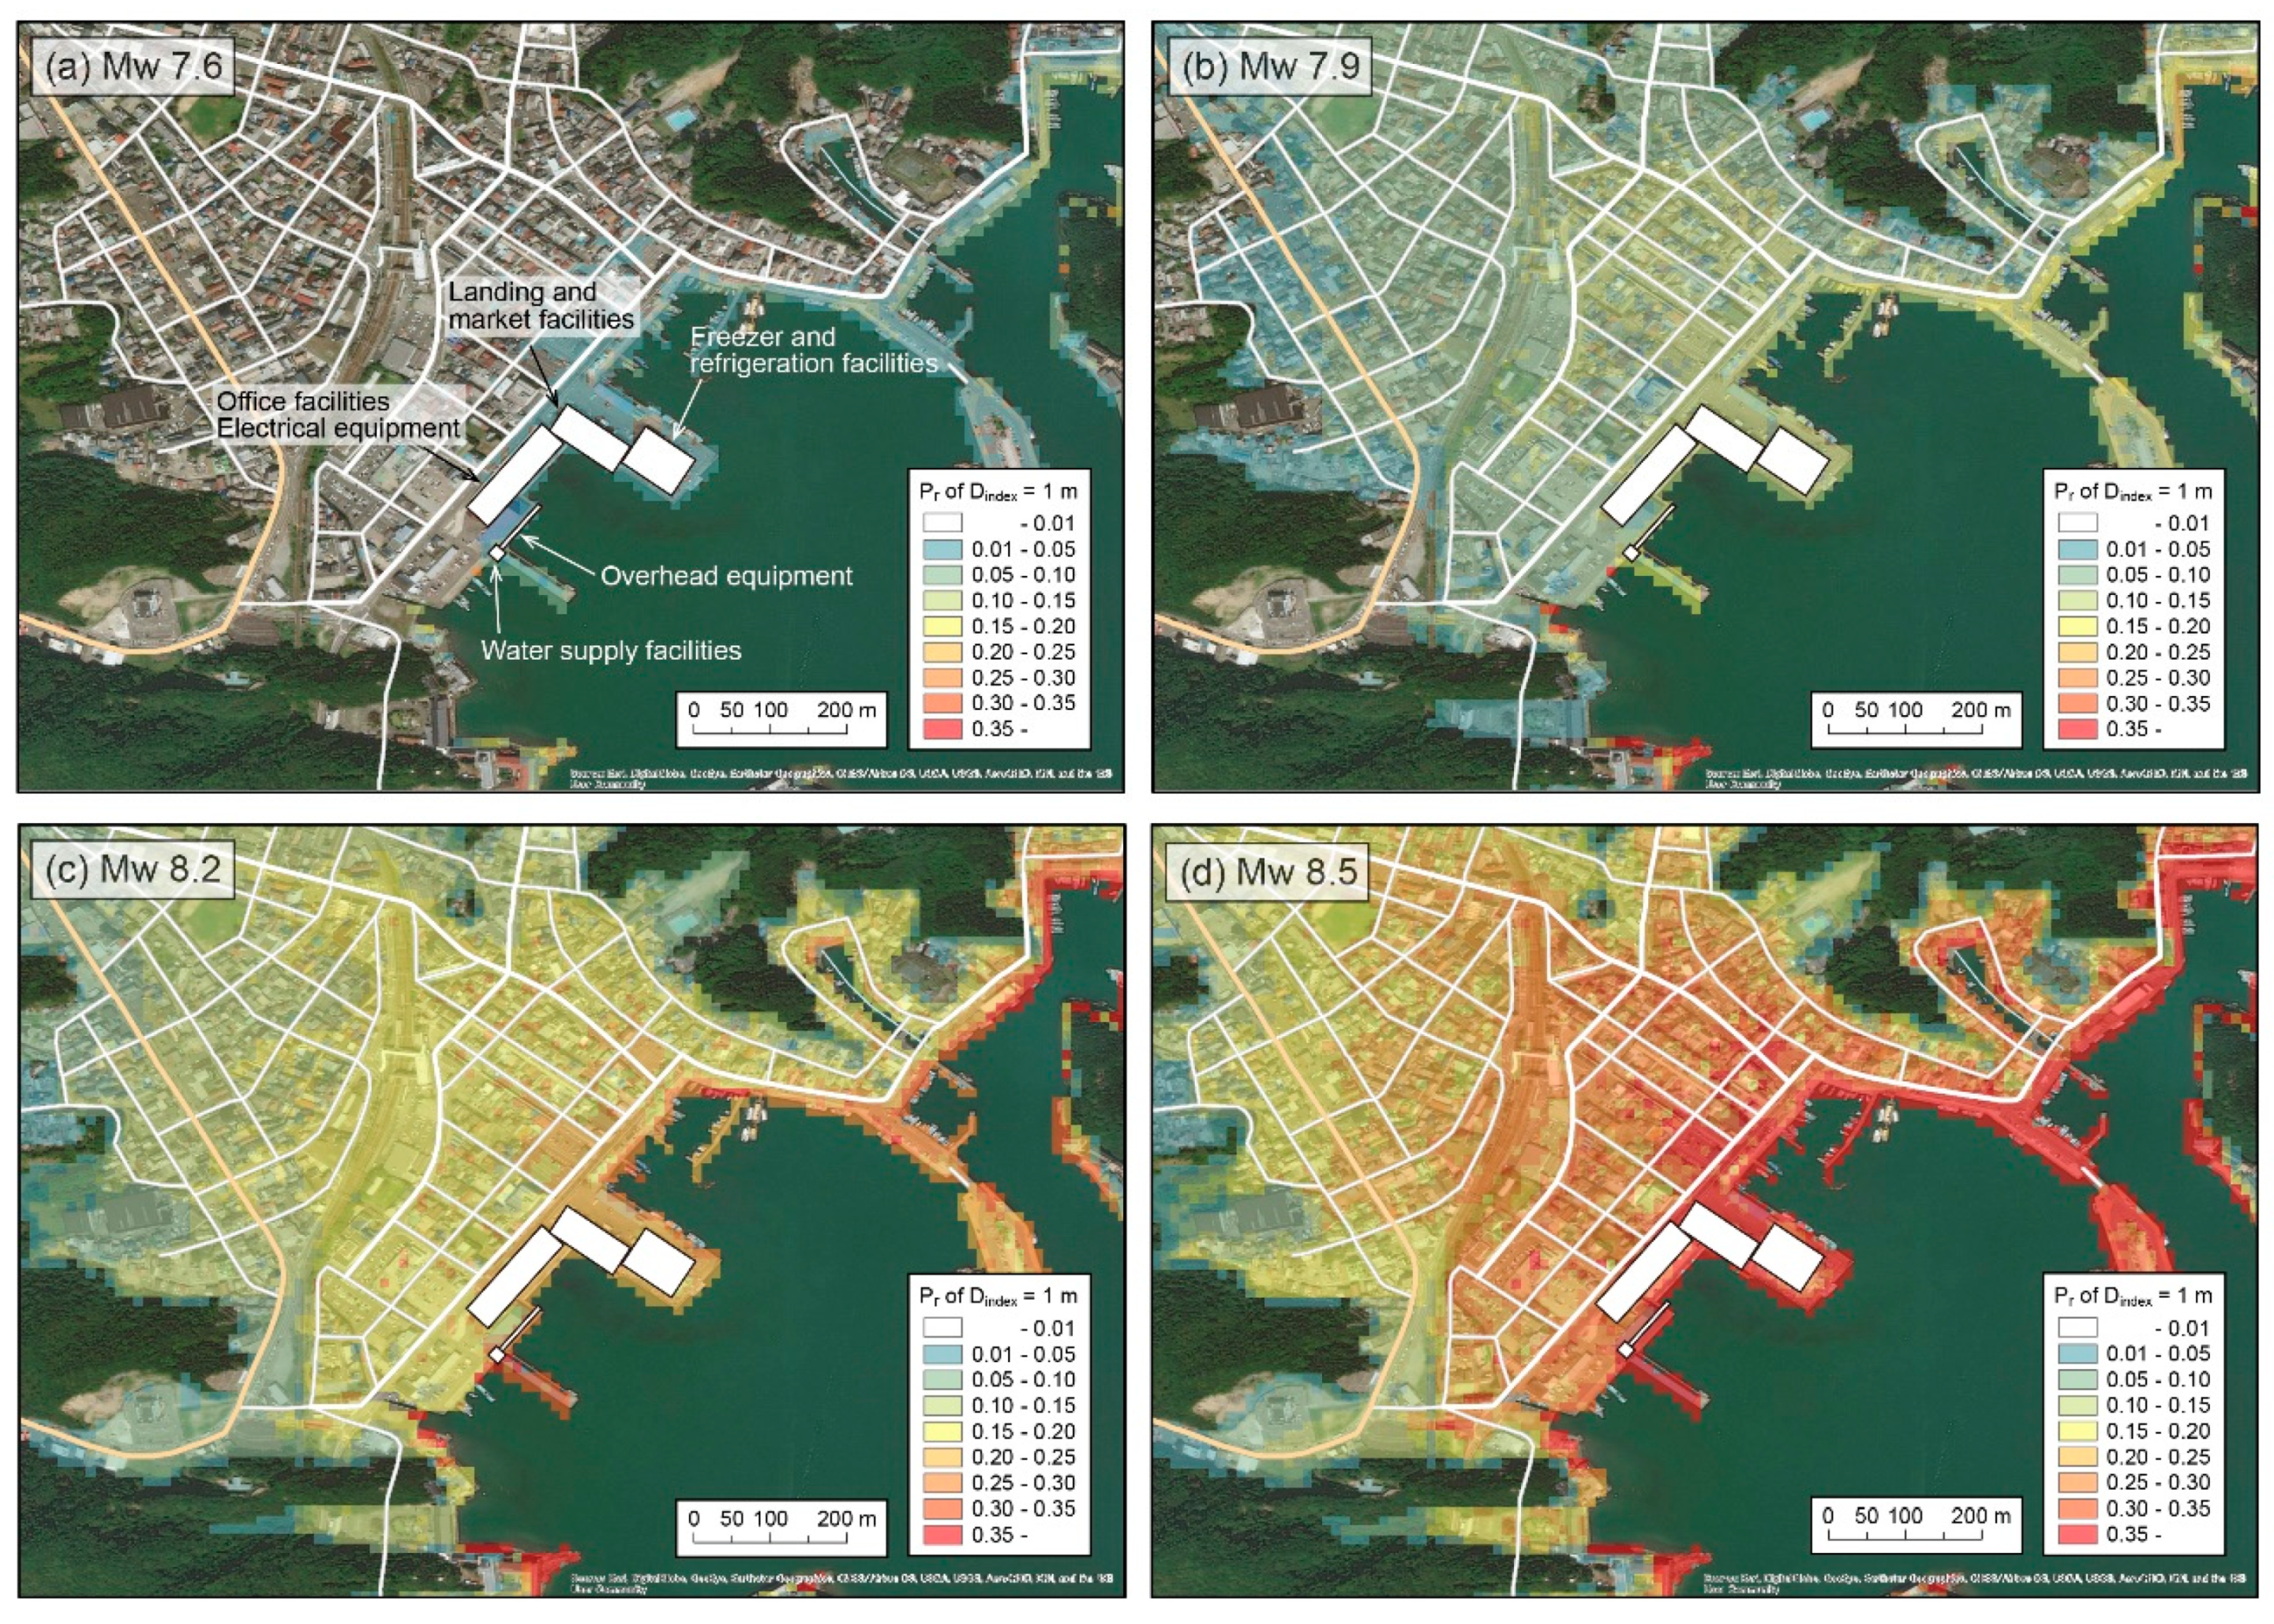
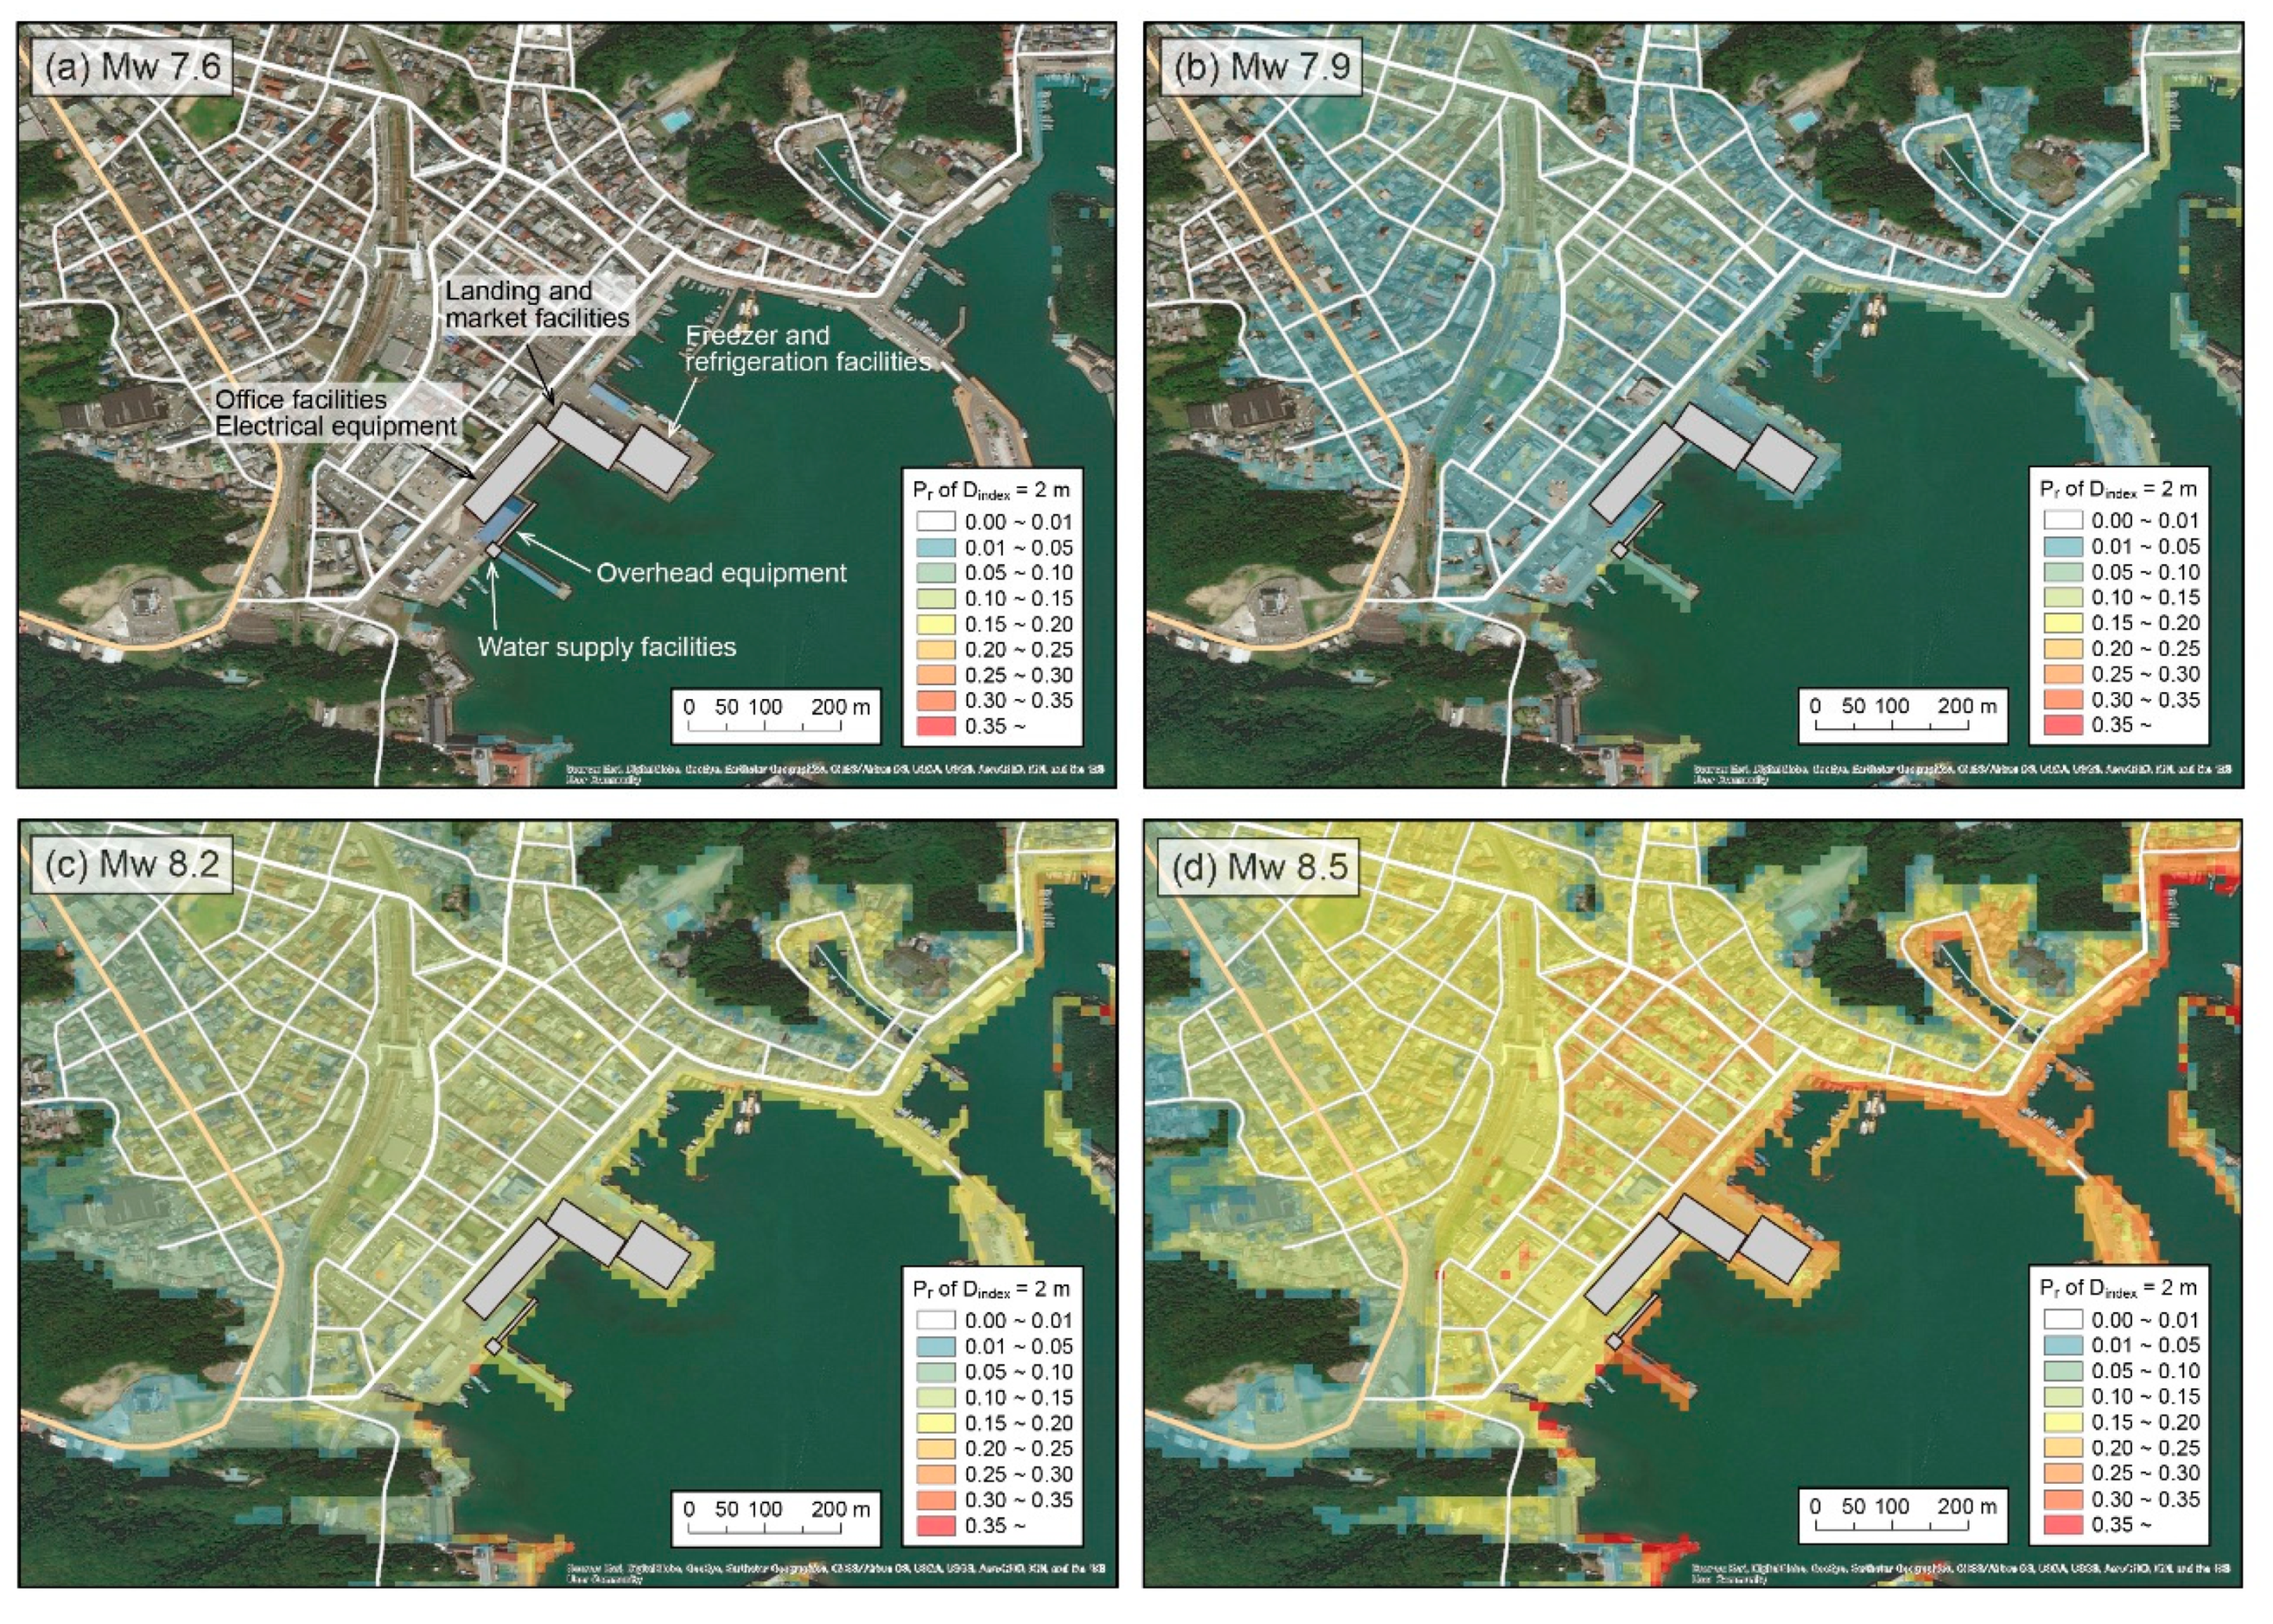
4.2. Setting the Scenario for a Tsunami Source Model

The setting method of a tsunami source scenario is an issue in predicting tsunami damage. Since the 2011 Tohoku tsunami, tsunami damage prediction has been considered based on either the disaster prevention level for a 100-year tsunami for the area that is the target of the prediction, or the disaster mitigation level from a maximum possible model issued by the Japan Cabinet Office [18]. In either case, since the tsunami estimation results are based on a source scenario set by the disaster prevention level or disaster mitigation level, uncertainty for tsunami hazards from inundation etc. is not considered.
We tested a damage estimation method that probabilistically expresses tsunami hazards and predicts the resulting damage for fishery facilities and equipment. The tsunami source model assumed a tsunami generated by a large earthquake in the Nankai Trough: based on spatial and scale diversity of tsunami sources, the scenario model along the Nankai Trough took into account 1506 possible cases (Figure 6). For the tsunami scenario model of fault model along the Nankai Trough with fluctuation in fault depth, slope and magnitude were used. The scenario of the moment magnitude Mw were divided into 4 classes corresponding to Mw 7.6, 7.9, 8.2, and 8.5, the depth was 5 km or 20 km, and the rake angle was 5 degrees, 10 degrees, and 25 degrees, and the slip amount was determined according to Mw by using scaling law’s [19], and diverse occurrence locations were considered [20].

4.3. Tsunami Numerical Analysis and Damage Prediction for Fishery Facilities

The governing equation is the tsunami analysis code JAGURS [21] based on the nonlinear long wave equation. The nonlinear long wave equations are expressed as
η t + M x + N y = 0
M t + x ( M 2 D ) + y ( M N D ) + g D η x + g n 2 D 7 / 3 M M 2 + N 2 = 0
N t + x ( M N D ) + y ( N 2 D ) + g D η y + g n 2 D 7 / 3 N M 2 + N 2 = 0
where η is wave amplitude, D is total depth (inundation depth on land), M and N are flux discharge in two horizontal directions, g is gravity acceleration, and n is Manning’s roughness coefficient (0.025 m−1/3s in the sea and 0.03 m−1/3s on land). The spatial grid spacing including the tsunami source gradually changes from 2340 m to 810, 270, 90, 30, and 10 m to become a high-resolution bathymetric model. The computational time interval for each region is 0.1 s to satisfy the stability condition of the finite difference method. The area including Nachi-Katsu’ura Fishery Port in the damage prediction area and its coast were analyzed with a grid spacing of 10 m.
As tsunami damage prediction was the target of this research, we selected several parameters as the hazard probability Pr corresponding to an arbitrary spatial position of s on the inundation area: exceeding inundation depth Dindex corresponds to each tsunami scenario, and moment magnitude scale of Mw is defined below and used as the assessment index.
P r = f ( D i n d e x ,   s ,   M w )
f ( D i n d e x ,   s ,   M w ) F r q ( D i n d e x ,   s ,   M w ) / k
Here, Frq(Dindex, s, Mw) is the frequency of Dindex for each scale Mw at s, and k the total number of tsunami scenarios for each Mw simulated. To simplify the analysis, the tsunami source scenarios for the entire Nankai Trough are taken to have the same occurrence probability. The occurrence probability variation can also be divided into the Tokai, Tonankai, and Nankai segments. It is also possible to evaluate the seismic scale by weighting it using the Gutenberg-Richter law [22]. The value of Dindex in this research is a trial value and it’s should vary depending on the damage prediction object.

4.4. Damage Prediction Results

Pr distribution for inundation depths exceeding 1 m around the Nachi-Katsu’ura Fishery Port for 4 classes of tsunami scenario in Figure 7, The reason for the inundation depth set as exceeding 1m was used as the criteria is that the partial loss damage for fishery facilities has occurred around 1 m depth in the field results. For the prediction of actual damage occurrence, it is necessary to examine at the inundation depth corresponding to the criteria of damage occurrence for each facility.
A slight inundation only occurs near the quay, Pr at Nachi Katsu’ura Fishery Port is less than 10% for Mw 7.6 class in Figure 7a. In the case of a tsunami with Mw of 7.9 or more, the probability of inundation exceed 1 m has increased not only in Katsu’ura Fishery Port but also in inland areas in Figure 7b–d. Focusing on various facilities, Pr around various facilities less than 5% in the case of Mw 7.6 class. It compared with the criteria for partial damage in Table 1, only water supply facilities could be damaged of partial loss. In the case of Mw 7.9 class, Pr distribution around those facilities become over 30% in Mw 8.2 class and over 20% in Mw 8.5 class. Therefore, it is predicted of those facilities possibility of occurred partially loss damaged during over Mw of 7.9 class.
Pr for inundation depths exceeding 2 m around the Nachi-Katsu’ura Fishery Port was shown in Figure 8, A slight inundation only occurs near the quay, Pr at Nachi Katsu’ura Fishery Port is less than 5% for Mw 7.6 class in Figure 8a. for over Mw 7.9 class of tsunami scenario, Pr distribution area has widely spread not only in Katsu’ura Fishery Port but also in inland areas in Figure 8b–d. Pr as 0.02 to 0.08 were distributed around the facilities in the Mw 7.9 class. Pr as 0.08 around the water supply facilities, as 0.05 around the landing and market, as 0.03 around the office and as 0.02 around the freezer and refrigeration. In the Mw 8.2 class, Pr as 0.10 to 0.17 were distributed around the facilities, Pr as 0.17 around the water supply, as 0.15 around the landing and market, as 0.10 around the office and as 0.12 around the freezer and refrigeration. In the Mw 8.5 class, Pr as 0.16 to 0.28 were distributed around the facilities, Pr as 0.28 around the water supply, as 0.21 around the landing and market, as 0.16 around the office and as 0.17 around the freezer and refrigeration. Thus, as the class of Mw increases, Pr around each facility also tends to increase.
Here, referring to the result of Mw 8.5 class, the damage probability of each facility was examined using the criteria of total loss damage based on Pr and the fragility function from Figure 4. Resulting the damage probability of water supply facility has reached on 100% by the fragility function of Figure 4e with the inundation depth exceeds 2 m, the probability for total loss damage in Mw 8.5 class was estimated more than 28% to multiply with Pr. According to a similar procedure of the case of water supply facility, the probability of total loss damage of 2 m inundation depth for the landing and market facilities was evaluated close to 0%, the total loss ratio in the Mw 8.5 class is close to 0%. The probability of total loss damage for the office facility was evaluated close to 30%, the probability of total loss in the Mw 8.5 class as about 5%. For the freezer and refrigeration, the probability of total loss damage was evaluated close to 0%. Therefore, there is a possibility that each facility will avoid total loss damage, but in any case, the possibility of partial loss damage to the electrical system is extremely high.

5. Conclusions

A field survey of the fishery-port damage caused by the 2011 Tohoku tsunami was conducted for the Pacific coasts of Hokkaido, Aomori, Ibaraki, and Chiba prefectures. The results of the study were used to build criteria for damage occurrence for 16 types of fishery-port facilities and equipment.
A tsunami hazard assessment method that expresses the probability distribution for tsunami inundation depths was considered by using 1506 tsunami scenarios for Nankai Trough earthquakes of the scale as Mw divided into four classes (Mw 7.6, 7.9, 8.2, and 8.5). Tsunami damage was predicted for a model region, the Nachi Katsu’ura Fishery Port in Wakayama Prefecture. The method we developed in this research makes it possible to assess the probability of tsunami damage by combining a tsunami hazard assessment method with criteria for damage occurrence for fishery port facilities and equipment.

Author Contributions

Conceptualization, K.I.; Data curation, T.I. and K.E.; Formal analysis, K.I.; Funding acquisition, K.I.; Investigation, K.I., T.I., T.H., A.S., M.O., M.N. and K.M.; Supervision, K.I., T.H. and T.S.; Visualization, T.I., K.E. and K.K.; Writing—original draft, K.I.; Writing—review & editing, K.I.

Funding

This research was supported by a research grant from The Japanese Institute of Fisheries Infrastructure and Communities (JIFIC) titled “Development of the vulnerability criteria for fishery port facilities during tsunami and storm surge” from 2016 to 2017.

Acknowledgments

We are grateful to the anonymous reviewers for their constructive and attentive comments. We express our appreciation to the officials of the cooperating fisheries cooperatives in Hokkaido, Aomori, Ibaraki, and Chiba prefectures and others for their cooperation in the conduct of this research.

Conflicts of Interest

The funders had no role in the design of the study; in the collection, analyses, or interpretation of data; in the writing of the manuscript, or in the decision to publish the results.

References

  1. Aomori Prefecture, Hachinohe Haber BCP. Available online: http://www.pref.aomori.lg.jp/soshiki/kendo/kowan-/files/170224hachibcp01.pdf (accessed on 30 June 2019). (In Japanese).
  2. Japan Fisheries Agency. Guidelines for the Development of BCPs on the Production and Distribution of Fishery Products in Fishery Areas (revised edition). Available online: http://www.jfa.maff.go.jp/j/gyoko_gyoz-yo/g_hourei/attach/pdf/index-88.pdf (accessed on 30 June 2019). (In Japanese)
  3. Nagai, S.; Imamura, F.; Shuto, N. Reproducibility of the 1960 Chilean tsunami in coastal areas by numerical computation. In Proceedings of the Coastal Engineering Conference, Kyoto, Japan, 7 November 1989; Japan Society of Civil Engineers: Tokyo, Japan, 1989; Volume 36, pp. 183–187. (In Japanese). [Google Scholar]
  4. Suppasri, A.; Fukui, K.; Yamashita, K.; Leelawat, N.; Ohira, H.; Imamura, F. Developing fragility functions for aquaculture rafts and eelgrass in the case of the 2011 Great East Japan tsunami. Nat. Hazards Earth Syst. Sci. 2018, 18, 145–155. [Google Scholar] [CrossRef] [Green Version]
  5. Hashimoto, T.; Koshimura, S.; Kobayashi, E. Analysis of large ship drifting motion by tsunami—A case study in banda aceh, Indonesia. J. Japan. Soc. Civ. Eng. Ser. B2 (Coastal Eng.) 2009, 65, 316–320. (In Japanese) [Google Scholar] [CrossRef]
  6. Suppasri, A.; Muhari, A.; Futami, T.; Imamura, F.; Shuto, N. Loss functions of small marine vessels based on surveyed data and numerical simulation of the 2011 Great East Japan tsunami. J. Waterw. Port Coast. Ocean Eng. 2014, 140, 04014018. [Google Scholar] [CrossRef]
  7. Shuto, N. Tsunami intensity and disasters. In Tsunamis in the World; Kluwer Academic Publishers: Dodlek, The Netherlands, 1993; pp. 197–216. [Google Scholar]
  8. Yeh, H. Design tsunami forces for onshore structures. J. Disaster Res. 2007, 2, 531–536. [Google Scholar] [CrossRef]
  9. Koshimura, S.; Namegaya, Y.; Yanagisawa, H. Tsunami fragility—A new measure to identify tsunami damage. J. Disaster Res. 2009, 4, 479–488. [Google Scholar] [CrossRef]
  10. Suppasri, A.; Pakoksung, K.; Charvet, I.; Chua, C.T.; Takahashi, N.; Ornthammarath, T.; Latcharote, P.; Leelawat, N.; Imamura, F. Load-resistance analysis: An alternative approach to tsunami damage assessment applied to the 2011 Great East Japan tsunami. Nat. Hazards Earth Syst. Sci. 2019, 19, 1807–1822. [Google Scholar] [CrossRef]
  11. Fisheries Research Agency. Survey Report on the Earthquake and Tsunami Damage to Fishing Port Facilities Due to the Great East Japan Earthquake (first report), Report on Activities for Recovery and Reconstructions from the 2011 Great East Japan Earthquake, 1. Available online: https://www.fra.affrc.go.jp/eq/re-po_res/report01.pdf (accessed on 30 June 2019). (In Japanese)
  12. Fisheries research Agency. Survey Report on the Earthquake and Tsunami Damage to Fishing Port Facilities Due to the Great East Japan Earthquake (first report), Report on Activities for Recovery and Reconstructions from the 2011 Great East Japan Earthquake, 2. Available online: https://www.fra.affrc.go.jp/eq/re-po_res/report05.pdf (accessed on 30 June 2019). (In Japanese)
  13. Imai, K.; Obayashi, R.; Kai, Y.; Namegaya, Y.; Takahashi, N. Characteristics of tsunami fragility functions of wooden houses with straight coasts. In Proceedings of the JAEE annual meeting 2016, Eikokuji Campus of Kochi University of Technology, Kochi, Japan, 26–27 September 2016; Japan Association for Earthquake Engineering P2-2. (In Japanese). [Google Scholar]
  14. Hirono town. Record of the Great East Japan Earthquake and Tsunami: The Bonds between the Sea and the Plateau, a Sure Recovery for the Future. Available online: http://www.town.hirono.iwate.jp/do-cs/2014080600027/ (accessed on 30 June 2019). (In Japanese).
  15. Suppasri, A.; Mas, E.; Charvet, I.; Gunasekera, R.; Imai, K.; Fukutani, Y.; Abe, F.; Imamura, F. Building damage characteristics based on surveyed data and fragility curves of the 2011 Great East Japan tsunami. Nat. Hazards 2013, 66, 319–341. [Google Scholar] [CrossRef]
  16. Wakayama Prefectural Federation of Fisheries Cooperative Associations. Overview of Nachi-Katsu’ura Fishery Port. Available online: http://wkgyoren.com/katsuura/index.html (accessed on 30 June 2019). (In Japanese).
  17. Hatori, T. Field investigation of the Nankaido tsunamis in 1707 and 1854 along the Osaka and Wakayama Coasts, West Peninsula. Bull. Earthq. Res. Inst. 1980, 55, 505–535. [Google Scholar]
  18. Japan Cabinet Office. Fault Models for Tsunami—Tsunami Fault Models and the Height, Inundation Areas-Investigation Committee for Nankai trough Huge Earthquake Fault Models (Secondary report). Available online: http://www.bousai.go.jp/kaigirep/chousakai/tohokukyokun/pdf/tyuukan.pdf (accessed on 30 June 2019). (In Japanese)
  19. Romanowicz, B.; Ruff, L.J. On moment-length scaling of large strike slip earthquakes and the strength of faults. Geophys. Res. Lett. 2002, 29, 45-1. [Google Scholar] [CrossRef]
  20. Ishibashi, M.; Baba, T.; Takahashi, N.; Imai, K. Social implementation of tsunami prediction system on Wakayama by using DONET information. J. Jpn. Soc. Nat. Disaster Sci. 2018, 37, 125–142. (In Japanese) [Google Scholar]
  21. Baba, T.; Ando, K.; Matsuoka, D.; Hyodo, M.; Hori, T.; Takahashi, N.; Obayashi, R.; Imato, Y.; Kitamura, D.; Uehara, H.; et al. Large-scale, high-speed tsunami prediction for the great Nankai trough earthquake on the K computer. Int. J. High Perform. Comput. Appl. 2016, 30, 71–84. [Google Scholar] [CrossRef]
  22. Gutenberg, B.; Richter, C.F. Seismicity of the Earth; Geological Society of America: New York, NY, USA, 1941; No. 34; pp. 1–126. [Google Scholar]
Figure 1. Surveyed fishery ports; the triangles indicate the ports we investigated. The numbers in parentheses indicate the name of the fishery port in the key on the right side. The × marks the epicenter of the 2011 Tohoku-oki earthquake.
Geosciences 09 00410 g001
Figure 2. Example of fishery port facilities and equipment damage at Noushi fishery port (6 on Figure 1). (a) The tsunami trace height distribution around Noushi fishery port. Tsunami run-up height (R), inundation height (I), and inundation depth (D). (b) Fishing gear and automobiles displaced by moving water at the port site. (c) The forklift that collided with the shutter door of the landing and market facilities. (d) Fishing gear scattered in the warehouse. (e) The office in which electric devices failed due to inundation by the tsunami. All the photos were provided by the Noushi Fishery Cooperative.
Geosciences 09 00410 g002
Figure 3. An example of a process for determining the variables as μ and σ on fragility function for fishery warehouse. (a) Histogram for the number of the repairable and total loss of fishery warehouse. The class of the inundation depth was made to be the 0.5 m interval, and the repairable and total loss within the range were counted. (b) An example of the plot on normal probability paper.
Geosciences 09 00410 g003
Figure 4. Fragility functions (damage probability PD versus inundation depth) for fishery port facilities and equipment. Circles indicate observed data, solid lines indicate the fragility function for each category, and dashed lines indicate extrapolation of the function. (a) Warehouses. The dash-dot line indicates the fragility function of wooden houses along straight coastlines during the 2011 Tohoku-oki earthquake tsunami [13]. (b) Landing and market facilities. (c) Freezer and refrigeration facilities, the dashed line is extrapolated and are not reliable. (d) Ice-making facilities, the dashed line is extrapolated and is also not reliable. (e) Water supply facilities. (f) Fueling facilities, the dashed line is extrapolated and is not reliable. (g) Overhead equipment, the dashed line is extrapolated and is not reliable. (h) Fishing gear. (i) Forklifts.
Geosciences 09 00410 g004
Figure 5. Location (a) and elevations (b) of fishery facilities and equipment for the Nachi-Katsu’ura Fishery Port of Wakayama Prefecture. The spatial distribution of fishery facilities and equipment in (b) is shown with respect to ground height. Numerals in parentheses indicate the ground height relative to mean sea level in Tokyo Bay.
Geosciences 09 00410 g005
Figure 6. A tsunami source fault model with 1506 types of tsunami scenarios. The solid green line region indicates spatial grid of 810 m, orange line region as 270 m, blue line region as 90 m, (a) Earthquake moment magnitude cases of Mw 7.6, (b) Mw 7.9, (c) Mw 8.2, and (d) Mw 8.5.
Geosciences 09 00410 g006
Figure 7. Probability distribution of tsunami inundation depth exceeding 1 m at Nachi-Katsu’ura Fishery Port. (a) Tsunami scenario for an Mw 7.6 cases, (b) Mw 7.9 cases, (c) Mw 8.2 cases, (d) Mw 8.5 cases.
Geosciences 09 00410 g007
Figure 8. Probability distribution of tsunami inundation depth exceeding 2 m at Nachi-Katsu’ura Fishery Port. (a) Tsunami scenario for an Mw 7.6 cases, (b) Mw 7.9 cases, (c) Mw 8.2 cases, (d) Mw 8.5 cases.
Geosciences 09 00410 g008
Table 1. Fishery port facility and equipment damage criteria in Japan.
Damaged Facilities and EquipmentCriteria for Damage Occurrence (Inundation Depth)
Partial Loss (Repairable), mTotal Loss
(1) General electrical equipmentinundated1)
(2) Building shutter doors0.5
(3) Warehouse facilities0.5Fragility Func. in Figure 4a
(4) Landing and market facilities0.7Fragility Func. in Figure 4b
(5) Office facilities0.5Previous research2)
(6) Freezer and refrigeration facilities3)0.9Fragility Func. in Figure 4c
(7) Ice-making facilities3)0.9Fragility Func. in Figure 4d
(8) Water supply facilities3)0.2Fragility Func. in Figure 4e
(9) Fueling facilities3)0.6Fragility Func. in Figure 4f
(10) Overhead equipment3)0.8Fragility Func. in Figure 4g
(11) Fishing gear0.24)Fragility Func. in Figure 4h
(12) Forklifts0.9Fragility Func. in Figure 4i
(13) Truck scales5)0.8
(14) Belt conveyors5)1.7
(15) Wastewater treatment facilities5)1.0
(16) Aquaculture facilities5)0.1
1) Depends on inundation, determined by the relationship between height of the distribution unit from the ground and inundation depth. 2) Reference [13]. 3) Fragility function for total loss is provisional because the number of damage cases observed is about 10. 4) If stored inside warehouse, may not wash away. 5) Because the number of samples is less than 10, depth in the table indicates minimum inundation depth at which fishery equipment is damaged.

