Multi-Source Based Spatio-Temporal Distribution of Snow in a Semi-Arid Headwater Catchment of Northern Mongolia

 , ,
, ,
Abstract
:1. Introduction
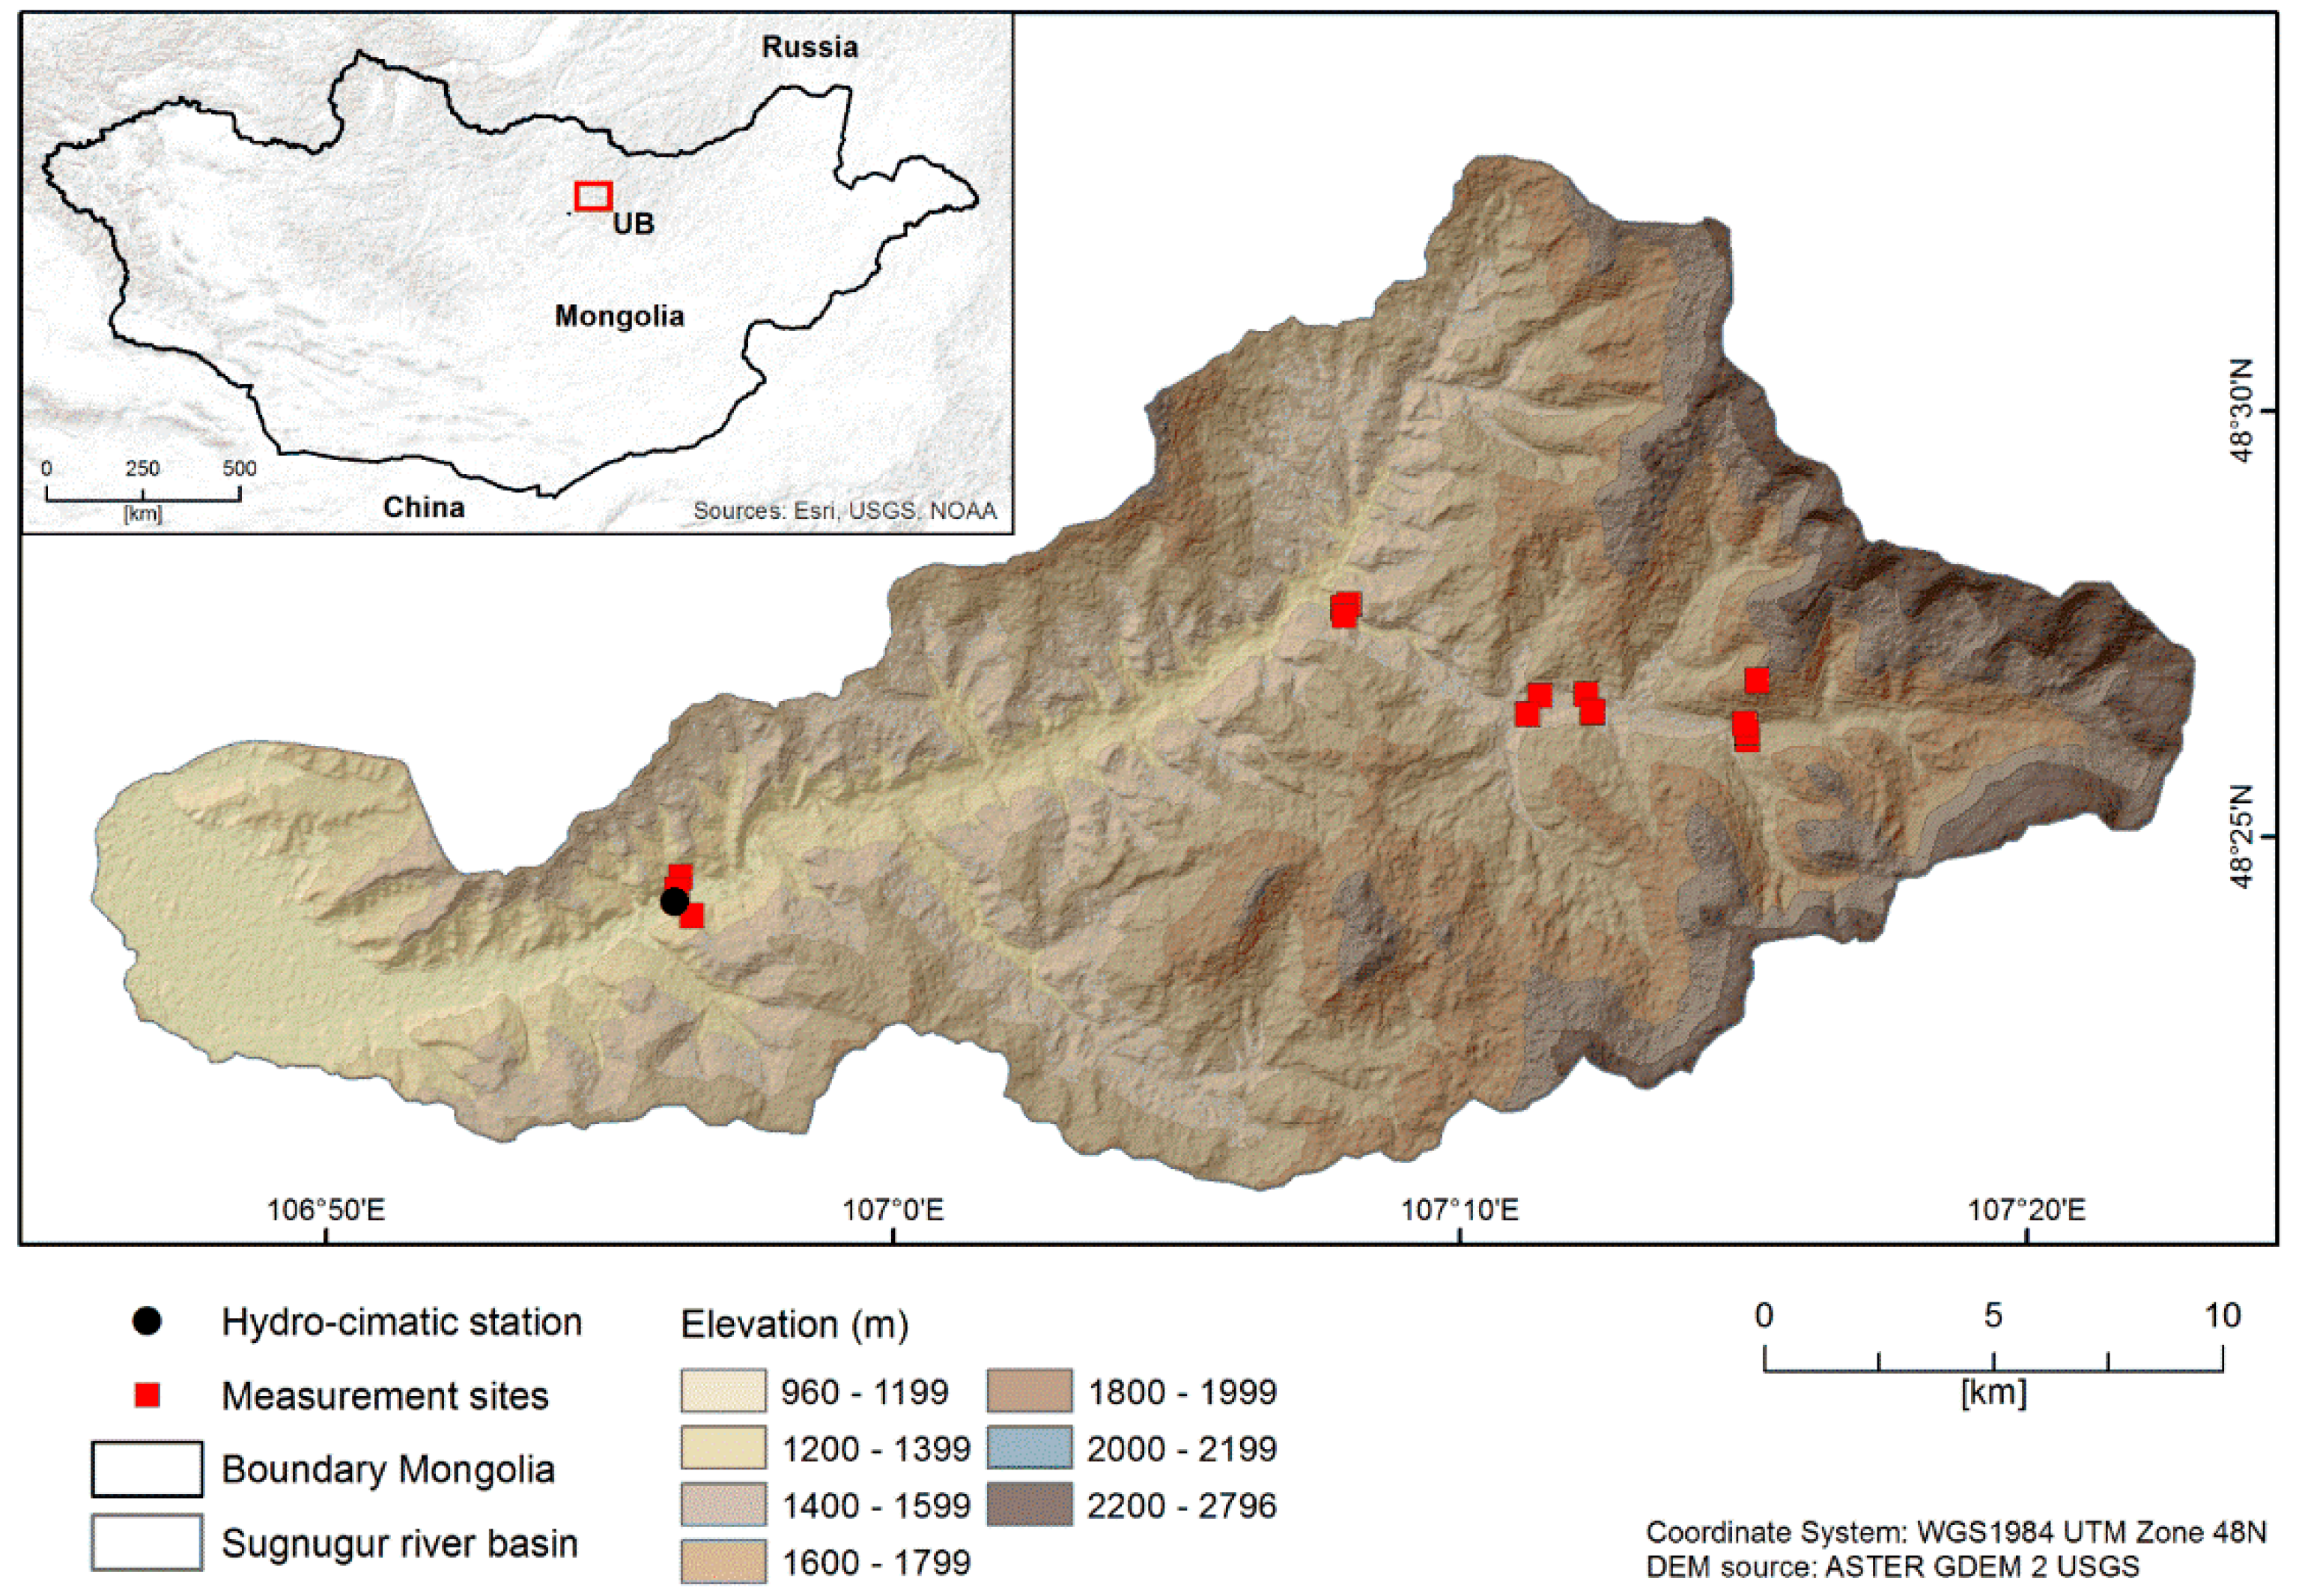
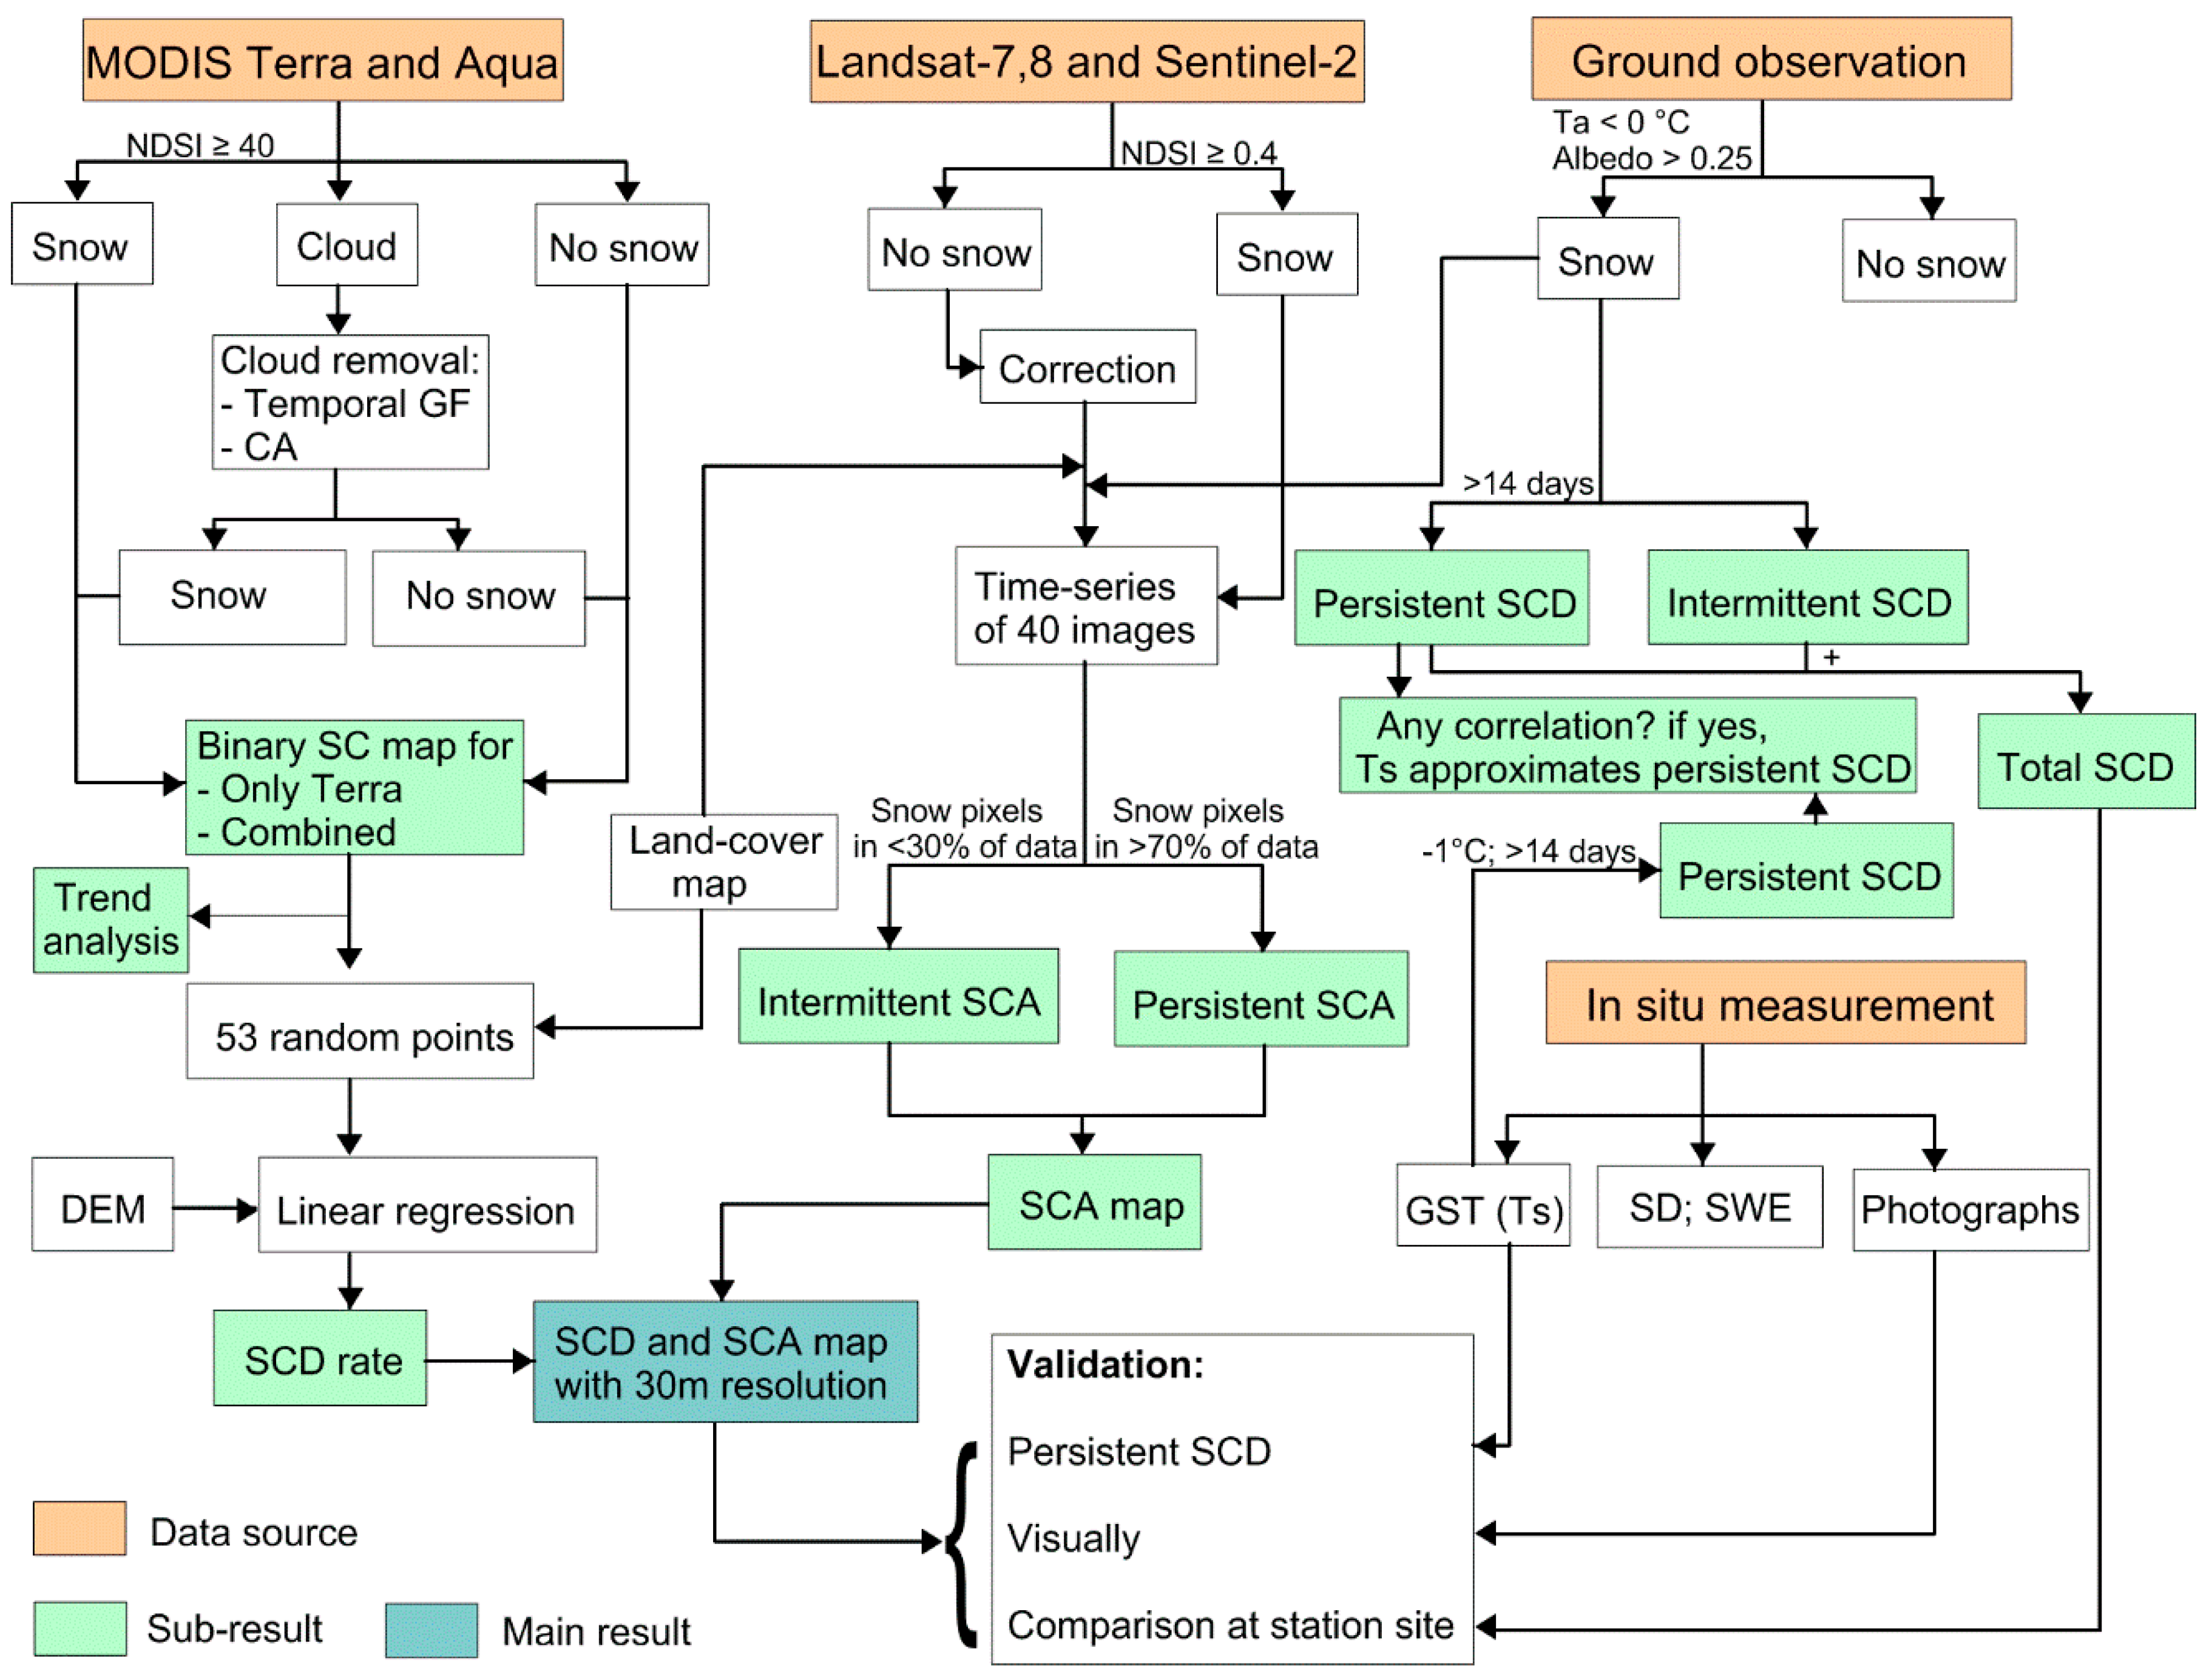
2. Materials and Methods
2.1. Materials
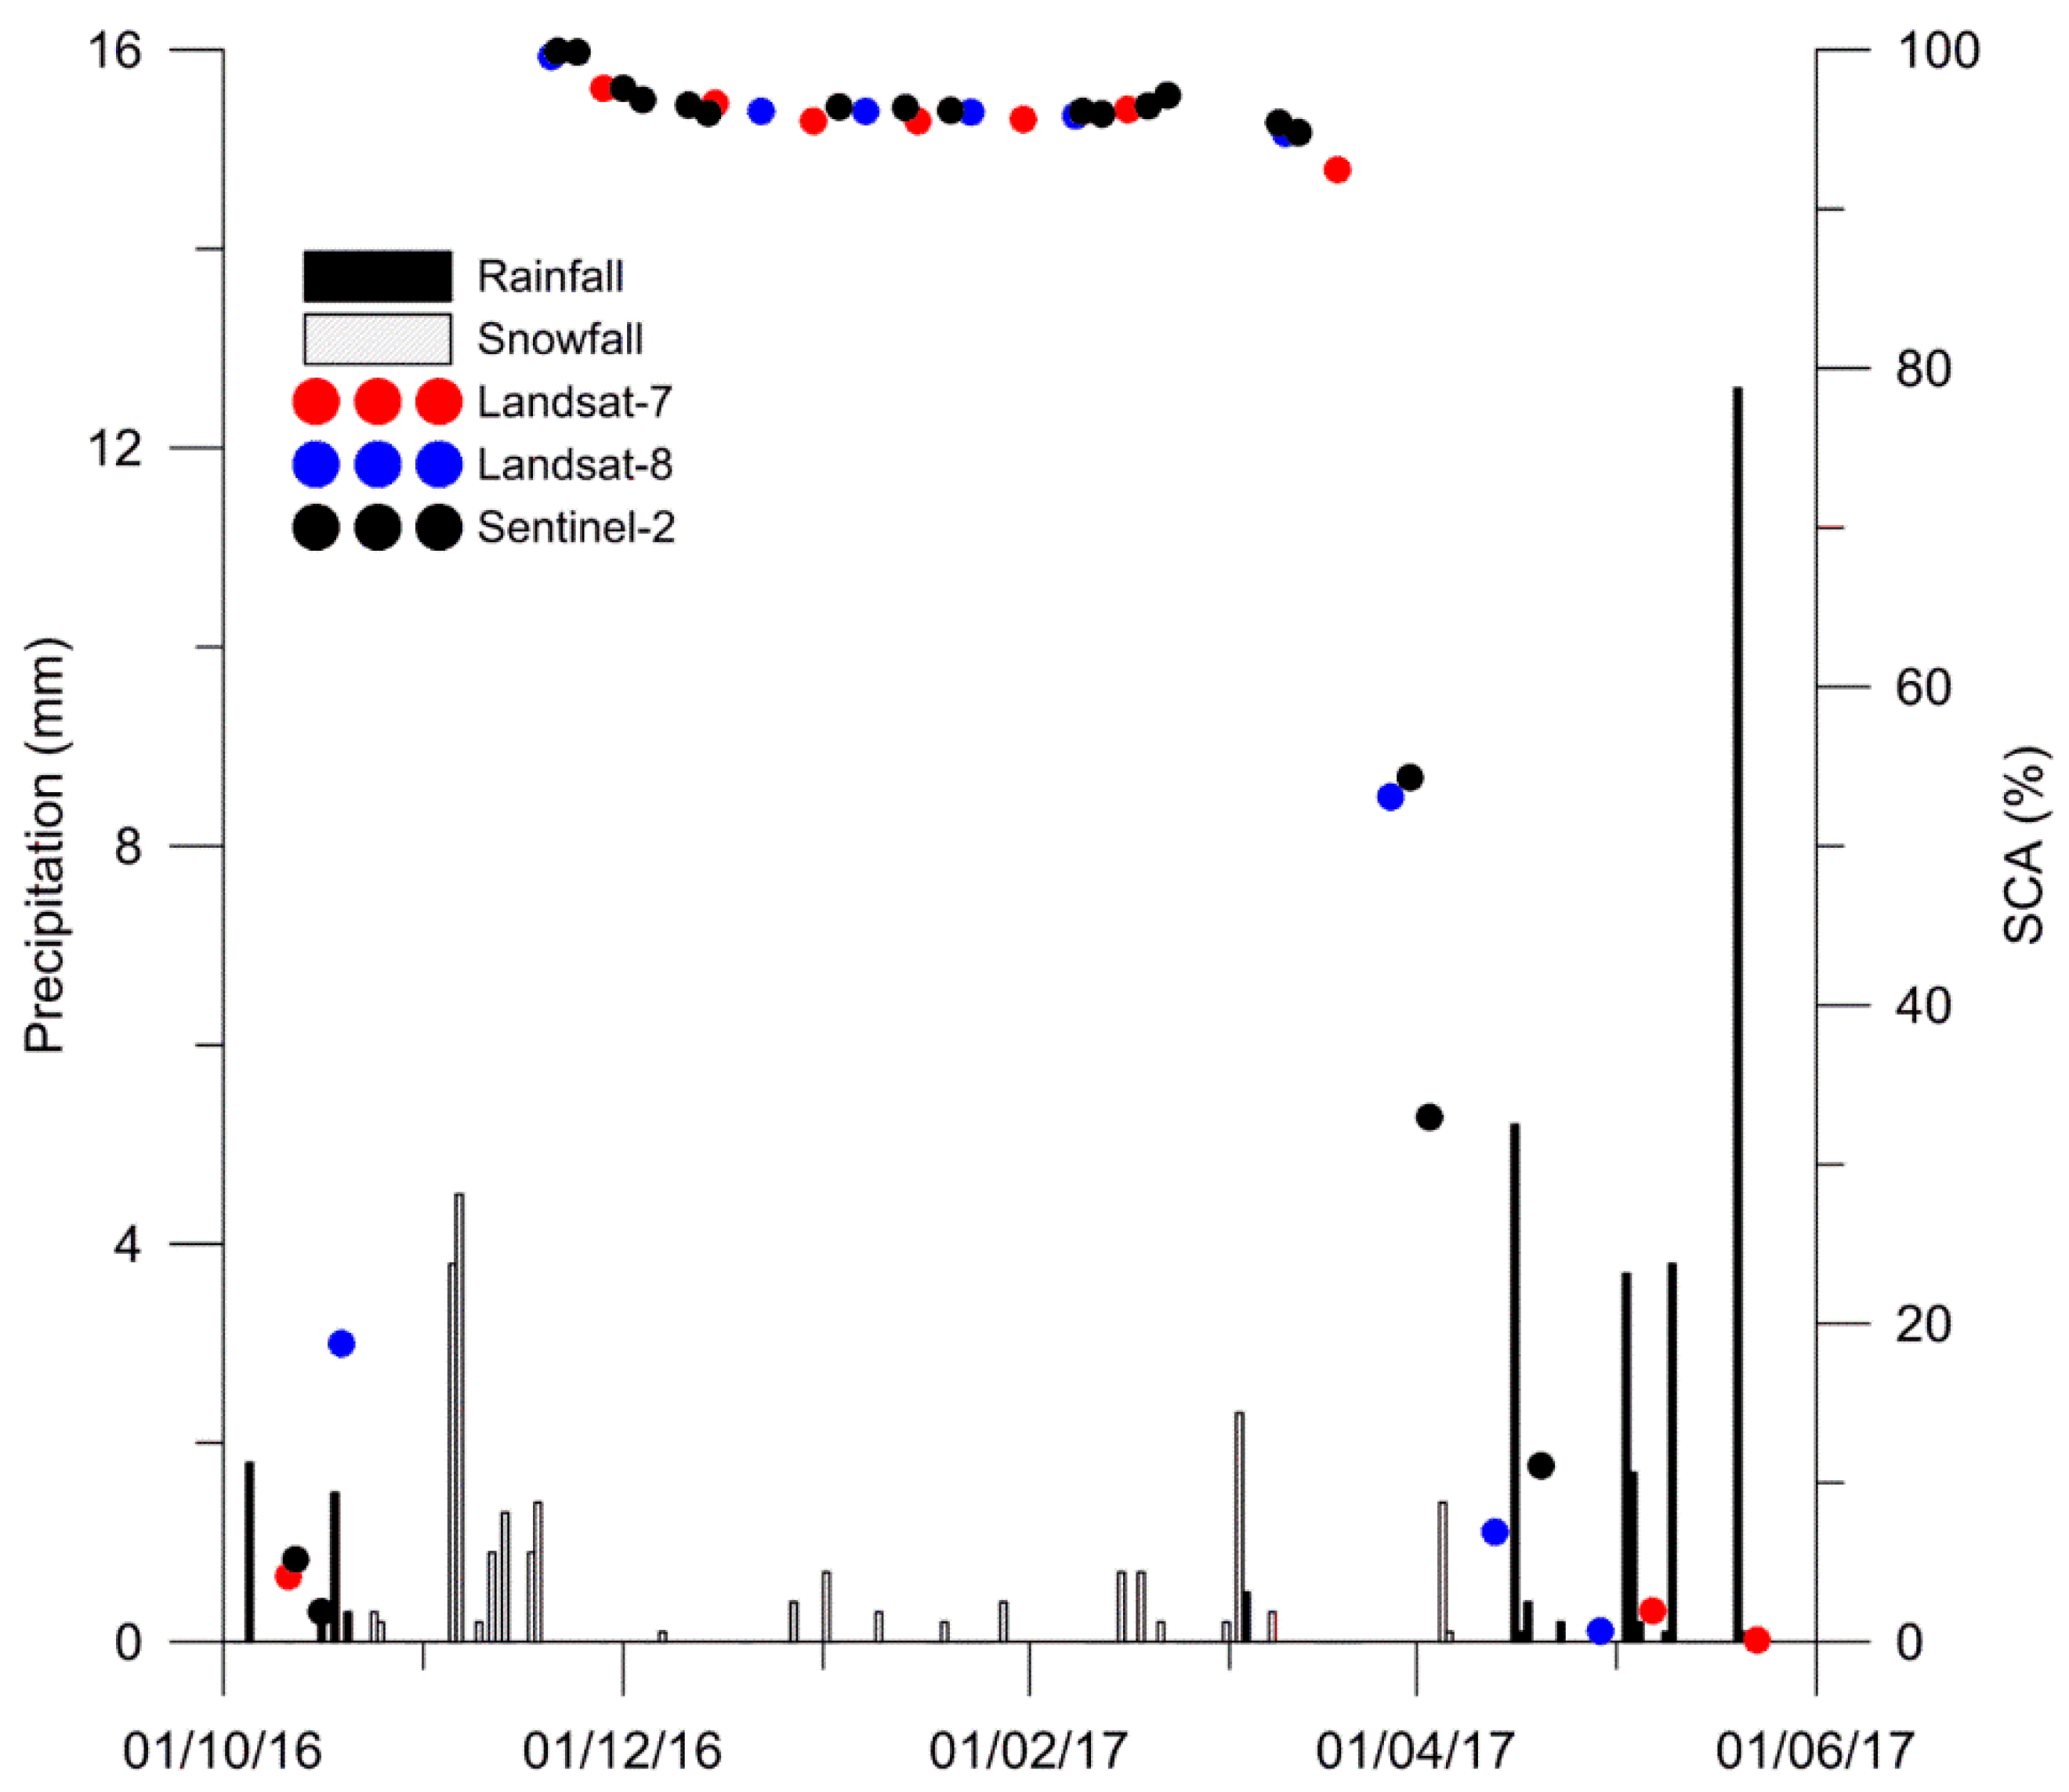
2.2. Methods
3. Results
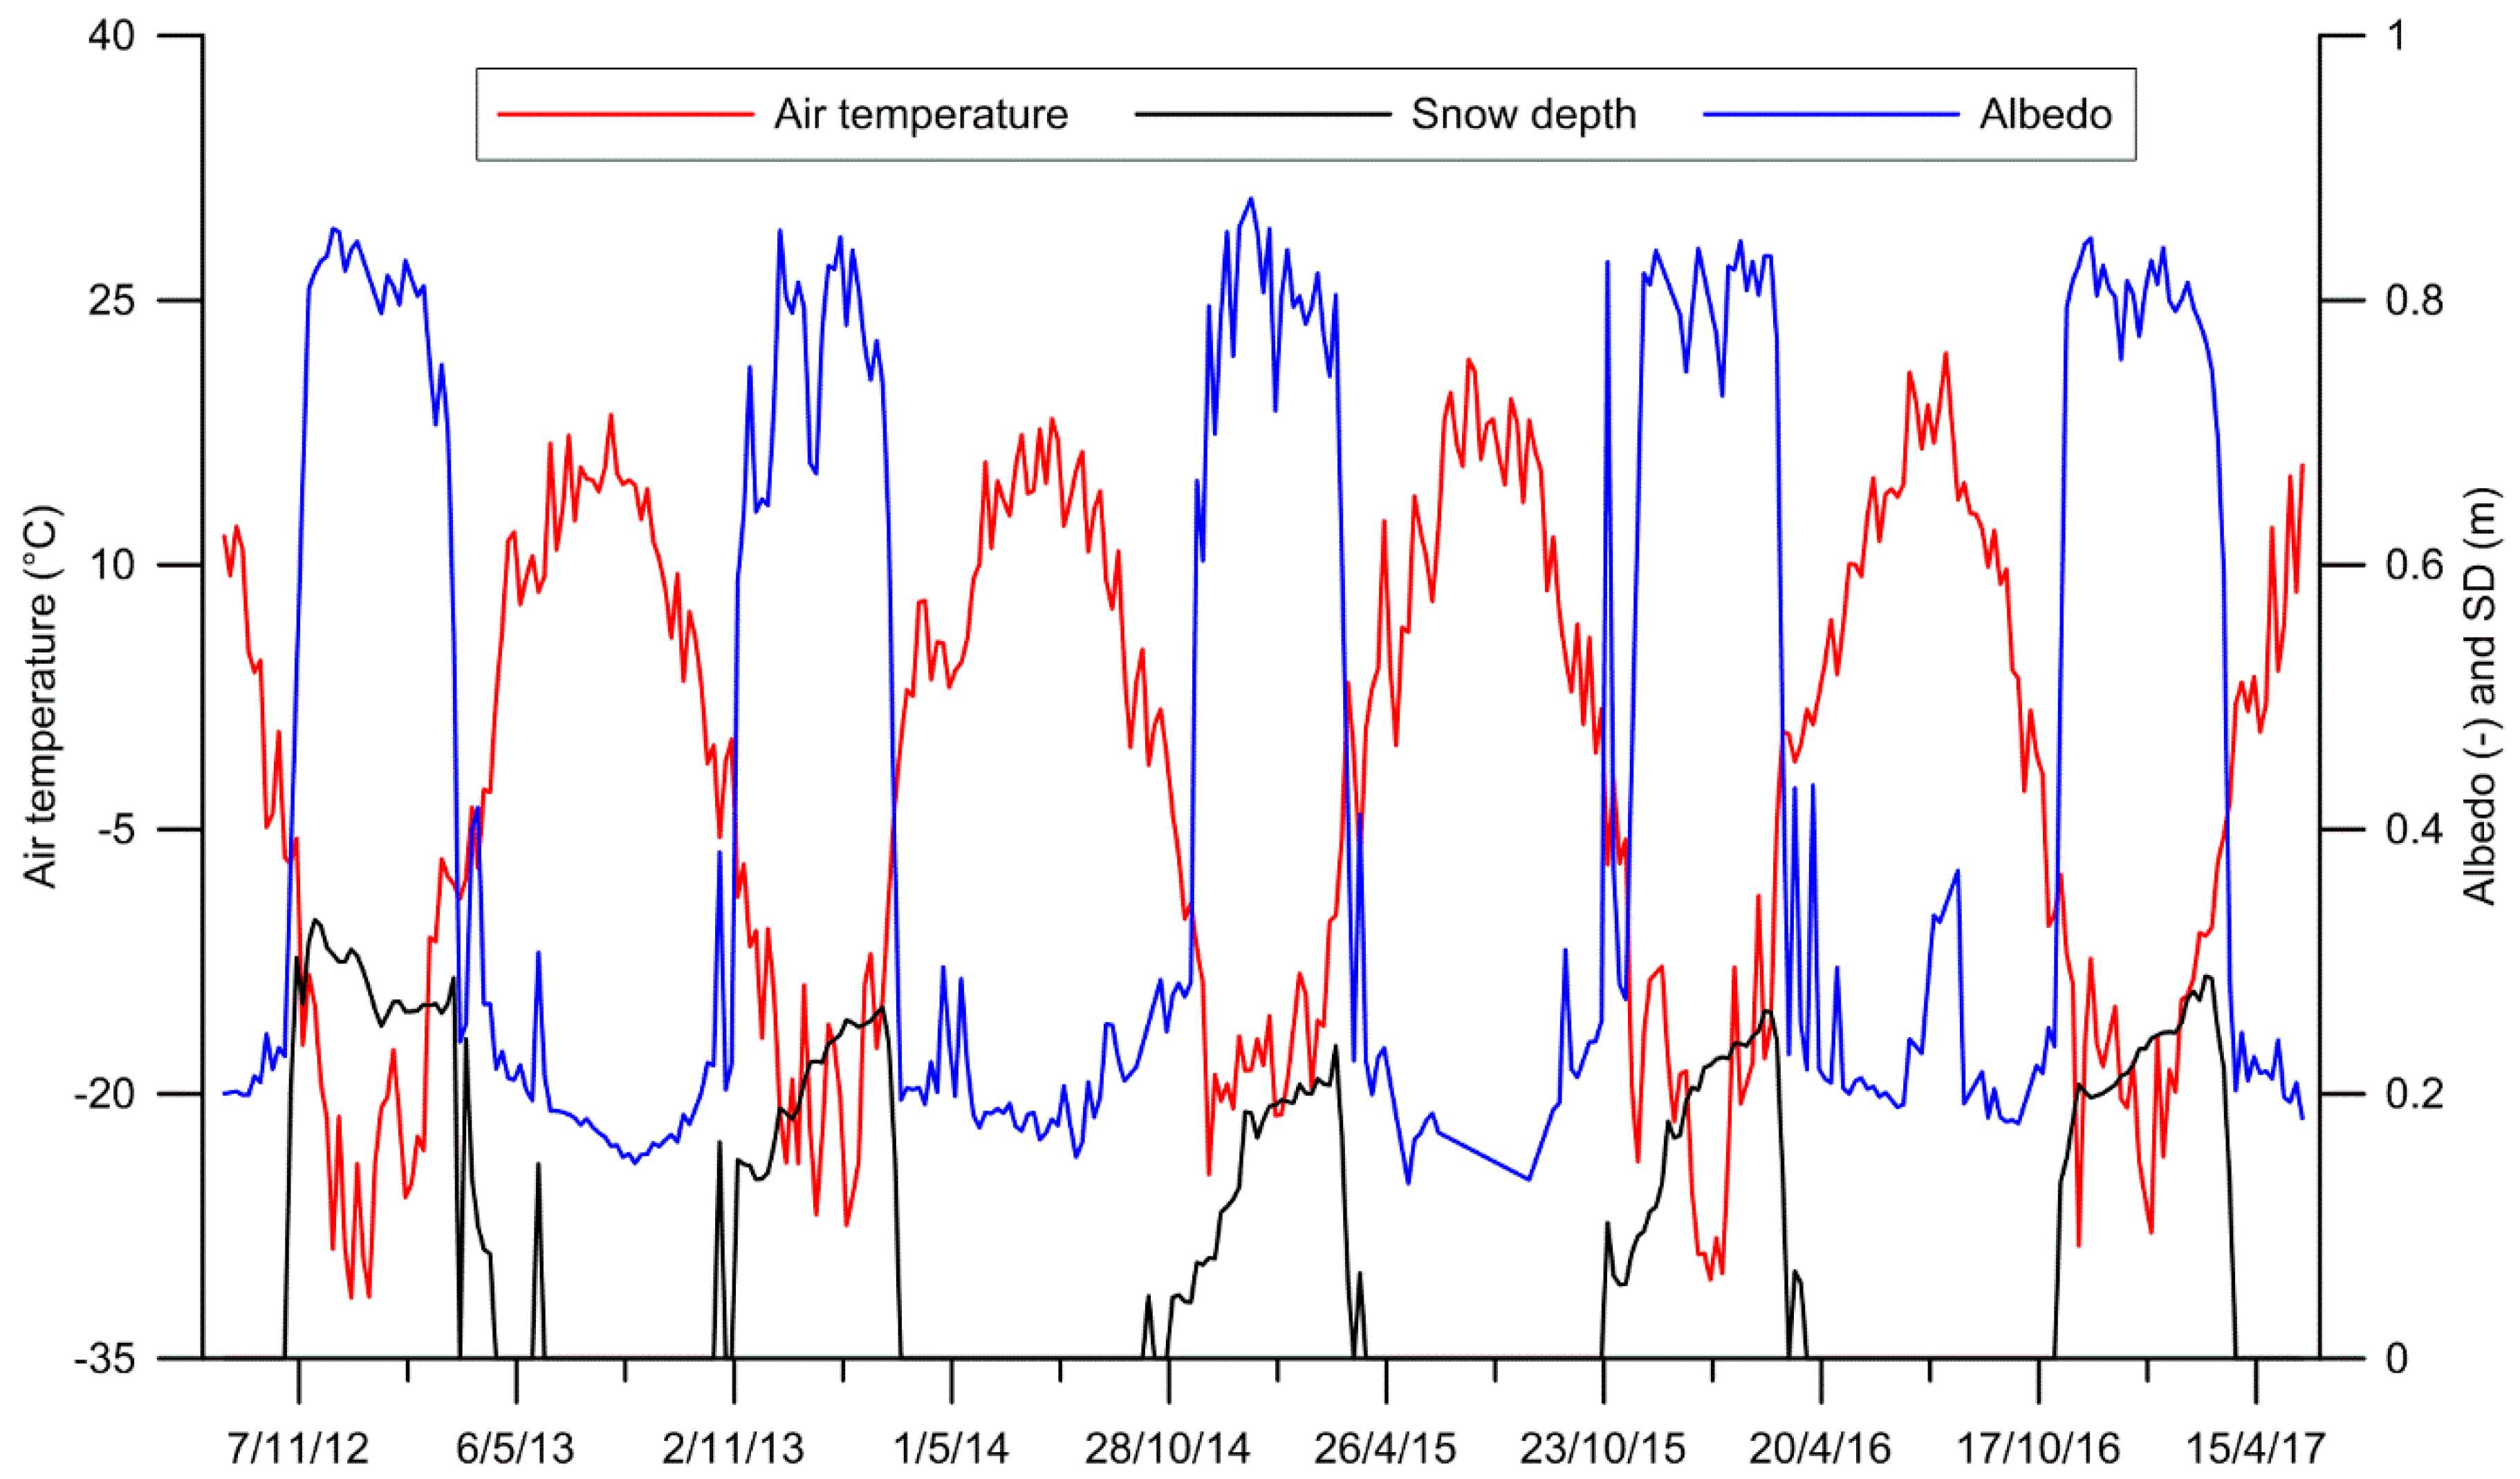
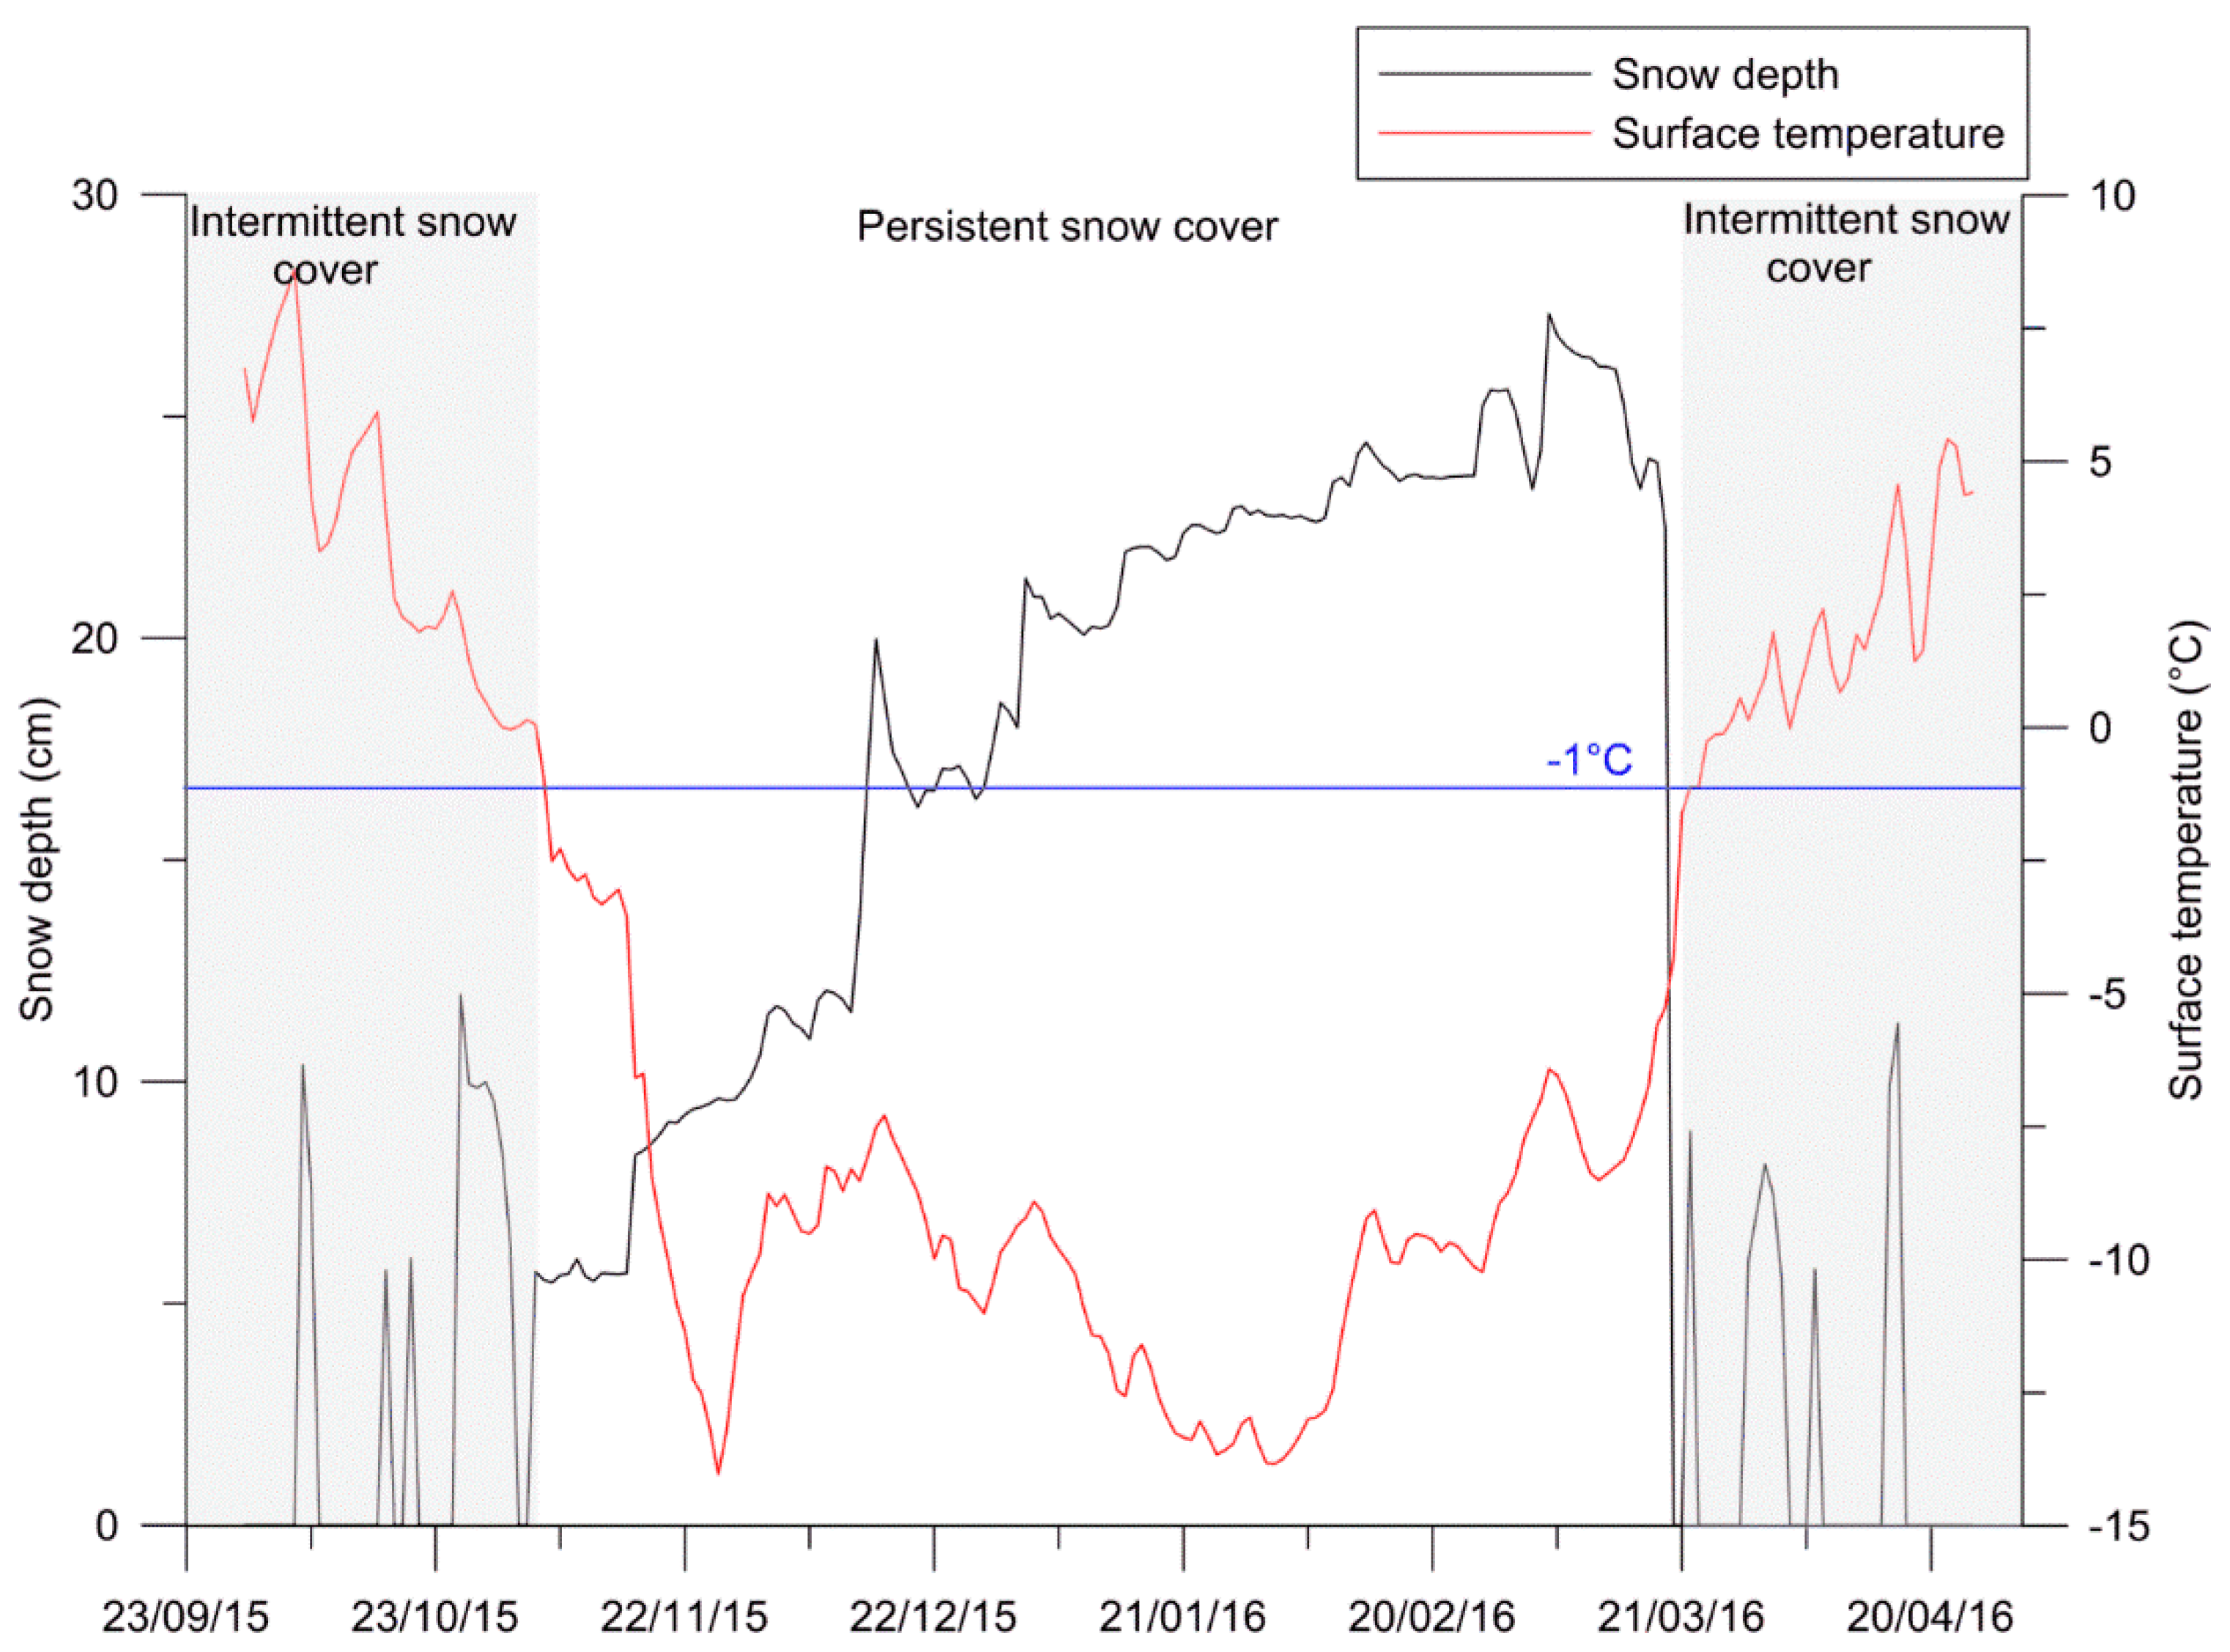
3.1. Seasonal Snow Cover from In Situ Measurements
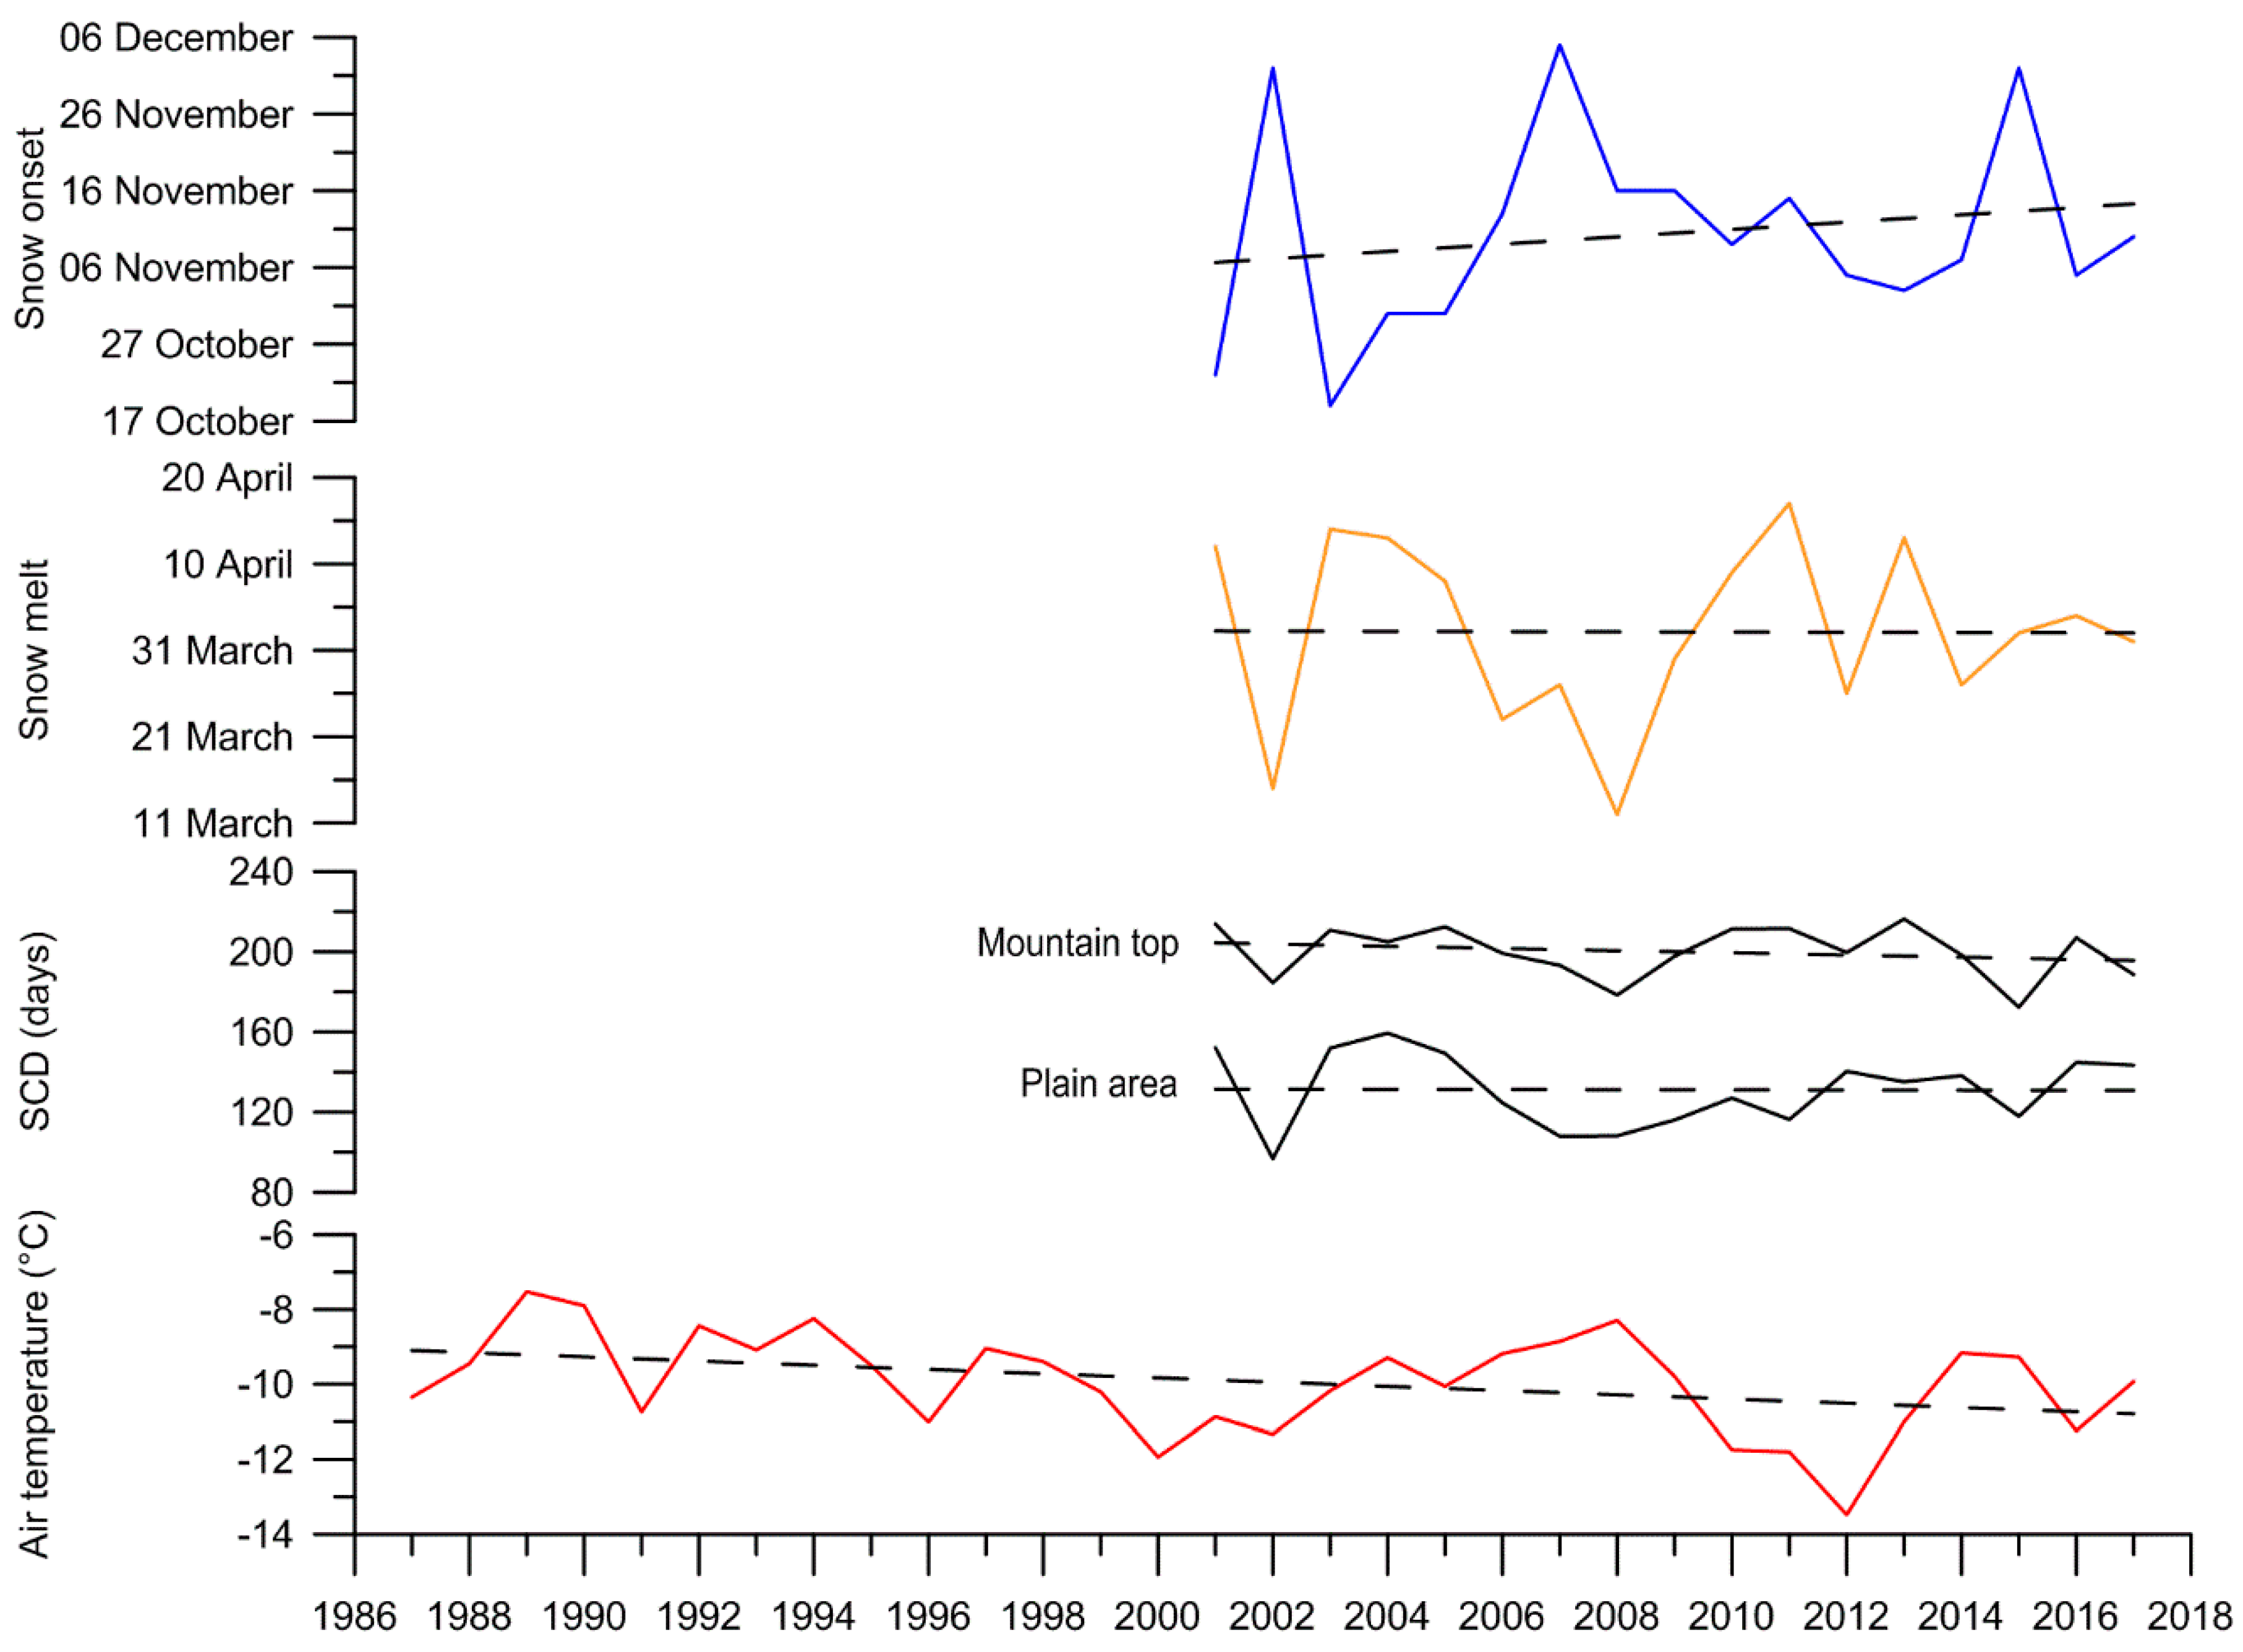
3.2. Temporal Distribution of Snow
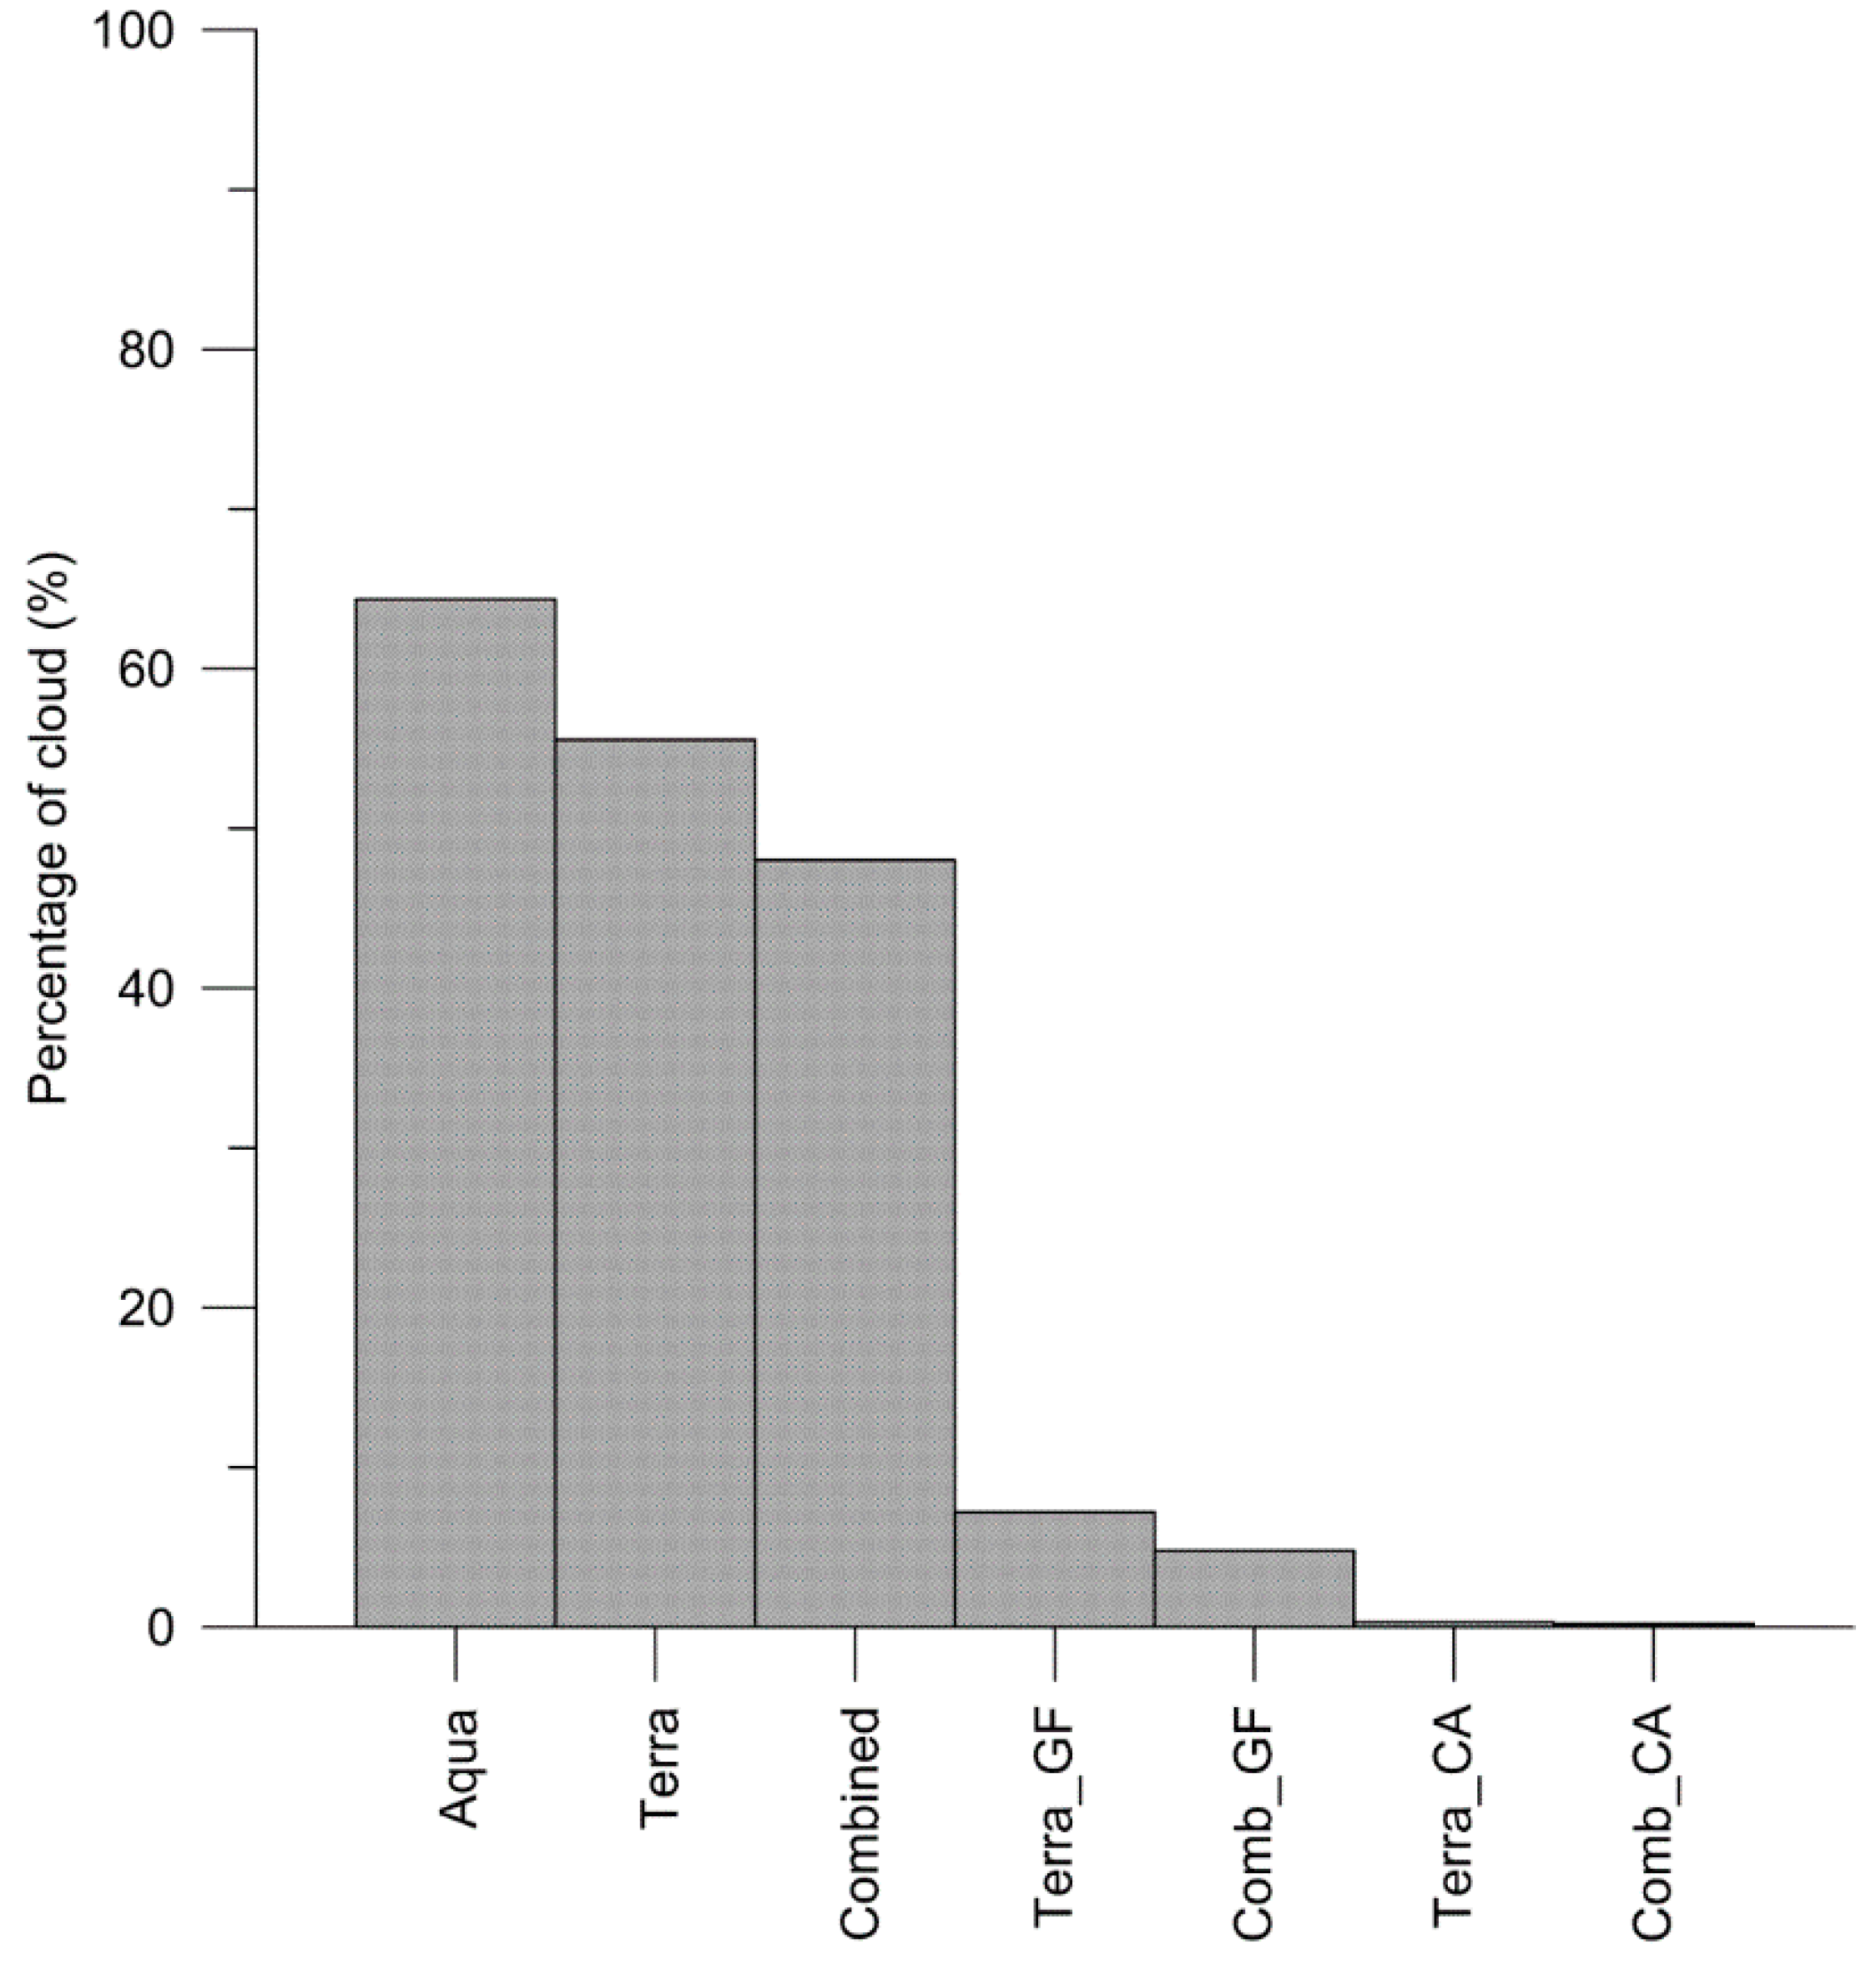
3.2.1. Cloud Reduction
3.2.2. SCD and Trend Analysis
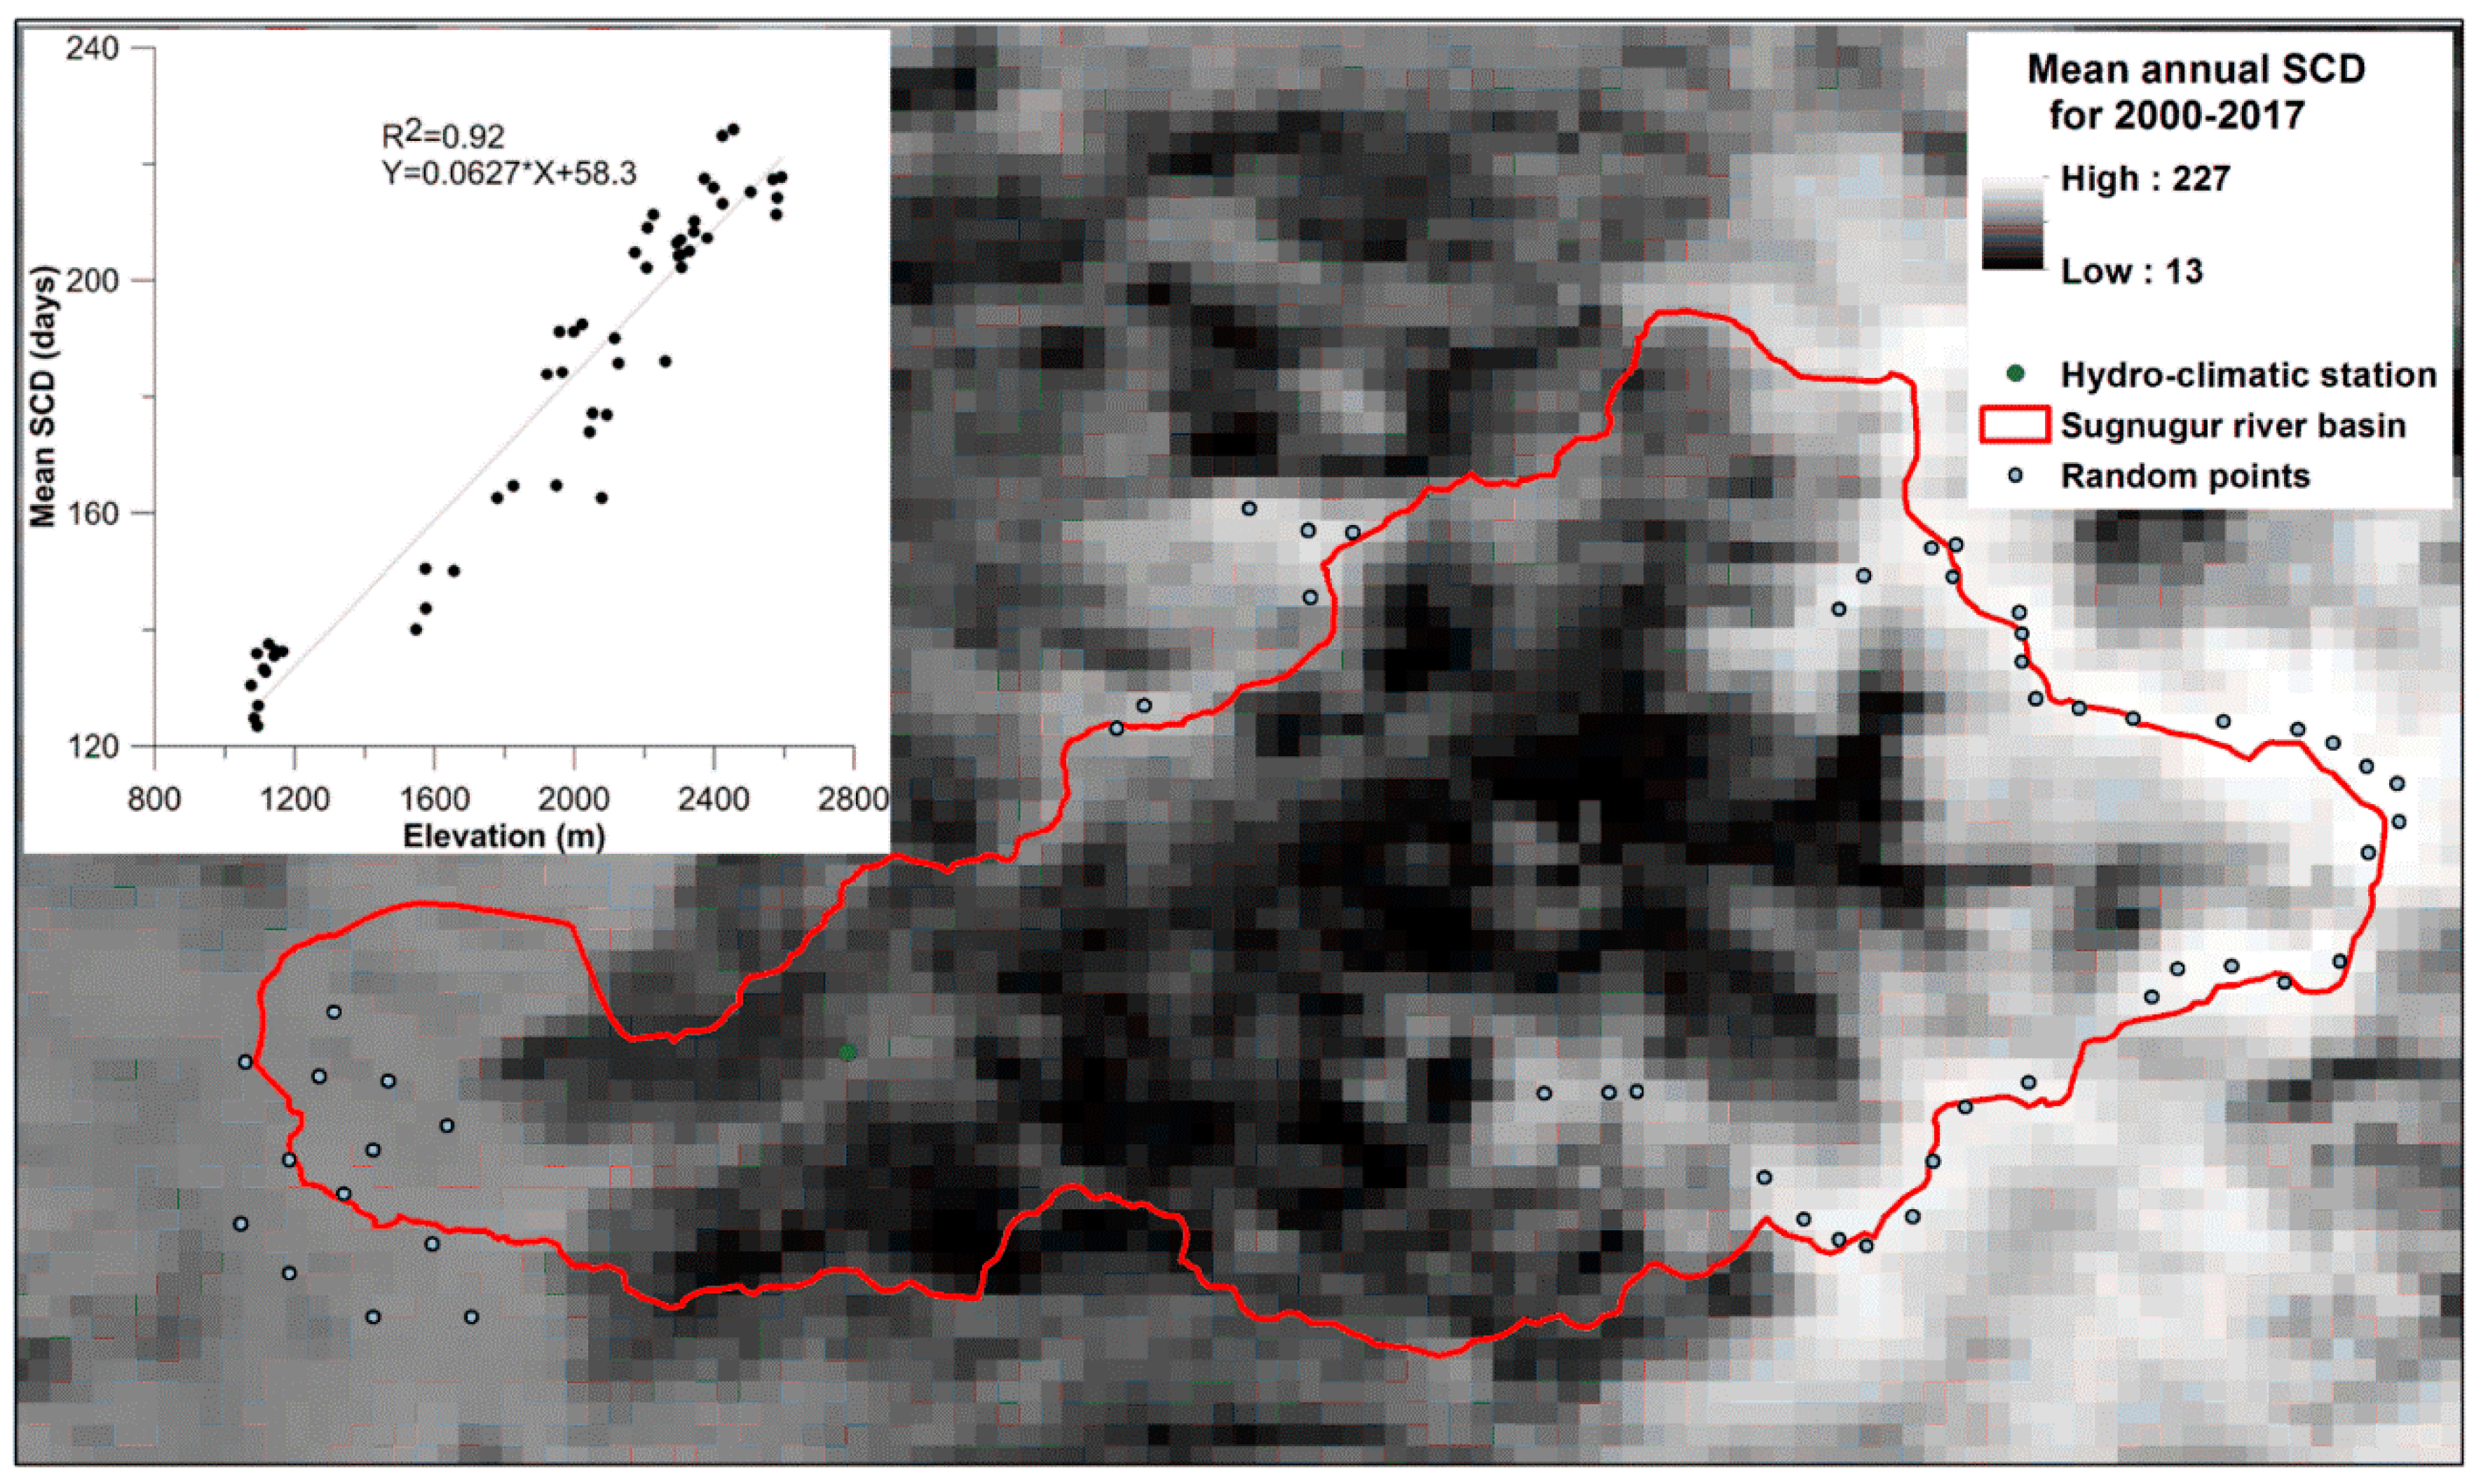
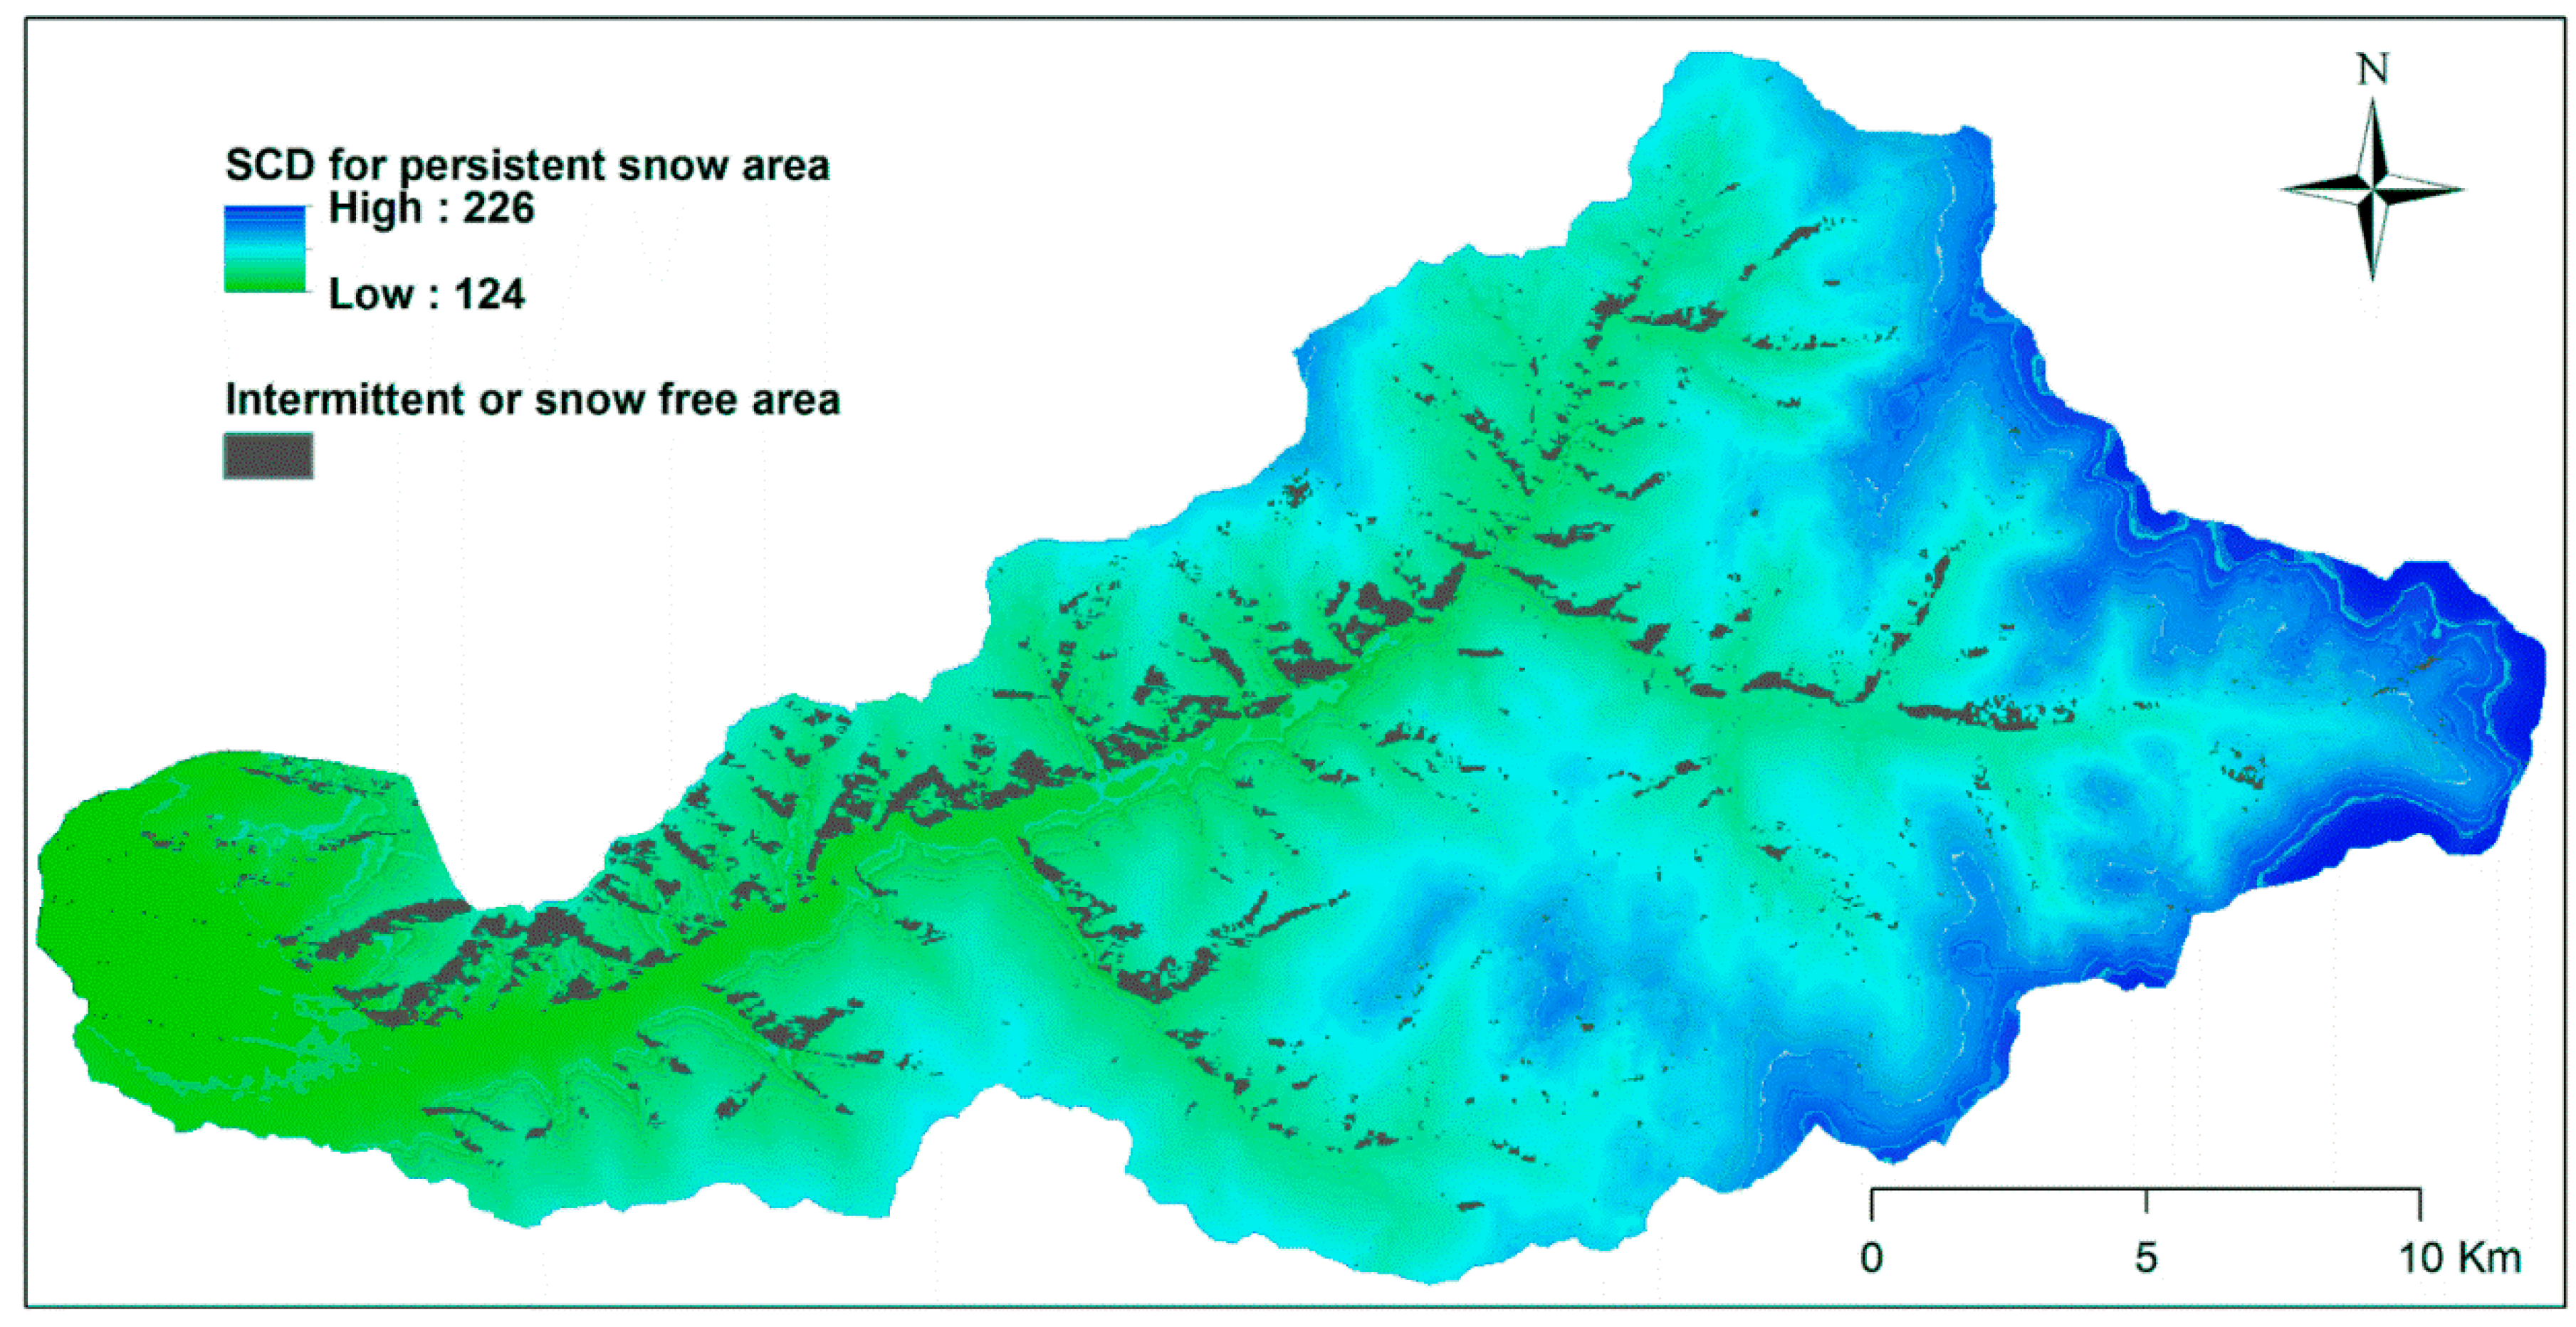
3.3. Spatial Distribution of Snow
3.4. Mapping Snow Cover
4. Discussion
5. Conclusions
Supplementary Materials
Author Contributions
Funding
Acknowledgments
Conflicts of Interest
Appendix

| Abbreviation | Explanation | Unit |
|---|---|---|
| SCD | Snow cover duration | days |
| SCD RATE | Snow cover duration rate | day/m |
| SCA | Snow cover area | % |
| SWE | Snow water equivalent | mm |
| SO | Snow onset | date |
| SM | Snow melt | date |
| SH | Siberian high | - |
| DEM | Digital elevation model | m |
| GF | Gap-filling | - |
| CA | Conditional adjustment | - |
| NDSI | Normalized difference snow index | - |
| TA | Daily average air temperature | °C |
| TS | Daily average ground surface temperature | °C |
References
- Wang, X.; Wu, C.; Wang, H.; Gonsamo, A.; Liu, Z. No evidence of widespread decline of snow cover on the Tibetan Plateau over 2000–2015. Sci. Rep. 2017, 7, 14645. [Google Scholar] [CrossRef] [PubMed] [Green Version]
- Viviroli, D.; Dürr, H.H.; Messerli, B.; Meybeck, M.; Weingartner, R. Mountains of the world, water towers for humanity: Typology, mapping, and global significance. Water Resour. Res. 2007, 43, 1–13. [Google Scholar] [CrossRef]
- Chevallier, P.; Pouyaud, B.; Mojaïsky, M.; Bolgov, M.; Olsson, O.; Bauer, M.; Froebrich, J. River flow regime and snow cover of the Pamir Alay (Central Asia) in a changing climate. Hydrol. Sci. J. 2014, 59, 1491–1506. [Google Scholar] [CrossRef] [Green Version]
- Kim, Y.; Kimball, J.S.; Robinson, D.A.; Derksen, C. New satellite climate data records indicate strong coupling between recent frozen season changes and snow cover over high northern latitudes. Environ. Res. Lett. 2015, 10, 084004. [Google Scholar] [CrossRef] [Green Version]
- Callaghan, T.V.; Johansson, M.; Brown, R.D.; Groisman, P.Y.; Labba, N.; Radionov, V.; Barry, R.G.; Bulygina, O.N.; Essery, R.L.H.; Frolov, D.M.; et al. The Changing Face of Arctic Snow Cover: A Synthesis of Observed and Projected Changes. AMBIO 2011, 40, 17–31. [Google Scholar] [CrossRef] [Green Version]
- Bednorz, E.; Wibig, J. Circulation patterns governing October snowfalls in southern Siberia. Theor. Appl. Climatol. 2017, 128, 12–139. [Google Scholar] [CrossRef]
- Zhou, H.; Aizen, E.; Aizen, V. Seasonal snow cover regime and historical change in Central Asia from 1986 to 2008. Glob. Planet. Chang. 2017, 148, 192–216. [Google Scholar] [CrossRef]
- Cohen, J.; Foster, J.; Barlow, M.; Saito, K.; Jones, J. Winter 2009–2010: A case study of an extreme Arctic Oscillation event. Geophys. Res. Lett. 2010, 37. [Google Scholar] [CrossRef]
- Cohen, J.; Screen, J.A.; Furtado, J.C.; Barlow, M.; Whittleston, D.; Coumou, D.; Francis, J.; Dethloff, K.; Entekhabi, D.; Overland, J.; et al. Recent Arctic amplification and extreme mid-latitude weather. Nat. Geosci. 2014, 7, 627–637. [Google Scholar] [CrossRef] [Green Version]
- Panagiotopoulos, F.; Shahgedanova, M. Observed Trends and Teleconnections of the Siberian High: A Recently Declining Center of Action. J. Clim. 2005, 18, 1411–1422. [Google Scholar] [CrossRef]
- Lindsay, C.; Zhu, J.; Miller, A.E.; Kirchner, P.; Wilson, T.L. Deriving Snow Cover Metrics for Alaska from MODIS. Remote Sens. 2015, 7, 12961–12985. [Google Scholar] [CrossRef] [Green Version]
- Notarnicola, C.; Duguay, M.; Moelg, N.; Schellenberger, T.; Tetzlaff, A.; Monsorno, R.; Costa, A.; Steurer, C.; Zebisch, M. Snow Cover Maps from MODIS Images at 250 m Resolution. Remote Sens. 2013, 5, 110–126. [Google Scholar] [CrossRef]
- Rittger, K.; Painter, T.H.; Dozier, J. Advances in Water Resources Assessment of methods for mapping snow cover from MODIS. Adv. Water Resour. 2013, 51, 367–380. [Google Scholar] [CrossRef]
- Walters, R.D.; Watson, K.A.; Marshall, H.; Mcnamara, J.P.; Flores, A.N. A physiographic approach to downscaling fractional snow cover data in mountainous regions. Remote Sens. Environ. 2014, 152, 413–425. [Google Scholar] [CrossRef]
- Gafurov, A.; Vorogushyn, S.; Farinotti, D.; Duethmann, D.; Merkushkin, A.; Merz, B. Snow-cover reconstruction methodology for mountainous regions based on historic in situ observations and recent remote sensing data. Cryosphere 2015, 9, 451–463. [Google Scholar] [CrossRef] [Green Version]
- Gurung, D.R.; Maharjan, S.B.; Shrestha, A.B.; Shrestha, M.S.; Bajracharya, S.R.; Murthy, M.S.R. Climate and topographic controls on snow cover dynamics in the Hindu Kush Himalaya. Int. J. Climatol. 2017, 37, 3873–3882. [Google Scholar] [CrossRef] [Green Version]
- Liu, J.P.; Zhang, W.C. Long term spatio-temporal analyses of snow cover in Central Asia using ERA-Interim and MODIS products. IOP Conf. Ser. Earth Environ. Sci. 2017, 57, 012033. [Google Scholar] [CrossRef] [Green Version]
- Manuel, G. An Operational Snow Cover Product from Sentinel-2 and Landsat-8 Data for Mountain Regions. La Montagne, Territoire D’Innovation; Grenoble, France, January 2017. Available online: https://hal.archives-ouvertes.fr/halshs-01486820 (accessed on 9 January 2018).
- Dedieu, J.; Carlson, B.Z.; Bigot, S.; Sirguey, P.; Vionnet, V.; Choler, P. On the Importance of High-Resolution Time Series of Optical Imagery for Quantifying the Effects of Snow Cover Duration on Alpine Plant Habitat. Remote Sens. 2016, 8, 481. [Google Scholar] [CrossRef]
- Selkowitz, D.; Rittger, K. Developing a 30 m daily snow covered area time series for the Sierra Nevada Alpine using Landsat and MODIS data. In Proceedings of the AGU Fall Meeting, San Francisco, CA, USA, 3–7 December 2012. [Google Scholar]
- Li, H.Y.; He, Y.Q.; Hao, X.H.; Che, T.; Wang, J.; Huang, X.D. Downscaling Snow Cover Fraction Data in Mountainous Regions Based on Simulated Inhomogeneous Snow Ablation. Remote Sens. 2015, 7, 8995–9019. [Google Scholar] [CrossRef] [Green Version]
- Cristea, N.C.; Breckheimer, I.; Raleigh, M.S.; HilleRisLambers, J.; Lundquist, J.D. An evaluation of terrain-based downscaling of fractional snow covered area data sets based on LiDAR-derived snow data and orthoimagery. Water Resour. Res. 2017, 53, 6802–6820. [Google Scholar] [CrossRef]
- Kostadinov, T.S.; Lookingbill, T.R. Remote Sensing of Environment Snow cover variability in a forest ecotone of the Oregon Cascades via MODIS Terra products. Remote Sens. Environ. 2015, 164, 155–169. [Google Scholar] [CrossRef]
- Kopp, B.J.; Minderlein, S.; Menzel, L. Soil Moisture Dynamics in a Mountainous Headwater Area in the Discontinuous Permafrost Zone of northern Mongolia. Arct. Antract. Alp. Res. 2014, 46, 459–470. [Google Scholar] [CrossRef] [Green Version]
- Kopp, B.J.; Lange, J.; Menzel, L. Effects of wildfire on runoff generating processes in northern Mongolia. Reg. Environ. Chang. 2016, 17, 1951–1963. [Google Scholar] [CrossRef]
- Zhang, Y.; Mamoru, I.; Tetsou, O.; Dambaravja, O. Role of snow playing in water cycle in semi- arid region of Mongolia. In Proceedings of the 3rd International Workshop on Terrestrial Change in Mongolia, Tsukuba, Japan, 9–10 November 2004; pp. 23–24. [Google Scholar]
- Wimmer, F.; Schlaffer, S.; aus der Beek, T.; Menzel, L. Distributed modelling of climate change impacts on snow sublimation in Northern Mongolia. Adv. Geosci. 2009, 21, 117–124. [Google Scholar] [CrossRef] [Green Version]
- Parajka, J.; Holko, L.; Kostka, Z.; Blöschl, G. MODIS snow cover mapping accuracy in a small mountain catchment-comparison between open and forest sites. Hydrol. Earth Syst. Sci. 2012, 16, 2365–2377. [Google Scholar] [CrossRef]
- Klein, A.G.; Barnett, A.C. Validation of daily MODIS snow cover maps of the Upper Rio Grande River Basin for the 2000–2001 snow year. Remote Sens. Environ. 2003, 86, 162–176. [Google Scholar] [CrossRef]
- Tekeli, A.E.; Akyu, Z.; Arda, A.S.; Sensoy, A.; Sorman, Ü. Using MODIS snow cover maps in modeling snowmelt runoff process in the eastern part of Turkey. Remote Sens. Environ. 2005, 97, 216–230. [Google Scholar] [CrossRef]
- Parajka, J.; Blöschl, G. Validation of MODIS snow cover images over Austria. Hydrol. Earth Syst. Sci. 2006, 10, 679–689. [Google Scholar] [CrossRef] [Green Version]
- Ault, T.W.; Czajkowski, K.P.; Benko, T.; Coss, J.; Struble, J.; Spongberg, A.; Templin, M.; Gross, C. Validation of the MODIS snow product and cloud mask using student and NWS cooperative station observations in the Lower Great Lakes Region. Remote Sens. Environ. 2006, 105, 341–353. [Google Scholar] [CrossRef]
- Wang, X.; Xie, H.; Liang, T. Evaluation of MODIS snow cover and cloud mask and its application in Northern Xinjiang, China. Remote Sens. Environ. 2008, 112, 1497–1513. [Google Scholar] [CrossRef]
- Liang, T.; Zhang, X.; Xie, H.; Wu, C.; Feng, Q.; Huang, X.; Chen, Q. Remote Sensing of Environment Toward improved daily snow cover mapping with advanced combination of MODIS and AMSR-E measurements. Remote Sens. Environ. 2008, 112, 3750–3761. [Google Scholar] [CrossRef]
- Huang, X.; Liang, T.; Zhang, X.; Guo, Z. Validation of MODIS snow cover products using Landsat and ground measurements during the 2001–2005 snow seasons over northern Xinjiang, China. Int. J. Remote Sens. 2011, 32, 133–152. [Google Scholar] [CrossRef]
- Gafurov, A.; Kriegel, D.; Vorogushyn, S.; Merz, B. Evaluation of remotely sensed snow cover product in Central Asia. Hydrol. Res. 2013, 44, 506–522. [Google Scholar] [CrossRef]
- Dong, C.; Menzel, L. Improving the accuracy of MODIS 8-day snow products with in situ temperature and precipitation data. J. Hydrol. 2016, 534, 466–477. [Google Scholar] [CrossRef]
- Dong, C.; Menzel, L. Producing cloud-free MODIS snow cover products with conditional probability interpolation and meteorological data. Remote Sens. Environ. 2016, 186, 439–451. [Google Scholar] [CrossRef]
- Dong, C. Remote sensing, hydrological modeling and in situ observations in snow cover research: A review. J. Hydrol. 2018, 561, 573–583. [Google Scholar] [CrossRef]
- Hall, D.K.; Riggs, G.A. MODIS/Terra Snow Cover Daily L3 Global 500 m Grid; version 6; NASA National Snow and Ice Data Center Distributed Active Archive Center: Boulder, CO, USA, 2016.
- National Aeronautic and Space Administration (NASA) and Ministry of Economy, Trade, and Industry (METI). ASTER GDEM 2; U.S Geological Survey: Sioux Falls, South Dakota, 2011. Available online: https://earthexplorer.usgs.gov/ (accessed on 25 December 2017).
- Landsat-7, Landsat-8 and Sentinel-2 (ESA) Image Courtesy of the U.S. Geological Survey. Available online: https://earthexplorer.usgs.gov/ (accessed on 15 November 2017).
- Hall, D.K.; Riggs, G.A.; Salomonson, V.V.; Digirolamo, N.E.; Bayr, K.J. MODIS snow-cover products. Remote Sens. Environ. 2002, 83, 181–194. [Google Scholar] [CrossRef] [Green Version]
- Hall, D.K.; Riggs, G.A.; Foster, J.L.; Kumar, S.V. Development and evaluation of a cloud-gap-filled MODIS daily snow-cover product Part of the Physical Sciences and Mathematics Commons. Remote Sens. Environ. 2010, 114, 496–503. [Google Scholar] [CrossRef]
- Wang, X.; Wang, J.; Jiang, Z.; Li, H.; Hao, X. An Effective Method for Snow-Cover Mapping of Dense Coniferous Forests in the Upper Heihe River Basin Using Landsat Operational Land Imager Data. Remote Sens. 2015, 7, 17246–17257. [Google Scholar] [CrossRef] [Green Version]
- Ishikawa, M.; Iijima, Y.; Zhang, Y.; Kadota, T.; Yabuki, H.; Ohata, T.; Battogtokh, D.; Sharkhuu, N. Comparable energy balance measurements on the permafrost and immediate adjacent permafrost-free slopes at the southern boundary of Eurasian permafrost, Mongolia. In Proceedings of the Ninth International Conference on Permafrost, Fairbanks, AK, USA, 29 June–3 July 2008. [Google Scholar]
- Hüsler, F.; Jonas, T.; Riffler, M.; Musial, J.P.; Wunderle, S. A satellite-based snow cover climatology (1985–2011) for the European Alps derived from AVHRR data. Cryosphere 2014, 8, 73–90. [Google Scholar] [CrossRef] [Green Version]
- Liu, J.; Zhang, W.; Liu, T. Monitoring recent changes in snow cover in Central Asia using improved MODIS snow-cover products. J. Arid Land 2017, 9, 763–777. [Google Scholar] [CrossRef]
- Hu, Z.; Zhang, C.; Hu, Q.; Tian, H. Temperature Changes in Central Asia from 1979 to 2011 Based on Multiple Datasets. J. Clim. 2014, 1143–1167. [Google Scholar] [CrossRef]
- Dietz, A.J.; Keunzer, C.; Conrad, C. Snow-cover variability in Central Asia between 2000 and 2001 derived from improved MODIS daily snow-cover products. Int. J. Remote Sens. 2013, 34, 3879–3902. [Google Scholar] [CrossRef]
- Mandanici, E.; Bitelli, G. Preliminary Comparison of Sentinel-2 and Landsat 8 Imagery for a Combined Use. Remote Sens. 2016, 8, 1014. [Google Scholar] [CrossRef]
- Revuelto, J.; Gilaberte, M. The effect of slope aspect on the response of snowpack to climate warming in the Pyrenees. Theor. Appl. Climatol. 2014, 117, 207–219. [Google Scholar]
- Hall, D.K.; Riggs, G.A. Accuracy assessment of the MODIS snow products. Hydrol. Process. 2007, 21, 1534–1547. [Google Scholar] [CrossRef]
- Pu, Z.; Xu, L.; Salomonson, V.V. MODIS/Terra observed seasonal variations of snow cover over the Tibetan Plateau. Geophys. Res. Lett. 2007, 34, L067606. [Google Scholar] [CrossRef]
- Woo, M.; Marsh, P. Snow, frozen soils and permafrost hydrology in Canada, 1999–2002. Hydrol. Process. 2005, 19, 215–229. [Google Scholar] [CrossRef]
- Zhang, T. Influence of the seasonal snow cover on the ground thermal regime: An overview. Rev. Geophys. 2005, 43, RG4002. [Google Scholar] [CrossRef]
- Burles, K.; Boon, S. Snowmelt energy balance in a burned forest plot, Crowsnest Pass, Alberta, Canada. Hydrol. Process. 2011, 25, 3012–3029. [Google Scholar] [CrossRef]

| 2012/13 | 2013/14 | 2014/15 | 2015/16 | 2016/17 | |
|---|---|---|---|---|---|
| Intermittent | 13 | 12 | 13 | 21 | 6 |
| Persistent | 132 1/140 2 | 135 1/135 2 | 144 1/143 2 | 137 1/139 2 | 141 1/147 2 |
| Total | 145 | 146 | 157 | 156 | 147 |
| r2 | Slope | Intercept | p Value | |
|---|---|---|---|---|
| October | 0.002 | −0.0092 | −0.2744 | 0.78 |
| November | 0.053 | −0.0721 | −11.26 | 0.25 |
| December | 0.22 | −0.142 | −18.06 | 0.012 * |
| January | 0.19 | −0.14 | −20.8 | 0.023 * |
| February | 0.18 | −0.15 | −15.5 | 0.021 * |
| March | 0.0009 | −0.009 | −7.82 | 0.09 |
| April | 0.03 | 0.0435 | 1.42 | 0.32 |
© 2019 by the authors. Licensee MDPI, Basel, Switzerland. This article is an open access article distributed under the terms and conditions of the Creative Commons Attribution (CC BY) license (http://creativecommons.org/licenses/by/4.0/).
Share and Cite
Munkhjargal, M.; Groos, S.; Pan, C.G.; Yadamsuren, G.; Yamkin, J.; Menzel, L. Multi-Source Based Spatio-Temporal Distribution of Snow in a Semi-Arid Headwater Catchment of Northern Mongolia. Geosciences 2019, 9, 53. https://doi.org/10.3390/geosciences9010053
Munkhjargal M, Groos S, Pan CG, Yadamsuren G, Yamkin J, Menzel L. Multi-Source Based Spatio-Temporal Distribution of Snow in a Semi-Arid Headwater Catchment of Northern Mongolia. Geosciences. 2019; 9(1):53. https://doi.org/10.3390/geosciences9010053
Chicago/Turabian StyleMunkhjargal, Munkhdavaa, Simon Groos, Caleb G. Pan, Gansukh Yadamsuren, Jambaljav Yamkin, and Lucas Menzel. 2019. "Multi-Source Based Spatio-Temporal Distribution of Snow in a Semi-Arid Headwater Catchment of Northern Mongolia" Geosciences 9, no. 1: 53. https://doi.org/10.3390/geosciences9010053