Distribution of Rare Earth Elements in Sediments of the Marine Lake Mir (Dugi Otok, Croatia)


Rudjer Bošković Institute, Division for Marine and Environmental Research, Bijenička 54, Zagreb 10000, Croatia
*
Author to whom correspondence should be addressed.
Geosciences 2018, 8(8), 301; https://doi.org/10.3390/geosciences8080301
Submission received: 6 July 2018
/
Revised: 3 August 2018
/
Accepted: 7 August 2018
/
Published: 10 August 2018
(This article belongs to the Special Issue Geochemical Equilibrium and Processes in Seawater)
Abstract
:The Lake Mir represents a small, isolated, and shallow marine lake situated in the south-eastern part of the Dugi otok Island, in a karstic landscape of the eastern Adriatic coast. The surrounding karstic background, with occasional occurrences of red soil, characterizes the sediments in the lake as coarse grained and carbonate rich. Previous studies suggested the prevailing influence of the lake bathymetry, that is, the proportion of carbonates and grain size characteristics of the sediments, on the variability of the element composition of the lake sediments. To confirm previous assumptions and obtain a better understanding of the factors influencing sediment composition of this marine lake, the distribution of rare earth elements in sediments of the Lake Mir and the nearby Telašćica Bay, as well as surrounding soils, was investigated. In the lake sediments, the sum of rare earth elements, including Y (hereinafter referred as ΣREY), ranged from 10.6 mg kg−1 to 25.3 mg kg−1; in the Telašćica Bay sediments, ΣREY were higher compared to the lake and ranged from 56.4 mg kg−1 to 85.2 mg kg−1, while the highest ΣREY, from 83.3 mg kg−1 to 227 mg kg−1, were observed in soils surrounding the lake. Despite the difference in the levels of the rare earth elements, the REY normalized patterns and associated fractionation parameters (ΣLREE/ΣHREE, (La/Yb)N, and (Nd/Yb)N) showed similarities between the lake sediments and the surrounding soils, confirming a significant influence of local lithology on the lake composition. The results of the statistical analysis, on the other hand, suggest the contribution of both the carbonate (e.g., calcite) and non-carbonate minerals (i.e., alumosilicates and Al–Fe-hydroxides) on the total REY content in the lake sediments.
1. Introduction
Karst regions make up around 12% of the world’s surface (excluding the Antarctic, Greenland, and Iceland), and Dinaric karst, which includes the study area, is one of the biggest in Europe, extending from Slovenia to Albania. By the dissolution of a soluble layer or layers of bedrock, usually carbonate rock such as limestone or dolomite, form karst landscapes with distinctive surface features and underground drainages.
Karst marine lakes represent unique and rare marine systems, formed by intrusion of sea into such karst landscape. Special conditions are required for their formation as well as their preservation, which makes them fragile marine systems. So far, approximately 200 marine lakes have been documented worldwide [1,2,3,4,5,6,7,8,9]. Unfortunately, their uniqueness entails poor knowledge of them and understanding of ongoing geochemical processes in them, and existing literature mainly deals with biological aspects of marine lakes.
The object of this study is a small marine lake (Lake Mir), situated in the south-eastern part of the Dugi otok Island, in the central part of the eastern Adriatic coast.
Extensive work has been done recently to describe the geochemical processes that affect the distribution of trace elements and organic matter in the Lake Mir [10]. Going one step further, our investigations provide information on the distribution of rare earth elements, including Y (REY), in this unique marine system. Therefore, the objectives of this study were as follows: (1) to assess the levels of REY in surface sediments of the Lake Mir and Telašćica Bay, and surrounding soils; (2) to get an overview of spatial variations in REY abundances and fractionation patterns; (3) to determine the influence of surrounding geological setting on the distribution of REY in the lake sediments; and 4) to determine the major factors controlling the levels of these elements in the lake sediments.
Present and Future REY Trends in Water Systems
In soils and sediments, levels of REYs can be influenced not only by the parent material and history, and the weathering state of the soil, contents of organic matter, and present clay minerals [11,12], but also by diverse anthropogenic activities [13,14,15].
A growing number of current or emerging alternative energy technologies (e.g., electric and hybrid vehicles, energy-efficient lighting, wind power) and digital equipment (e.g., flat panel displays, disk drives, digital cameras) contain REY-bearing components such as glass, magnets, metal alloys, catalysts, and phosphors [16,17]. The latter are the cause of increasing trends in the annual demand for REYs, leading to the increasing exploitation of rare earth minerals [16,18]. Consequently, increasingly more REYs enter the soils and water systems, mainly through microelement fertilizers and mine tailings, and subsequently accumulate in soils and sediments, bioaccumulate in biota [19,20], and enter the food chain, causing serious environmental problems [21].
In order to successfully identify sources that can influence the increase of REY concentration in water systems, it is necessary to know the processes and mechanisms that determine their distribution in the environment. This study provides an insight into the influence of local soils on the distribution of REY in sediments of the nearby water body and suggests the possibility of differentiation between external influence and substrate, which is the main premise when determining the external source of the REY in the environment. In addition, it provides background concentrations for the unique environment of marine lakes situated in the karstic environment.
2. Materials and Methods
2.1. Study Area
Lake Mir is a small (0.2 km2), isolated, and shallow (with mean depth of 3.3 m, and maximal depth of 7.7 m) marine lake situated in the south-eastern part of the Dugi otok Island, in the central part of the eastern Adriatic coast (43°53′12″ N, 15°10′ E); in a narrow area between the Telašćica Bay and the open sea (Figure 1a,b).
The eastern Adriatic coast belongs to the Dinarides, that is, Dinaric Alps, which span for about 700 km, merging in the north-west with the Southern Alps and in the south-east with the Hellenides [22]. The Dinarides are dominantly built of Mesozoic carbonates and are considered as karst locus tipicus [22,23]. As part of the Adriatic, the Dugi otok Island is also entirely built of carbonate rocks, limestones, and dolomites, displaying typical karstic morphological features [23].
Because of the intense tectonic dynamics in the Dinaridic region, the rocks are karstified to a high extent. The existing karstified forms along the Adriatic coast have been partly flooded during the last transgression in the late Pleistocene–Holocene [23,24,25]. Among the many karstic features of the Dinaridic region formed as a result of the sea level rise are also marine lakes, including the Lake Mir. Namely, marine Lake Mir formed as a result of submersion of karst uvala, that is, closed karst depression.
Furthermore, the lake is separated from the open sea by the 90-m thick karstified bedrock barrier, through which free circulation of seawater is allowed [23].
The lake exhibits small water level changes throughout the year. Only in the south-eastern part of the lake, the sea tends to spill over into the lake during storm events. The shores of the lake are mostly low and rocky, while the lake bottom is rocky in shallow parts and covered with fine-grained sediment in the deeper sections. The deepest regions are covered with pellet mud, and during phytoplankton blooms these sediments are overlaid with aggregates. In general, lake sediments contain relatively high amounts of organic carbon (from 3.2% to 8.9%), much higher compared with the nearby Telašćica Bay (0.4%), indicating intensive biological production, which takes place in the lake [10].
Basic physico-chemical parameters define the water body of the lake as well mixed and non-stratified with high temperature amplitudes (8–26 °C) and variations in salinity (38–40) [10]. Periodic development of anoxic conditions in the lake appeared sporadically [10].
The surrounding soils mainly consist of red soil (terra rossa). Namely, weathering of carbonate bedrock resulted in sporadic occurrences of terra rossa, a residual soil generally formed over the limestone bedrock/substrate in the Mediterranean climate conditions [26]. Their chemical composition [10] corresponds to the composition of other soils from the Croatian karst regions [27].
The karstic background, with occasional occurrences of red soil, characterize deposited sediments as coarse grained and carbonate rich, whose elemental composition is affected by the bathymetry of the basin [10]. A high proportion of organic matter (up to 9%) and its well preservation within the sediment reflect the lake’s isolated geography and limited communication with the open sea, pointing to lesser input of nutrients from wet deposition and surrounding soil [10].
2.2. Sampling and Sample Preparation
Sampling locations include Lake Mir and Telašćica Bay (Figure 1c). Surface sediment samples were collected at a total of 40 locations, 35 in the Lake Mir and 5 in the Telašćica Bay, while soil samples were collected at 7 sites. Sediments were sampled by scuba diving by grab corer (collecting upper 10–15 cm of sediment), while soil samples were collected from the surface around the lake. Sediment and soil samples were lyophilized, homogenized using an agate mill, and stored until digestion. Characteristics of the sampled sediments with respect to their grain size distribution, total organic carbon (TOC), and carbonate content (CaCO3) are described in detail elsewhere [10]. Values of mentioned parameters, previously reported by Mlakar et al. [10], are given in Appendix A (Table A1).
2.3. Rare Earth Element Analysis
Multi-elemental analysis of total digests was performed in Bureau Veritas Commodities (Canada) using a Perkin Elmer SCIEX ELAN 6100 ICP-MS (Inductively Coupled Plasma Mass Spectrometry) instrument. The following reference materials were used: USGS GXR-1, GXR-2, GXR-4, and GXR-6. Good agreement between the analysed and certified concentrations within their analytical uncertainties for all elements was obtained (±10%). All sediment and soil samples were analyzed for total concentration of 15 elements (Ce, Dy, Er, Eu, Gd, Ho, La, Lu, Nd, Pr, Sm, Tb, Tm, Yb, and Y).
2.4. REY Ratios and Enrichment
For the purpose of this study, the rare earth elements, including Y, were divided into two conventionally termed subgroups; light (LREE, from La to Gd) and heavy rare earth elements (HREE, from Tb to Lu, including Y).
In order to compare REY concentrations in different samples, measured element concentrations were normalized to the estimated average composition of the North American Shale Composite (NASC) [28]. This eliminates the characteristic “zigzag” REY distribution patterns and enables us to identify any individual REY anomalies in various geologic and environmental materials [29].
The decoupling of anomalous behavior of Ce and Eu from the other REY in the NASC-normalized distribution patterns (expressed as CeN/CeN* and EuN/EuN*, respectively) was calculated using the following formulae [12]:
The (La/Yb)N and (Nd/Yb)N ratios were used to describe enrichment of certain parts of the normalized patterns [15,29].
CeN/CeN* = CeN/(LaN × PrN)0.5
EuN/EuN* = EuN/(SmN × GdN)0.5
2.5. Statistical Analysis
Differences between groups regarding the level of REY were tested by analysis of variance (ANOVA) on ranks and subsequent pairwise comparison by Dunn’s method (SigmaPlot 11.0, Systat Software Inc., San Jose, CA, USA), with level of significance set at p < 0.05. The multivariate principal component analysis (PCA; STATISTICA 8.0, StatSoft Inc., Palo Alto, CA, USA) was performed on the data matrix consisting of the ΣREY and previously reported element concentrations in the Lake Mir sediments [10] (Appendix A, Table A2).
3. Results
Basic descriptive statistical parameters for distribution of REY concentrations in the surface sediments and soils are listed in Table 1. The results of measurement of rare earth elements (Ce, Dy, Er, Eu, Gd, Ho, La, Lu, Nd, Pr, Sm, Tb, Tm, and Yb) and Y (REY) are presented in Appendix A (Table A3 and Table A4), Related calculated parameters, the europium anomaly (EuN/EuN*) and the cerium anomaly (CeN/CeN*), (La/Nd)N, and (La/Yb)N are listed in Table 2.
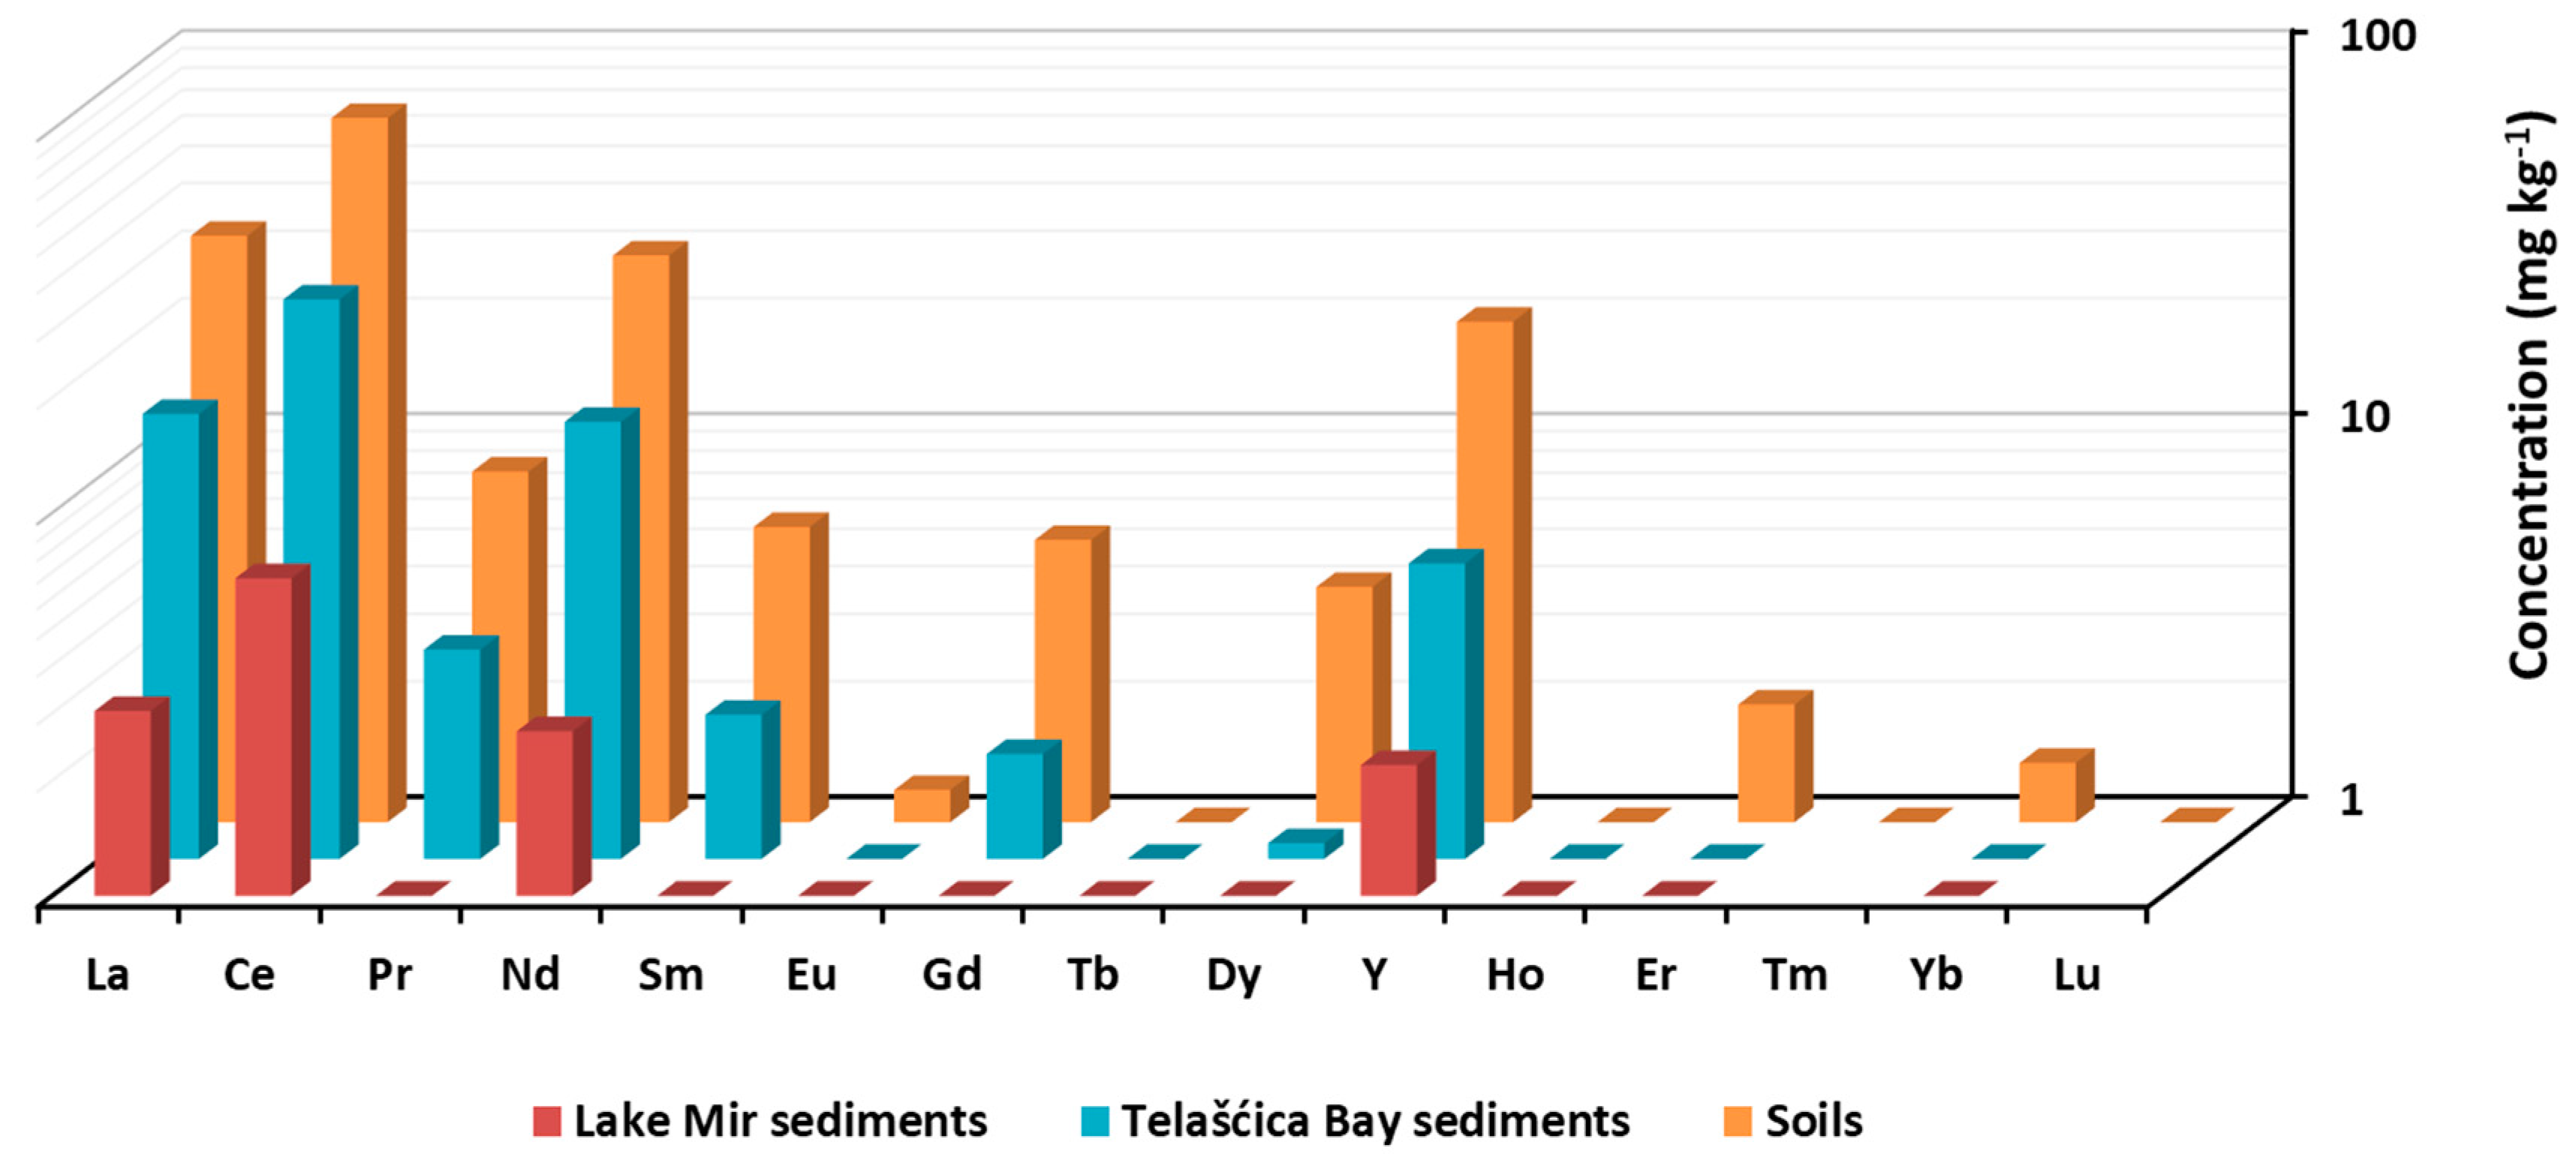
Concentrations of the REYs in all analysed samples ranged over three orders of magnitude, from below the detection limit (Tb, Ho, Tm, and Lu) to 81 mg kg−1 (Ce), with ΣREY ranging from 10.6 mg kg−1 to 85.2 mg kg−1 and 83.3 mg kg−1 to 227 mg kg−1 in sediments and soils, respectively. Among REY, Ce and La were present at the highest levels in all measured samples, whereas Tb, Ho, Tm, and Lu exhibited the lowest values in samples. Generally, the highest concentrations of REY, with an average ΣREY equaling 184 mg kg−1, were observed in soil samples, whereas sediments from both the Lake Mir and Telašćica Bay exhibited lower REY levels. Nonetheless, the sediments from the Telašćica Bay contain somewhat higher values compared with the Lake Mir sediments (Figure 2), with average ΣREY amounting to 73.8 mg kg−1 and 17.2 mg kg−1, respectively.
Figure 2 shows the distribution of average concentrations of the REY in the Lake Mir sediments, soils surrounding the lake, as well as the Telašćica Bay sediments.
The comparison of average REY values among the studied sets of samples showed that the REY concentrations in the Lake Mir sediments are 2 to 10 times lower compared with those in the Telašćica Bay and up to 20 times lower compared with REY levels found in soils.
The latter is reflected in the statistically highly significant difference (p < 0.001) observed between the studied groups of samples for all rare earth elements, including Y. As a result of substantial differences in total concentrations of REYs between the soils, the Telašćica Bay sediments, and the Lake Mir sediments, these three sets of samples were described and discussed separately.
In soils, the highest REY concentrations were measured at location S7 with ΣREY equaling 227 mg kg−1, and the lowest REY in location S5, with ΣREY equaling 83.3 mg kg−1.
The EuN/EuN* values in soil samples ranged from 0.87 to 0.99, with an average of 0.94, showing slightly negative values. The CeN/CeN* values were found in a similar range, from 0.85 to 1.05, with an average of 0.97, showing slightly negative to slightly positive values. Interestingly, the lowest value of the EuN/EuN* and the highest value of the CeN/CeN* were recorded for sample S5. Contrary to this observation, highest values of EuN/EuN* and lowest values of CeN/CeN* were found for sample S7.
In sediments of the Telašćica Bay, highest REY concentrations were detected in sediment at location T2 with ΣREY equaling 85.2 mg kg–1, whereas the lowest was at location T3, with ΣREY equaling 56.4 mg kg–1.
The sediments in the Telašćica Bay exhibited a slightly negative to slightly positive EuN/EuN* values, ranging from 0.93 to 1.16, with an average of 1.02. The CeN/CeN* values were found in a somewhat narrower range, showing slightly negative values (0.93–0.95, with an average of 0.94). The sediment at location T3 revealed both the highest EuN/EuN* value (1.16) and the highest CeN/CeN* value (0.95).
In the Lake Mir sediments, highest REY concentrations were measured at location M2, whereas the lowest were found at location M26, with ΣREY equaling 25.3 mg kg−1 and 10.6 mg kg–1, respectively.
The sediments exhibited a wider range of EuN/EuN* values, from 0.68 to 1.27, with an average of 0.85, whereas the CeN/CeN* displayed somewhat narrower range of values, ranging from 0.89 to 1.15, with an average of 1.06.
All soils showed a predominance of light rare earth elements (LREE, La-Gd) over heavy rare earths (HREE, Tb-Lu, including Y) with ΣLREE/ΣHREE ranging from 4.47 to 5.39, from 6.99 to 9.46, and from 4.71 to 5.29 in the Lake Mir sediments, the Telašćica Bay sediments, and the soils, respectively (Table 2). Remarkably, the average value of ΣLREE/ΣHREE obtained for the Lake Mir sediments (4.88) was similar to the average ΣLREE/ΣHREE obtained for surrounding soils (5.13), while the Telašćica Bay sediments showed much higher ΣLREE/ΣHREE values, with an average of 8.06. The predominance of light over heavy REY is also reflected in their normalized patterns (Figure 3).
As can be seen in Figure 3, the NASC-normalized REY patterns of sediments from both the Lake Mir (b) and the Telašćica Bay (a) were characterized by values below unity, indicating depletion of REY relative to NASC. Normalized patterns of soils, on the other hand, were characterized by values close to unity for LREE, and depletion for HREE, when compared with NASC.
In general, normalized patterns indicate spatial variability of the REY distribution within the studied groups (Figure 3), reflected in an average relative standard deviation (RSD) of normalized concentrations amounting to 24%, 19%, and 26% in the Lake Mir sediments, the Telašćica Bay sediments, and the soils, respectively.
Although all groups of samples exhibited predominance of LREE over HREE, differences between the groups regarding the shape of the normalized curves (Figure 3) can be clearly discerned. Sediments from the Lake Mir were characterized by an overall predominance of elements from Nd to Dy, with the exception of Eu, and lower values of elements from Y to Yb. On the other hand, normalized patterns of the Telašćica Bay sediments displayed a gradual decrease in normalized values from La to Lu.
The average normalized pattern of soils resembles the average normalized pattern of Lake Mir sediments (Figure 3). The latter is reflected in their similar (La/Yb)N and (Nd/Yb)N ratios, amounting to 2.21 and 2.33, respectively, in the Lake Mir sediments, and 2.21 and 2.32, respectively, in the surrounding soils (Table 2). The Telašćica Bay sediments, on the other hand, displayed values for these ratios that were twice as high, with (La/Yb)N and (Nd/Yb)N equaling 5.00 and 4.62, respectively (Table 2).
4. Discussion
4.1. REY Distribution in Soils and Sediments
The REY concentrations in the soil around the Lake Mir show low variability among the samples (Appendix A, Table A4). The only exception is the sample from location S5, situated in the south-eastern part of the basin (Figure 1c). At this location, seawater occasionally penetrates the lake during heavy storms, resulting in a predominance of calcareous type of soil, that is, absence of terra rossa cover [15]. This is reflected in up to two times lower REY levels in soil.
Average REY concentrations in soils were found to be lower than those reported for terra rossa from the Pingba Farm profile in central China [30] and the Kucukkoras Region in Turkey [31], respectively (Table 3). However, they were found to be comparable to the average rare earth elements concentrations in terra rossa and other soils from the drainage area of the Zrmanja River estuary [15], situated also in the karstic area of the eastern Adriatic coast.
While red soils, that is, terra rossa, contain relatively high concentrations of rare earth, carbonate rocks, that is, limestones and dolomites, typically contain very small amounts of accessory minerals, which are the most common carriers of the REYs. Accordingly, sediments from both the Telašćica Bay and the Lake Mir showed much lower levels of REY.
The REY levels in sediments of the Telašćica Bay were found to be comparable to literature data for the sediments from the Bijagós archipelago, Guinea-Bissau [32], the sediments from the port of Rijeka in the northern part of the eastern Adriatic [33], and the sediments of the Gulf of Biscay in France [34] (Table 3). They were also comparable to the lower range of values reported for the sediments of the Chesapeake Bay [13] and the estuarine sediments in Cochin in India [35] (Table 3). Measured concentrations exhibited lower values than the literature data for estuarine sediments of the river Odiel in Spain [14] (Table 3). In addition to differences in geological background, higher concentrations of rare earth in the Odiel River could probably be related to agricultural pressures (use of fertilizers) reported for this system [14].
The levels of REY in the Lake Mir are, on average, five times lower than in the Telašćica Bay, and thereby are lower than the abovementioned literature values. The difference in levels of REY between the Telašćica Bay and the Lake Mir is probably related to the difference in material sources contributing to the sediment composition of these two systems.
Both groups of sediments and soils displayed a prevalence of light rare earths. Most shales and sediments contain higher concentrations of LREE compared with HREE [36,37,38], and the predominance of light rare earth elements in sediments investigated in this study was somewhat expected. Namely, enrichment of the LREE relative to the HREE is considered to reflect greater affinity of the particles (i.e., clay minerals) for light rare earths [36,37,38]. However, the ΣLREE/ΣHREE, (La/Yb)N, and (Nd/Yb)N ratio values for the Lake Mir sediments were found to be similar to ratio values of soils sampled nearby, pointing to a direct correlation between REY distribution in the sediments and local lithology. Similar observations were reported for the sediments of the Zrmanja River estuary and surrounding soils [15].
4.2. Principal Component Analysis (PCA)
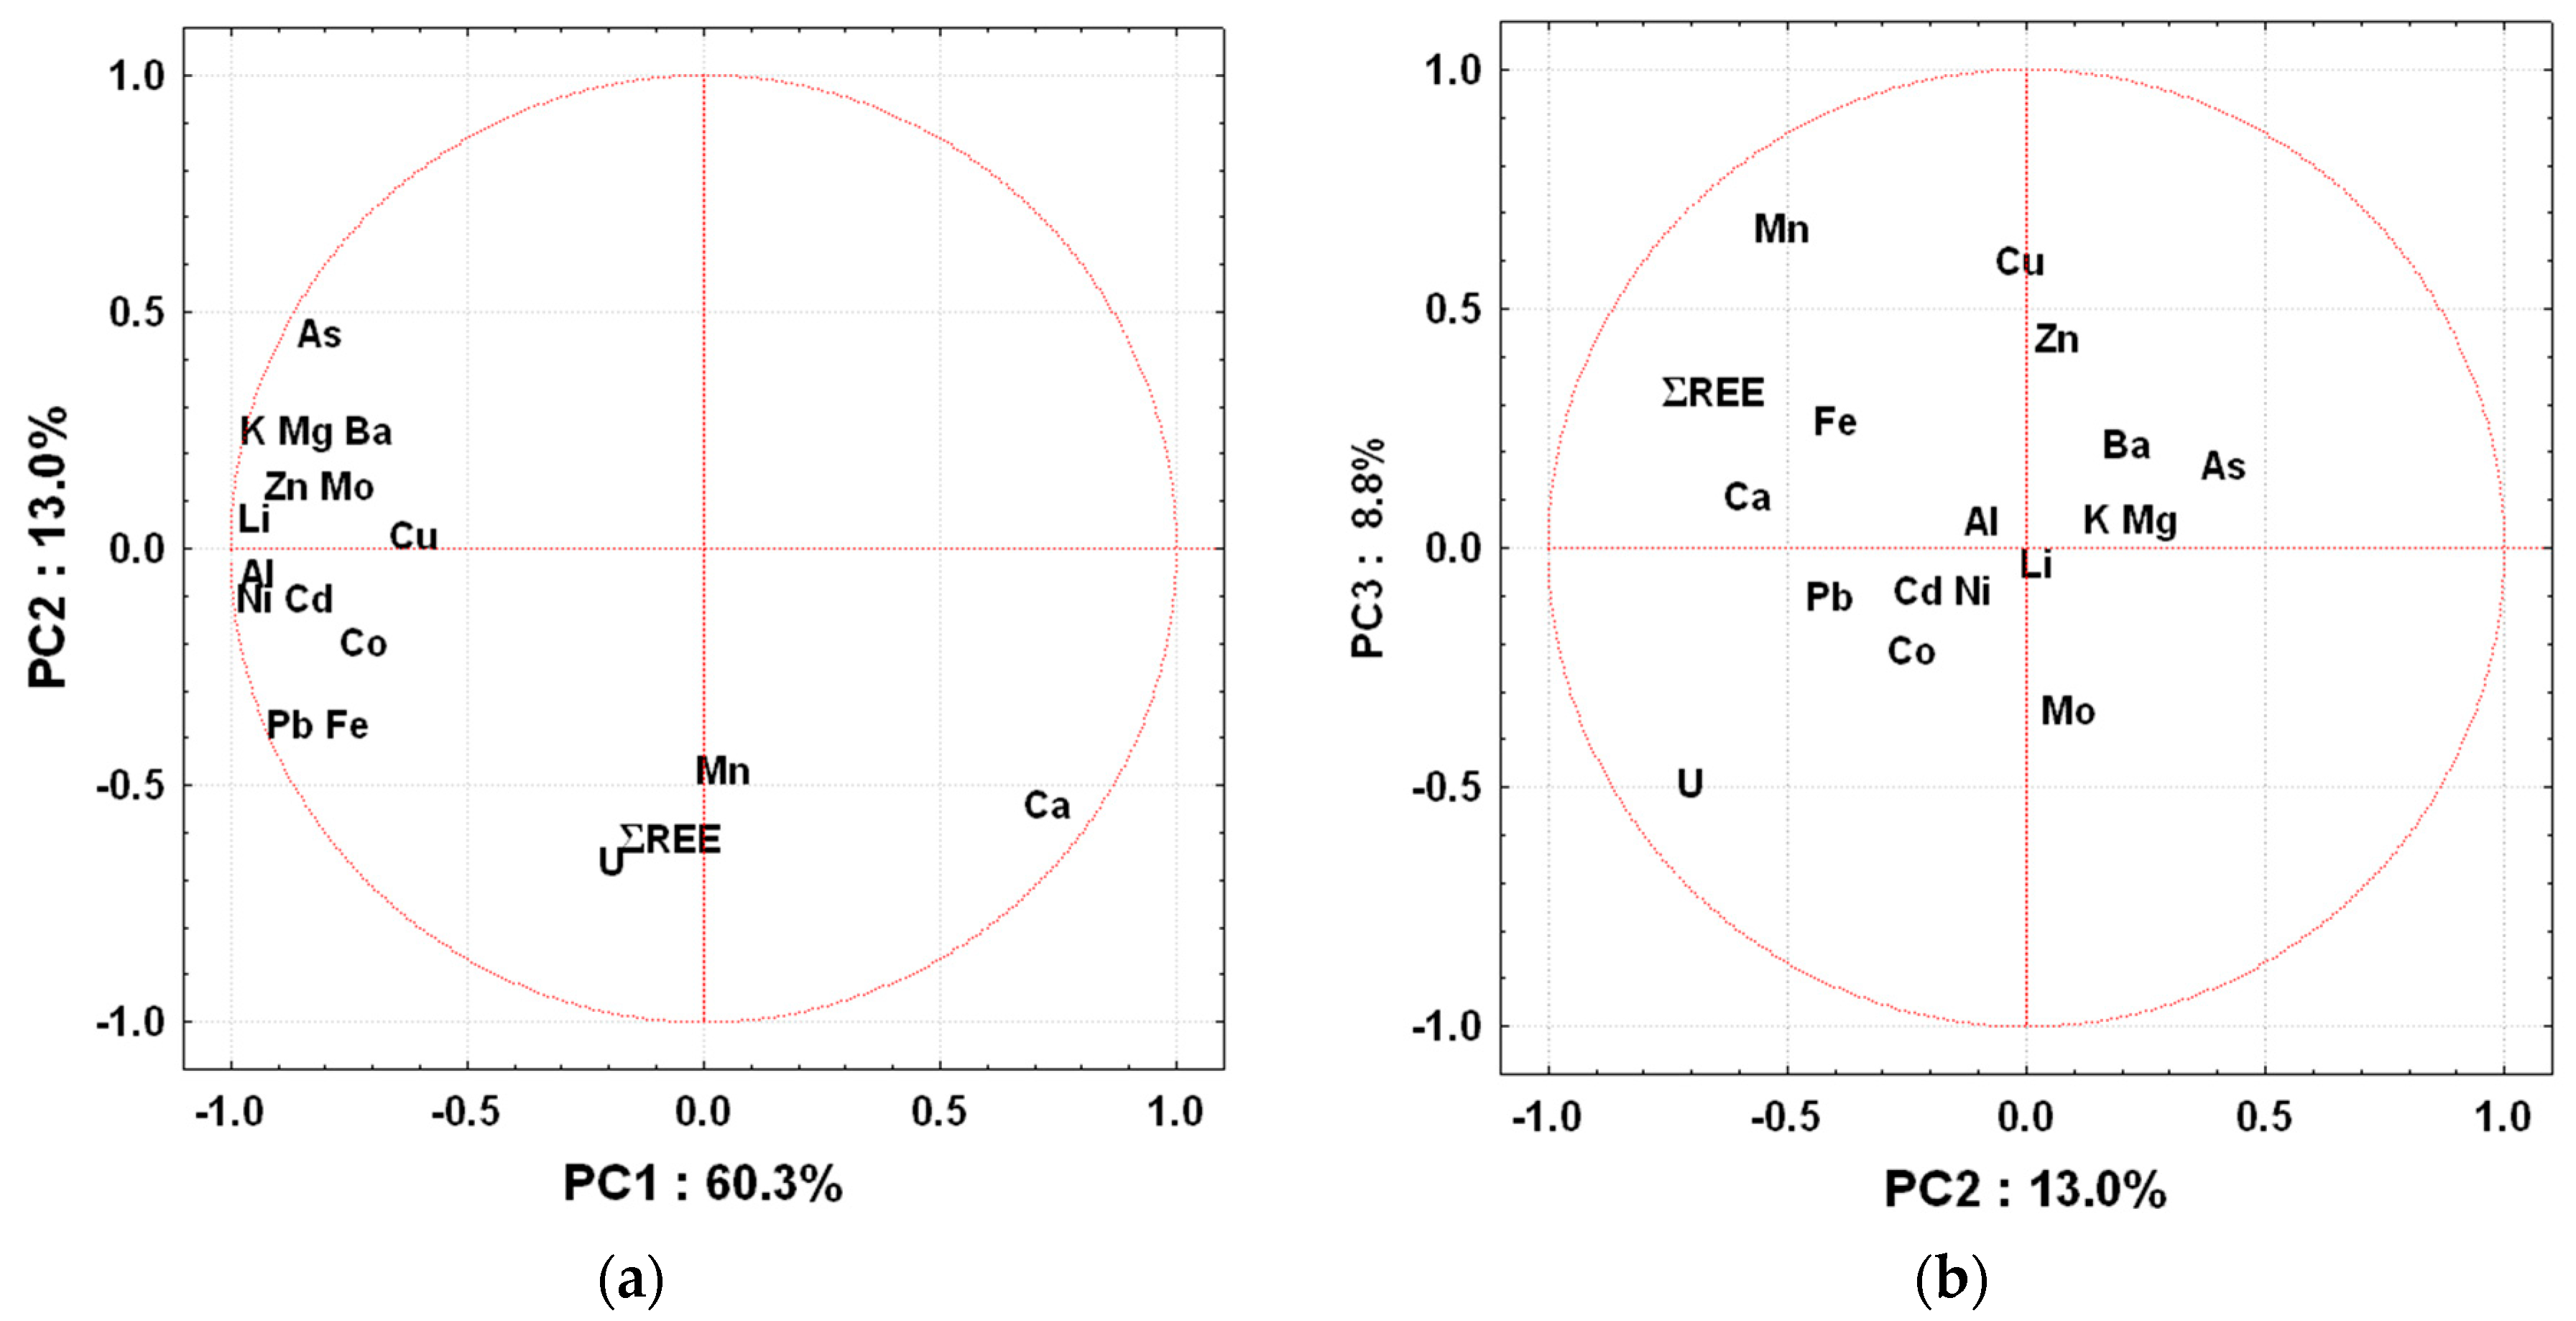
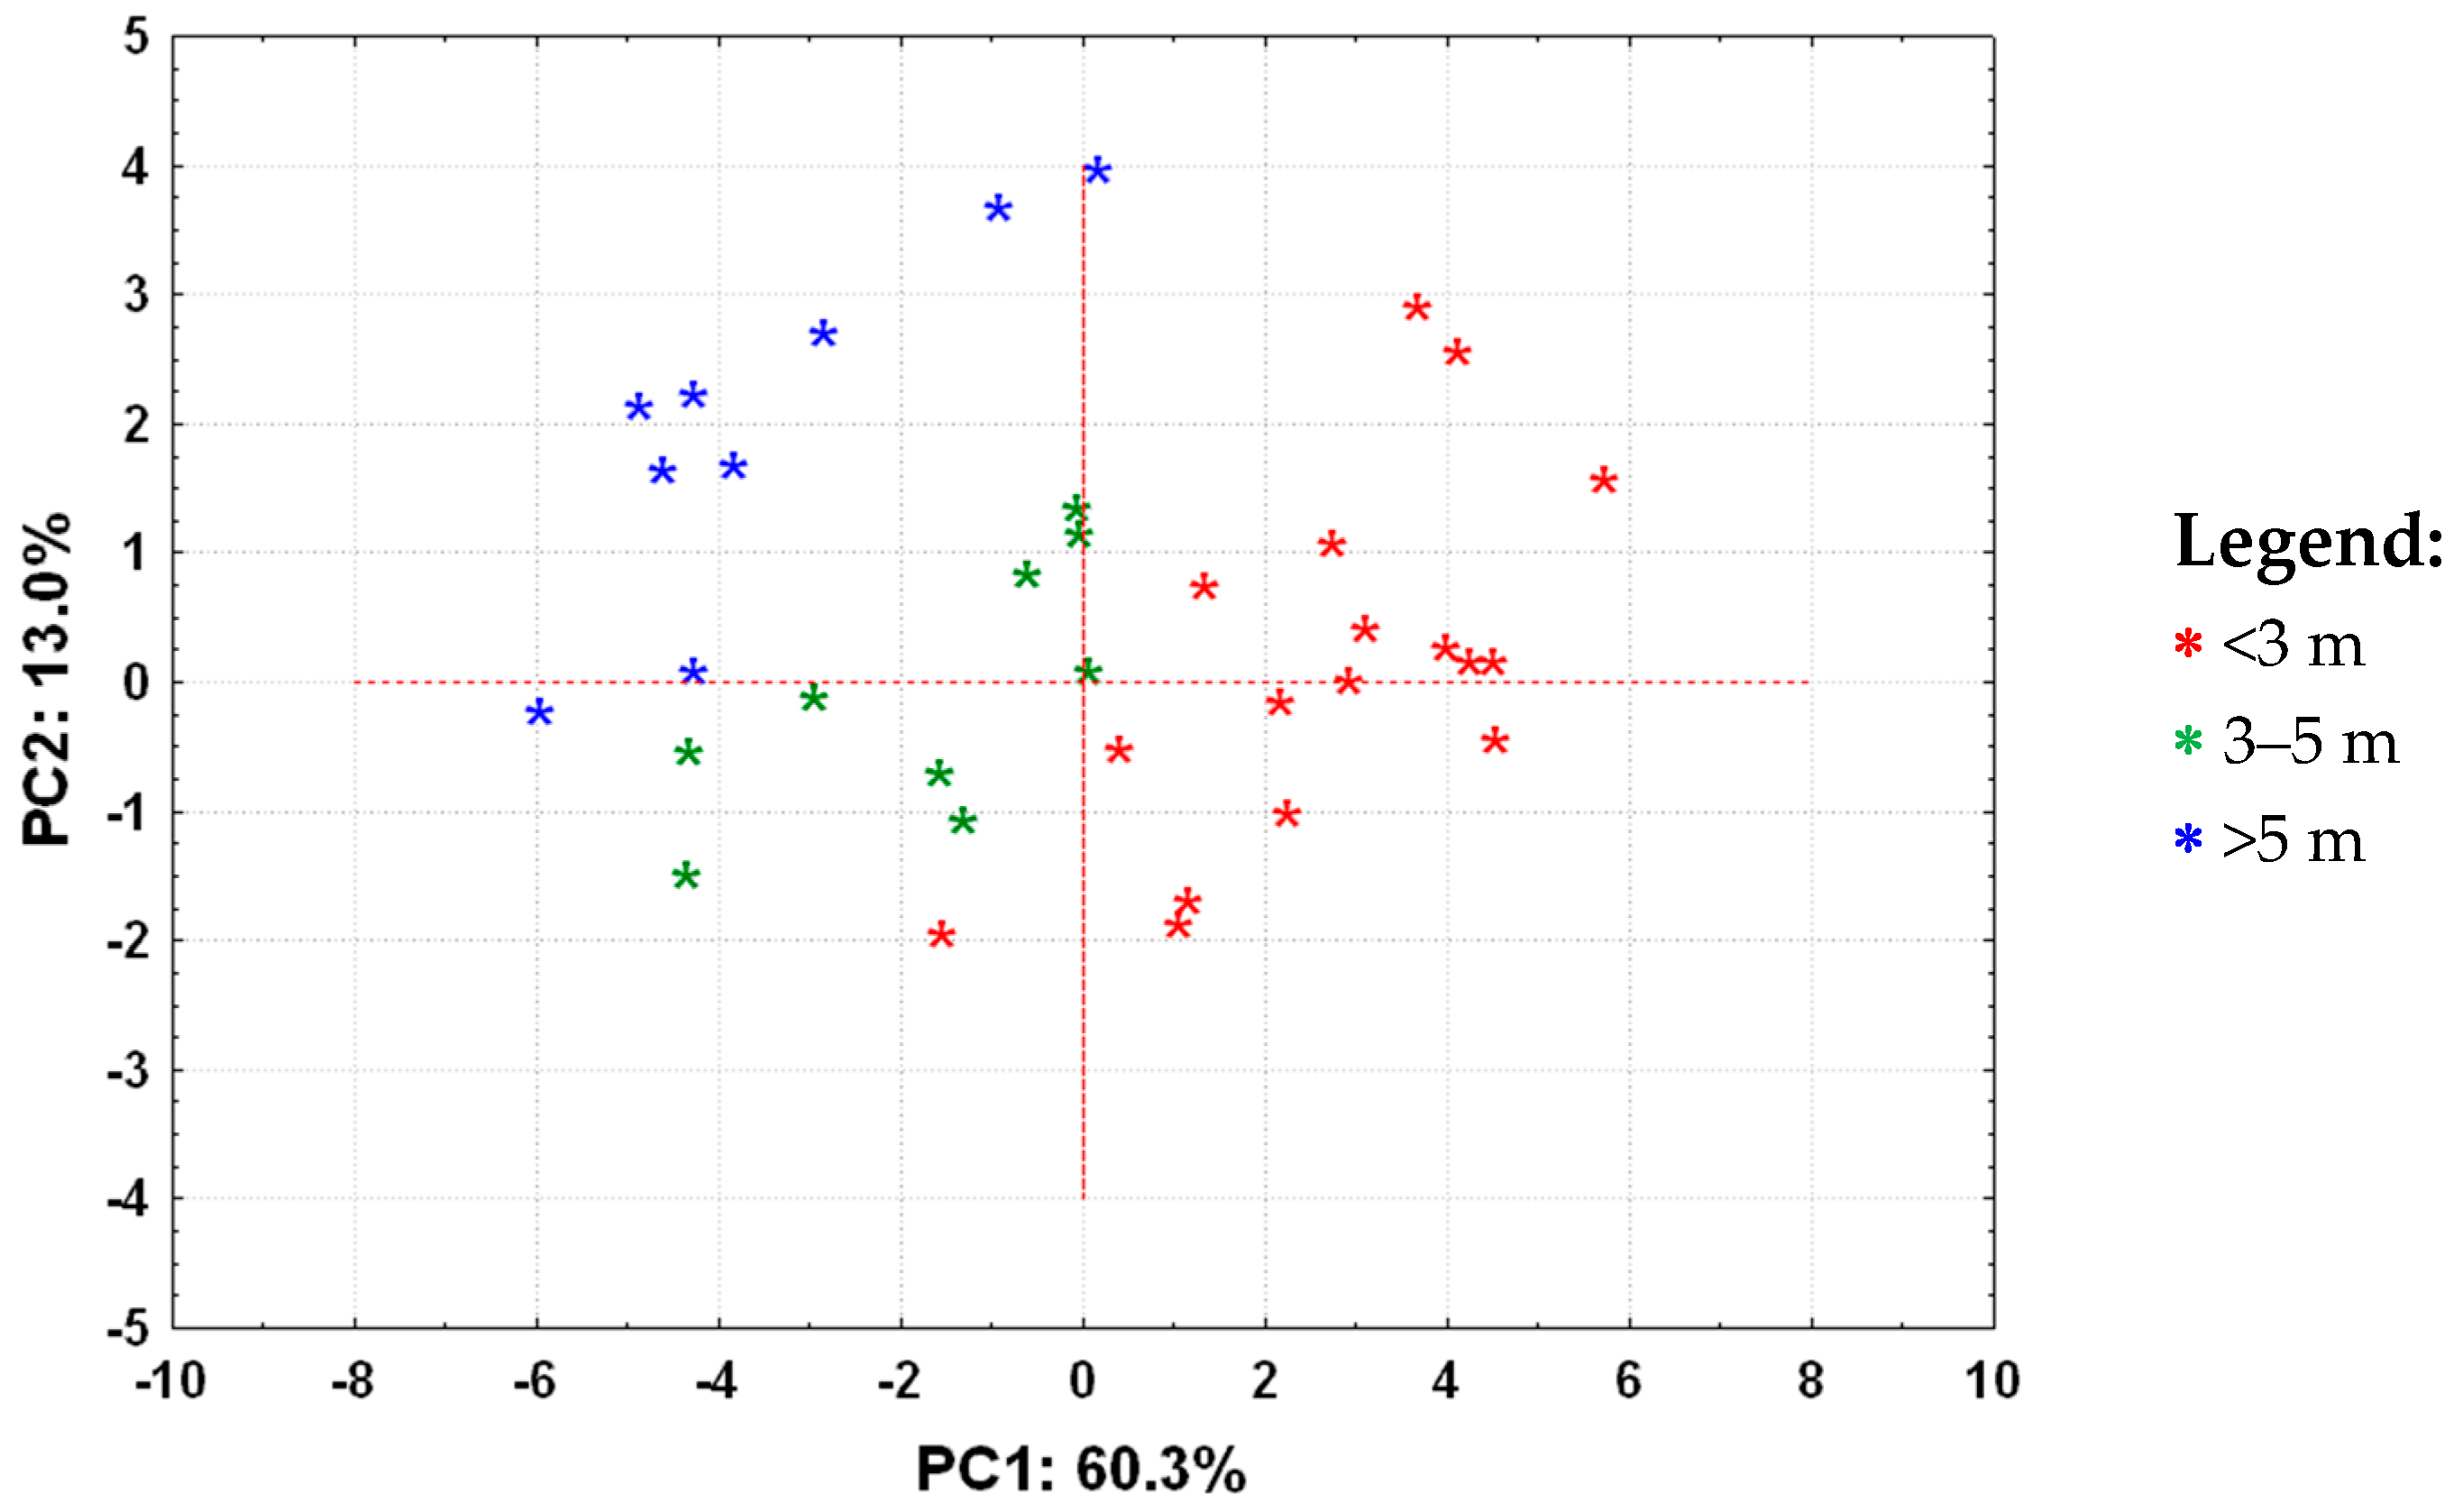
In order to identify processes that control the element distribution in surface sediments of the Lake Mir, PCA was performed on the dataset, including ΣREY and concentrations of 17 elements (Al, As, Ba, Ca, Cd, Co, Cu, Fe, K, Li, Mg, Mn, Mo, Ni, Pb, U, and Zn) previously reported by Mlakar et al. (2015) [10]. The eigenvalues of the first three principal components (PCs) were larger than 1, indicating their significance. The first three PCs explained 82.1% of the total variability among the 18 variables; the first component (PC1) contributed 60.3%, while the second (PC2) and third (PC3) component contributed 13.0% and 8.8% of the total variance, respectively. The results of the PCA are presented on the PC1 versus PC2 and PC1 versus PC3 loading plots (Figure 4), and PC1 versus PC2 score plot (Figure 5).
Calcium had the highest positive PC1 loading (0.71), while the majority of other elements, such as Al, As, Ba, Cd, Co, Fe, K, Li, Mg, Mo, Ni, Pb, and Zn, exhibited negative PC1 loadings—between 0.73 and 0.96. The Al, Fe, K, and Li are typical geogenic elements, that is, the major constituent of clay minerals, and proxy for the sedimentary fine-grained particles content [39] (Windom et al., 1989). The Al and Fe are also main constituents of Al–Fe-hydroxides predominating in terra rossa soils [40]. Although the mineral composition of terra rossa in the Mediterranean area was reported to be very variable [41], the main mineral fractions generally found in this type of soil are clay minerals, Al–Fe-oxides and hydroxides [42,43,44], and in some places, quartz [38,39,45,46].
Thus, the significant and positive correlations between Al, Fe, K, Li, As, Ba, Cd, Co, Mg, Mo, Ni, Pb, and Zn indicate that levels of all these elements in the sediments of the Lake Mir are related to the abundance of fine-grained fraction comprised predominantly of aluminosilicates and/or Al–Fe-hydroxides. Their opposite grouping on the PC1 versus PC2 loading plot from Ca (Figure 4a), points to their similar origin in the surface sediments of the Lake Mir (i.e., aluminosilicates and/or Al–Fe-hydroxides), which is different from those influencing Ca content (i.e., carbonates). The latter suggests that PC1 discriminate samples with regards to their shares of carbonate and non-carbonate component.
The U, ΣREY, Ca, and Mn, on the other hand, exhibited the greatest negative effect on PC2 (0.52 to 0.71), while none of the elements displayed a positive effect higher than 0.5 on PC2. Interestingly, the separation of ΣREY from other lithogenic elements (Figure 4a) points to the diversity of processes that determine the concentration levels of these two groups of elements. Moreover, grouping of ΣREY with Ca (Figure 4a) points to the similarity of processes that control their distribution in the surface sediments of the Lake Mir. According to Chapazz et al. [47], authigenic uranium represents <3% of the total U concentration in the sediments. Thus, the grouping of U with Ca, ΣREY, and Mn suggests a common factor influencing their distribution in the sediments. As Ca is representative of sediment carbonate fraction, distribution of these elements is, at least partly, related to an input of terrigenous carbonate component in the Lake Mir. The fact that the maximum levels of rare earth elements in the Lake Mir sediments correspond to the levels of REE in tufa samples from the Zrmanja River [15] supports this assumption.
In the PC1 versus PC2 score plot (Figure 5), sampling locations are clearly divided into three groups with regards to the depth reported by Mlakar et al. (2015) [10]. The shallower locations also contain highest shares of carbonates [10], which explain their highest positive values of PC1 (Figure 5). The latter is somewhat expected, given that coastal parts, that is, the shallowest parts of the basin, usually contain the highest share of coarse fraction; in this case, terrigenous carbonates. With the depth increase, the share of the finest fraction in the sediment rises, which is reflected in the more negative values of PC1. The latter is confirmed by previously reported high variability in the carbonate content of the Lake Mir sediments (from 33.7% to 85.3%), showing its decline in the lake at greater depths [10]. However, the differences between the three groups are not defined only in relation to PC1, but with respect to both principal components, PC1 and PC2 (Figure 5). The distribution of rare earth elements in the surface sediments of the Lake Mir is, therefore, governed by input of both the aluminosilicates and/or Al–Fe-hydroxides and carbonate particles.
In the PC2 versus PC3 loading plot (Figure 4b), manganese and copper showed the highest positive PC3 loadings (0.62 and 0.55, respectively), while U is found to be clearly separated from all other elements in the PC2 versus PC3 plot, showing the highest negative effect on PC3 (0.54). Separation of Mn, Cu, and to some extent Zn from all other elements in the PC2 versus PC3 plot (Figure 4b) suggests the similarity of processes that control their distribution in the surface sediments of the Lake Mir. A previous study linked the contribution of Zn in sediments partly to organic matter [10]. Following the latter, distribution of Mn, Cu, and Zn in the lake sediments could be partially governed by biological processes.
The PCA suggested several sources influencing the lake composition and confirmed the link between the pedological features and geological setting and the REY content in the surface sediments of the Lake Mir. Although rare earth elements are generally associated with clay minerals and Al–Fe-hydroxides [15], in the marine Lake Mir, their grouping displayed a distinct separation from typical lithogenic elements, pointing to their origin from both the carbonate and non-carbonate particles.
5. Conclusions
Based on the results described, it can be concluded that the levels of rare earth elements, including Y, in sediments of the marine Lake Mir are primarily influenced by the pedological and geological background (dominated by carbonates and red soils), and particle size distribution. Although sediment concentrations are much lower than those in soils, similarity in normalized patterns and fractionation indices undoubtedly points to the influence of local substrate on the sediment composition of the lake. The latter additionally confirms the possible application of rare earth elements as a proxy for the differentiation between external sources (attributing to higher levels of REY in the system) and local bedrock.
Author Contributions
Conceptualization, Ž.F.; Methodology, M.M.; Software, Ž.F.; Validation, Ž.F. and M.M.; Formal analysis, Ž.F.; Investigation, M.M.; Resources, M.M.; Data Curation, M.M.; Writing—Original Draft Preparation, Ž.F.; Writing—Review & Editing, M.M. and G.K.; Visualization, Ž.F.; Supervision, M.M.; Project Administration, M.M.; Funding Acquisition, M.M.
Funding
This research was funded by Public Institution of the “Telašćica” Nature Park.
Acknowledgments
We would like to thank the expert associate, Milena Ramov, and other personnel from Telašćica Nature Park for help during field work.
Conflicts of Interest
The authors declare no conflict of interest.
Appendix A

Table A1.
The grain size distribution data, total organic carbon (TOC), and carbonate content (CaCO3) content of the Lake Mir and the Telašćica Bay sediments, previously reported by Mlakar et al. [10].
Table A1.
The grain size distribution data, total organic carbon (TOC), and carbonate content (CaCO3) content of the Lake Mir and the Telašćica Bay sediments, previously reported by Mlakar et al. [10].
| Clay (%) | Silt (%) | Sand (%) | TOC (%) | CaCO3 (%) | |
|---|---|---|---|---|---|
| Lake Mir | 0.3–1.7 | 13–42 | 57–82 | 3.2–8.9 | 41–75 |
| Telašćica Bay | 1.0 | 17 | 81 | 0.4 | 85 |
Table A2.
Element concentrations, expressed in mg kg−1 or * g kg−1, in the Lake Mir sediments (M1–M35) previously reported by Mlakar et al. [10].
Table A2.
Element concentrations, expressed in mg kg−1 or * g kg−1, in the Lake Mir sediments (M1–M35) previously reported by Mlakar et al. [10].
| Al * | As | Ba | Ca * | Cd | Co | Cu | Fe * | K * | Li | Mg * | Mn | Mo | Ni | Pb | U | Zn | |
|---|---|---|---|---|---|---|---|---|---|---|---|---|---|---|---|---|---|
| M1 | 1.7 | 3.1 | 25.7 | 206 | 0.05 | 0.8 | 2.93 | 0.25 | 1.0 | 3.3 | 5.0 | 361 | 0.96 | 3.6 | 3.9 | 1.7 | 8.6 |
| M2 | 3.2 | 3.8 | 22.3 | 198 | 0.04 | 0.9 | 4.59 | 0.31 | 1.3 | 4.8 | 4.4 | 192 | 2.38 | 4.2 | 2.9 | 1.6 | 8.9 |
| M3 | 2.0 | 2.6 | 23.0 | 226 | 0.05 | 0.9 | 3.12 | 0.23 | 1.1 | 4.0 | 5.1 | 169 | 1.36 | 4.1 | 5.3 | 2.1 | 8.4 |
| M4 | 1.8 | 3.7 | 21.6 | 212 | 0.07 | 1.5 | 7.37 | 0.49 | 1.4 | 4.8 | 4.3 | 151 | 2.42 | 5.8 | 5.5 | 1.9 | 12.5 |
| M5 | 3.8 | 6.2 | 35.2 | 228 | 0.09 | 1.7 | 6.82 | 0.79 | 2.1 | 7.4 | 6.3 | 256 | 2.44 | 7.0 | 8.1 | 2.4 | 14.5 |
| M6 | 2.1 | 4.1 | 22.1 | 150 | 0.01 | 1.0 | 3.63 | 0.44 | 1.5 | 4.2 | 4.0 | 151 | 1.26 | 4.2 | 3.5 | 1.3 | 9.6 |
| M7 | 5.8 | 19.2 | 55.1 | 170 | 0.13 | 2.2 | 6.17 | 0.67 | 3.8 | 10.4 | 10.1 | 426 | 4.01 | 9.0 | 7.8 | 2.2 | 17.3 |
| M8 | 3.9 | 19.6 | 40.0 | 138 | 0.10 | 1.7 | 15.1 | 0.54 | 3.3 | 6.2 | 7.9 | 205 | 4.57 | 7.5 | 6.7 | 1.8 | 20.1 |
| M9 | 2.4 | 5.3 | 24.1 | 152 | 0.08 | 1.4 | 4.33 | 0.49 | 1.7 | 4.0 | 5.3 | 185 | 3.50 | 4.7 | 6.1 | 2.1 | 9.4 |
| M10 | 3.5 | 6.0 | 32.2 | 236 | 0.15 | 1.8 | 6.09 | 0.82 | 2.1 | 6.5 | 5.8 | 215 | 3.10 | 7.1 | 7.9 | 2.5 | 13.4 |
| M11 | 3.7 | 22.3 | 44.4 | 94.4 | 0.06 | 1.5 | 8.94 | 0.4 | 4.0 | 8.8 | 10.7 | 101 | 4.06 | 6.2 | 4.0 | 1.5 | 22.0 |
| M12 | 6.9 | 24.6 | 65.9 | 140 | 0.11 | 2.7 | 25.4 | 1.27 | 4.6 | 11 | 11.4 | 468 | 4.25 | 10.1 | 9.0 | 2.1 | 36.8 |
| M13 | 2.8 | 15.7 | 36.5 | 184 | 0.12 | 2.0 | 23.1 | 0.57 | 2.4 | 6.4 | 5.8 | 189 | 3.85 | 7.0 | 7.6 | 2.1 | 24.5 |
| M14 | 6.5 | 23.2 | 58.2 | 112 | 0.22 | 2.4 | 10.5 | 0.73 | 4.7 | 12.0 | 13.0 | 156 | 9.31 | 11.2 | 9.5 | 2.4 | 25.8 |
| M15 | 6.5 | 31.2 | 61.8 | 96.7 | 0.21 | 2.5 | 10.7 | 0.73 | 6.0 | 14.1 | 15.2 | 121 | 7.11 | 11.1 | 8.6 | 1.6 | 24 |
| M16 | 2.5 | 9.1 | 31.2 | 179 | 0.10 | 1.3 | 6.99 | 0.29 | 2.1 | 5.1 | 6.6 | 362 | 2.37 | 5.1 | 7.1 | 2.3 | 15.5 |
| M17 | 3.7 | 32 | 47.5 | 78.4 | 0.09 | 1.8 | 5.64 | 0.44 | 3.4 | 8.9 | 9.1 | 80 | 10.9 | 7.9 | 6.1 | 1.4 | 17.8 |
| M18 | 6.6 | 48 | 89.8 | 100 | 0.20 | 1.8 | 14.4 | 0.5 | 5.5 | 11.2 | 14.7 | 154 | 4.39 | 8.9 | 8.7 | 1.8 | 30.9 |
| M19 | 4.0 | 28.7 | 60.4 | 161 | 0.09 | 1.7 | 5.22 | 0.4 | 3.8 | 8.7 | 9.5 | 214 | 4.89 | 7.4 | 6 | 2.2 | 13.3 |
| M20 | 5.9 | 13 | 45.0 | 163 | 0.12 | 2.0 | 9.39 | 0.77 | 3.8 | 9.7 | 10.2 | 167 | 5.88 | 8.7 | 8.8 | 2.7 | 18.5 |
| M21 | 6.9 | 48.5 | 84.1 | 113 | 0.16 | 1.9 | 21.2 | 0.58 | 5.8 | 13.1 | 13.3 | 104 | 7.59 | 10.6 | 7.6 | 1.8 | 32.3 |
| M22 | 5.7 | 53 | 89.3 | 126 | 0.14 | 1.5 | 7.48 | 0.51 | 5.5 | 11.9 | 14.0 | 168 | 5.07 | 8.6 | 6.5 | 1.8 | 18.6 |
| M23 | 4.3 | 26.4 | 61.2 | 177 | 0.13 | 1.8 | 6.13 | 0.52 | 4.0 | 9.2 | 9.9 | 187 | 5.23 | 8.2 | 6.0 | 2.4 | 13.7 |
| M24 | 4.1 | 7.3 | 32.6 | 187 | 0.11 | 1.8 | 5.63 | 0.57 | 2.7 | 7.6 | 6.9 | 113 | 5.51 | 8.5 | 8.5 | 2.8 | 12.5 |
| M25 | 5.8 | 6.1 | 40.2 | 189 | 0.16 | 2.2 | 6.22 | 0.67 | 3.4 | 10.7 | 8.2 | 131 | 6.98 | 10.3 | 9.4 | 3.4 | 16.4 |
| M26 | 2.9 | 4.0 | 19.6 | 132 | 0.04 | 0.9 | 3.00 | 0.22 | 1.8 | 5.4 | 5.0 | 71 | 2.05 | 3.9 | 4.6 | 1.6 | 8.1 |
| M27 | 3.4 | 7.7 | 31.0 | 167 | 0.07 | 1.7 | 5.45 | 0.51 | 2.6 | 7.3 | 7.2 | 103 | 3.36 | 7.4 | 7.2 | 2.2 | 11.0 |
| M28 | 6.3 | 52.3 | 78.1 | 107 | 0.17 | 2.0 | 8.83 | 0.63 | 5.0 | 10.6 | 14.3 | 107 | 7.38 | 10.1 | 8.3 | 2.1 | 19.7 |
| M29 | 5.1 | 19.4 | 43.0 | 113 | 0.12 | 5.0 | 5.63 | 0.55 | 4.5 | 10.1 | 14 | 230 | 8.86 | 8.9 | 9.1 | 2.9 | 16.5 |
| M30 | 4.1 | 3.2 | 27.2 | 195 | 0.08 | 1.3 | 3.65 | 0.34 | 1.8 | 7.7 | 5.2 | 136 | 2.58 | 6.4 | 6.3 | 2.8 | 9.6 |
| M31 | 8.2 | 33.8 | 69.3 | 111 | 0.2 | 3.0 | 13.0 | 1.04 | 5.2 | 14.7 | 13.7 | 168 | 8.13 | 13.2 | 10.9 | 1.8 | 27.3 |
| M32 | 7.2 | 36.4 | 72.2 | 133 | 0.19 | 2.7 | 7.95 | 0.74 | 4.6 | 12.9 | 9.5 | 151 | 10.7 | 11.9 | 8.83 | 3.0 | 20.1 |
| M33 | 2.5 | 5.5 | 24.7 | 214 | 0.12 | 1.7 | 4.3 | 0.26 | 1.6 | 5.7 | 5.0 | 73 | 2.88 | 5.1 | 5.5 | 2.8 | 9.7 |
| M34 | 1.7 | 4.3 | 23.1 | 234 | 0.07 | 0.9 | 4.16 | 0.28 | 1.0 | 2.6 | 4.5 | 161 | 1.51 | 4.0 | 4.3 | 2.0 | 9.7 |
| M35 | 1.3 | 1.9 | 19.4 | 222 | 0.01 | 0.8 | 1.59 | 0.2 | 0.9 | 3.0 | 3.9 | 251 | 0.29 | 3.8 | 2.4 | 1.3 | 5.1 |
Table A3.
Concentrations of rare earth element Y (REYs), expressed in mg kg−1, in the Lake Mir sediments (M1–M35). LREE—light rare earth elements; HREE—heavy rare earth elements.
Table A3.
Concentrations of rare earth element Y (REYs), expressed in mg kg−1, in the Lake Mir sediments (M1–M35). LREE—light rare earth elements; HREE—heavy rare earth elements.
| La | Ce | Pr | Nd | Sm | Eu | Gd | Tb | Dy | Y | Ho | Er | Tm | Yb | Lu | ΣREY | ΣLREE/ΣHREE | |
|---|---|---|---|---|---|---|---|---|---|---|---|---|---|---|---|---|---|
| M1 | 4.2 | 9.87 | 1.0 | 3.98 | 0.8 | 0.2 | 0.8 | 0.1 | 0.6 | 2.99 | <0.1 | 0.3 | <0.1 | 0.2 | <0.1 | 25.0 | 4.98 |
| M2 | 4.3 | 9.95 | 1.0 | 3.94 | 0.7 | 0.2 | 0.7 | <0.1 | 0.6 | 3.34 | 0.1 | 0.3 | <0.1 | 0.2 | <0.1 | 25.3 | 4.58 |
| M3 | 3.3 | 7.43 | 0.8 | 3.01 | 0.6 | 0.1 | 0.6 | <0.1 | 0.5 | 2.44 | <0.1 | 0.2 | <0.1 | 0.2 | <0.1 | 19.2 | 4.74 |
| M4 | 3.7 | 5.70 | 0.6 | 2.32 | 0.4 | <0.1 | 0.4 | <0.1 | 0.3 | 1.97 | <0.1 | 0.2 | <0.1 | 0.1 | <0.1 | 15.7 | 5.11 |
| M5 | 3.5 | 7.94 | 0.9 | 3.11 | 0.6 | 0.1 | 0.6 | <0.1 | 0.4 | 2.66 | <0.1 | 0.2 | <0.1 | 0.2 | <0.1 | 20.2 | 4.84 |
| M6 | 2.0 | 4.66 | 0.5 | 1.70 | 0.3 | <0.1 | 0.3 | <0.1 | 0.3 | 1.57 | <0.1 | 0.1 | <0.1 | <0.1 | <0.1 | 11.4 | 4.80 |
| M7 | 3.5 | 7.78 | 0.8 | 3.18 | 0.6 | 0.1 | 0.6 | <0.1 | 0.4 | 2.56 | <0.1 | 0.2 | <0.1 | 0.2 | <0.1 | 19.9 | 4.93 |
| M8 | 2.6 | 5.80 | 0.6 | 2.17 | 0.4 | <0.1 | 0.4 | <0.1 | 0.3 | 1.72 | <0.1 | 0.2 | <0.1 | 0.1 | <0.1 | 14.3 | 5.16 |
| M9 | 2.1 | 4.81 | 0.5 | 1.87 | 0.4 | <0.1 | 0.4 | <0.1 | 0.3 | 1.58 | <0.1 | 0.1 | <0.1 | 0.1 | <0.1 | 12.2 | 4.85 |
| M10 | 3.6 | 7.75 | 0.8 | 2.96 | 0.6 | 0.1 | 0.6 | <0.1 | 0.5 | 2.74 | <0.1 | 0.2 | <0.1 | 0.2 | <0.1 | 20.1 | 4.51 |
| M11 | 2.0 | 4.66 | 0.5 | 1.72 | 0.3 | <0.1 | 0.3 | <0.1 | 0.3 | 1.61 | <0.1 | 0.1 | <0.1 | 0.1 | <0.1 | 11.6 | 4.49 |
| M12 | 3.4 | 7.87 | 0.8 | 2.97 | 0.6 | 0.1 | 0.6 | <0.1 | 0.4 | 2.27 | <0.1 | 0.2 | <0.1 | 0.2 | <0.1 | 19.4 | 5.32 |
| M13 | 2.8 | 6.24 | 0.6 | 2.47 | 0.5 | 0.1 | 0.5 | <0.1 | 0.4 | 2.11 | <0.1 | 0.2 | <0.1 | 0.1 | <0.1 | 16.0 | 4.70 |
| M14 | 3.3 | 7.32 | 0.8 | 2.90 | 0.6 | 0.1 | 0.5 | <0.1 | 0.4 | 2.41 | <0.1 | 0.2 | <0.1 | 0.2 | <0.1 | 18.7 | 4.83 |
| M15 | 3.1 | 6.83 | 0.7 | 2.68 | 0.5 | 0.1 | 0.5 | <0.1 | 0.4 | 2.18 | <0.1 | 0.2 | <0.1 | 0.1 | <0.1 | 17.3 | 5.00 |
| M16 | 2.8 | 6.16 | 0.6 | 2.56 | 0.5 | 0.1 | 0.5 | <0.1 | 0.4 | 2.07 | <0.1 | 0.2 | <0.1 | 0.1 | <0.1 | 16.0 | 4.77 |
| M17 | 1.9 | 4.18 | 0.5 | 1.71 | 0.3 | <0.1 | 0.3 | <0.1 | 0.3 | 1.49 | <0.1 | 0.1 | <0.1 | 0.1 | <0.1 | 10.9 | 4.47 |
| M18 | 2.9 | 6.53 | 0.7 | 2.68 | 0.5 | 0.1 | 0.5 | <0.1 | 0.4 | 2.09 | <0.1 | 0.2 | <0.1 | 0.2 | <0.1 | 16.8 | 4.81 |
| M19 | 3.0 | 6.56 | 0.7 | 2.60 | 0.5 | 0.1 | 0.5 | <0.1 | 0.4 | 2.03 | <0.1 | 0.2 | <0.1 | 0.1 | <0.1 | 16.7 | 5.11 |
| M20 | 3.3 | 7.19 | 0.8 | 3.06 | 0.6 | 0.1 | 0.5 | <0.1 | 0.4 | 2.20 | <0.1 | 0.2 | <0.1 | 0.2 | <0.1 | 18.6 | 5.18 |
| M21 | 3.3 | 7.25 | 0.8 | 2.85 | 0.6 | 0.1 | 0.5 | <0.1 | 0.4 | 2.27 | <0.1 | 0.2 | <0.1 | 0.2 | <0.1 | 18.5 | 5.02 |
| M22 | 2.7 | 5.95 | 0.6 | 2.33 | 0.4 | <0.1 | 0.4 | <0.1 | 0.3 | 2.02 | <0.1 | 0.2 | <0.1 | 0.1 | <0.1 | 15.0 | 4.73 |
| M23 | 2.7 | 5.89 | 0.6 | 2.30 | 0.4 | <0.1 | 0.4 | <0.1 | 0.4 | 2.02 | <0.1 | 0.2 | <0.1 | 0.1 | <0.1 | 15.0 | 4.52 |
| M24 | 2.8 | 6.11 | 0.7 | 2.43 | 0.5 | 0.1 | 0.5 | <0.1 | 0.4 | 2.08 | <0.1 | 0.2 | <0.1 | 0.1 | <0.1 | 15.9 | 4.73 |
| M25 | 3.4 | 8.15 | 0.8 | 2.95 | 0.6 | 0.1 | 0.6 | <0.1 | 0.4 | 2.28 | <0.1 | 0.2 | <0.1 | 0.2 | <0.1 | 19.7 | 5.39 |
| M26 | 1.8 | 4.16 | 0.4 | 1.70 | 0.3 | <0.1 | 0.3 | <0.1 | 0.3 | 1.50 | <0.1 | 0.1 | <0.1 | <0.1 | <0.1 | 10.6 | 4.56 |
| M27 | 2.5 | 5.61 | 0.6 | 2.26 | 0.5 | 0.1 | 0.5 | <0.1 | 0.4 | 1.90 | <0.1 | 0.2 | <0.1 | 0.1 | <0.1 | 14.7 | 4.64 |
| M28 | 3.3 | 7.34 | 0.8 | 3.20 | 0.6 | 0.1 | 0.5 | <0.1 | 0.4 | 2.28 | <0.1 | 0.2 | <0.1 | 0.2 | <0.1 | 18.9 | 5.14 |
| M29 | 2.3 | 4.97 | 0.6 | 2.24 | 0.5 | <0.1 | 0.4 | <0.1 | 0.3 | 1.80 | <0.1 | 0.2 | <0.1 | 0.1 | <0.1 | 13.4 | 4.59 |
| M30 | 3.9 | 9.03 | 1.0 | 3.77 | 0.8 | 0.2 | 0.7 | <0.1 | 0.5 | 2.91 | <0.1 | 0.2 | <0.1 | 0.2 | <0.1 | 23.2 | 5.09 |
| M31 | 3.8 | 8.56 | 0.9 | 3.52 | 0.7 | 0.1 | 0.6 | <0.1 | 0.5 | 2.72 | <0.1 | 0.2 | <0.1 | 0.2 | <0.1 | 21.8 | 5.02 |
| M32 | 3.6 | 7.84 | 0.8 | 2.99 | 0.6 | 0.1 | 0.6 | <0.1 | 0.4 | 2.43 | <0.1 | 0.2 | <0.1 | 0.2 | <0.1 | 19.8 | 5.12 |
| M33 | 2.8 | 6.02 | 0.7 | 2.59 | 0.5 | 0.1 | 0.5 | <0.1 | 0.4 | 2.17 | <0.1 | 0.2 | <0.1 | 0.1 | <0.1 | 16.1 | 4.60 |
| M34 | 3.5 | 7.90 | 0.8 | 3.0 | 0.6 | 0.1 | 0.7 | <0.1 | 0.5 | 2.56 | <0.1 | 0.2 | <0.1 | 0.1 | <0.1 | 20.0 | 4.94 |
| M35 | 2.6 | 6.06 | 0.6 | 2.39 | 0.4 | <0.1 | 0.4 | <0.1 | 0.3 | 1.82 | <0.1 | 0.1 | <0.1 | 0.1 | <0.1 | 14.8 | 5.37 |
ΣREY—rum of all rare earth element concentrations, including Y. ΣLREE/ΣHREE—ratio of sum of light (La–Gd) and heavy (Tb–Lu, including Y) rare earth element concentrations.
Table A4.
Concentrations of REYs, expressed in mg kg−1, in the Telašćica Bay sediments (T1–T5) and surrounding soils (S1–S7).
Table A4.
Concentrations of REYs, expressed in mg kg−1, in the Telašćica Bay sediments (T1–T5) and surrounding soils (S1–S7).
| La | Ce | Pr | Nd | Sm | Eu | Gd | Tb | Dy | Y | Ho | Er | Tm | Yb | Lu | ΣREY | ΣLREE/ΣHREE | |
|---|---|---|---|---|---|---|---|---|---|---|---|---|---|---|---|---|---|
| T1 | 16.2 | 31.8 | 3.8 | 15 | 2.6 | 0.5 | 2.2 | 0.3 | 1.3 | 6.4 | 0.2 | 0.5 | <0.1 | 0.4 | <0.1 | 81.2 | 7.92 |
| T2 | 16.6 | 33.5 | 4.2 | 16.4 | 2.8 | 0.6 | 2.1 | 0.3 | 1.2 | 6.48 | 0.2 | 0.5 | <0.1 | 0.3 | <0.1 | 85.2 | 8.49 |
| T3 | 11.3 | 22.7 | 2.7 | 10.8 | 1.8 | 0.4 | 1.3 | 0.2 | 0.7 | 3.89 | 0.1 | 0.3 | <0.1 | 0.2 | <0.1 | 56.4 | 9.46 |
| T4 | 15.2 | 30.2 | 3.7 | 14.6 | 2.6 | 0.5 | 2.2 | 0.3 | 1.3 | 6.5 | 0.2 | 0.6 | <0.1 | 0.4 | <0.1 | 78.3 | 7.42 |
| T5 | 13.3 | 26.3 | 3.2 | 12.4 | 2.1 | 0.4 | 1.6 | 0.2 | 1.0 | 6.28 | 0.2 | 0.5 | <0.1 | 0.3 | <0.1 | 67.8 | 6.99 |
| S1 | 33.1 | 68.6 | 8.0 | 29.3 | 5.8 | 1.2 | 5.4 | 0.7 | 4.0 | 19.8 | 0.7 | 2.0 | 0.3 | 1.4 | 0.2 | 181 | 5.20 |
| S2 | 36.9 | 76.6 | 8.9 | 32.7 | 6.3 | 1.3 | 5.8 | 0.8 | 4.5 | 22.3 | 0.8 | 2.2 | 0.3 | 1.6 | 0.2 | 201 | 5.15 |
| S3 | 38.6 | 81 | 9.4 | 34.4 | 6.7 | 1.4 | 6.2 | 0.8 | 4.7 | 22.8 | 0.8 | 2.3 | 0.3 | 1.6 | 0.3 | 211 | 5.29 |
| S4 | 35.6 | 76 | 8.7 | 31.7 | 6.3 | 1.3 | 5.9 | 0.8 | 4.4 | 21.2 | 0.8 | 2.2 | 0.3 | 1.5 | 0.2 | 197 | 5.27 |
| S5 | 14.7 | 32.1 | 3.4 | 12.9 | 2.6 | 0.5 | 2.5 | 0.3 | 1.9 | 10.1 | 0.4 | 1.0 | 0.1 | 0.7 | 0.1 | 83.3 | 4.71 |
| S6 | 34.7 | 68.3 | 8.5 | 30.9 | 6.1 | 1.2 | 5.5 | 0.8 | 4.1 | 20.3 | 0.8 | 2.0 | 0.3 | 1.4 | 0.2 | 185 | 5.19 |
| S7 | 44.0 | 79.9 | 10.7 | 39.3 | 7.5 | 1.6 | 6.9 | 0.9 | 5.2 | 25.3 | 0.9 | 2.5 | 0.3 | 1.8 | 0.3 | 227 | 5.10 |
ΣREY—sum of all rare earth element concentrations, including Y. ΣLREE/ΣHREE—ratio of sum of light (La–Gd) and heavy (Tb–Lu, including Y) rare earth element concentrations.
References
- Hamner, W.M.; Gilmer, R.W.; Hamner, P.P. The physical, chemical, biological characteristics of a stratified, saline, sulfide lake in Palau. Limnol. Oceanogr. 1982, 27, 896–909. [Google Scholar] [CrossRef]
- Burnett, W.C.; Landing, W.M.; Lyons, W.B.; Orem, W. Jellyfish Lake, Palau: A model anoxic environment for geochemical studies. Eos Trans. Am. Geophys. Union 1989, 70, 777–783. [Google Scholar] [CrossRef]
- Landing, W.M.; Burnett, W.C.; Lyons, W.B.; Orem, W.H. Nutrient cycling, the biogeochemistry of manganese, iron, zinc in Jellyfish Lake, Palau. Limnol. Oceanogr. 1991, 36, 515–525. [Google Scholar] [CrossRef]
- Orem, W.H.; Burnett, W.C.; Landing, W.M.; Lyons, W.B.; Showers, W. Jellyfish Lake, Palau: Early diagenesis of organic matter in sediments of an anoxic marine lake. Limnol. Oceanogr. 1991, 36, 526–543. [Google Scholar] [CrossRef] [Green Version]
- Bates, A.L.; Spiker, E.C.; Orem, W.H.; Burnett, W.C. Speciation, isotopic composition of sulfur in sediments from Jellyfish Lake, Palau. Chem. Geol. 1993, 106, 63–76. [Google Scholar] [CrossRef]
- Lyons, W.B.; Lent, R.M.; Burnett, W.C.; Chin, P.; Landing, W.M.; Orem, W.H.; McArthur, J.M. Jellyfish Lake, Palau: Regeneration of C, N, Si, P in anoxic marine sediments. Limnol. Oceanogr. 1996, 41, 1394–1403. [Google Scholar] [CrossRef]
- Hamner, W.M.; Hamner, P.P. Stratified marine lakes of Palau (Western Caroline Islands). Phys. Geogr. 1998, 19, 175–220. [Google Scholar]
- Cerrano, C.; Azzini, F.; Bavestrello, G.; Calcinai, B.; Pansini, M.; Sarti, M.; Thung, D.C. Marine lakes of karst islands in Ha Long Bay (Vietnam). Chem. Ecol. 2006, 22, 489–500. [Google Scholar] [CrossRef]
- Colin, P.L. Marine Environments of Palau; Indo-Pacific Press: San Diego, CA, USA, 2009; p. 414. [Google Scholar]
- Mlakar, M.; Fiket, Ž.; Geček, S.; Cukrov, N.; Cuculić, V. Marine lake as in situ laboratory for studies of organic matter influence on speciation and distribution of trace metals. Cont. Shelf Res. 2015, 103, 1–11. [Google Scholar] [CrossRef]
- Davranche, M.; Grybos, M.; Gruau, G.; Pedrot, M.; Dia, A.; Marsac, R. Rare earth element patterns: A tool for identifying trace metal sources during wetland soil reduction. Chem. Geol. 2011, 284, 127–137. [Google Scholar] [CrossRef]
- McLennan, S.M.; Taylor, S.R. Geology, Geochemistry, and Natural Abundances of the Rare Earth Elements. In Encyclopedia of Inorganic and Bioinorganic Chemistry; John Wiley & Sons, Ltd.: Hoboken, NJ, USA, 2012. [Google Scholar]
- Hannigan, R.; Dorval, E.; Jones, C. The rare earth element chemistry of estuarine surface sediments in Chesapeake Bay. Chem. Geol. 2010, 272, 20–30. [Google Scholar] [CrossRef]
- López-González, N.; Borrego, J.; Carro, B.; Grande, J.A.; De la Torre, M.L.; Valente, T. Rare-earth-element fractionation patterns in estuarine sediments as a consequence of acid mine drainage: A case study in SW Spain. Bol. Geol. Min. 2012, 123, 55–64. [Google Scholar]
- Fiket, Ž.; Mikac, N.; Kniewald, G. Influence of the geological setting on the REE geochemistry of estuarine sediments: A case study of the Zrmanja River estuary (eastern Adriatic coast). J. Geochem. Explor. 2017, 182, 70–79. [Google Scholar] [CrossRef]
- Haxel, G.B.; Hedrick, J.B.; Orris, G.J. Rare Earth Elements: Critical Resources for High Technology. U.S. Geological Survey Fact Sheet 087-02; 2002. Available online: http://pubs.usgs.gov/fs/2002/ fs087-02/ (accessed on 9 August 2018).
- Long, K.R.; Van Gosen, B.S.; Foley, N.K.; Cordier, D. The Principal Rare Earth Elements Deposits of the United States—A Summary of Domestic Deposits and A Global Perspective; U.S. Geological Survey: Reston, VA, USA, 2010; p. 104.
- Livergood, R. Rare Earth Elements: A Wrench in the Supply Chain. Center for Strategic and International Studies. 2010. Available online: http://csis.org/files/publication/101005_DIIG_Current_Issues_no22_Rare_earth_elements.pdf (accessed on 9 August 2018).
- Wang, Y.; Sun, J.; Chen, H.; Guo, F. Determination of the contents and distribution characteristics of REE in natural plants by NAA. J. Radioanal. Nucl. Chem. 1997, 219, 99–103. [Google Scholar] [CrossRef]
- Wang, L.H.; Huang, X.H.; Zhou, Q. Effects of rare earth elements on the distribution of mineral elements and heavy metals in horseradish. Chemosphere 2008, 73, 314–319. [Google Scholar] [CrossRef] [PubMed]
- Zhang, C.; Li, Q.; Zhang, M.; Zhang, N.; Li, M. Effects of rare earth elements on growth and metabolism of medicinal plants. Acta Pharm. Sin. B 2013, 3, 20–24. [Google Scholar] [CrossRef]
- Pamić, J.; Gušić, I.; Jelaska, V. Geodynamic evolution of the Central Dinarides. Tectonophysics 1998, 297, 251–268. [Google Scholar] [CrossRef]
- Surić, M. Submerged Karst—Dead or Alive? Examples from the Eastern Adriatic Coast (Croatia). Geoadria 2005, 10, 5–12. [Google Scholar] [CrossRef]
- Šegota, T. The sea level and vertical movements of the Adriatic Sea bottom since Ris-Würm glaciations till today. Geol. Vjesnik Zagreb 1982, 35, 93–109. (In Croatian) [Google Scholar]
- Pirazzoli, P.A. A review of possible eustatic, isostatic and tectonic contributions in eight late—Holocene relative sea-level histories from the Mediterranean area. Quat. Sci. Rev. 2005, 24, 1989–2001. [Google Scholar] [CrossRef]
- Bates, R.L.; Jackson, J.A. Glossary of Geology; American Geological Institute: Falls Church, VA, USA, 1987. [Google Scholar]
- Miko, S.; Durn, G.; Prohić, E. Evaluation of terra rossa geochemical baselines from Croatian karst regions. J. Geochem. Explor. 1999, 66, 173–182. [Google Scholar] [CrossRef]
- Gromet, P.L.; Dymek, P.F.; Haskin, L.A.; Korotev, R.L. The North American Shale Composite: Its Composition, Major and Minor Element Characteristics. Geochim. Cosmochim. Acta 1984, 48, 2469–2482. [Google Scholar] [CrossRef]
- Migaszewski, Z.M.; Gałuszka, A. The Characteristics, Occurrence, and Geochemical Behavior of Rare Earth Elements in the Environment: A Review. Crit. Rev. Environ. Sci. Technol. 2015, 45, 429–471. [Google Scholar] [CrossRef]
- Feng, J.L. Behaviour of rare earth elements and yttrium in ferromanganese concretions, gibbsite spots, and the surrounding terra rossa over dolomite during chemical weathering. Chem. Geol. 2010, 271, 112–132. [Google Scholar] [CrossRef]
- Yalcin, M.G.; Ilhan, S. Major and Trace Element geochemistry of Terra Rossa Soil in the Kucukkoras Region, Karaman, Turkey. Geochem. Int. 2008, 46, 1038–1054. [Google Scholar] [CrossRef]
- Carvahlo, L.; Figueira, P.; Monteiro, R.; Reis, A.T.; Almeida, J.; Catry, T.; Lourenço, P.M.; Catry, P.; Barbosa, C.; Catry, I.; et al. Major, minor, trace and rare earth elements in sediments of the Bijagós archipelago, Guinea-Bissau. Mar. Pollut. Bull. 2018, in press. [Google Scholar] [CrossRef] [PubMed]
- Cukrov, N.; Frančišković-Bilinski, S.; Hlača, B.; Barišić, D. A recent history of metal accumulation in the sediments of Rijeka harbor, Adriatic Sea, Croatia. Mar. Pollut. Bull. 2011, 62, 154–167. [Google Scholar] [CrossRef] [PubMed]
- Chaillou, G.; Anschutz, P.; Lavaux, G.; Blanc, G. Rare earth elements in the modern sediments of the Bay of Biscay (France). Mar. Chem. 2006, 100, 39–52. [Google Scholar] [CrossRef]
- Deepulal, P.M. Behaviour of ERZs in a tropical estuary and adjacent continental shelf of southwest coast of India: Evidence from anomalies. J. Earth Syst. Sci. 2012, 121, 1215–1227. [Google Scholar] [CrossRef]
- Vlasov, K.A. Geochemistry and Mineralogy of Rare Elements and Genetic Types of their Deposits—Vol. 1 Geochemistry of Rare Earth Elements; IPST No. 2123; Israel Program for Scientific Translations: Jerusalem, Israel, 1996; p. 945. [Google Scholar]
- Sholkovitz, E.R. The geochemistry of rare earth elements in the Amazon River estuary. Geochim. Cosmochim. Acta 1993, 57, 2181–2190. [Google Scholar] [CrossRef]
- Sholkovitz, E.R.; Elderfield, H.; Szymczak, R.; Casey, K. Island weathering: River sources of rare earth elements to the Western Pacific Ocean. Mar. Chem. 1999, 68, 39–57. [Google Scholar] [CrossRef]
- Windom, H.L.; Schropp, S.J.; Calder, F.D.; Ryan, J.D.; Smith, R.G.; Burney, L.C.; Lewis, F.G.; Rawlinson, C.H. Natural trace metal concentrations in estuarine and coastal marine sediments of the southeastern United States. Environ. Sci. Technol. 1989, 23, 314–320. [Google Scholar] [CrossRef]
- Durn, G. Terra Rossa in the Mediterranean Region: Parent Materials, Composition and Origin. Geol. Croat. 2003, 56, 83–100. [Google Scholar]
- Macleod, D.A. The origin of the red Mediterranean soils in Epirus, Greece. J. Soil Sci. 1980, 31, 125–136. [Google Scholar] [CrossRef]
- Garcia-Gonzales, M.T.; Recio, P. Geochemistry and mineralogy of the clay fraction from some Spanish terra rossa. Agrochimica 1988, 32, 161–170. [Google Scholar]
- Boero, V.; Premoli, A.; Melis, P.; Barberis, E.; Arduino, E. Influence of climate on the iron oxide mineralogy of terra rossa. Clays Clay Miner. 1992, 40, 8–13. [Google Scholar] [CrossRef]
- Bronger, A.; Bruhn-Lobin, N. Paleopedology of Terrae rossae—Rhodoxeralfs from Quaternary calcarenites in NW Morocco. Catena 1997, 28, 279–295. [Google Scholar] [CrossRef]
- Moresi, M.; Mongelli, G. The relation between the terra rossa and the carbonate-free residue of the underlying limestones and dolostones in Apulia, Italy. Clay Miner. 1988, 23, 439–446. [Google Scholar] [CrossRef]
- Altay, I. Red Mediterranean soils in some karstic regions of Taurus mountains, Turkey. Catena 1997, 247–260. [Google Scholar]
- Chappaz, A.; Gobeil, C.; Tessier, A. Controls on uranium distribution in lake sediments. Geochim. Cosmochim. Acta 2010, 74, 203–214. [Google Scholar] [CrossRef]
Figure 1.
(a) Location of the Dugi otok Island; (b) location of the Lake Mir and the Telašćica Bay on the Dugi otok Island; (c) map of sampling locations at the Lake Mir and the Telašćica Bay (Google Earth, 2018).
Figure 1.
(a) Location of the Dugi otok Island; (b) location of the Lake Mir and the Telašćica Bay on the Dugi otok Island; (c) map of sampling locations at the Lake Mir and the Telašćica Bay (Google Earth, 2018).
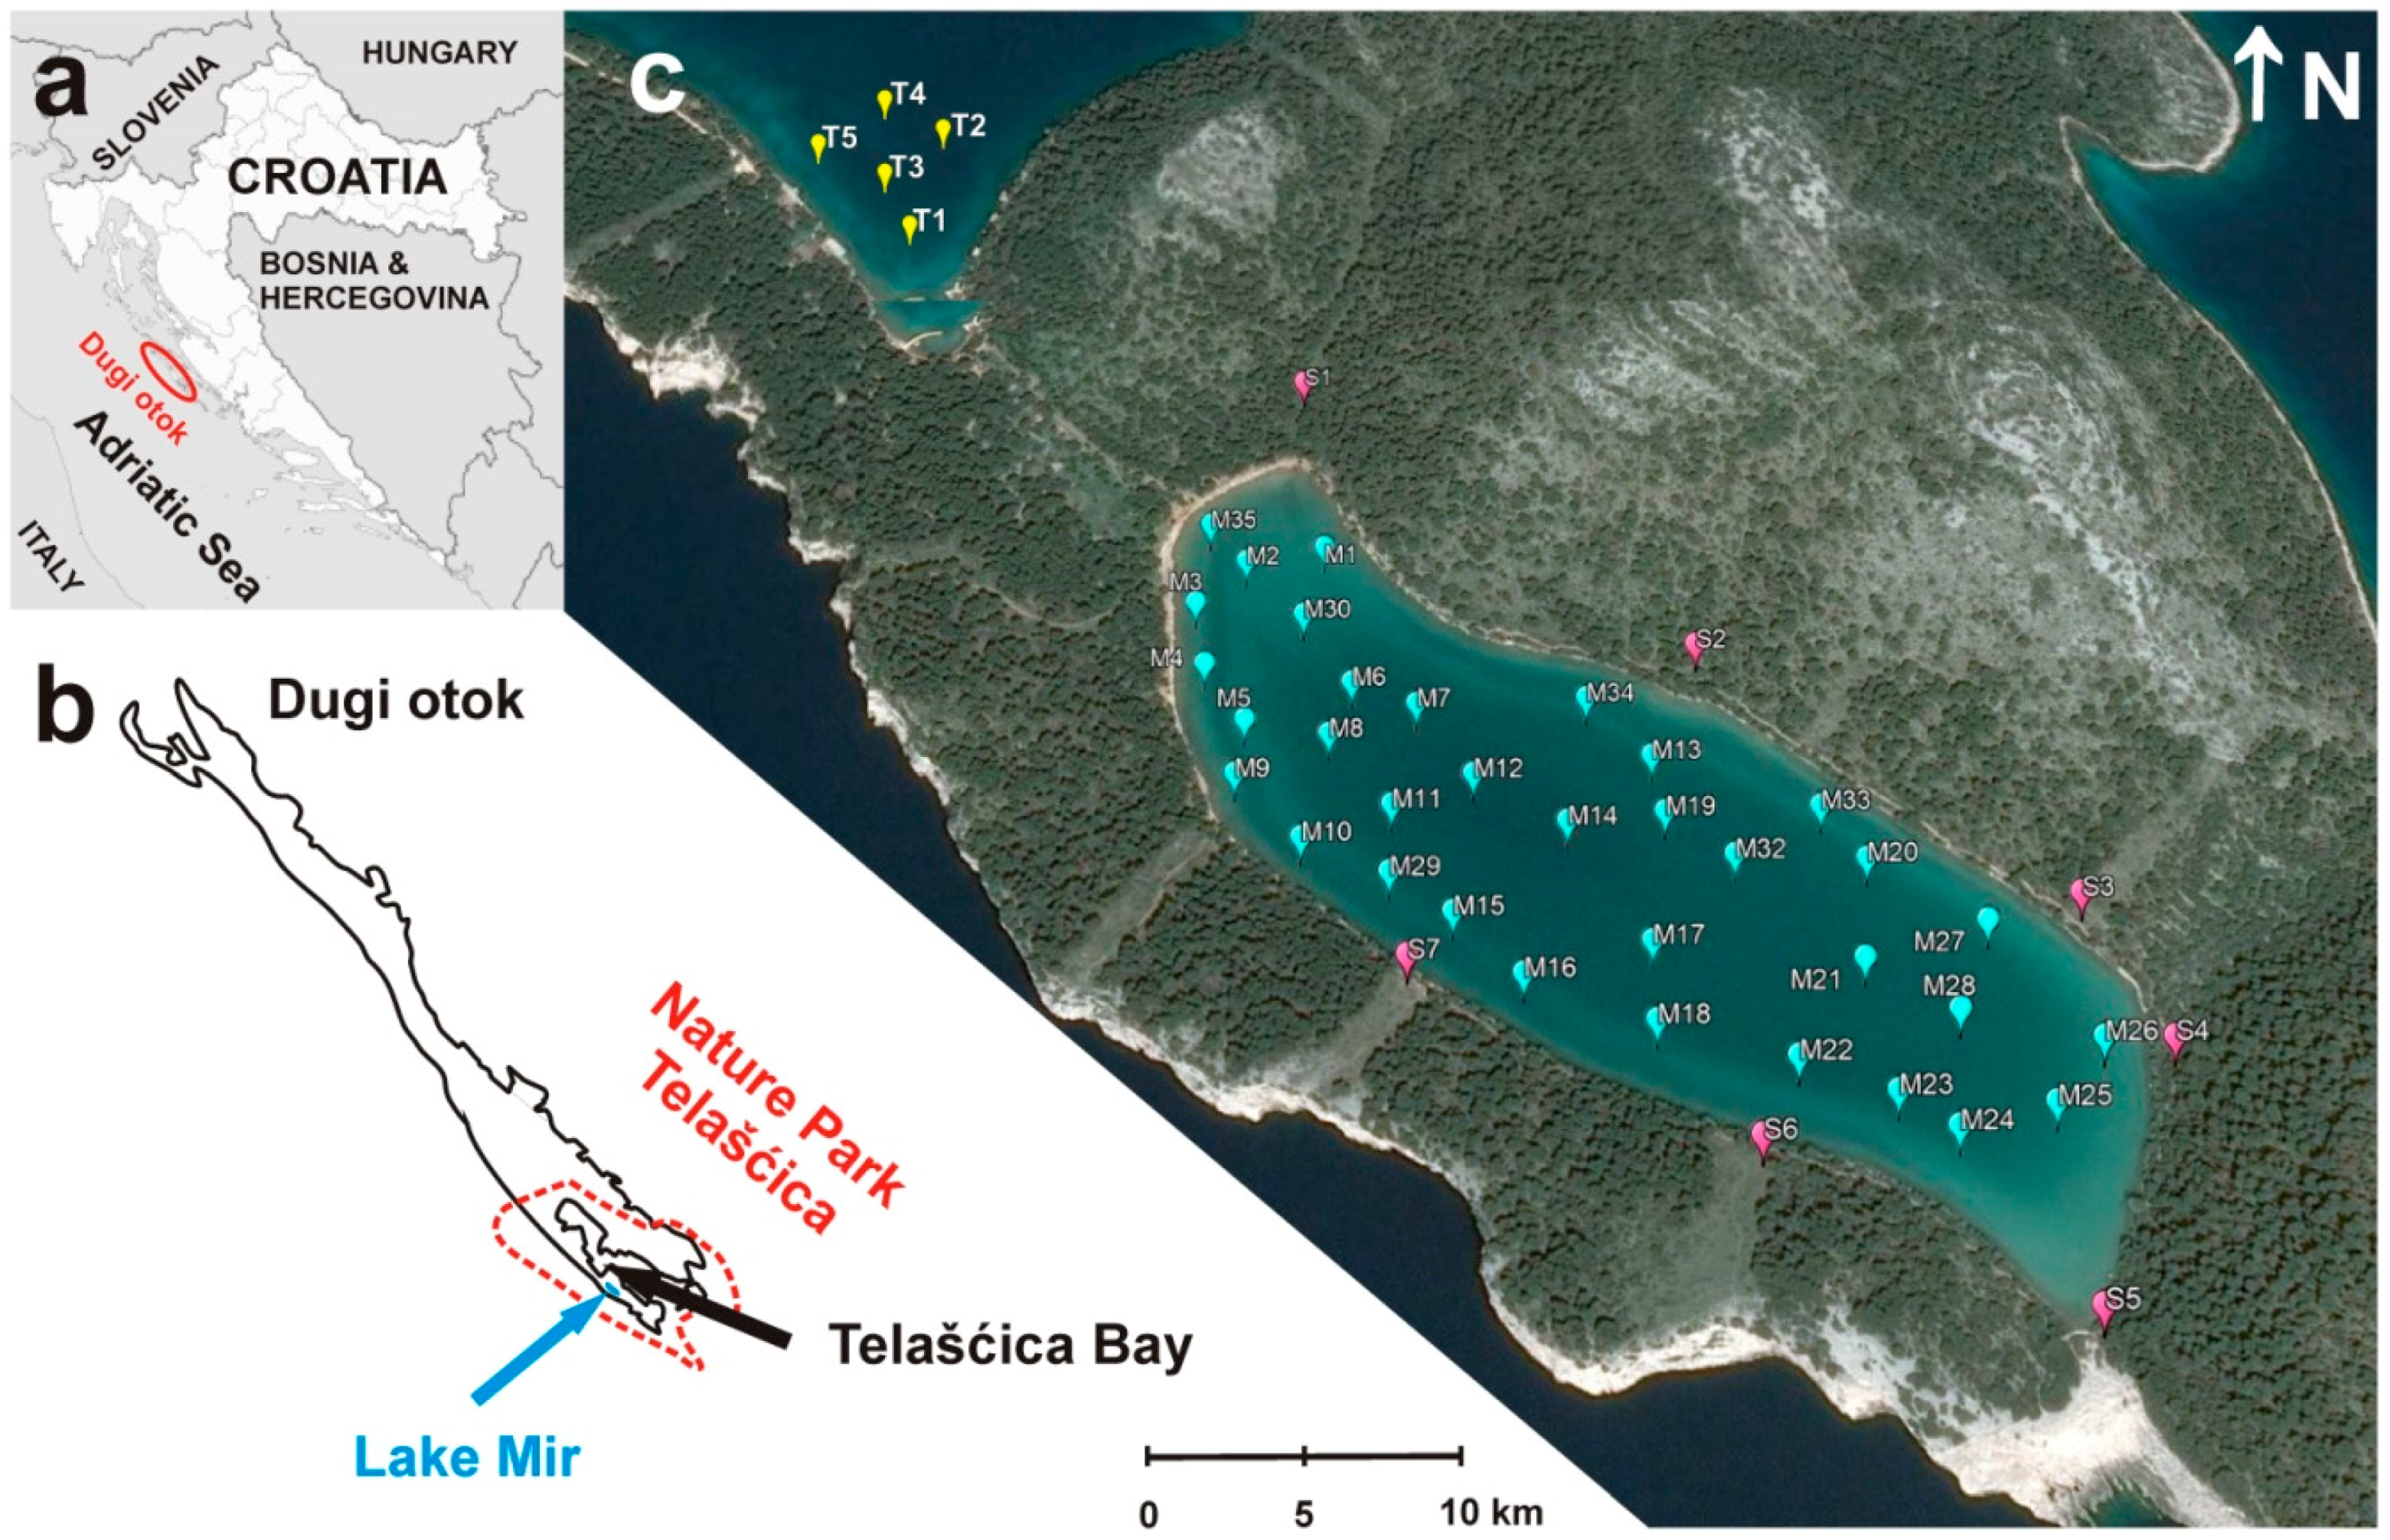
Figure 2.
The average concentrations of rare earth elements and Y in the Lake Mir sediments, the Telašćica Bay sediments, and soils surrounding the lake.
Figure 2.
The average concentrations of rare earth elements and Y in the Lake Mir sediments, the Telašćica Bay sediments, and soils surrounding the lake.

Figure 3.
The average REY patterns, normalized to North American Shale Composite, for studied sediments (a,b) and soils (c), with indicated standard deviation. (dashed line separates light rare earth elements (LREE) (La–Gd) from heavy REE (HREE) (Tb–Lu, including Y)).
Figure 3.
The average REY patterns, normalized to North American Shale Composite, for studied sediments (a,b) and soils (c), with indicated standard deviation. (dashed line separates light rare earth elements (LREE) (La–Gd) from heavy REE (HREE) (Tb–Lu, including Y)).
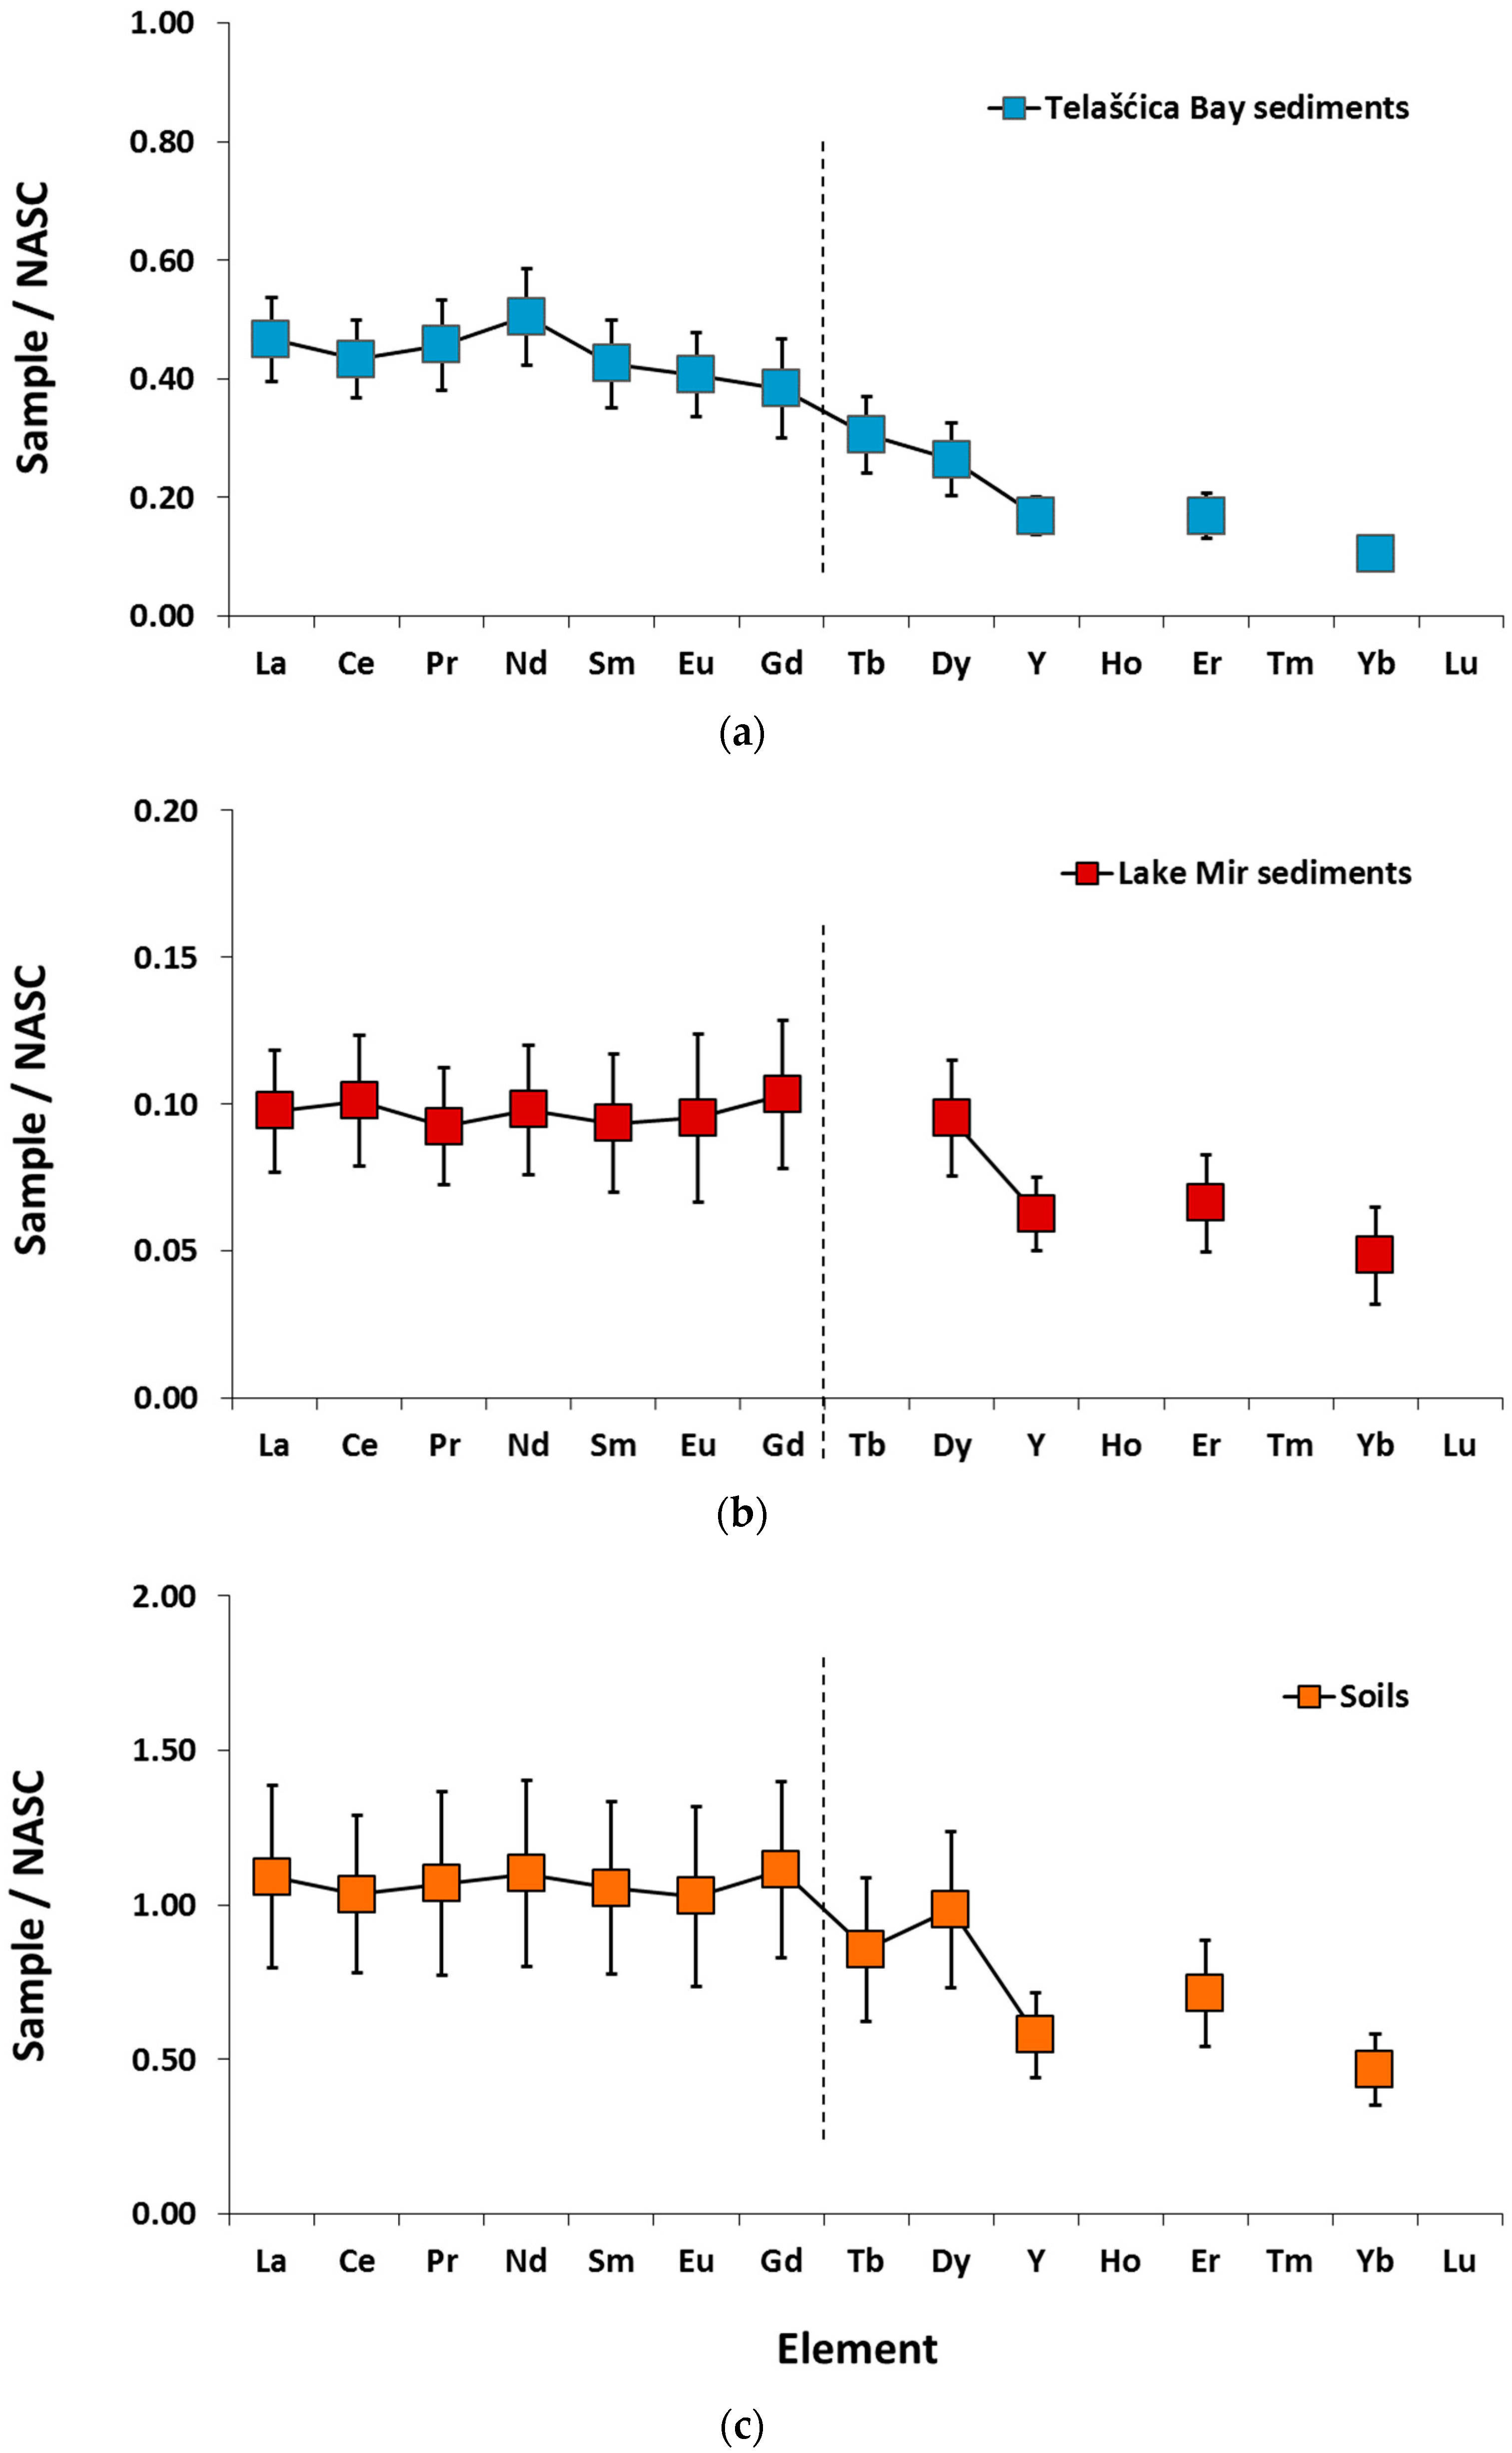
Figure 4.
Principal component analysis (PCA) loadings plots: (a) principal component (PC)1 vs. PC2, (b) PC2 vs. PC3.
Figure 4.
Principal component analysis (PCA) loadings plots: (a) principal component (PC)1 vs. PC2, (b) PC2 vs. PC3.

Figure 5.
PCA score plot for PC1 vs. PC2. Sampling locations divided into three groups according to the depth [10].
Figure 5.
PCA score plot for PC1 vs. PC2. Sampling locations divided into three groups according to the depth [10].

Table 1.
Basic descriptive statistical parameters for distribution of rare earth elements and Y concentrations, expressed in mg kg−1, in the Lake Mir and the Telašćica Bay sediments and soils.
Table 1.
Basic descriptive statistical parameters for distribution of rare earth elements and Y concentrations, expressed in mg kg−1, in the Lake Mir and the Telašćica Bay sediments and soils.
| La | Ce | Pr | Nd | Sm | Eu | Gd | Tb | Dy | Y | Ho | Er | Tm | Yb | Lu | ΣREY | |
|---|---|---|---|---|---|---|---|---|---|---|---|---|---|---|---|---|
| Soils | ||||||||||||||||
| min | 14.7 | 32.1 | 3.4 | 12.9 | 2.6 | 0.5 | 2.5 | 0.3 | 1.9 | 10.1 | 0.4 | 1.0 | 0.1 | 0.7 | 0.1 | 83.3 |
| max | 44.0 | 81.0 | 10.7 | 39.3 | 7.5 | 1.6 | 6.9 | 0.9 | 5.2 | 25.3 | 0.9 | 2.5 | 0.3 | 1.8 | 0.3 | 227 |
| avg | 33.9 | 68.9 | 8.2 | 30.2 | 5.9 | 1.2 | 5.5 | 0.7 | 4.1 | 20.3 | 0.7 | 2.0 | 0.3 | 1.4 | 0.2 | 184 |
| SD | 9.2 | 17.0 | 2.3 | 8.3 | 1.6 | 0.3 | 1.4 | 0.2 | 1.1 | 4.8 | 0.2 | 0.5 | 0.1 | 0.3 | 0.1 | 46.9 |
| Telašćica Bay Sediments | ||||||||||||||||
| min | 11.3 | 22.7 | 2.7 | 10.8 | 1.8 | 0.4 | 1.3 | 0.2 | 0.7 | 3.9 | 0.1 | 0.3 | <0.1 | 0.2 | <0.1 | 56.4 |
| max | 16.6 | 33.5 | 4.2 | 16.4 | 2.8 | 0.6 | 2.2 | 0.3 | 1.3 | 6.5 | 0.2 | 0.6 | <0.1 | 0.4 | <0.1 | 85.2 |
| avg | 14.5 | 28.9 | 3.5 | 13.8 | 2.4 | 0.5 | 1.9 | 0.3 | 1.1 | 5.9 | 0.2 | 0.5 | - | 0.3 | - | 73.8 |
| SD | 2.2 | 4.4 | 0.6 | 2.2 | 0.4 | 0.1 | 0.4 | 0.1 | 0.3 | 1.1 | 0.0 | 0.1 | - | 0.1 | - | 11.7 |
| Lake Mir Sediments | ||||||||||||||||
| min | 1.8 | 4.2 | 0.4 | 1.7 | 0.3 | 0.1 | 0.3 | 0.1 | 0.3 | 1.5 | 0.1 | 0.1 | <0.1 | 0.1 | <0.1 | 10.6 |
| max | 4.3 | 10.0 | 1.0 | 4.0 | 0.8 | 0.2 | 0.8 | 0.1 | 0.6 | 3.3 | 0.1 | 0.3 | <0.1 | 0.2 | <0.1 | 25.3 |
| avg | 3.0 | 6.7 | 0.7 | 2.7 | 0.5 | 0.1 | 0.5 | 0.1 | 0.4 | 2.2 | 0.1 | 0.2 | - | 0.1 | - | 17.2 |
| SD | 0.7 | 1.5 | 0.2 | 0.6 | 0.1 | 0.0 | 0.1 | 0.1 | 0.4 | 0.0 | - | 0.1 | - | 3.8 | ||
Min—minimum, max—maximum, avg—average, SD—standard deviation.
Table 2.
Calculated anomalies and fractionation indices for studied samples.
| Sample | EuN/EuN* | CeN/CeN* | (La/Yb)N | (Nd/Yb)N | Sample | EuN/EuN* | CeN/CeN* | (La/Yb)N | (Nd/Yb)N |
|---|---|---|---|---|---|---|---|---|---|
| M1 | 1.11 | 1.12 | 2.07 | 2.00 | M25 | 0.74 | 1.15 | 1.67 | 1.65 |
| M2 | 1.27 | 1.11 | 2.12 | 2.43 | M26 | n/a | 1.14 | n/a | n/a |
| M3 | 0.74 | 1.06 | 1.62 | 2.29 | M27 | 0.89 | 1.06 | 2.46 | 2.52 |
| M4 | n/a | 0.89 | 3.64 | 2.25 | M28 | 0.81 | 1.05 | 1.62 | 1.79 |
| M5 | 0.74 | 1.04 | 1.72 | 2.52 | M29 | n/a | 0.98 | 2.26 | 2.50 |
| M6 | n/a | 1.08 | n/a | 2.47 | M30 | 1.19 | 1.06 | 1.92 | 2.11 |
| M7 | 0.74 | 1.08 | 1.72 | 2.51 | M31 | 0.68 | 1.07 | 1.87 | 1.97 |
| M8 | n/a | 1.08 | 2.56 | 2.14 | M32 | 0.74 | 1.07 | 1.77 | 1.67 |
| M9 | n/a | 1.09 | 2.07 | 2.30 | M33 | 0.89 | 1.00 | 2.75 | 2.89 |
| M10 | 0.74 | 1.06 | 1.77 | 2.27 | M34 | 0.68 | 1.10 | 3.44 | 3.35 |
| M11 | n/a | 1.08 | 1.97 | 2.03 | M35 | n/a | 1.13 | 2.56 | 2.67 |
| M12 | 0.74 | 1.11 | 1.67 | 2.54 | T1 | 0.93 | 0.94 | 3.98 | 4.19 |
| M13 | 0.89 | 1.12 | 2.75 | 2.42 | T2 | 1.10 | 0.93 | 5.44 | 6.11 |
| M14 | 0.81 | 1.05 | 1.62 | 2.39 | T3 | 1.16 | 0.95 | 5.56 | 6.03 |
| M15 | 0.89 | 1.08 | 3.05 | 2.55 | T4 | 0.93 | 0.93 | 3.74 | 4.08 |
| M16 | 0.89 | 1.10 | 2.75 | 2.44 | T5 | 0.97 | 0.94 | 4.36 | 4.62 |
| M17 | n/a | 0.99 | 1.87 | 2.01 | |||||
| M18 | 0.89 | 1.06 | 1.43 | 2.25 | S1 | 0.95 | 0.98 | 2.33 | 2.34 |
| M19 | 0.89 | 1.05 | 2.95 | 2.56 | S2 | 0.95 | 0.98 | 2.27 | 2.28 |
| M20 | 0.81 | 1.03 | 1.62 | 2.46 | S3 | 0.96 | 0.99 | 2.37 | 2.40 |
| M21 | 0.81 | 1.04 | 1.62 | 2.42 | S4 | 0.95 | 1.00 | 2.34 | 2.36 |
| M22 | n/a | 1.08 | 2.66 | 2.11 | S5 | 0.87 | 1.05 | 2.07 | 2.06 |
| M23 | n/a | 1.07 | 2.66 | 1.91 | S6 | 0.92 | 0.92 | 2.44 | 2.46 |
| M24 | 0.89 | 1.01 | 2.75 | 2.47 | S7 | 0.99 | 0.85 | 2.41 | 2.44 |
EuN/EuN*—europium anomaly; CeN/CeN*—cerium anomaly; (La/Yb)N—ratio of La and Yb normalized concentrations; (Nd/Yb)N—ratio of Nd and Yb normalized concentrations; n/a—not applicable as a result of lack of data (concentrations below the limits of detection).
Table 3.
Comparison of average REY concentrations in the studied lake and bay sediments and local soils with literature data, expressed in mg kg−1.
Table 3.
Comparison of average REY concentrations in the studied lake and bay sediments and local soils with literature data, expressed in mg kg−1.
| Sediments | Terra rossa Soil | |||||||||||||
|---|---|---|---|---|---|---|---|---|---|---|---|---|---|---|
| Lake Mir * | Telašćica Bay * | Zrmanja Estuary, Croatia [15] | Bijagós Archipelago [32] | Cochin, India [35] | Odiel Spain [14] | Chesapeake Bay, USA [13] | Biscay, France [34] | Rijeka, Croatia [33] | Dugi Otok * | Zrmanja Estuary, Croatia [15] | Turkey [31] | China [30] | ||
| La | 3.04 | 14.5 | 23.5 | 4.4–22 | 14.0–51.5 | 30.1 | 15.0–120 | 7.03–27.7 | 10.7 | 33.9 | 13.1 | 86.0 | 69.7–385 | |
| Ce | 6.74 | 28.9 | 45.8 | 9.1–47 | 27.7–103 | 49.3 | 29.7–240 | 12.8–56.5 | 23.1 | 68.9 | 27.2 | 184 | 170–510 | |
| Pr | 0.71 | 3.52 | 5.10 | 0.9–5.0 | 2.77–10.0 | 8.29 | 3.01–26.4 | 1.74–6.63 | 2.91 | 8.2 | 2.92 | 18.9 | 15.0–160 | |
| Nd | 2.69 | 13.8 | 22.0 | 3.1–18 | 11.1–38.8 | 33.3 | 11.0–101 | 6.53–25.2 | 11.4 | 30.2 | 12.8 | 80.1 | 51.6–673 | |
| Sm | 0.52 | 2.38 | 3.85 | 0.52–3.3 | 1.93–6.91 | 7.70 | 1.87–17.4 | 1.19–4.93 | 2.49 | 5.9 | 2.33 | 14.0 | 9.24–225 | |
| Eu | 0.11 | 0.48 | 0.795 | 0.21–0.87 | 0.54–1.65 | 1.56 | 0.32–3.08 | 0.25–1.15 | 0.60 | 1.2 | 0.508 | 2.97 | 1.77–42.1 | |
| Gd | 0.51 | 1.88 | 3.02 | 0.49–3.0 | 1.37–5.67 | 7.71 | 1.61–14.3 | 1.06–4.36 | 2.59 | 5.5 | 1.99 | 10.4 | 6.46–109 | |
| Tb | <0.1 | 0.26 | 0.513 | - | 0.19–0.89 | 1.12 | 0.23–2.01 | 0.13–0.58 | 0.38 | 0.7 | 0.322 | 1.89 | 0.98–17.9 | |
| Dy | 0.40 | 1.1 | 2.61 | 0.35–2.1 | 1.01–4.92 | 6.28 | 1.05–10.5 | 0.64–3.04 | 2.00 | 4.1 | 1.82 | 11.0 | 5.47–70.4 | |
| Y | 2.19 | 5.91 | 13.1 | - | - | - | - | - | 11.3 | 20.3 | 157 | 56.6 | 26.1–76.5 | |
| Ho | <0.1 | 0.18 | 0.506 | 0.08–0.43 | 0.21–1.03 | 1.33 | 0.20–1.86 | 0.12–0.61 | 0.38 | 0.7 | 0.343 | 2.09 | 1.08–8.97 | |
| Er | 0.19 | 0.48 | 1.42 | 0.19–1.2 | 0.53–2.83 | 3.48 | 0.65–5.93 | 0.38–1.78 | 0.97 | 2.0 | 1.06 | 6.03 | 3.20–23.8 | |
| Tm | <0.1 | - | 0.179 | 0.039–0.18 | 0.08–0.39 | 0.54 | 0.09–0.83 | 0.05–0.29 | 0.11 | 0.3 | 0.157 | 0.918 | 0.521–4.61 | |
| Yb | 0.15 | 0.32 | 1.31 | 0.19–1.2 | 0.5–2.34 | 3.66 | 0.72–5.35 | 0.33–1.57 | 0.71 | 1.4 | 1.09 | 5.91 | 3.47–34.6 | |
| Lu | <0.1 | - | 0.245 | 0.039–0.19 | 0.08–0.36 | 0.56 | 0.10–0.96 | 0.04–0.23 | - | 0.2 | 0.156 | 0.885 | 0.549–4.93 | |
* This study.
© 2018 by the authors. Licensee MDPI, Basel, Switzerland. This article is an open access article distributed under the terms and conditions of the Creative Commons Attribution (CC BY) license (http://creativecommons.org/licenses/by/4.0/).
Share and Cite
MDPI and ACS Style
Fiket, Ž.; Mlakar, M.; Kniewald, G. Distribution of Rare Earth Elements in Sediments of the Marine Lake Mir (Dugi Otok, Croatia). Geosciences 2018, 8, 301. https://doi.org/10.3390/geosciences8080301
AMA Style
Fiket Ž, Mlakar M, Kniewald G. Distribution of Rare Earth Elements in Sediments of the Marine Lake Mir (Dugi Otok, Croatia). Geosciences. 2018; 8(8):301. https://doi.org/10.3390/geosciences8080301
Chicago/Turabian StyleFiket, Željka, Marina Mlakar, and Goran Kniewald. 2018. "Distribution of Rare Earth Elements in Sediments of the Marine Lake Mir (Dugi Otok, Croatia)" Geosciences 8, no. 8: 301. https://doi.org/10.3390/geosciences8080301
Note that from the first issue of 2016, this journal uses article numbers instead of page numbers. See further details here.