Combining Social Vulnerability and Physical Vulnerability to Analyse Landslide Risk at the Municipal Scale


Centro de Estudos Geográficos, IGOT-Universidade de Lisboa, 1600-276 Lisboa, Portugal
*
Author to whom correspondence should be addressed.
Geosciences 2018, 8(8), 294; https://doi.org/10.3390/geosciences8080294
Submission received: 30 June 2018
/
Revised: 27 July 2018
/
Accepted: 30 July 2018
/
Published: 7 August 2018
Abstract
:In this work residents’ social vulnerability and buildings’ physical vulnerability of the Loures municipality (Portugal) were combined to locate the areas where the vulnerability is the highest, and to analyse the landslide risk. The social vulnerability of Loures was assessed using the Geographic Basis for Information Reference (BGRI) terrain units by combining sensitivity and lack of resilience based on the population and housing Census 2011 data. The physical vulnerability was assessed in a previous study based on an inquiry of a pool of European landslide experts and a sub-pool of landslide experts who know the study area. A matrix approach was used to cross the classes of the social and physical vulnerabilities. Finally, the landslide risk was analysed for each terrain unit considering the combined vulnerability, the buildings’ economic value and the landslide susceptibility for a specific landslide magnitude (3-metre-deep rotational slide). Results show that 0.9% of the population reside in the area of the municipality where 75% of the future landslide should occur, and 0.8% of the buildings of the municipality—which represent a value of EUR 146,170,000—are also located in this dangerous area. This approach is reproducible: the risk analysis can be applied for another magnitude scenario in Loures, and the combined vulnerability can be assessed in any Portuguese municipality thanks to the availability of the data.
1. Introduction
Landslides affect exposed populations worldwide, causing damage, fatalities and injuries. In Portugal, landslides are quite frequent and have been responsible for damage and disruption on roads and buildings. Damage caused by landslides can be reduced with adequate policies and practices. For that, it is mandatory to assess landslide hazard and vulnerability to analyse the landslide risk in order to improve disaster preparedness and prevent losses [1].
Most of the definitions of vulnerability to natural disasters agree to state that the vulnerability is: (1) multi-dimensional, as it has several facets (e.g., physical, social, economic, environmental, institutional); (2) dynamic, because it changes over time; (3) intrinsic of any community; (4) scale-dependent, given that it can be expressed at different scales from human or household to country resolution; and (5) site-specific, which implies that each study area might need its own approach [2]. Nevertheless, these dimensions are rarely considered all together in a vulnerability assessment. Indeed, most of the scientific studies which assess the vulnerability to natural hazards examine only one facet of the vulnerability of the elements at risk—most of the time, either the social vulnerability or the physical vulnerability.
Social vulnerability characterises the inequalities which define the predisposition or susceptibility of social groups in the context of a disaster [3,4]. The concept of social vulnerability is complex [5]; indeed, it is itself a multi-faceted entity and authors use this term with different meanings [6], some of them are presented in the Table 1.
Moreover, some approaches to assess social vulnerability are based on the assessment of intangible losses, whereas other approaches are based on the underlying socioeconomic factors that are responsible for vulnerability in a society [5]. Social vulnerability is commonly measured by indexes which are based on a set of socioeconomic indicators (e.g., age, gender, disability) which can either be weighted (e.g., by expert judgement, analytic hierarchy, Principal Component Analysis (PCA), factor analysis or multiple regression models) or not (if all indicators are assumed to have an equal significance). The indicators are then combined, often by an additive combination when the factors are independent or by a multiplicative combination when the utility of one factor depends on another factor, or even by an association of both additive and multiplicative combinations [12]. The obtained social vulnerability can then be combined with the hazard assessment to evaluate risk, e.g., [13,14].
Physical vulnerability is a functional relationship between process magnitude, the impacts on structural elements at risk and exposed values [15]. Physical vulnerability of buildings is defined by the expected degree of loss resulting from the impact of a certain event. Its assessment requires the evaluation of different parameters and factors such as type of element at risk, resistance, and implemented protective measures (i.e., local structural protection) [15]. In physical geography and in engineering geology, most of the studies consider the vulnerability to a hazardous event of a given magnitude as being the degree of loss of elements at risk expressed in a scale ranging from 0 (no loss) to 1 (total loss), e.g., [16,17,18,19,20]. From this definition emerged a wide range of vulnerability assessment models, each study addressing vulnerability in a different way [21]. These different models partly depend on the different scales of the vulnerability assessment [22], and on the purpose for which the vulnerability assessment method was made. Some models are based on the collection and analysis of the registered damage in recent historic events, as it is usually done for relatively frequent events such as floods or earthquakes, which allows the construction of vulnerability curves by correlating the magnitude of the event and the degree of damage. When there is not enough available information regarding the caused damage, the physical vulnerability can be measured through expert opinions. For example, landslide experts can give their opinion on the potential damage that can be caused to a specific type of element at risk by a landslide that has a certain magnitude, and the vulnerability assessment would be based on their answers. This method is time-consuming because numerous experts must be interviewed to obtain results with a lower subjectivity.
In literature, few studies have the ambition to assess simultaneously several facets of the vulnerability to landslides. Léone was one of the pioneers as he proposed a method to assess the corporal (for people), structural (for material goods) and functional (for activities) facets of vulnerability to landslides and presented them in matrices [23]. More recently, Shrestha proposed a method to assess the socioeconomic and physical vulnerabilities to landslides and floods in Putalibazaar, Nepal [24]. In its study, total vulnerability was assessed by combining the physical and socioeconomic vulnerabilities which are functions of the landslide magnitude, the physical exposure indicators (number of households, total population, agricultural land area and road length), and the capacity of adaptation indicators (e.g., accessibility, health, communication). Perception of disaster by the population and by governmental and nongovernmental organisations was also assessed by questionnaires. Alexander proposed a method based on the vulnerability of buildings, structures, human lives and socioeconomic activities, which can be used at three levels: single asset; summed assets; and generalised assets [25]. Puissant and co-authors created an index to assess the potential damage which can be caused by landslides [26]. The index is called Potential Damage Index (DPI), and was elaborated to assess the potential physical injuries, structural and functional damage, and socioeconomic effects. This index has been used as a base in other studies: for example, Carlier and co-authors used it to assess the direct and indirect consequences of landslides in the Upper Guil catchment, an area of the PACA region in France [27]. Recently, Murillo-Garcia and co-authors proposed a method to assess the vulnerability to landslides by combining the exposure level of the population and the infrastructures, the sensitivity of the population and its lack of resilience [28]. The exposure is calculated from data regarding population and hazard, the sensitivity of the population is composed by social indicators (e.g., population density, youngest and oldest population, female population, indigenous population), and the lack of resilience is composed by indicators dealing with incomes, economically active population, health insurance and road characteristics. The combination of the different facets of the vulnerability considered in this study is interesting, though the physical vulnerability of the buildings is not assessed, and the possible application of the vulnerability assessment is not clearly defined.
The present study aims to combine the social vulnerability of residents and the physical vulnerability of buildings in order to analyse landslide risk in a municipality located in the Lisbon region, Portugal. It was developed on the continuation of previous studies in the Loures municipality, the first one regarding the landslide susceptibility assessment [29] and the second devoted to the physical vulnerability of the buildings to landslides [30]. The paper is organised as follows: First are described the data and methods used: (1) to assess the social vulnerability of the Loures municipality; (2) to assess the physical vulnerability of the buildings of Loures; (3) to combine physical and social vulnerability to landslides; and (4) to assess the landslide risk. Then, the presentation of the results is made as follows: (1) social vulnerability map; (2) five physical vulnerability maps (one per each landslide magnitude); (3) five combined vulnerability maps; (4) one table represents the landslide risk analysis of the resident population and a second table represents the landslide risk analysis for the buildings. Finally, a discussion about the results precedes some concluding remarks.
2. Materials and Methods
2.1. Study Area
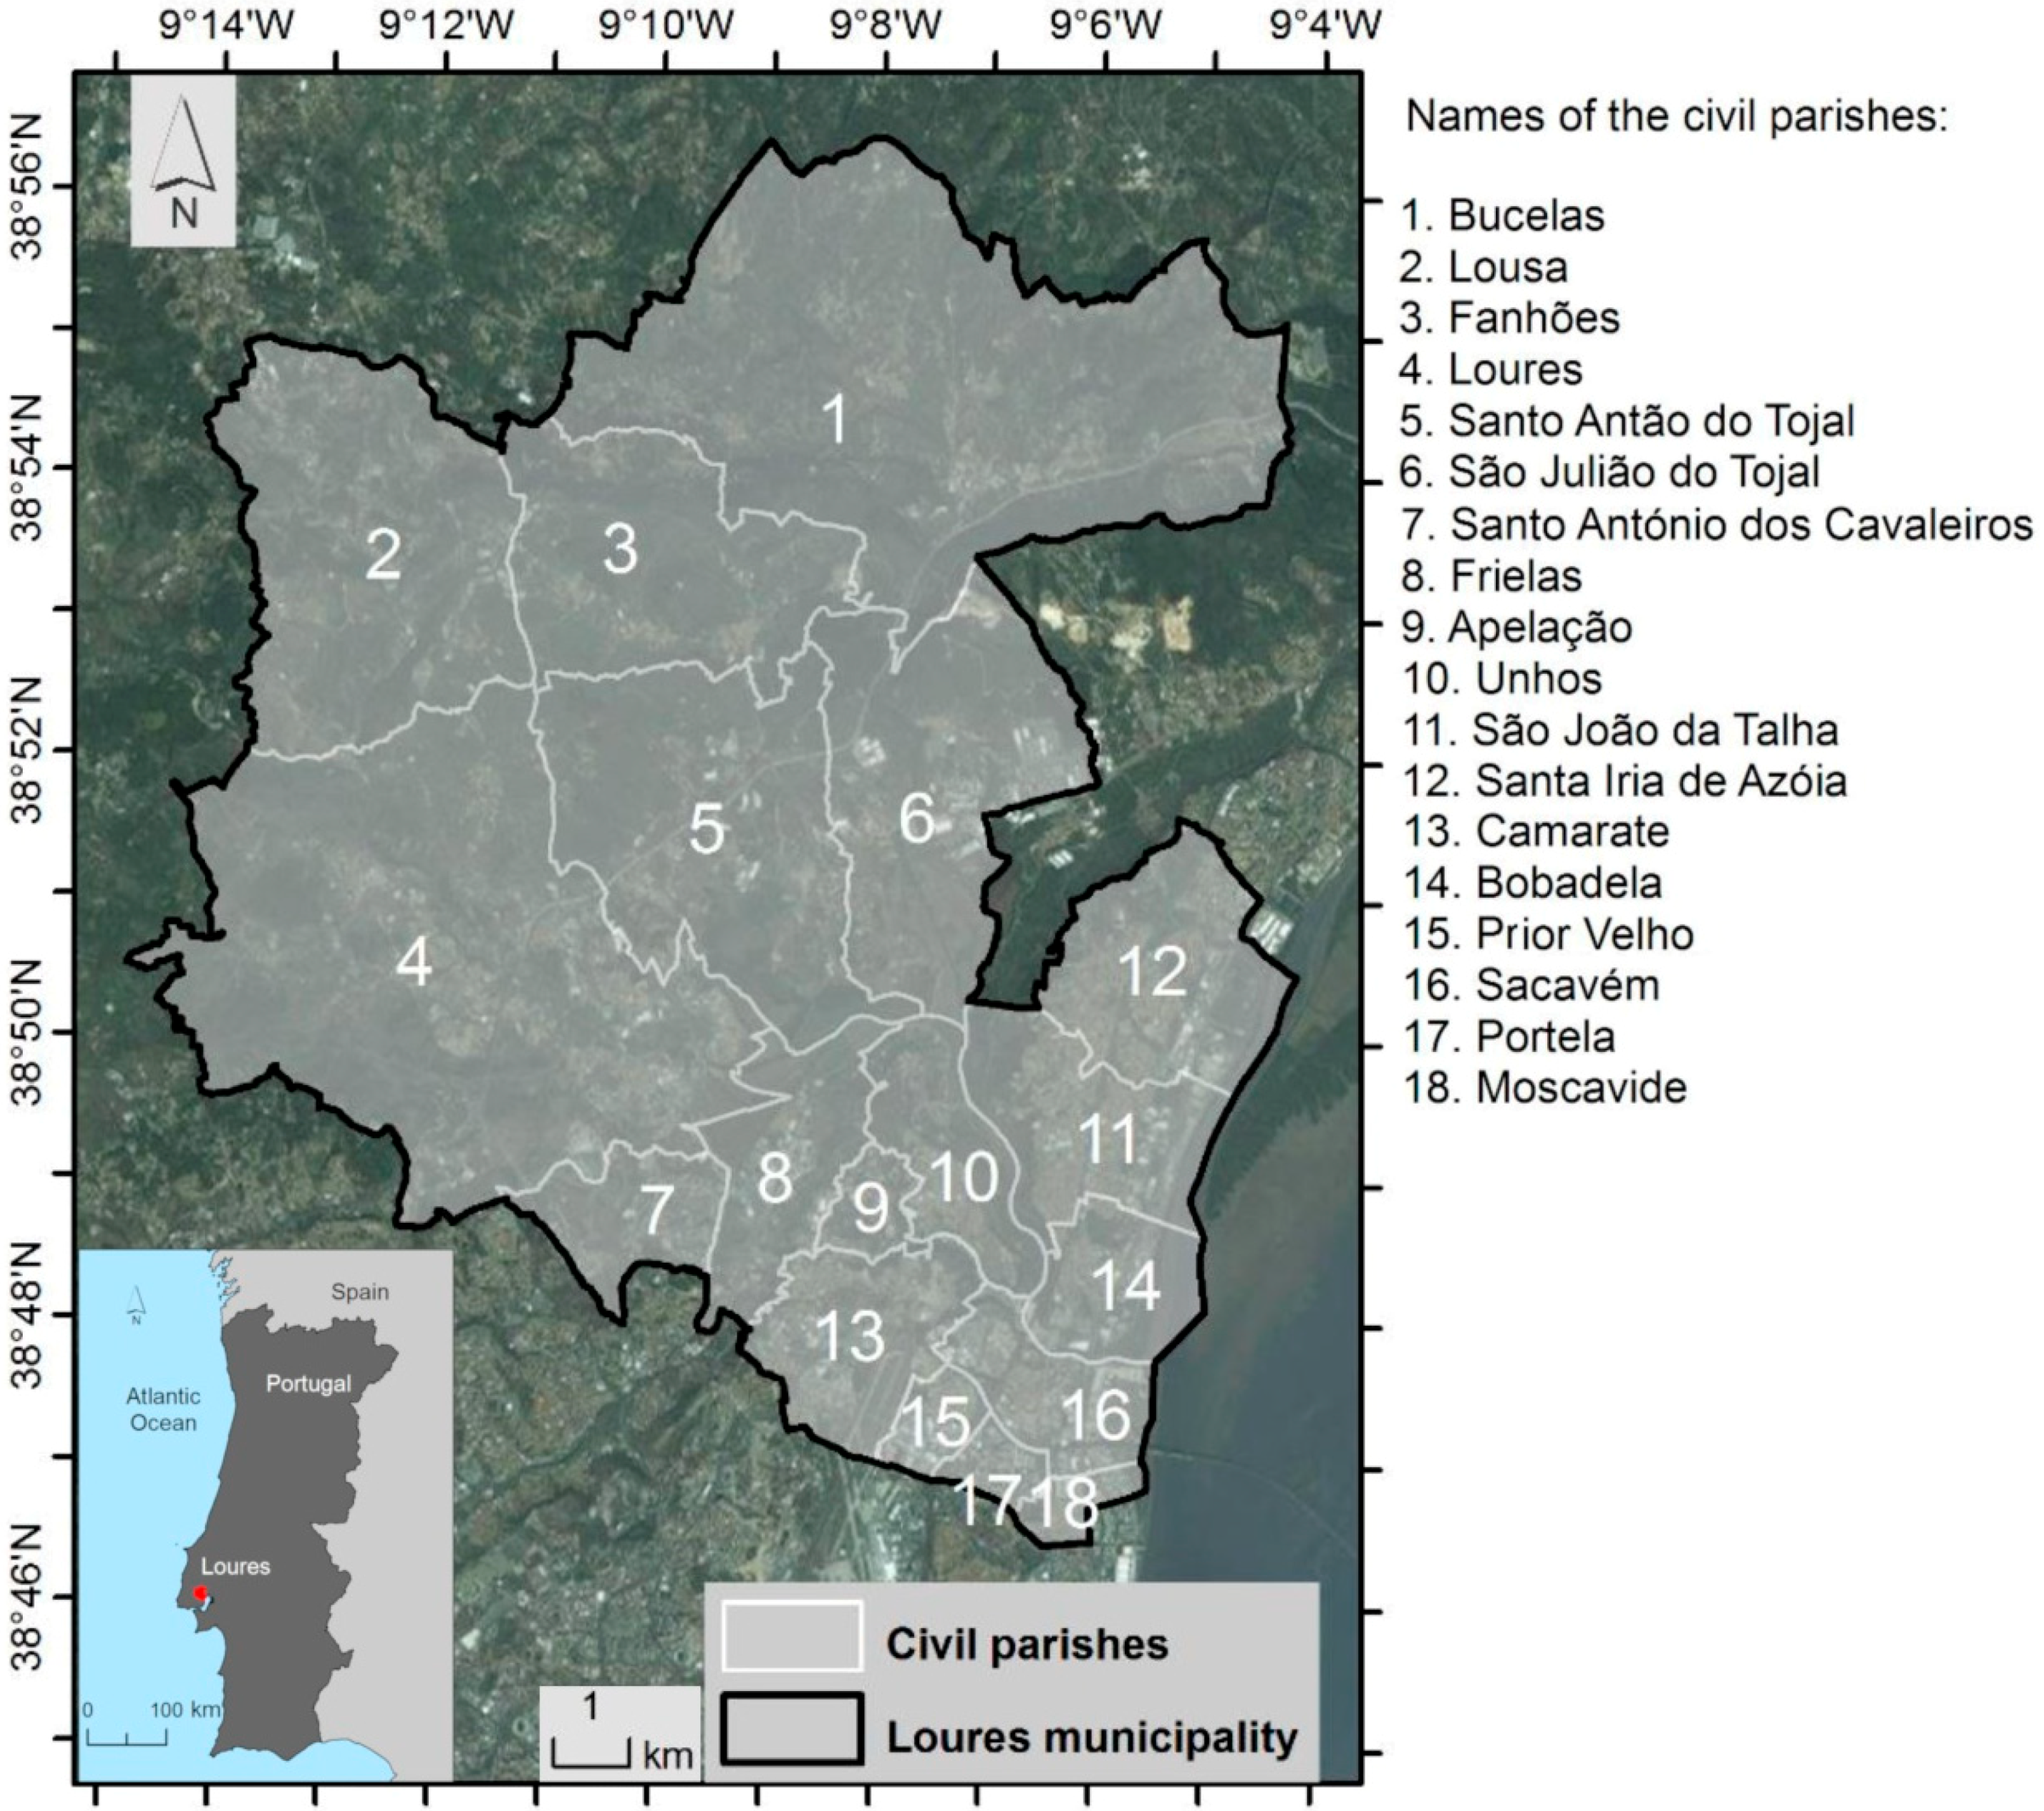
The study area is the Loures municipality, where landslide hazard and risk have been extensively studied during the last decades (e.g., [29,30,31,32,33,34,35,36]). Its area is about 169.3 km2 and 205,054 persons were living in this municipality in 2011 [37]. Loures municipality is included in the Greater Lisbon and is composed by 18 civil parishes (Figure 1). The choice of this study area was driven by five reasons: (1) Loures municipality is prone to landslide occurrence [29,31]; (2) data about landslides and types and location of elements at risk were available for this study area [29,30]; (3) this municipality is next to Lisbon, the capital of Portugal, and has been experiencing an increasing urbanisation in the last 50 years [31]; (4) the stakeholders of the municipality are conscious that there is a need of natural risk reduction in the municipality and previous studies have identified the landslide prone areas that must be included in the Natural Ecological Reserve [29,32]; and (5) the physical vulnerability of the buildings of the Loures municipality was assessed in a previous study [30].
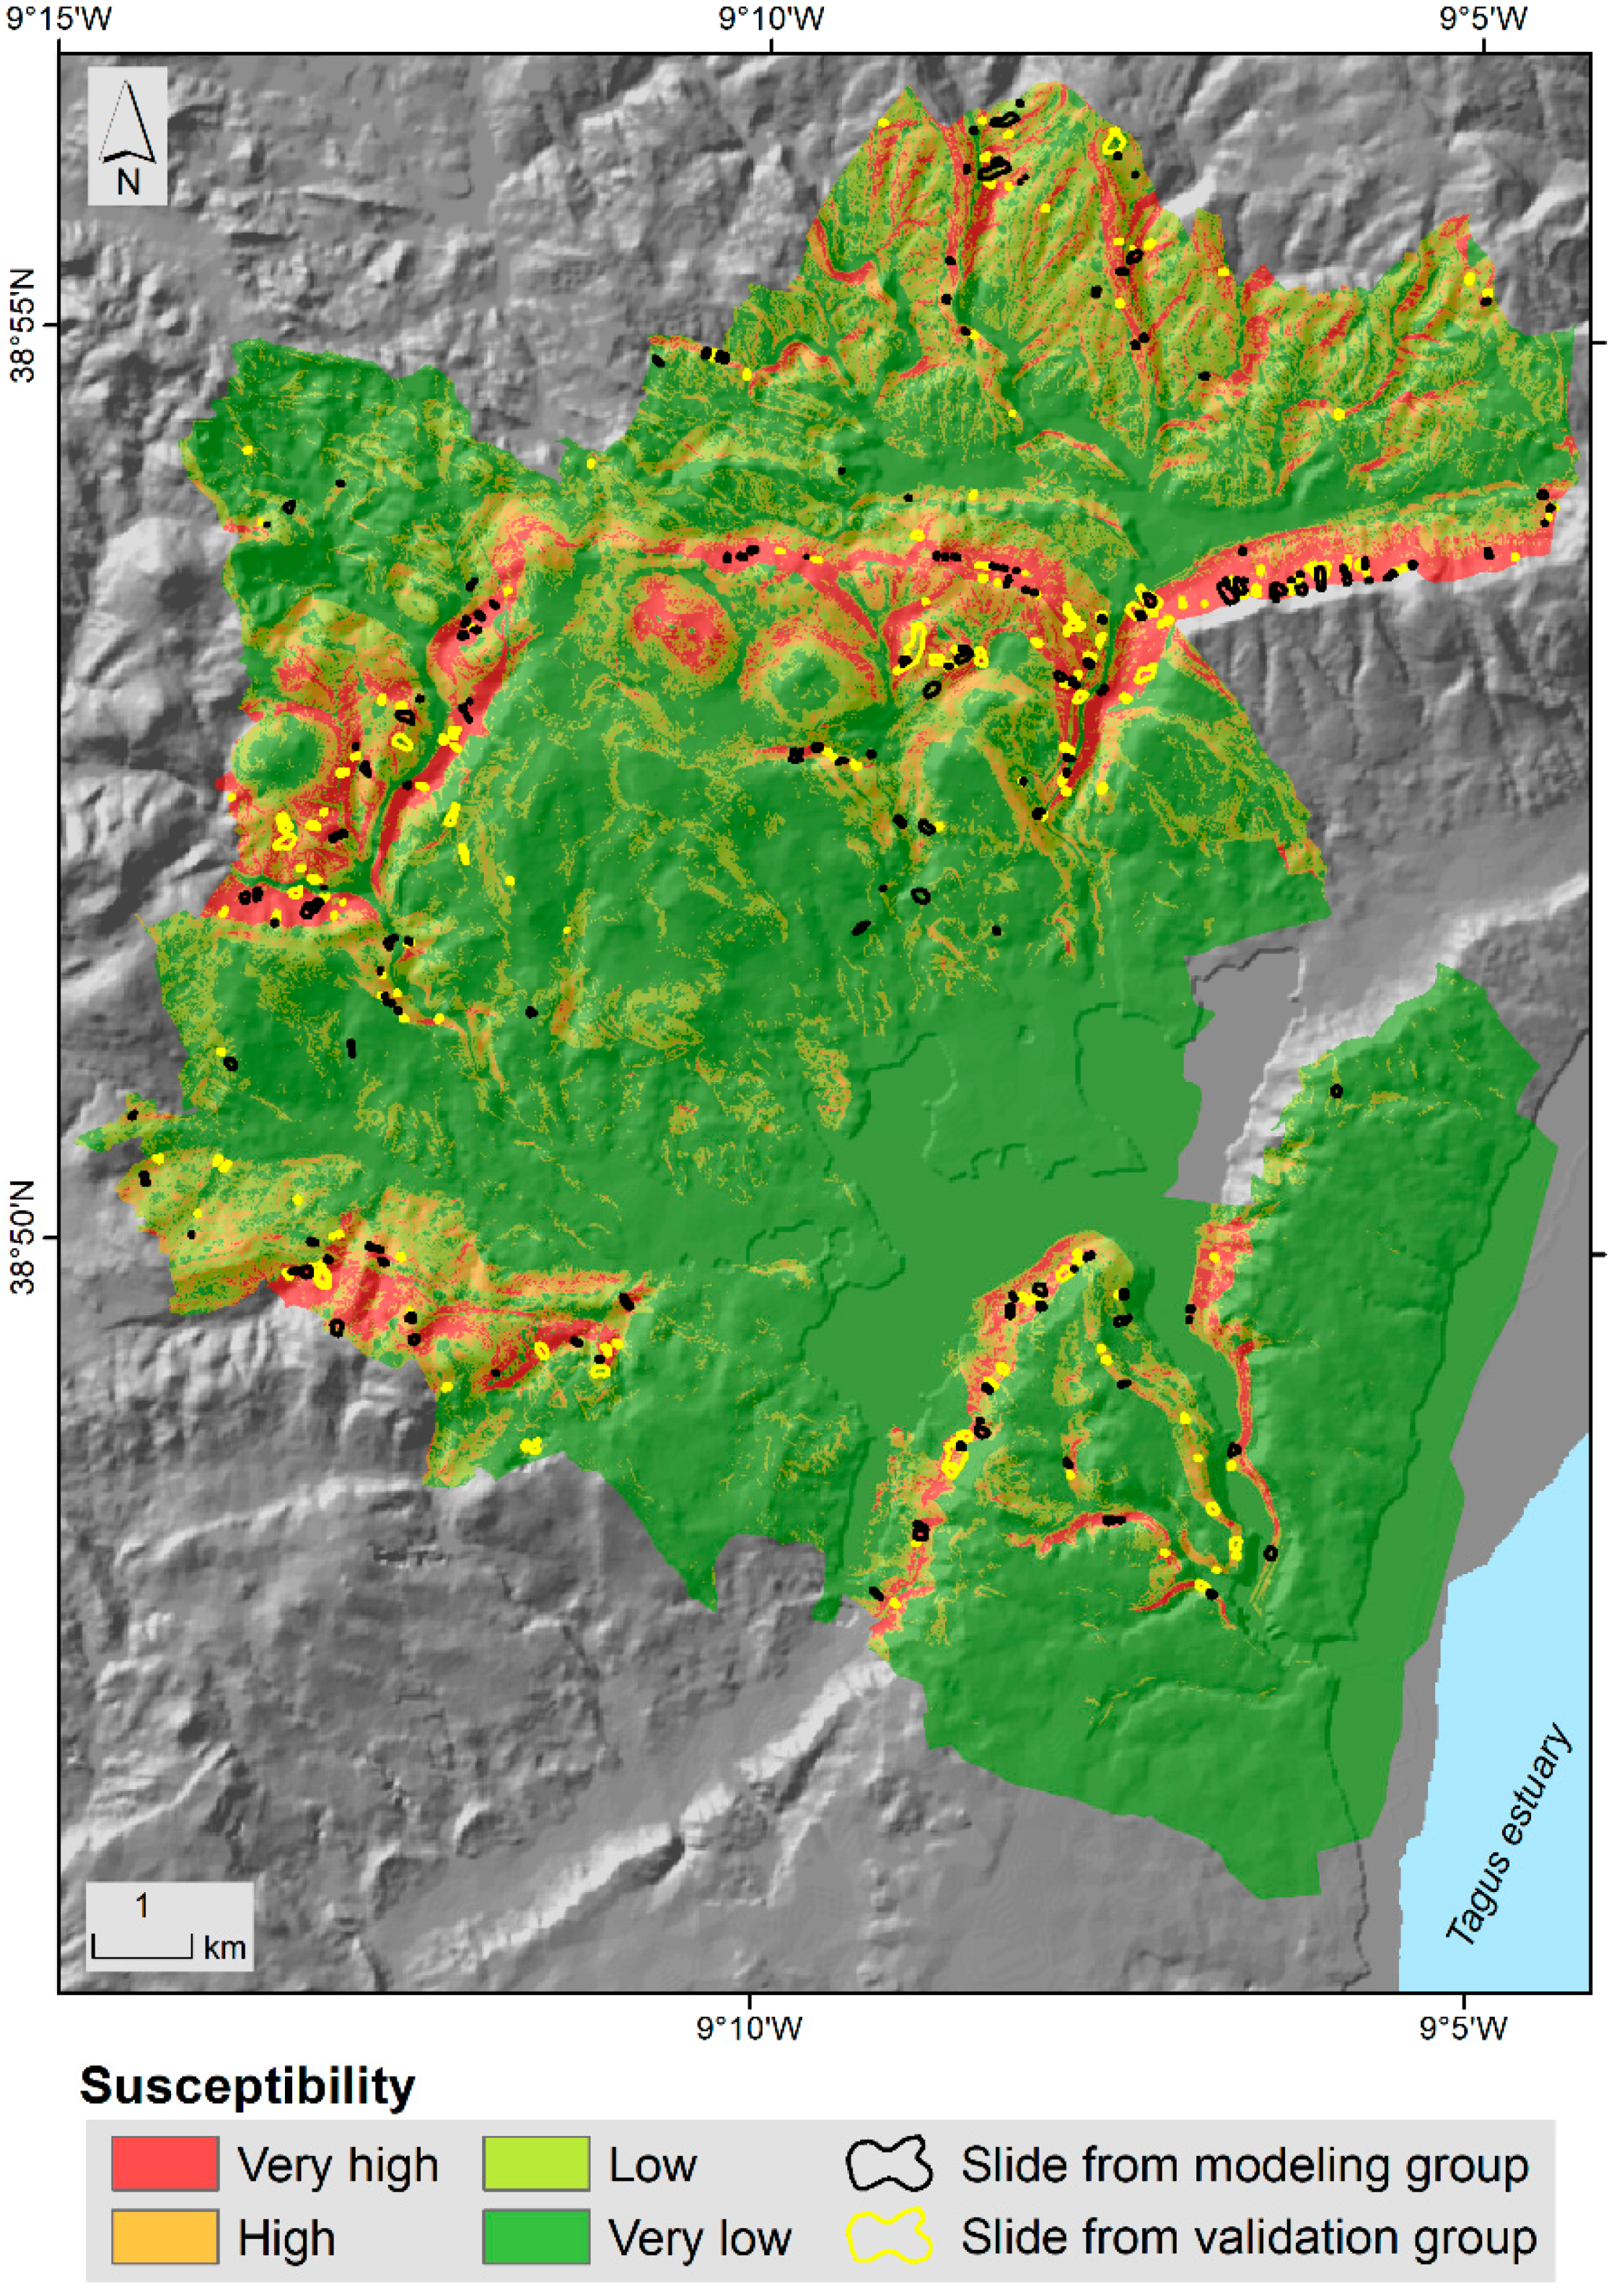
The susceptibility to various types of landslides in the Loures municipality was assessed in previous studies, e.g., [24]. In the present study, only the susceptibility to deep-seated rotational slides (slip surface depth > 1.5 m) was considered. The susceptibility was assessed and validated using a bi-variate statistical method called information value method [38] using a landslide inventory composed by 353 deep-seated slides (average area 3806 m2). The susceptibility assessment used in this study comes from previous research [29,30] and is shown in Figure 2.
We chose, as mapping unit to assess vulnerability, the smallest statistical unit, which is the Geographic Basis for Information Reference subsection (BGRI). The BGRI units are the basic geographic entities used for the 2011 census operations, which divide each basic administrative unit (which is the civil parish) into sections and subsections. The BGRI subsections are territorial units, whether built-up or not, which represent a block in urban areas, a locality or part of a locality in rural areas, or residual areas which may or may not have dwellings [37]. Their boundaries were defined by the National Institute of Statistics (INE), and the statistical information was also collected by the INE. The Loures municipality is composed by 2942 BGRI subsections, which are sized from 0.05 to 626.78 hectares having for average 5.77 hectares.
2.2. Assessment of the Social Vulnerability
The social vulnerability was here defined as the average of the sensitivity of the population and its lack of resilience (adapted from Murillo-Garcia and co-authors [28]), as shown in the Equation (1).
The social vulnerability indicators that were chosen to compute the sensitivity and the lack of resilience of the Loures municipality were obtained from the National Institute of Statistics (INE) census at the BGRI level. Relative to the Murillo-Garcia and co-authors formulas [28], we chose to consider only the sensitivity and lack of resilience of the population as parts of the vulnerability, excluding thus its exposure to the landslides, which is considered later in the study as a part of the risk analysis. Moreover, we considered the average of the indicators and not the power of their multiplication as Murillo-Garcia and co-authors did [28], in order to have values of sensitivity, lack of resilience and social vulnerability ranging between 0 and 1, being 0 the minimum and 1 the maximum.
Some of the indicators had to be adapted due to the availability of the data and the context (see Table 2). The indicators with an asterisk were not used by Murillo-Garcia and co-authors [28].
In total, ten indicators were used to quantify the social vulnerability at the BGRI scale, five for the sensitivity (Equation (2)) and five for the lack of resilience (Equation (3)).
where DP represents the population density; YP represents the population younger than 13 years old; OP represents the population older than 64 years old; FP represents the female population; and IP represents the illiterate population.
where WA represents the number of persons without financial activity; UNEMP represents the unemployed population; NDEV represents the dwellings without water, WC, sewer or bathroom; RDW represents the rented dwellings; and RLC represents the reclassified location coefficient.
All the indicators used in the Equations (1)–(3) were linearly rescaled from 0 to 1, where 1 characterises the maximum vulnerability. The social vulnerability values range therefore also between 0 and 1.
The social vulnerability coming from the average of the sensitivity and the lack of resilience was classified into five classes using a standard deviation classification (Table 3).
2.3. Assessment of the Physical Vulnerability of Buildings
The physical vulnerability of the buildings of the Loures municipality was assessed for different landslide magnitude scenarios in a previous study by calculating the average vulnerability attributed by a pool of European landslide experts and by a sub-pool of landslide experts who know the study area [30]. The experts attributed a vulnerability value to the buildings of the Loures municipality, which had been classified into 4 classes regarding their structural types: (1) wood or metal (light structures); (2) adobe, rammed earth, or loose stone walls; (3) brick or stone masonry walls; (4) masonry walls confined with reinforced concrete. Indeed, as the properties of the foundations of all the buildings in Loures are not known, as it is often the case for a municipality or a region because of the large number of elements at risk, the structure of the buildings had been used as a proxy to estimate their resistance capacity. Second, as the vulnerability varies according to the landslide magnitude and to the position of the building on a landslide, five landslide magnitude scenarios were considered assuming different depths of the slip surface (1, 3, 5, 10, and 20 m). The maximum slip surface depth correspond to the value of the largest landslide inventoried in the study area [33,39]. The variability of the answers given by the experts had been assessed by calculating the standard deviations. The average vulnerability, based on the structural type of the buildings, had been calculated at the basic geographic entity (BGRI) level. The present study considers the physical vulnerability values obtained in the previous study [30], classified into four classes (Table 4).
2.4. Combination between the Social Vulnerability and the Physical Vulnerability of Buildings
The classes of the social vulnerability (Table 3) and the physical vulnerability (Table 4) were summed to obtain the combined vulnerability (Table 5).
The combined vulnerability values were computed for the five landslide magnitude scenarios and the resulting maps are shown in the Results Section 3.3.
2.5. Landslide Risk Analysis
The landslide risk is defined as the product of the landslide hazard, the vulnerability and the value of the elements at risk [16,33,40].
Landslide hazard is characterised by the probability of occurrence within a specified period of time and within a given area of a potentially damaging phenomenon [16] having a given magnitude [41], which is typically measured with the landslide area or the landslide volume [42]. In this study, the temporal probability is not accounted for, due to the lack of data needed to characterize the recurrence time of landslides. Therefore, hazard is substituted by susceptibility, which express the potential for landslide occurrence as a function of geo-environmental and morphological controls. A previous study demonstrated that the 3-metre-deep landslides are the ones which generate the highest risk values in the Loures municipality due to their relatively high frequency combined with a substantial potential damage [30]. Therefore, to assess the risk in the present study, the value of 3-metre-deep landslide was chosen. Nevertheless, it is possible to assess the risk in the same way for any landslide magnitude scenario.
In the case of this study, the landslide risk was analysed by table crossing the landslide susceptibility, the combined vulnerability and the elements at risk, following Koks and co-authors [43]. In the present study two types of elements at risk were considered: the population and the built environment. That is why landslide risk is presented in two tables in the Results Section 3.4, the first one considering the exposure of the resident population, and the second one considering the economic value of the buildings.
In order to assess the exposure of the population and the buildings, the resident population of each BGRI subsection provided by the census of the INE was considered, as well as the buildings location that was provided in vector format by the Loures Municipality (Direcção de Projecto do Plano Director Municipal, or DPPDM). Because the number of residents per building was not available, the resident population per BGRI was distributed into each residential building of the BGRI by dasymetric mapping in function of the area of each building [44], in order to estimate the number of residents in each susceptibility class and in each combined vulnerability class. In addition, the physical vulnerability calculated for each BGRI unit was ascribed for the total buildings existing in the BGRI.
The economic values of the buildings of the Loures municipality were calculated in a previous study [30], using the Equation (4):
where EV is the market economic value; ACC is the average cost of construction; TA is the total area; FC is the functionality coefficient; LC is the location coefficient; and AC is the age coefficient.
EV = ACC × TA × FC × LC × AC
Finally, the landslide risk was analysed at the pixel basis by crossing the landslide susceptibility and the buildings, the later containing the information of combined vulnerability and the economic value.
3. Results
3.1. Assessment of Social Vulnerability for the BGRI Terrain Units
The social vulnerability was assessed at the BGRI scale (Figure 3). This assessment was based on the average of the sensitivity and the lack of resilience, themselves based on ten indicators provided by the Portuguese census and by the Portuguese Tax Services (Law Number 64-B/2011 of 30 December).
Some few BGRI subsections (162 out of 2942) of the Loures municipality do not have any referenced building and were represented as white polygons in Figure 3. The social vulnerability of the 2780 remaining BGRI subsections of the Loures municipality range from 0.03 to 0.92; the mean is 0.48 and the standard deviation is 0.11. The vulnerability values were classified into 5 classes with the standard deviation classification in order to highlight the extremes values. 3.5% of the BGRI subsections are in the highest class, represented in red in Figure 3 (vulnerability > 1.5 Std. Dev); 22.0% of the BGRI subsections are in the second highest class, represented in orange in Figure 3 (vulnerability between 0.50 and 1.5 Std. Dev.). The size of the BGRI subsections is not representative of the number of residents (the population density is quite variable in the municipality). For instance, in Moscavide civil parish (number 18 in Figure 1), there are 32 subsections with a very high social vulnerability; their area is small but their mean population density is high (42 hab./km2 for a total area of 0.15 km2) with respect to the large BGRI subsections with a very high social vulnerability of other civil parishes (e.g., the 4 largest BGRI subsections of the Loures civil parish (number 4 in Figure 1), which have a total area of 4.72 km2 and a mean population density of 23 hab./km2).
3.2. Physical Vulnerability
Physical vulnerability was assessed for five landslide magnitude scenarios depending on the depth of landslide slip surface. Figure 4 shows the physical vulnerability for buildings located on the body of the slide, assuming different depths of the slip surface (1, 3, 5, 10, and 20 m). The mapping unit is still the BGRI subsection.
As expected, the physical vulnerability increases with the landslide magnitude. All the BGRI subsections have a high or very high physical vulnerability for a slip surface above 5 m (see Figure 4). However, these scenarios are not the most frequent of the Loures municipality. If we take into account not only the vulnerability of the buildings but also the frequency of the landslides, the risk is the highest for the 3-metre-deep landslides [30]. That is why this is the value we kept analysing the risk in Section 3.4.
3.3. Combined Vulnerability
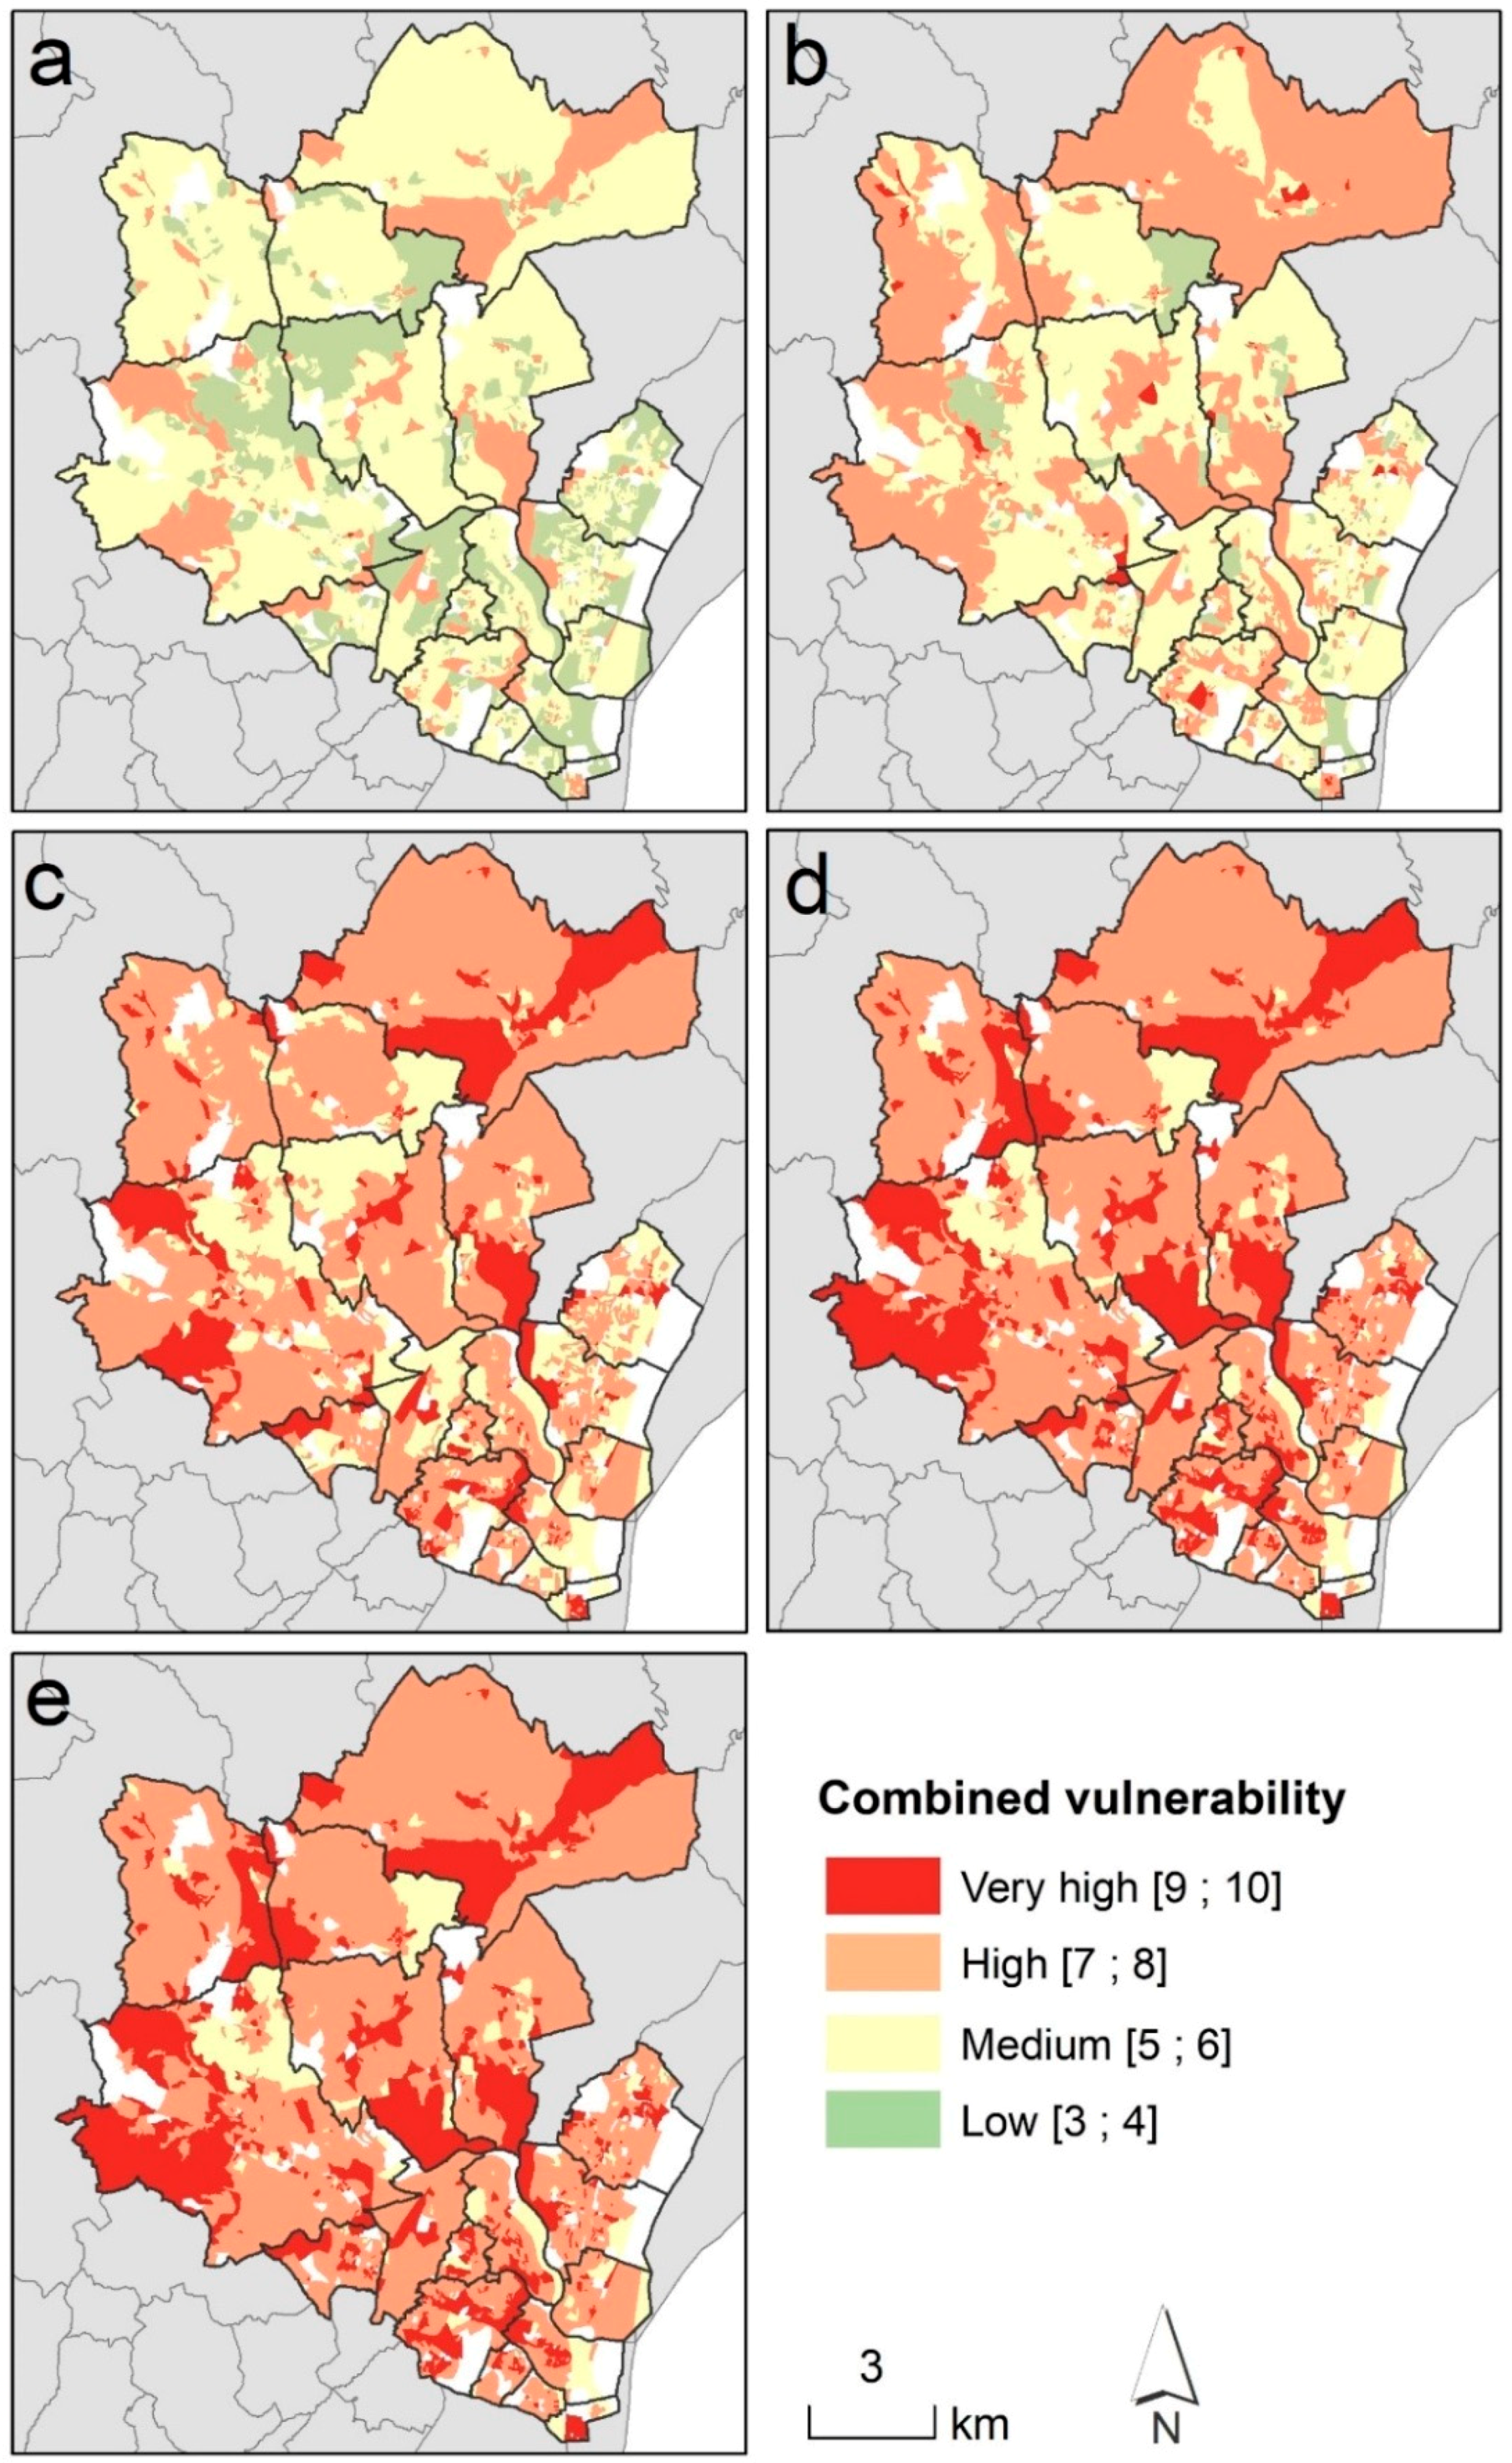
The social and physical vulnerabilities were combined in order to visualise the BGRI subsections which are the most vulnerable to landslides (Figure 5).
In terms of values, most of the residents living in buildings potentially affected by a landslide body have a low or medium vulnerability to 1-metre-deep landslides, a medium, high and in some cases a very high vulnerability to 3 and 5-metre-deep landslides, and a high and very high vulnerability to 10 and 20-metre-deep landslides (Figure 5). The obtained maps provide a location of the most vulnerable BGRI subsections, but they do not provide information about the number of residents which are in the high and very high vulnerability classes.
3.4. Landslide Risk Analysis
The risk was analysed for the scenario that considers 3-metre-deep landslides for the resident population living in buildings potentially affected by a landslide body and for the built environment potentially affected by a landslide body within the Loures municipality. The results are summarised in Table 6 and Table 7, respectively.
In Table 6, the exposure of the population is characterised by the number of residents per class of landslide susceptibility. The share of the residents per class of combined vulnerability is also shown by the percentage of each combined vulnerability class, within each landslide susceptibility class. In Table 7, the economic value of the buildings and the percentage of buildings per susceptibility class are shown, as well as the share of economic value of the buildings, which is represented by its percentage of combined vulnerability, in each landslide susceptibility class.
There is also an “error” column in each table, which comes from buildings that had been identified by the Municipal Master Plan (Direcção de Projecto do Plano Director Municipal, or DPPDM) but that had not been recorded in the BGRI by the INE (they are situated in the white zones of the Figure 3); that is why the vulnerability could not be calculated in these BGRI subsections. The error caused by this lack of data has a limited influence on the total results, as the proportion of missing data is almost negligible in the case of the resident population (0.07%) and quite low in the case of the buildings (2.05%).
Considering the combined vulnerability to 3-metre-deep landslides, the classes 1 (very high) and 4 (low) have a small area in relation to the classes 2 (high) and 3 (medium), as it can be seen in the Figure 5b. That is why most of the population (99.11%) resides in the classes 2 and 3 (respectively high and medium combined vulnerability classes). Among these classes 2 and 3, most of the population resides in the very low landslide susceptibility class (IV), which represents 64.89% of the Loures municipality. Its risk is thus not high, in comparison to the 0.90% residents who are living in high (II) or very high (I) landslide susceptibility class. Similar observations can be done for the economic value of the buildings. Indeed, most the built environment (94.00%) is located within the combined vulnerability classes 2 and 3, and most of the buildings are located within the very low landslide susceptibility class (IV). The risk is the highest for the 0.8% of the buildings which are located within the high (II) and very high (I) susceptibility classes (the total economic value of which being EUR 146,170,000) and among them, for the ones which are located within the most vulnerable classes (0.80% of the total economic value of the buildings are located within a high or very high susceptibility class and has a combined vulnerability medium or higher).
4. Discussion
In comparison to the social vulnerability values resulting from the study of Murillo-Garcia and co-authors [28], the social vulnerability which was assessed at the BGRI scale in the present study is on average lower. This can be explained by the fact that Murillo-Garcia and co-authors [28] considered the exposure of the population as a part of the vulnerability. Moreover, the original formulas were adapted, and the indicators are not always the same. Finally, the context is different, essentially by the absence of indigenous population in the Loures context.
Regarding the economic value of the buildings (Table 7), the share of the economic values tends to follow the trends of the share of resident population shown in Table 6. This is mainly because the distribution of the residential buildings (which were used in Table 6) is fairly homogeneous among the total built environment (which was used in Table 7).
The method used in the present study to assess the social vulnerability at the BGRI scale has the advantage to be applicable to any Portuguese municipality and it is not time consuming because the data used is provided by the INE and the Portuguese Tax Services and are available at the BGRI scale for the entire country. Moreover, the risk analysis presented here for 3-metre-deep landslides can be reproduced for any of the other landslide magnitudes for which the physical vulnerability was assessed. Finally, the risk analyses are summarised in tables which enable a quick interpretation of the findings.
However, the present study has several limitations; one of them is that the results were not validated, as it occurs in most of the geospatial modelling studies which focus on the construction, mapping and analysis of quantitative factors [45]. Consequences data record after landslide occurrences in the Loures municipality is limited; the data are too few to build a reliable validation model of vulnerability and risk findings. Moreover, indicators relative to the health, the coping capacity and the risk perception are also important for a complete social vulnerability assessment [45], and these indicators are not available in Portugal at the BGRI scale. Another limitation is that the model of social vulnerability provides results for the resident population, which must be close to the reality during the night-time; but during the daytime the population is not the same and the INE does not provide detailed data (e.g., age, employment) about the population which is present in the Loures municipality during the daytime. An estimate could be found by using a spatio-temporal model of the population distribution which uses population mobility statistics, as the one of Freire and co-authors [46]. The population which is present in the Loures municipality during the daytime could be assessed in a future work. Regarding the susceptibility, the susceptibility map was prepared for landslides deeper than 1.5 m, while the risk analysis is limited to landslides with a depth of about 3 m. Therefore, there is a discrepancy between the susceptibility and the risk analysis, possibly leading to errors. However, the error is small because the landslide frequency strongly decreases with landslide size, which means that distribution of landslide susceptibility does not depend substantially on landslides deeper than 3 m. The last limitation regards the issues of the presentation of the results: first, the vulnerability classification is relative, which makes difficult the comparison of the results of this municipality with other municipality vulnerability which would be assessed with the same method; second, the combined vulnerability maps show the location of the vulnerable BGRI subsections without providing information about the number of residents which are in each subsection, and the stakeholders may have to overlap the population density on the combined vulnerability maps before making decisions to reduce landslide risk in the study area. Finally, the repartition of the residents per buildings was not known and was therefore estimated using a dasymetric distribution, which approximates the reality adding therefore a supplementary uncertainty. The stakeholders should take into consideration the propagation of uncertainty in the different steps of the methodology, which makes the results quite uncertain.
5. Conclusions
The major aim of the present study was to develop a method of vulnerability assessment including the social and the physical facets of the vulnerability, and which is applicable at the municipal scale in Portugal. The second aim was to use the vulnerability assessment to support the landslide risk analysis. Finally, the developed method should be useful to spatial planning, civil protection and insurance stakeholders.
Many methodologies developed for vulnerability assessment are difficult to implement because of the unavailability of data. In addition, the achievement of relevant data is frequently time-consuming as it implies extensive field work. The present study aimed to be easily and readily applicable in others Portuguese municipalities for which an inventory of the past landslides has been listed.
A social vulnerability assessment was made at the BGRI scale in the present study. Results coming from a previous study [30] were used for the physical vulnerability assessment of the buildings. The combination of the two facets of the vulnerability was made by crossing the classes of the vulnerability assessment with the classes of the physical vulnerability at the BGRI scale in a matrix. The landslide risk was finally analysed considering the combined vulnerability provided by the combination of the physical vulnerability and the social vulnerability assessment, the landslide susceptibility, the exposure of the population and the value of the elements at risk. The 3-metre-deep landslide magnitude scenario was chosen because the risk is maximum in this case due to the relatively high frequency of such landslides and their substantial potential damage.
According to the susceptibility model (very high and high susceptibility classes), 75% of the future landslides should occur in 16.58% of the study area. This area gathers 0.9% of the resident population (the 0.47% of the Loures population who live in this area are highly vulnerable to 3-metre-deep landslides and the remaining 0.43% have a medium vulnerability) and 0.8% of the buildings, the economic value of which being EUR 146,170,000.
In terms of application, civil protection can be interested by the combined vulnerability developed in this study. Indeed, this vulnerability assessment provides the location of the more vulnerable population at a large scale crossed with the buildings which have a high physical vulnerability to different landslide magnitudes.
Author Contributions
C.G.-G. and J.L.Z. designed the research. C.G.-G. processed data and wrote the original draft. J.L.Z. oriented the research, validated the methodology and review the writing of the manuscript.
Funding
This work was financed by national funds through FCT–Portuguese Foundation for Science and Technology, I.P., under the framework of the project FORLAND–Hydro-geomorphologic risk in Portugal: driving forces and application for land use planning (PTDC/ATPGEO/1660/2014). Clémence Guillard-Gonçalves was a FCT PhD fellow, grant number SFRH/BD/64973/2009.
Acknowledgments
We acknowledge three anonymous reviewers and the editor of Geosciences for their interesting suggestions.
Conflicts of Interest
The authors declare no conflict of interest.
References
- Léone, F. Caractérisation des Vulnérabilités aux Catastrophes «Naturelles»: Contribution à une Evaluation Géographique Multirisque (Mouvements de Terrain, Séismes, Tsunamis, Eruptions Volcaniques, Cyclones). Ph.D. Thesis, Université Paul Valéry-Montpellier III, Montpellier, France, 2007. [Google Scholar]
- Thywissen, K. Components of Risk: A Comparative Glossary; UNU-EHS: Bonn, Germany, 2006. [Google Scholar]
- Susman, P.; O’Keefe, P.; Wisner, B. Global Disasters: A Radical Interpretation. In Interpretations of Calamity: From the Viewpoint of Human Ecology; Hewitt, K., Ed.; Allen & Unwinn: Boston, MA, USA, 1983; pp. 263–283. [Google Scholar]
- Hewitt, K. Regions of Risk: A Geographical Introduction to Disasters; Longman: Essex, UK, 1997; ISBN 0-582-21005-4. [Google Scholar]
- Ciurean, R.L.; Schröter, D.; Glade, T. Conceptual Frameworks of Vulnerability Assessments for Natural Disasters Reduction. In Approaches to Disaster Management-Examining the Implications of Hazards, Emergencies and Disasters; Tiefenbacher, J., Ed.; InTech: Rijeka, Croatia, 2013; pp. 3–32. ISBN 978-953-51-1093-4. [Google Scholar]
- Tapsell, S.; Mccarthy, S.; Faulkner, H.; Alexander, M. Social Vulnerability to Natural Hazards; Middlesex University: London, UK, 2010. [Google Scholar]
- Blaikie, P.; Cannon, T.; Davis, I.; Wisner, B. At Risk: Natural Hazards, People’s Vulnerability, and Disasters; Routledge: London, UK, 1994. [Google Scholar]
- Weichselgartner, J. Disaster mitigation: The concept of vulnerability revisited. Disast. Prev. Manag. 2001, 10, 85–94. [Google Scholar] [CrossRef]
- Wisner, B.; Blaikie, P.M.; Cannon, T.; Davis, I. At Risk. Natural Hazards, People’s Vulnerability and Disasters; Routledge: London, UK, 2004. [Google Scholar]
- Cutter, S.L.; Emrich, C.T. Moral hazard, social catastrophe: The changing face of vulnerability along the hurricane coasts. Ann. Am. Acad. Polit. Soc. Sci. 2006, 604, 102–111. [Google Scholar] [CrossRef]
- Yarnal, B. Vulnerability and all that jazz: Assessing vulnerability in New Orleans after Hurricane Katrina. Technol. Soc. 2007, 29, 249–255. [Google Scholar] [CrossRef]
- SafeLand. Deliverable D2.6. Methodology for Evaluation of the Socio-Economic Impact of Landslides (Socio-Economic Vulnerability); SafeLand: London, UK, 2012. [Google Scholar]
- Cutter, S.; Mitchell, J.; Scott, M. Revealing the Vulnerability of People and Places: A Case Study of Georgetown County, South Carolina. Ann. Assoc. Am. Geogr. 2000, 90, 713–737. [Google Scholar] [CrossRef]
- Guillard-Goncąlves, C.; Cutter, S.L.; Emrich, C.T.; Zêzere, J.L. Application of Social Vulnerability Index (SoVI) and delineation of natural risk zones in Greater Lisbon, Portugal. J. Risk Res. 2015, 18, 651–674. [Google Scholar] [CrossRef]
- Fuchs, S. Susceptibility versus resilience to mountain hazards in Austria—Paradigms of vulnerability revisited. Nat. Hazards Earth Syst. Sci. 2009, 9, 337–352. [Google Scholar] [CrossRef]
- Varnes, D. The International Association of Engineering Geology Commission on Landslides and Other Mass Movements 1984. In Landslide Hazard Zonation: A Review of Principles and Practice; UNESCO Pre.: Paris, France, 1984. [Google Scholar]
- Hufschmidt, G.; Crozier, M.; Glade, T. Evolution of natural risk: Research framework and perspectives. Nat. Hazards Earth Syst. Sci. 2005, 5, 375–387. [Google Scholar] [CrossRef]
- Chacón, J.; Irigaray, C.; Fernández, T.; El Hamdouni, R. Engineering geology maps: Landslides and geographical information systems. Bull. Eng. Geol. Environ. 2006, 65, 341–411. [Google Scholar] [CrossRef]
- Fuchs, G.; Reichel, A. An exploratory inquiry into destination risk perceptions and risk reduction strategies of first time vs. repeat visitors to a highly volatile destination. Tour. Manag. 2011, 32, 266–276. [Google Scholar] [CrossRef]
- Uzielli, M.; Catani, F.; Tofani, V.; Casagli, N. Risk analysis for the Ancona landslide—II: Estimation of risk to buildings. Landslides 2014, 12, 83–100. [Google Scholar] [CrossRef]
- Papathoma-Köhle, M.; Kappes, M.; Keiler, M.; Glade, T. Physical vulnerability assessment for alpine hazards: State of the art and future needs. Nat. Hazards 2011, 58, 645–680. [Google Scholar] [CrossRef]
- Puissant, A.; Van Den Eeckhaut, M.; Malet, J.-P.; Maquaire, O. Landslide consequence analysis: A region-scale indicator-based methodology. Landslides 2013, 11, 843–858. [Google Scholar] [CrossRef]
- Léone, F. Concept de Vulnérabilité Appliqué à L’évaluation des Risques Générés par les Phénomènes de Mouvements de Terrain, Orléans. Ph.D. Thesis, Université Grenoble 1-Joseph Fourier-Sciences, Techniques et Médecine, Grenoble, France, 1996. [Google Scholar]
- Shrestha, A. Vulnerability Assessment of Weather Disasters in Syangja District, Nepal: A Case Study in Putalibazaar Municipality Case Study in Putalibazaar Municipality; Advances Institute on Vulnerability to Global Environmental Change; START and Department of Hydrology: Kathmandu, Nepal, 2005. [Google Scholar]
- Alexander, D. Vulnerability to Landslides. In Landslide Hazard and Risk; Glade, T., Anderson, M., Crozier, M.J., Eds.; John Wiley & Sons, Ltd.: Hoboken, NJ, USA, 2005; pp. 175–198. ISBN 9780471486633. [Google Scholar]
- Puissant, A.; Malet, J.; Maquaire, O. Mapping landslide consequences in mountain areas: A tentative approach with a semi-quantitative procedure. In SAGEO 2006, Proceedings of the International Conference on Spatial Analysis and Geomatics, Strasbourg, France, 11 September 2006; Weber, C., Gancarski, P., Eds.; University of Rennes 2: Strasbourg, France, 2006; pp. 1–16. [Google Scholar]
- Carlier, B.; Dujarric, C.; Frison-Bruno, N.; Puissant, A.; Lissak, C.; Madelin, M.; Viel, V.; Bétard, F.; Fort, M.; Arnaud-Fassetta, G. Physical, social and institutional vulnerability assessment in small Alpine communities. Results of the SAMCO-ANR project in the Upper Guil Valley (French Southern Alps). In Proceedings of the EGU General Assembly 2016, Vienna, Austria, 17–22 April 2016. [Google Scholar]
- Murillo-Garcia, F.; Rossi, M.; Fiorucci, F.; Alcántara-Ayala, I. Population Landslide Vulnerability Evaluation: The Case of the Indigenous Population of Pahuatlán-Puebla, Mexico. In Engineering Geology for Society and Territory—Volume 2: Landslide Processes; Giordan, D., Crosta, G., Corominas, J., Azzam, R., Wasowski, J., Sciarra, N., Eds.; Springer: Zürich, Switzerland, 2015; Volume 2, pp. 1793–1797. ISBN 9783319090573. [Google Scholar]
- Guillard, C.; Zezere, J. Landslide susceptibility assessment and validation in the framework of municipal planning in Portugal: The case of loures municipality. Environ. Manag. 2012, 50, 721–735. [Google Scholar] [CrossRef] [PubMed]
- Guillard-Gonçalves, C.; Zêzere, J.L.; Pereira, S.; Garcia, R.A.C. Assessment of physical vulnerability of buildings and analysis of landslide risk at the municipal scale—Application to the Loures municipality, Portugal. Nat. Hazards Earth Syst. Sci. 2016, 16, 311–331. [Google Scholar] [CrossRef]
- Zêzere, J.L.; De Brum Ferreira, A.; Rodrigues, M.L. The role of conditioning and triggering factors in the occurrence of landslides: A case study in the area north of Lisbon (Portugal). Geomorphology 1999, 30, 133–146. [Google Scholar] [CrossRef]
- Oliveira, S.C.; Zêzere, J.L.; Guillard-Gonçalves, C.; Garcia, R.A.C.; Pereira, S. Integration of landslide susceptibility maps for land use planning and civil protection emergency management. In Advancing Culture of Living with Landslides; Sassa, K., Mikoš, M., Yin, Y., Eds.; Springer: Cham, Switzerland, 2017; Volume 1, pp. 543–553. ISBN 9783319534831. [Google Scholar]
- Zêzere, J.L.; Garcia, R.A.C.; Oliveira, S.C.; Reis, E. Probabilistic landslide risk analysis considering direct costs in the area north of Lisbon (Portugal). Geomorphology 2008, 94, 467–495. [Google Scholar] [CrossRef]
- Zêzere, J.L.; Reis, E.; Garcia, R.A.C.; Oliveira, S.C.; Rodrigues, M.L.; Vieira, G.; Ferreira, A.B.B. Integration of spatial and temporal data for the definition of different landslide hazard scenarios in the area north of Lisbon (Portugal). Nat. Hazards Earth Syst. Sci. 2004, 4, 133–146. [Google Scholar] [CrossRef] [Green Version]
- Zêzere, J.; Trigo, R.; Trigo, I. Shallow and deep landslides induced by rainfall in the Lisbon region (Portugal): Assessment of relationships with the North Atlantic Oscillation. Nat. Hazards Earth Syst. Sci. 2005, 5, 331–344. [Google Scholar] [CrossRef]
- Zêzere, J.L.; Oliveira, S.C.; Garcia, R.A.C.; Reis, E. Landslide risk analysis in the area North of Lisbon (Portugal): Evaluation of direct and indirect costs resulting from a motorway disruption by slope movements. Landslides 2007, 4, 123–136. [Google Scholar] [CrossRef]
- Instituto Nacional de Estatísticas (INE). Censos 2011—Resultados Definitivos—Portugal; Instituto Nacional de Estatísticas (INE): Lisbon, Portugal, 2012; ISBN 9789892501819.
- Yin, K.; Yan, T. Statistical prediction models for slope instability of metamorphosed rocks. In Proceedings of the 5th ISL, Rotterdam, The Netherlands, 10–15 July 1988; Bonnard, C., Ed.; CiNii: Tokyo, Japan, 1988; pp. 1269–1272. [Google Scholar]
- Zêzere, J. Landslide susceptibility assessment considering landslide typology. A case study in the area north of Lisbon (Portugal). Nat. Hazards Earth Syst. Sci. 2002, 2, 73–82. [Google Scholar] [CrossRef] [Green Version]
- Cardinali, M.; Reichenbach, P.; Guzzetti, F.; Ardizzone, F.; Antonini, G.; Galli, M.; Cacciano, M.; Castellani, M.; Salvati, P. A geomorphological approach to the estimation of landslide hazards and risks in Umbria, Central Italy. Nat. Hazards Earth Syst. Sci. 2002, 2, 57–72. [Google Scholar] [CrossRef] [Green Version]
- Jaiswal, P.; van Westen, C.J.; Jetten, V. Quantitative estimation of landslide risk from rapid debris slides on natural slopes in the Nilgiri hills, India. Nat. Hazards Earth Syst. Sci. 2011, 11, 1723–1743. [Google Scholar] [CrossRef] [Green Version]
- Li, Z.; Nadim, F.; Huang, H.; Uzielli, M.; Lacasse, S. Quantitative vulnerability estimation for scenario-based landslide hazards. Landslides 2010, 7, 125–134. [Google Scholar] [CrossRef]
- Koks, E.E.; Jongman, B.; Husby, T.G.; Botzen, W.J.W. Combining hazard, exposure and social vulnerability to provide lessons for flood risk management. Environ. Sci. Policy 2015, 47, 42–52. [Google Scholar] [CrossRef]
- Garcia, R.A.C.; Oliveira, S.C.; Zêzere, J.L. Assessing population exposure for landslide risk analysis using dasymetric cartography. Nat. Hazards Earth Syst. Sci. 2016, 16, 2769–2782. [Google Scholar] [CrossRef] [Green Version]
- Rufat, S.; Tate, E.; Burton, C.G.; Maroof, A.S. Social vulnerability to floods: Review of case studies and implications for measurement. Int. J. Disast. Risk Reduct. 2015, 14, 470–486. [Google Scholar] [CrossRef]
- Freire, S.; Aubrecht, C.; Wegscheider, S. Spatio-temporal population distribution and evacuation modeling for improving tsunami risk assessment in the Lisbon Metropolitan Area. In Proceedings of the International Symposium on Geo-Information for Disaster Management (Gi4DM), Antalya, Turkey, 3–8 May 2011; p. 6. [Google Scholar]
Figure 1.
Civil parishes of the Loures municipality.

Figure 2.
Susceptibility map for deep-seated rotational slides occurrence in the Loures municipality (based on the work done by Guillard and Zêzere [29] and Guillard-Gonçalves and co-authors [30]).
Figure 3.
Social vulnerability of the Loures municipality. The civil parishes are delimitated (which names are indicated in Figure 1).
Figure 3.
Social vulnerability of the Loures municipality. The civil parishes are delimitated (which names are indicated in Figure 1).
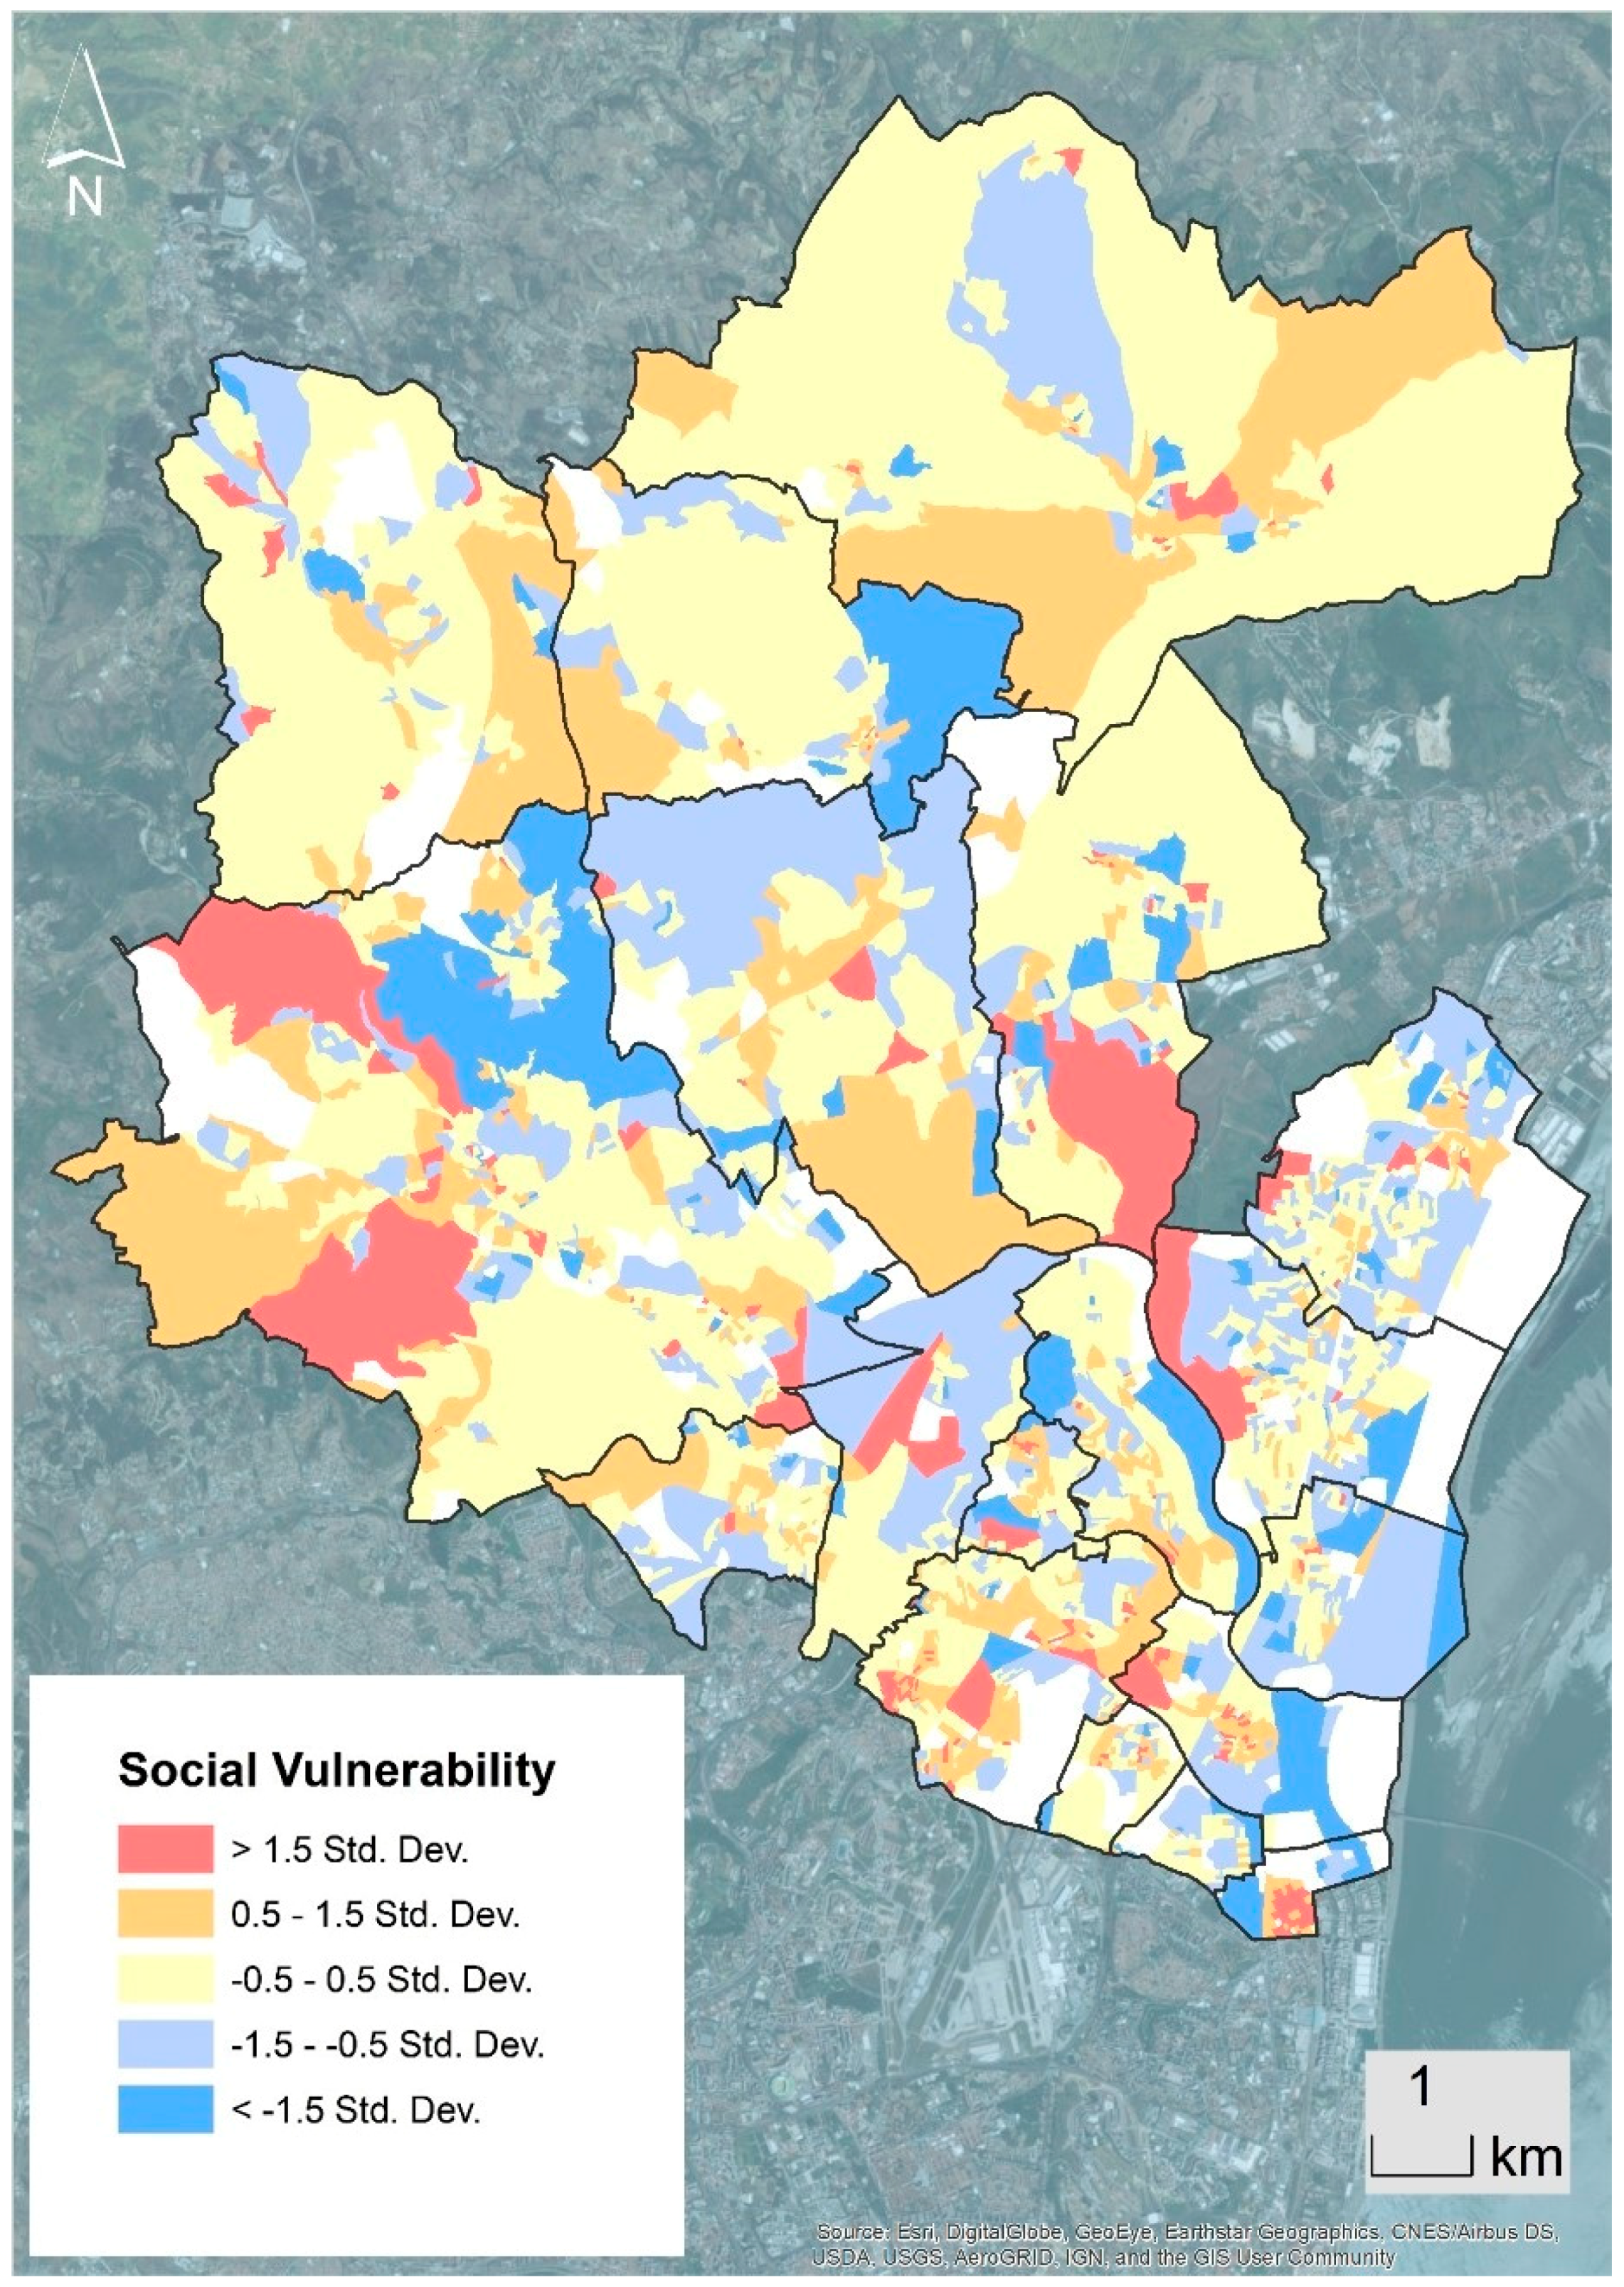
Figure 4.
Physical vulnerability for buildings potentially affected by a landslide body, for slip surface depth of (a) 1 m; (b) 3 m; (c) 5 m; (d) 10 m; and (e) 20 m. White polygons are BGRI subsections without buildings.
Figure 4.
Physical vulnerability for buildings potentially affected by a landslide body, for slip surface depth of (a) 1 m; (b) 3 m; (c) 5 m; (d) 10 m; and (e) 20 m. White polygons are BGRI subsections without buildings.
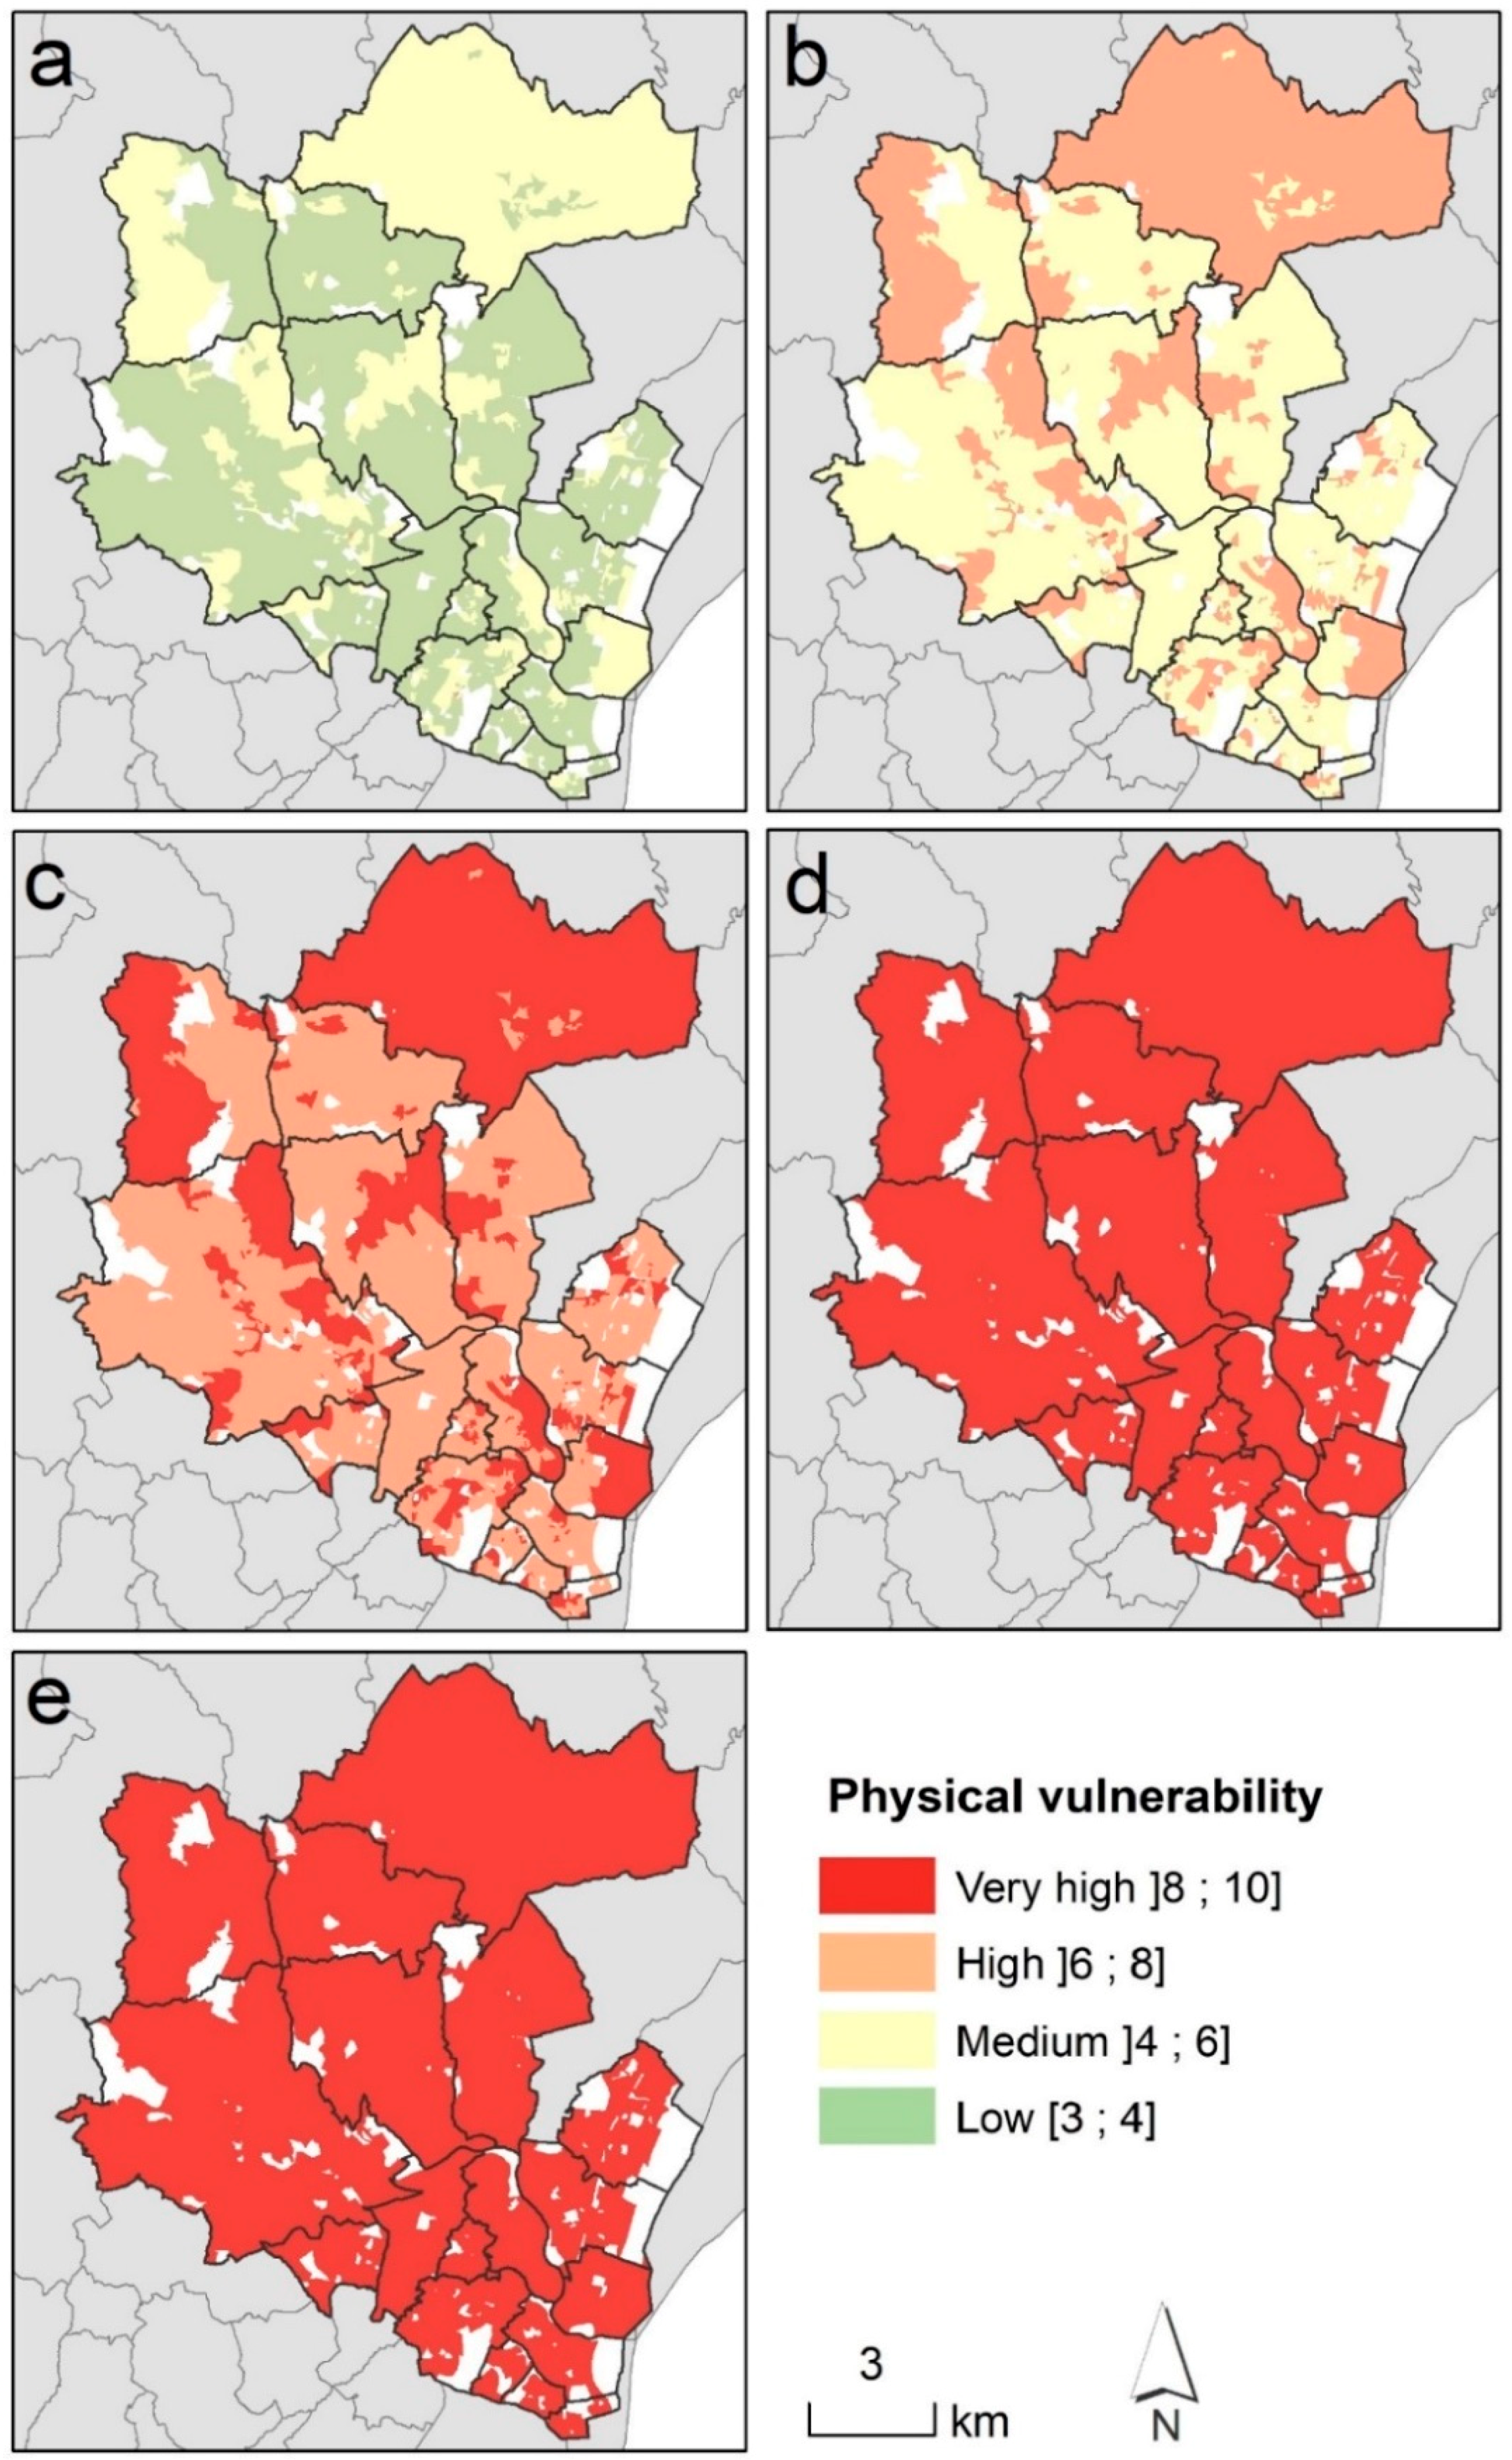
Figure 5.
Combined vulnerability for residents living in buildings potentially affected by a landslide body, for slip surface depth of (a) 1 m; (b) 3 m; (c) 5 m; (d) 10 m; and (e) 20 m. White polygons are BGRI subsections without buildings.
Figure 5.
Combined vulnerability for residents living in buildings potentially affected by a landslide body, for slip surface depth of (a) 1 m; (b) 3 m; (c) 5 m; (d) 10 m; and (e) 20 m. White polygons are BGRI subsections without buildings.

Table 1.
Different meanings associated to social vulnerability (adapted from [6]).
Table 1.
Different meanings associated to social vulnerability (adapted from [6]).
| Social Vulnerability Definition | Reference Source |
|---|---|
| The susceptibility of social groups to potential losses from hazard events or society’s resistance and resilience to hazard. | Blaikie and co-authors, 1994 [7] Hewitt, 1997 [4] |
| The condition of a given area with respect to hazard, exposure, preparedness, prevention, and response characteristics to cope with specific natural hazards. It is a measure of the capability of this set of elements to withstand events of a certain physical character. | Weichselgartner, 2001 [8] |
| The characteristics of a person or group and their situation that influence their capacity to anticipate, cope with, resist and recover from the impact of a natural hazard … It involves a combination of factors that determine the degree to which someone’s life, livelihood, property and other assets are put at risk by a discrete and identifiable event … in nature and in society. | Wisner and co-authors, 2004 [9] |
| The product of social inequalities; it is defined as the susceptibility of social groups to the impacts of hazards, as well as their resiliency or ability to adequately recover from them … susceptibility is not only a function of demographic characteristics … but also more complex constructs such as health care provision, social capital and access to lifelines. | Cutter and Emrich 2006 [10] |
| The result of social factors that place people in highly exposed areas, affect the sensitivity of people to that exposure, and influence their capacity to respond and adapt | Yarnal 2007 [11] |
Table 2.
Social vulnerability indicators (adapted from [28]).
Table 2.
Social vulnerability indicators (adapted from [28]).
| Indicator | Description |
|---|---|
| DP | Population density: number of residents per square kilometre |
| YP | Young population: Population younger than 13 years old |
| OP | Old population: Population older than 64 years old |
| FP | Female population: Number of female residents |
| IP | Illiterate population: Number of residents who do not read neither write |
| WA * | Without activity: Number of residents living without economic activity |
| UNEMP * | Unemployed population: Number of unemployed residents looking for a first job or for a new job |
| NDEV * | Number of dwellings without water, WC, sewer or bathroom |
| RDW * | Rented dwellings: Number of classical family accommodation of usual residence which are rented |
| RLC * | Reclassified location coefficient: used to characterise the property market and the accessibility of the buildings by the Portuguese Tax Services |
* Indicators not used by [28].
Table 3.
Classification of social vulnerability calculated at the BGRI scale his is a table.
| Social Vulnerability Value and Level | Value of the Class | ||
|---|---|---|---|
| ≤−1.5 Std. Dev. | [0; 0.24] | Very low | 1 |
| [−1.5 Std. Dev.; −0.5 Std. Dev.] | [0.24; 0.38] | Low | 2 |
| [−0.5 Std. Dev.; 0.5 Std. Dev.] | [0.38; 0.53] | Medium | 3 |
| [0.5 Std. Dev.; 1.5 Std. Dev.] | [0.53; 0.67] | High | 4 |
| >1.5 Std. Dev. | [0.67; 1] | Very high | 5 |
Table 4.
Classification of physical vulnerability calculated at the BGRI scale.
| Physical Vulnerability Value and Level | Value of the Class | |
|---|---|---|
| 0–0.2 | Very low | 1 |
| 0.2–0.4 | Low | 2 |
| 0.4–0.6 | Medium | 3 |
| 0.6–0.8 | High | 4 |
| 0.8–1 | Very high | 5 |
Table 5.
Classification of the combined vulnerability.
| Combined Vulnerability Value | Combined Vulnerability Class |
|---|---|
| 1 and 2 | Very low |
| 3 and 4 | Low |
| 5 and 6 | Medium |
| 7 and 8 | High |
| 9 and 10 | Very high |
Table 6.
Landslide risk analysis for the resident population, considering the combined vulnerability for 3-metre-deep landslides (see Figure 5b); adapted from Koks and co-authors [43].
| Landslide Susceptibility Class (See Figure 2) | Area of the Landslide Susceptibility Class | Resident Population | Share of Resident Population per Combined Vulnerability Class (i.e., Risk) | ||||||
|---|---|---|---|---|---|---|---|---|---|
| Total (km2) | % | Total | % | Very High | High | Medium | Low | Error | |
| I. Very high | 11.71 | 6.97 | 391 | 0.2 | 0 | 0.14 | 0.06 | 0 | 0 |
| II. High | 16.15 | 9.61 | 768 | 0.7 | 0 | 0.33 | 0.37 | 0 | 0 |
| III. Low | 31.16 | 18.53 | 8492 | 4.3 | 0.01 | 1.92 | 2.36 | 0 | 0 |
| IV. Very low | 109.10 | 64.89 | 187,343 | 94.8 | 0.74 | 41.15 | 52.78 | 0.07 | 0.07 |
| Total | 168.13 | 100.00 | 197,614 | 100.00 | 0.75 | 43.54 | 55.57 | 0.07 | 0.07 |
Table 7.
Landslide risk analysis for the buildings, considering the combined vulnerability for 3-metre-deep landslides (see Figure 5b).
Table 7.
Landslide risk analysis for the buildings, considering the combined vulnerability for 3-metre-deep landslides (see Figure 5b).
| Landslide Susceptibility Class (see Figure 2) | Area of the Landslide Susceptibility Class | Economic Value of the Buildings | Share of Economic Value of the Buildings per Combined Vulnerability Class | ||||||
|---|---|---|---|---|---|---|---|---|---|
| Total (km2) | % | Total (M€) | % of Buildings | Very High | High | Medium | Low | Error | |
| I. Very high | 11.71 | 6.97 | 35 | 0.2 | 0 | 0.14 | 0.06 | 0 | 0 |
| II. High | 16.15 | 9.61 | 111 | 0.6 | 0 | 0.32 | 0.28 | 0 | 0 |
| III. Low | 31.16 | 18.53 | 681 | 3.7 | 0.03 | 1.89 | 1.77 | 0.03 | 0.01 |
| IV. Very low | 109.10 | 64.89 | 17,450 | 95.5 | 3.24 | 36.71 | 52.83 | 0.65 | 2.04 |
| Total | 168.13 | 100.00 | 18,277 | 100.00 | 3.27 | 39.06 | 54.94 | 0.68 | 2.05 |
© 2018 by the authors. Licensee MDPI, Basel, Switzerland. This article is an open access article distributed under the terms and conditions of the Creative Commons Attribution (CC BY) license (http://creativecommons.org/licenses/by/4.0/).
Share and Cite
MDPI and ACS Style
Guillard-Gonçalves, C.; Zêzere, J.L. Combining Social Vulnerability and Physical Vulnerability to Analyse Landslide Risk at the Municipal Scale. Geosciences 2018, 8, 294. https://doi.org/10.3390/geosciences8080294
AMA Style
Guillard-Gonçalves C, Zêzere JL. Combining Social Vulnerability and Physical Vulnerability to Analyse Landslide Risk at the Municipal Scale. Geosciences. 2018; 8(8):294. https://doi.org/10.3390/geosciences8080294
Chicago/Turabian StyleGuillard-Gonçalves, Clémence, and José Luís Zêzere. 2018. "Combining Social Vulnerability and Physical Vulnerability to Analyse Landslide Risk at the Municipal Scale" Geosciences 8, no. 8: 294. https://doi.org/10.3390/geosciences8080294
Note that from the first issue of 2016, this journal uses article numbers instead of page numbers. See further details here.