Measurement and Modeling Air Quality Impacts of Dust Emissions from Unpaved Roads in Tuxtla Gutierrez, Chiapas

 ,
,
Abstract
:
1. Introduction
2. Methods
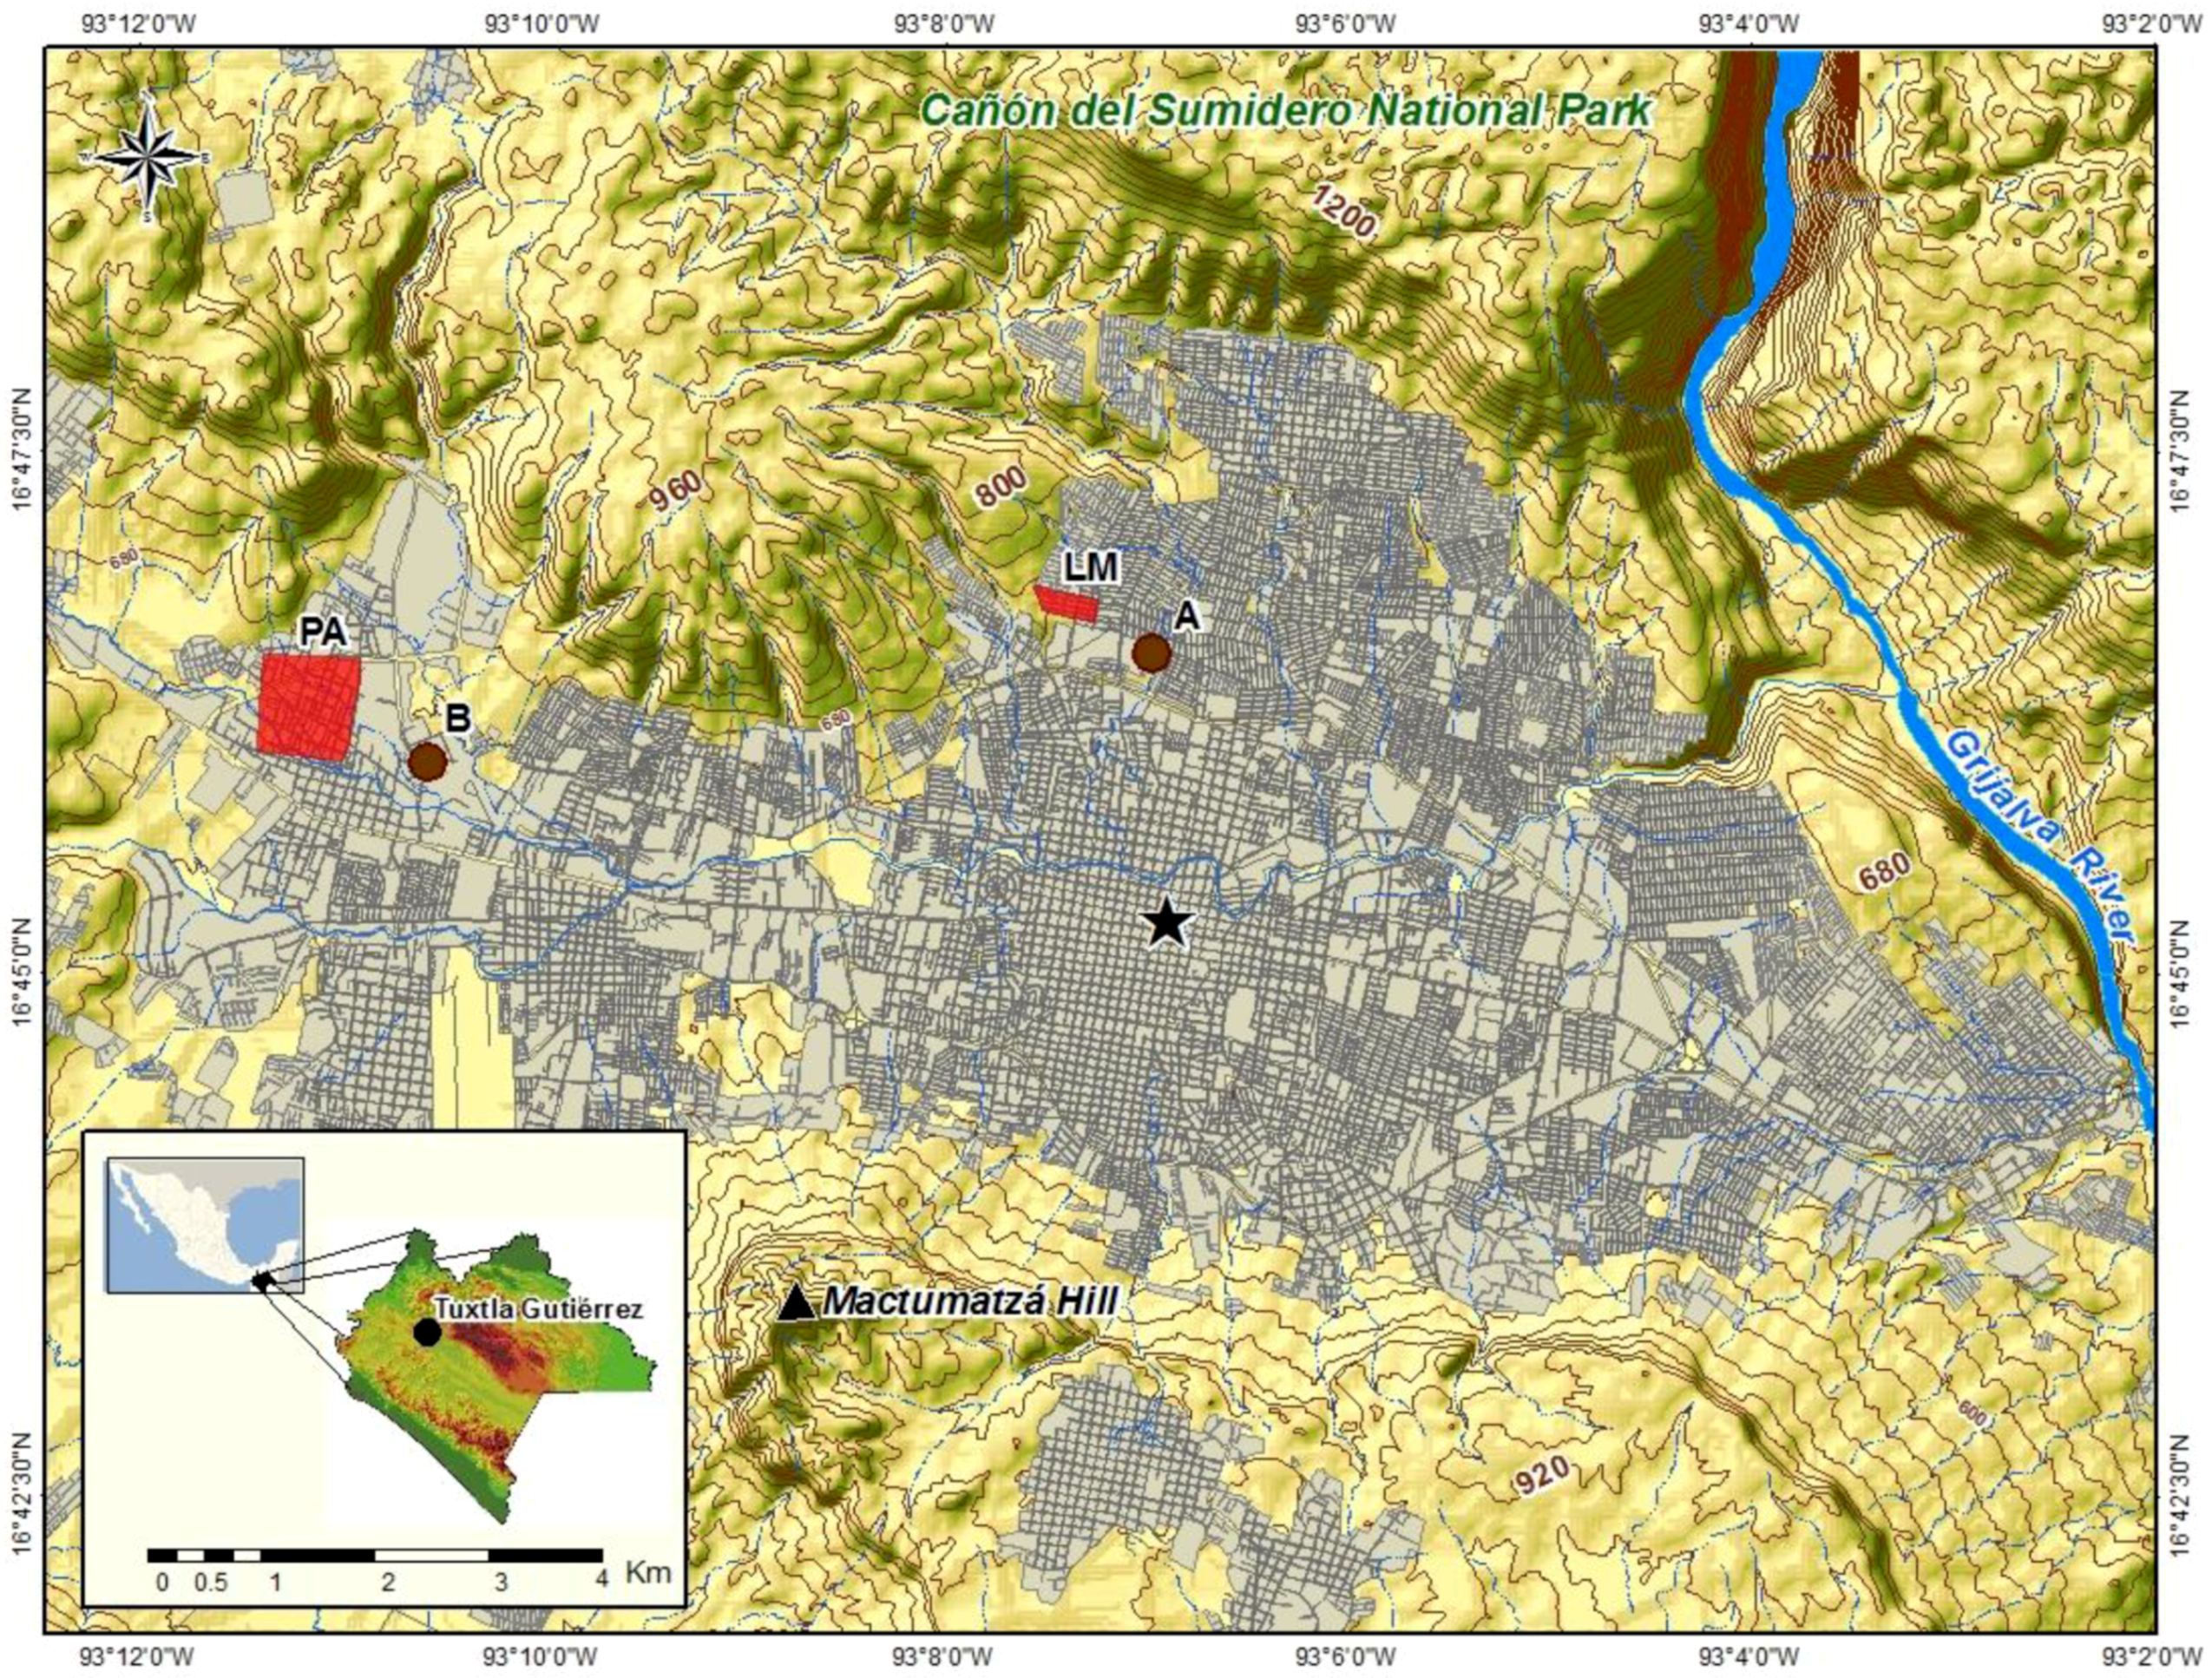
2.1. Study Site
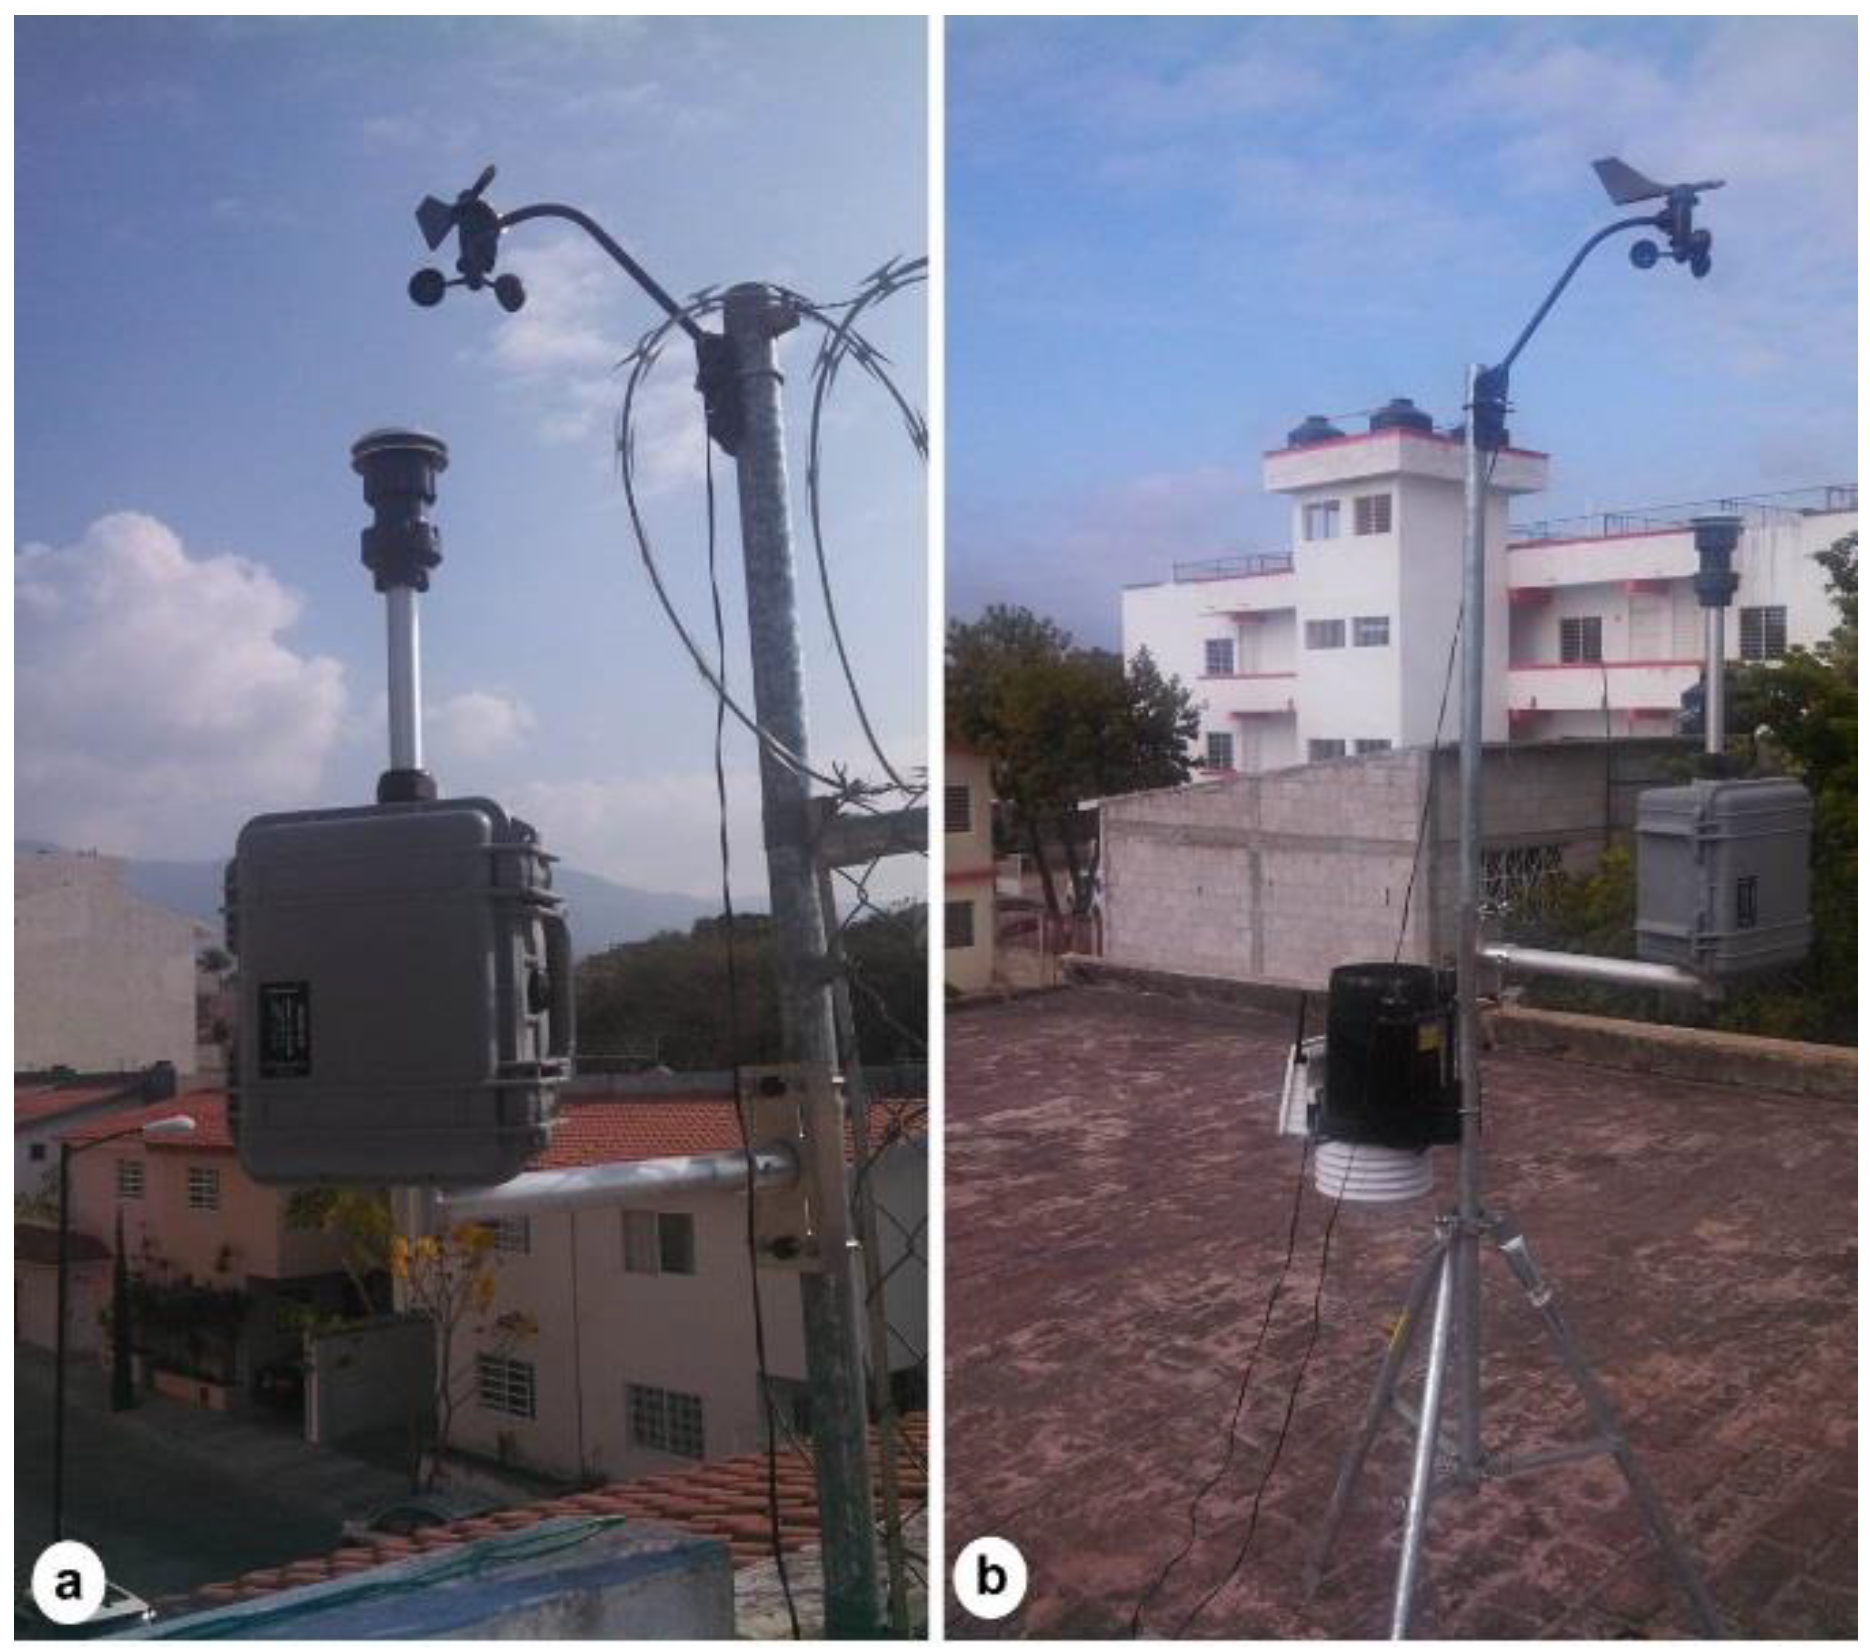
2.2. Field Campaign
2.3. Model Application for Impacted Areas
3. Results and Discussion
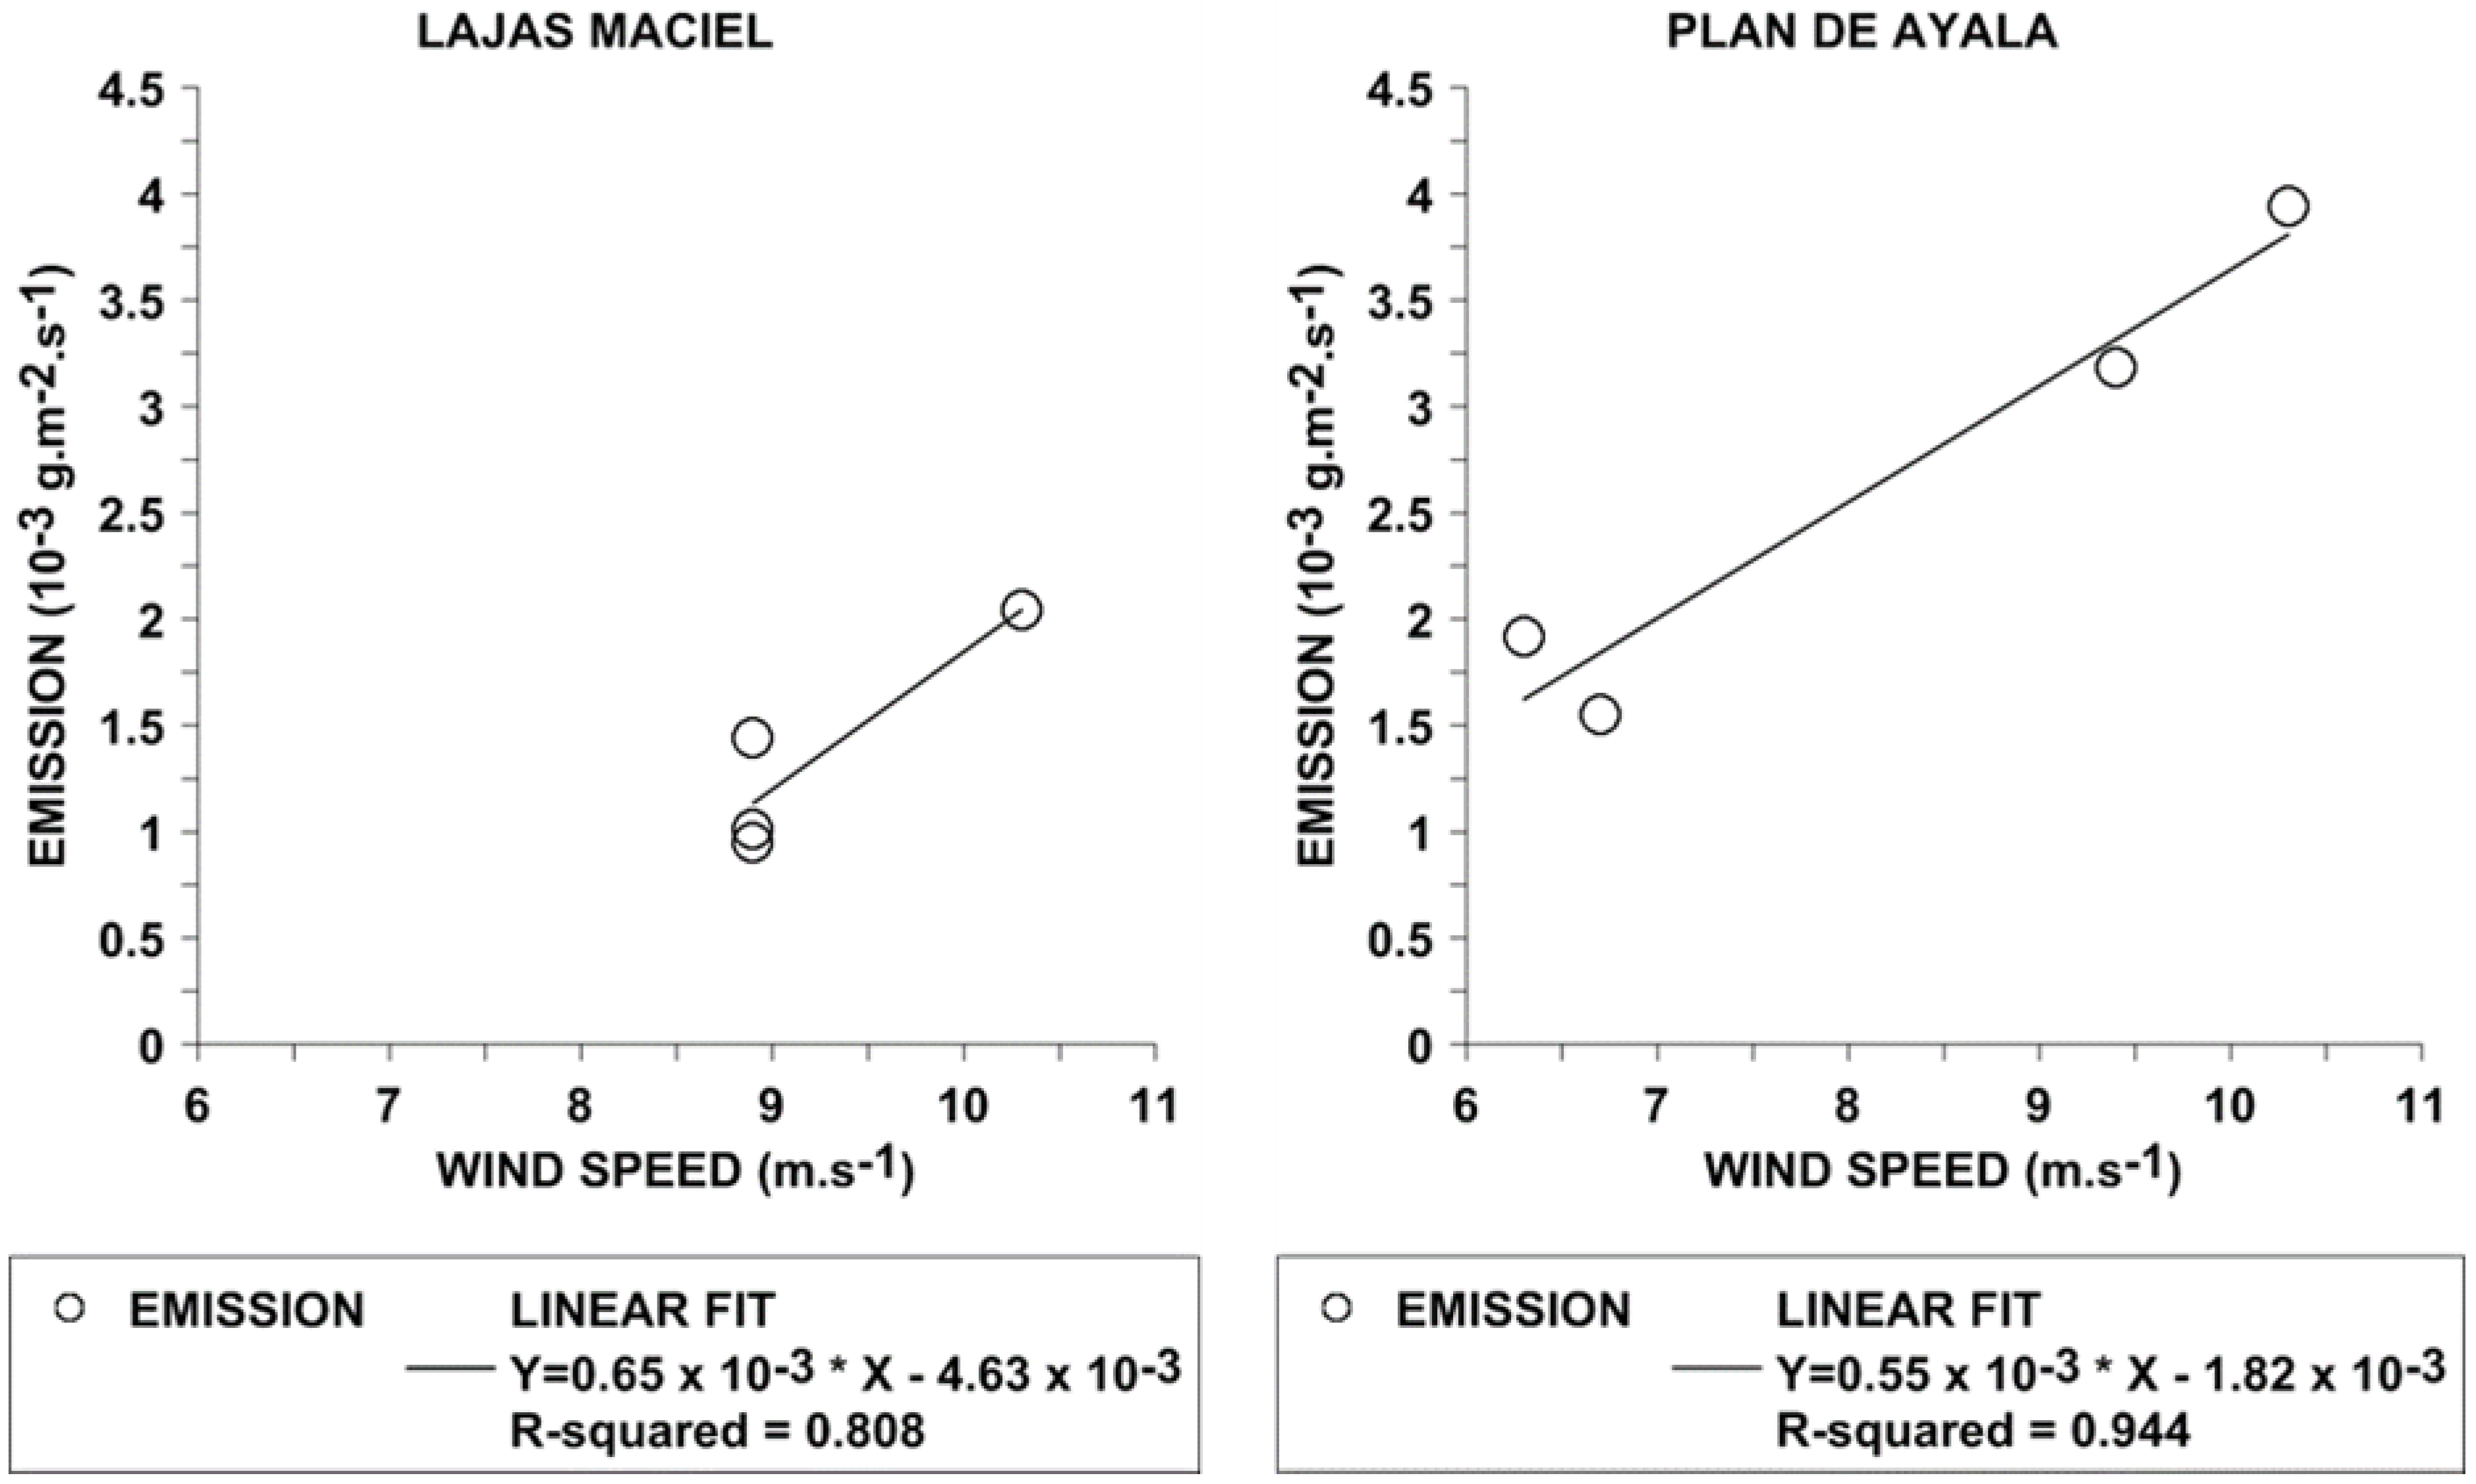
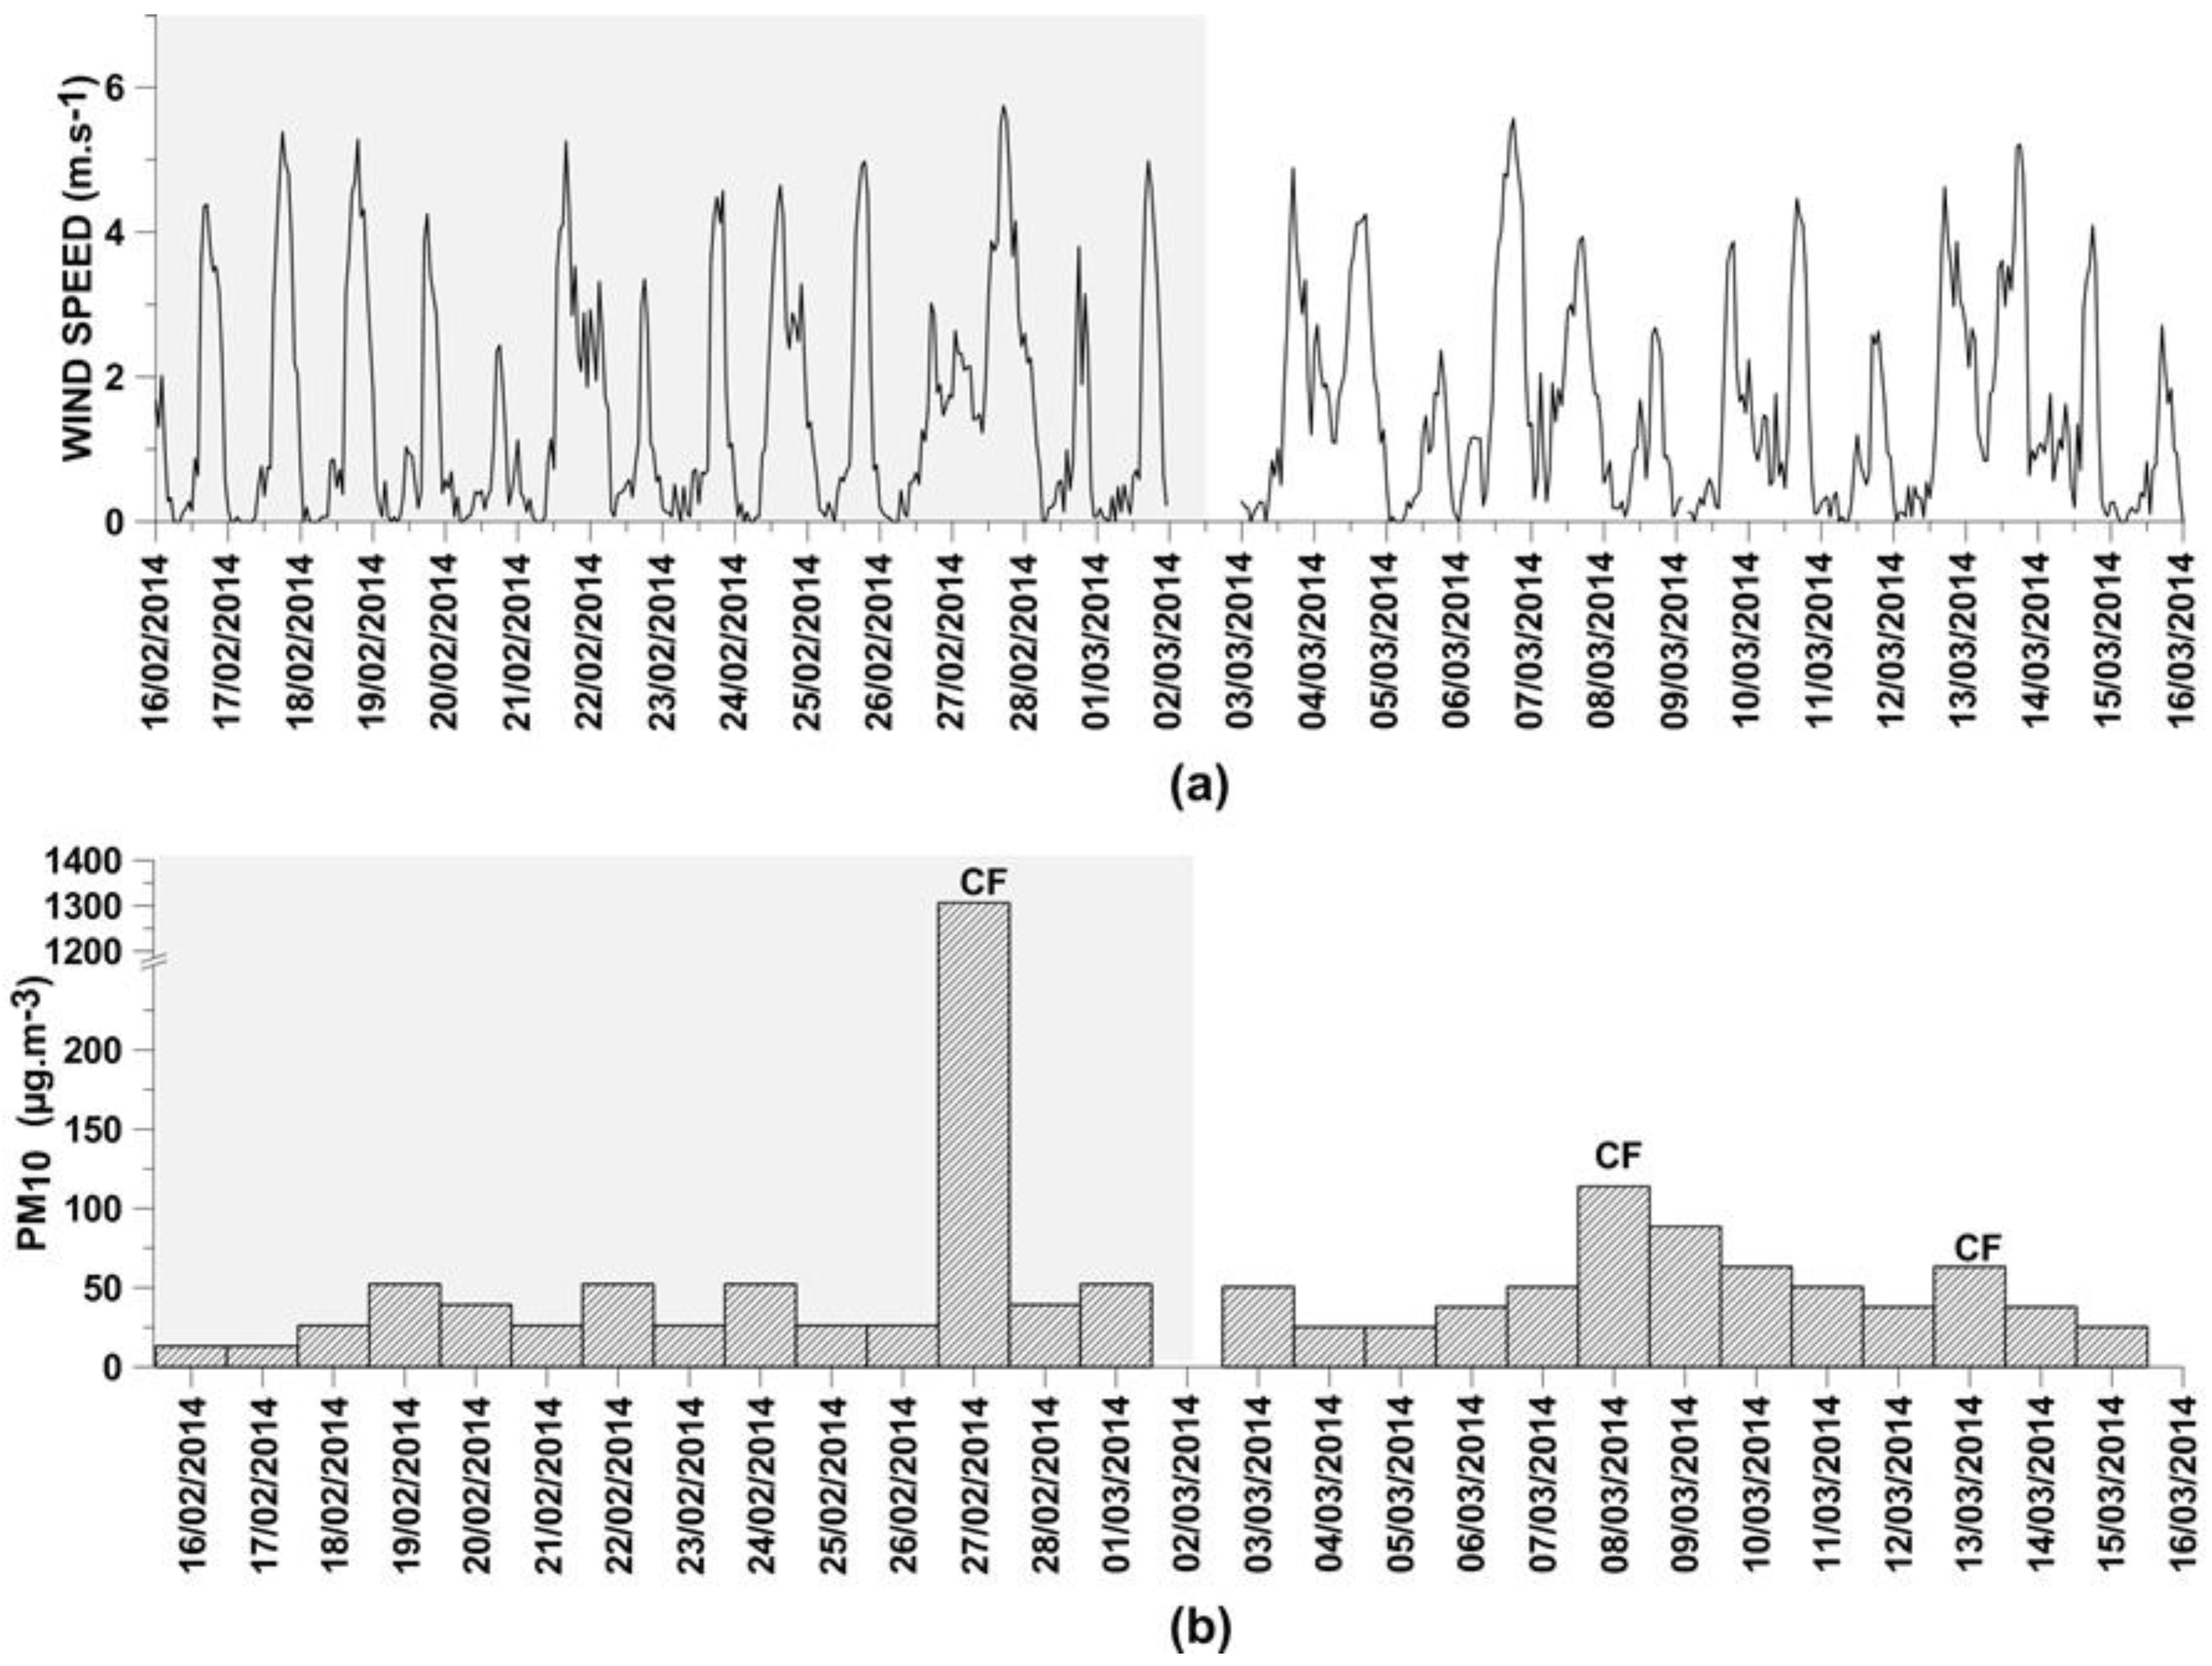
3.1. Field Measurements
3.2. Simulations
4. Conclusions
5. Future Research
Author Contributions
Funding
Acknowledgments
Conflicts of Interest
References
- Choobari, O.A.; Zawar-Reza, P.; Sturman, A. The global distribution of mineral dust and its impacts on the climate system: A review. Atmos. Res. 2014, 138, 152–165. [Google Scholar] [CrossRef]
- Ostro, B.D.; Hurley, S.; Lipsett, M.J. Air pollution and daily mortality in the Coachella Valley, California: A study of PM10 dominated by coarse particles. Environ. Res. 1999, 81, 231–238. [Google Scholar] [CrossRef] [PubMed]
- Pope, C.A.; Thun, M.J.; Namboodiri, M.M.; Dockery, D.W.; Evans, J.S.; Speizer, F.E.; Heath, C.W., Jr. Particulate air pollution as a predictor of mortality in a prospective study of U.S. adults. Am. J. Respir. Crit. Care Med. 1995, 151, 669–674. [Google Scholar] [CrossRef] [PubMed]
- Schwartz, J.; Dockery, D.; Neas, L. Is Daily Mortality Associated Specifically with Fine Particles? J. Air Waste Manag. Assoc. 1996, 46, 927–939. [Google Scholar] [CrossRef] [PubMed] [Green Version]
- Hagen, L.J.; Skidmore, E.L. Wind Erosion and Visibility Problems. Trans. ASAE 1977, 20, 898–903. [Google Scholar] [CrossRef]
- Gillette, D.A. Dust production by wind erosion: Necessary conditions and estimates of vertical fluxes of dust and visibility reduction by dust. In Physics of Desertification; El-Baz, F., Hassan, M.H.A., Eds.; Martinus Nijhoff Publisher: Dordrecht, The Netherlands, 1986; pp. 361–371. [Google Scholar]
- Calderón-Garcidueñas, L.; Gónzalez-Maciel, A.; Reynoso-Robles, R.; Delgado-Chávez, R.; Mukherjee, P.; Kulesza, R.; Torres-Jardón, R.; Ávila-Ramírez, J.; Villarreal-Ríos, R. Hallmarks of Alzheimer disease are evolving relentlessly in Metropolitan Mexico City infants, children and young adults. APOE4 carriers have higher suicide risk and higher odds of reaching NFT stage V at ≤ 40 years of age. Environ. Res. 2018, 164, 475–487. [Google Scholar] [CrossRef] [PubMed]
- Penttinen, P.; Timonen, K.L.; Tiittanen, P.; Mirme, A.; Ruuskanen, J.; Pekkanen, J. Ultrafine particles in urban air and respiratory health among adult asthmatics. Eur. Respir. J. 2001, 17, 428–435. [Google Scholar] [CrossRef] [PubMed] [Green Version]
- Kanatani, K.T.; Ito, I.; Al-Delaimy, W.K.; Adachi, Y.; Mathews, W.C.; Ramsdell, J.W. Desert dust exposure is associated with increased risk of asthma hospitalization in children. Am. J. Respir. Crit. Care Med. 2010, 182, 1475–1481. [Google Scholar] [CrossRef] [PubMed]
- Goudie, A.S. Desert dust and human health disorders. Environ. Int. 2014, 63, 101–113. [Google Scholar] [CrossRef] [PubMed]
- Gillies, J.A.; Watson, J.G.; Rogers, F.; DuBois, D.; Chow, J.C.; Langston, R.; Sweet, J. Long-Term Efficiencies of Dust Suppressants to Reduce PM10 Emissions from Unpaved Roads. J. Air Waste Manag. Assoc. 1999, 49, 3–16. [Google Scholar] [CrossRef] [PubMed]
- Etyemezian, V.; Ahonen, S.; Nikolic, D.; Gillies, J.; Kuhns, H.; Gillette, D.; Veranth, J. Deposition and Removal of Fugitive Dust in the Arid Southwestern United States: Measurements and Model Results. J. Air Waste Manag. Assoc. 2004, 54, 1099–1111. [Google Scholar] [CrossRef] [PubMed] [Green Version]
- Kuhns, H.; Gillies, J.; Etyemezian, V.; Dubois, D.; Ahonen, S.; Nikolic, D.; Durham, C. Spatial Variability of Unpaved Road Dust PM10 Emission Factors near El Paso, Texas. J. Air Waste Manag. Assoc. 2005, 55, 3–12. [Google Scholar] [CrossRef] [PubMed]
- Jazcilevich, A.; Wellens, A.; Siebe, C.; Rosas, I.; Bornstein, R.; Riojas-Rodríguez, H. Application of a stochastic vehicular wake erosion model to determine PM2.5 exposure. Aeolian Res. 2012, 4, 31–37. [Google Scholar] [CrossRef]
- Vega, E.; Reyes, E.; Sánchez, G.; Ortíz, E.; Ruíz, M.; Chow, J.; Watson, J.; Edgerton, S. Basic statistics of PM2.5 and PM10 in the atmosphere of Mexico City. Sci. Total Environ. 2002, 287, 167–176. [Google Scholar] [CrossRef]
- Mugica, V.; Ortiz, E.; Molina, L.; De Vizcaya-Ruiz, A.; Nebot, A.; Quintana, R.; Aguilar, J.; Alcántara, E. PM composition and source reconciliation in Mexico City. Atmos. Environ. 2009, 43, 5068–5074. [Google Scholar] [CrossRef]
- MCE2. Megacities Initiative: Local and Global Research Observations. Molina Center for Energy and the Environment, 2009. Available online: www.mce2.org/es/campanas/zmvm-2006 (accessed on 26 May 2018).
- Díaz-Nigenda, E.; Tatarko, J.; Jazcilevich, A.; García, A.; Caetano, E.; Ruíz-Suárez, G. A modeling study of Aeolian erosion enhanced by surface wind confluences over Mexico City. Aeolian Res. 2010, 2, 143–157. [Google Scholar] [CrossRef]
- Hamidi, M.; Reza, M.K.; Shao, Y. Numerical simulation of dust events in the Middle East. Aeolian Res. 2014, 13, 59–70. [Google Scholar] [CrossRef]
- Beegum, S.N.; Gherboudj, I.; Chaouch, N.; Couvidat, F.; Menut, L.; Ghedira, H. Simulating aerosols over Arabian Peninsula with CHIMERE: Sensitivity to soil, surface parameters and anthropogenic emission inventories. Atmos. Environ. 2016, 128, 185–197. [Google Scholar] [CrossRef]
- Laden, F.; Neas, L.; Dockery, D.; Schwartz, J. Association of Fine Particulate Matter from Different Sources with Daily Mortality in Six U.S. Cities. Environ. Health Perspect. 2000, 108, 941–947. [Google Scholar] [CrossRef] [PubMed]
- Chepil, W.S.; Woodruff, N.P. Sedimentary characteristics of dust storms. Part II. Visibility and dust concentration. Am. J. Sci. 1957, 255, 104–114. [Google Scholar] [CrossRef]
- Jáuregui, E. La erosión eólica en los suelos vecinos al lago de Texcoco [Wind erosion in neighboring soils of Lake of Texcoco]. Ingeniería Hidráulica en México 1971, XXV-2, 103–117. [Google Scholar]
- Jáuregui, E. Variaciones de largo periodo de la visibilidad en la Ciudad de México [Long period variations of visibility in Mexico City]. Geofísica Internacional 1983, 22–23, 251–275. [Google Scholar]
- Jáuregui, E. The dust storms of Mexico City. Int. J. Climatol. 1989, 9, 169–180. [Google Scholar] [CrossRef]
- U.S. Environmental Protection Agency (US-EPA). User’s Guide for the Industrial Source Complex (ISC3) Dispersion Models, Volume I—User Instruction; EPA-454/B-95-003a; U.S. Environmental Protection Agency: Research Triangle Park, NC, USA, 1995.
- Qiu, G.; Pattey, E. Estimating PM10 emissions from spring wheat harvest using an atmospheric tracer technique. Atmos. Environ. 2008, 42, 8315–8321. [Google Scholar] [CrossRef]
- Lazo, P.; Curé, M.; Gaete, H. Modelación de la dispersión de Anhídrido Sulfuroso en la comuna de Puchuncaví utilizando el programa ISC3 [Modelling of sulphur anhydride dispersion in Puchuncaví city using the ISC3 model]. Ingeniare. Revista Chilena de Ingeniería. 2006, 14, 229–237. [Google Scholar]
- Chalvatzaki, E.; Aleksandropoulou, V.; Glytsos, T.; Lazaridis, M. The effect of dust emissions from open storage piles to particle ambient concentration and human exposure. Waste Manag. 2012, 32, 2456–2468. [Google Scholar] [CrossRef] [PubMed]
- López-Martínez, J.; Gutiérrez-Lujú, S. Comparación de los datos de dispersión de bióxido de azufre y otros contaminantes en la atmósfera, obtenidos experimentalmente y por simulación usando el modelo ISC3 [Data comparison of sulphur dioxide dispersion and other pollutants in the atmosphere, obtained experimentally and by simulation using the ISC3 model]. Tecnología Ciencia y Educación 1999, 14, 10–18. [Google Scholar]
- Návar, J.; Treviño, E. Estimating Tonnage of Soil Particles which Potentially Contribute to Air Pollution in the Metropolitan Area of Monterrey, Mexico. Terra 1998, 16, 21–31. [Google Scholar]
- Watson, J.G.; Chow, J.C.; Pace, T.G. Fugitive dust emissions. In Air Pollution Engineering Manual; Davis, T.W., Ed.; John Wiley & Sons, Inc.: New York, NY, USA, 2000; pp. 117–135. [Google Scholar]
- Kavouras, I.; DuNois, D.W.; Nikolich, G.; Corral Avittia, A.Y.; Etyemezian, V. Particulate dust emission factors from unpaved roads in the U.S.–Mexico border semi-arid region. J. Arid Environ. 2016, 124, 189–192. [Google Scholar] [CrossRef]
- CEIEG. Comité Estatal de Información Estadística y Geográfica, Gobierno del Estado de Chiapas [State Committee of Statistical and Geographic Information, Government of the State of Chiapas]. 2017. Available online: www.ceieg.chiapas.gob.mx/perfiles/ (accessed on 26 May 2018).
- U.S. Environmental Protection Agency (US-EPA). AP 42, Fifth Edition Compilation of Air Pollutant Emission Factors, Volume 1: Stationary Point and Area Sources; U.S. Environmental Protection Agency: Research Triangle Park, NC, USA, 1995.
- Fryrear, D.W.; Stout, S.E.; Hagen, L.J.; Vories, E.D. Wind erosion: Field measurement and analysis. Trans. ASAE 1991, 34, 155–160. [Google Scholar] [CrossRef]
- Prieto Méndez, J.; Prieto García, F.; Acevedo Sandoval, O.; Méndez Marzo, M. Correlation of moisture, pH and zeta potential (ζ) in sandy-clay-loam soils of the southern state of Hidalgo, Mexico. Acta Montanistica Slovaca Ročník 2013, 18, 17–25. [Google Scholar]
- Delgadillo Ramírez, M.; Quechulpa Montalvo, S. Manual de Monitoreo de carbono en Sistemas agroforestales [Handbook for Monitoring Carbon in Agroforestry Systems]; Comisión Nacional Forestal: Mexico, D.F., Mexico; AMBIO S.C. de R.L.: Chiapas, Mexico, 2006. [Google Scholar]
- ASTM D422/63. Standard Test Method for Particle-Size Analysis of Soils; ASTM International: West Conshohocken, PA, USA, 2002. [Google Scholar]
- Wachecka-Kotkowska, L.; Kotkowski, P. Grain-size distribution analysis of Quaternary sediments from the southern part of the Lodz region in Poland: A computational-methods approach. Geologos 2011, 17, 205–219. [Google Scholar] [CrossRef]
- Feng, G.; Sharratt, B.S. Evaluation of the SWEEP model during high winds on the Columbia Plateau. Earth Surf. Process. Landf. 2009, 34, 1461–1468. [Google Scholar] [CrossRef]
- Van Donk, S.J.; Skidmore, E.L. Field experiment for evaluating wind erosion models. Ann. Arid Zone 2001, 40, 281–302. [Google Scholar]
- Van Donk, S.J.; Skidmore, E.L. Measurement and simulation of wind erosion, roughness degradation and residue decomposition on an agricultural field. Earth Surf. Process. Landf. 2003, 28, 1243–1258. [Google Scholar] [CrossRef] [Green Version]
- Van Donk, S.J.; Huang, X.; Skidmore, E.L.; Anderson, A.B.; Gebhart, D.L.; Prehodaz, V.E.; Kellogg, E.M. Wind erosion from military training lands in the Mojave Desert, California, USA. J. Arid Environ. 2003, 54, 687–703. [Google Scholar] [CrossRef]
- Hagen, L.J. Evaluation of the Wind Erosion Prediction System (WEPS) erosion submodel on cropland fields. Environ. Model. Softw. 2004, 19, 171–176. [Google Scholar] [CrossRef]
- Sharratt, B.; Feng, G.; Wendling, L. Loss of soil and PM10 from agricultural fields associated with high winds on the Columbia Plateau. Earth Surf. Process. Landf. 2007, 32, 621–630. [Google Scholar] [CrossRef]
- Goossens, D.; Buck, B.J. Can BSNE (Big Spring Number Eight) samplers be used to measure PM10, respirable dust, PM2.5, and PM1.0? Aeolian Res. 2012, 5, 43–49. [Google Scholar] [CrossRef]
- Environmental Systems Research Incorporated (ESRI). ArcGIS 10.0; Environmental Systems Research Incorporated: Redlands, CA, USA, 2011. [Google Scholar]
- Mirzamostafa, N.; Stone, L.R.; Hagen, L.J.; Skidmore, E.L. Soil Aggregate and Texture Effects on Suspension Components from Wind Erosion. Soil Sci. Soc. Am. J. 1998, 62, 1351–1361. [Google Scholar] [CrossRef]
- Hagen, L.J. Fine particulates (PM10 and PM2.5) generated by breakage of mobile aggregates during simulated wind erosion. Trans. ASAE 2004, 47, 107–112. [Google Scholar] [CrossRef]
- US-EPA. PM-10 Guideline Document; EPA-452/R-93-008; Office of Air Quality Planning and Standards, United Stated Environmental Protection Agency: Research Triangle Park, NC, USA, 1993.
- NOM Norma Oficial Mexicana. Valores límites permisibles para la concentración de partículas suspendidas PM10 y PM2.5 en el aire ambiente y criterios para su evaluación [Environmental Health. Air Quality Standards for PM10 and PM2.5 Particles in Ambient Air and Criteria for Evaluation]; NOM-025-SSA1-2014 Salud Ambiental; Secretaría de Salud: México, D.F., México, 2014. [Google Scholar]
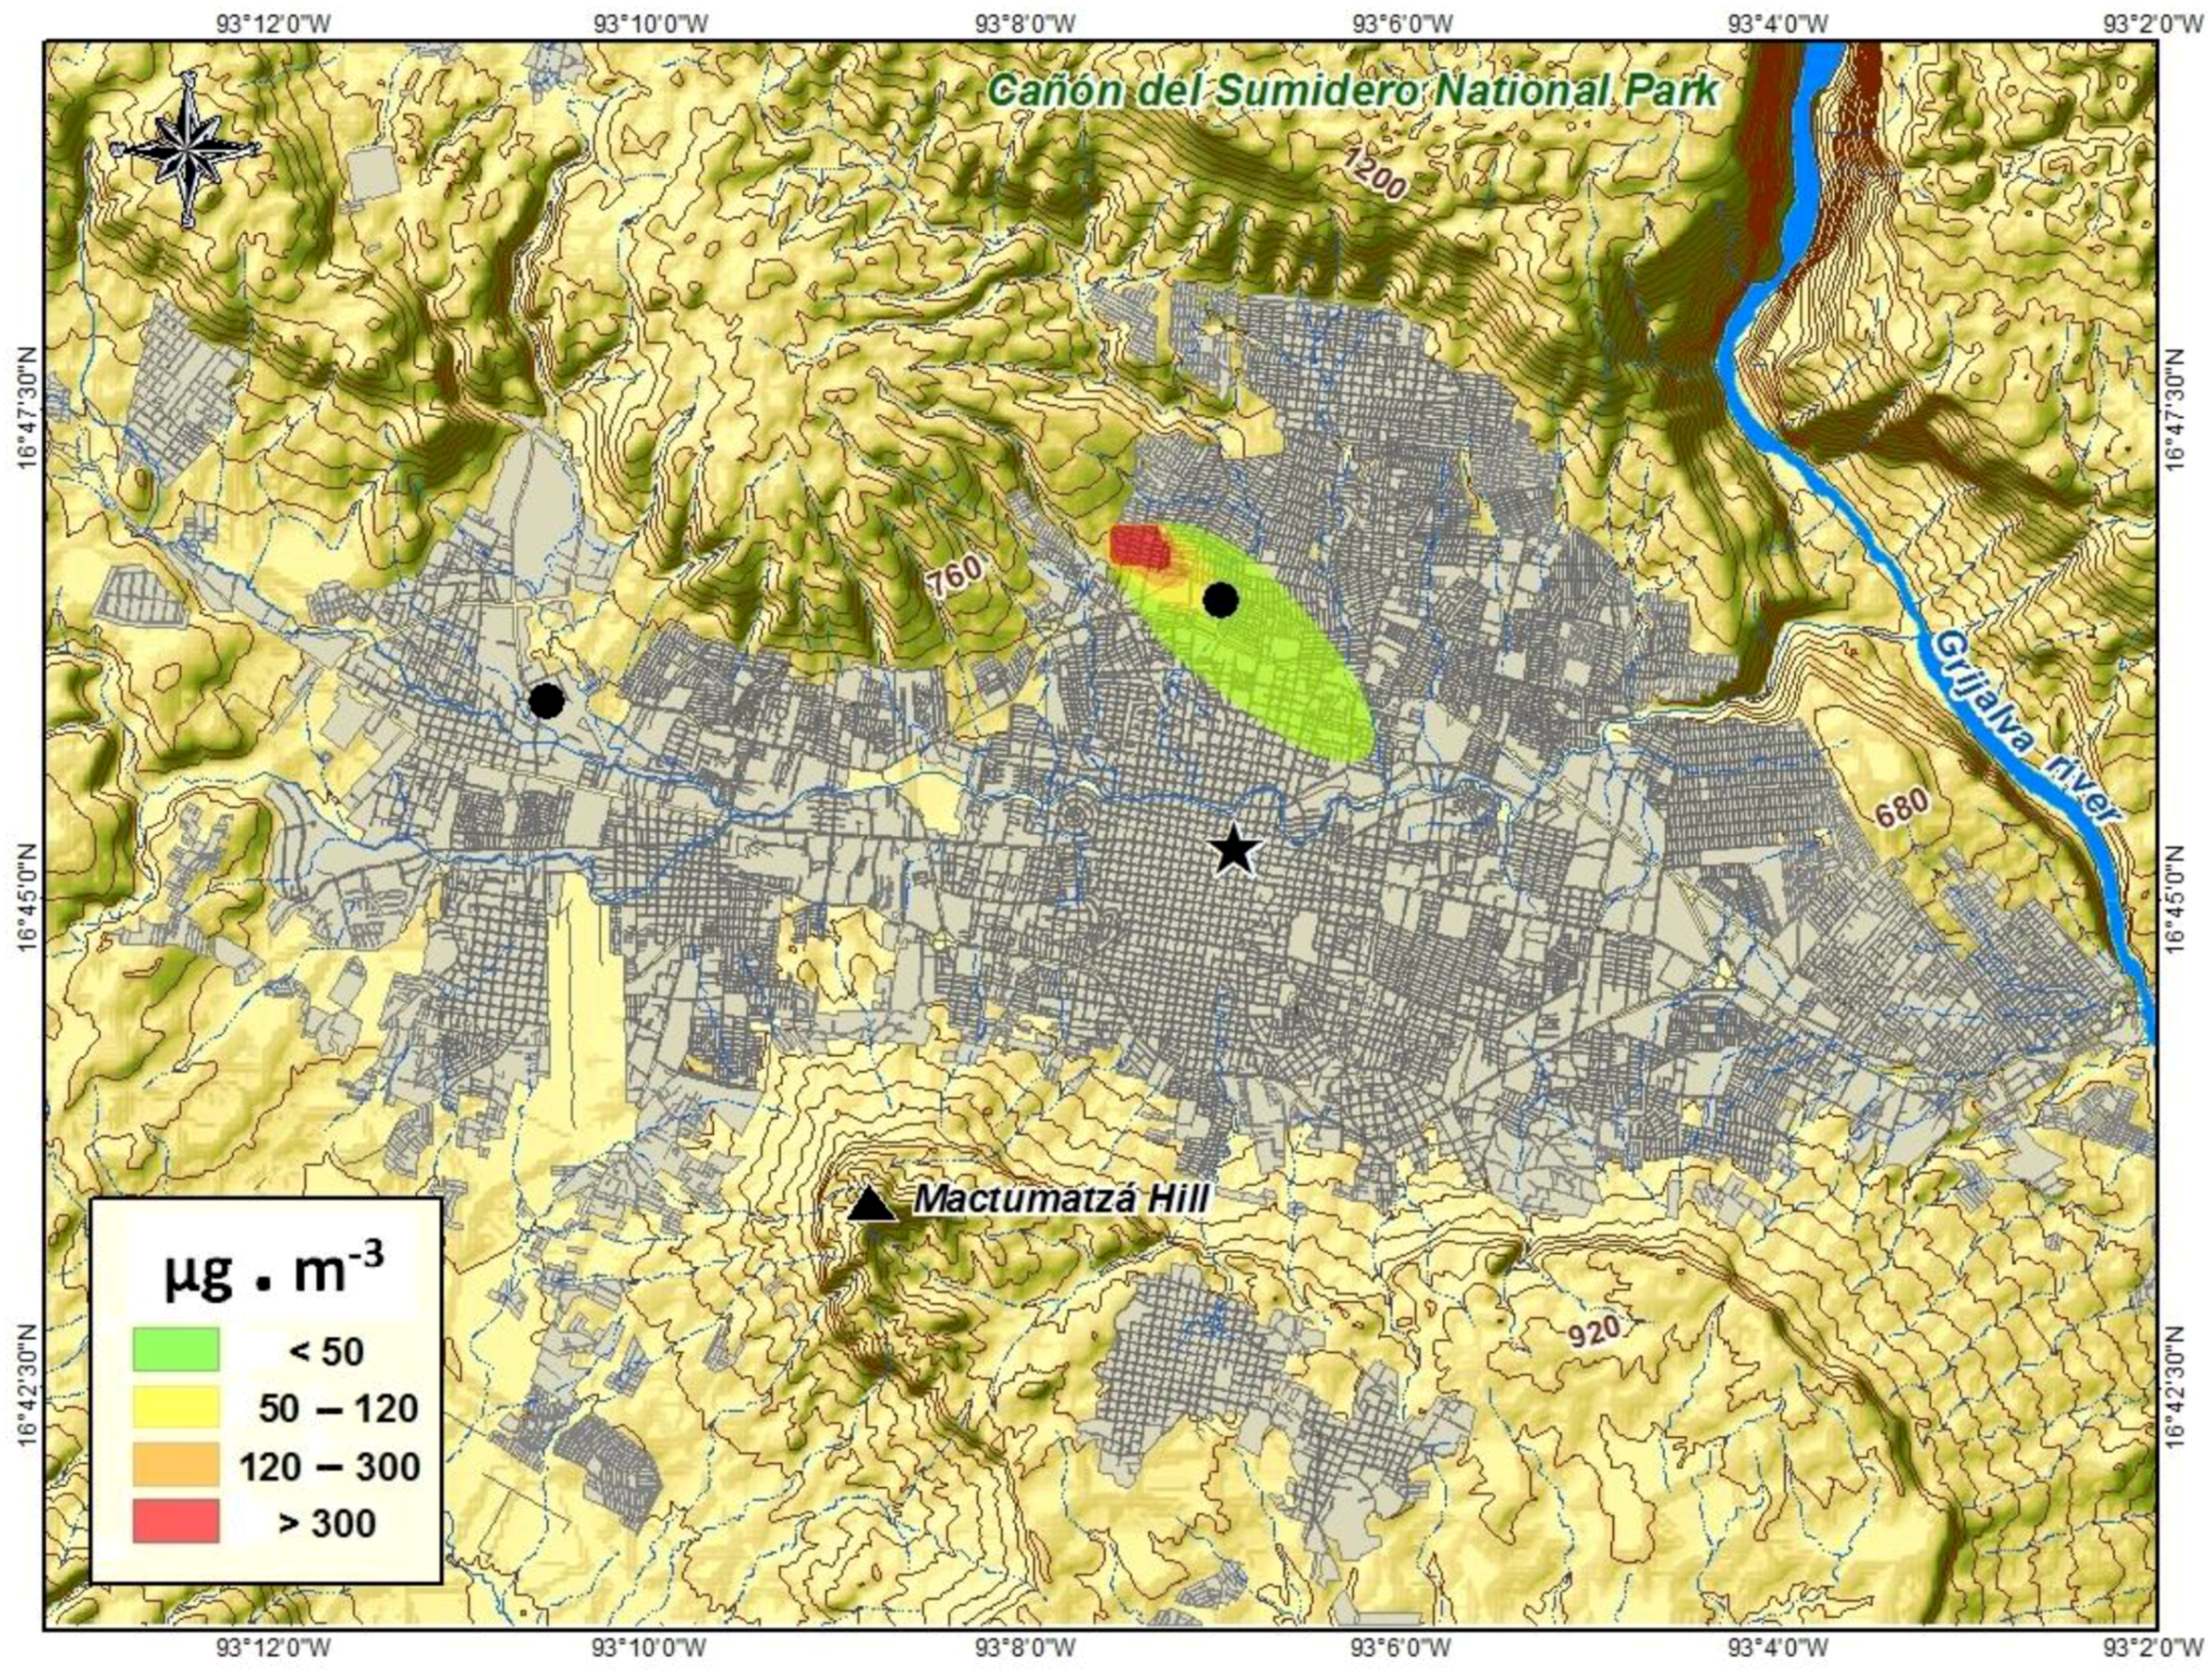
 . The blue lines represent the presence of rivers and streams. The brown slight lines represent elevation in meters above sea level.
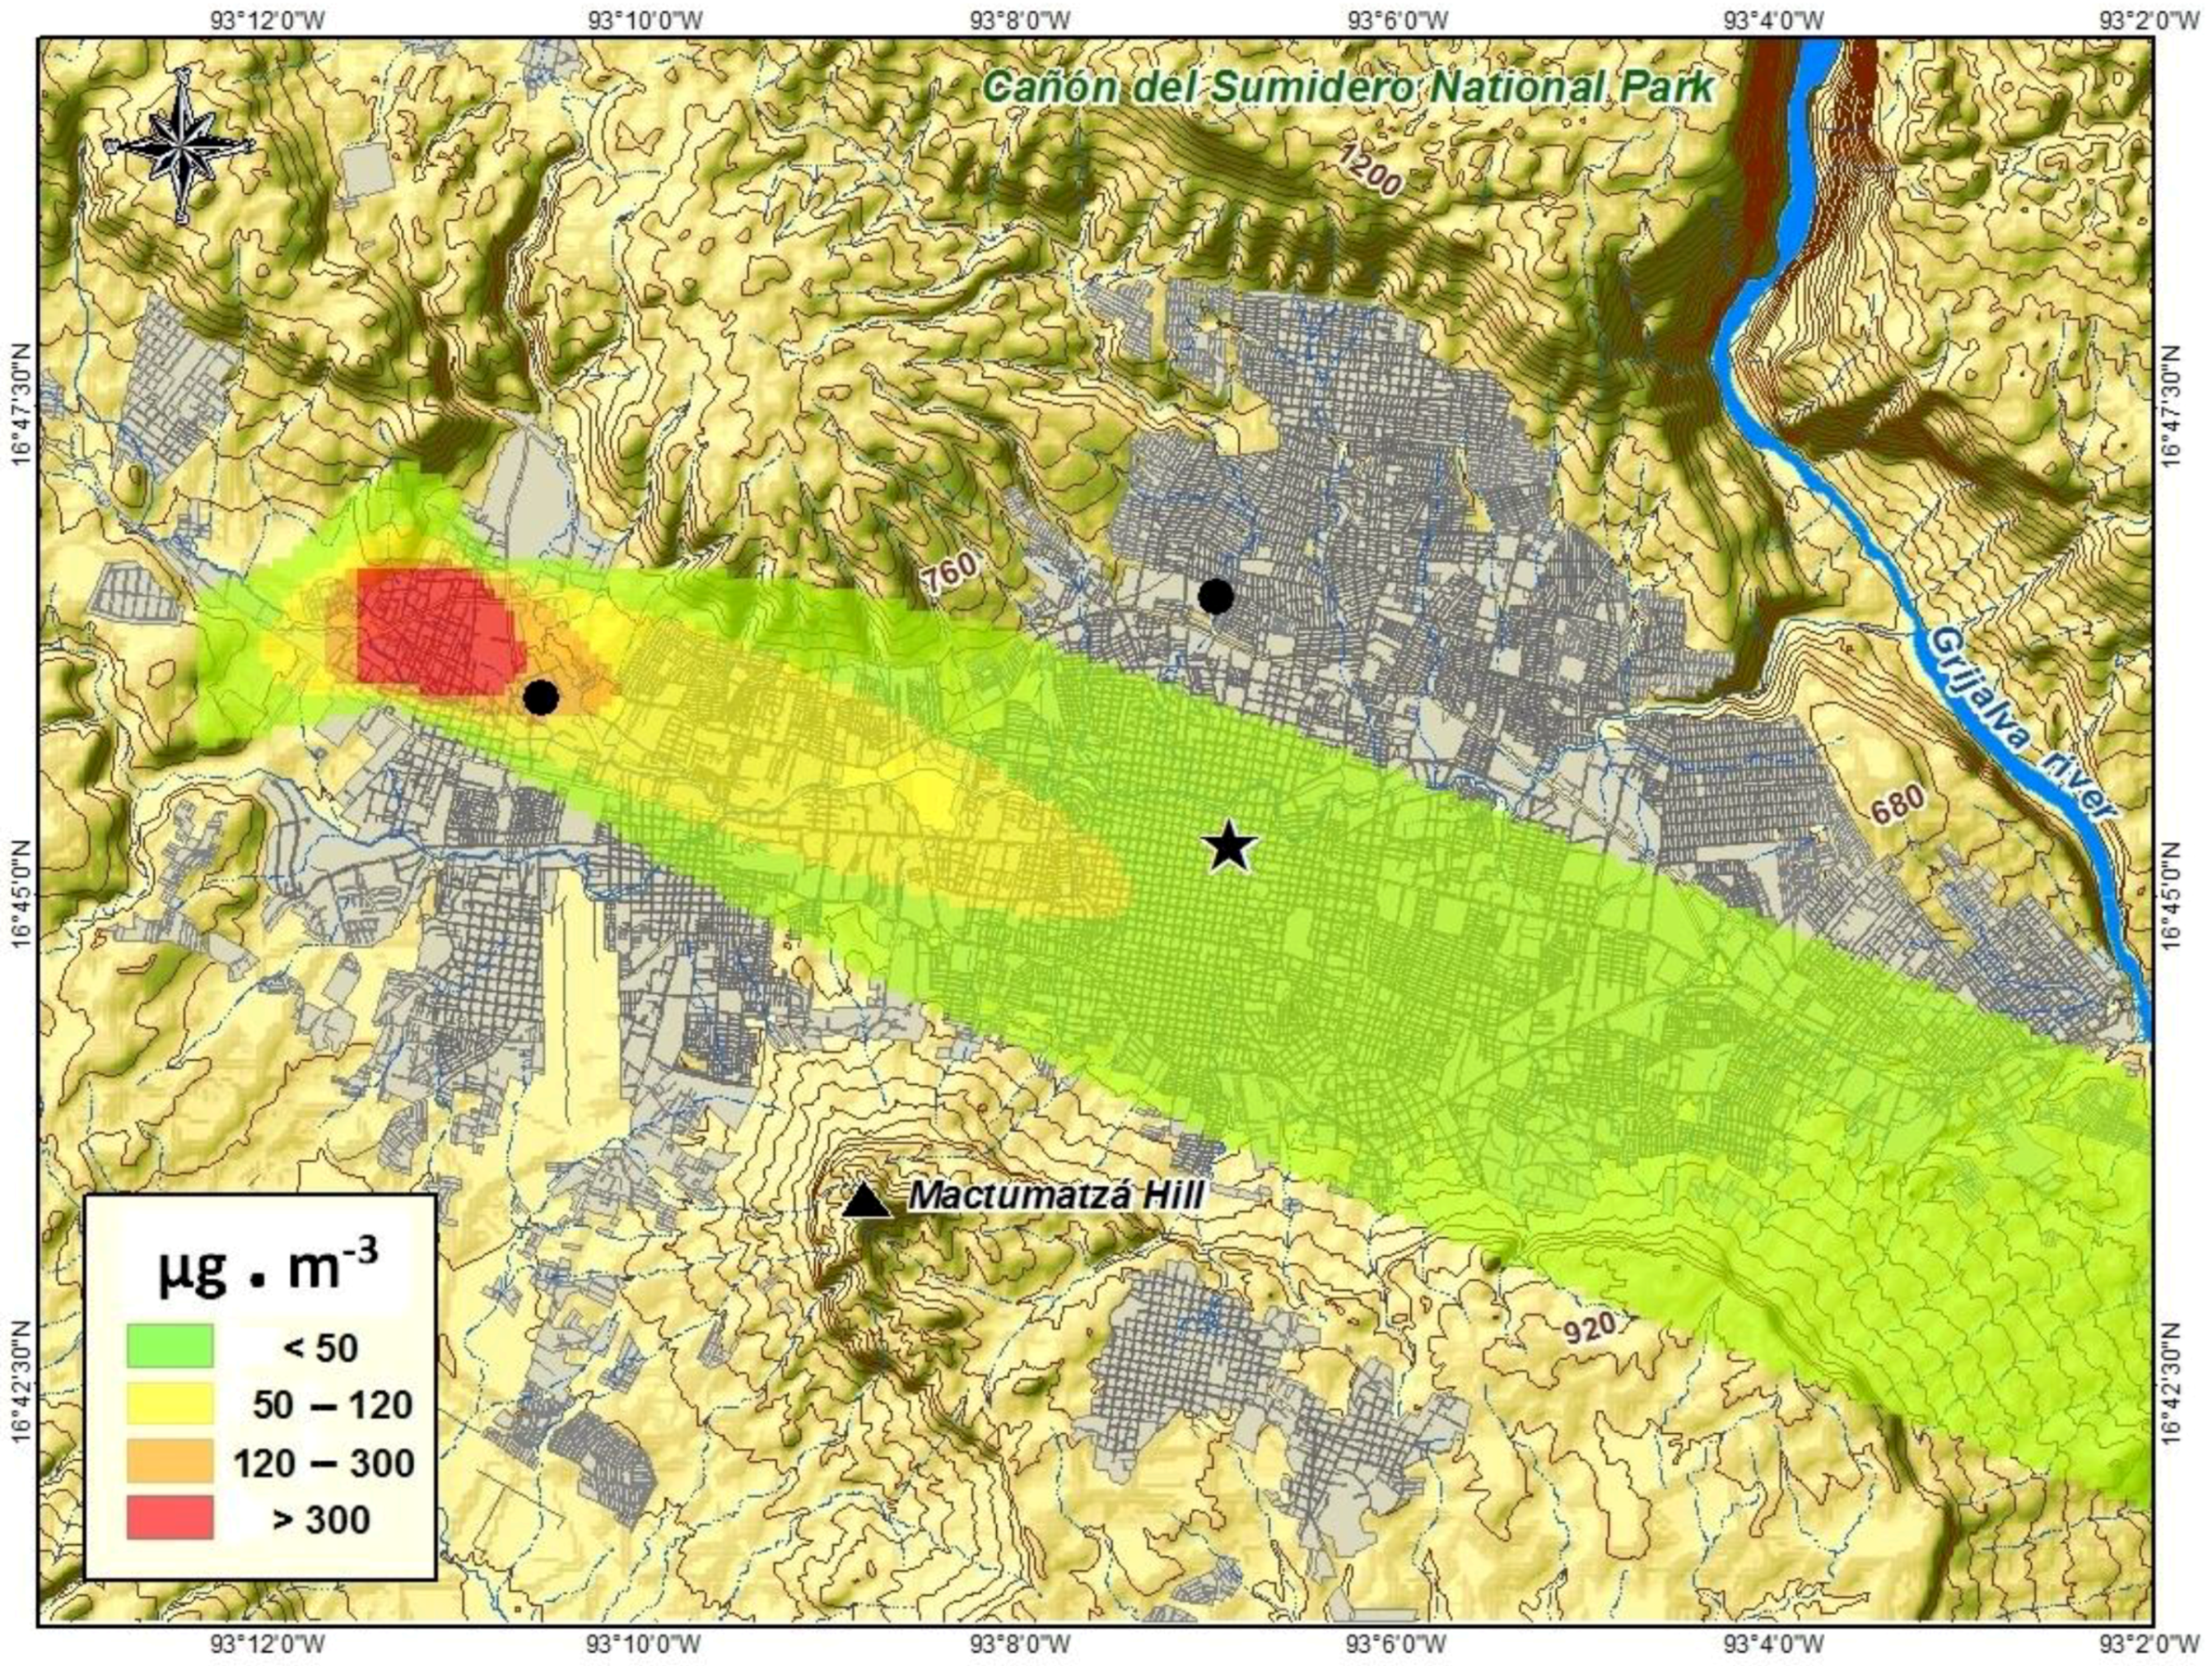
. The blue lines represent the presence of rivers and streams. The brown slight lines represent elevation in meters above sea level.
. The blue lines represent the presence of rivers and streams. The brown slight lines represent elevation in meters above sea level.


 .
.
.
. .
.
.
. .
.
.
.

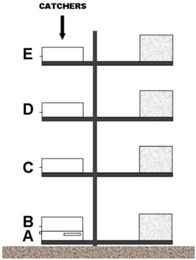 | Catcher Location | Opening L × H (cm) | Height (m) | |
| Lajas Maciel | Plan de Ayala | |||
| E | 2 × 5 | 2.10 | 2.40 | |
| D | 1.40 | 1.60 | ||
| C | 0.70 | 1.00 | ||
| B | 0.13 | 0.24 | ||
| A | 2 × 1 | 0.10 | 0.14 | |
| Parameter | Site | |
|---|---|---|
| Lajas Maciel | Plan de Ayala | |
| Sand content (%) | 64.1 | 70.8 |
| Silt content (%) | 12.0 | 10.3 |
| Clay content (%) | 23.9 | 19.0 |
| Bulk density (g·cm−3) | 1.4 | 1.6 |
| Saltation size material content (%) | 25.1 | 35.1 |
| Suspension size material content (%) | 5.9 | 6.3 |
| PM10 content (%) | 0.3 | 1.2 |
| Slope (degrees) | 12 | 7 |
| Road width (m) | 6 | 10 |
| Distance up wind (m) | 70 | 100 |
| Site | Date | Event | Maximum Observed Wind Speed (m·s−1) | Discharge of Sediments (10−3 kg·m−1) | PM10 Emission (10−3 g·m−2·s−1) |
|---|---|---|---|---|---|
| Lajas Maciel | 12 February 2014 | 1 | 8.9 | 3.78 | 0.95 |
| 2 | 10.3 | 8.17 | 2.04 | ||
| 3 | 8.9 | 4.06 | 1.02 | ||
| 4 | 8.9 | 5.78 | 1.45 | ||
| Plan de Ayala | 21 February 2014 | 1 | 9.4 | 18.18 | 3.18 |
| 2 | 6.3 | 10.95 | 1.92 | ||
| 3 | 6.7 | 8.86 | 1.55 | ||
| 4 | 10.3 | 22.52 | 3.94 |
| Date | PM10 (µg·m−3) | |
|---|---|---|
| Minivol | ISC3 | |
| 27 February 2014 | 1307 | 37 |
| 8 March 2014 | 114 | 177 |
| 13 March 2014 | 63 | 403 |
© 2018 by the authors. Licensee MDPI, Basel, Switzerland. This article is an open access article distributed under the terms and conditions of the Creative Commons Attribution (CC BY) license (http://creativecommons.org/licenses/by/4.0/).
Share and Cite
Díaz-Nigenda, E.; Tatarko, J.; Morales-Iglesias, H.; Hernández Méndez, Z.; Vázquez Morales, W.; Alatorre-Ibargüengoitia, M.A. Measurement and Modeling Air Quality Impacts of Dust Emissions from Unpaved Roads in Tuxtla Gutierrez, Chiapas. Geosciences 2018, 8, 284. https://doi.org/10.3390/geosciences8080284
Díaz-Nigenda E, Tatarko J, Morales-Iglesias H, Hernández Méndez Z, Vázquez Morales W, Alatorre-Ibargüengoitia MA. Measurement and Modeling Air Quality Impacts of Dust Emissions from Unpaved Roads in Tuxtla Gutierrez, Chiapas. Geosciences. 2018; 8(8):284. https://doi.org/10.3390/geosciences8080284
Chicago/Turabian StyleDíaz-Nigenda, Emmanuel, John Tatarko, Horacio Morales-Iglesias, Zuleyma Hernández Méndez, Williams Vázquez Morales, and Miguel Angel Alatorre-Ibargüengoitia. 2018. "Measurement and Modeling Air Quality Impacts of Dust Emissions from Unpaved Roads in Tuxtla Gutierrez, Chiapas" Geosciences 8, no. 8: 284. https://doi.org/10.3390/geosciences8080284