Possibility of Groundwater Pollution in Halabja Saidsadiq Hydrogeological Basin, Iraq Using Modified DRASTIC Model Based on AHP and Tritium Isotopes


Abstract
:1. Introduction
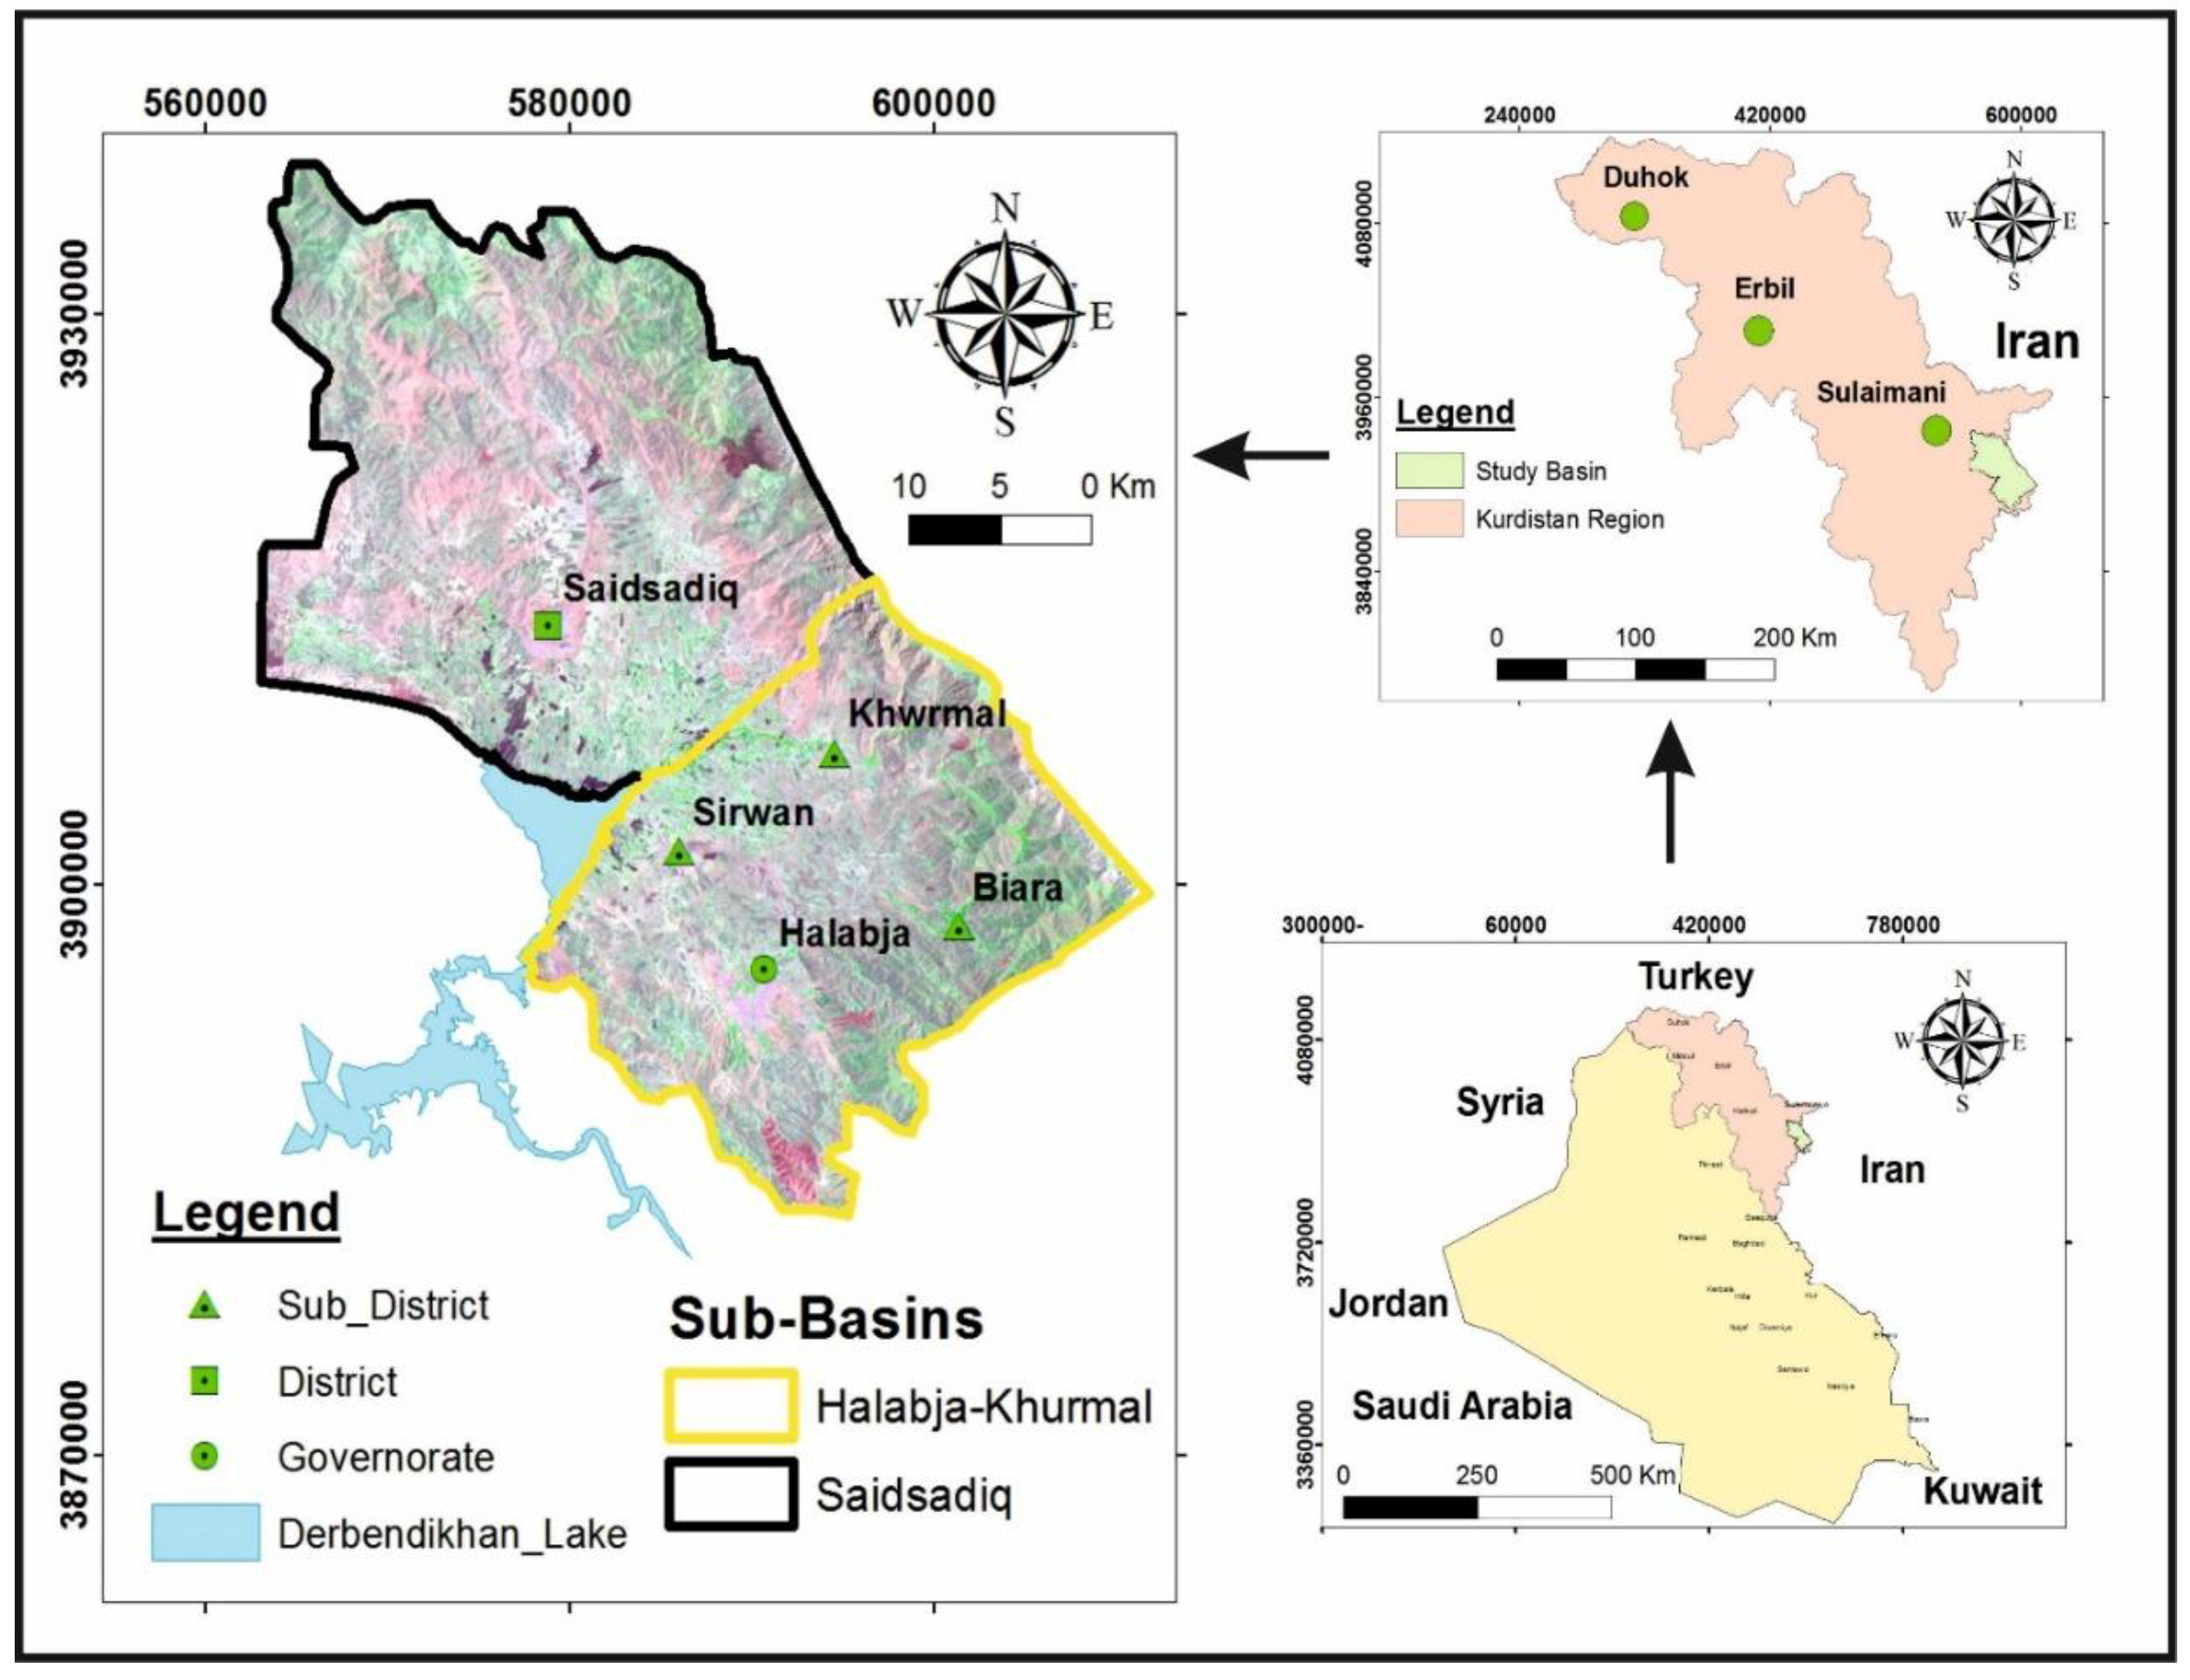
1.1. Study Area
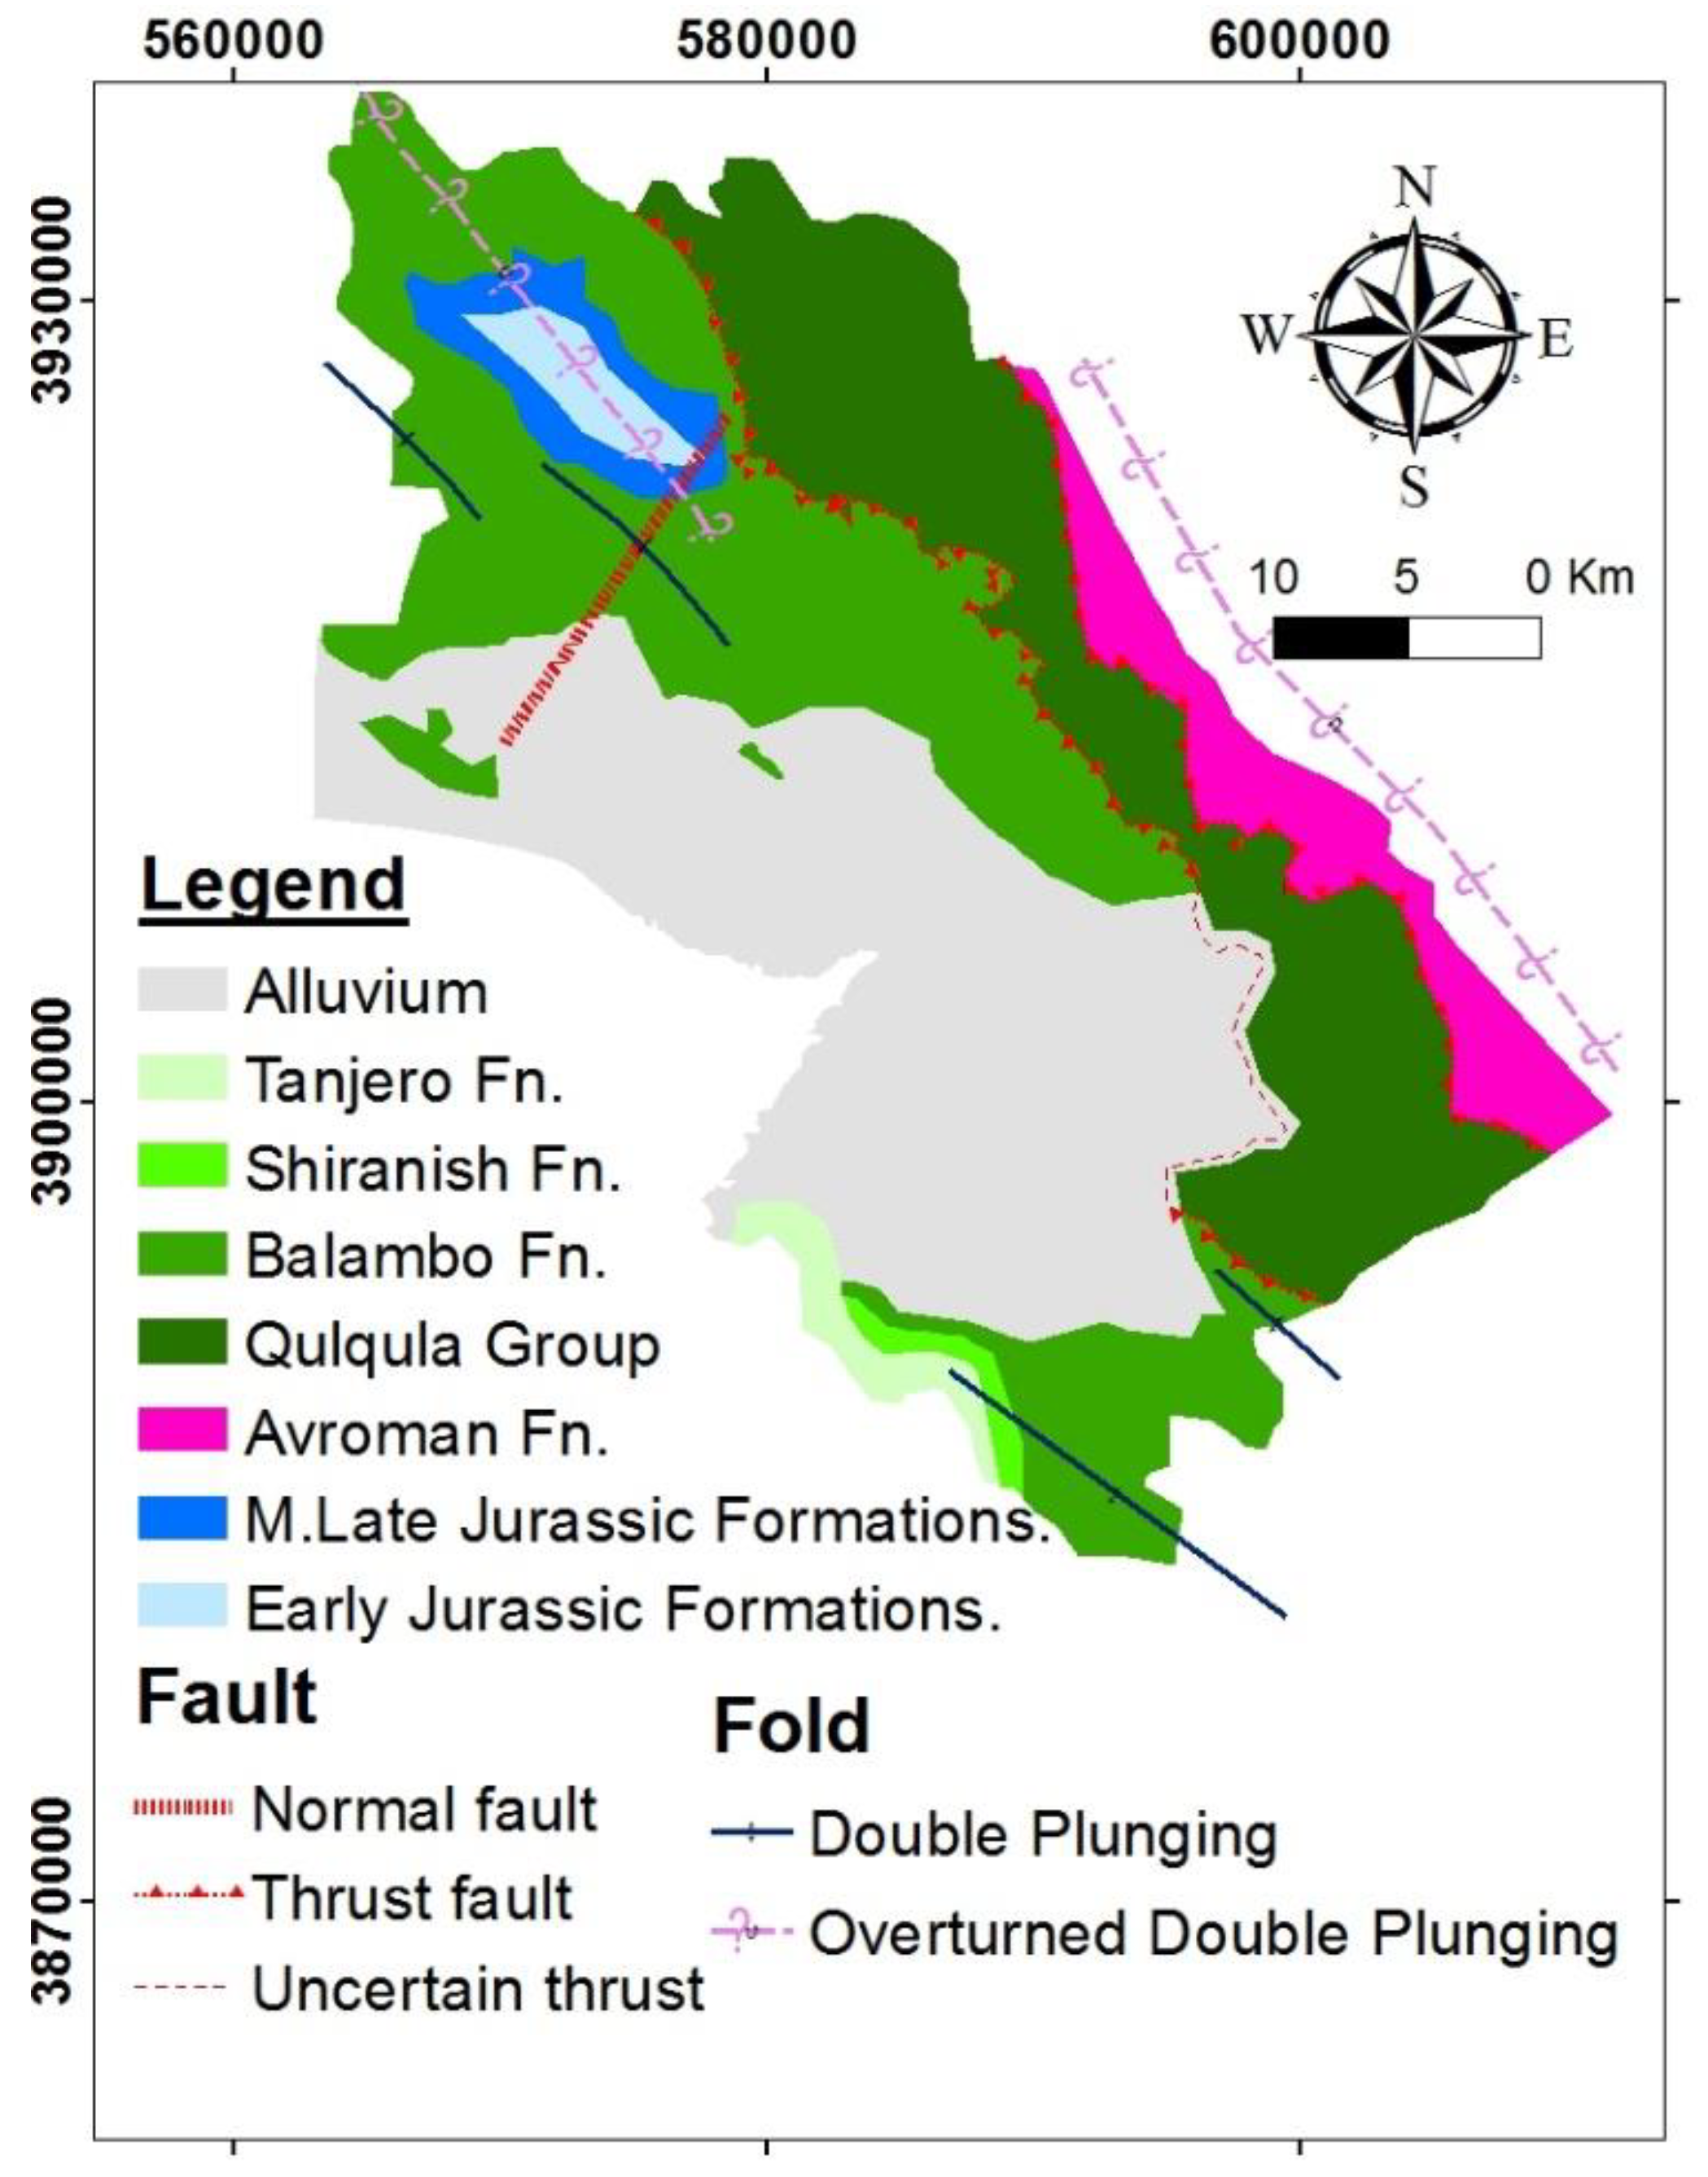
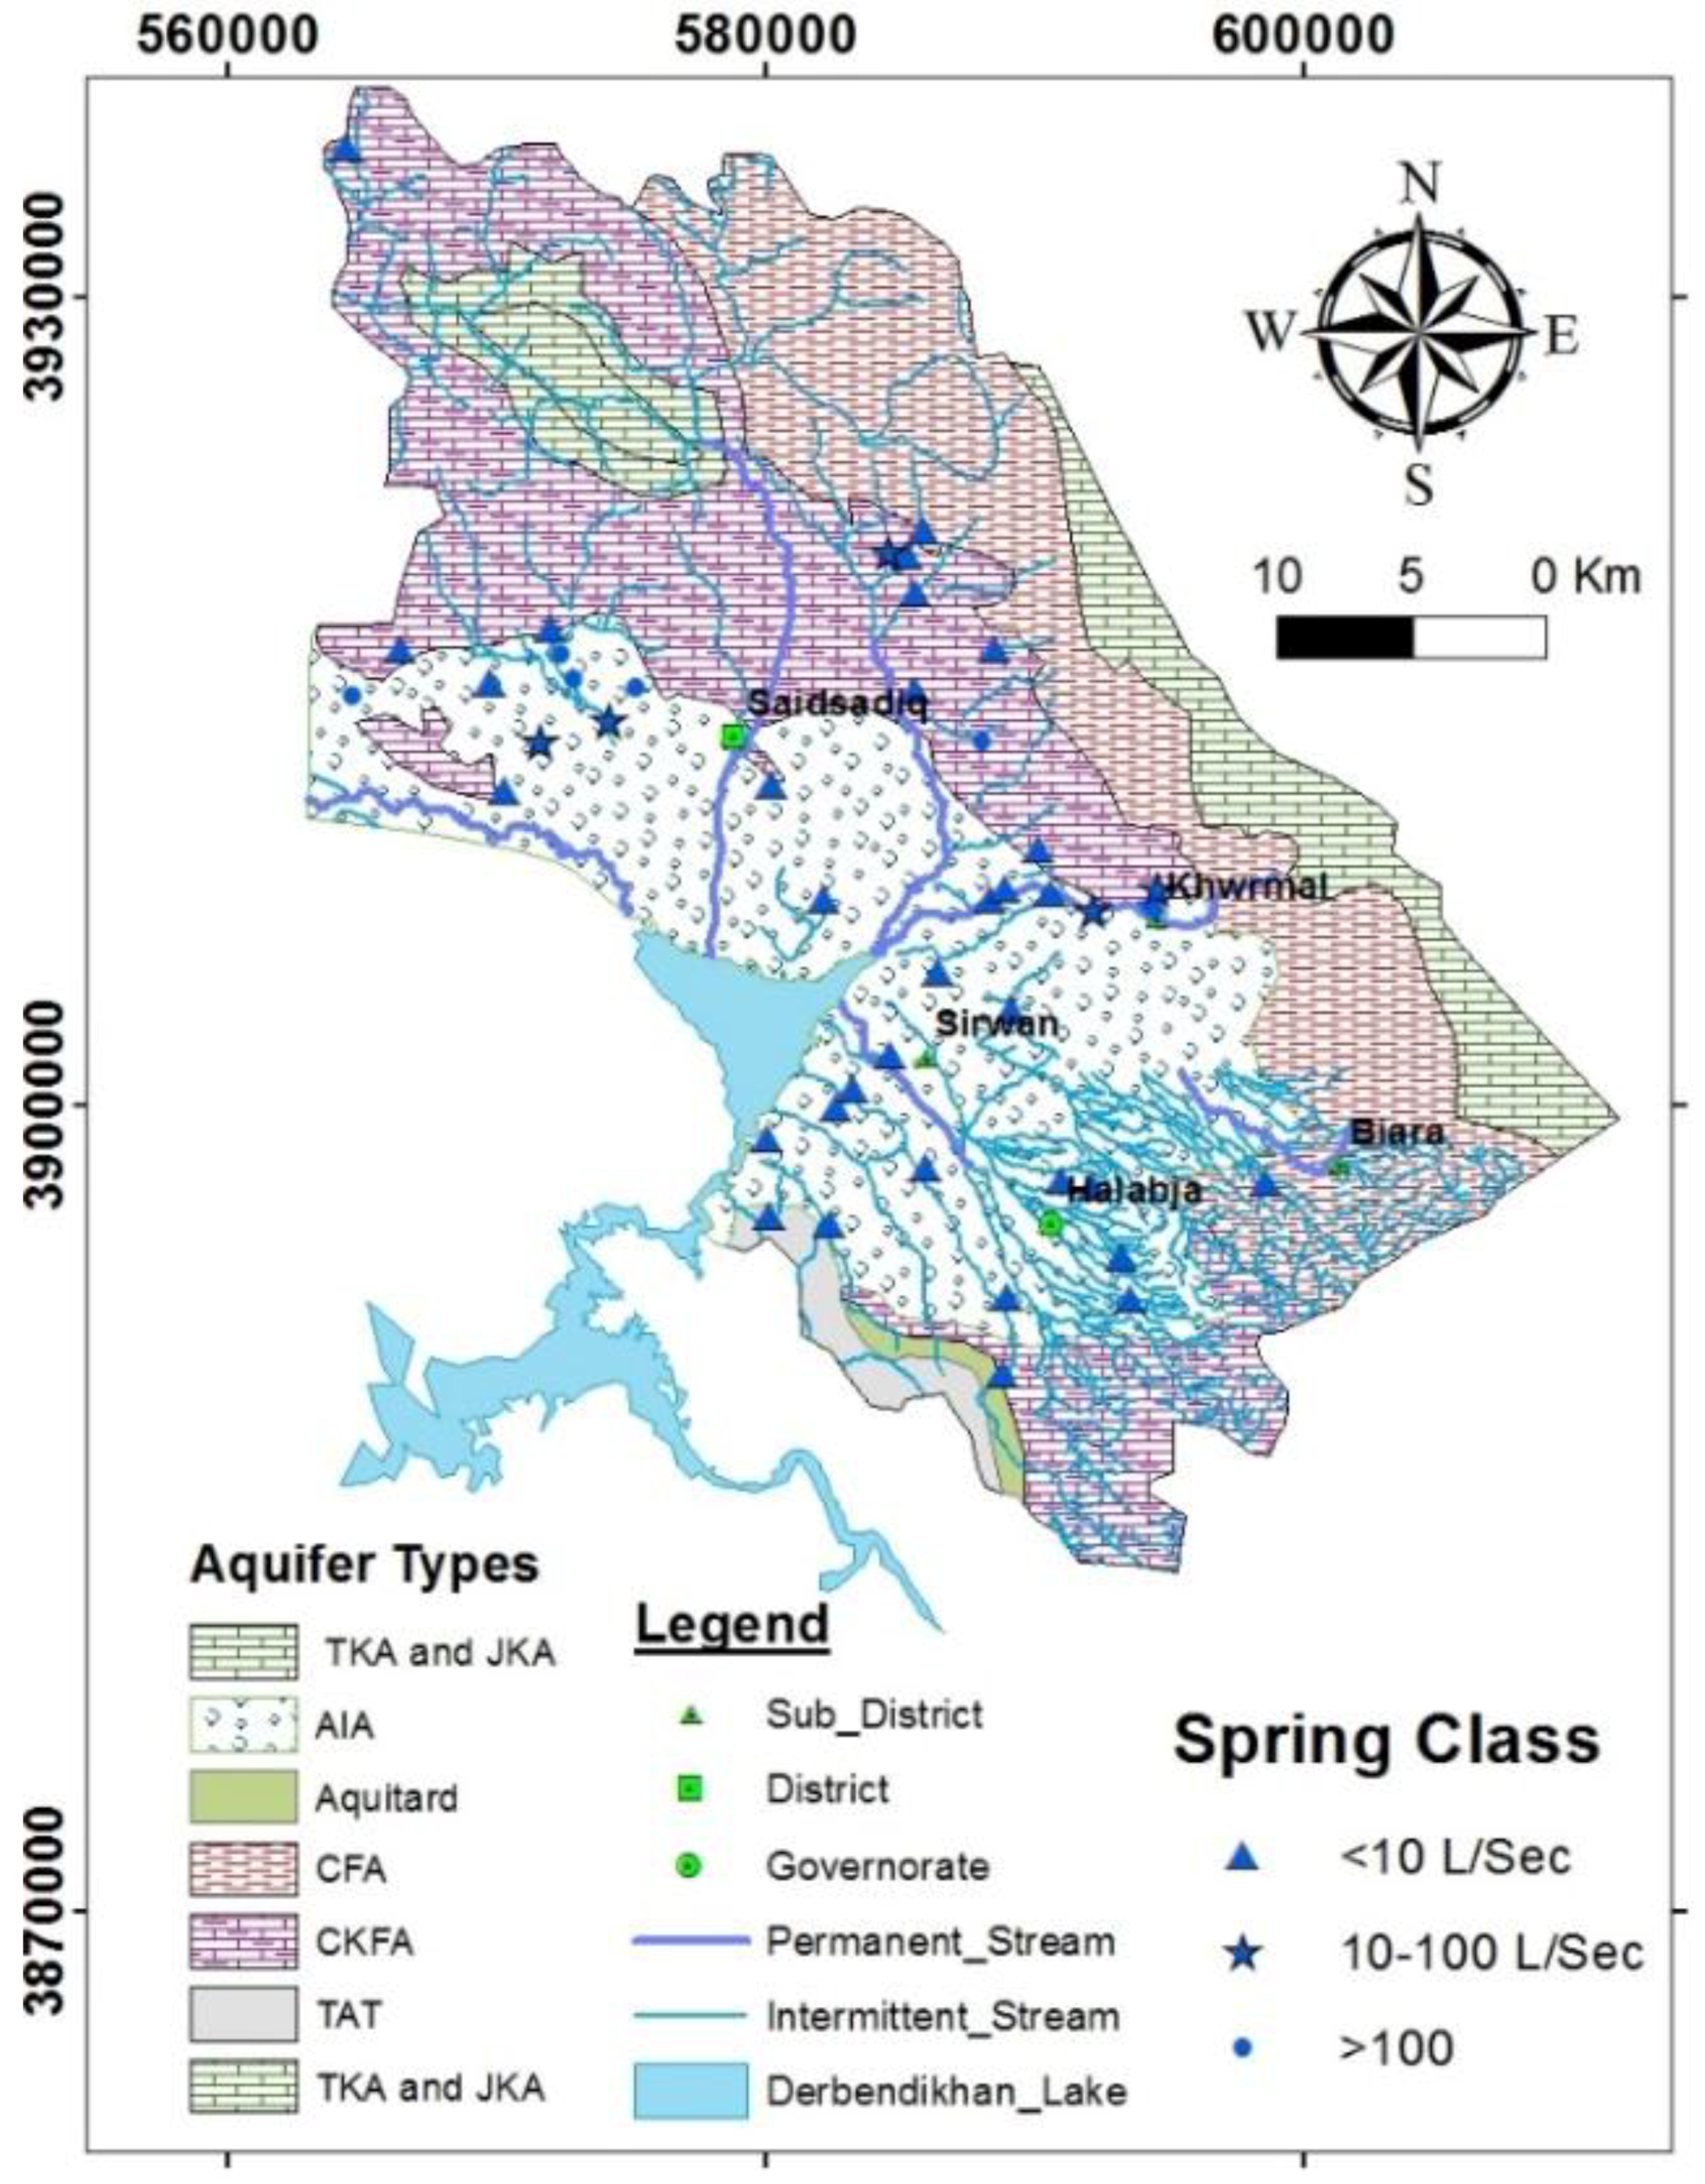
1.2. Geology and Hydrogeological Setting
2. Methodology
2.1. Material and Source of Data
2.2. DRASTIC Vulnerability Model
2.3. Analytic Hierarchy Process (AHP) Applied to DRASTIC Model
3. Result and Discussion
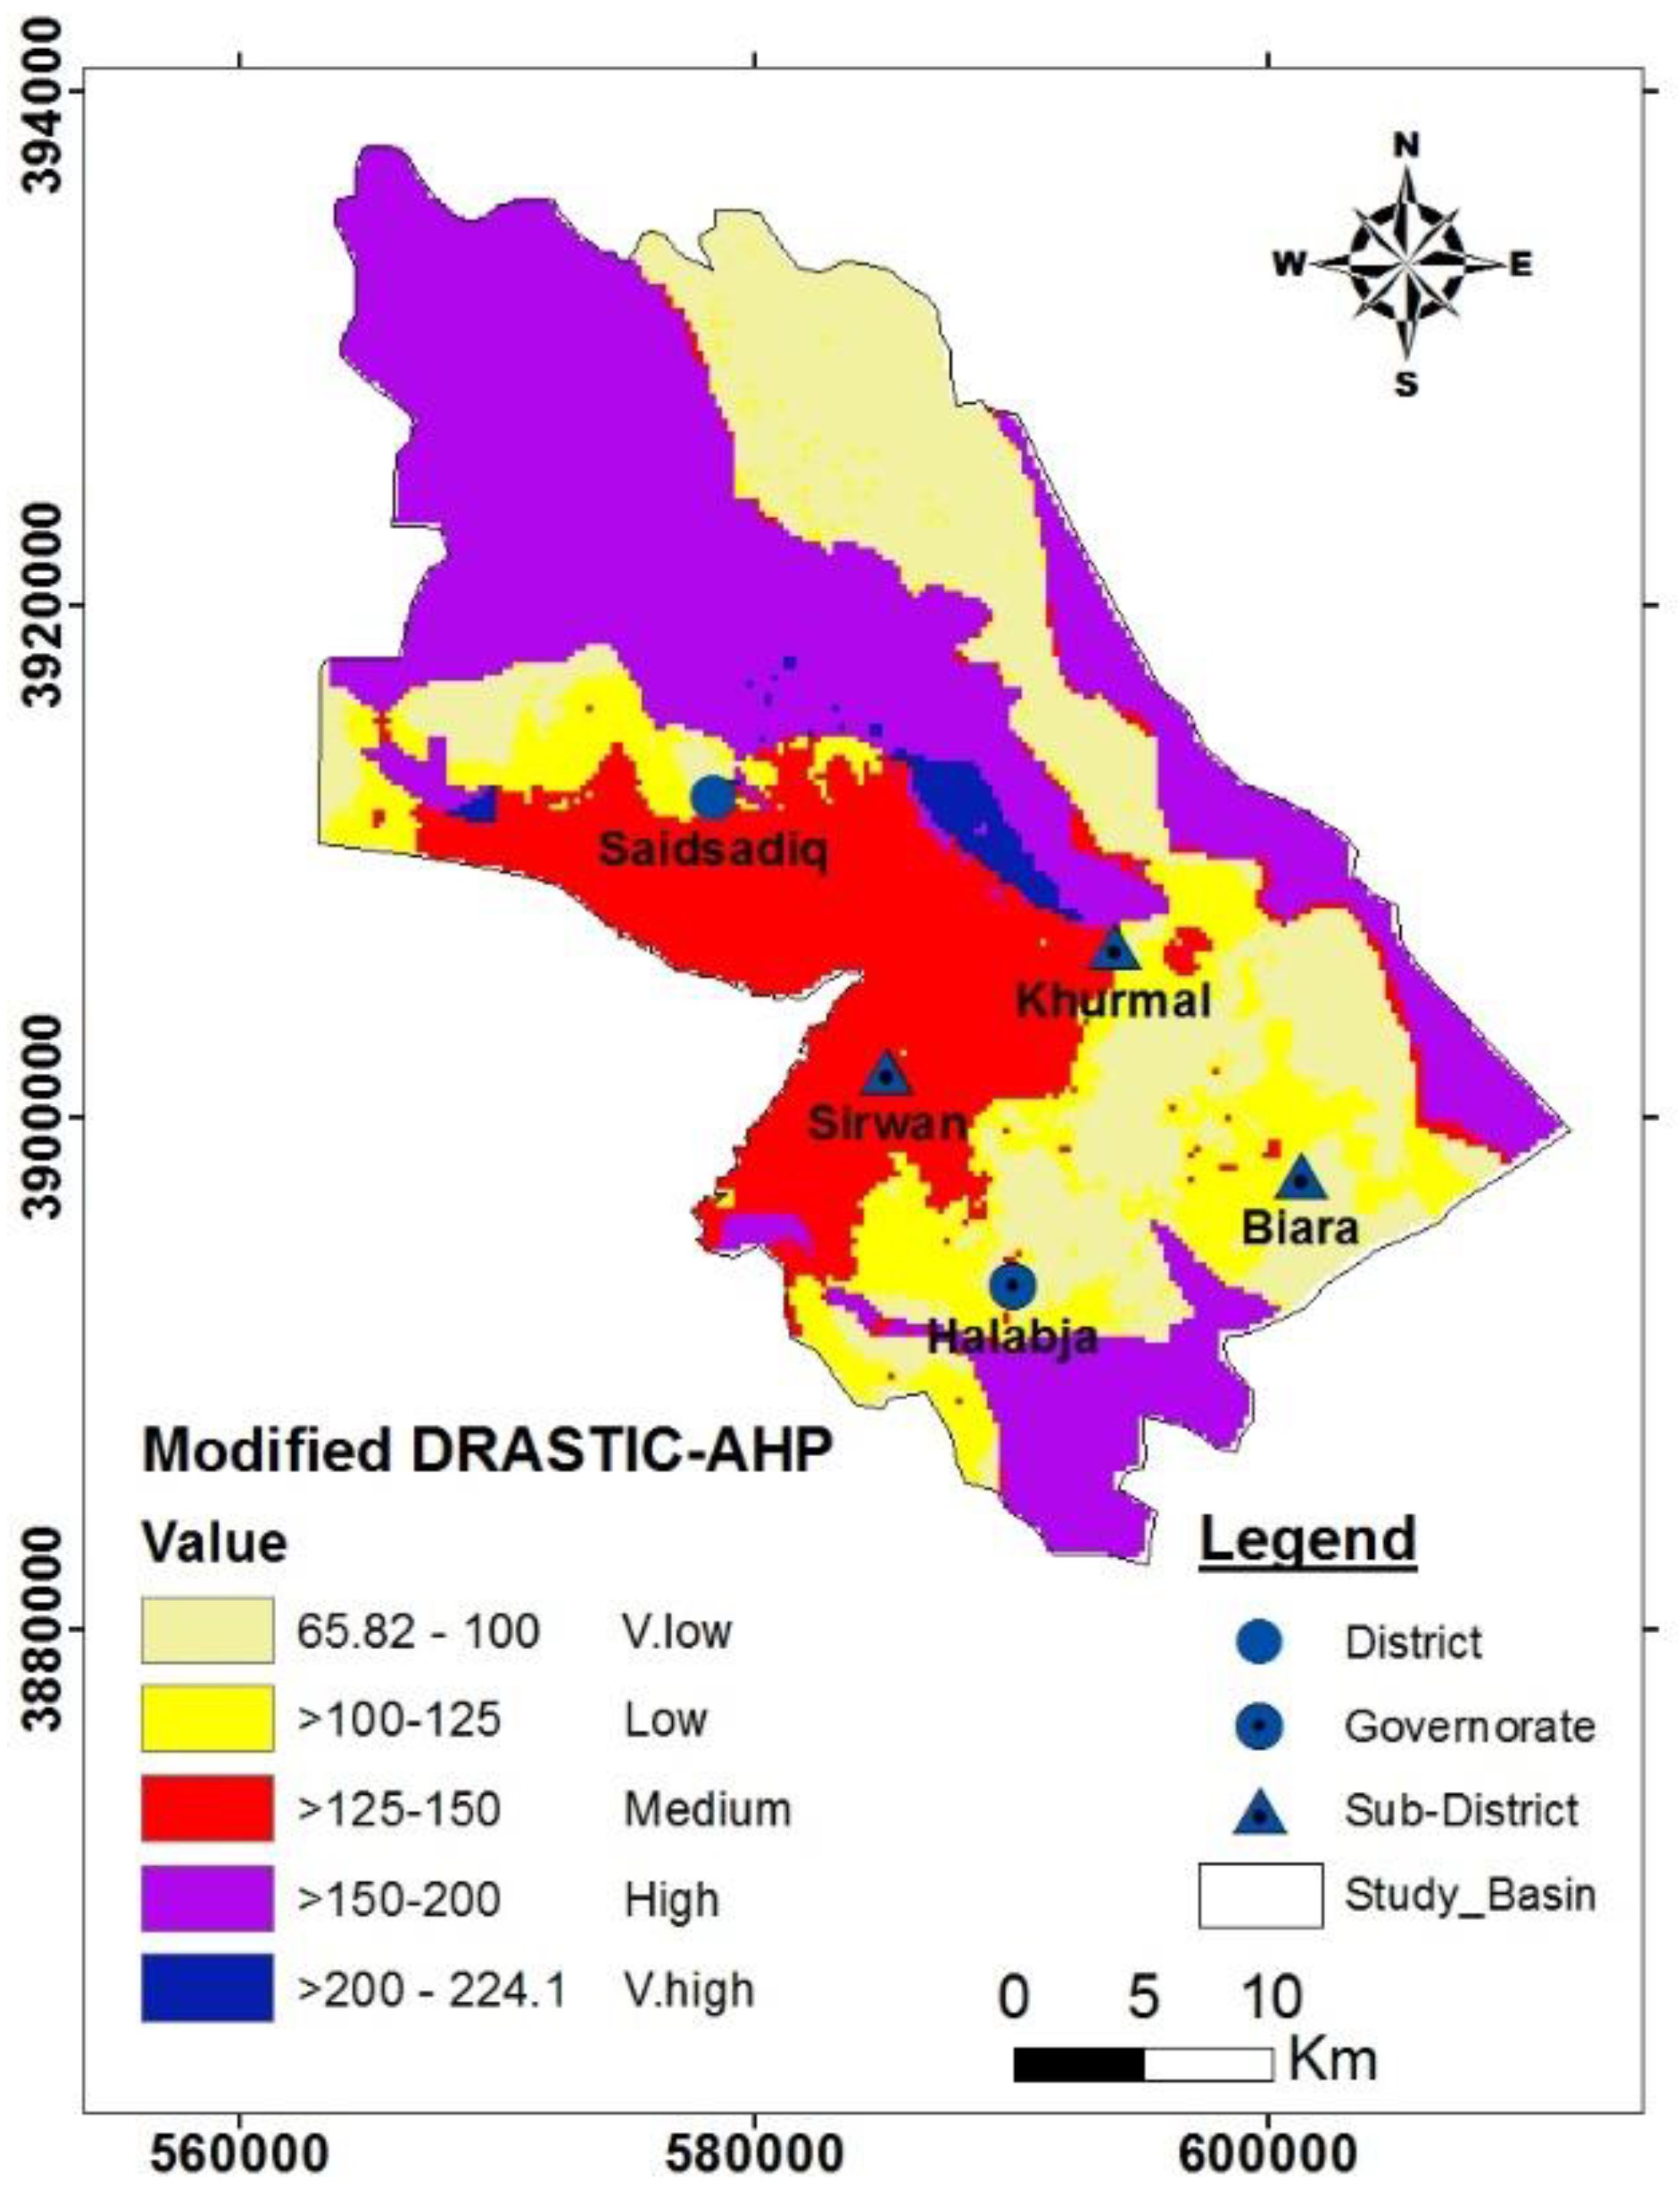
3.1. Modified DRASTIC Model
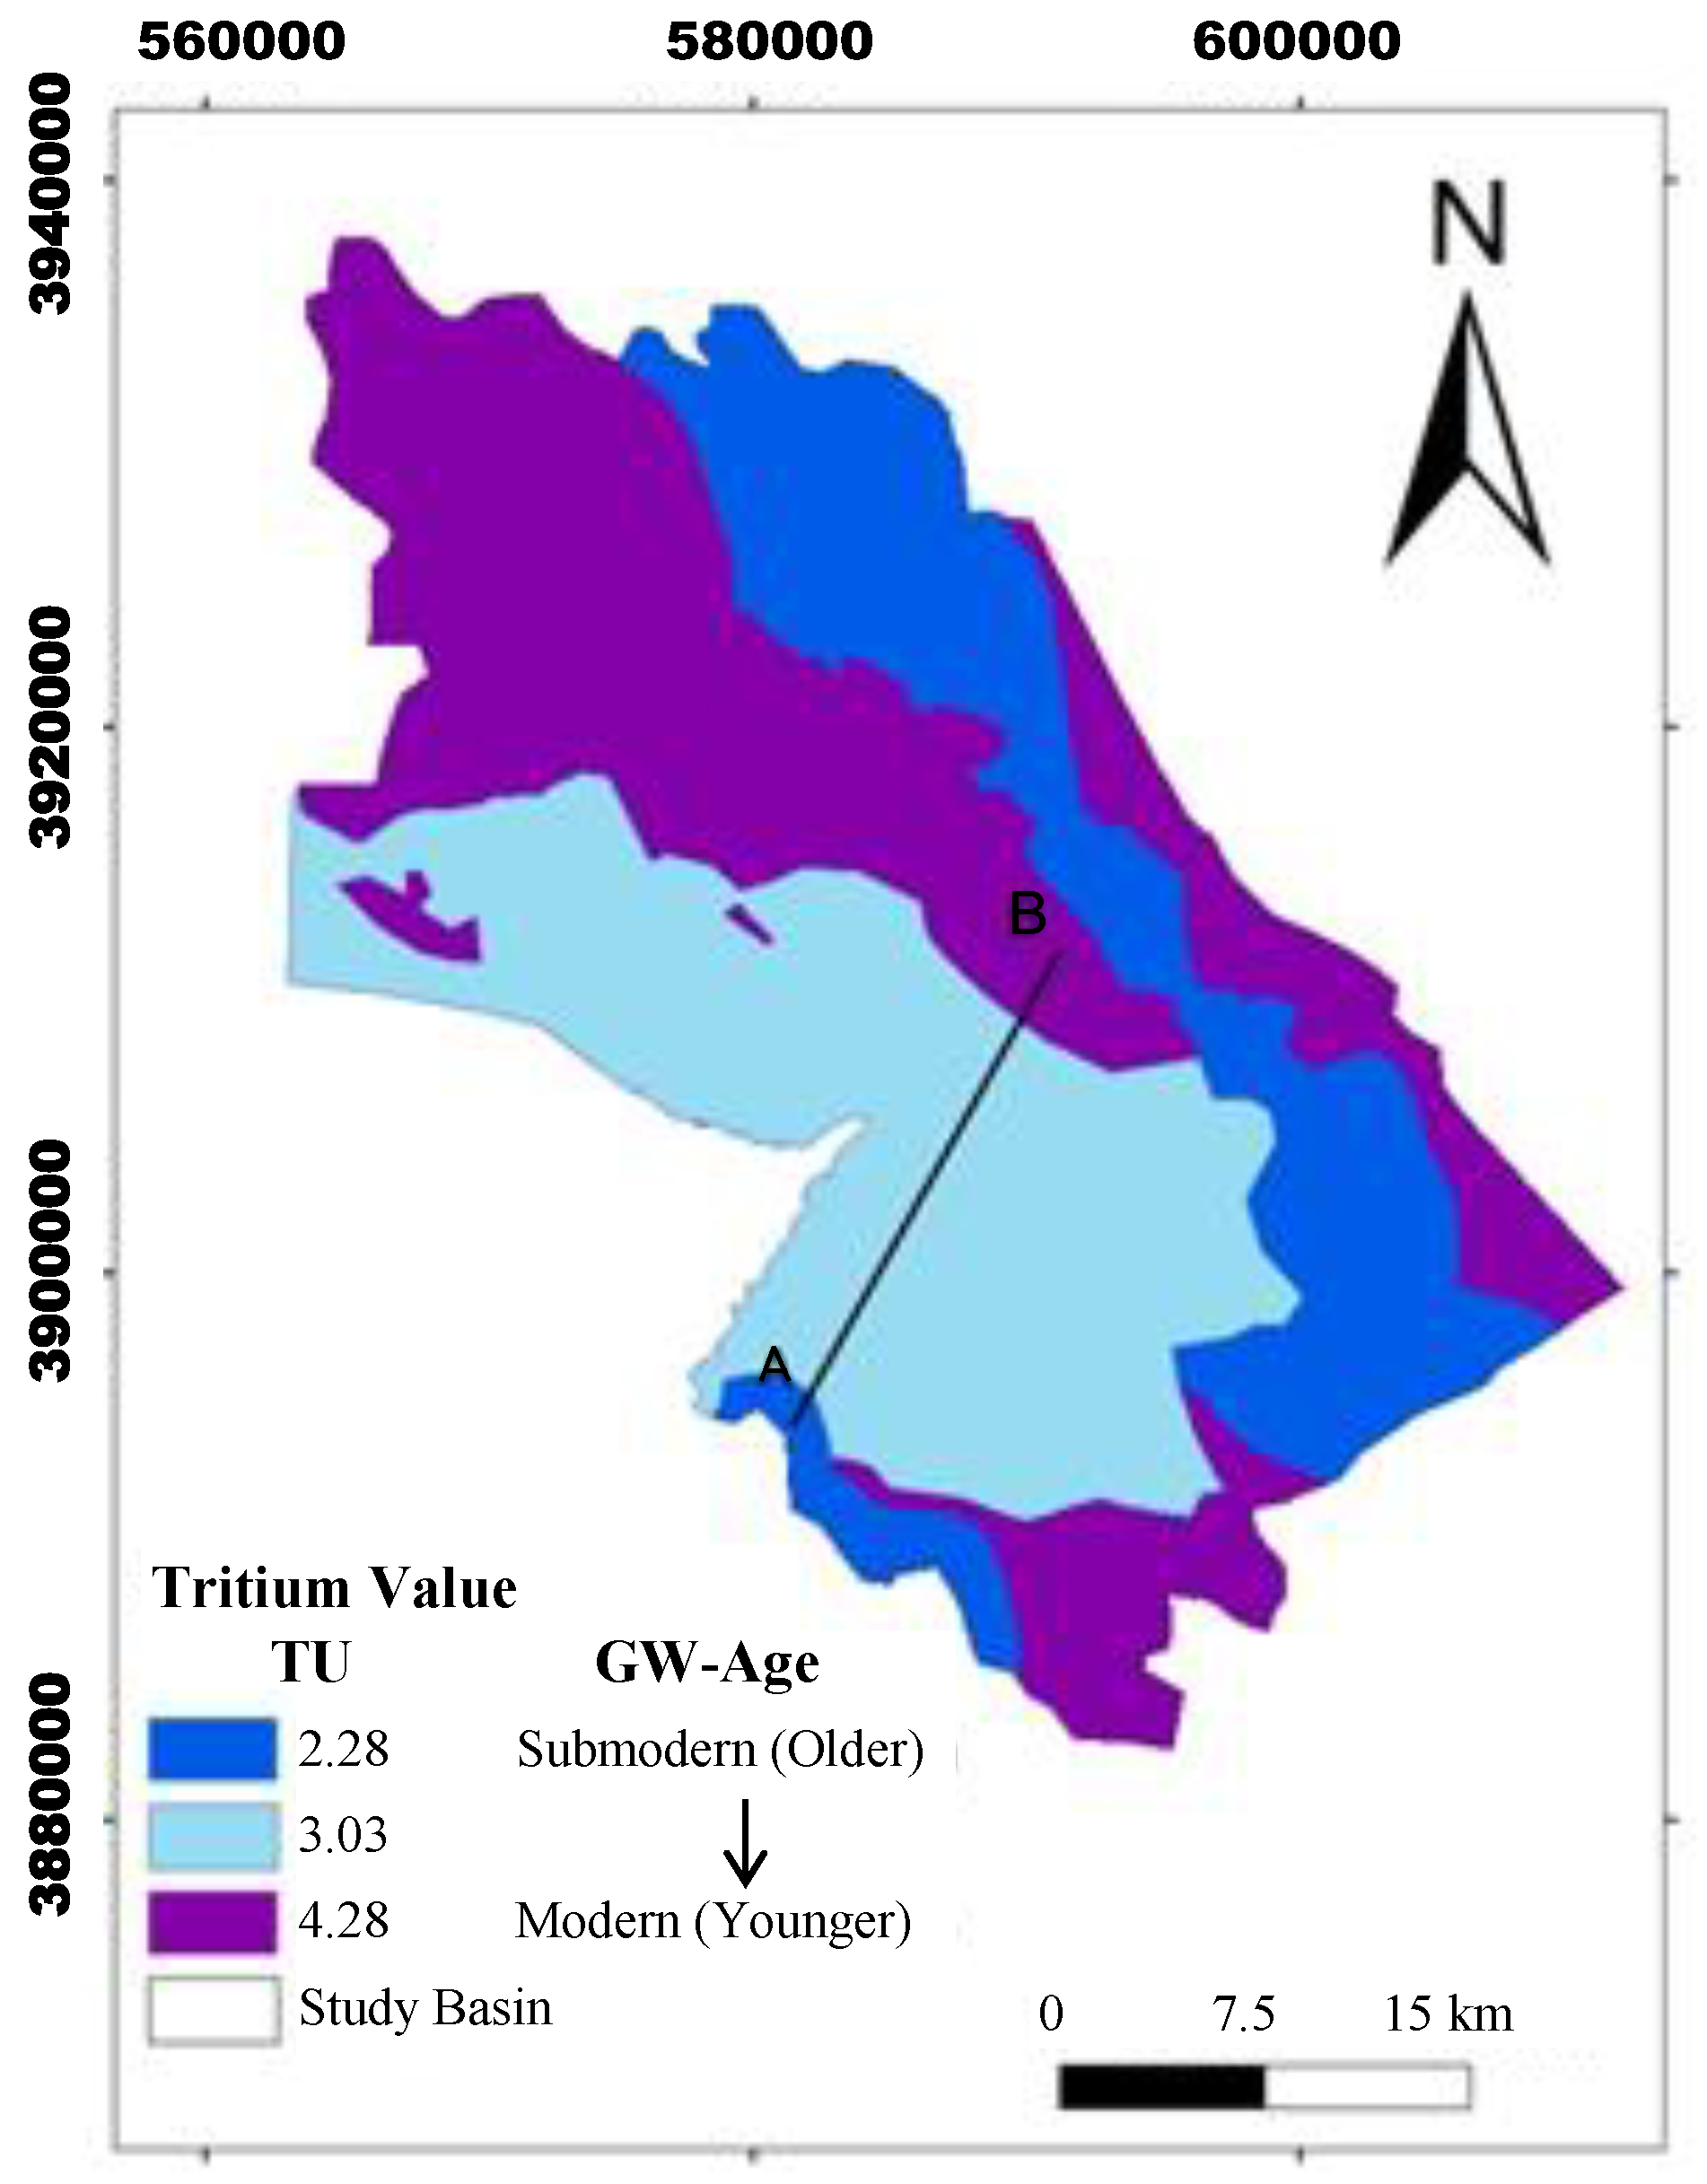
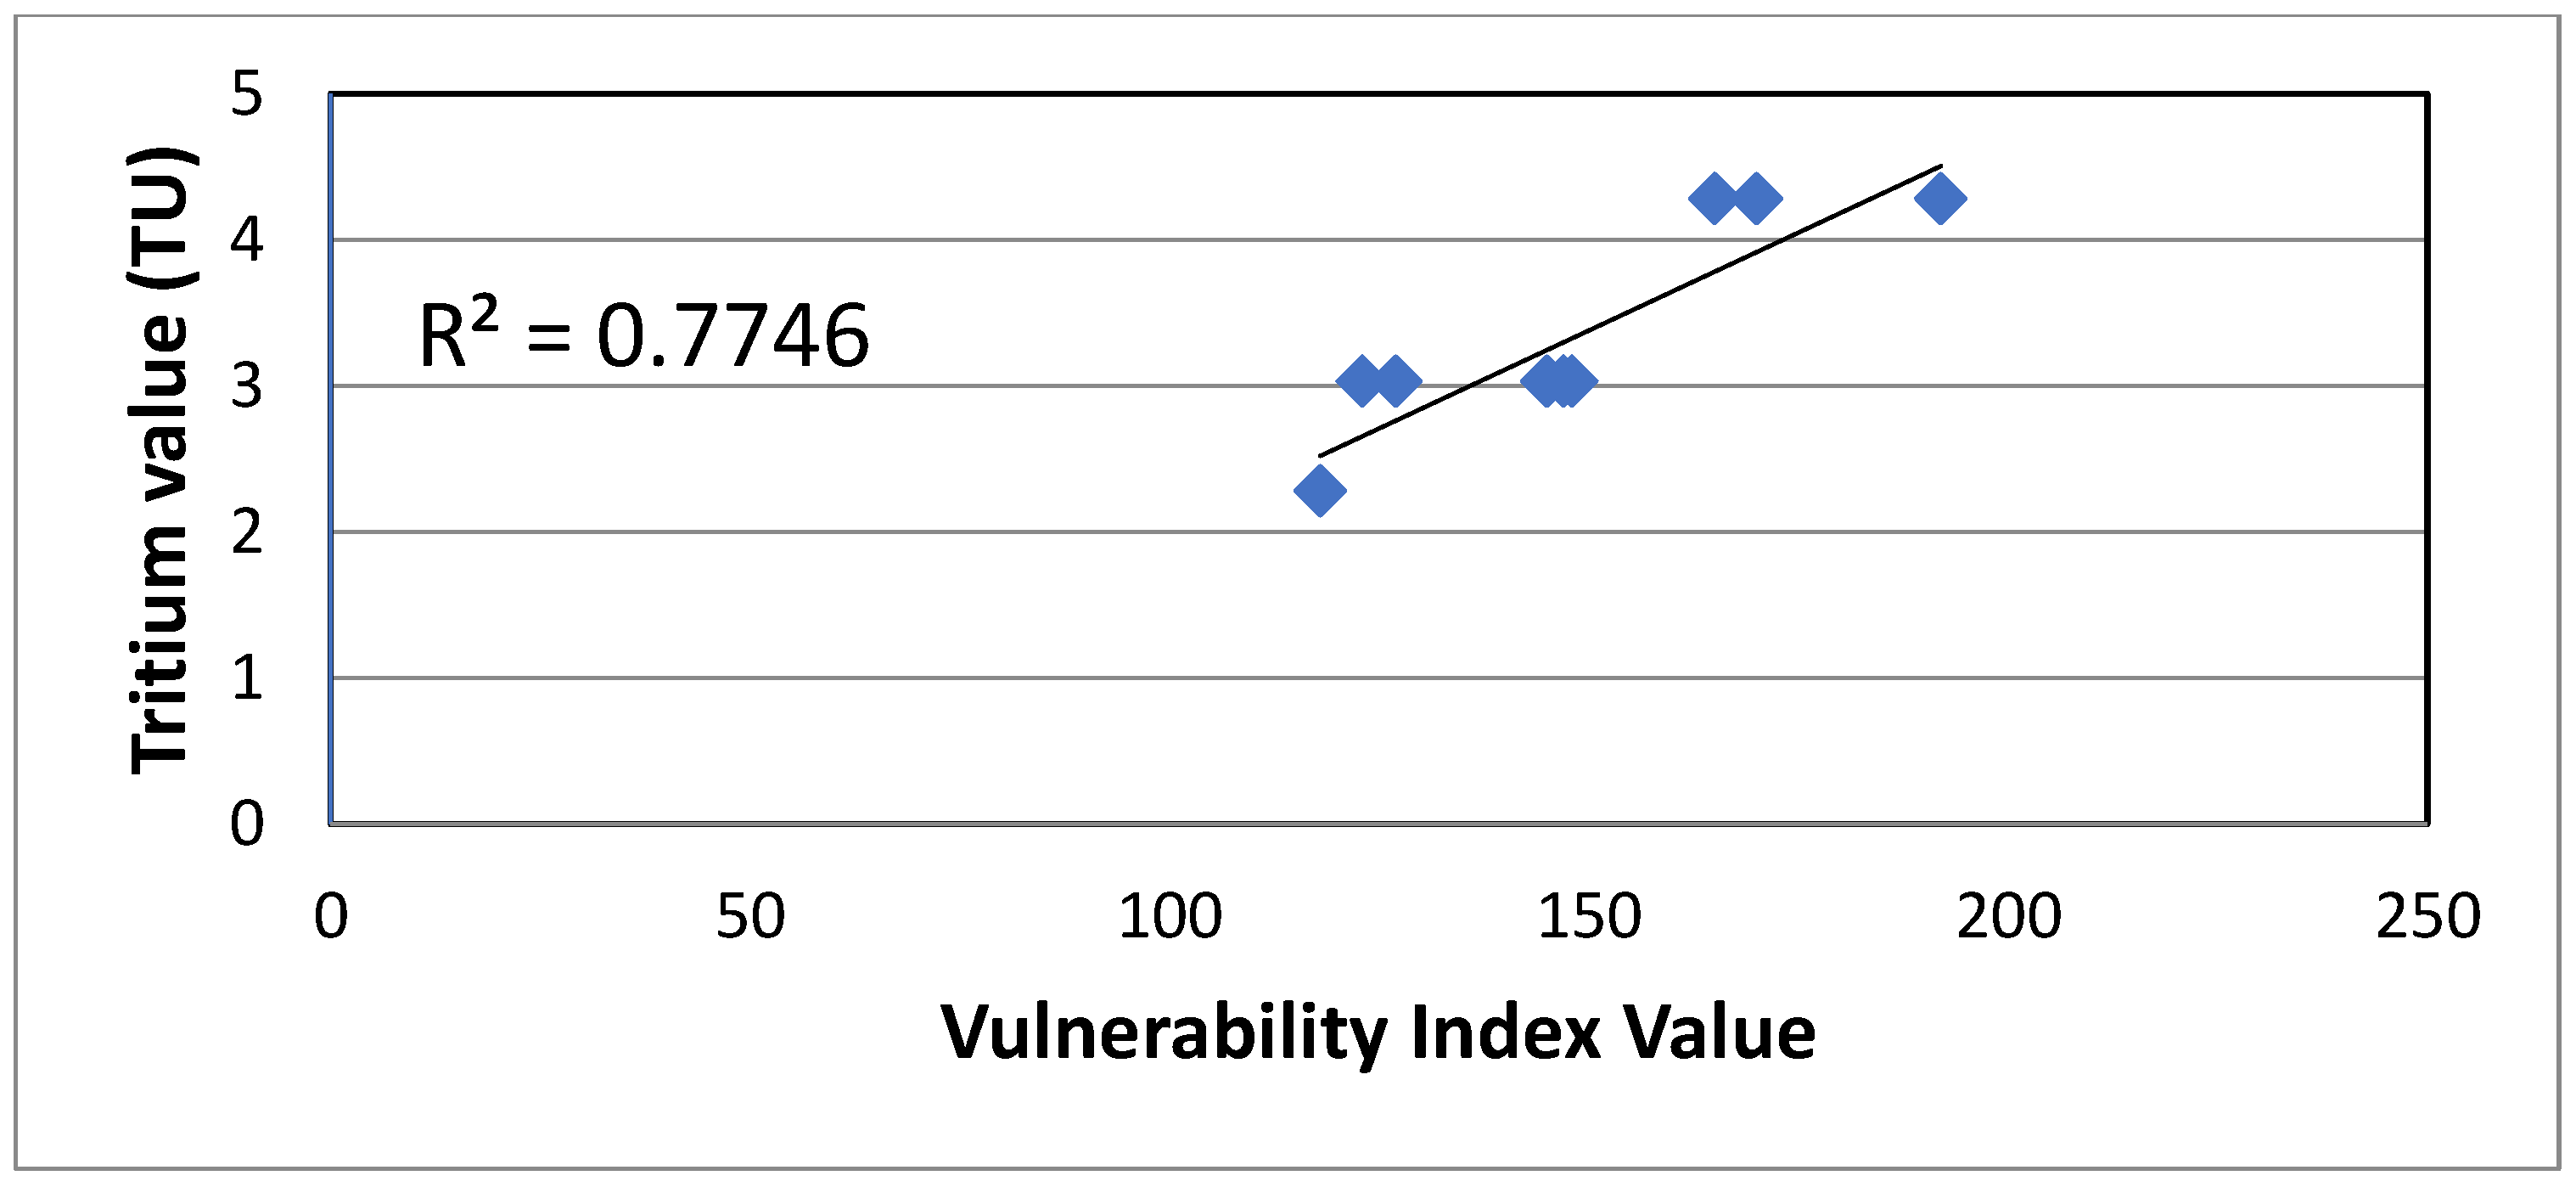
3.2. Validation against Groundwater Age Using Unstable Isotopes
- <0.8 TU designates sub-modern water (prior to 1950s).
- 0.8 to 5 TU designates a mix of sub-modern and modern water.
- >5 to 15 TU designates modern water (<5 to 10 years).
- >15 to 30 TU designates s some bomb tritium.
- >30 TU designates recharge generate in the 1960s to 1970s.
4. Conclusions
Author Contributions
Conflicts of Interest
References
- Foster, S.S.D. Groundwater Recharge and Pollution Vulnerability of British Aquifers: A Critical Overview; Geological Society Special Publication: London, UK, 1988; Volume 130. [Google Scholar]
- Abdullah, T.O.; Ali, S.S.; Al-Ansari, N.A. Groundwater assessment of Halabja Saidsadiq Basin, Kurdistan region, NE of Iraq using vulnerability mapping. Arab. J. Geosci. 2016, 9, 223. [Google Scholar] [CrossRef]
- Doerfliger, N.; Zwahlen, F. Groundwater Vulnerability Mapping in Karstic Regions (EPIK)—Application to Groundwater Protection Zones; Swiss Agency for the Environment, Forests and Landscape (SAEFL): Bern, Switzerland, 1998. [Google Scholar]
- Doerfliger, N.; Jeannin, P.Y.; Zwahlen, F. Water vulnerability assessment in karst environments: A new method of defining protection areas using a multi-attribute approach and GIS tools (EPIK method). Environ. Geol. 1999, 39, 165–176. [Google Scholar] [CrossRef]
- Goldscheider, N.; Klute, M.; Sturm, S.; Hotzl, H. The PI Method a GIS—Based Approach to Mapping Groundwater Vulnerability with Special Consideration of Karst Aquifers. Z. Angew. Geol. 2000, 46, 157–166. [Google Scholar]
- Ghosh, A.; Tiwari, A.K.; Das, S. A GIS based DRASTIC model for assessing groundwater vulnerability of Katri Watershed, Dhanbad, India. Model. Earth Syst. Environ. 2015, 1. [Google Scholar] [CrossRef] [Green Version]
- Singh, P.K.; Tiwari, A.K.; De Maio, M. Evaluation of aquifer vulnerability in a coal mining of India by using GIS-based DRASTIC model. Arab. J. Geosci. 2016, 9, 1–15. [Google Scholar] [CrossRef]
- Saha, D.; Alam, F. Groundwater vulnerability assessment using DRASTIC and Pesticide DRASTIC models in intense agriculture area of the Gangetic plains India. Environ. Monit. Assess. 2014, 186, 8741–8763. [Google Scholar] [CrossRef] [PubMed]
- Edet, A. An aquifer vulnerability assessment of the Benin Formation aquifer, Calabar, southeastern Nigeria, using DRASTIC and GIS approach. Environ. Earth Sci. 2014, 71, 1747–1765. [Google Scholar] [CrossRef]
- Nasri, N.; Chebil, M.; Guellouz, L.; Bouhlila, R.; Maslouhi, A.; Ibnoussina, M. Modelling nonpoint source pollution by nitrate of soil in the Mateur plain, northeast of Tunisia. Arab. J. Geosci. 2015, 8, 1057–1075. [Google Scholar] [CrossRef]
- Shrestha, S.; Semkuyu, D.J.; Pandey, V.P. Assessment of groundwater vulnerability and risk to pollution in Kathmandu Valley, Nepal. Sci. Total Environ. 2016, 556, 23–35. [Google Scholar] [CrossRef] [PubMed]
- Abdullah, T.O.; Ali, S.S.; Al-Ansari, N.A.; Knutsson, S. Groundwater Vulnerability Mapping using Lineament Density on Standard DRASTIC Model: Case Study in Halabja Saidsadiq Basin, Kurdistan Region, Iraq. Engineering 2015, 7, 644–667. [Google Scholar] [CrossRef]
- Blavoux, B.; Lachassagne, P.; Henriot, A.; Ladouche, B.; Marc, V.; Beley, J.; Olive, P. A Fifty-Year Chronicle of Tritium Data for Characterising the Functioning of the Evian and Thonon (France) Glacial Aquifers. J. Hydrol. 2013, 494, 116–133. [Google Scholar] [CrossRef]
- Buday, T. The Regional Geology of Iraq: Stratigraphy and Paleogeography; Kassab, I.I., Jassim, S.Z., Eds.; Publications of Geological Survey of Iraq: Baghdad, Iraq, 1980. [Google Scholar]
- Ali, S.S. Geology and Hydrogeology of Sharazoor-Piramagroon Basin in Sulaimani Area, Northeastern Iraq. Unpublished Ph.D. Thesis, Faculty of Mining and Geology, University of Belgrade, Beograd, Serbia, 2007. [Google Scholar]
- Jassim, S.Z.; Goff, J.C. Geology of Iraq; Jassim, Ed.; Geological Society of London: London, England, 2006. [Google Scholar]
- Buday, T.; Jassim, S. The Regional Geology of Iraq: Tectonis, Magmatism, and Metamorphism; Kassab, I.I., Abbas, M.J., Eds.; State Establishment of Geological Survey and Minieral Investigations: Baghdad, Iraq, 1987. [Google Scholar]
- Aller, L.; Bennett, T.; Lehr, J.H.; Petty, R.H.; Hackett, G. DRASTIC: A Standardized System for Evaluating Groundwater Pollution Potential Using Hydrogeologic Setting; USEPA Report 600/2-87/035; Robert S. Kerr Environmental Research Laboratory: Ada, OK, USA, 1987. [Google Scholar]
- Saaty, T.L. Axiomatic foundation of the analytic hierarchy process. Manag. Sci. 1986, 32, 841–855. [Google Scholar] [CrossRef]
- Merkin, B.G. Group Choice; John Wiley & Sons: New York, NY, USA, 1979. [Google Scholar]
- Saaty, T.L. The Analytic Hierarchy Process: Planning, Priority Setting, Resources Allocation; McGraw: New York, NY, USA, 1980. [Google Scholar]
- Saaty, T.L. How to make a decision: The analytic hierarchy process. Interfaces 1994, 24, 19–43. [Google Scholar] [CrossRef]
- Uyan, M. MSW landfill site selection by combining AHP with GIS for Konya, Turkey. Environ. Earth Sci. 2014, 71, 1629–1639. [Google Scholar] [CrossRef]
- Chang, C.W.; Wu, C.R.; Lin, C.T.; Lin, H.L. Evaluating digital video recorder systems using analytic hierarchy and analytic network processes. Inf. Sci. 2007, 177, 3383–3396. [Google Scholar] [CrossRef]
- Isalou, A.A.; Zamani, V.; Shahmoradi, B.; Alizadeh, H. Landfill site selection using integrated fuzzy logic and analytic network process (F-ANP). Environ. Earth Sci. 2013, 68, 1745–1755. [Google Scholar] [CrossRef]
- Kumar, P.R.; Somashekar, R.K. Environmental Tritium and Hydrochemical Investigations to Evaluate Groundwater in Varahi and Markandeya River Basins, Karnataka, India. J. Environ. Radioact. 2011, 102, 153–162. [Google Scholar]
- UN (United Nations); ILO (International Labour Organisation); WHO (World Health Organization). Environmental Health Criteria for Selected Radionuclides. Environmental Health Criteria 25. Available online: http://www.inchem.org/documents/ehc/ehc/ehc25.htm (accessed on 10 June 2018).
- Hamamin, D.F.; Ali, S.S. Hydrodynamic study of karstic and intergranular aquifers using isotope geochemistry in Basara basin, Sulaimani, North-Eastern Iraq. Arab. J Geosci. 2013, 6, 2933–2940. [Google Scholar] [CrossRef]
- Davies, G. Results of Ground-Water Tracing Experiments in the Nelson-WoosterHumphreyTunnel; Cambrian Ground Water Co.: Oak Ridge, TN, USA, 2002. [Google Scholar]
- Mckenzie, J.M.; Mark, B.G.; Thompson, L.G.; Schotterer, U.; Lin, P.-N. A hydrogeochemical survey of Kilimanjaro (Tanzania): Implications for water sources and ages. Hydrogeol. J. 2010, 18, 985–995. [Google Scholar] [CrossRef]
- Motzer, W.E. Age Dating Groundwater. Available online: http://www.primarywaterinstitute.org/images/pdfs/Tritium_in_groundwater.pdf (accessed on 10 June 2018).


| Aquifer | Formation | Thickness (m) | References |
|---|---|---|---|
| Intergranular Aquifer (AIA) | Quaternary deposits | more than 300 | [2] |
| Fissured Aquifer (CFA) | Balambo Kometan | 250 | [15] |
| Fissured-Karstic Aquifer (CKFA) | Avroman Jurassic formation | 200 From 80 to 200 | [16] |
| Karstic-Aquifer (TKA) and (JKA) | Avroman Jurassic | 200 80–200 | [16] |
| Non-Aquifer (Aquiclude, Aquitard and TAT) | Qulqula Shiranish Tanjero | more than 500 225 2000 | [17] |
| Intensity of Importance | Definition |
|---|---|
| 1 | Equal importance |
| 2 | Equal to moderately importance |
| 3 | Moderate importance |
| 4 | Moderate to strong importance |
| 5 | Strong importance |
| 6 | Strong to very strong importance |
| 7 | Very strong importance |
| 8 | Very to extremely strong importance |
| 9 | Extreme importance |
| n | 1 | 2 | 3 | 4 | 5 | 6 | 7 |
|---|---|---|---|---|---|---|---|
| RI | 0 | 0 | 0.58 | 0.9 | 1.12 | 1.24 | 1.32 |
| D | I | R | A | C | S | T | Eigenvector | Priority Vector (Weight) | DRASTIC Weight | Modified Weight | |
|---|---|---|---|---|---|---|---|---|---|---|---|
| D | 1.0 | 1.0 | 2.0 | 3.0 | 3.0 | 5.0 | 7.0 | 2.5 | 0.28 | 5.00 | 6.42 |
| I | 1.0 | 1.0 | 2.0 | 3.0 | 3.0 | 5.0 | 7.0 | 2.51 | 0.28 | 5.0 | 6.42 |
| R | 0.5 | 0.5 | 1.0 | 2.0 | 2.0 | 3.0 | 5.0 | 1.47 | 0.16 | 4.0 | 3.76 |
| A | 0.33 | 0.33 | 0.5 | 1.0 | 1.0 | 2.0 | 3.0 | 0.85 | 0.10 | 3.0 | 2.19 |
| C | 0.33 | 0.33 | 0.5 | 1.0 | 1.0 | 2.0 | 3.0 | 0.85 | 0.10 | 3.0 | 2.19 |
| S | 0.20 | 0.20 | 0.33 | 0.50 | 0.50 | 1.0 | 2.0 | 0.49 | 0.05 | 2.0 | 1.25 |
| T | 0.14 | 0.14 | 0.20 | 0.33 | 0.33 | 0.5 | 1.0 | 0.30 | 0.03 | 1.0 | 0.77 |
| SUM | 3.5 | 3.5 | 6.5 | 10.8 | 10.8 | 18.5 | 28.0 | 8.99 | 1.00 | 23.0 | 23.0 |
| Sample Code | Site | 3H (TU) ± σ | Average 3H | Aquifer |
|---|---|---|---|---|
| ITB | Banishar Mosques Well | 4.7 ± 0.3 | 4.28 | CKFA. TKA and JKA |
| ITB2 | Basak Well | 3.8 ± 0.3 | ||
| ITJ | Jalela Village Well | 4 ± 0.3 | ||
| ITS1 | Saraw Swbhan Agha | 4.5 ± 0.3 | ||
| ITM | Mzgawta | 4 ± 0.3 | ||
| ITSb | SheraBara | 4.3 ± 0.3 | ||
| ITT2 | Tawanawal | 4.6 ± 0.3 | ||
| ITD | Darbarulla | 4.3 ± 0.3 | ||
| ITTh | Halabaj Taymwr Hassan | 3.3 ± 0.3 | 3.03 | AIA |
| ITS | Sirwan | 2.3 ± 0.3 | ||
| ITSs | Shekhan Shanadactry Road Project | 3.1 ± 0.3 | ||
| ITSm | Soila Mesh | 3 ± 0.3 | ||
| ITGs | Gulajoy Saroo | 3.2 ± 0.3 | ||
| ITMh | Mstakani Haji Ahmad | 3 ± 0.3 | ||
| ITT | Taza De | 3 ± 0.3 | ||
| ITB3 | Bezhawa | 3.3 ± 0.3 | ||
| ITX | Kharpane Well | 2.4 ± 0.3 | 2.28 | |
| ITBk | Balkhay Khwaroo | 2.3 ± 0.3 | ||
| ITS2 | Sargat | 2.1 ± 0.3 | CFA | |
| ITBb | Bani Bnok | 2.3 ± 0.3 |
| Vulnerability Class | Modified DRASTIC—AHP | Covered Area% |
|---|---|---|
| Very low | 65–100 | 30 |
| Low | >100–125 | 7 |
| Medium | >125–150 | 25 |
| High | >150–200 | 35 |
| Very high | >200–224 | 3 |
© 2018 by the authors. Licensee MDPI, Basel, Switzerland. This article is an open access article distributed under the terms and conditions of the Creative Commons Attribution (CC BY) license (http://creativecommons.org/licenses/by/4.0/).
Share and Cite
Abdullah, T.O.; Ali, S.S.; Al-Ansari, N.A.; Knutsson, S. Possibility of Groundwater Pollution in Halabja Saidsadiq Hydrogeological Basin, Iraq Using Modified DRASTIC Model Based on AHP and Tritium Isotopes. Geosciences 2018, 8, 236. https://doi.org/10.3390/geosciences8070236
Abdullah TO, Ali SS, Al-Ansari NA, Knutsson S. Possibility of Groundwater Pollution in Halabja Saidsadiq Hydrogeological Basin, Iraq Using Modified DRASTIC Model Based on AHP and Tritium Isotopes. Geosciences. 2018; 8(7):236. https://doi.org/10.3390/geosciences8070236
Chicago/Turabian StyleAbdullah, Twana O., Salahalddin S. Ali, Nadhir A. Al-Ansari, and Sven Knutsson. 2018. "Possibility of Groundwater Pollution in Halabja Saidsadiq Hydrogeological Basin, Iraq Using Modified DRASTIC Model Based on AHP and Tritium Isotopes" Geosciences 8, no. 7: 236. https://doi.org/10.3390/geosciences8070236