Article

Albedo of a Small Ice-Covered Boreal Lake: Daily, Meso-Scale and Interannual Variability on the Background of Regional Climate

Northern Water Problems Institute, Karelian Research Center, Russian Academy of Sciences, 185030 Petrozavodsk, Russia
*
Author to whom correspondence should be addressed.
Geosciences 2018, 8(6), 206; https://doi.org/10.3390/geosciences8060206
Submission received: 31 March 2018 / Revised: 30 May 2018 / Accepted: 5 June 2018 / Published: 7 June 2018

Abstract

:
In winter, the reflective properties of ice-and-snow-covered lakes and the surrounding surface covered with snow differ little. Estimation of the albedo becomes especially important in spring when the reflectivity of the ice-covered lakes differs markedly from the surrounding snow-free surface. The measurements of the snow and ice albedo in situ are necessary to ensure adequate analysis of remote sensing data and monitoring of the state of the land ice. A wide range of surface albedo of small boreal ice-covered Lake Vendyurskoe (North-Western Russia) is calculated from observational data of solar radiation obtained in 1995–2000 and 2002–2017. A noticeable variability of albedo due to spring melting and changes in weather conditions is described. Climatic variability (North Atlantic Oscillation (NAO) index, the average monthly air temperature and sum of precipitation in December-March) is analyzed in the context of possible influence on the maximal thickness of snow and white ice, and, consequently, on the spring lake albedo dynamics. In current work to estimate the external heat flux that comes from the atmosphere to the surface of the lake and presumably determines the dynamics of albedo during spring melting, a simple parameter was used: the accumulated sum of positive temperatures, starting from March 1. The obtained prognostic equation of the cubic dependence of albedo on the named parameter demonstrates a different rate of albedo decrease in the melting of snow, white, and congelation ice.

1. Introduction

Reflective properties of the earth’s surface are an important part of its heat balance because it reduces the ability to absorb shortwave radiation [1,2]. Since the earth’s surface is very heterogeneous, its reflectivity, which is described by the concept of albedo, also varies markedly. Albedo is defined as the ratio of the reflected to the incident radiation flux. Albedo of the earth’s surface is used in climate and numerical weather prediction models [3,4]. At the same time, the model representation of the albedo is often overly simplistic and may cause large errors in weather prediction and climate simulations [5]. Satellite data offers great opportunities for exploring the earth’s surface albedo [6] and monitoring the state of the land and sea ice [7]. Remote sensing data can be used to verify, calibrate and improve the climate models; however, satellite data often contain noticeable error [8]. Thus, in situ measurements of the earth’s surface albedo are necessary to ensure adequate analysis of the remote sensing data.
Lakes of the boreal regions of Eurasia and North America cover significant areas of the earth’s surface. Therefore, lakes’ optical properties, which differ markedly from the surrounding soil or forest surfaces, must be taken into account in climatic models. In winter, the reflective properties of ice-and-snow-covered lakes and the surrounding surface covered with snow differ slightly. However, in spring, when the reflectivity of the ice-covered lakes differs markedly from the surrounding snow-free surface, estimation of the lake albedo becomes especially important.
The ice cover of a small boreal lake normally consists of two main layers, i.e., congelation ice and white ice [9,10,11], characterized by notably different transparency and albedo. Congelation ice forms during the initial period of freeze-up, and its thickness and optical properties are determined by the weather conditions and the presence of light-absorbing particles [12]. Low air temperature and no precipitation lead to the rapid increase of the thickness of congelation ice. After a significant snowfall, cracks appear in the congelation ice, and the water rises to its surface. Gradually, a layer of wet snow freezes in its upper part, transforming into white ice. Sometimes a layer of wet snow between white and congelation ice, known as slush, does not freeze completely [10,13].
For most of the winter, the surface of small boreal lakes is covered with snow and is therefore characterized by high reflectivity; the albedo of fresh and old snow varies from 0.95 to 0.7 [13]. As it ages, there is a reduction of snow albedo due to an increase in grain size and accumulation of microparticles (soot, dust, ash, and other contaminants) [14]. In spring, optical properties of the lake surface rapidly change due to intensive melting and modification in the texture of the snow-ice cover. First, the snow layer melts, leading to a sharp decrease in the albedo from 0.8–0.9 to 0.5–0.6. Then intense melting and changes in the internal structure of the white and congelation ice begin, and lake surface albedo gradually decreases to 0.1–0.2 [13,15]. Along with the most active surface melting, there is also internal melting and melting at the lower boundary of the ice [15]. White ice becomes saturated with water, darkens, and its albedo is reduced. Air bubbles, vertical channels, and cracks are formed in the congelation ice turning it into so-called candled ice. Such changes in the internal structure of the ice and its scattering properties lead to a change in its albedo. Radiation measurements at Lake Bonney, Antarctica, revealed that the phenomenon of «whitening ice» is caused by changes in its scattering properties; albedo of ice at the same time significantly increased [16]. It should be noted that in spring pronounced daily variability of albedo (which reaches its maximum in the morning, reduces during the day and slightly increases in the evening) is due to the variable sun height, the weather conditions and the day-night cycle of melting-freezing [17,18]. All these changes cause a wide range of lake surface albedo values during intensive melting: from 0.9 for fresh snow to 0.1 for the wet congelation ice [13,15,19]. These factors make it difficult to parameterize the albedo in numerical models [18,20,21,22].
The optical properties of the snow and ice during intense melting have been poorly studied because of the difficulty and danger of in situ measurements of irradiance on the weakened ice. Therefore, gathering a large amount of observational data on the optical properties of snow and ice during melting is necessary to ensure adequate analysis of the remote sensing data and monitoring of the state of the land ice.
The main goal of our study is to analyze the inter-annual, meso-scale and daily surface albedo variability of a small boreal lake during the period of spring melting based on the long-term measurements of solar radiation and ice-snow thickness. One of the main tasks of the work is to link the albedo dynamics with the snow-ice cover change occurring during the spring melting period. We suggest that a change in the thickness of the snow, white and congelation ice, as well as their sequential disappearance, control the temporal dynamics of the lake albedo during spring melting. We propose to link the albedo dynamics with an external heat flux from the atmosphere to the lake surface using a simple parameter—the accumulated sum of positive temperatures, starting from March 1. Moreover, climatic variability expressed in terms of the NAO index (North Atlantic Oscillation), the average monthly air temperature in December-March, and the sum of precipitation during the same period are analyzed in the context of a possible influence on the thickness of the snow and ice cover and, consequently, on the lake albedo dynamics.

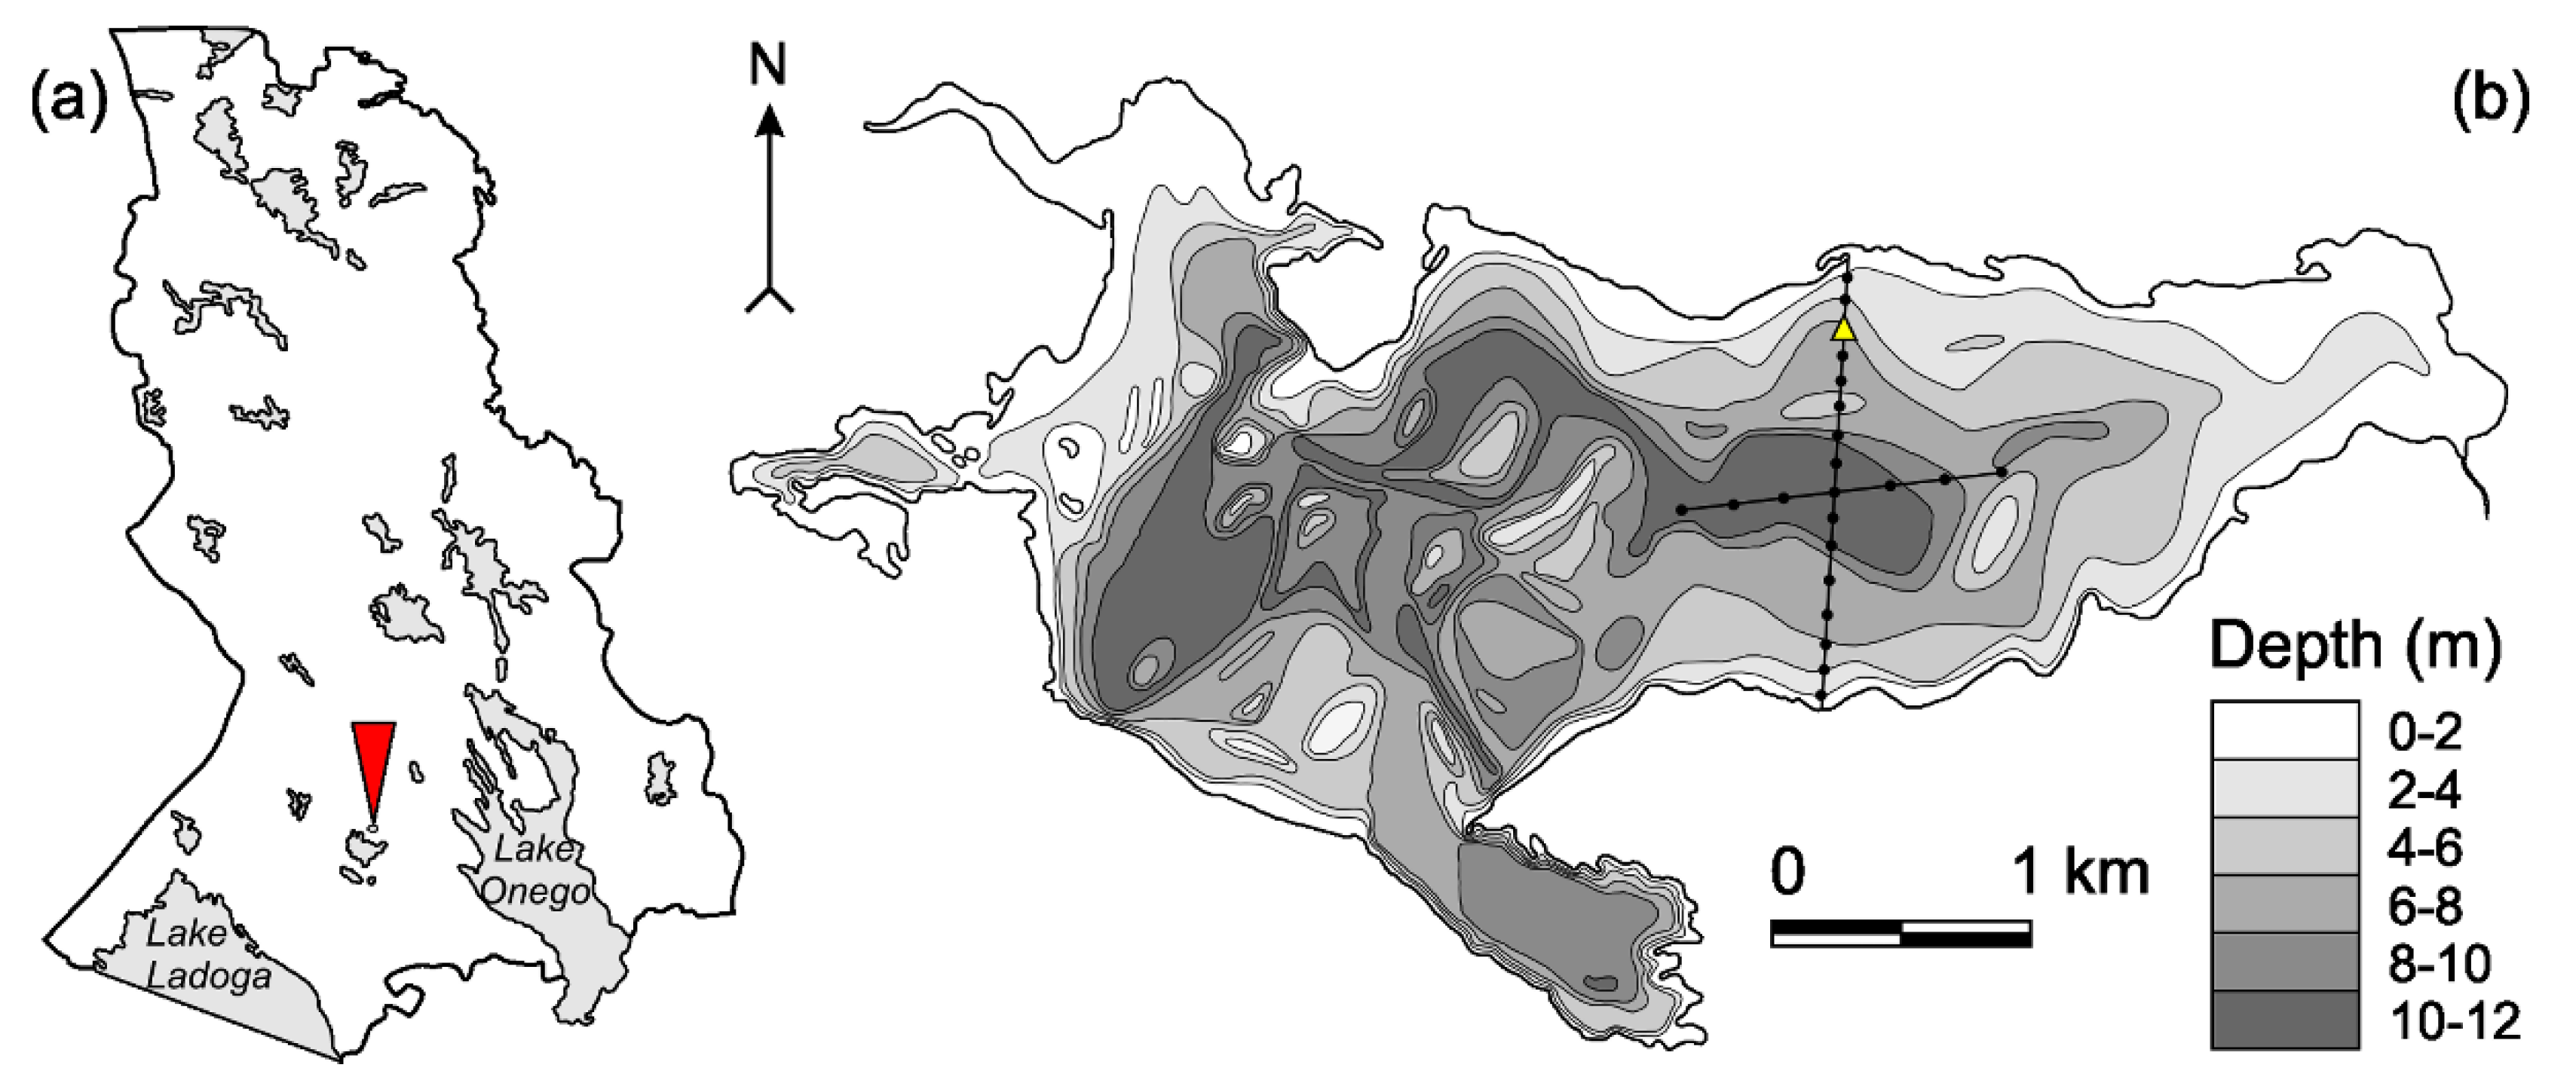
2. Materials and Methods

The study was conducted on Lake Vendyurskoe (62°10 N, 33°10′ E) located in southern Karelia, northwestern Russia (Figure 1). It is a small and shallow lake of glacial origin with a surface area 10.4 km2, a volume of 54.8 × 10⁶ m3, and a maximal and average depths of 13.4 and 5.3 m, respectively). Lake Vendyurskoe has several small inflows and one outflow. The ice-period on the lake starts from early November to mid-December; icebreaking takes place from the end of April to o mid-May, so the ice-covered period ranges between 150 and 190 days [23,24]. The lake ice cover consists mainly of two layers—white ice and congelation ice. In some years, a layer of snow with water (slush) is observed between white and congelation ice [25]. Snow (up to 0.3 m) covers the ice during the main part of the winter.
The combined impact of the Atlantic Ocean in the west and the Eurasian continent in the east forms the climate of Karelia, which has characteristics of both maritime and continental climate. Western winds bring warm moist air to Karelia, causing mild winters with frequent thaws. Karelian summer is short and cool. The impact of the continental high-pressure system, located above the Eurasian continent, occasionally causes severe winters and high temperatures in the summer. The transition of air temperature through −5 °C in the direction of decrease is observed at the end of November in this region, the upward shift is observed on March 20–25. The period with average daily air temperatures below −5 °C continues 115–125 days and below −10 °C 50–60 days in different years. Intensive cyclonic activity in the southern Karelia region (on an average 215 days with cyclones per year) increases the number of overcast days to 120–130 per year. Precipitation averages 620 mm annually [26].
The measurements of solar radiation and ice and snow thickness have been conducted on Lake Vendyurskoe in 1995–2000 and 2002–2017. Field irradiance measurements were carried out at the radiation station (Figure 1, Table 1) annually during the melting period from end-March to mid-April, in November-December 1995, in March 1996, and in January–March 2002. The duration of continuous measurements of irradiance was usually 1–2 weeks with a temporal resolution varied between 1 and 5 min. The downwelling and upwelling planar irradiances were measured with two Star-shaped pyranometers (Theodor Friderich & Co, Meteorologische Gerate und Systeme, Germany, resolution 0.2 W/m2), mounted on a tripod at a height of one meter above the surface of the ice. The value of albedo was calculated as the ratio of downwelling and upwelling irradiances. The average daily albedo was calculated as an average in the time interval from 10 a.m. to 6 p.m. when solar zenith angle (SZA) was less than 75°. The minimum SZA in the area of research (62°10 N, 33°10′ E) is observed approximately at 1:40 p.m.–1:50 p.m. local time. Thus, a period of albedo averaging is centered with respect to the astronomical noon. In addition, spatial variability of albedo was investigated based on measurement collected with MS-80m universal pyranometer (EKO Instruments USA Inc., resolution 1 W/m2) at all stations of two transects in March and April 2002, April 2006 and April 2007 (Table 1). Instruments were installed at a height of about one meter above the surface of the lake. At each station, measurements were taken within 3–5 min A snowmobile was used to move between stations, so all 22 stations were covered by measurements for a period of less than 3 h. Measurements of albedo on transects were made from 11 a.m. to 2 p.m. during the period close to the astronomical noon (variability of SZA was less than 5°). Then the maximum, minimum and average values of albedo were calculated among all measurement stations.
The measurements of ice and snow thickness were carried out at all stations in March–April every year, and also in the beginning and middle of winter in some years. Ice surveys were carried out on one of the first days of radiation measurements and sometimes additionally on one of the last days. At each station, the snow thickness was measured with a ruler with an accuracy of about 0.5 cm. A block of ice was sawn from the ice sheet at each station, and the thickness of its sub-layers, i.e., white ice, slush (if any) and congelation ice, was measured with a ruler at an accuracy of about 0.5 cm. In April 1995, 1996 and 1998, only the total ice thickness was measured, without measuring the thickness of the sub-layers. Then the average and standard deviation of thickness of snow and ice layers were calculated for all stations. At the radiation station, the measurements of snow and ice thickness were carried out during the measurements of irradiance twice a day, i.e., in the morning and in the evening. Using these measurements, the average melting rate of snow and ice for each day was calculated. Then, the maximum and average snow and ice melting rates for the whole measurement period were determined. Snow density measurements were carried out with a box sampler (1000 cm3 capacity) and a spring balance.
We tried to obtain a regression relationship between the maximum thickness of snow and white ice and parameters that characterized regional climate variability at the study site in winter: NAO index, mean air temperature and the sum of precipitation for the period from December to March. We also investigated the regression between the albedo in spring and the same climatic parameters. We used the meteorological station Petrozavodsk data (WMO station ID: 22820, coordinates 61°49′ N and 34°16′ E) which is located 67 km to the south-east from the Lake Vendyurskoe. Petrozavodsk air temperature data can be successfully used for the study area, since the correlation of this parameter near the lake (TairLAKE) and on the meteorological station (TairMS) is very high (TairLAKE = 0.74TairMS + 0.03, R2 = 0.66). This correlation was revealed using the air temperature measurements near the northern shore of the Lake Vendyurskoe in April 2005–2012 with an «EMS Brno» weather station. The average daily air temperature and precipitation for Petrozavodsk station for 1950–2016 were obtained on the website of the All-Russian Scientific Research Institute of Hydrometeorological Information—World Data Center (VNIIGMI-WDC) [27]. Data on the air temperature for every 3 h for the period from 1998 to 2005 were obtained on the website “Russia’s Weather” [28] and from 2005 to 2017 on the website “Reliable Prognosis” [29]. The values of the NAO index for December–March period for 1950–2016 were obtained on the website “Climate Data Guide” [30].
We assessed the external heat flux that comes from the atmosphere to the surface of Lake Vendyurskoe and presumably determines the albedo dynamics using the stepwise multiple regression method. As predictors, we used: (1) the sum of the positive mean daily air temperatures, starting from March 1, (2) the accumulated values of the incident solar radiation flux, starting from March 1, (3) the mean daily air temperature and (4) the mean daily flux of the incident solar radiation. The accumulated sum of positive temperatures, starting from March 1 (T+) is calculated as the sum of the average daily air temperatures over the days when this temperature exceeded 0 °С. This parameter is an integral indicator of the variability of weather conditions in the spring. Calculation of the incident solar radiation flux was carried out using the approach proposed in [24]. To calculate the predictors (1) and (2), we used the data of the meteorological station Petrozavodsk. To calculate the predictors (3) and (4), we used the measurements at the radiation station and meteorological station near Lake Vendyurskoe as well as data from the meteorological station of Petrozavodsk. We also investigated the relation between the daily averaged albedo and snow-ice cover thickness.
Correlation and regression analysis of data were carried out using the software package STATISTICA.

3. Results

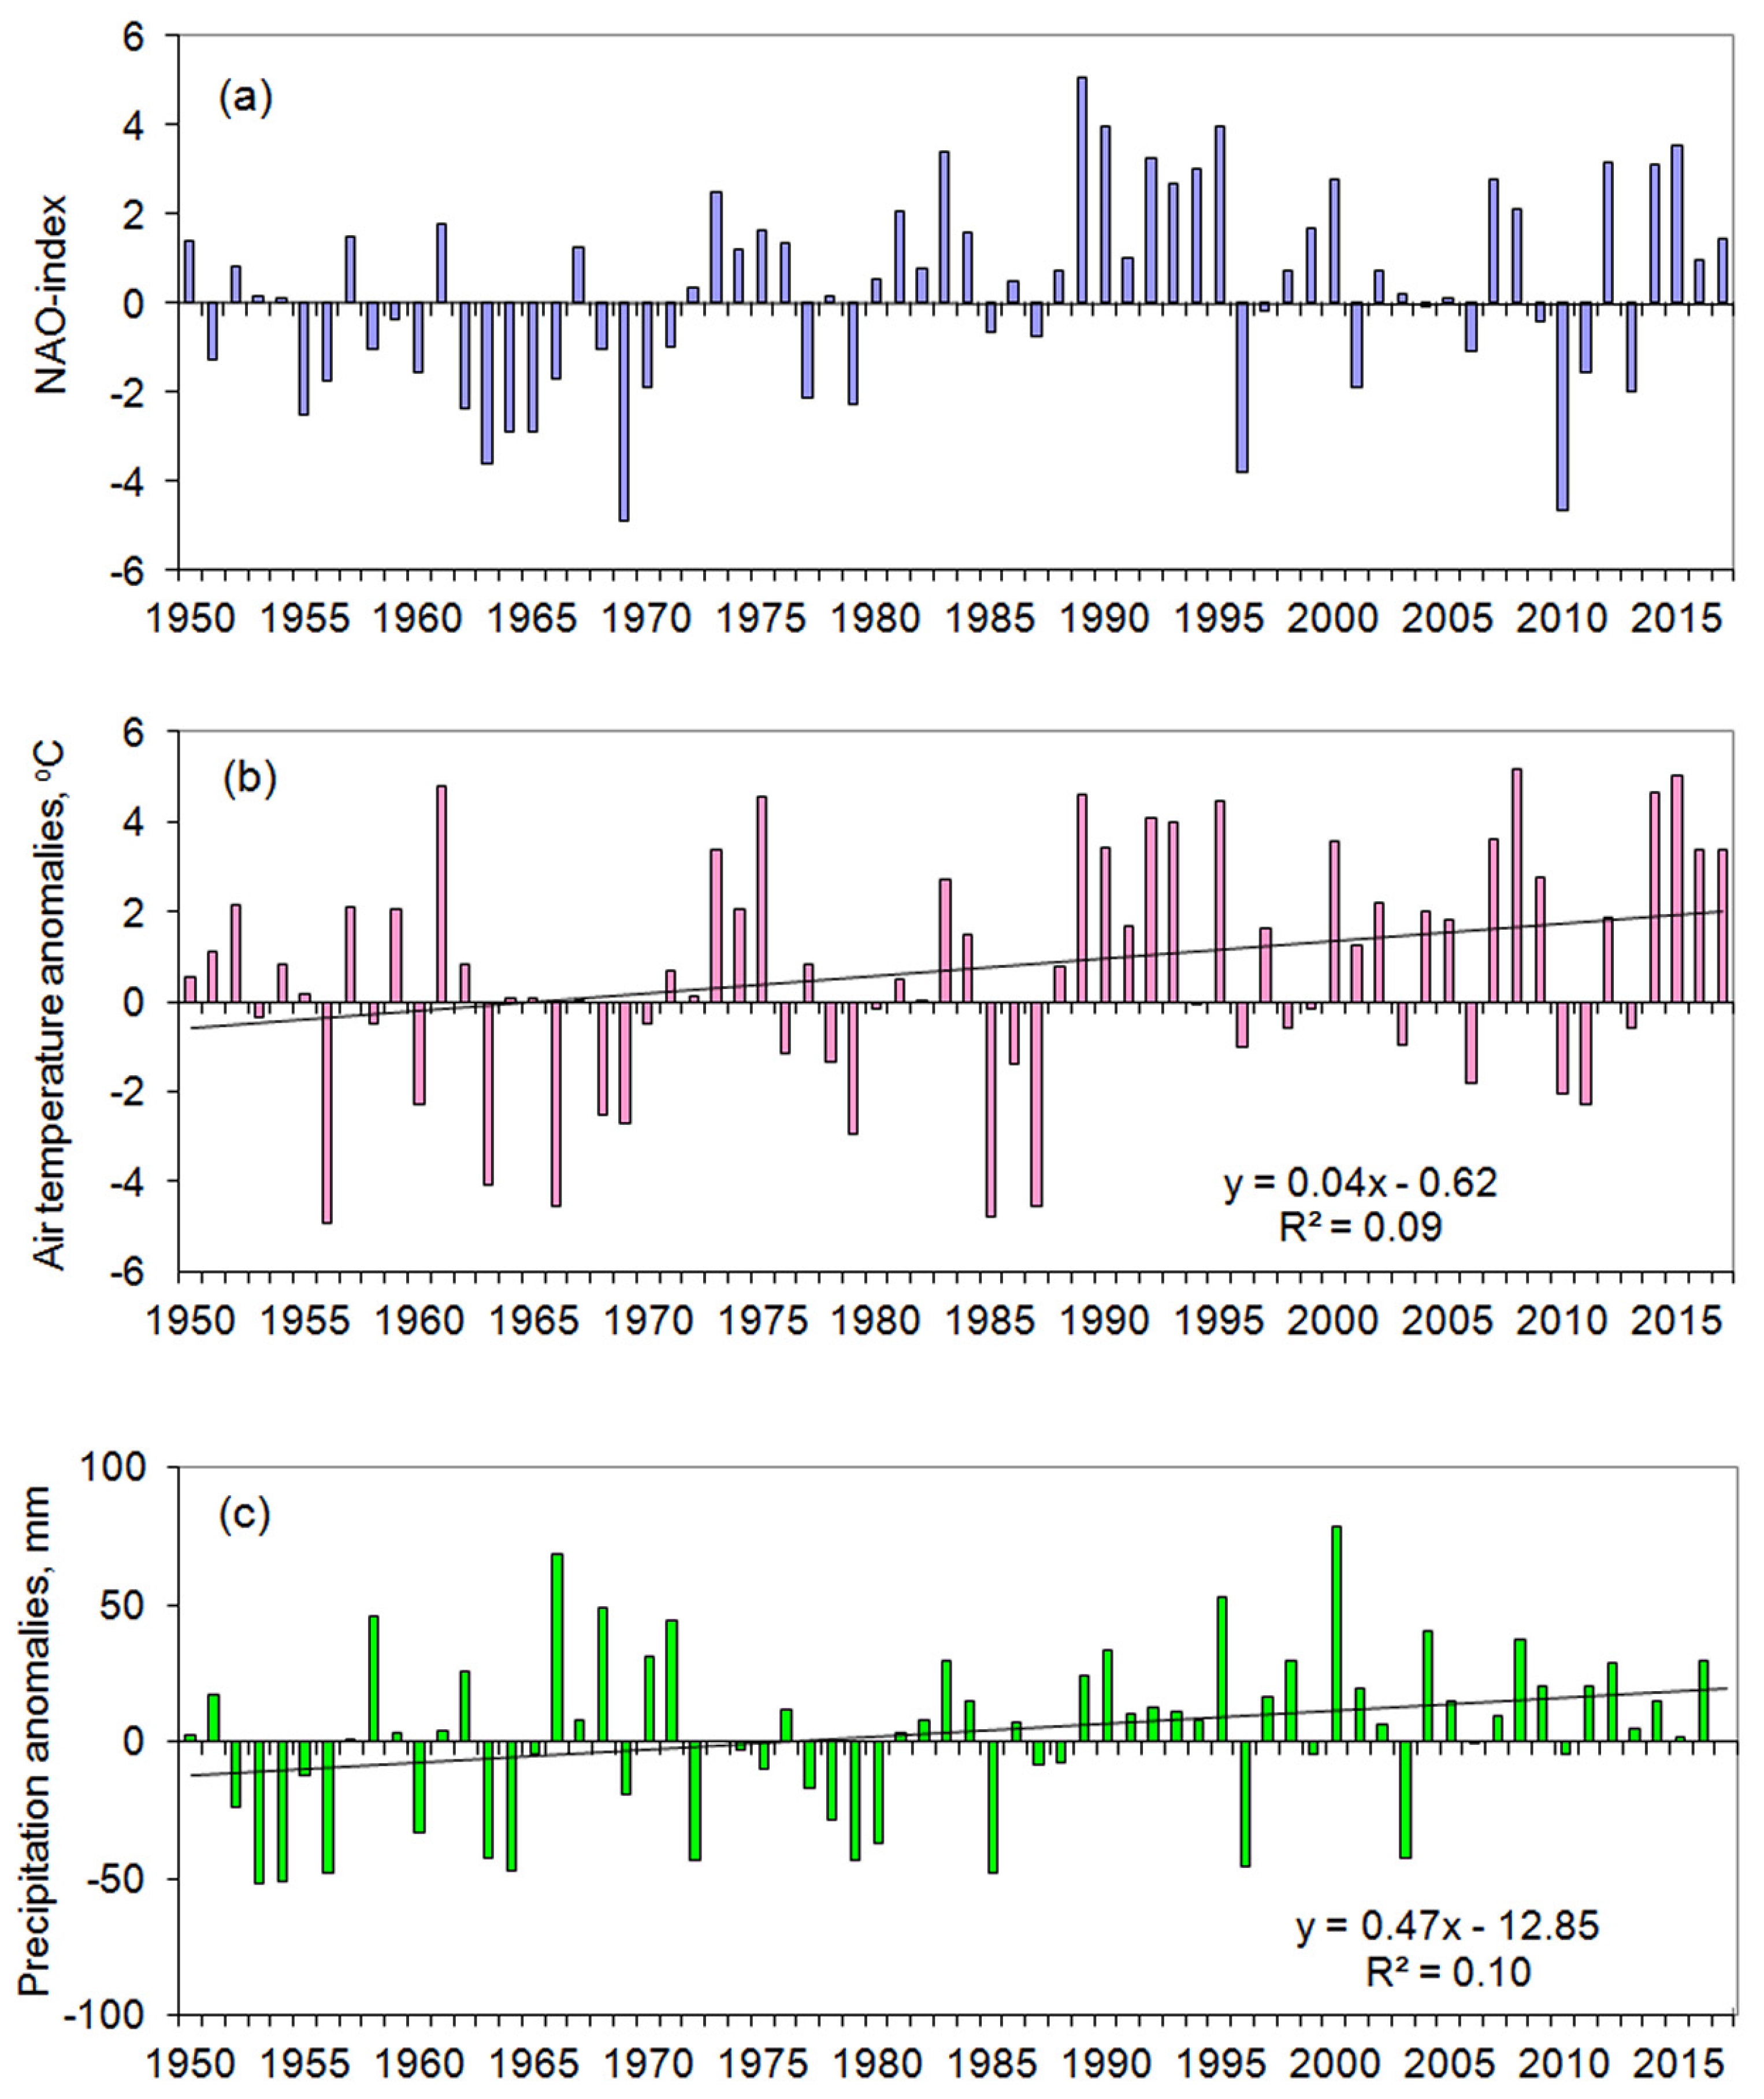
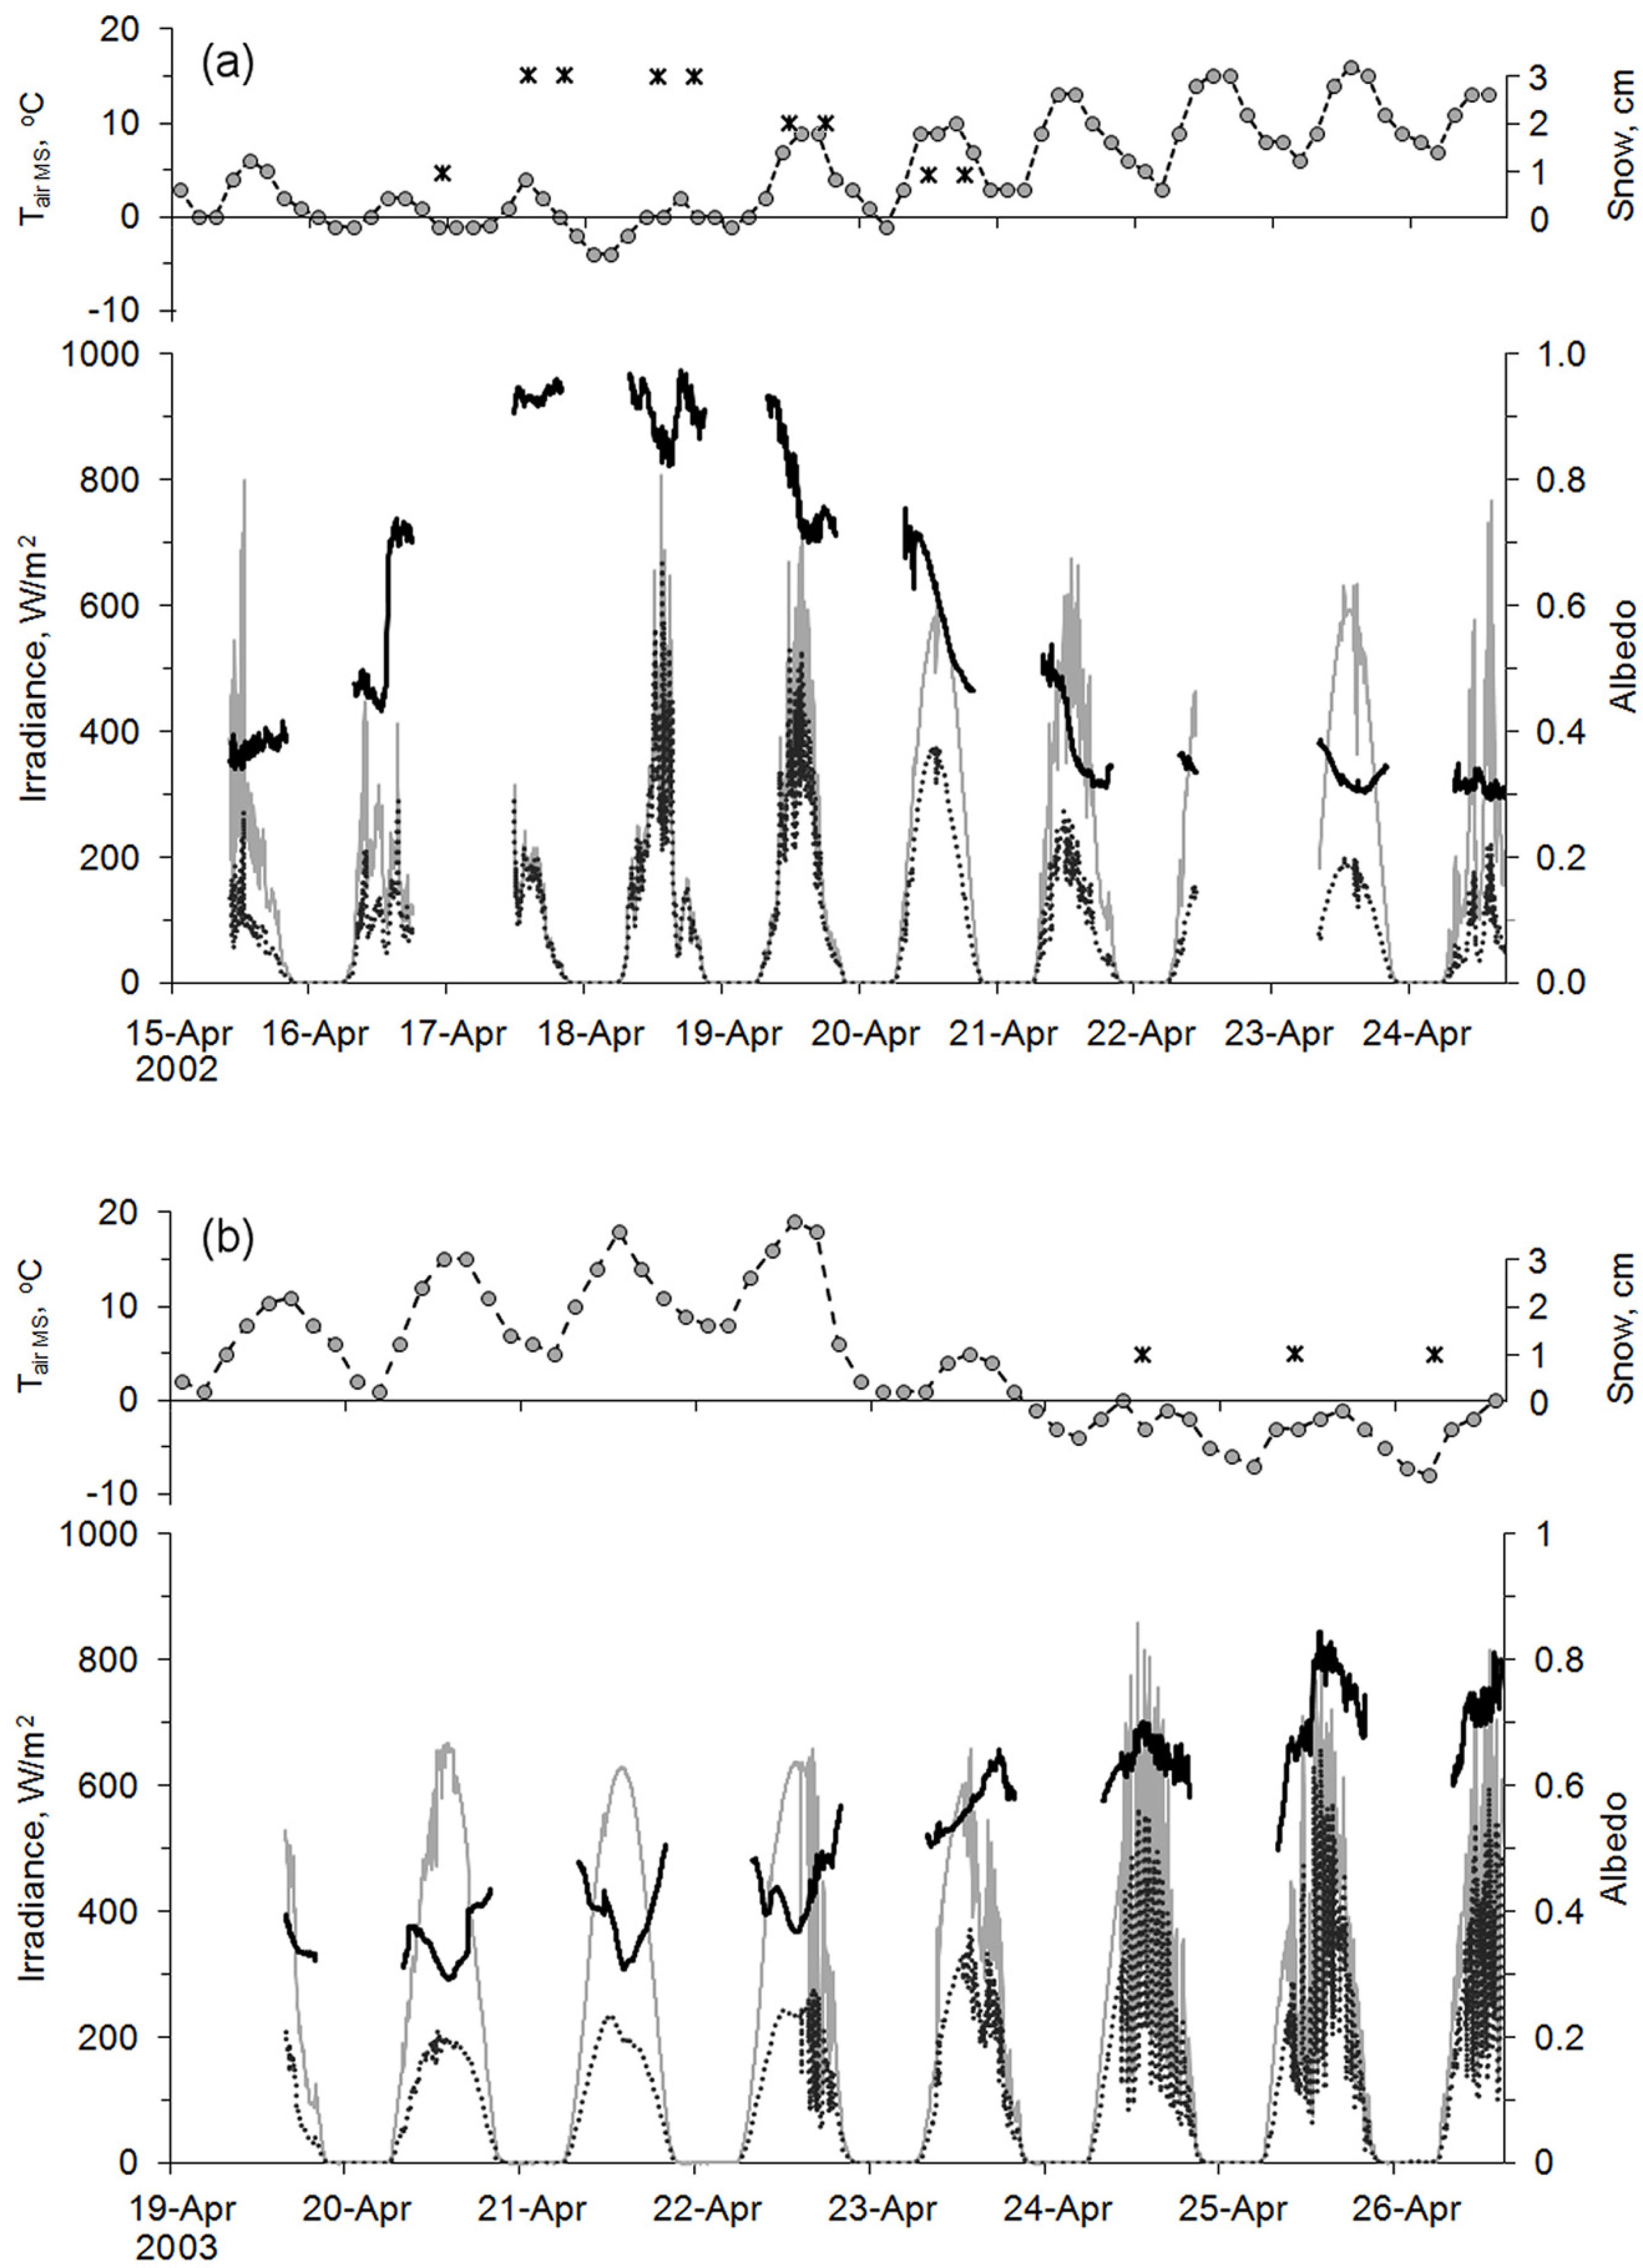
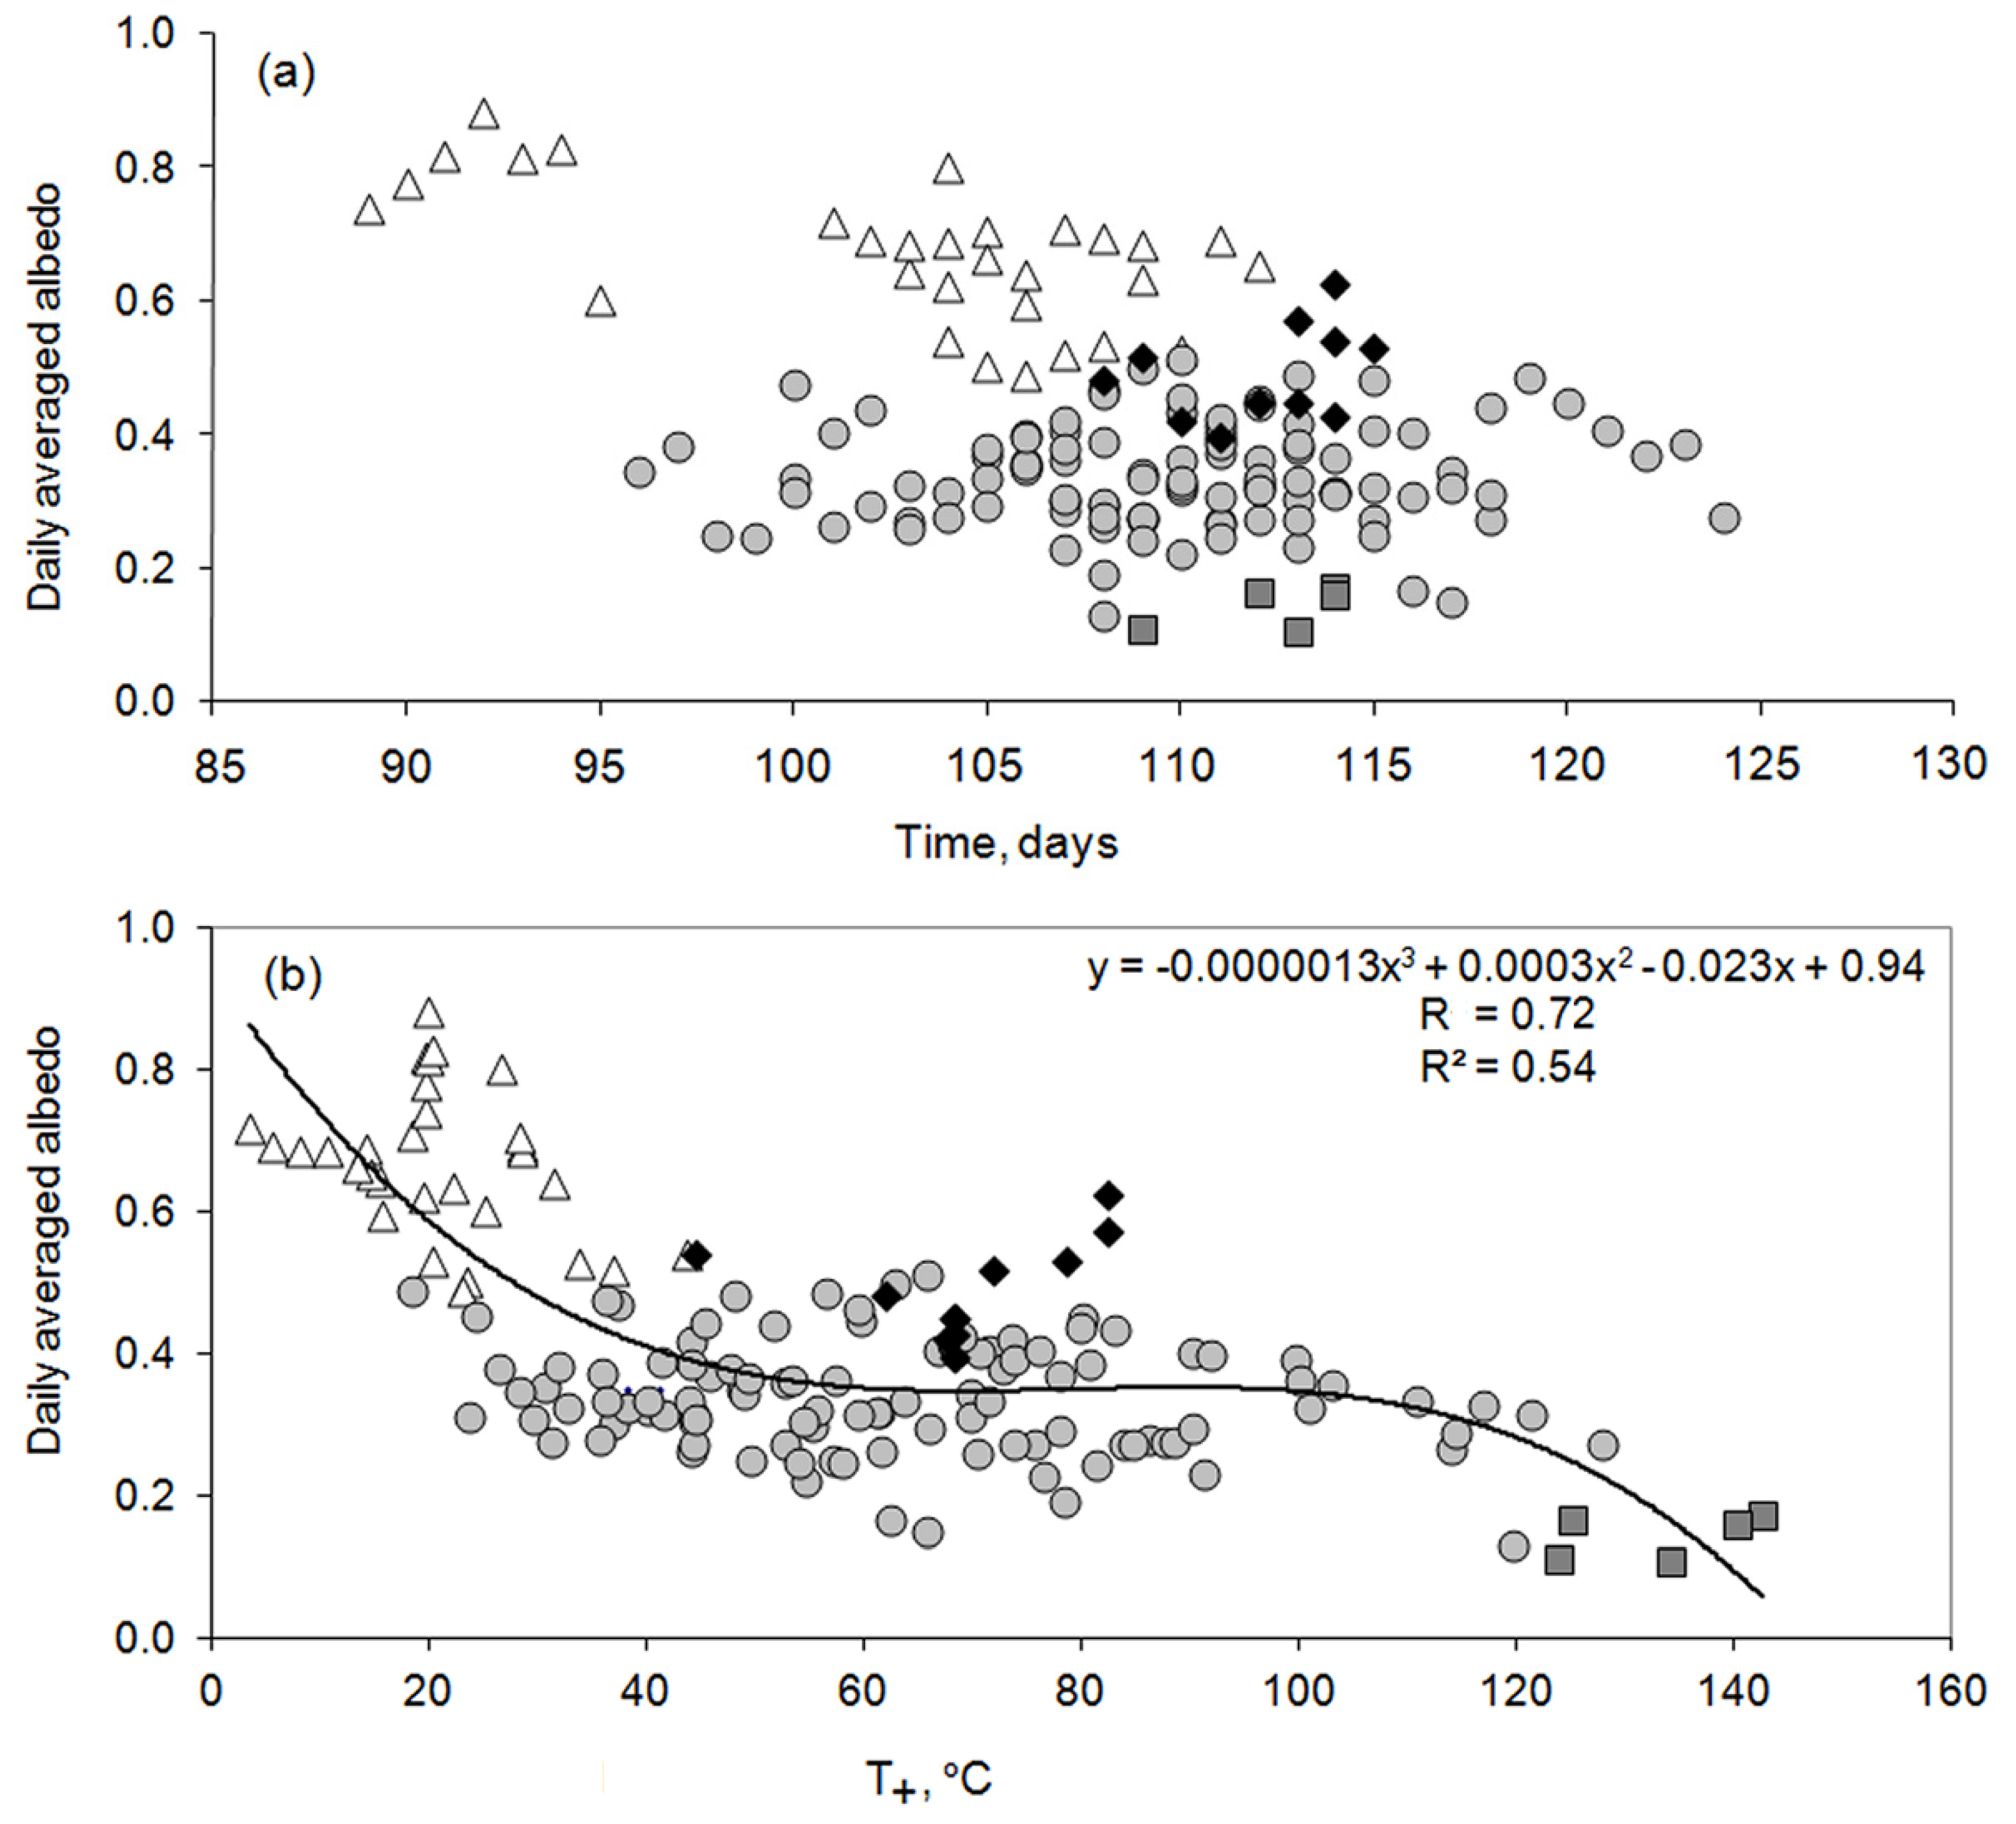
3.1. Climatic Variability

NAO-index values over the last 25 years were mainly positive (Figure 2a), and the average of NAO-index over last 25 years is 0.7.
Mean annual air temperature in the study region was increasing from 1950 to 2016 at a rate 0.029 °C per year; it was 0.056 °С per year during the intensive temperature increase period (1976–2016). Trends are significant at the level р < 0.01 (p is significance level). Air temperature growth rates are not the same for different months; in 1976–2016, the significant trends were observed for April, July, August, and September. Figure 2b shows the air temperature anomalies for the period December-March relative to the climatic norm (1961–1990) and linear trend for period 1950–2016 for meteorological station Petrozavodsk. It is clear that this parameter was positive in the vast majority of cases over the last 25 years (a positive deviation of more than 5 °C was observed in 2008 and 2015).
Total precipitation for December-March in 1950–2016 varied from 60 to 200 mm for station Petrozavodsk. Its increase for the given period was 0.48 mm per year (p < 0.05). The precipitation anomalies for December-March period (in relation to the climate norm 1961–1990) were generally positive and reached 20–40 mm in the last 25 years (Figure 2c).
Data analysis revealed that the mean monthly air temperature during December-March for the Petrozavodsk meteorological station correlates well with the NAO-index; the correlation coefficient is about 0.7; correlation between atmospheric precipitation and NAO-index is weaker, with the correlation coefficient about 0.3.

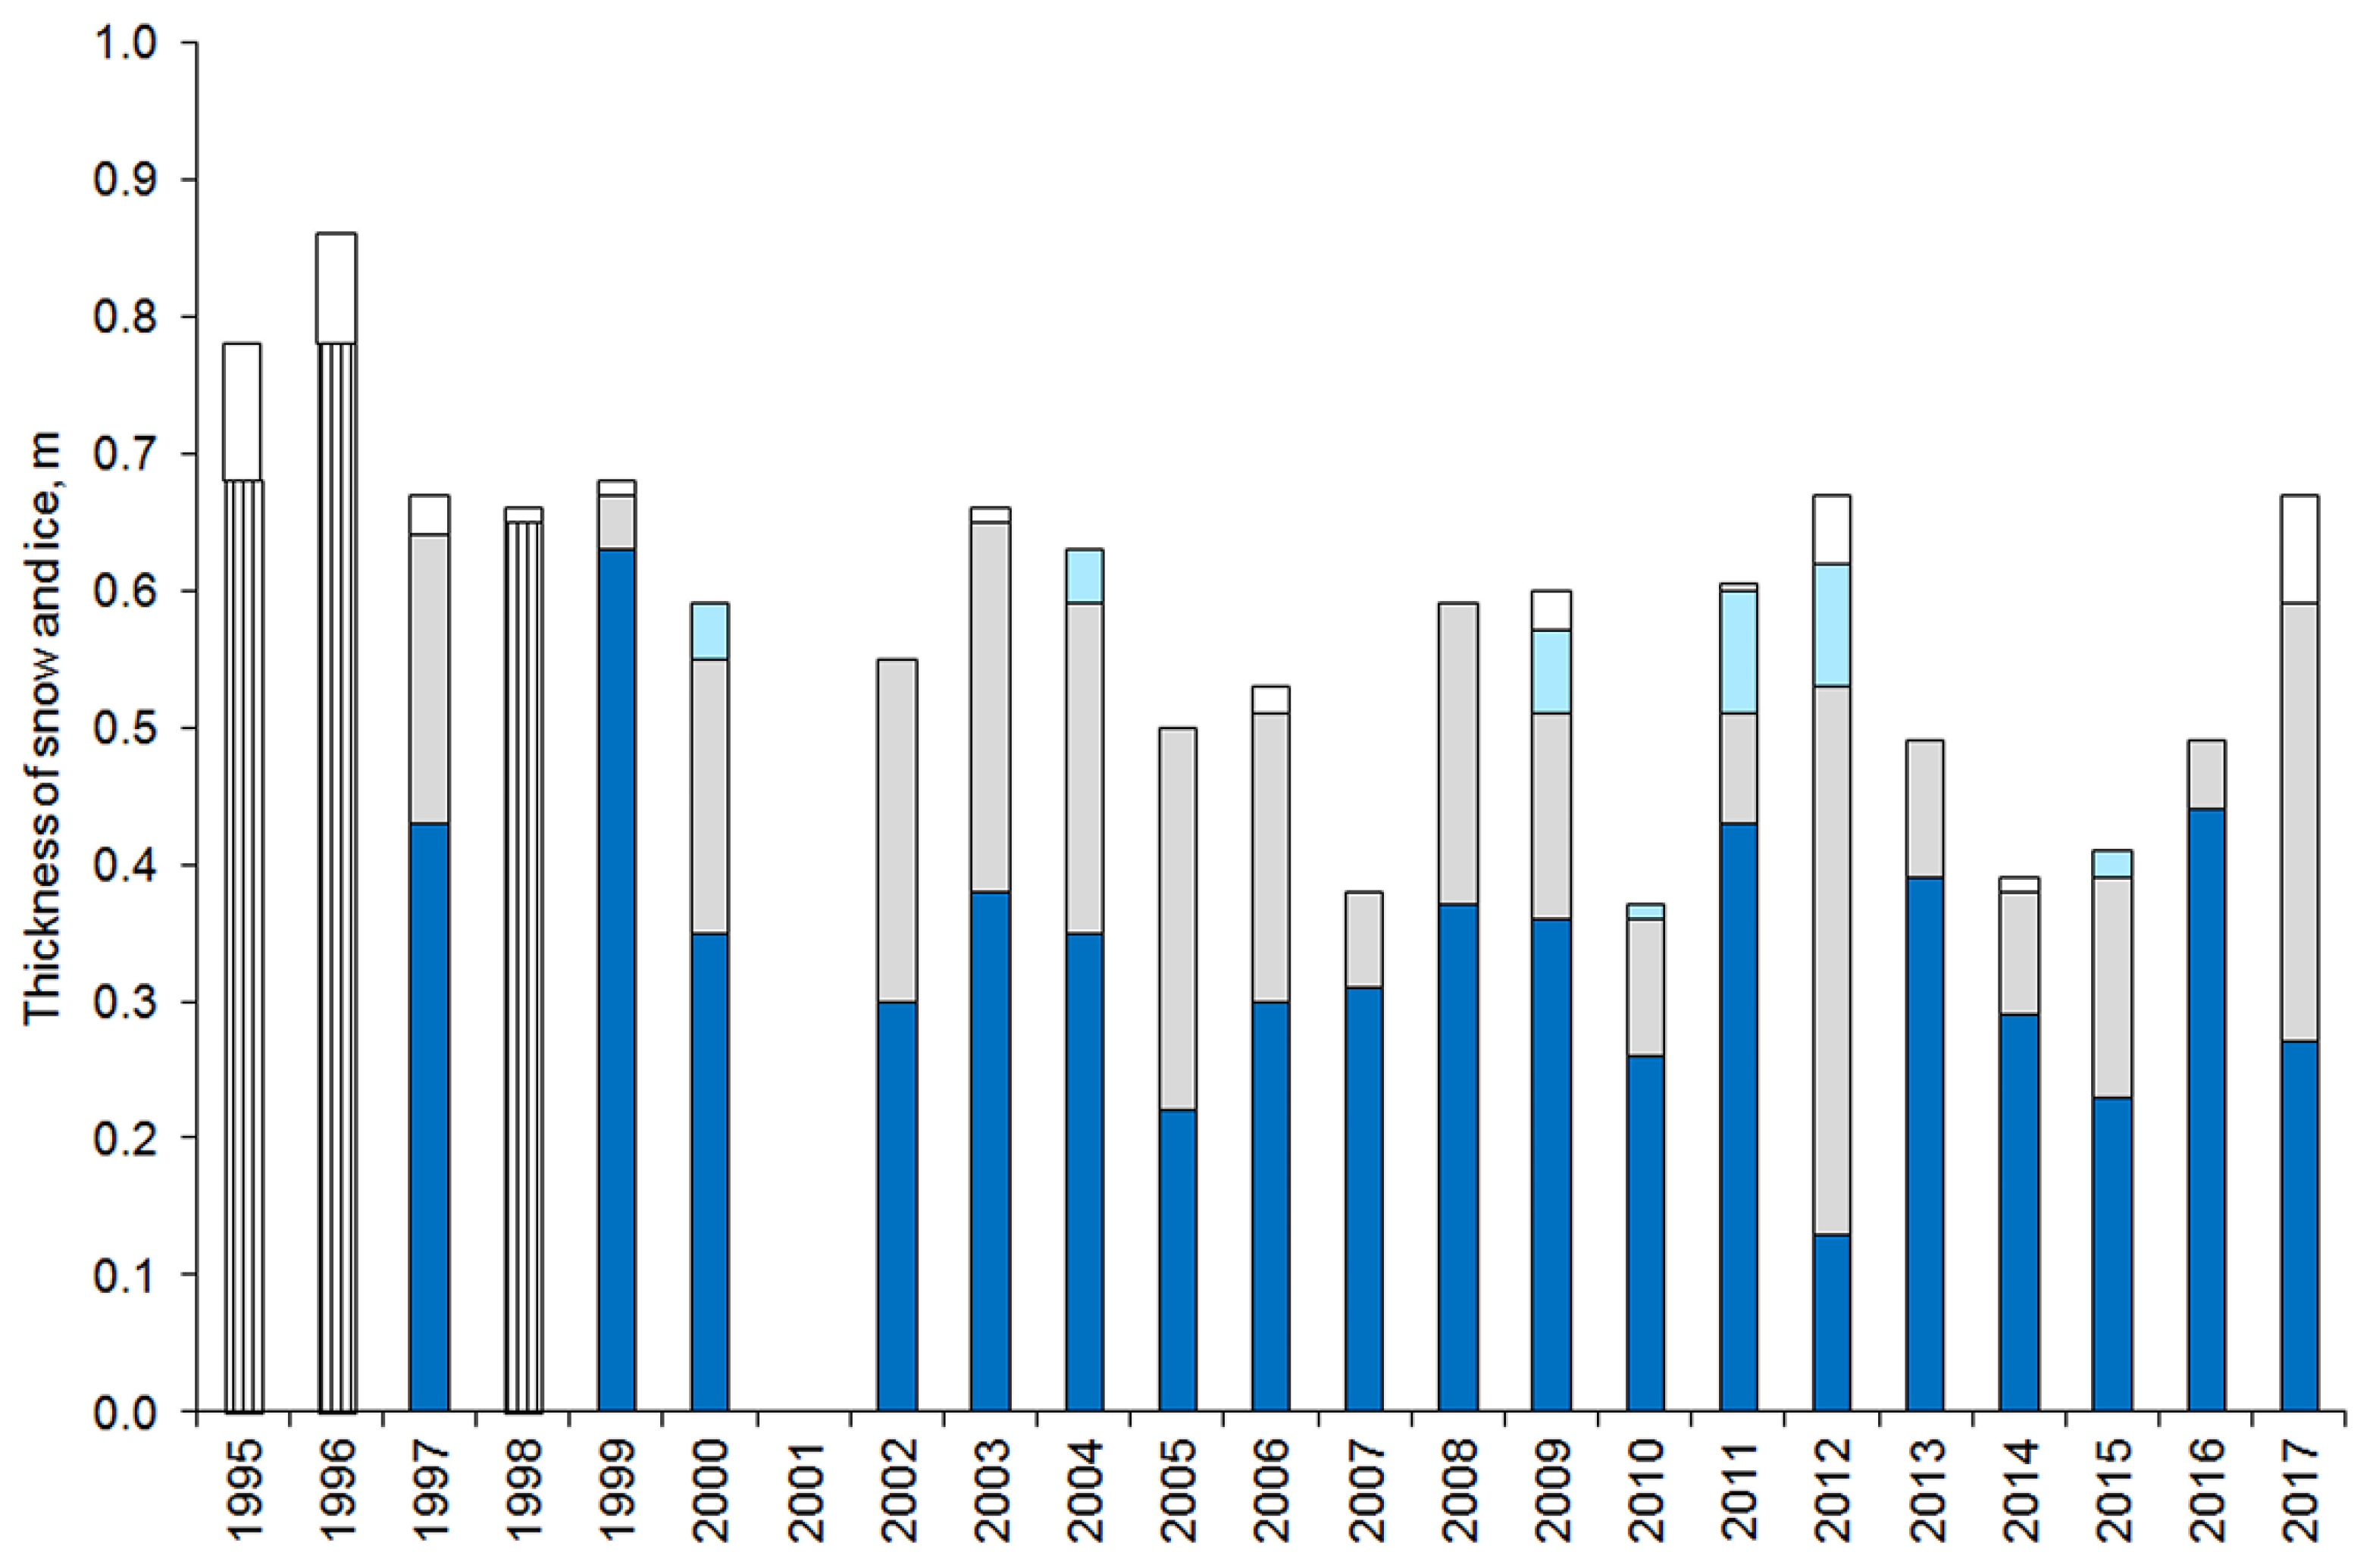
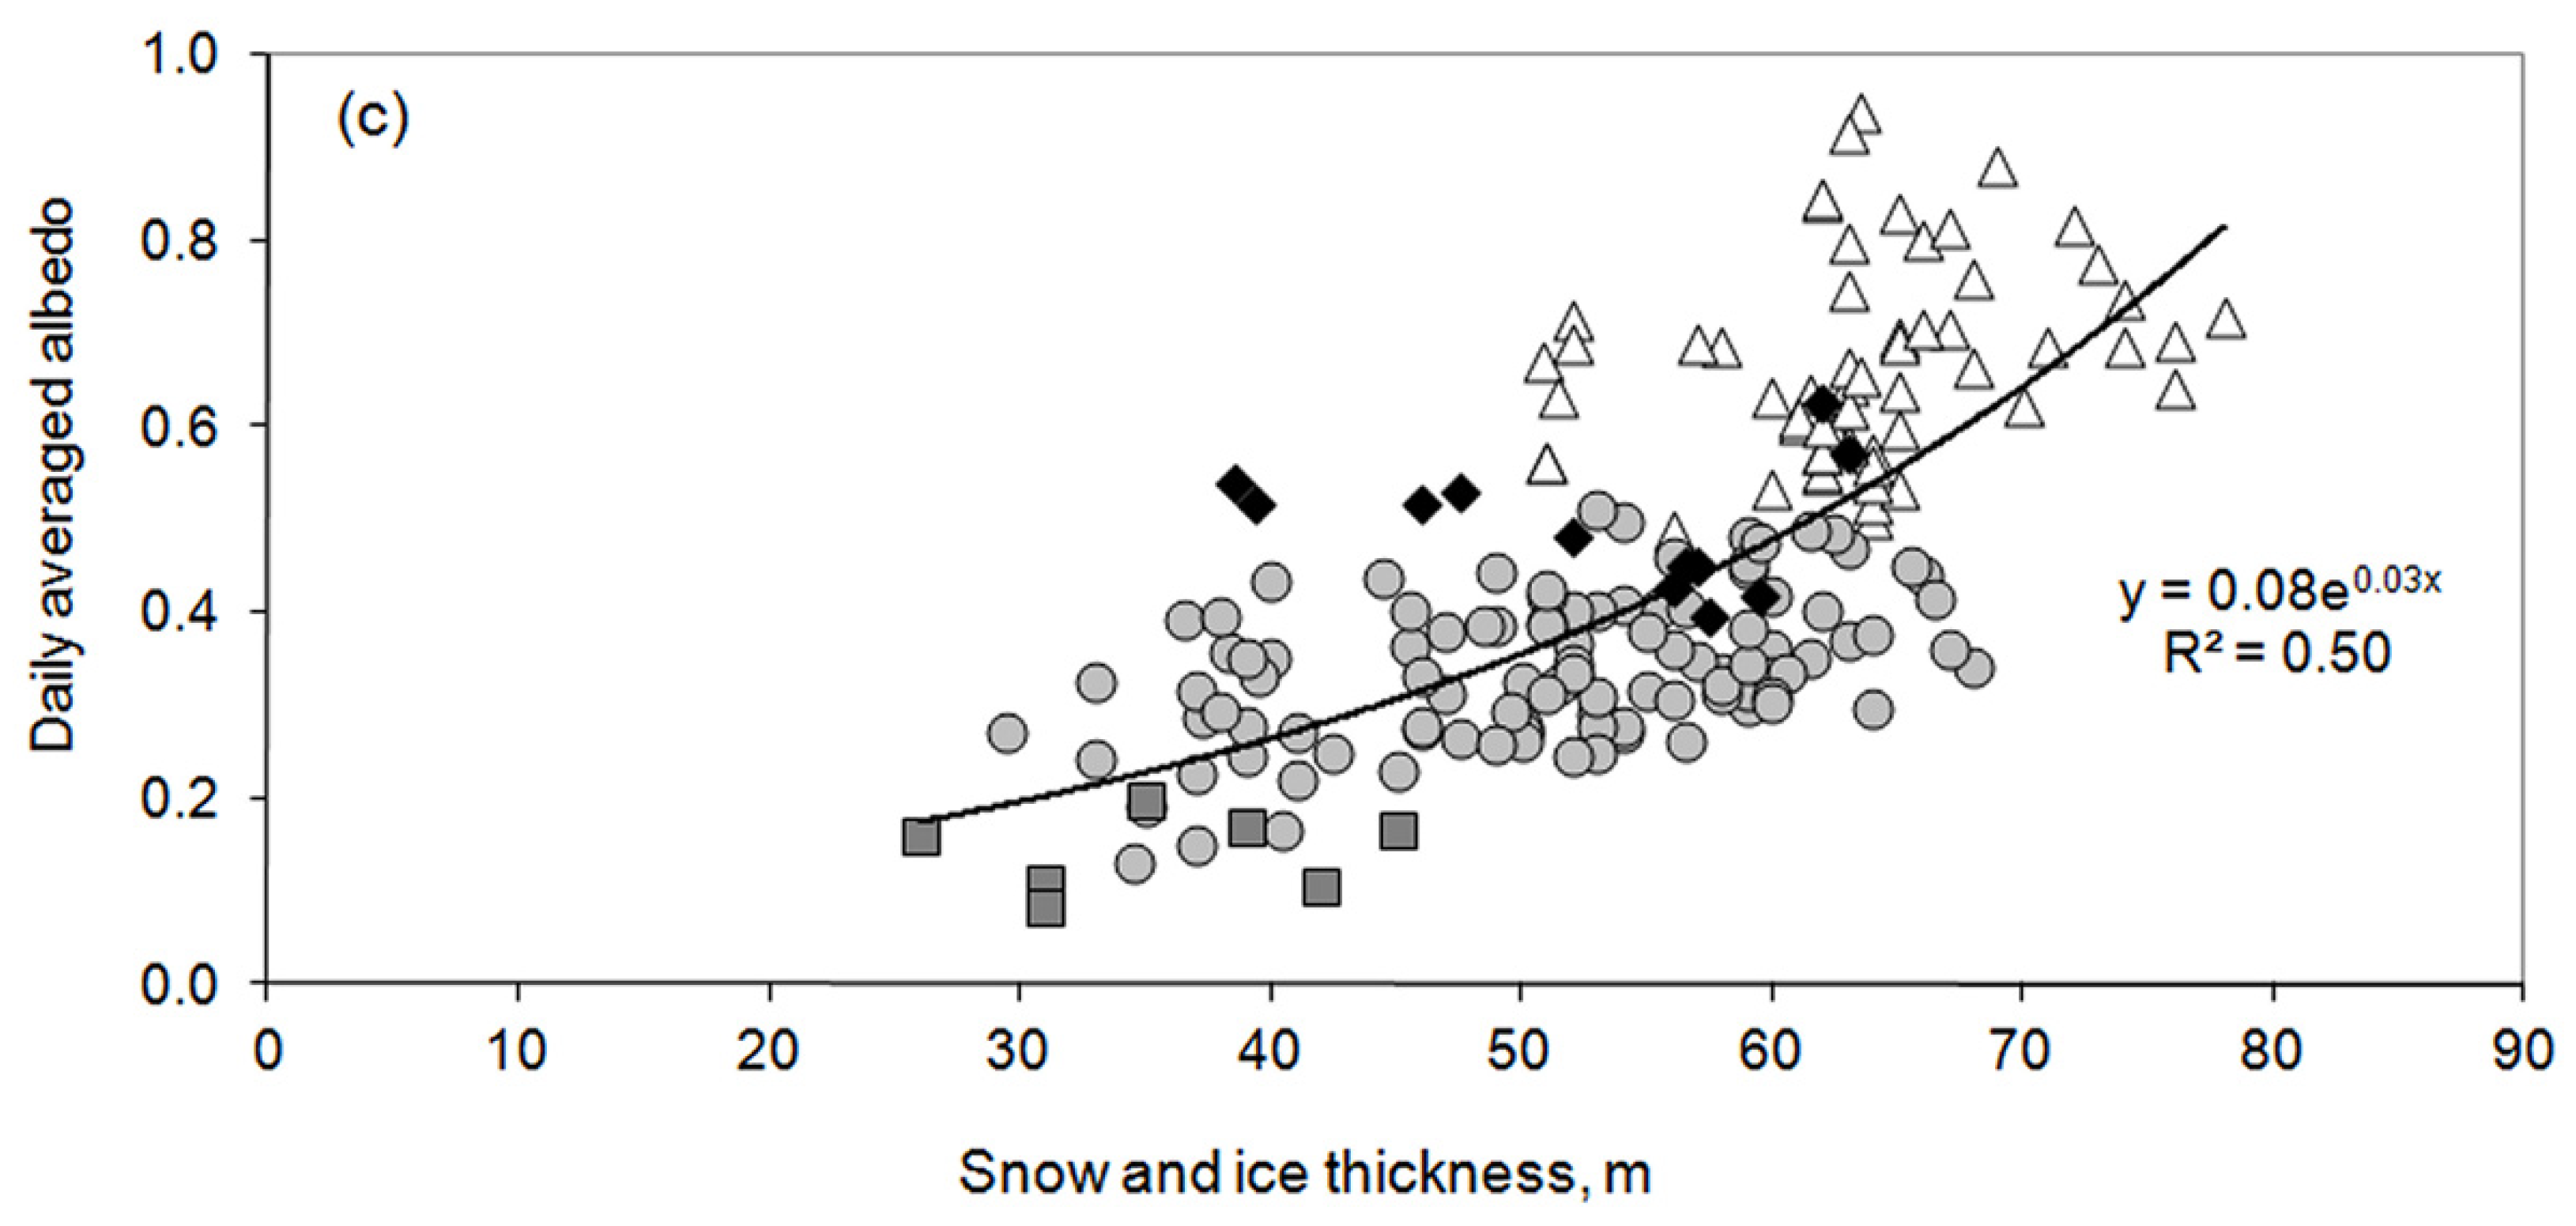
3.2. Ice and Snow Thickness

The thickness of snow usually reached 0.2–0.3 m on Lake Vendyurskoe in mid-winter (Table 2). A notable spatial difference of the ice thickness was observed during all years. It was minimal in early winter, then gradually increased and reached a maximum in late winter and spring.
In late March—early April, the snow melted quickly with a rate of melting of 1–2 cm per day, and by mid-April the snow thickness did not exceed a few cm (Figure 3). The ice thickness averaged over all stations in mid-April varied within 0.4 to 0.8 m in different years, with congelation ice 0.25–0.57 m thick, white ice 0.10–0.27 m thick, and slush 0.03–0.09 m thick. In spring, the standard deviation of the thickness of congelation ice and snow was 1–5 cm, that of slush 1–4 cm, and that of white ice 1–8 cm. Typically, in mid-April the congelation ice was thicker than the white ice, but sometimes the thickness of the white ice was larger. An abnormally small thickness of congelation ice in 2012 (0.13–0.14 m) was a result of frequent precipitation during the first month of ice-period, which markedly increased the thickness of white ice.
In mid-April, melting of snow and ice was observed, and the melting rate of total ice varied widely from 0.2 to 3.7 cm per day in different years depending on the weather conditions. The melting rate of white ice, slush and snow was 1–2 cm per day, and for congelation ice 0.1–0.8 cm per day with maximum in April 1999 (2.1 cm per day).
Attempts were made to investigate the variability of snow and white ice maximal thickness using multiple regressions. The predictors were NAO, the average air temperature for the period from December to March, and the amount of precipitation for the same period. However, since measurements of the thickness of snow and white ice were carried out in different years during the spring melting period, when the thicknesses of snow, and often of white ice, were already significantly reduced, the links with the selected predictors were not established.

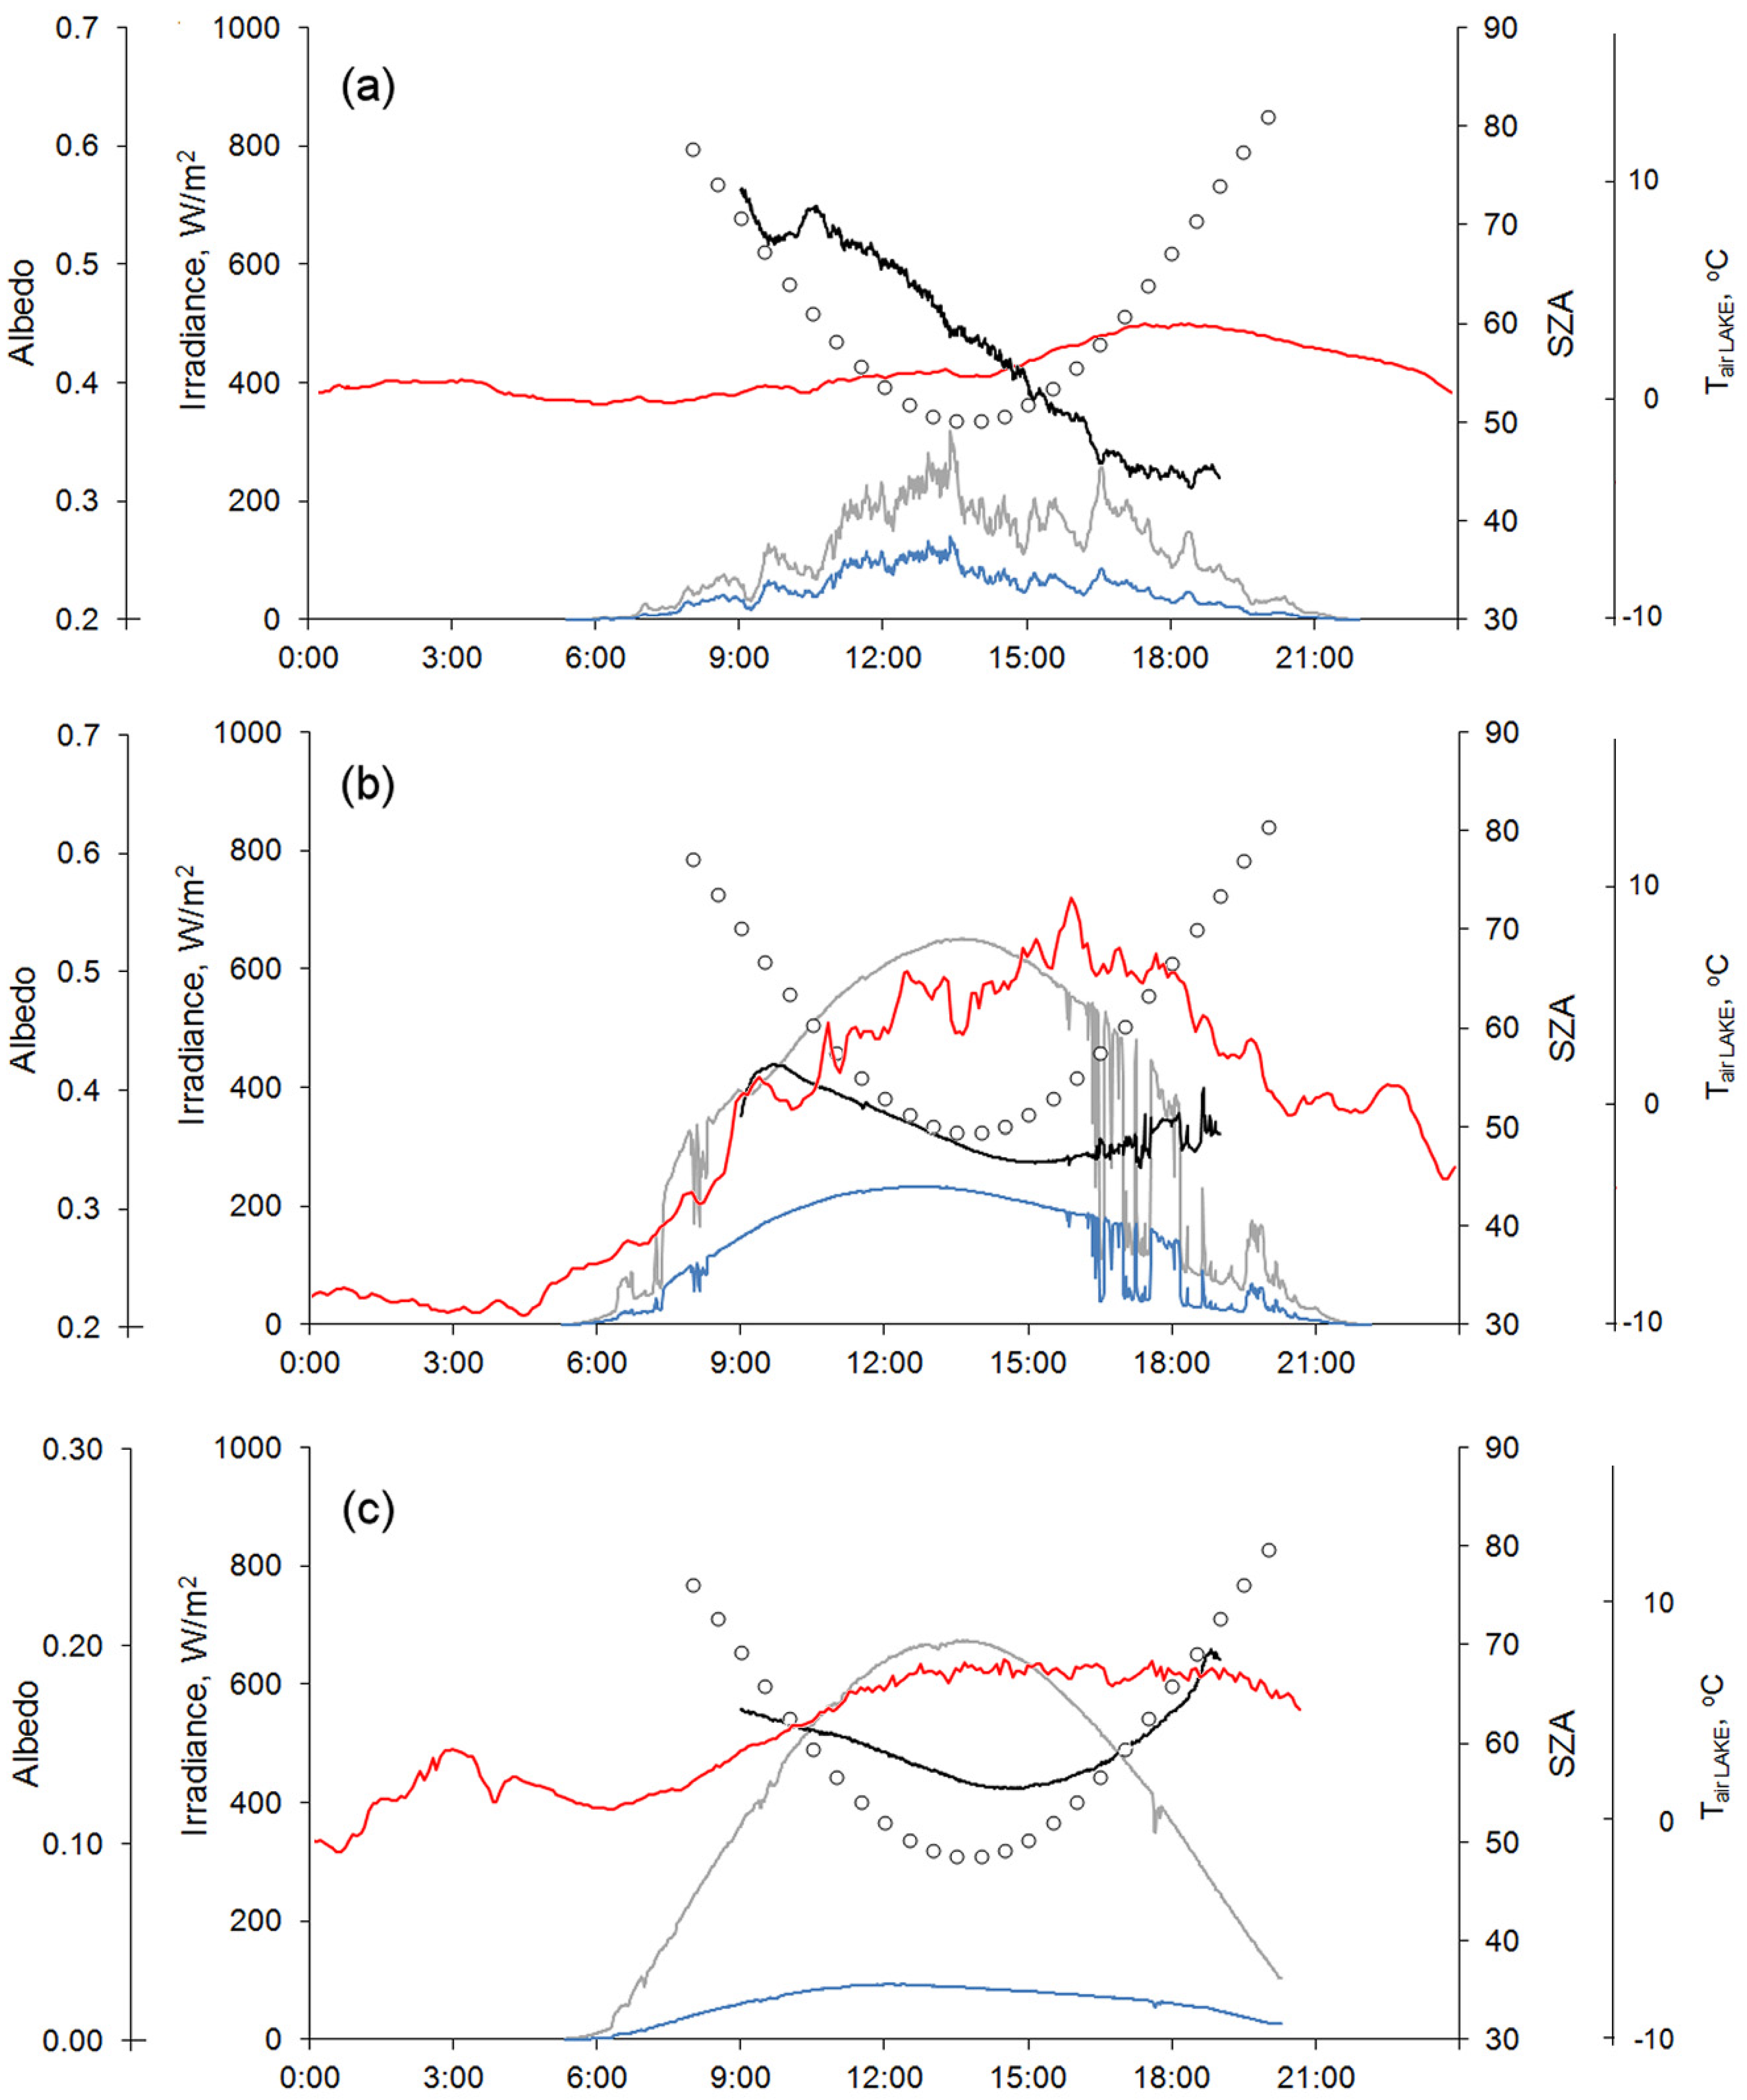
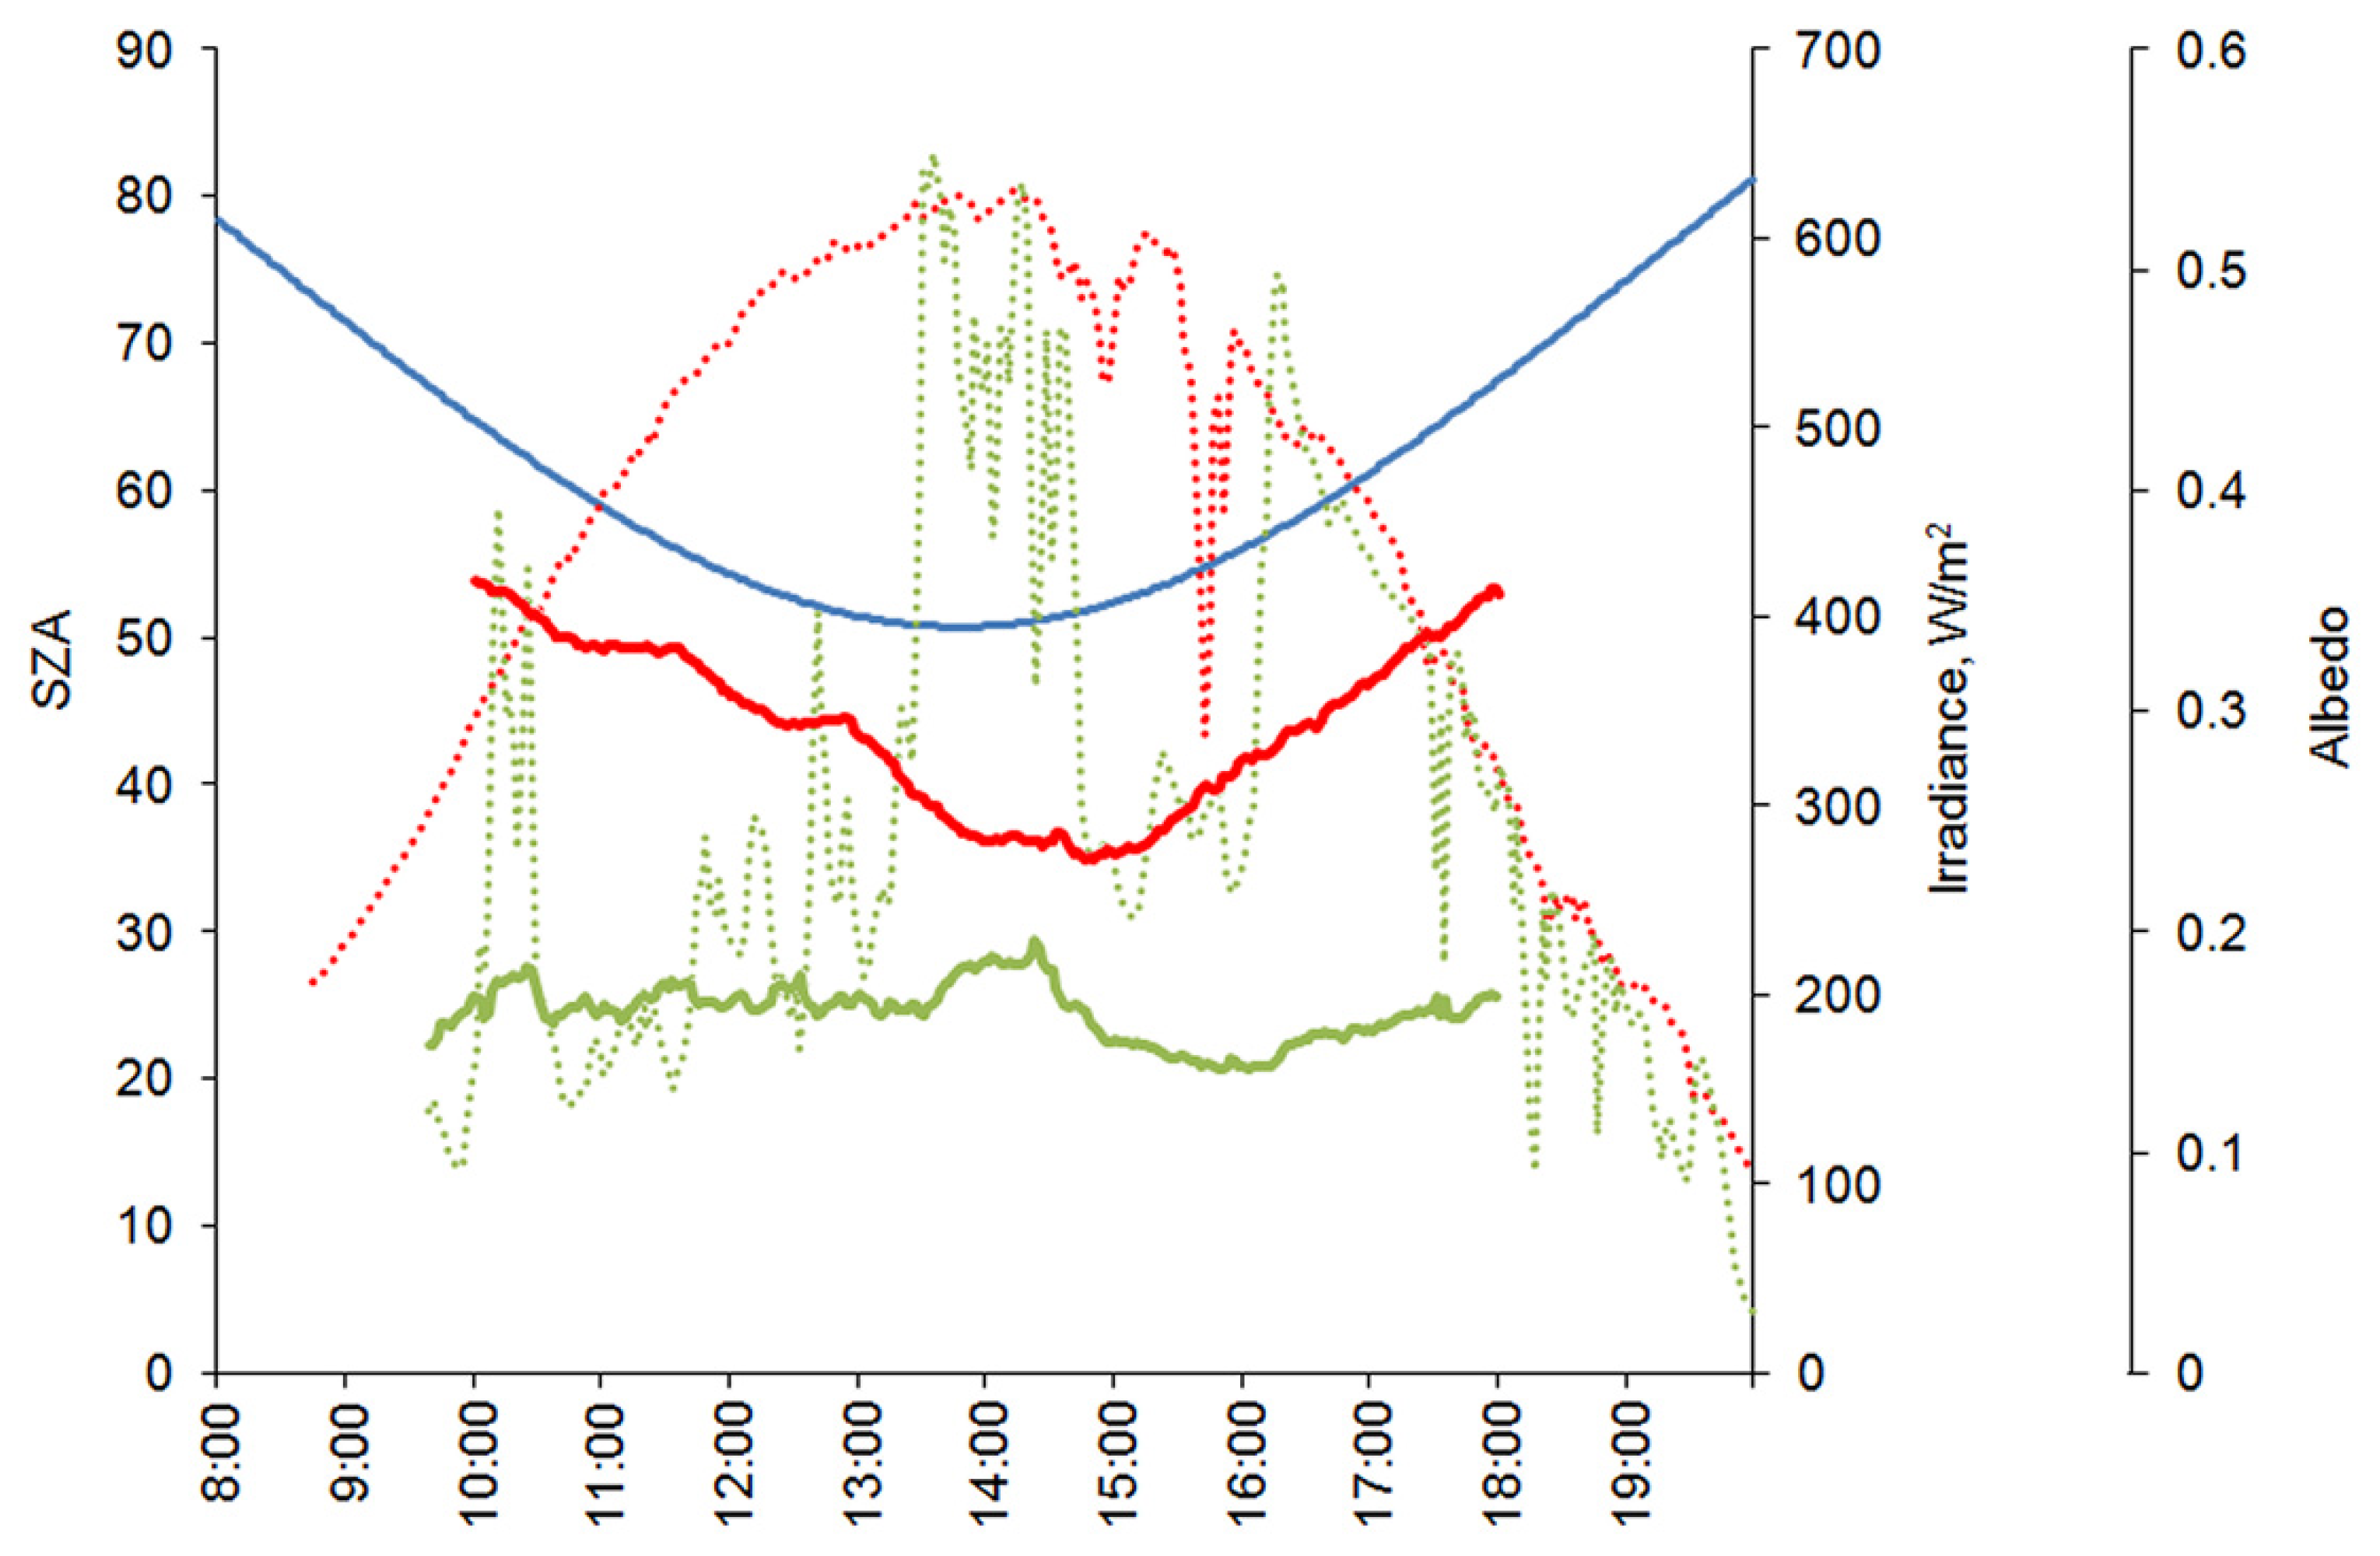
3.3. Solar Radiation and Albedo Variability

In mid-April, the daily maxima of downwelling and upwelling planar irradiance at the lake surface were 500–800 W/m2 and 200–500 W/m2, respectively (Table 1). During most of the winter, the albedo of the lake surface (ice covered with snow) varied little within 0.8–0.95. Albedo of fresh fallen snow reached 0.90–0.95. Gradually, as a result of snow texture transformation, snow albedo decreased to 0.8 and even lower, when the snow became wet due to short-term thaws with rain and fogs, and the thin ice crust formed on the snow surface. Snowflakes melted, coalesced and formed ice grains 1–2 mm in diameter. Density of this kind of snow increased to 400–500 kg/m3. Because of positive air temperature, the surface grains became wet, and the albedo value decreased to 0.6. However, after snowfall, the lake albedo rose again to 0.9–0.95.
In spring, as melting of snow and ice progressed, the albedo variability of the lake surface significantly increased. In general, as the melting develops, the albedo rapidly decreases, but a snowfall, which also may occur in mid-April, can dramatically increase the albedo. However, since a layer of fresh snow rarely exceeds several cm, it quickly melts, and the lake albedo decreases once again. For example, such rapid increase of albedo from 0.45 to 0.95 was observed during April 16–17, 2002 as a result of a snowfall. A layer of fresh snow on the surface of white ice was 3 cm thick. Then, due to the fast increase of air temperature from −4 to +13 °C and sunny weather, the snow quickly melted, and the lake surface albedo rapidly decreased from 0.9 to 0.3 during April 19–21, 2002 (Figure 4a).
When the snow melts completely, the white ice albedo does not exceed 0.5. However, sometimes, the transformation of the structure of the white ice surface is observed, when ice grains with a diameter of 1–2 mm, very similar to wet “snow”, are formed. This transformation leads to an increase in the albedo to 0.7–0.8. For example, the albedo of white ice was 0.3 on April 20, 2003 (Figure 4b) but, as a result of the transformation of the white ice surface, the “snow” layer began to form reaching the thickness of 3 cm by April 23, 2003 and the average daily albedo reached 0.57. In the next few days, negative air temperature and a snowfall led to the formation of a thin layer of fresh snow (about 1 cm thick). The albedo continued to grow, and on April 25–26 it was 0.70–0.85.
On clear sunny days, there was a pronounced decrease of the albedo during the daytime. According to our data, the lake albedo decreased by 0.2–0.3 from 9–10 a.m. to 6–7 p.m. on some days due to active melting and change the surface of white ice. For example, albedo decreased from 0.56 to 0.31 during April 22, 2006 as a result of intensive melting on the background of positive air temperatures (Figure 5a). On April 20, 2012, albedo decreased from 0.63 to 0.28 from 10 a.m. to 6 p.m. due to air temperature increase to 6.8 °C (−4 °C previous night) and rapid melting of slush on the surface of white ice. The thickness of slush decreased over the same period by 1.5 cm. The greatest decrease in albedo was observed on clear sunny days with a positive air temperature and rapid melting of freshly fallen snow (for example, 19 April 2002 albedo decrease from 0.94 to 0.62, see Figure 4a) or when white ice or slush rapidly melted and water appeared on its surface (April 5, 2017 albedo decreased from 0.72 to 0.42 from 9 a.m. to 5 p.m.; April 24, 1997 albedo decreased from 0.76 to 0.45 from 9 a.m. to 6 p.m.).
Analysis of downwelling irradiance data made it possible to reveal clear days, that is, the days when the radiation curve changed smoothly, without significant fluctuations. For example, April 20, 2002 was a clear sunny day (Figure 4a), as well as April 20 and 21, 2003 (Figure 4b). Sometimes on clear days with positive air temperature a certain correlation of albedo with SZA was observed: albedo decreased from morning hours to 2–3 p.m., then it increased up to 5–6 p.m. (Figure 5b,c, see also Figure 4a, April 23, 2002 and Figure 4b, April 20–22, 2003).
After snow melting, the surface of white ice is characterized by pronounced heterogeneity with small elevated areas and depressions of several meters in diameter. Thus, the surface of the lake becomes patchy. In the elevated areas, the light spots similar to wet “snow” are formed. Water accumulates in the depressions, and dark wet spots are formed there. Spatial measurements of albedo in April 2002, 2006, and 2007 revealed that differences between dark and light spots can reach 30–40% (Table 1, data marked with asterisks).
After complete melting of the white ice, the albedo of the lake surface continues to decline. For four years only, the measurements were carried out during periods with complete melting of white ice. The congelation ice on the lake surface was observed only on April 20–24, 1999, April 24, 2000, April 18–19, 2007 and April 24, 2013. The congelation ice albedo varied from 0.08 to 0.35. On clear days with positive air temperature we observed a decrease of congelation ice albedo to a minimum at 2–3 p.m., and subsequent growth by evening; on cloudy days, the congelation ice albedo had no pronounced changes associated with the height of the sun (Figure 6).
An attempt to establish the dependence of albedo on climatic parameters (NAO index, precipitation sum and average air temperature for the period from December to March) with the use of multiple regressions did not succeed.
There is no clear dependence of albedo on the observation date during the spring melting because of the variable conditions that occurred over different years in terms of air temperature and solar irradiance evolution (Figure 7a).
The intensive melting of the snow-ice cover occurs mainly at air temperature above 0 °C. We tried to find a connection between the dynamics of the albedo and the change in the type of snow-ice cover during the spring melting period.
Applying multiple regression with four predictors we obtained the correlation and determination coefficients R = 0.75 and R2 = 0.56; standard of residual (SR) is 0.11. At that, the first predictor (the sum of the positive air temperatures, starting from March 1) reflecting the melting process of the snow-ice cover, explains 90% of albedo variability. In addition, it was found that between mean daily values of air temperature and solar radiation in March-April there is a correlation R > 0.7. So, for rough estimations of albedo, only the first predictor—the sum of positive temperatures from March 1 (Figure 7b)—was taken into account. We intentionally neglected the snowfall episodes in the development of this dependence, because snowfalls in April are not very frequent. In addition, the fallen snow usually melts within 1–2 days, and albedo returns to its level before the snowfall. To describe this dependence, different types of equations were used. For linear equation, A = −0.0033(T+) + 0.598, the connection is significant at the level p < 0.01, but the coefficient of determination is low R2 = 0.39, SR = 0.13. For power form of the equation, A = 1.84(T+)−0.41, the empirical dependence improves, R2 = 0.42, SR = 0.12.
To best approximate the observation data, we used a cubic spline:
A = 0.94 0.023 T + + 0.0003 ( T + ) 2 0.0000013 ( T + ) 3
Here A is a daily average albedo, T+ is the accumulated sum of positive temperatures from March 1.
The equation choice was determined with the use of an explained fraction of the dispersion with the highest determination coefficient R2 = 0.54 (the statistical significance level p < 0.01).
We also showed the relation between the daily averaged albedo and snow-ice cover thickness (Figure 7c). This relationship is best described with an exponential dependence of the daily albedo average (A) over the full snow-ice thickness (SI):
A = 0.08   e ( 0.03   SI )
For prognostic purposes, Equation (1) is preferable because of its better correlation (R2 = 0.54); besides, it does not require measurements of ice thickness on the lake.

4. Discussion

The formation of ice-snow cover on boreal lakes is dependent on the regional climate variability. Karelian weather conditions in winter are largely determined by the large-scale western transfer of air masses. To estimate its intensity, the NAO index is widely used. The values of this index are positive when the western transfer of relatively warm, damp air masses above Europe intensify, and they are negative when the transfer weakens. A joint analysis of meteorological data from Petrozavodsk station and the NAO index showed that winters with NAO-index positive values are usually warmer than a climatic norm (1961–1990) and characterized by an increased amount of precipitation. Winters with the negative index values are relatively colder and less snowy than a climatic norm. This may point at the relatively warm winters in the region of our research with increased precipitation, which should affect the lakes snow-ice cover structure (decrease in congelation ice thickness, and white ice thickness growth).
Statistically significant relationship of ice-on and ice-off terms with NAO-index values during the two preceding months in Karelian lakes was established earlier in [31]. Air temperature determines the growth rate of congelation ice in early winter. Precipitation influences snow cover and white ice thickness. As shown in [12], the increase in air temperature reduces basal ice growth, while increased precipitation may either decrease or increase the net ice growth via thermal insulation or white ice formation. As air temperature and precipitation in winter months vary in different years, the thickness, structure, and texture of the small lakes snow-ice cover also differ.
A review of several albedo parameterizations is given in [18]. In most of the parameterizations mentioned in this paper, the dependence of the albedo on the thickness of snow and ice, as well as on the temperature of the surface and air, is investigated. The authors show that the best parameterization of the albedo of first-year sea ice in the Gulf of Bothnia, Baltic Sea, in spring 2004 in the period of intensive spring melting as the determining parameter includes the thickness of the snow. No connection was found with air and surface temperature.
Statistical regression dependency of albedo and maximal thickness of the snow and white ice on Lake Vendyurskoe on winter characteristics (NAO-index, air temperature and precipitation anomalies for the period from December to March) was not established, since observations were carried out mainly during the period of intense spring melting. However, it is obvious that the formation of the snow, white and congelation ice occurs under the influence of the weather conditions of a particular year, that is, it experiences the influence of the above mentioned climatic parameters. We have not been able to establish these links because of shortcomings of our observations. Large and inevitable flaw of our ice measurements is that they occurred only occasionally in winter; with regards to the spring melting, every year they fell to a different phase of this process: i.e., beginning, middle, end. Therefore, we had no information on the maximum thickness of snow and white ice before the beginning of spring melting for all years of observations. So, we could not find a reliable relationship between the maximal thickness of snow-ice sheet and climatic parameters.
At the same time, the relationship between the daily averaged albedo and the sum of accumulated positive temperatures from March 1 in the form of a cubic equation with a coefficient of determination R2 = 0.5 was revealed. The suggested third order polynomial fits the physical meaning of the lake albedo variability from the amount of external heat that has come to its surface. The sharpest decrease in the albedo is observed in the melting of snow. Complete snow melting ends when the accumulated sum of positive temperatures reached approximately 30 degrees (Figure 7b). In different years this process lasted about 10–15 days. Short snowmelt period is typical over land areas [32] and lakes [15] in southern Finland, with a mean duration of 15 days. For complete melting of white ice, it is required that the accumulated sum of positive temperatures increases by another 80 degrees. While white ice melts, its albedo varies very slightly. If in the initial ice-period, a large amount of precipitation fell and a thick layer of white ice formed, the process of its melting required more the accumulated sum of positive temperatures. After complete melting of white ice, the process of albedo reduction is again accelerated, in connection with the fact that congelation ice melts very quickly and a water film forms on its surface.
According to our data, the values of the lake surface albedo varied widely in mid-April depending on the weather conditions (precipitation, air temperature). The data for all years of the measurements were summarized, and the following estimates of the albedo for different conditions of lake surfaces were obtained: 0.80 ± 0.15 for fresh snow, 0.60 ± 0.20 for old and wet snow, 0.35 ± 0.10 for white ice, 0.20 ± 0.05 for slush and 0.20 ± 0.15 for congelation ice. We also showed the exponential dependence relation between the daily averaged albedo and snow-ice cover thickness (Figure 7c). Our estimates of albedo are in good agreement with the results of measurements and calculations of albedo for other lakes [15,17,19].
Our estimates of melting rate of snow and ice (0.1–2 cm per day) are also in good agreement with the results of the rigorous research of processes of ice melting held at Lake Vendyurskoe in April 1999 [33], 2006 and 2007 [34]. A melting rate of 2.9 and of 3.4 cm per day (cloudless conditions) was calculated during April 20–21, 1999 [33]. The investigation of the diurnal melting dynamics was conducted in [33] using the heat budget of the ice-sheet. The maximum melting rate was observed during the day hours (12:00–15:00), while at night, with low air temperatures, the growth of the ice was observed. The heat budget analysis revealed that the internal melting due to the absorption of short-wave radiation was the dominant mechanism of melting. In [34] the melting rate is investigated on the basis of the heat budget of Lake Vendyurskoe ice cover: the mean melting rates of 1.2 cm per day at the surface, 0.2–0.8 cm per day at the bottom and 1–2 cm per day in the interior were calculated. Similar values of the average rate of ice melting in mid-April (1.5 cm per day) were obtained for Lake Pääjärvi, Finland [15].
We observed a noticeable meso-scale variability of the albedo in the spring during snowfall, snow melting and changes in the structure of the surface of white ice. There was also a pronounced variability of the albedo during the daytime hours (a decrease by 0.1–0.3 during the thawing process and an increase of 0.3–0.5 in the case of snowfall). On clear days we observed pronounced white ice and congelation ice albedo changes associated with the height of the sun: a decrease to a minimum at 2–3 p.m., and subsequent growth by evening (Figure 5b,c and Figure 6). Similar dynamics of albedo during the intensive melting was described for Lake Pääjärvi [15]: the sharp decrease in albedo from 0.8 to 0.1 recorded during two weeks in mid-April 2006 was caused by the intensive melting and changes of the lake surface. The authors also noted significant diurnal dynamics of the albedo reaching maximum in the morning and decreasing during the daytime due to the evolution of the surface state, changing solar altitude, and cloudiness conditions. A marked decrease in albedo during the daytime hours was also noted in [18], as a result of intensive melting.

5. Conclusions

The current study presents the results of the field investigations of surface albedo and thickness of snow and ice on a small Lake Vendyurskoe (Northwestern Russia) during 1995–2000 and 2002–2017. The wide inter-annual variability of the thickness and structure of snow-ice cover is described. Some features of the albedo dynamics in late winter and early spring are analyzed on the basis of the measurements of the thickness of snow and ice and irradiance above the ice. The results reveal a significant inter-annual, meso-scale and daily variability of albedo in spring (from 0.95 for fresh snow to less than 0.1 for congelation ice with water on its surface).
The pronounced variability of albedo during daytime was observed due to a change in the state of the surface of snow and ice as a result of its active melting at positive air temperature.
We were unable to establish a statistically significant relationship between the albedo, maximal thickness of snow and ice, and parameters that characterized regional climatic variability (NAO-index, precipitation and mean air temperature for the period December-March for meteorological station Petrozavodsk, closest to study site) because of the insufficient duration of measurements. We, therefore, offer only a qualitative conclusion that the warm winters in the region of interest with a large amount of precipitation falling in the initial period of freeze-up control the dynamics of the snow-ice cover, contributing to an increase in the thickness of the white ice.
To link the dynamics of the albedo with the external heat flux during the spring melting period, a simple approach based on the sum of accumulated positive temperatures from March 1 (T+) has been adopted to describe the evolution of the daily averaged albedo during the melting period. Sufficiently significant correlation between the average daily albedo and T+ is obtained. The use of this predictive equation is very convenient, since it does not require measurements of ice and snow thickness on the lake.
Analysis of our data showed that albedo depends significantly on the spring weather conditions, and, thus, can act as one of the indicators of climate variability. Simple empirical relationship between external heat and albedo established for Lake Vendyurskoe in this paper can potentially be applied to other small reservoirs with the similar ice phenology. There are about 61,000 small water bodies in the Republic of Karelia that stretches from south to north for almost 600 km. If the results of this study are to be applied elsewhere, it is necessary to select representative meteorological stations located at a distance of no more than 100 km from the study site.
The obtained equations based on the average daily data do not take into account the daily variability of albedo and its spatial heterogeneity. They should be considered in numerical models with a time step of less than one day [23]. To improve albedo estimations, we plan to establish its dependence on a set of meteorological characteristics controlling the heat fluxes and the heat balance (air temperature, wind, humidity, cloudiness).

Author Contributions

N.P. and A.T. formulated and designed the experiment; R.Z., N.P. and S.V. performed the experiment; N.P., G.Z., T.E., G.G., S.B. and S.V. analyzed the data; G.Z., N.P., and G.G. contributed materials and analysis tools, N.P., S.B. and G.Z. wrote the manuscript, and all the authors contributed to writing and discussing the paper.

Acknowledgments

The work was carried under the State scientific research.

Conflicts of Interest

The authors declare no conflict of interest.

References

  1. Liang, S.L.; Wang, K.C.; Zhang, X.T.; Wild, M. Review on estimation of land surface radiation and energy budgets from ground measurement, remote sensing and model simulations. IEEE J. Sel. Top. Appl. Earth Obs. Remote Sens. 2010, 3, 225–240. [Google Scholar] [CrossRef]
  2. Stephens, G.L.; Li, J.; Wild, M.; Clayson, C.A.; Loeb, N.; Kato, S.; L’Ecuyer, T.; Stackhouse, P.W., Jr.; Lebsock, M.; Andrews, T. An update on Earth’s energy balance in light of the latest global observations. Nat. Geosci. 2012, 5, 691–696. [Google Scholar] [CrossRef]
  3. Hall, A.; Qu, X. Using the current seasonal cycle to constrain snow albedo feedback in future climate change. Geophys. Res. Lett. 2006, 33. [Google Scholar] [CrossRef] [Green Version]
  4. Mironov, D.; Heise, E.; Kourzeneva, E.; Ritter, B.; Schneider, N.; Terzhevik, A. Implementation of the lake parameterisation saheme FLake into the numerical weather prediction model COSMO. Boreal Environ. Res. 2010, 15, 218–230. [Google Scholar]
  5. Pirazzini, R. Challenges in Snow and Ice Albedo Parameterizations. Geophysica 2009, 45, 41–62. [Google Scholar]
  6. Liang, S.L.; Li, X.; Wang, J. Advanced Remote Sensing: Terrestrial Information Extraction and Applications, 1st ed.; Academic Press: Oxford, UK, 2012; p. 800. ISBN 978-0-12-385955-6. [Google Scholar]
  7. Du, J.; Kimball, J.S.; Duguay, C.; Kim, Y.; Watts, J.D. Satellite microwave assessment of Northern Hemisphere lake ice phenology from 2002 to 2015. Cryosphere 2017, 11, 47–63. [Google Scholar] [CrossRef] [Green Version]
  8. He, T.; Liang, S.; Song, D.-X. Analysis of global land surface albedo climatology and spatial-temporal variation during 1981–2010 from multiple satellite products. J. Geophys. Res. Atmos. 2014, 119, 10281–10298. [Google Scholar] [CrossRef]
  9. Leppäranta, M.; Kosloff, P. The thickness and structure of Lake Pääjärvi ice. Geophysica 2000, 36, 233–248. [Google Scholar]
  10. Ashton, G.D. River and lake ice thickening, thinning and snow ice formation. Cold Reg. Sci. Technol. 2011, 68, 3–19. [Google Scholar] [CrossRef]
  11. Leppäranta, M. Freezing of Lakes and the Evolution of Their Ice Cover, 1st ed.; Springer: Berlin/Heidelberg, Germany, 2014; p. 311. ISBN 978-3-642-29081-7. [Google Scholar]
  12. Lei, R.; Leppäranta, M.; Cheng, B.; Heil, P.; Li, Z. Changes in ice-season characteristics of a European Arctic lake from 1964 to 2008. Clim. Chang. 2012, 115, 725–739. [Google Scholar] [CrossRef]
  13. Petrov, M.P.; Terzhevik, A.Y.; Palshin, N.I.; Zdorovennov, R.E.; Zdorovennova, G.E. Absorption of Solar Radiation by Snow-and-Ice Cover of Lakes. Water Resour. 2005, 32, 496–504. [Google Scholar] [CrossRef]
  14. Warren, S.G. Optical properties of snow. Rev. Geophys. Space Phys. 1982, 20, 67–89. [Google Scholar] [CrossRef]
  15. Jakkila, J.; Leppäranta, M.; Kawamura, T.; Shirasawa, K.; Salonen, K. Radiation transfer and heat budget during the ice season in Lake Pääjärvi, Finland. Aquat. Ecol. 2009, 43, 681–692. [Google Scholar] [CrossRef]
  16. Fritsen, C.H.; Priscu, J.C. Seasonal change in the optical properties of the permanent ice cover on Lake Bonney, Antarctica: Consequences for lake productivity and phytoplankton dynamics. Limnol. Oceanogr. 1999, 44, 447–454. [Google Scholar] [CrossRef]
  17. Bolsenga, S.J. Short note: Preliminary observations on the daily variation of the albedo. J. Glaciol. 1977, 18, 517–521. [Google Scholar] [CrossRef]
  18. Pirazzini, R.; Vihma, T.; Granskog, M.A.; Cheng, B. Surface albedo measurements over sea ice in the Baltic Sea during the spring snowmelt period. Ann. Glaciol. 2006, 44, 7–14. [Google Scholar] [CrossRef]
  19. Lei, R.; Leppäranta, M.; Erm, A.; Jaatinen, E.; Pärn, O. Field investigations of apparent optical properties of ice cover in Finnish and Estonian lakes in winter 2009. Est. J. Earth Sci. 2011, 60, 50–64. [Google Scholar] [CrossRef] [Green Version]
  20. Mullen, P.C.; Warren, S.G. Theory of the optical properties of lake ice. J. Geophys. Res. Atmos. 1988, 93, 8403–8414. [Google Scholar] [CrossRef]
  21. Gardner, A.S.; Sharp, M.J. A review of snow and ice albedo and the development of a new physically based broadband albedo parameterization. J. Geophys. Res. Earth Surf. 2010, 115. [Google Scholar] [CrossRef] [Green Version]
  22. Lang, J.; Lyu, S.; Li, Z.; Ma, Y.; Su, D. An Investigation of Ice Surface Albedo and Its Influence on the High-Altitude Lakes of the Tibetan Plateau. Remote Sens. 2018, 10, 218. [Google Scholar] [CrossRef]
  23. Zdorovennov, R.; Palshin, N.; Zdorovennova, G.; Efremova, T.; Terzhevik, A. Interannual variability of ice and snow cover of a small shallow lake. Est. J. Earth Sci. 2013, 62, 26–32. [Google Scholar] [CrossRef]
  24. Zdorovennova, G.E.; Gavrilenko, G.G.; Zdorovennov, R.E.; Mammarella, I.; Ojala, A.; Heiskanen, J.; Terzhevik, A.Y. Evolution of the temperature of the water column of boreal lakes against the background of changes in the regional climate. News Russ. Geogr. Soc. 2017, 149, 59–74. (In Russian) [Google Scholar]
  25. Zdorovennova, G.; Zdorovennov, R.; Palshin, N.; Terzhevik, A. Optical properties of the ice cover on Vendyurskoe lake, Russian Karelia (1995–2012). Ann. Glaciol. 2013, 54, 121–124. [Google Scholar] [CrossRef]
  26. Nazarova, L.E.; Filatov, N.N. Changes and variability of the climate and hydrological regime of the territory of Karelia. In Climate of Karelia: Variability and Influence on Water Objects and Catchment Area; Filatov, N.N., Ed.; Karelian Research Center of RAS: Petrozavodsk, 2004; pp. 12–87. ISBN 5-9274-0146-5. (In Russian) [Google Scholar]
  27. All-Russian Scientific Research Institute of Hydrometeorological Information—World Data Center (VNIIGMI-WDC). Available online: http://meteo.ru/data/162-temperature-precipitation (accessed on 6 June 2018). (In Russian).
  28. Russia’s Weather. Available online: http://meteo.infospace.ru/main.htm (accessed on 6 June 2018).
  29. Reliable Prognosis. Available online: https://rp5.ru/Weather_in_the_world (accessed on 6 June 2018).
  30. The Climate Data Guide: Hurrel North Atlantic Oscillation (NAO) Index (Station-Based). Available online: https://climatedataguide.ucar.edu/climate-data/hurrell-north-atlantic-oscillation-nao-index-station-based (accessed on 6 June 2018).
  31. Efremova, T.; Palshin, N.; Zdorovennov, R. Long-term characteristics of ice phenology in Karelian lakes. Est. J. Earth Sci. 2013, 62, 33–41. [Google Scholar] [CrossRef] [Green Version]
  32. Kuusisto, E. Snow Accumulation and Snowmelt in Finland; National Board of Waters: Helsinki, Finland, 1984; Volume 55, p. 149. ISBN 951-46-7494-4. [Google Scholar]
  33. Jonas, T.; Terzhevik, A.Y.; Mironov, D.V.; Wüest, A. Radiatively driven convection in an ice-covered lake investigated by using temperature microstructure technique. J. Geophys. Res. 2003, 108. [Google Scholar] [CrossRef] [Green Version]
  34. Lepparanta, M.; Terzhevik, A.; Shirasawa, K. Solar radiation and ice melting in Lake Vendyurskoe, Russian Karelia. Hydrol. Res. 2010, 41, 50–62. [Google Scholar] [CrossRef]
Figure 1. (a) Geographic location of Lake Vendyurskoe, red triangle. (b) Lake Vendyurskoe bathymetry and location of measurement stations and transects. The yellow triangle indicates the station of solar radiation measurements.
Geosciences 08 00206 g001
Figure 2. (a) North Atlantic Oscillation (NAO)-index and anomalies of average air temperature (b) and precipitation (c) for December-March for period 1950–2017 relative to the climate norm (period 1961–1990) for meteorological station Petrozavodsk. Solid lines are linear trends.
Geosciences 08 00206 g002
Figure 3. The spatial average over all stations of thickness of snow (white rectangle), total ice (vertical lines), slush (sky blue), white ice (grey) and congelation ice (dark blue) at the beginning of the radiation measurement period in April in different years.
Geosciences 08 00206 g003
Figure 4. Temporal variability of air temperature (circles, dashed line, MS Petrozavodsk data, temporal resolution 3 h), downwelling (grey line) and upwelling (dotted black line) planar irradiance on the surface of Lake Vendyurskoe, and lake surface albedo (solid black line, temporal resolution 2 min) during April 15–24, 2002 (a) and April 19–26, 2003 (b). Asterisks denote snow thickness, cm.
Geosciences 08 00206 g004
Figure 5. Temporal variability of downwelling (grey lines) and upwelling (blue lines) irradiance, albedo (black bold lines), solar zenith angle (circles) and air temperature near Lake Vendyurskoe (red lines) during April 22, 2006 (a), April 24, 2006 (b), and April 27, 2006 (c).
Geosciences 08 00206 g005
Figure 6. Temporal variability of solar zenith angle on April 20, 1999 (blue line), downwelling irradiance (dotted lines) and albedo of congelation ice (bold lines) during clear April 20, 1999 (red) and cloudy April 22, 1999 (green).
Geosciences 08 00206 g006
Figure 7. (a)—surface daily averaged albedo of Lake Vendyurskoe from end of March to early May, (b)—dependence of albedo on the accumulated sum of positive temperatures from March 1, and (c) —dependence of albedo on the thickness of the snow-ice cover for all years of measurements (1995–2000 and 2002–2017). Snow (triangles), white ice (circles), congelation ice (squares), snow spots on white ice (diamonds).
Geosciences 08 00206 g007aGeosciences 08 00206 g007b
Table 1. The dates and the temporal resolution of measurements of irradiance (downwelling Ed and upwelling Eup, maximal and average values) and albedo (maximal, minimal and average values) at the radiation station over the whole measurement period in different years. * Dates of spatial measurements of albedo and its maximal, minimal and average across all stations of both sections.
DatesTemporal Resolution, minIrradiance Max (Avg), W/m2Albedo Max-Min
EdEup(Avg)
13–23.04.19955760 (160)530 (56)0.78–0.18 (0.35)
27–29.11.1995595 (6)63 (5)0.94–0.62 (0.82)
27.12.1995270 (12)65 (11)0.99–0.77 (0.89)
25–27.03.19962575 (135)402 (104)0.93–0.68 (0.78)
18–25.04.19965733 (154)433 (66)0.74–0.20 (0.42)
14–27.04.19972920 (167)587 (95)0.86–0.37 (0.57)
28.04–04.05.19982755 (295)357 (124)0.52–0.26 (0.41)
14–24.04.19992785 (280)510 (85)0.76–0.09 (0.29)
13–24.04.20002722 (258)340 (93)0.58–0.10 (0.35)
28–30.01.20022198 (19)129 (13)0.98–0.60 (0.71)
21–23.03.20022465 (52)382 (42)0.98–0.72 (0.80)
23.03.2002 * 0.82–0.52 (0.69) *
24.03.2002 *0.89–0.48 (0.69) *
15–24.04.20022806 (161)668 (85)0.97–0.29 (0.56)
22.04.2002 *0.42–0.28 (0.34) *
23.04.2002 *0.54–0.37 (0.42) *
19–26.04.20032858 (202)660 (110)0.84–0.29 (0.52)
18–28.04.20042825 (356)361 (139)0.54–0.17 (0.39)
16–25.04.20052897 (198)636 (114)0.82–0.32(0.58)
16–27.04.20061885 (175)340 (51)0.60–0.13 (0.31)
24.04.2006 *0.59–0.32 (0.40) *
27.04.2006 *0.34–0.13 (0.26) *
13–19.04.20071895 (147)530 (56)0.71–0.08 (0.36)
16.04.2007 *0.54–0.19 (0.32) *
19.04.2007 *0.43–0.17 (0.32) *
12–20.04.20081922 (136)645 (89)0.82–0.46 (0.65)
21–28.04.20091921 (193)473 (74)0.69–0.23 (0.39)
17–19.04.20101738 (125)140 (27)0.25–0.13 (0.21)
17–21.04.20111954 (163)447 (73)0.58–0.23 (0.45)
11–24.04.20121978 (129)552 (72)0.89–0.22 (0.56)
20–24.04.20131893 (168)223 (40)0.34–0.07 (0.71)
26–31.03.20141981 (217)572 (119)0.89–0.27 (0.58)
10–16.04.20151804 (200)327 (71)0.56–0.21 (0.33)
8–13.04.20161894 (132)264 (36)0.43–0.18 (0.26)
30.03–10.04.20171836 (115)665 (79)0.92–0.28 (0.68)
Table 2. The spatial average (Avg) and standard deviation (Std) of thickness of snow (Sn) and total ice (TI) over stations of cross-section in early and mid-winter in different years.
DatesSnow and Ice Thickness
Avg (Std), cm
SnTI
29.11.199512 (5)16 (2)
25.12.199513 (3)41 (3)
21.03.199626 (4)67 (4)
18.02.199824 (4)57 (4)
05.12.19981 (0)22 (1)
08.12.199814 (2)23 (1)
20.02.199922 (3)60 (2)
01.03.199924 (3)61 (3)
26.01.200224 (6)45 (4)
22.03.200217 (6)61 (3)

