Modelling Individual Evacuation Decisions during Natural Disasters: A Case Study of Volcanic Crisis in Merapi, Indonesia

 ,
,  , , ,
, , ,
Abstract
:1. Introduction
2. Background
3. Materials and Methods
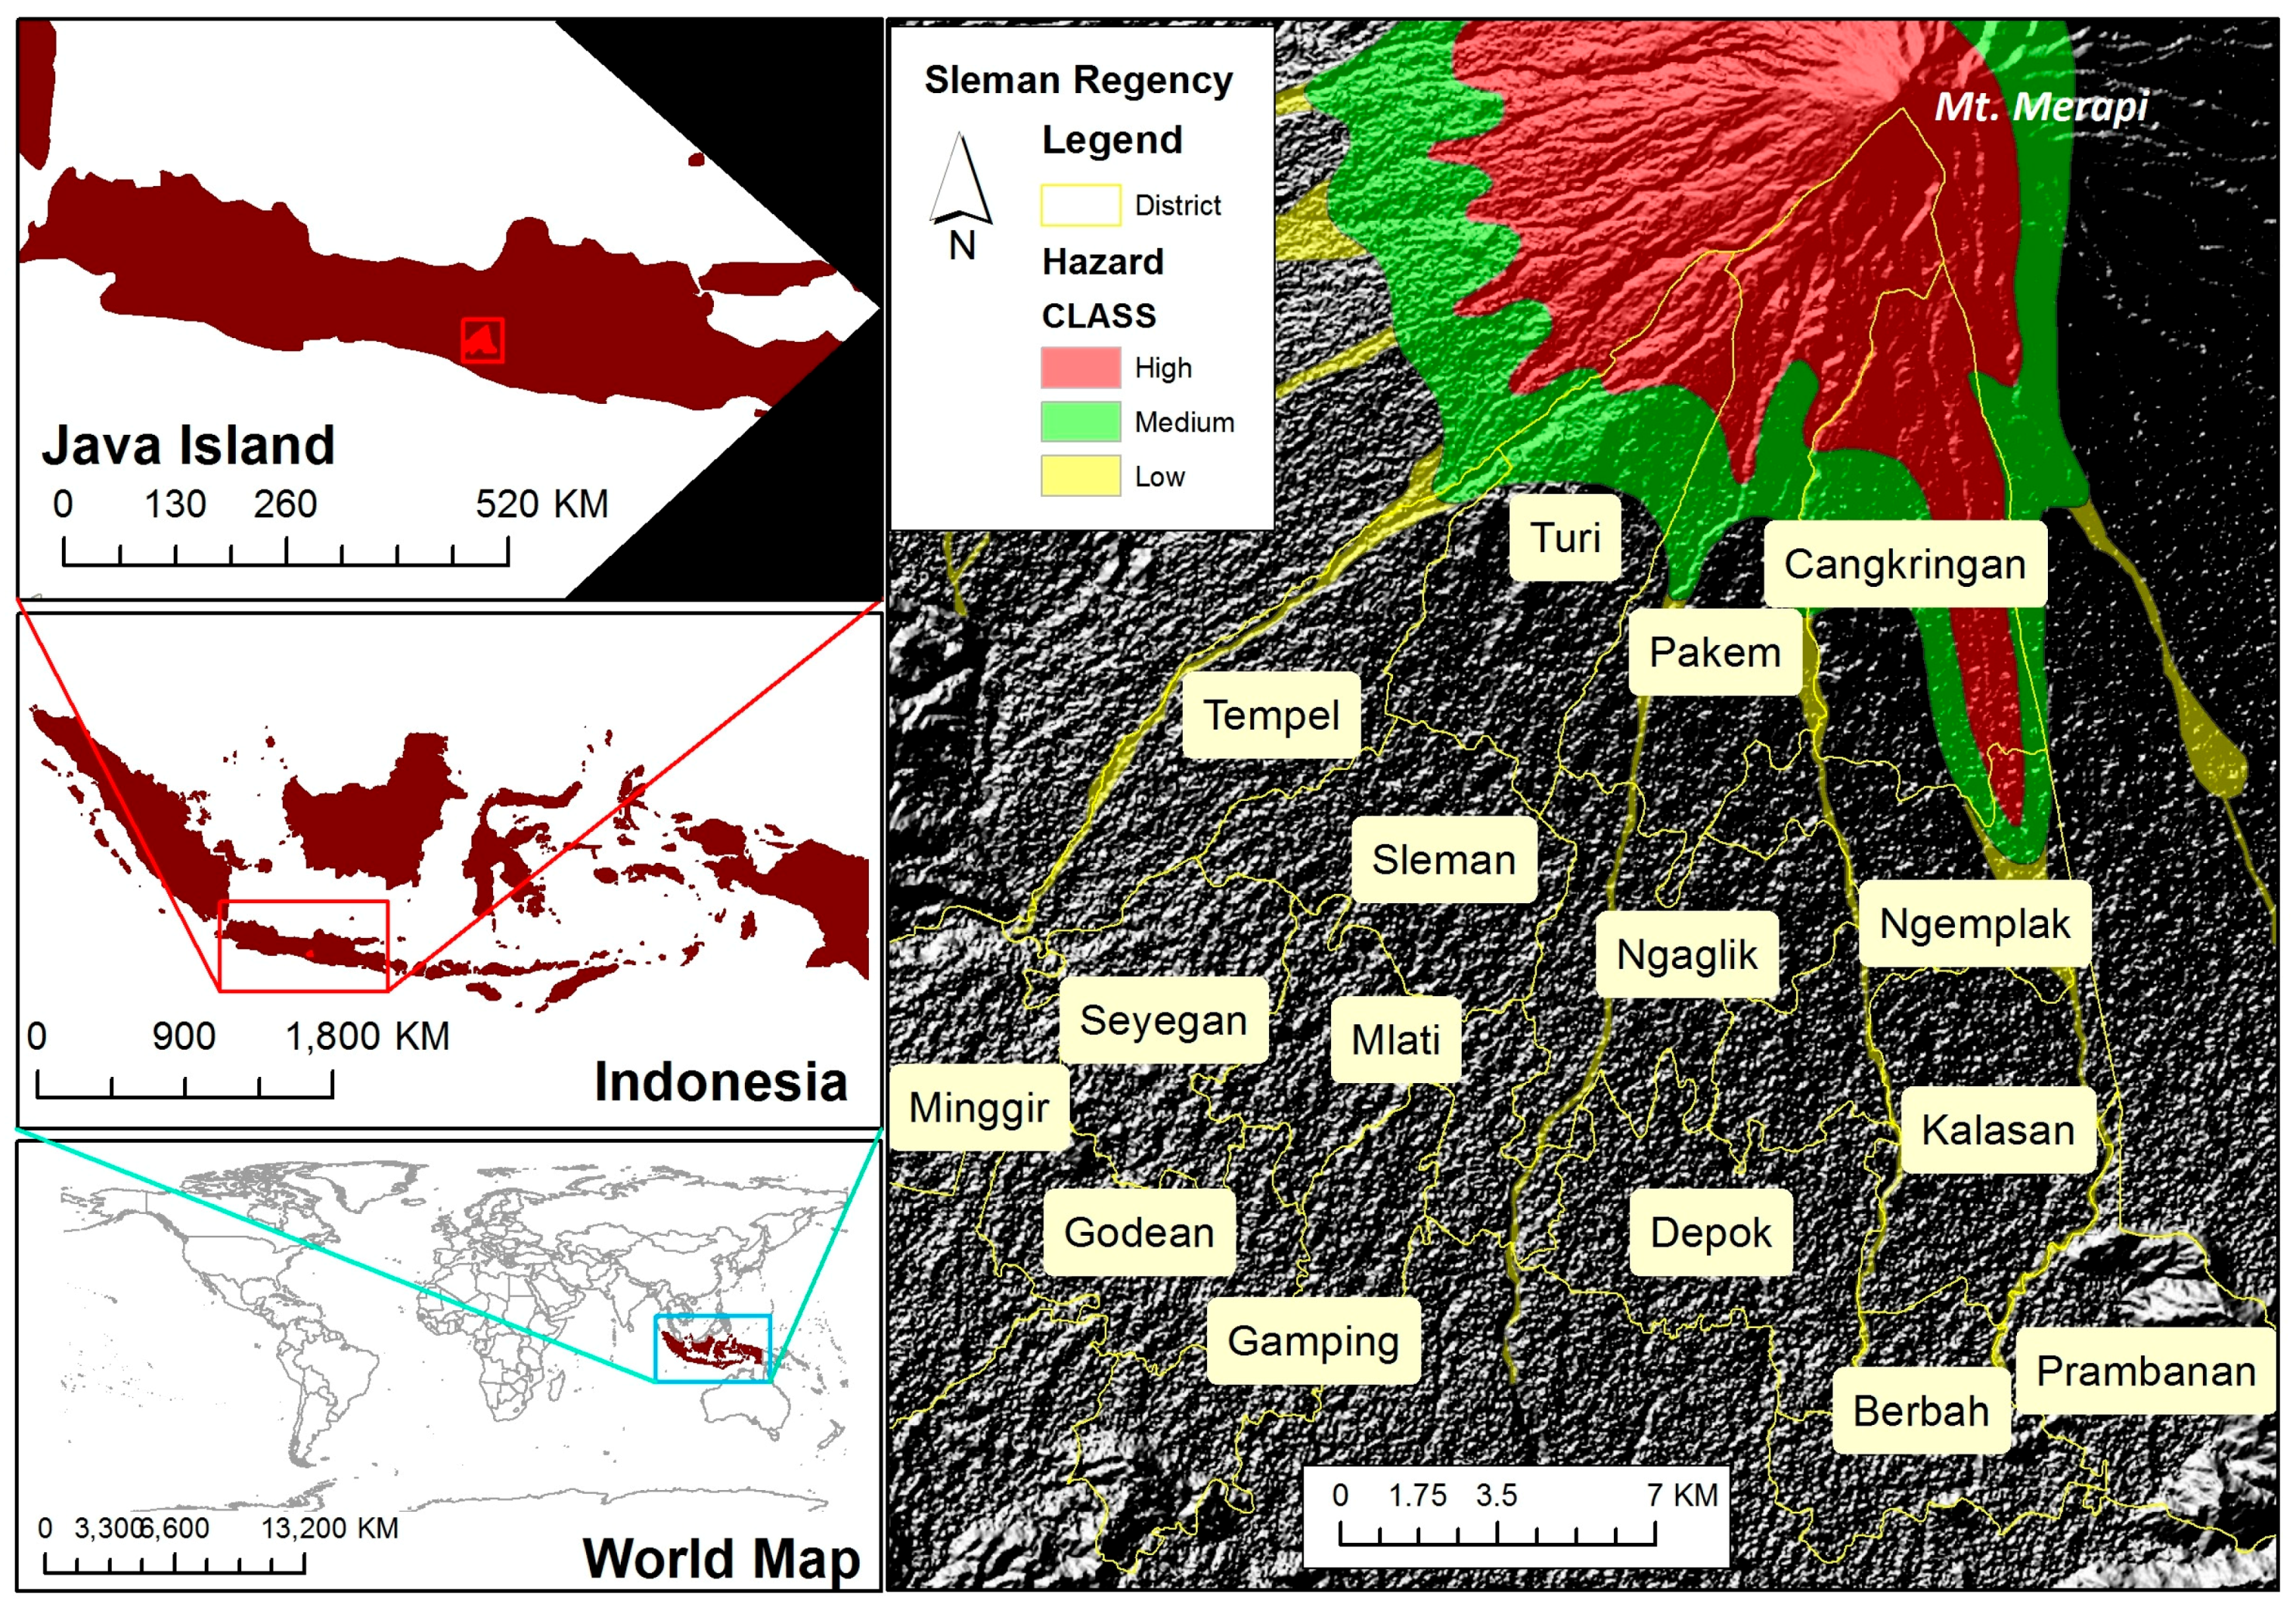
3.1. Study Area
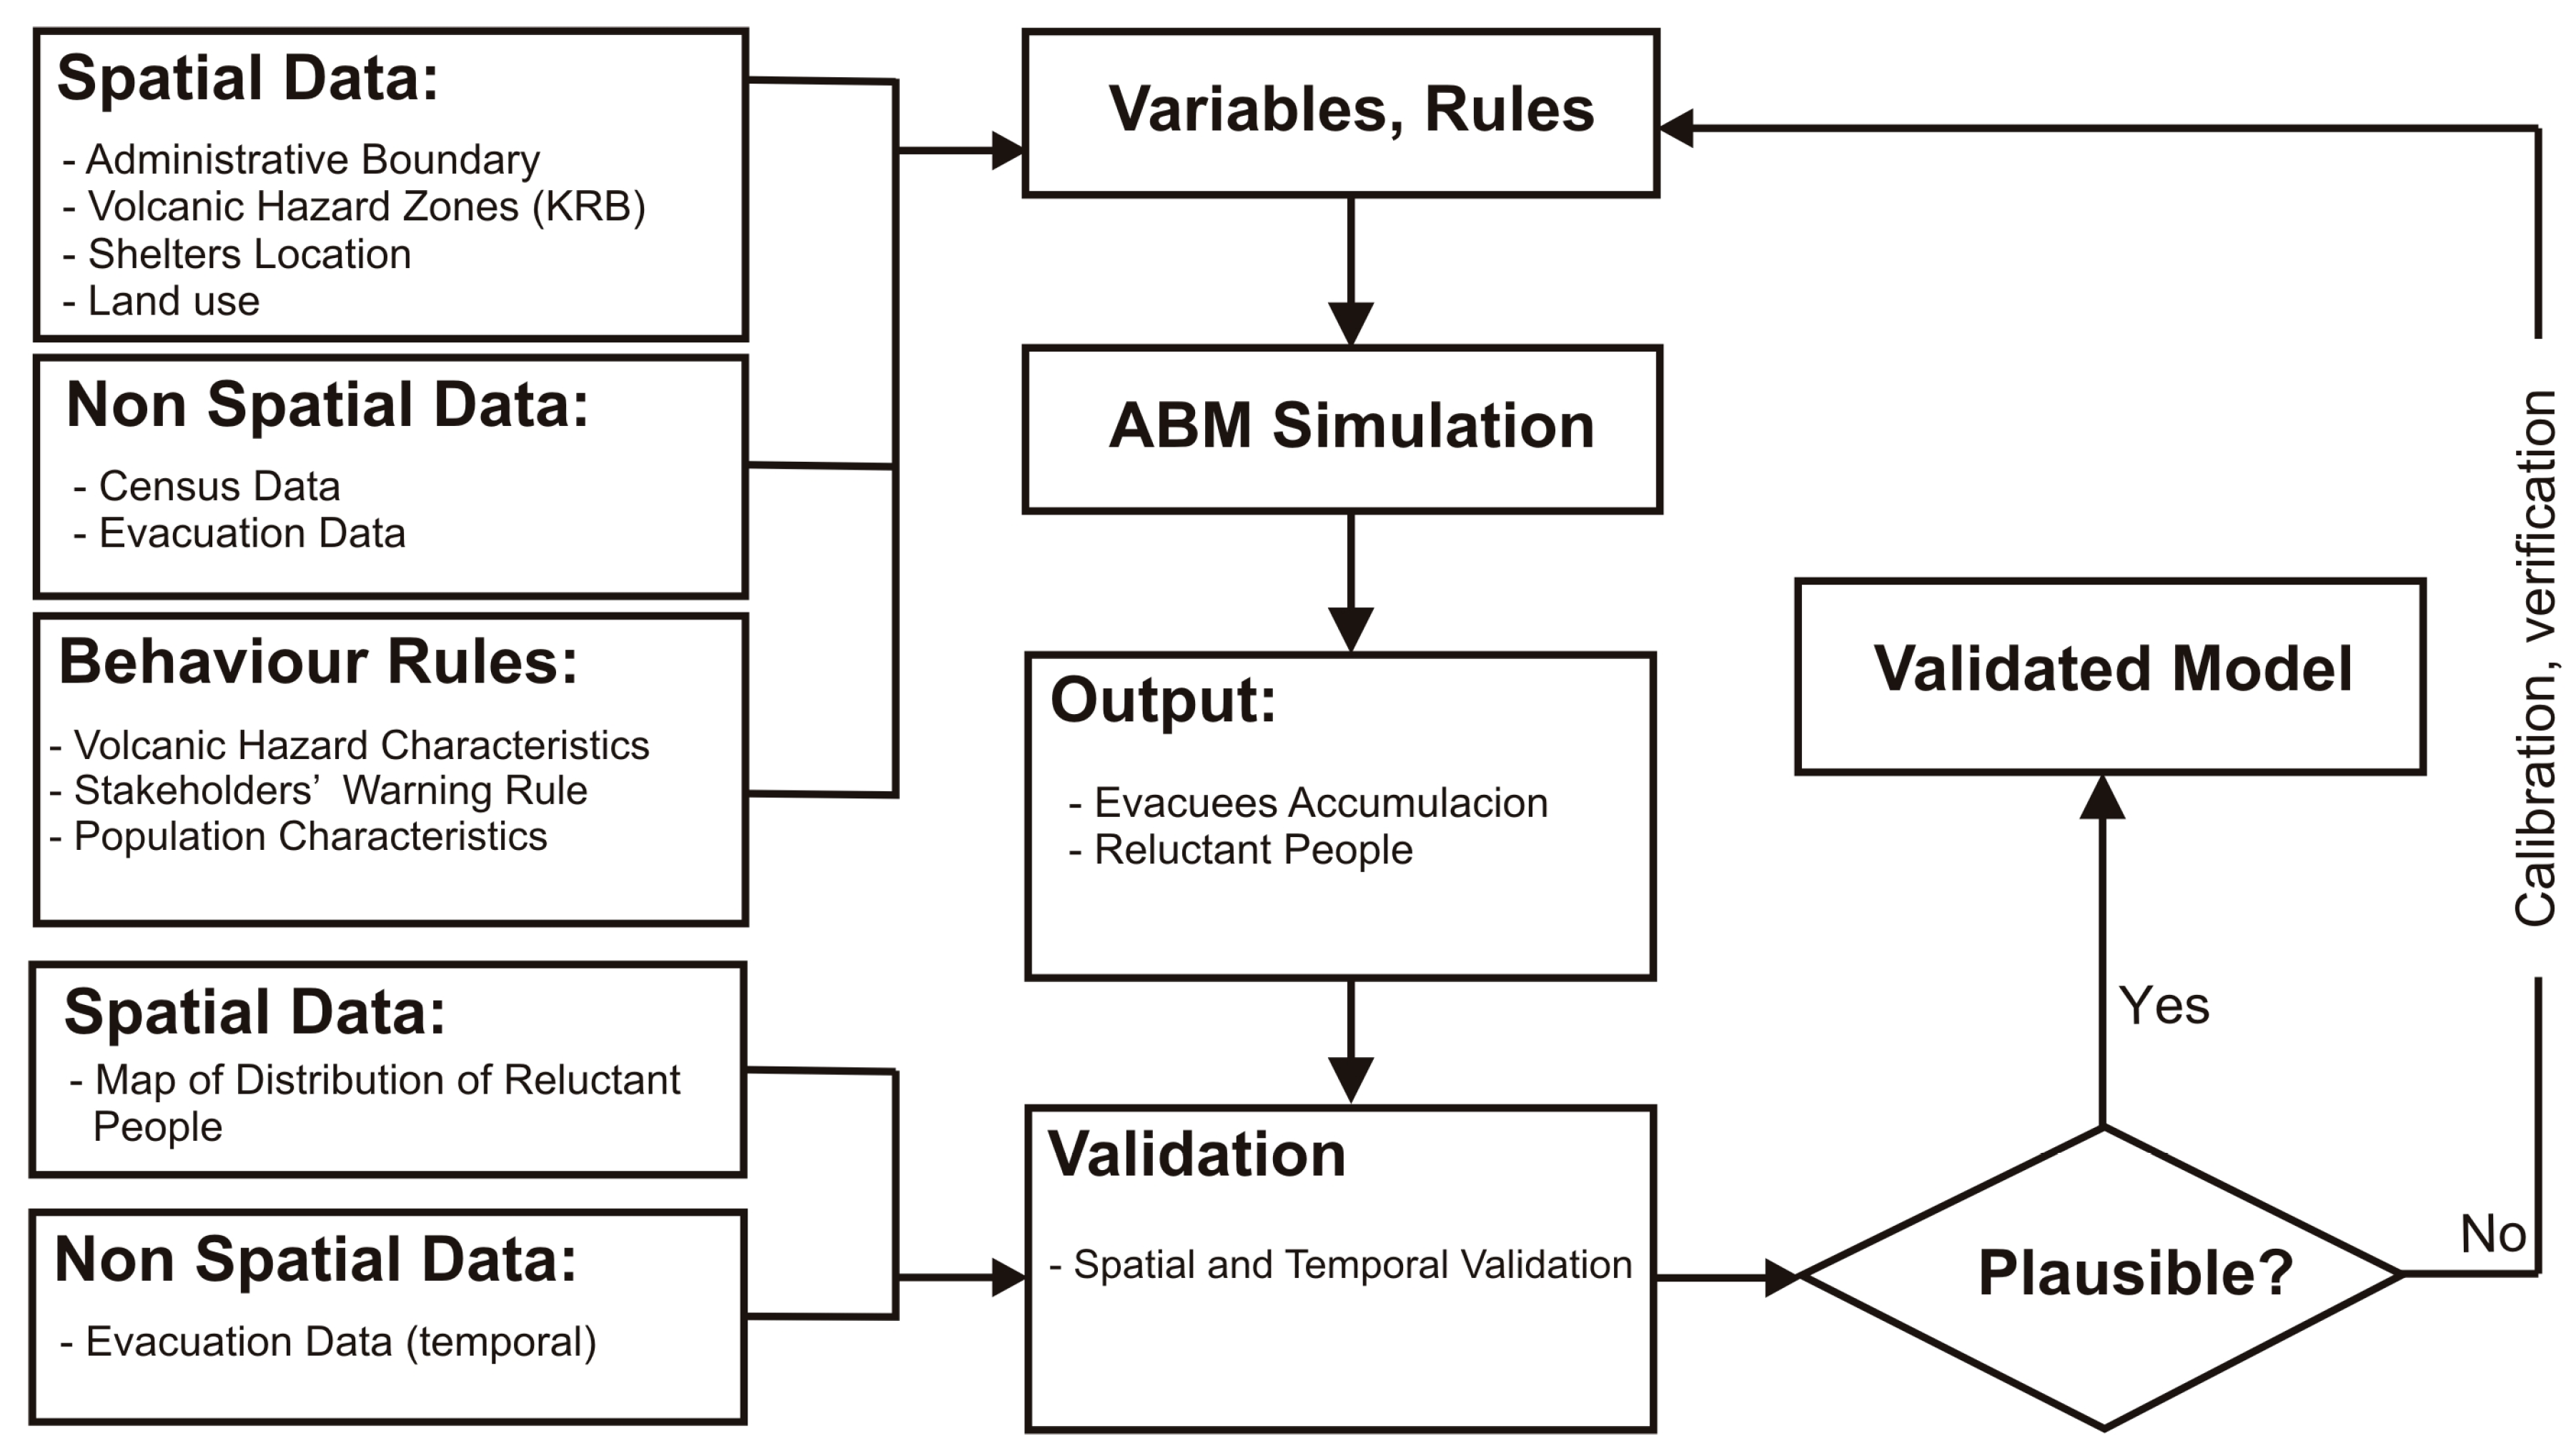
3.2. General Framework
3.3. Input Data
3.4. Model Design
3.4.1. Overview
Purpose
Entities, State Variables, Scales, and Environment
- Volcano: this agent represents Mt. Merapi, which has the rule to produce activity and trigger a change in the environment.
- People: this agent type represents people, generated based on the census data as synthetic population agents (see Section 3.5 for details of the synthetic population generation).
- Stakeholder: this is an agent who acts as stakeholder, with the role to alert people to evacuate.
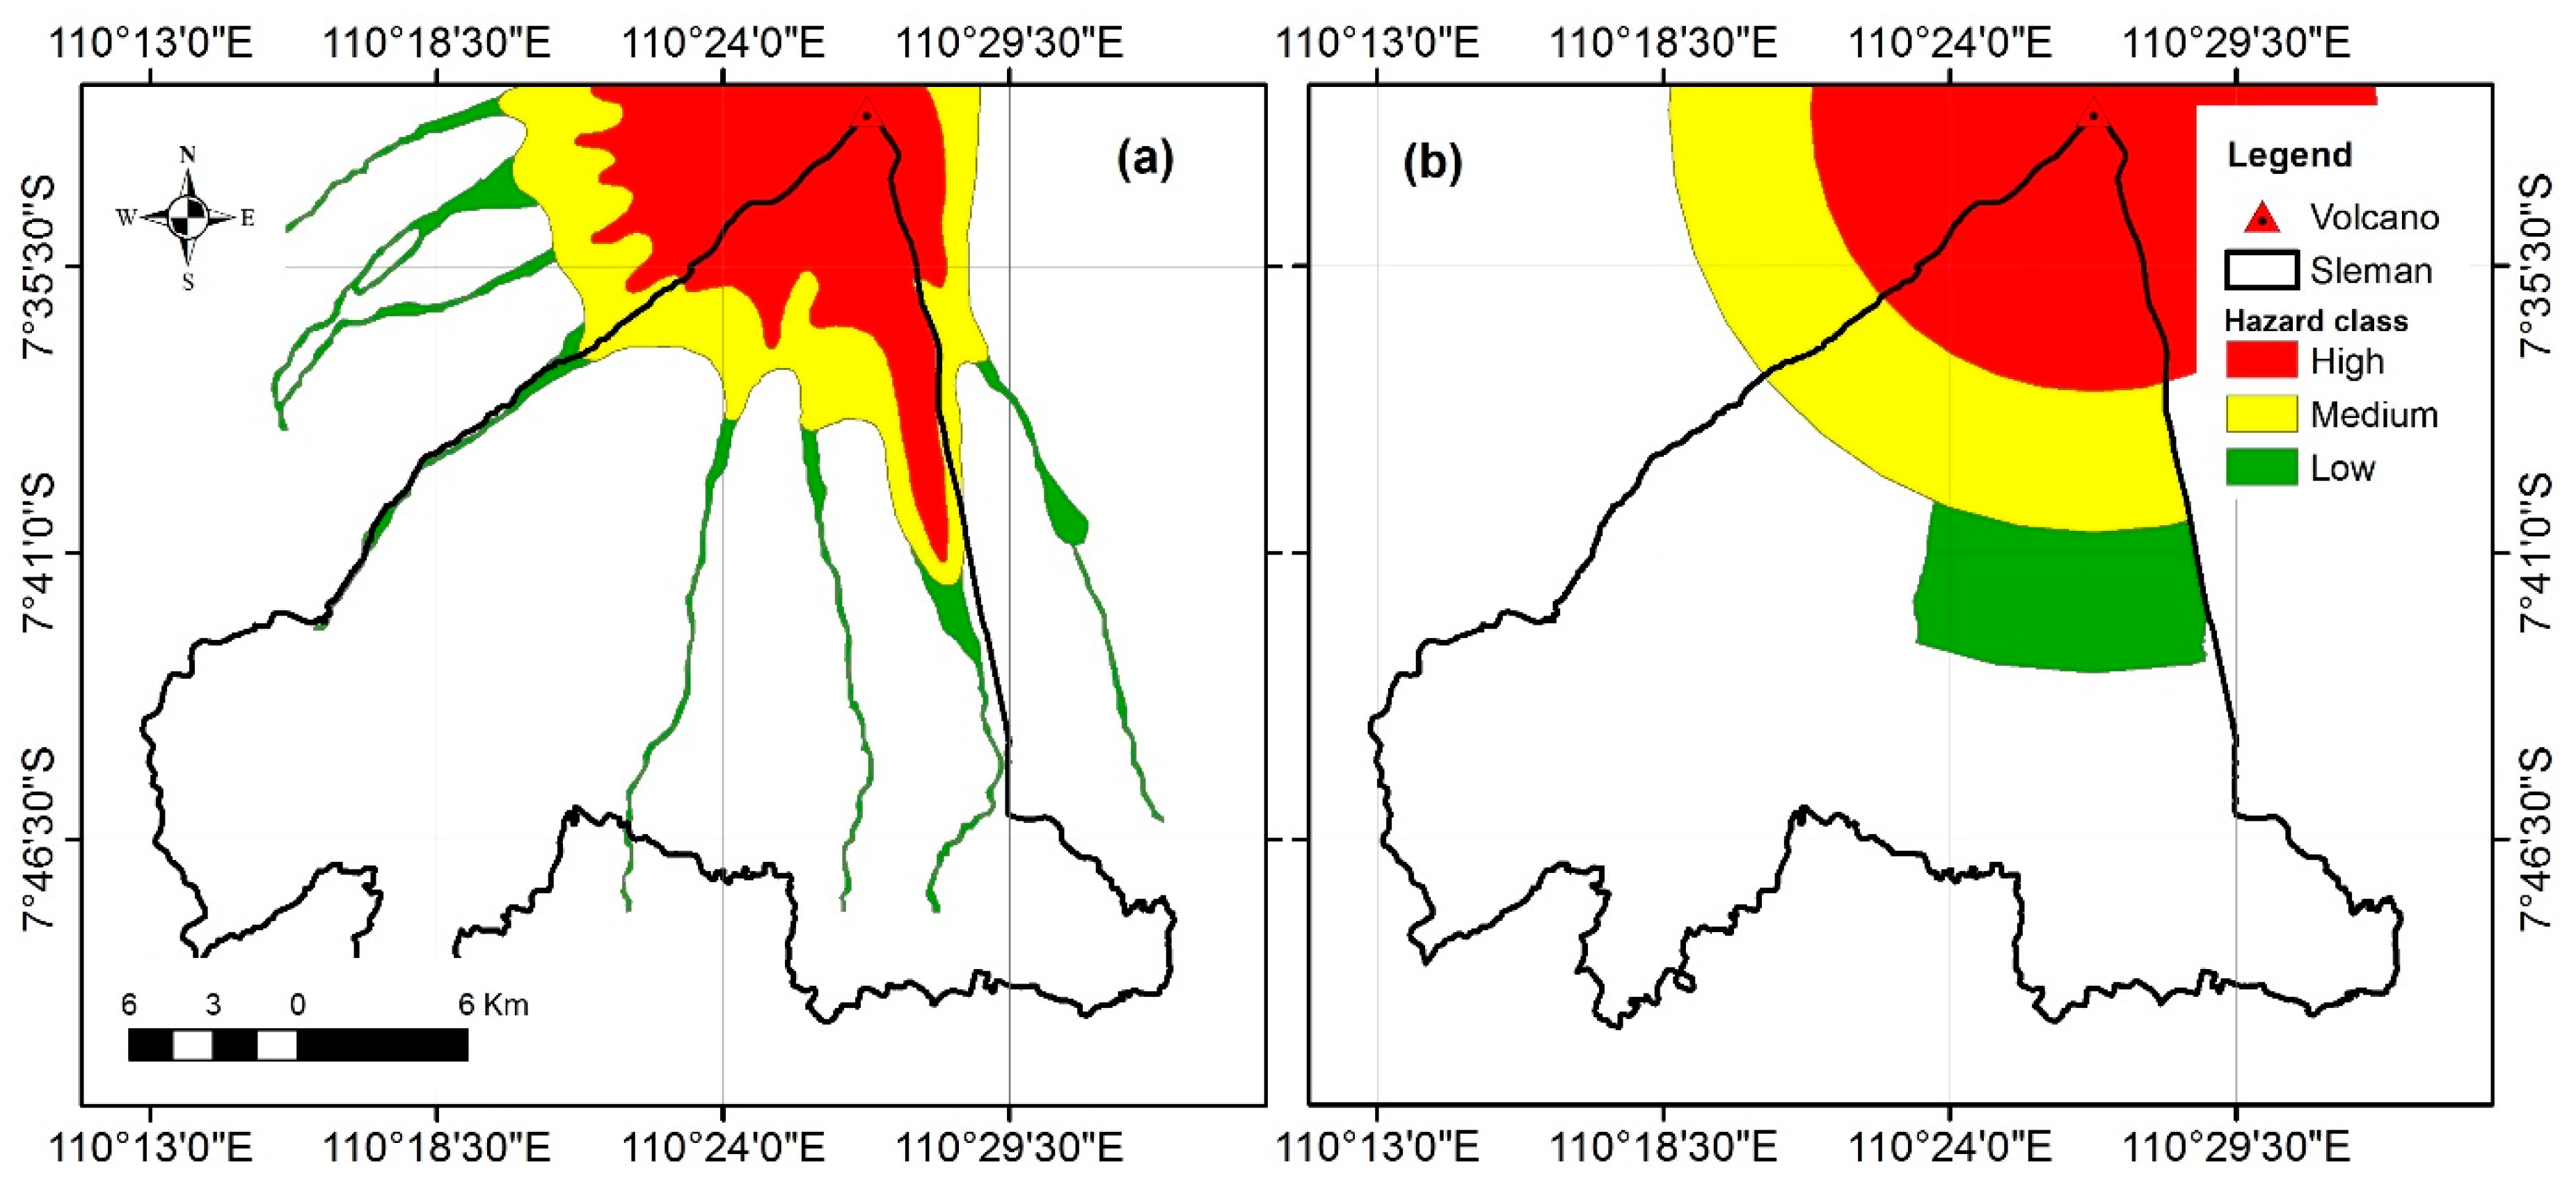
- Environment: this is represented as a spatial environment where the agents live. It consists of: (1) the population unit, which is a fixed environment provided as a GIS region; (2) the administrative boundary of the district where the agent’s population will be distributed within the region; (3) hazard zones to model the hazardous environment that dynamically changes following the volcanic activity; (4) the route networks that are used by agents to move; and (5) evacuation shelters, which are distributed outside the hazard zones as GIS points.
Process Overview and Scheduling
3.4.2. Design Concepts
- Emergence: by simulating the evacuation decision in a spatiotemporal dynamic model, the potential problems for evacuation may emerge, especially the emergence of reluctant people.
- Sensing: the stakeholder can sense the change in volcanic activity level by reading the signal (message) from the volcano. Human agents can sense their location, and whether they are located in a danger zone or not.
- Interaction: the stakeholder interacts with the human agents regarding the alert issuance. Human agents interact with each other to convey their decision to evacuate.
- Stochasticity: the socio-demographics and location of the human agents are generated randomly. The socio-demographics are generated using custom distribution based on census microdata, whereas the location of agents is generated based on the settlement distribution generated from land use data [111].
- Observation: the output can be monitored directly during the simulation from the map, as well as the monitoring charts. Some indicators are observed during the simulation, including the percentage of people at risk (low, medium, high), the percentage of evacuating people, occupancy of the evacuation shelters, and the level of volcanic activity. This output is also recorded as a CSV file that can be spatiotemporally analysed using GIS, or Excel for other purposes.
3.4.3. Details
Initialisation and Input
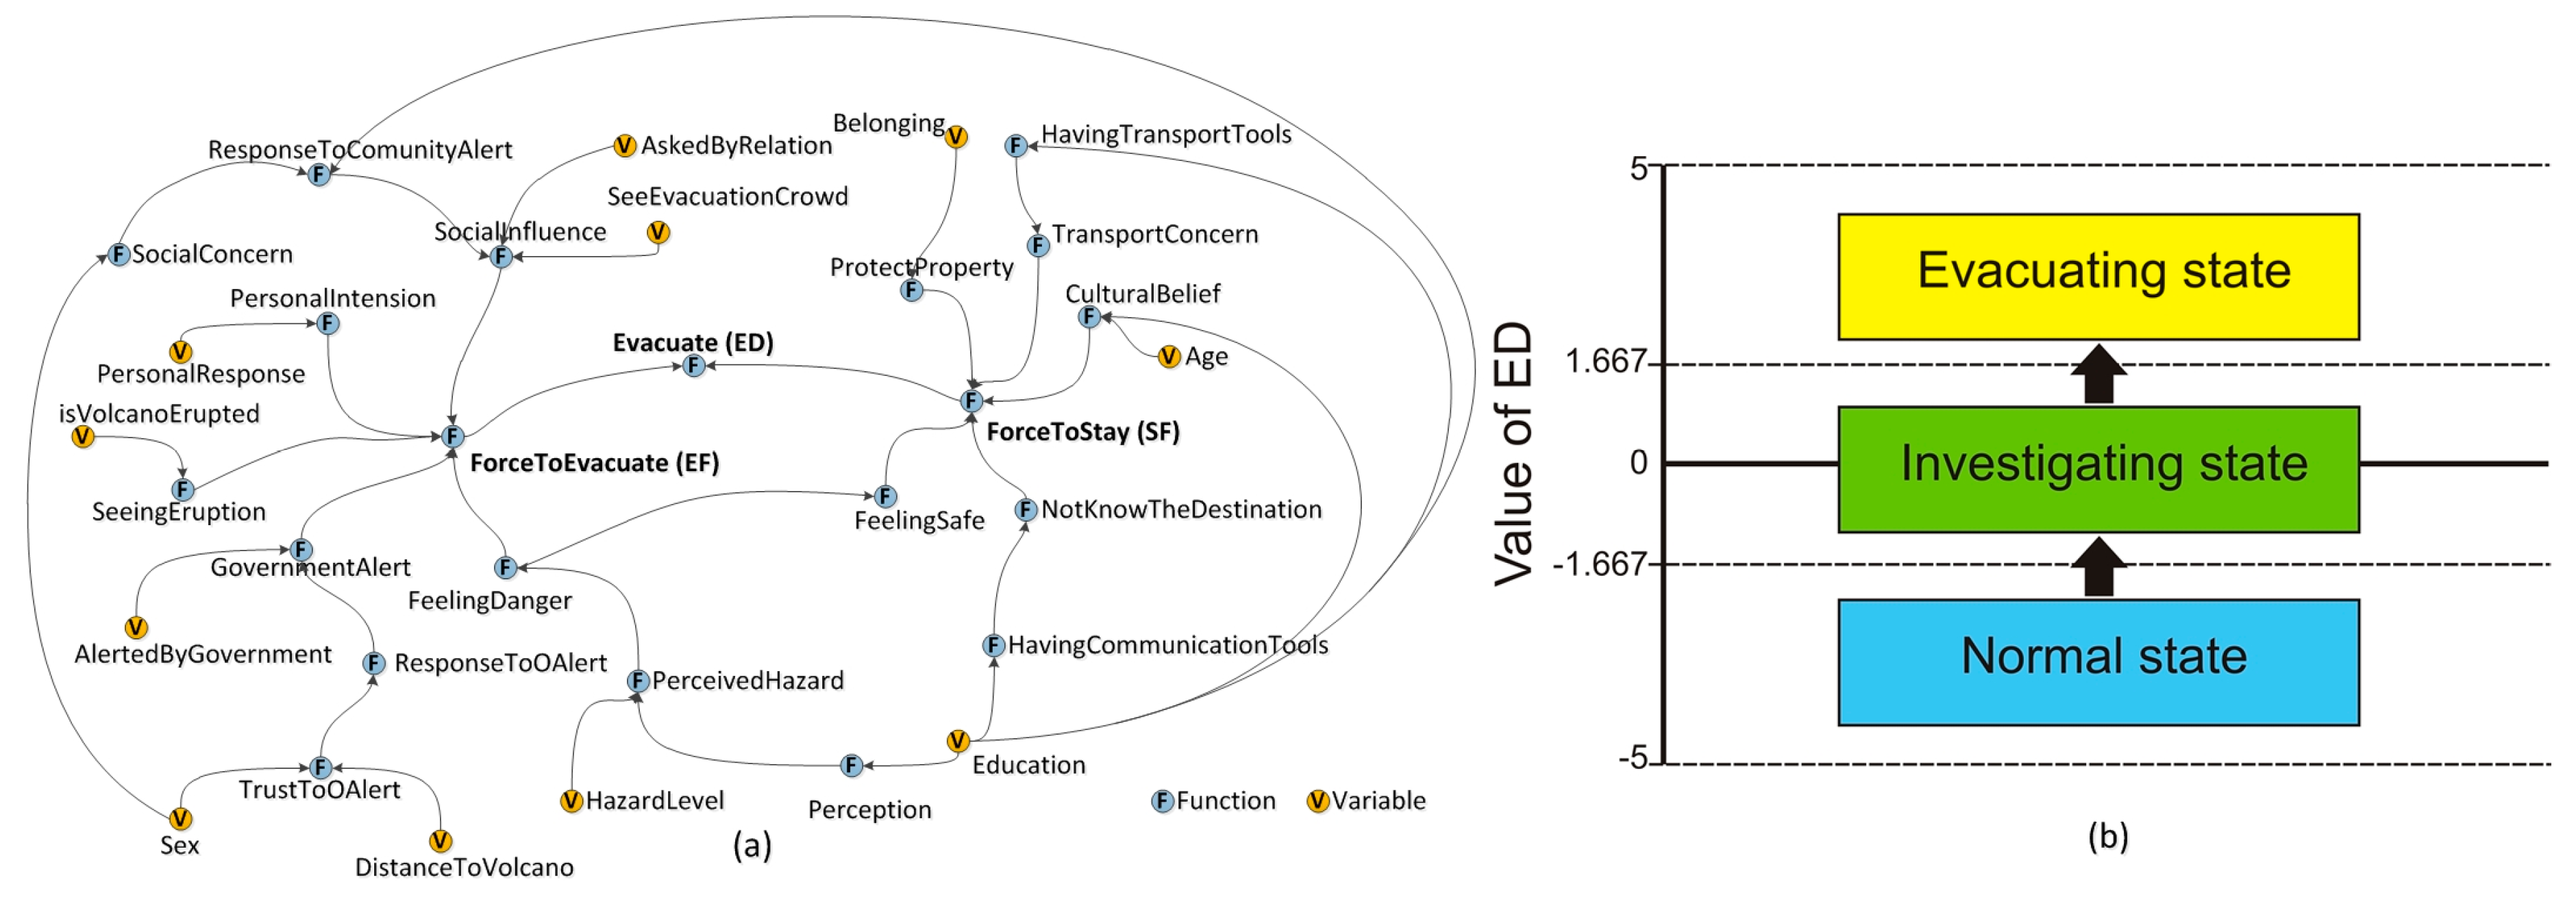
Sub-Models
- Normal: initial state of agent when there is no sign of hazard.
- Investigating: the agent observes the volcano and their environment (social, physical) as the activity of the volcano increases.
- Evacuating: the agent decides to evacuate. In this state, the agent warns their family as well as their relations to evacuate.
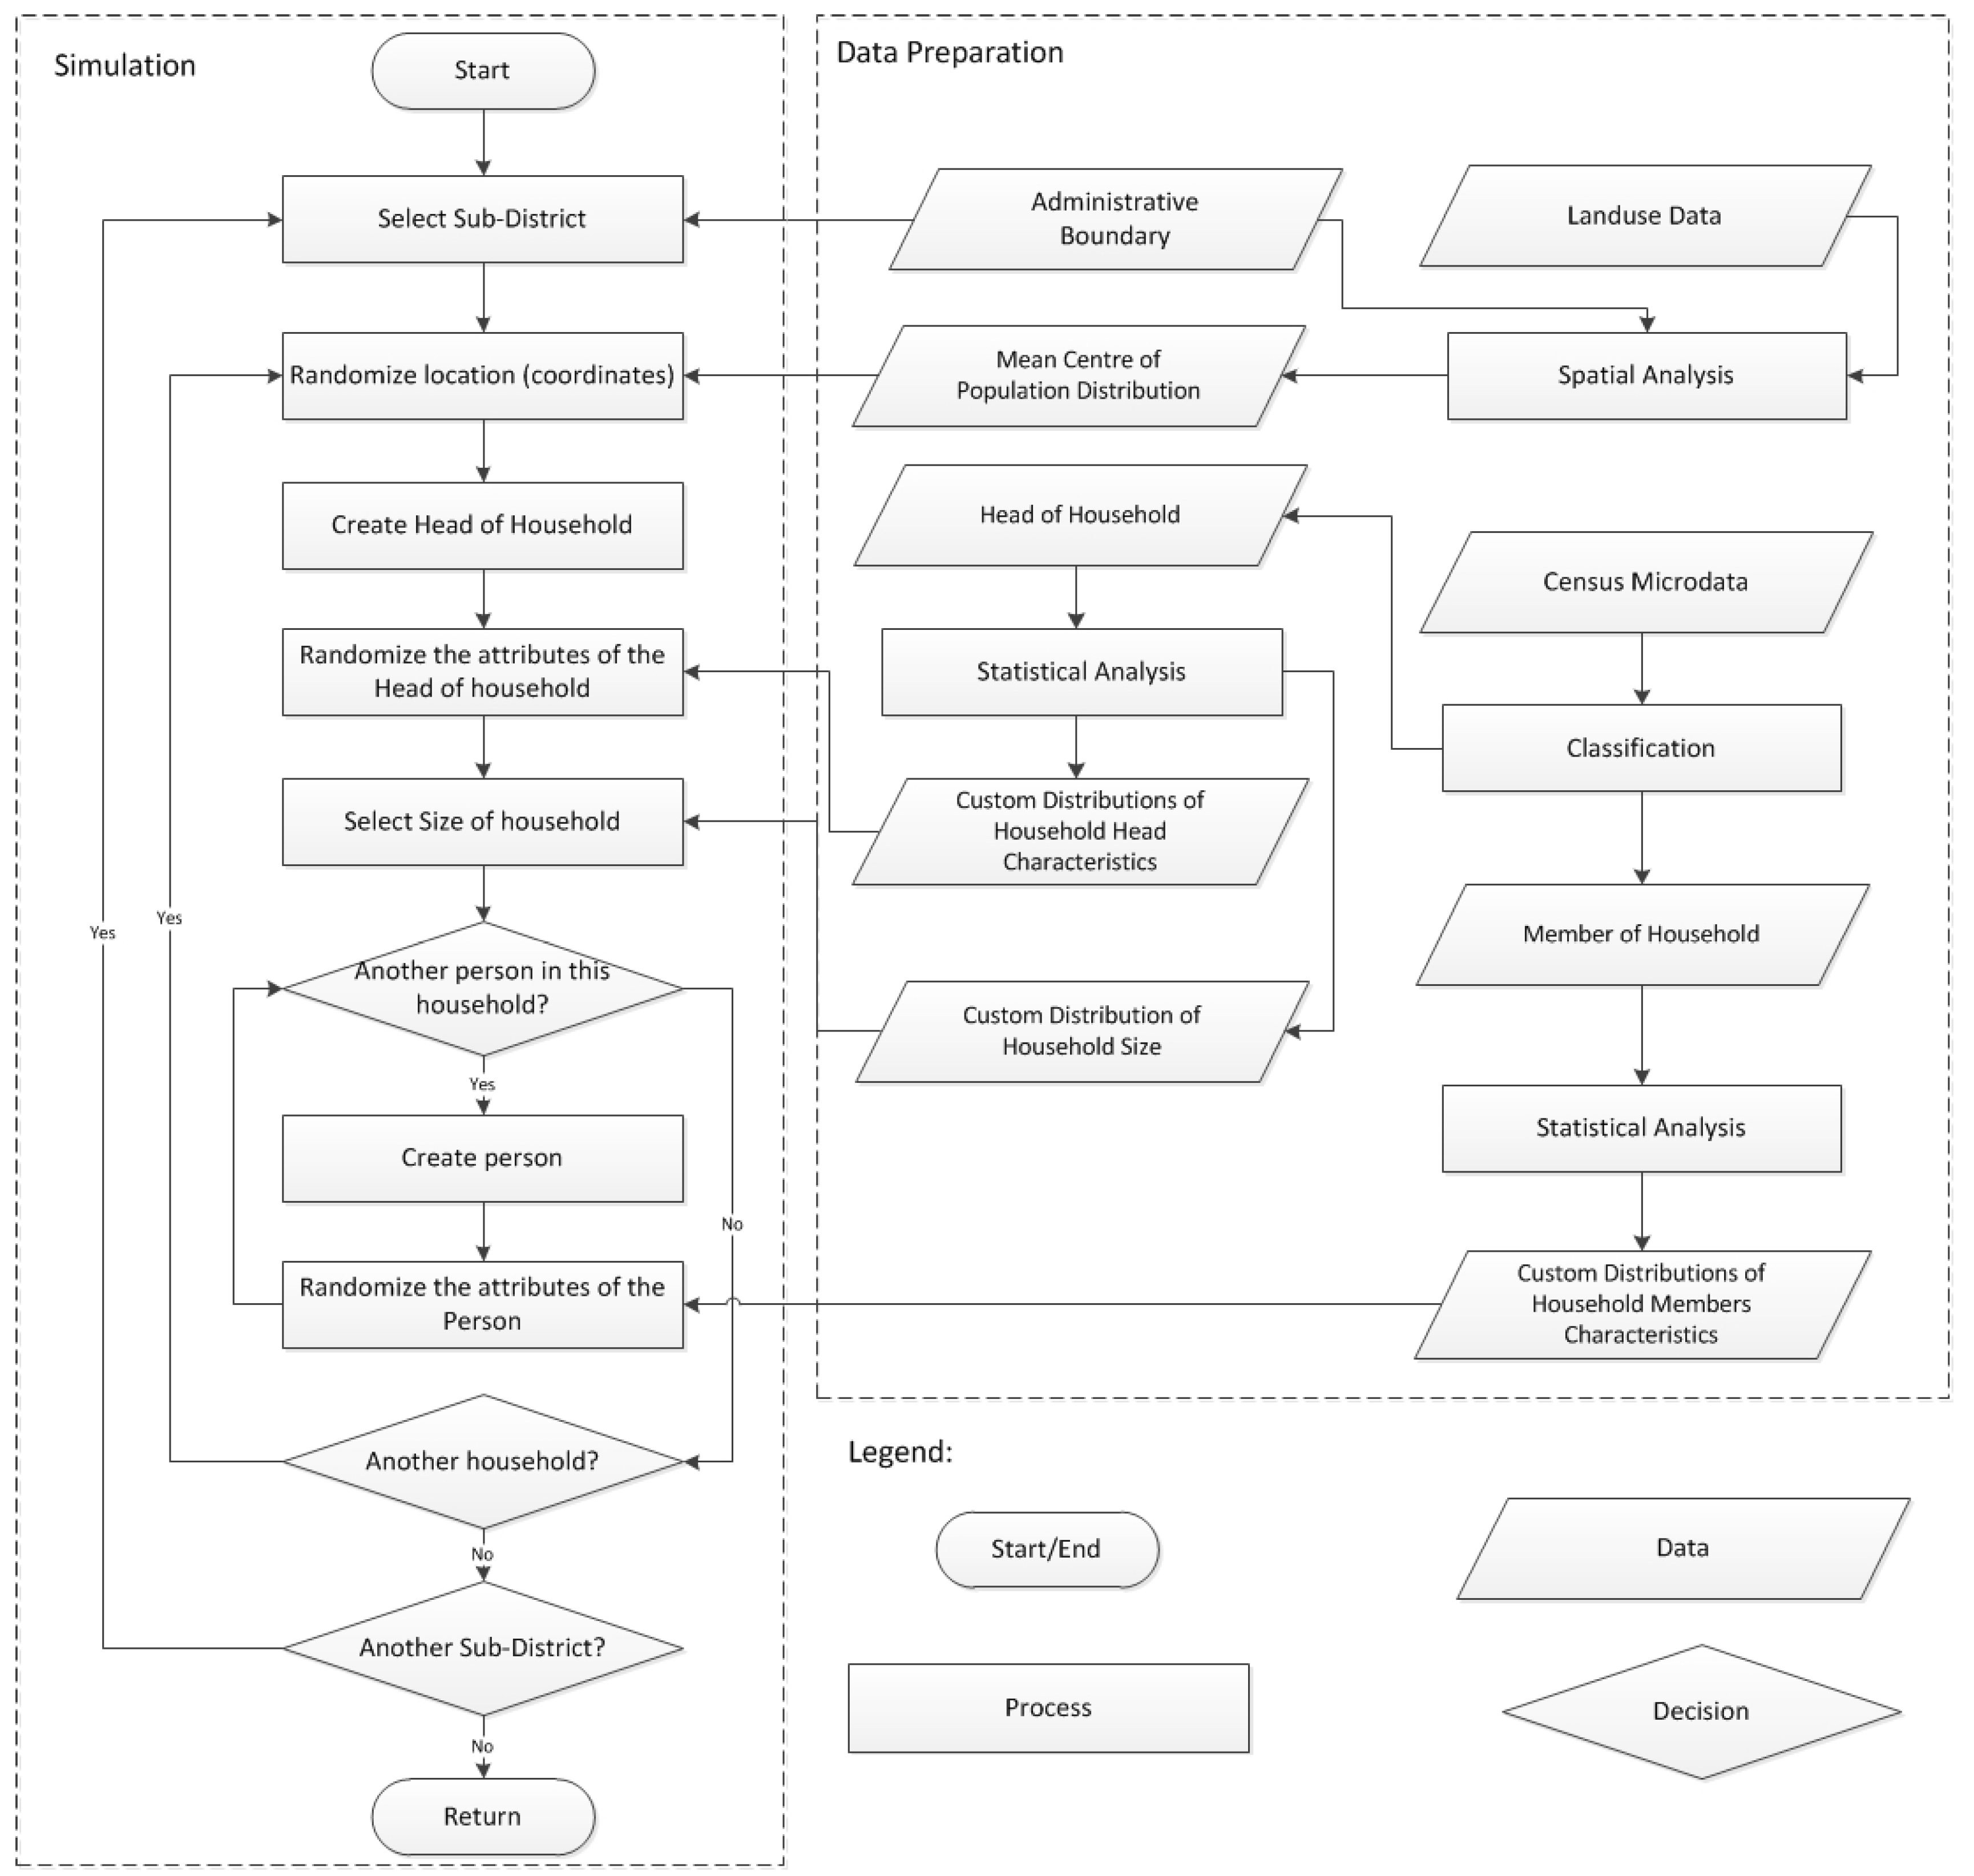
3.5. Population and Synthetic Population Generation
3.6. Calibration and Validation
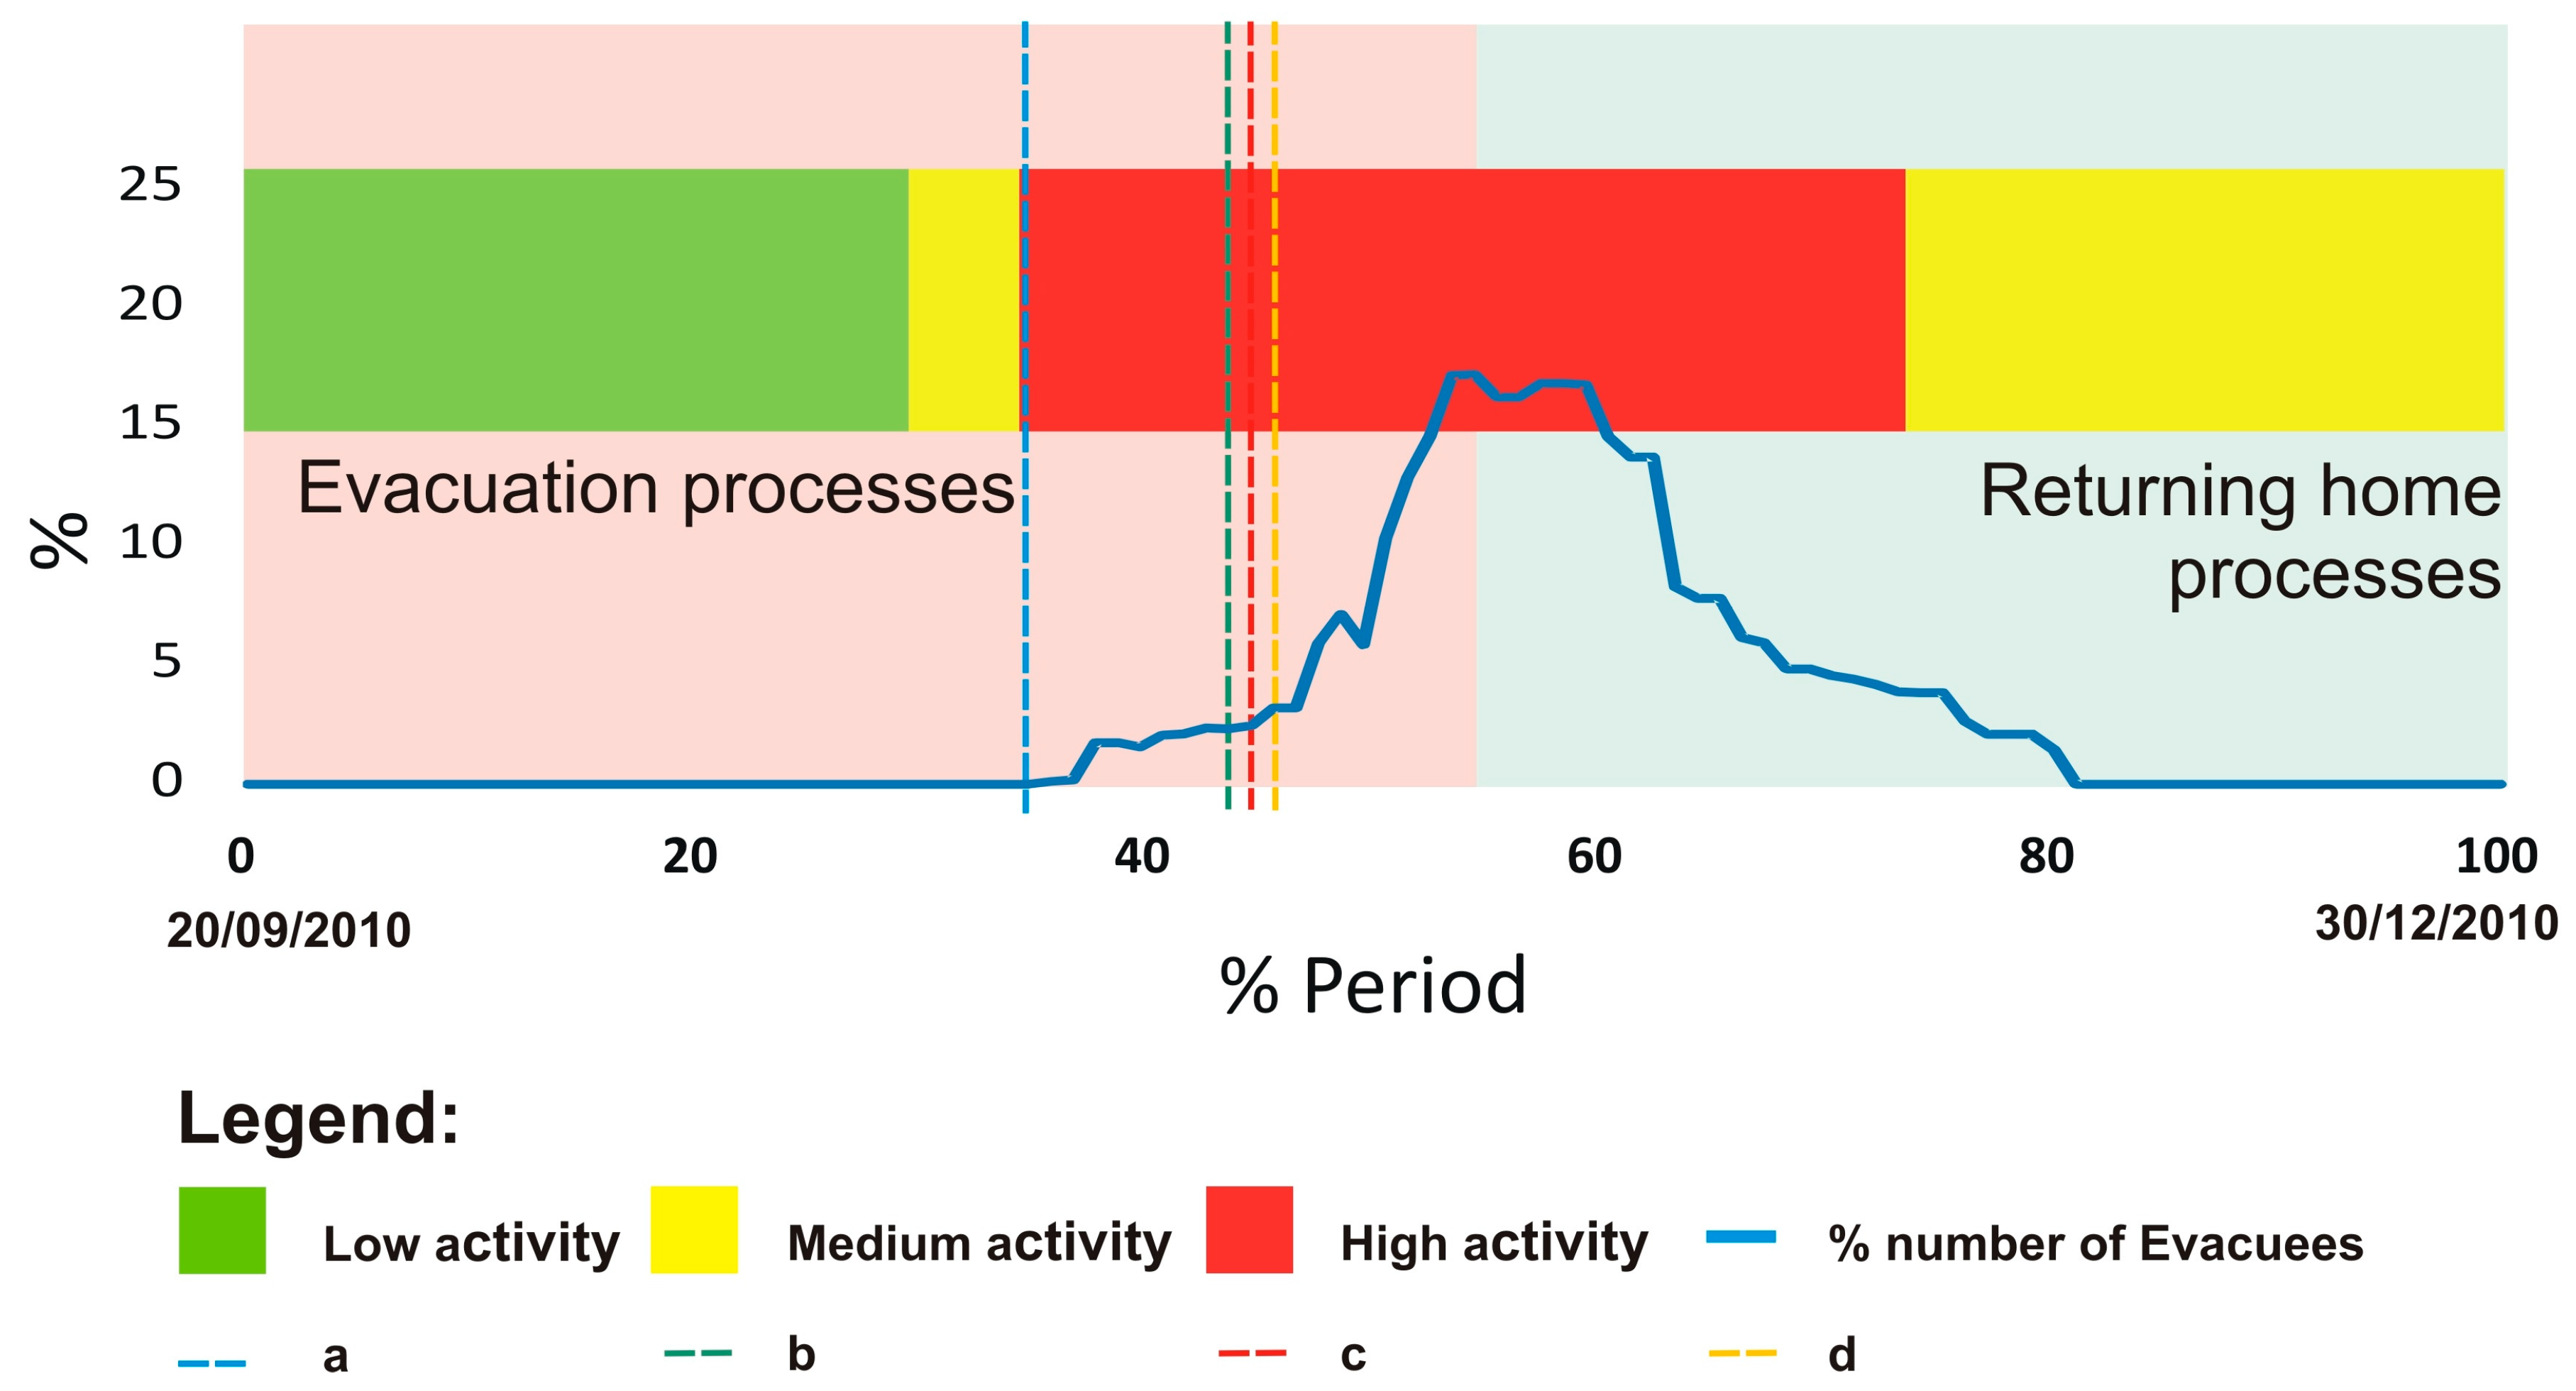
3.6.1. Empirical Data for Comparison
3.6.2. Calibration
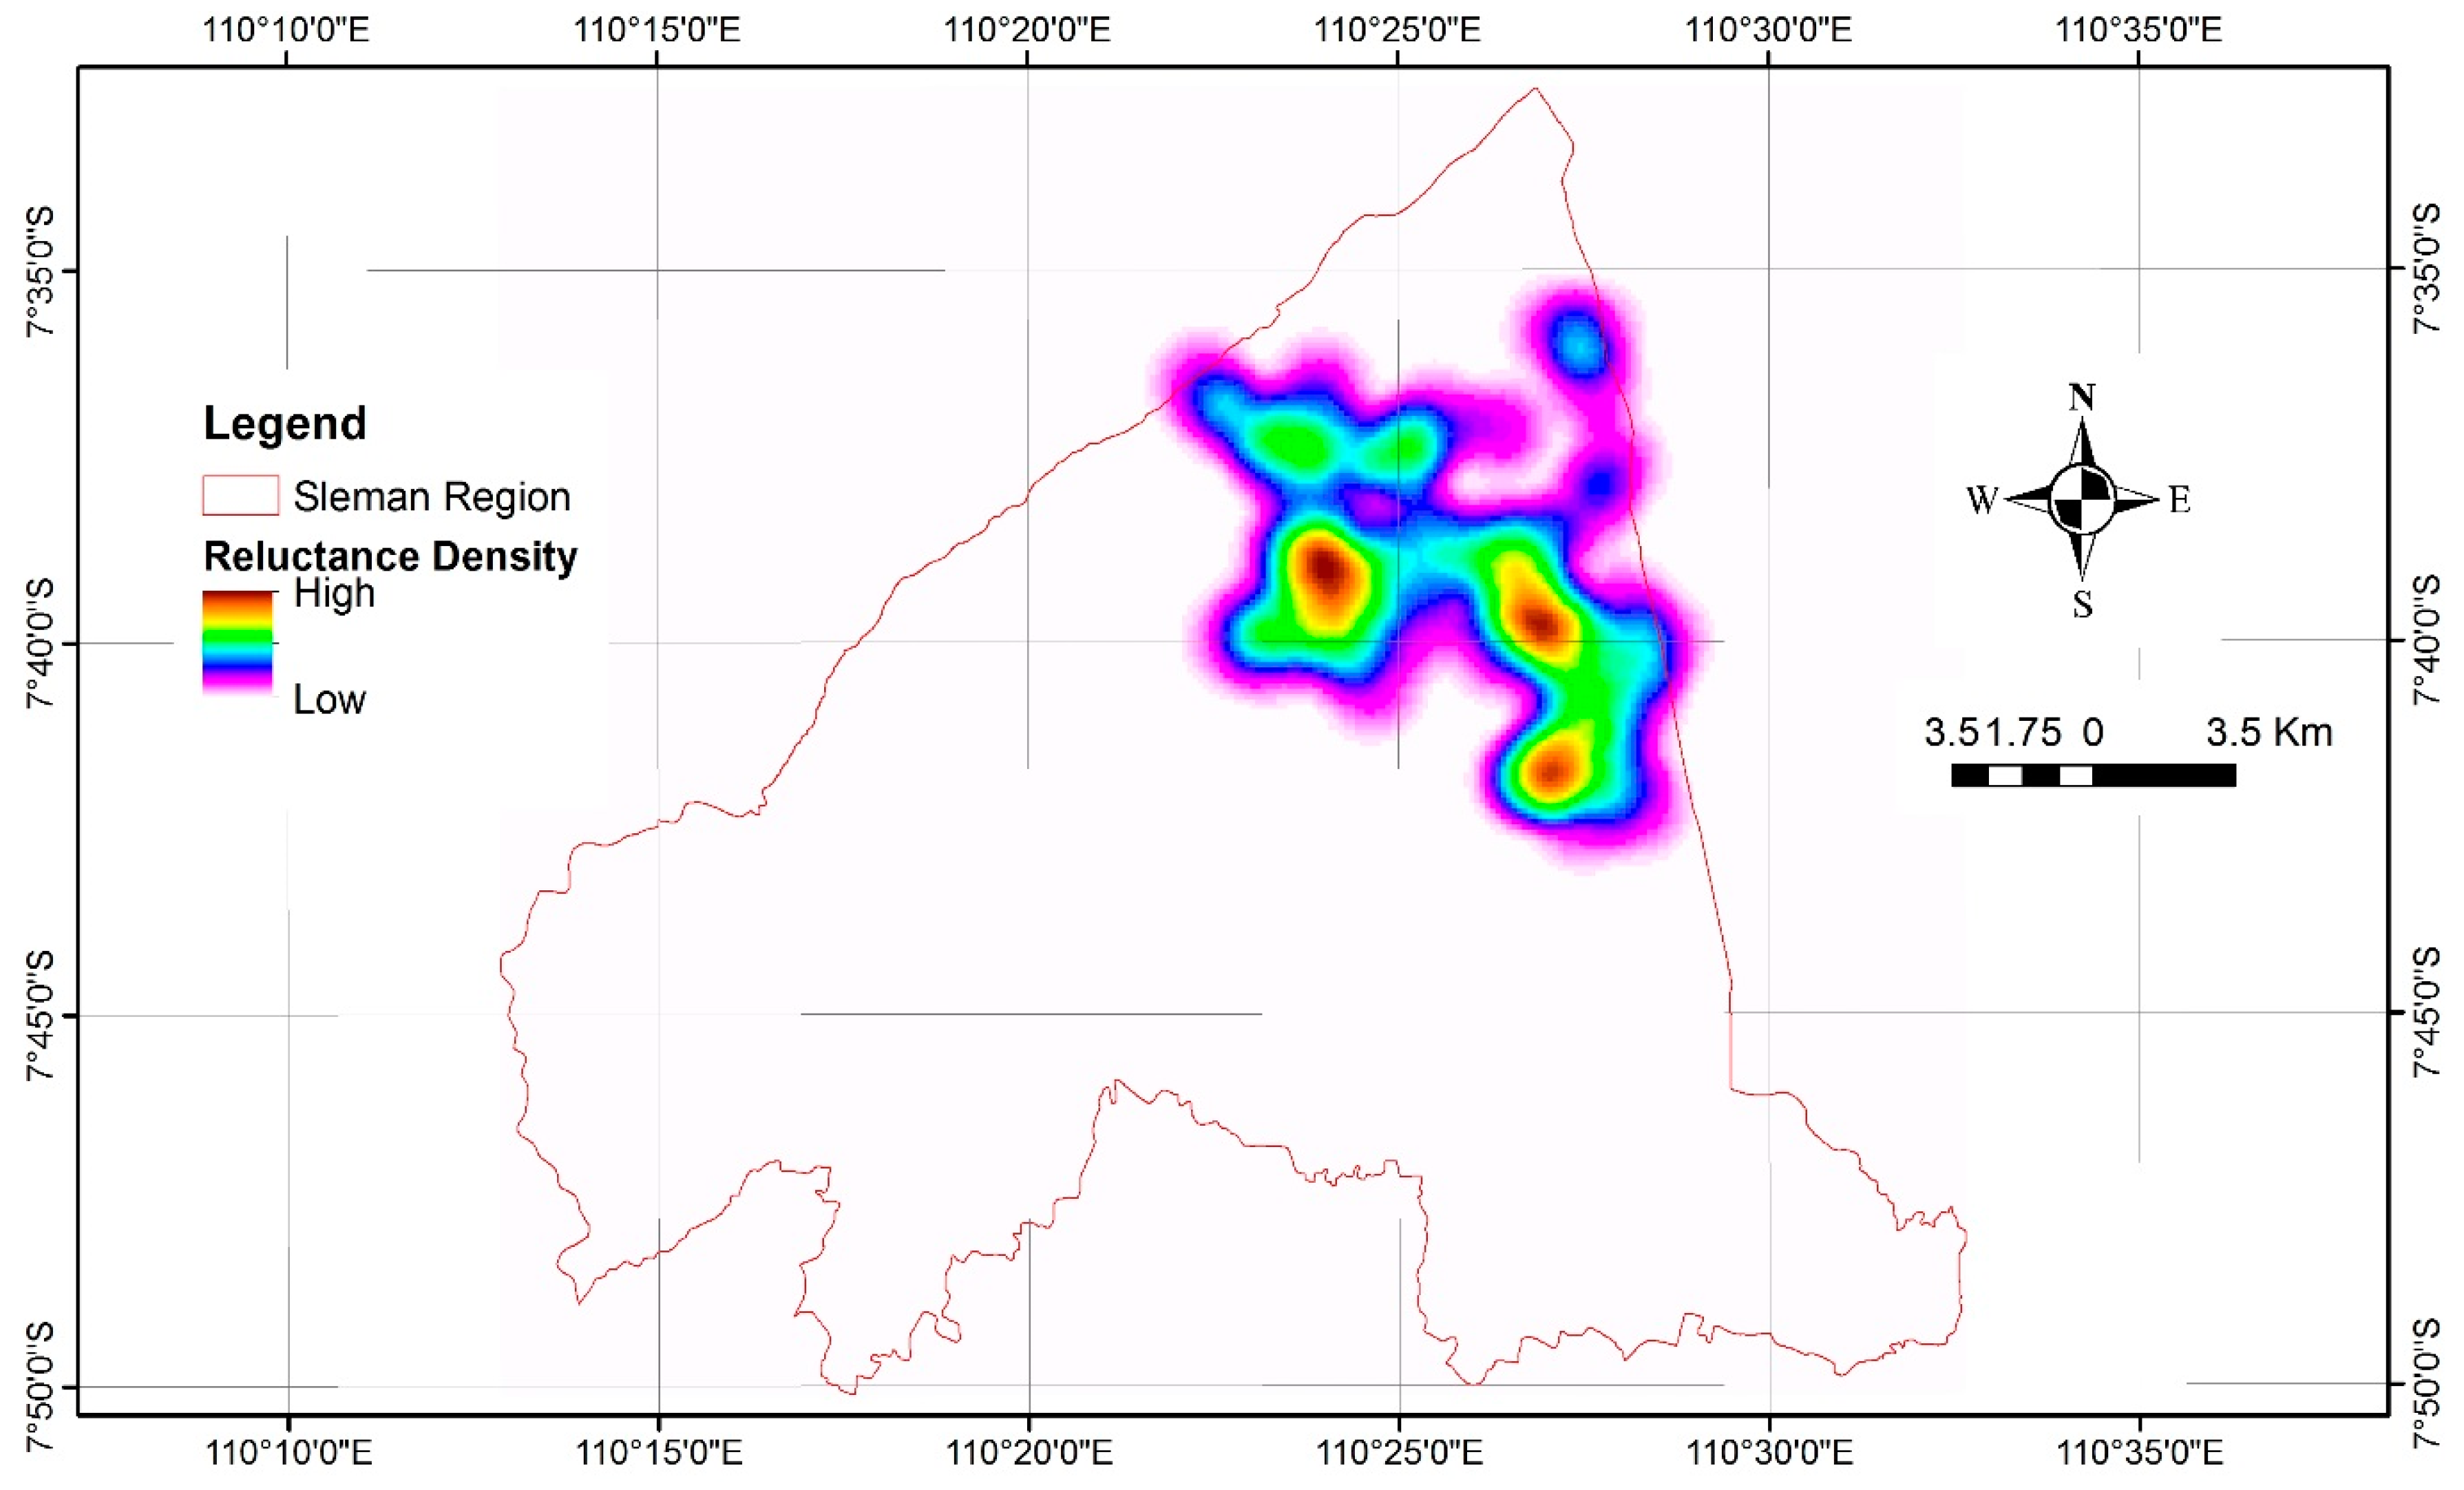
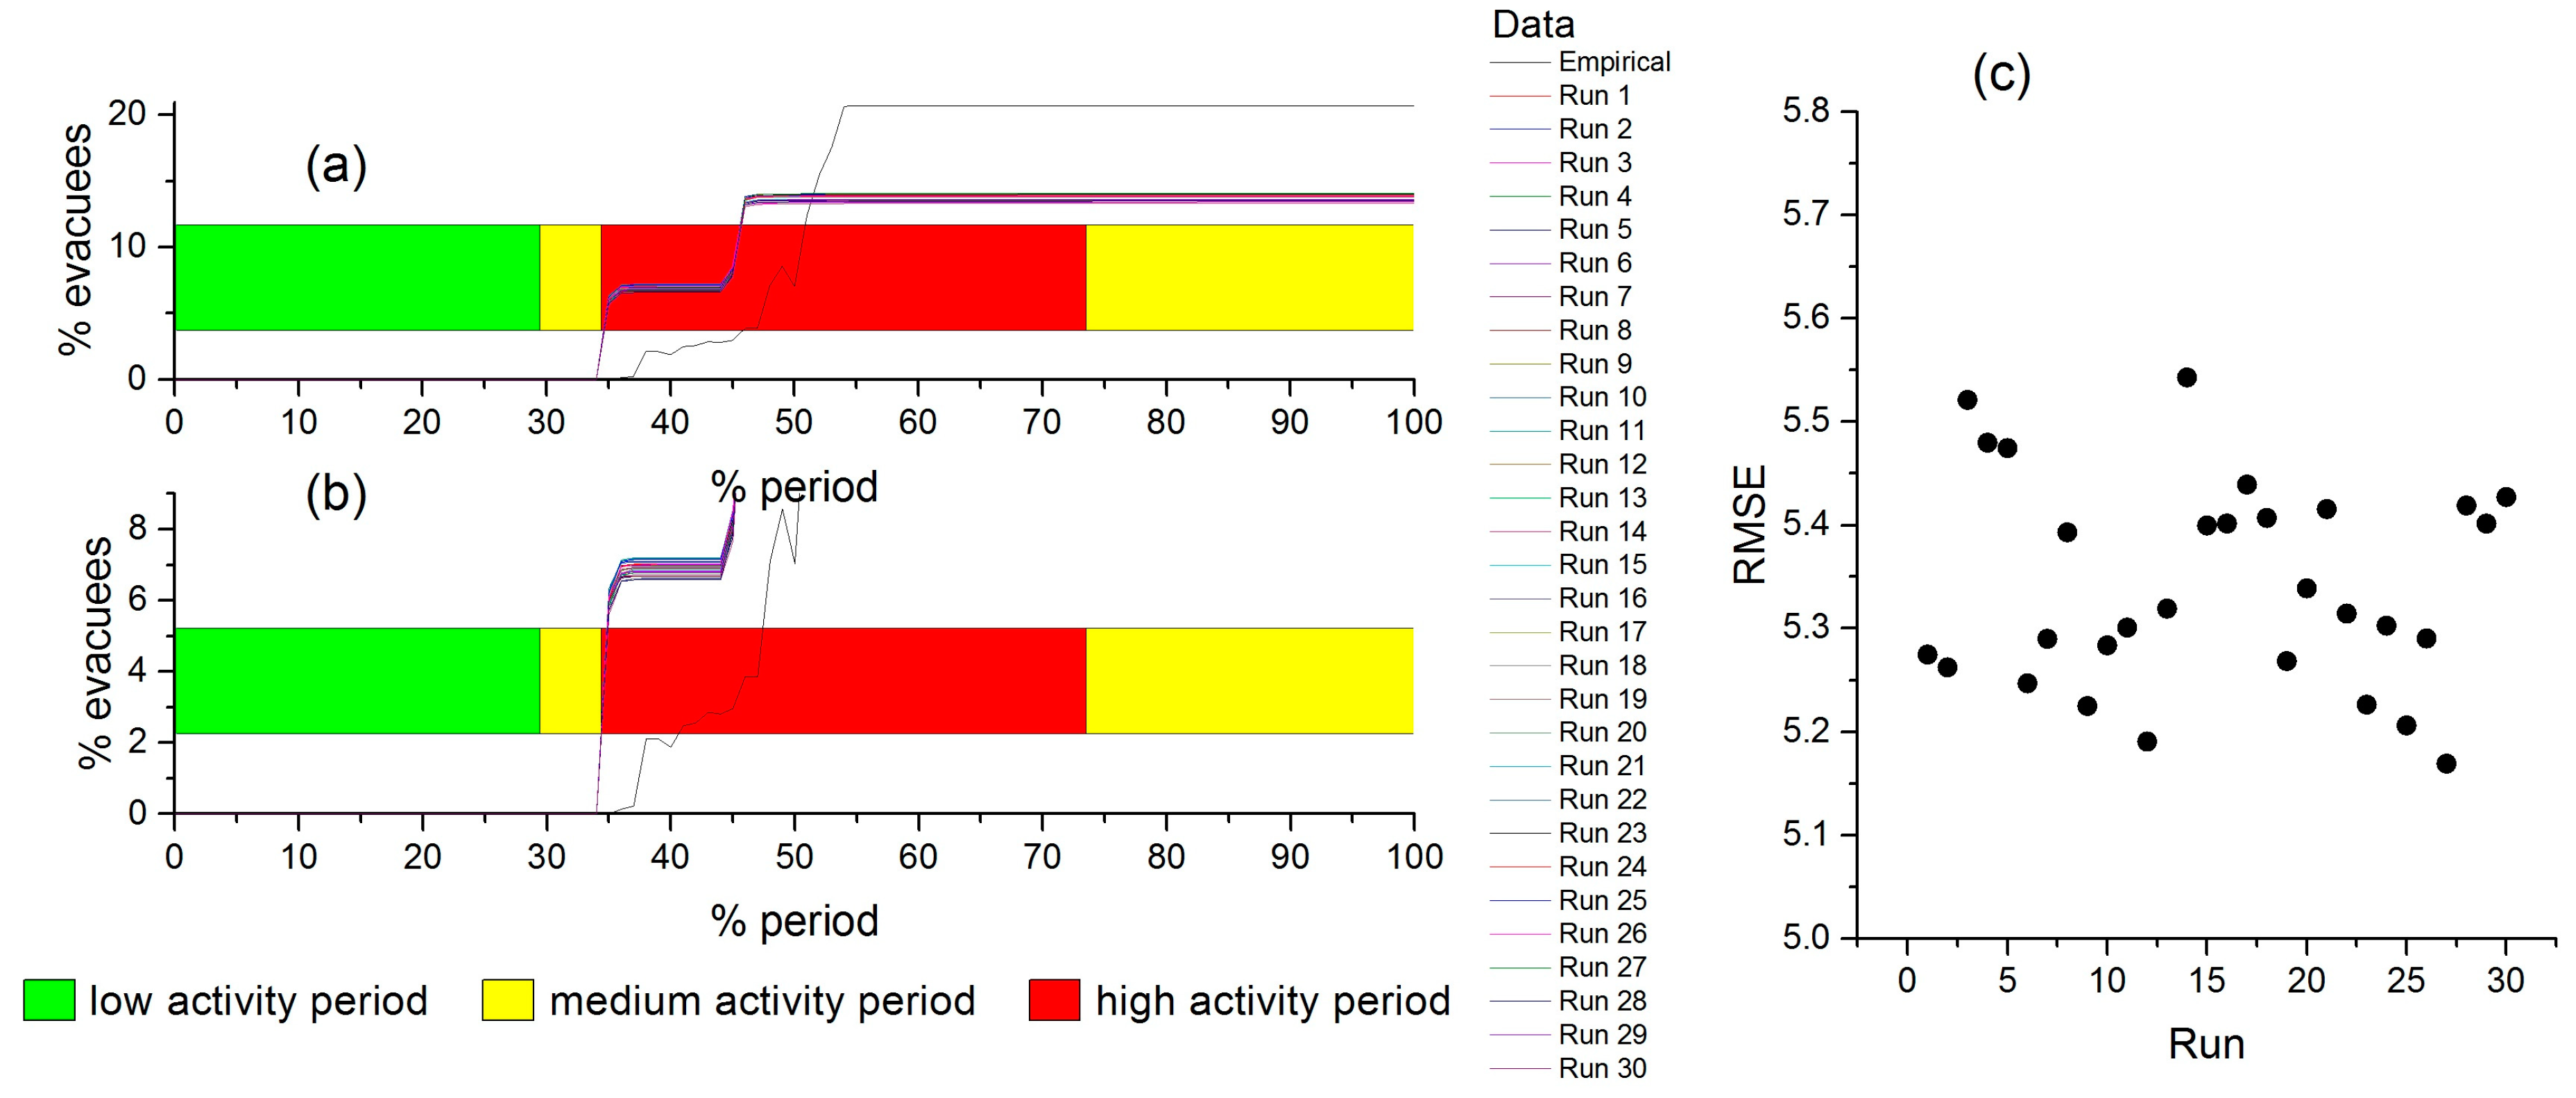
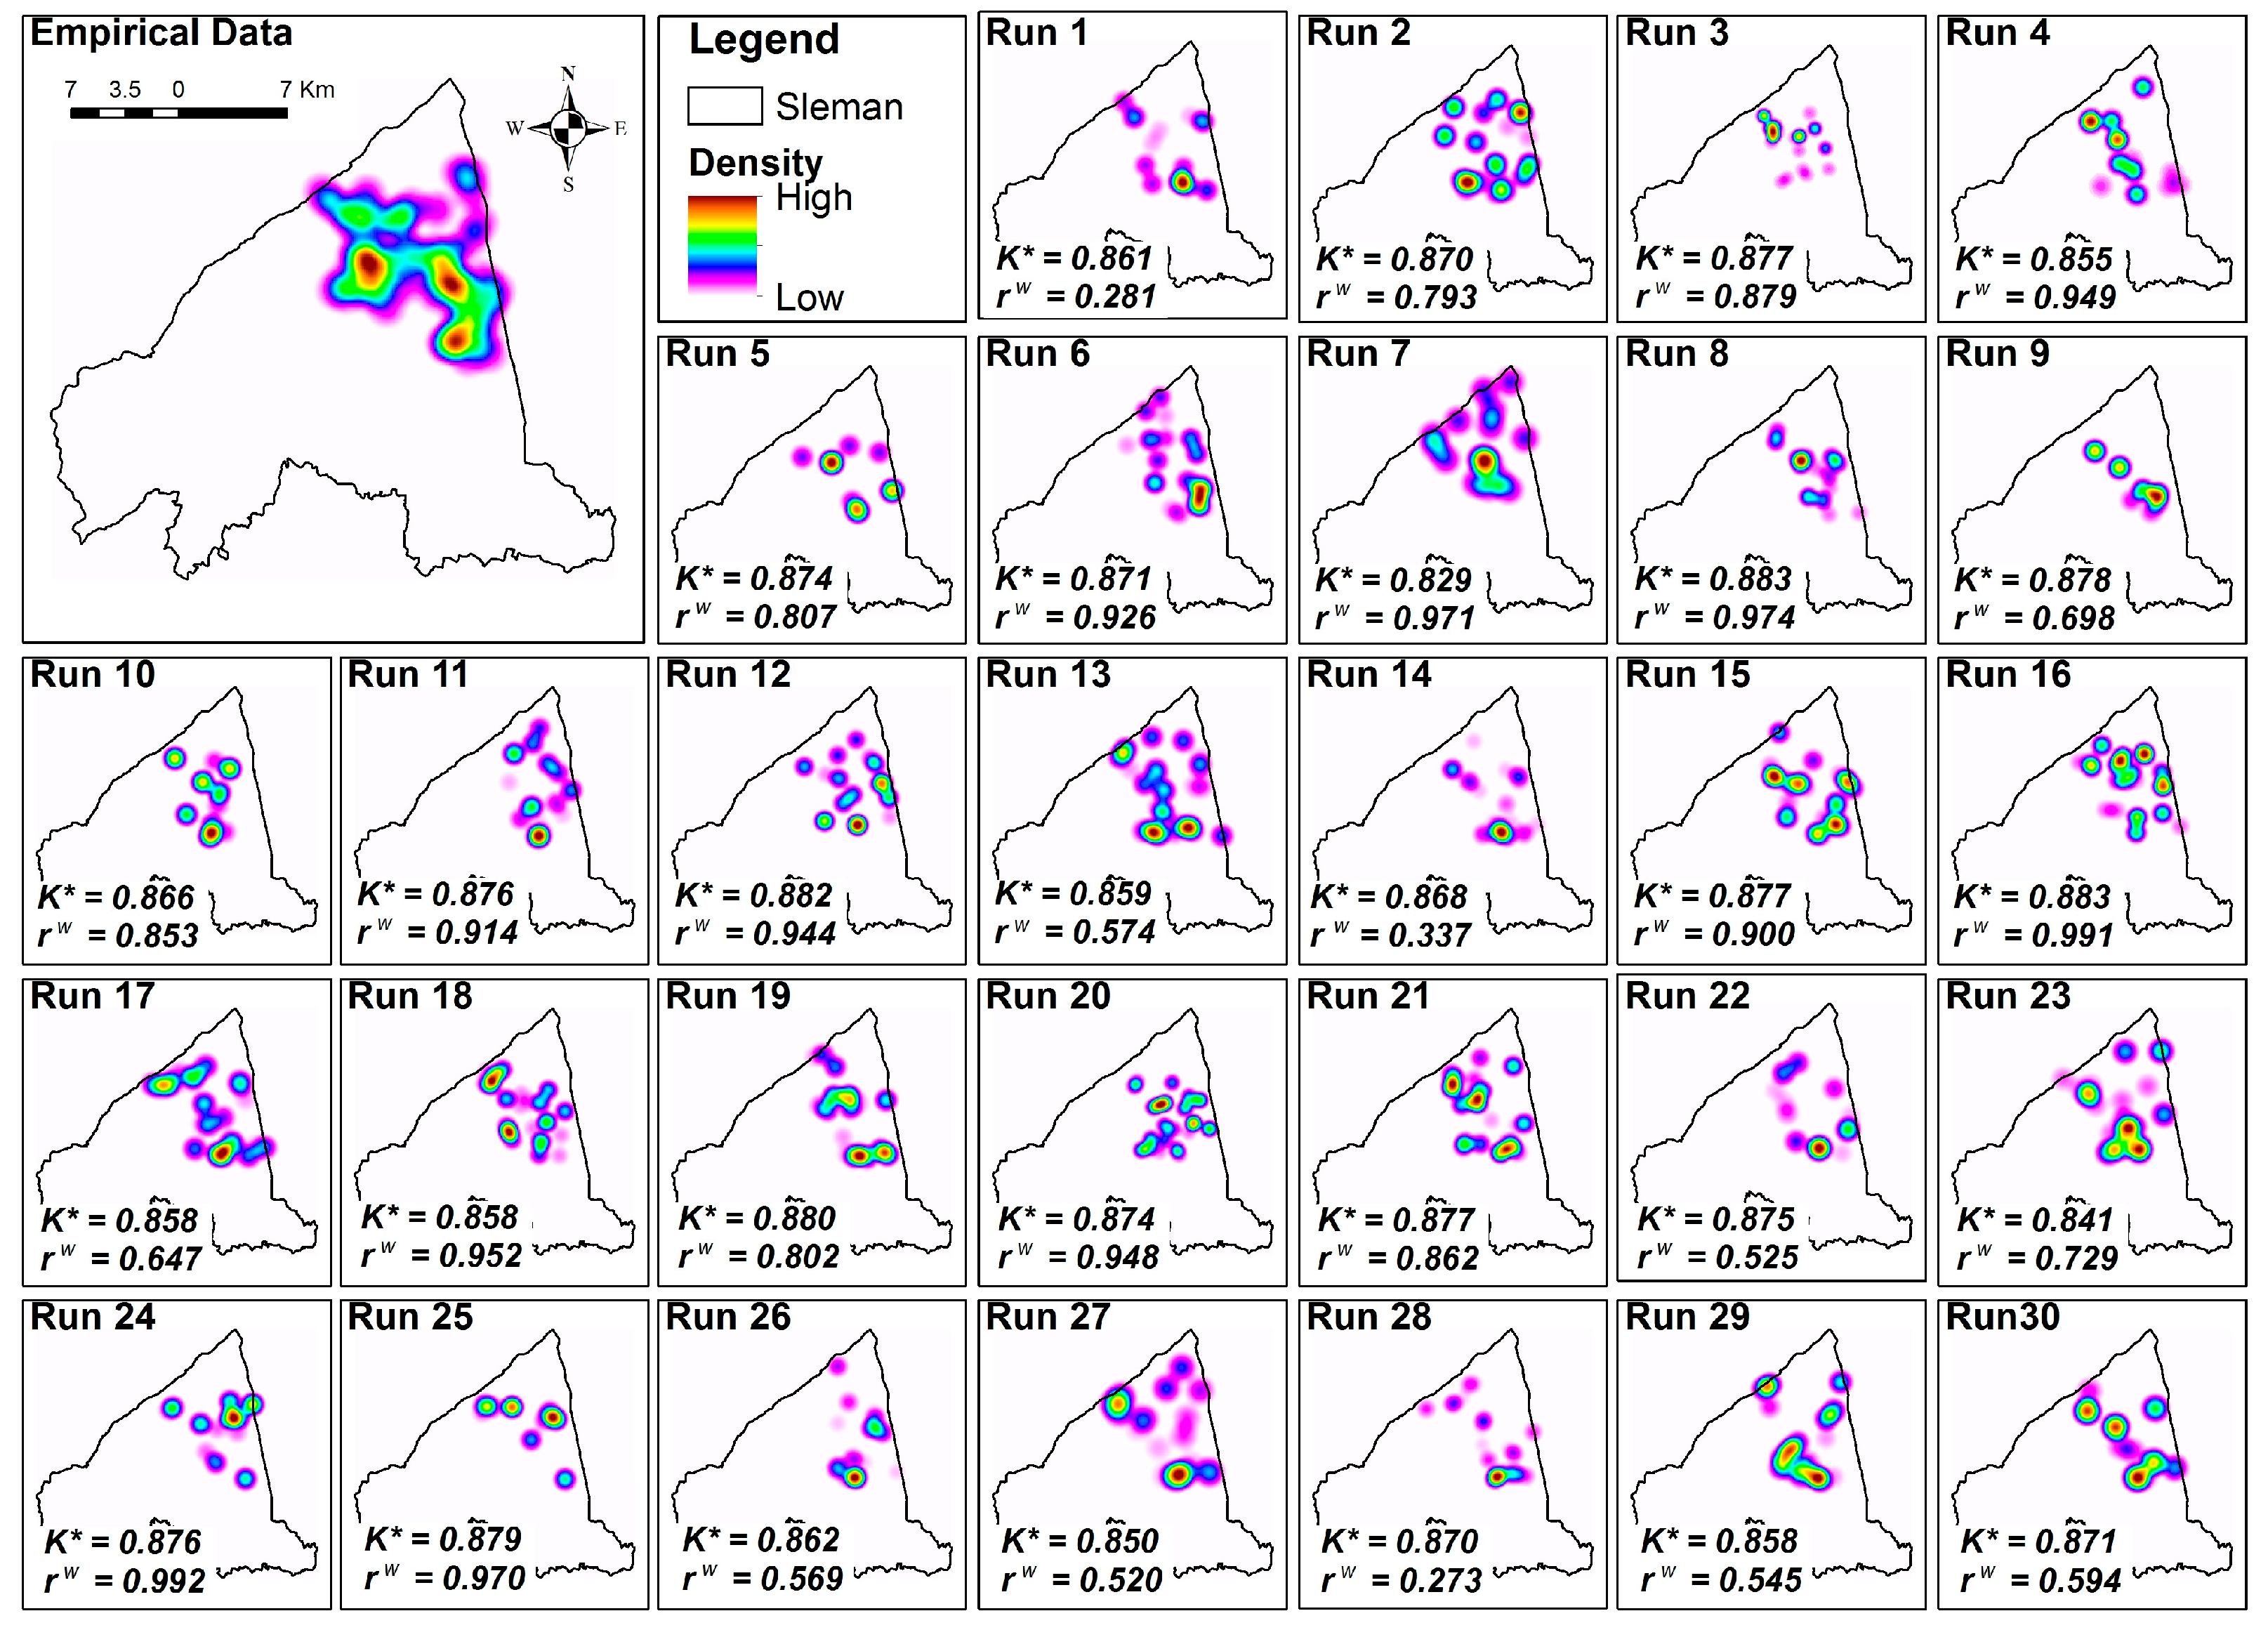
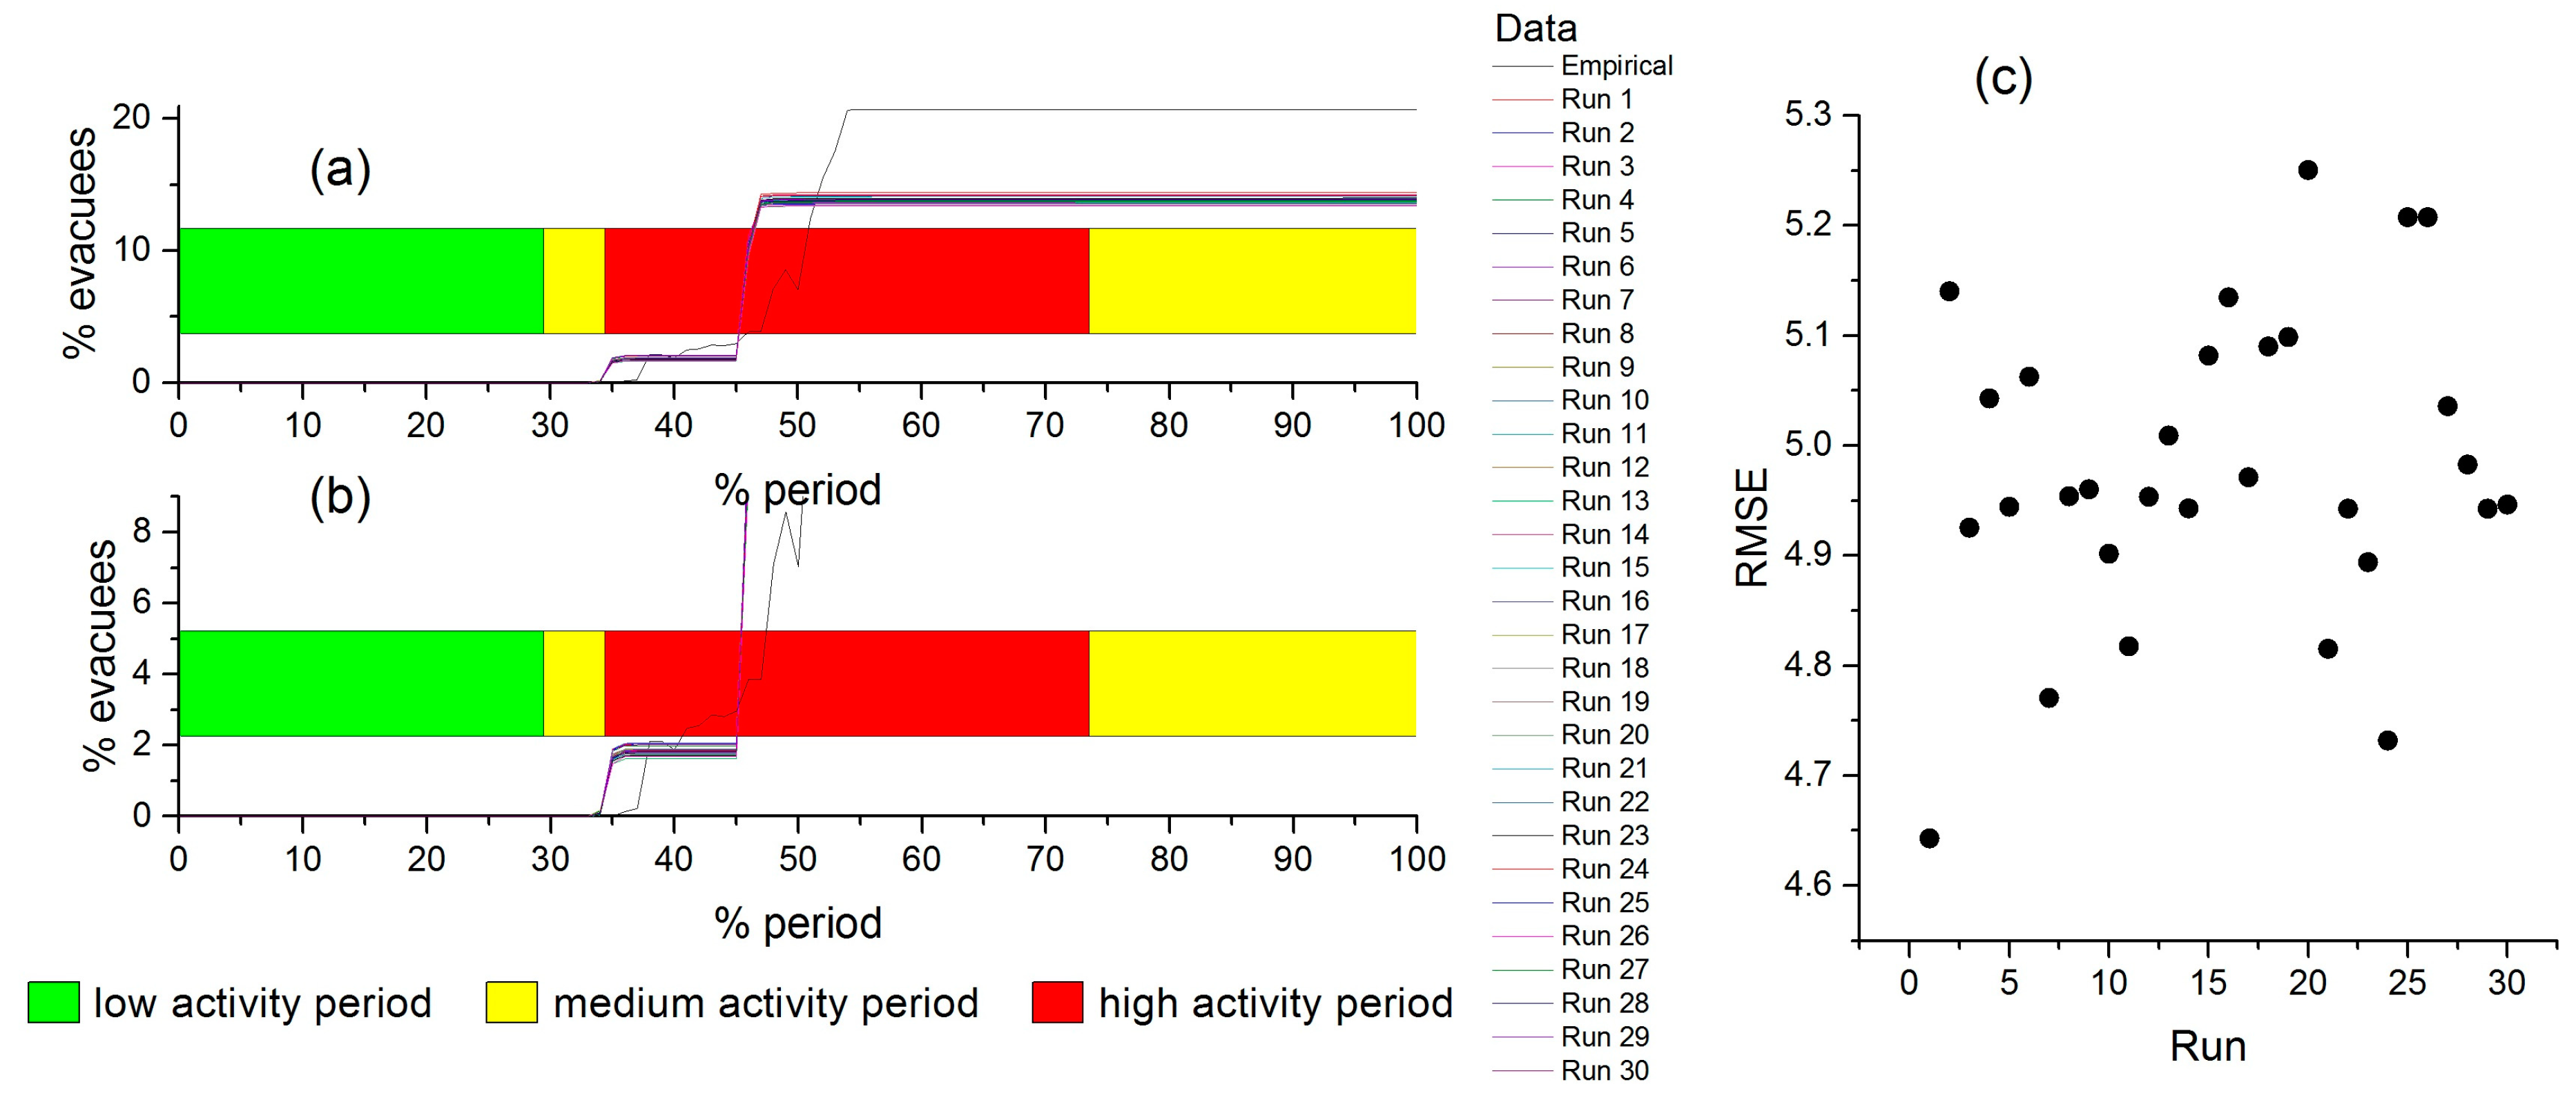
3.6.3. Validation
4. Results and Discussion
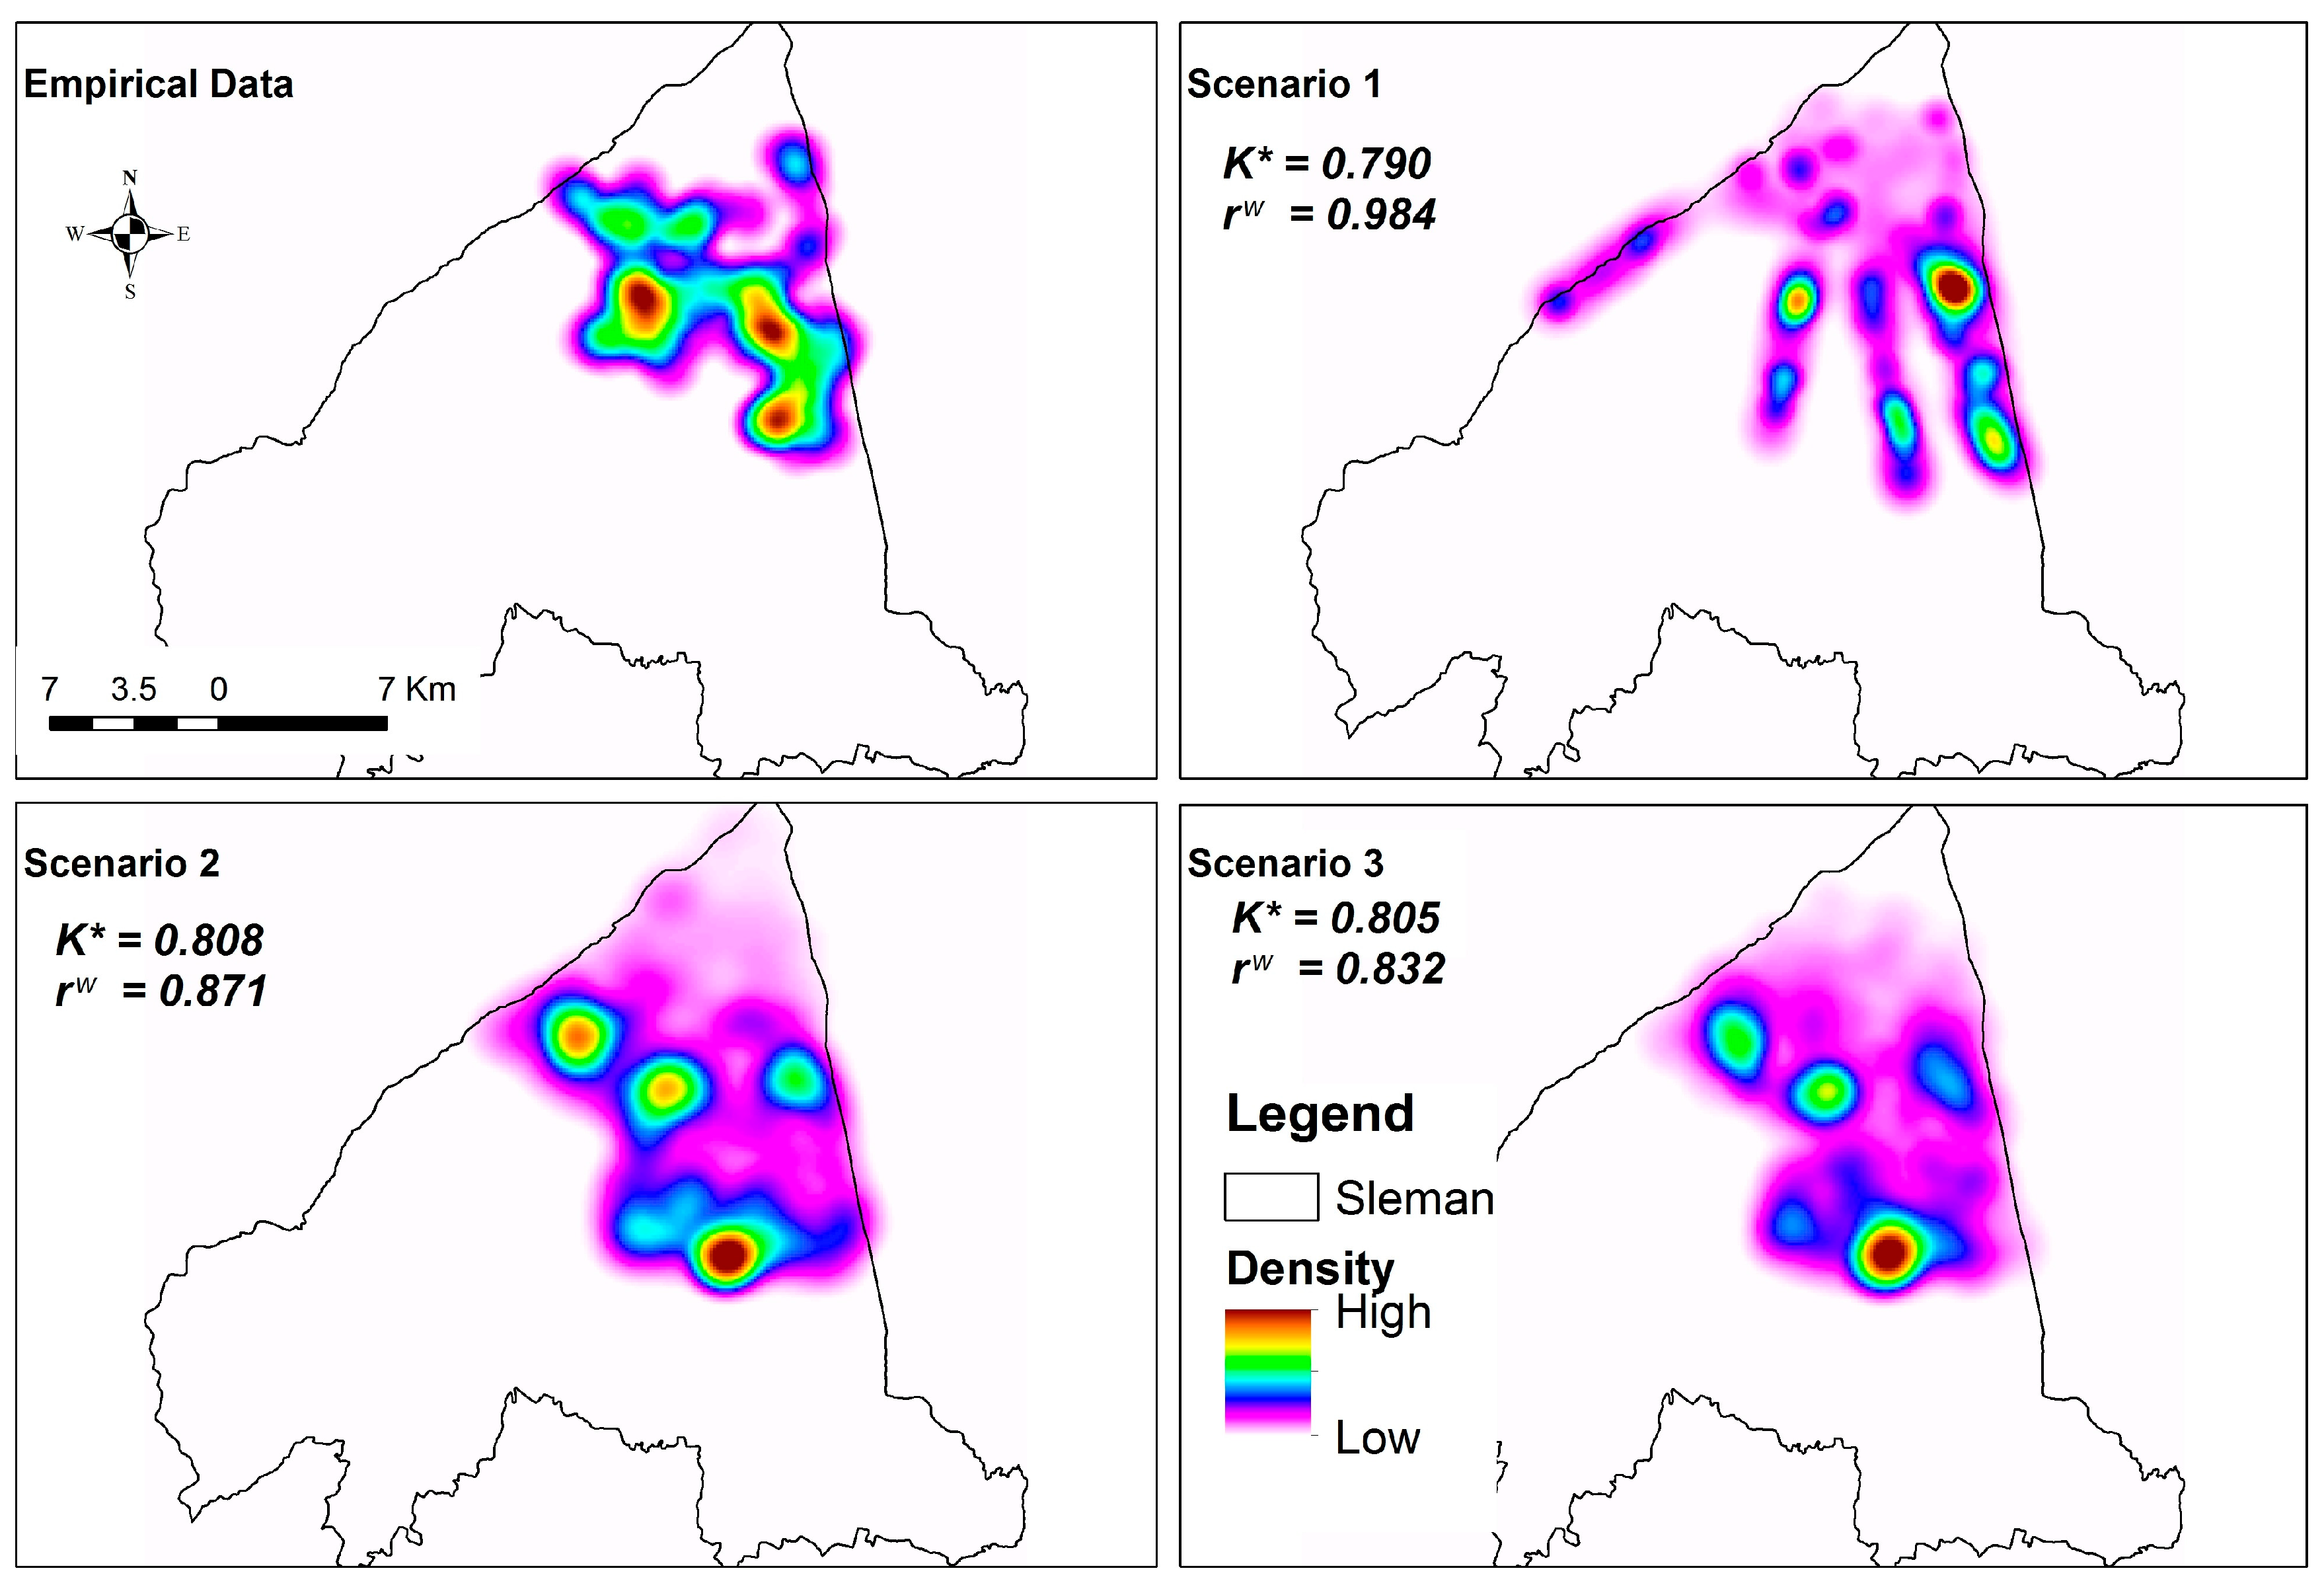
4.1. Results of the Simulation Scenarios
4.1.1. Scenario 1
4.1.2. Scenario 2
4.1.3. Scenario 3
4.2. Discussion and Future Research
5. Conclusions
Supplementary Materials
Author Contributions
Acknowledgments
Conflicts of Interest
References
- Alcántara-Ayala, I. Geomorphology, natural hazards, vulnerability and prevention of natural disasters in developing countries. Geomorphology 2002, 47, 107–124. [Google Scholar] [CrossRef]
- Beck, U. World at Risk; Polity: Cambridge, UK, 2009. [Google Scholar]
- CRED. 2015 Disasters in Numbers 2016; CRED: Brussels, Belgium, 2016. [Google Scholar]
- Guha-Sapir, D.; Hoyois, P.; Below, R. Annual Disaster Statistical Review 2015; CRED: Brussels, Belgium, 2016. [Google Scholar]
- Siagian, T.H.; Purhadi, P.; Suhartono, S.; Ritonga, H. Social vulnerability to natural hazards in Indonesia: Driving factors and policy implications. Nat. Hazards 2013, 70, 1603–1617. [Google Scholar] [CrossRef]
- Makinoshima, F.; Abe, Y.; Imamura, F.; Machida, G.; Takeshita, Y. Possible Factors Promoting Car Evacuation in the 2011 Tohoku Tsunami Revealed by Analysing a Large-Scale Questionnaire Survey in Kesennuma City. Geosciences 2017, 7, 112. [Google Scholar] [CrossRef]
- Quarantelli, E.L. The Warning Process and Evacuation Behavior: The Research Evidence; Disaster Research Center: Newark, Delaware, 1990. [Google Scholar]
- Saadatseresht, M.; Mansourian, A.; Taleai, M. Evacuation planning using multiobjective evolutionary optimization approach. Eur. J. Oper. Res. 2009, 198, 305–314. [Google Scholar] [CrossRef]
- Cutter, S.L.; Barnes, L.; Berry, M.; Burton, C.; Evans, E.; Tate, E.; Webb, J. A place-based model for understanding community resilience to natural disasters. Glob. Environ. Chang. 2008, 18, 598–606. [Google Scholar] [CrossRef]
- Voight, B.; Constantine, E.K.; Siswowidjoyo, S.; Torley, R. Historical eruptions of Merapi Volcano, Central Java, Indonesia, 1768–1998. J. Volcanol. Geotherm. Res. 2000, 100, 69–138. [Google Scholar] [CrossRef]
- Mei, E.T.W.; Lavigne, F. Influence of the institutional and socio-economic context for responding to disasters: Case study of the 1994 and 2006 eruptions of the Merapi Volcano, Indonesia. Geol. Soc. Lond. Spec. Publ. 2012, 361, 171–186. [Google Scholar] [CrossRef]
- Lavigne, F.; Morin, J.; Mei, E.T.W.; Calder, E.S.; Usamah, M.; Nugroho, U. Mapping hazard zones, rapid warning communication and understanding communities: Primary ways to mitigate pyroclastic flow hazard. In Advances in Volcanology; Springer: Berlin/Heidelberg, Germany, 2017; pp. 1–13. [Google Scholar]
- Zhang, B.; Chan, W.K.; Ukkusuri, S.V. Agent-based modeling for household level hurricane evacuation. In Proceedings of the 2009 Winter Simulation Conference (WSC), Austin, TX, USA, 13–16 December 2009; pp. 2778–2784. [Google Scholar]
- Mas, E.; Suppasri, A.; Imamura, F.; Koshimura, S. Agent-based simulation of the 2011 great east japan earthquake/tsunami evacuation: An integrated model of tsunami inundation and evacuation. J. Nat. Disaster Sci. 2012, 34, 41–57. [Google Scholar] [CrossRef]
- Carver, S.; Quincey, D. A Conceptual Design of Spatio-Temporal Agent-Based Model for Volcanic Evacuation. Systems 2017, 5, 53. [Google Scholar] [CrossRef]
- Chen, X.; Zhan, F.B. Agent-based modelling and simulation of urban evacuation: Relative effectiveness of simultaneous and staged evacuation strategies. J. Oper. Res. Soc. 2008, 59, 25–33. [Google Scholar] [CrossRef]
- Chandan, S.; Saha, S.; Barrett, C.; Eubank, S.; Marathe, A.; Marathe, M.; Swarup, S.; Vullikanti, A.K.S. Modeling the interaction between emergency communications and behavior in the aftermath of a disaster. In Proceedings of the International Conference on Social Computing, Behavioral-Cultural Modeling, and Prediction, Washington, DC, USA, 2–5 April 2013; Springer: Berlin, Germany, 2013; pp. 476–485. [Google Scholar]
- Donovan, K. Cultural Responses to Volcanic Hazards on Mt Merapi, Indonesia. Ph.D. Thesis, University of Plymouth, Plymouth, UK, 2010. [Google Scholar]
- Sagala, S.A.H. System Analysis of Social Resilience against Volcanic Risks Case Studies of Merapi, Indonesia and Mt. Sakurajima, Japan. Ph.D. Thesis, Kyoto University, Kyoto, Japan, 2009. [Google Scholar]
- Wilson, T.; Cole, J.; Johnston, D.; Cronin, S.; Stewart, C.; Dantas, A. Short- and long-term evacuation of people and livestock during a volcanic crisis: Lessons from the 1991 eruption of Volcán Hudson, Chile. J. Appl. Volcanol. 2012, 1, 2. [Google Scholar] [CrossRef]
- Grimm, V.; Berger, U.; Bastiansen, F.; Eliassen, S.; Ginot, V.; Giske, J.; Goss-Custard, J.; Grand, T.; Heinz, S.K.; Huse, G.; et al. A standard protocol for describing individual-based and agent-based models. Ecol. Model. 2006, 198, 115–126. [Google Scholar] [CrossRef]
- Polhill, J.G. ODD Updated. J. Artif. Soc. Soc. Simul. 2010, 13, 9. [Google Scholar] [CrossRef]
- Dash, N.; Gladwin, H. Evacuation Decision Making and Behavioral Responses: Individual and Household. Nat. Hazards Rev. 2007, 8, 69–77. [Google Scholar] [CrossRef]
- Ahsan, M.N.; Takeuchi, K.; Vink, K.; Ohara, M. A Systematic Review of the Factors Affecting the Cyclone Evacuation Decision Process in Bangladesh. J. Disaster Res. 2016, 11, 741. [Google Scholar] [CrossRef]
- Lim, M.B.B.; Lim, H.R.; Piantanakulchai, M.; Uy, F.A. A household-level flood evacuation decision model in Quezon City, Philippines. Nat. Hazards 2015, 80, 1539–1561. [Google Scholar] [CrossRef]
- Linardi, S. Peer coordination and communication following disaster warnings: An experimental framework. Saf. Sci. 2016. [Google Scholar] [CrossRef]
- Siebeneck, L.K.; Cova, T.J. Spatial and temporal variation in evacuee risk perception throughout the evacuation and return-entry process. Risk Anal. 2012, 32, 1468–1480. [Google Scholar] [CrossRef] [PubMed]
- Golledge, R.G. Spatial Behavior: A Geographic Perspective; Guilford Press: New York, NY, USA, 1997. [Google Scholar]
- Ronald, W. Population Evacuation in Volcanic Eruptions, Floods, and Nuclear Power Plant Accidents: Some Elementary Comparisons. J. Community Pschol. 1983, 11, 36–47. [Google Scholar]
- Botzen, W.J.; Aerts, J.C.; van den Bergh, J.C. Dependence of flood risk perceptions on socioeconomic and objective risk factors. Water Resour. Res. 2009, 45. [Google Scholar] [CrossRef]
- Bird, D.K.; Gísladóttir, G.; Dominey-Howes, D. Different communities, different perspectives: Issues affecting residents’ response to a volcanic eruption in southern Iceland. Bull. Volcanol. 2011, 73, 1209–1227. [Google Scholar] [CrossRef]
- Rianto, T. Spatial Analysis of Volcanic Risk Perception Case Study in Local Community at Merapi Volcano Dangerous Zones. Master’s Thesis, ITC, University of Twente, Enschede, The Netherlands, 2009. [Google Scholar]
- Khalid, M.N.A.; Yusof, U.K. A Crowd Modelling Considering Group Cohesion in the Emergency Route Planning Problems. Aust. J. Basic Appl. Sci. 2014, 8, 33–39. [Google Scholar]
- Liu, S.; Murray-Tuite, P.; Schweitzer, L. Incorporating Household Gathering and Mode Decisions in Large-Scale No-Notice Evacuation Modeling. Comput.-Aided Civ. Infrastruct. Eng. 2014, 29, 107–122. [Google Scholar] [CrossRef]
- Sagala, S.; Okada, N. F-2 Statistical analysis of correlation between hazard-related factors and households’ evacuation decisions in Mt. Merapi. Proc. Annu. Conf. Inst. Soc. Saf. Sci. 2009, AA12381938, 61–64. [Google Scholar]
- Donovan, K. Doing social volcanology: Exploring volcanic culture in Indonesia. Area 2010, 42, 117–126. [Google Scholar] [CrossRef]
- Lavigne, F.; De Coster, B.; Juvin, N.; Flohic, F.; Gaillard, J.-C.; Texier, P.; Morin, J.; Sartohadi, J. People’s behaviour in the face of volcanic hazards: Perspectives from Javanese communities, Indonesia. J. Volcanol. Geotherm. Res. 2008, 172, 273–287. [Google Scholar] [CrossRef]
- Tayag, J.; Insauriga, S.; Ringor, A.; Belo, M. People’s response to eruption warning: The Pinatubo experience, 1991–1992. In Fire and mud. Eruptions and Lahars of Mount Pinatubo, Philippines; University of Washington Press: Seattle, WC, USA, 1996. [Google Scholar]
- Canessa, E.; Riolo, R.L. The effect of organizational communication media on organizational culture and performance: An agent-based simulation model. Comput. Math. Organ. Theory 2003, 9, 147–176. [Google Scholar] [CrossRef]
- Marsella, S.C.; Pynadath, D.V.; Read, S.J. PsychSim: Agent-based modeling of social interactions and influence. In Proceedings of the International Conference on Cognitive Modeling, Pittsburgh, PA, USA, 30 July–1 August 2004; Volume 36, pp. 243–248. [Google Scholar]
- Qiu, F.; Hu, X. Modeling group structures in pedestrian crowd simulation. Simul. Model. Pract. Theory 2010, 18, 190–205. [Google Scholar] [CrossRef]
- Reneke, P.A. Evacuation Decision Model; US Department of Commerce, National Institute of Standards and Technology: Washington, DC, USA, 2013.
- Lovreglio, R.; Ronchi, E.; Nilsson, D. An Evacuation Decision Model based on perceived risk, social influence and behavioural uncertainty. Simul. Model. Pract. Theory 2016. [Google Scholar] [CrossRef]
- Rosenbaum, M.S.; Culshaw, M.G. Communicating the Risks Arising from Geohazards. J. R. Stat. Soc. Ser. A Stat. Soc. 2003, 166, 261–270. [Google Scholar] [CrossRef]
- Macal, C.M.; North, M.J. Tutorial on agent-based modeling and simulation. In Proceedings of the 37th Conference on Winter Simulation, Orlando, FL, USA, 4–7 December 2005; pp. 2–15. [Google Scholar]
- Gilbert, G.N. Agent-Based Models; SAGE: London, UK, 2008; ISBN 978-1-4129-4964-4. [Google Scholar]
- Macal, C.M. Model verification and validation. In Proceedings of the Workshop on Threat Anticipation: Social Science Methods and Models, Chicago, IL, USA, 7–8 April 2005. [Google Scholar]
- Brown, D.G.; Xie, Y. Spatial agent-based modelling. Int. J. Geogr. Inf. Sci. 2006, 20, 941–943. [Google Scholar] [CrossRef]
- Pons, M.; Johnson, P.A.; Rosas, M.; Jover, E. A georeferenced agent-based model to analyze the climate change impacts on ski tourism at a regional scale. Int. J. Geogr. Inf. Sci. 2014, 28, 2474–2494. [Google Scholar] [CrossRef] [Green Version]
- Brown, D.G.; Riolo, R.; Robinson, D.T.; North, M.; Rand, W. Spatial process and data models: Toward integration of agent-based models and GIS. J. Geogr. Syst. 2005, 7, 25–47. [Google Scholar] [CrossRef]
- Hawe, G.I.; Coates, G.; Wilson, D.T.; Crouch, R.S. Agent-based simulation for large-scale emergency response: A survey of usage and implementation. ACM Comput. Surv. CSUR 2012, 45, 8. [Google Scholar] [CrossRef] [Green Version]
- Zheng, X.; Zhong, T.; Liu, M. Modeling crowd evacuation of a building based on seven methodological approaches. Build. Environ. 2009, 44, 437–445. [Google Scholar] [CrossRef]
- Cole, J.W.; Sabel, C.E.; Blumenthal, E.; Finnis, K.; Dantas, A.; Barnard, S.; Johnston, D.M. GIS-Based Emergency and Evacuation Planning for Volcanic Hazards in New Zealand. 2005. Available online: http://www.nzsee.org.nz (accessed on 20 March 2018).
- Marrero, J.M.; García, A.; Llinares, A.; Rodríguez-Losada, J.A.; Ortiz, R. The Variable Scale Evacuation Model (VSEM): A new tool for simulating massive evacuation processes during volcanic crises. Nat. Hazards Earth Syst. Sci. 2010, 10, 747–760. [Google Scholar] [CrossRef] [Green Version]
- Wang, D.Q.; Gong, Q.G.; Shen, X.F. An Improved Personnel Evacuation Cellular Automata Model Based on the Ant Colony Optimization Algorithm. Appl. Mech. Mater. 2014, 513–517, 3287–3291. [Google Scholar] [CrossRef]
- Ye, Z.; Yin, Y.; Zong, X.; Wang, M. An Optimization model for evacuation based on cellular automata and ant colony algorithm. In Proceedings of the 2014 Seventh International Symposium on Computational Intelligence and Design (ISCID), Hangzhou, China, 13–14 December 2014; Volume 1, pp. 7–10. [Google Scholar]
- Yuan, W.; Tan, K.H. An evacuation model using cellular automata. Phys. Stat. Mech. Appl. 2007, 384, 549–566. [Google Scholar] [CrossRef]
- Bonabeau, E. Agent-based modeling: Methods and techniques for simulating human systems. Proc. Natl. Acad. Sci. USA 2002, 99, 7280–7287. [Google Scholar] [CrossRef] [PubMed]
- Reynolds, C. Individual-Based Models. 1999. Available online: http://www.red3d.com/cwr/ibm.html (accessed on 14 April 2017).
- An, L. Modeling human decisions in coupled human and natural systems: Review of agent-based models. Ecol. Model. 2012, 229, 25–36. [Google Scholar] [CrossRef]
- Chapuis, K.; Taillandier, P.; Renaud, M.; Drogoul, A. Gen*: A generic toolkit to generate spatially explicit synthetic populations. Int. J. Geogr. Inf. Sci. 2018, 32, 1194–1210. [Google Scholar] [CrossRef]
- Gilbert, N. Computer Simulation of Social Processes. 1993. Available online: http://sru.soc.surrey.ac.uk/SRU6.html (accessed on 14 April 2017).
- Klügl, F. A validation methodology for agent-based simulations. In Proceedings of the 2008 ACM Symposium on Applied Computing (SAC ’08), Fortaleza, Ceara, Brazil, 16–20 March 2008; ACM: New York, NY, USA, 2008; pp. 39–43. [Google Scholar]
- Robinson, S.A.; Rai, V. Determinants of spatio-temporal patterns of energy technology adoption: An agent-based modeling approach. Appl. Energy 2015, 151, 273–284. [Google Scholar] [CrossRef]
- Heppenstall, A.; Malleson, N.; Crooks, A. “Space, the Final Frontier”: How Good are Agent-Based Models at Simulating Individuals and Space in Cities? Systems 2016, 4, 9. [Google Scholar] [CrossRef]
- Lee, J.-S.; Filatova, T.; Ligmann-Zielinska, A.; Hassani-Mahmooei, B.; Stonedahl, F.; Lorscheid, I.; Voinov, A.; Polhill, J.G.; Sun, Z.; Parker, D.C. The Complexities of Agent-Based Modeling Output Analysis. J. Artif. Soc. Soc. Simul. 2015, 18, 4. [Google Scholar] [CrossRef]
- Wang, H.; Mostafizi, A.; Cramer, L.A.; Cox, D.; Park, H. An agent-based model of a multimodal near-field tsunami evacuation: Decision-making and life safety. Transp. Res. Part C Emerg. Technol. 2016, 64, 86–100. [Google Scholar] [CrossRef]
- Christensen, K.; Sasaki, Y. Agent-Based Emergency Evacuation Simulation with Individuals with Disabilities in the Population. Available online: http://jasss.soc.surrey.ac.uk/11/3/9.html (accessed on 17 March 2015).
- Shi, J.; Ren, A.; Chen, C. Agent-based evacuation model of large public buildings under fire conditions. Autom. Constr. 2009, 18, 338–347. [Google Scholar] [CrossRef]
- Tan, L.; Hu, M.; Lin, H. Agent-based simulation of building evacuation: Combining human behavior with predictable spatial accessibility in a fire emergency. Inf. Sci. 2015, 295, 53–66. [Google Scholar] [CrossRef]
- Zhao, H.; Winter, S.; Tomko, M. Integrating Decentralized Indoor Evacuation with Information Depositories in the Field. ISPRS Int. J. Geo-Inf. 2017, 6, 213. [Google Scholar] [CrossRef]
- Cajka, J.C.; Cooley, P.C.; Wheaton, W.D. Attribute Assignment to a Synthetic Population in Support of Agent-Based Disease Modeling; Methods Report; RTI Press: Research Triangle Park, NC, USA, 2010; Volume 19, pp. 1–14. [Google Scholar] [PubMed]
- Malleson, N.; Birkin, M. Analysis of crime patterns through the integration of an agent-based model and a population microsimulation. Comput. Environ. Urban Syst. 2012, 36, 551–561. [Google Scholar] [CrossRef]
- Namazi-Rad, M.-R.; Huynh, N.; Barthelemy, J.; Perez, P. Synthetic population initialization and evolution-agent-based modelling of population aging and household transitions. In Proceedings of the International Conference on Principles and Practice of Multi-Agent Systems, Gold Coast, QLD, Australia, 1–5 December 2014; pp. 182–189. [Google Scholar]
- Sadono, R.; Hartono, H.; Machfoedz, M.M.; Setiaji, S. Monitoring Land Cover Changes in the Disaster-Prone Area: A Case Study of Cangkringan Sub-District, the Flanks of Mount Merapi, Indonesia. Forum Geogr. 2017, 31. [Google Scholar] [CrossRef]
- Mei, E.T.W.; Lavigne, F.; Picquout, A.; de Bélizal, E.; Brunstein, D.; Grancher, D.; Sartohadi, J.; Cholik, N.; Vidal, C. Lessons learned from the 2010 evacuations at Merapi volcano. J. Volcanol. Geotherm. Res. 2013, 261, 348–365. [Google Scholar] [CrossRef]
- Mei, E.T.W.; Lavigne, F.; Picquout, A.; Grancher, D. Crisis management during the 2010 Eruption of Merapi Volcano. In Proceedings of the Regional Geographic Conference—International Geographical Union, Santiago, Chile, 14–18 November 2011; pp. 15–19. [Google Scholar]
- Siebert, L.; Simkin, T.; Kimberly, P. Volcanoes of the World; University of California Press: Berkeley, CA, USA, 2011. [Google Scholar]
- Newhall, C.G.; Self, S. The volcanic explosivity index (VEI) an estimate of explosive magnitude for historical volcanism. J. Geophys. Res. 1982, 87, 1231. [Google Scholar] [CrossRef]
- Gertisser, R.; Charbonnier, S.J.; Keller, J.; Quidelleur, X. The geological evolution of Merapi volcano, Central Java, Indonesia. Bull. Volcanol. 2012, 74, 1213–1233. [Google Scholar] [CrossRef]
- Thouret, J.-C.; Lavigne, F.; Kelfoun, K.; Bronto, S. Toward a revised hazard assessment at Merapi volcano, Central Java. J. Volcanol. Geotherm. Res. 2000, 100, 479–502. [Google Scholar] [CrossRef]
- Wilson, T.; Kaye, G.; Stewart, C.; Cole, J. Impacts of the 2006 Eruption of Merapi Volcano, Indonesia, on Agriculture and Infrastructure; GNS Science Report 2007/07; Institute of Geological and Nuclear Sciences Limited: Lower Hutt, New Zealand, 2007; p. 69. [Google Scholar]
- Jousset, P.; Pallister, J.; Boichu, M.; Buongiorno, M.F.; Budisantoso, A.; Costa, F.; Andreastuti, S.; Prata, F.; Schneider, D.; Clarisse, L.; et al. The 2010 explosive eruption of Java’s Merapi volcano—A ‘100-year’ event. J. Volcanol. Geotherm. Res. 2012, 241–242, 121–135. [Google Scholar] [CrossRef] [Green Version]
- Marfai, M.A.; Cahyadi, A.; Hadmoko, D.S.; Sekaranom, A.B. Sejarah Letusan Gunung Merapi Berdasarkan Fasies Gunungapi di Daerah Aliran Sungai Bedog, Daerah Istimewa Yogyakarta. RISET Geologi dan Pertambangan 2012, 22, 73–80. [Google Scholar] [CrossRef]
- Branney, M.; Kokelaar, B.P. Sedimentation of ignimbrites from pyroclastic density currents. Mem. Geol. Soc. Lond. 2002, 27, 150. [Google Scholar]
- Bardintzeff, J.M. Merapi volcano (Java, Indonesia) and Merapi-type nuée ardente. Bull. Volcanol. 1984, 47, 433–446. [Google Scholar] [CrossRef]
- Charbonnier, S.J.; Gertisser, R. Field observations and surface characteristics of pristine block-and-ash flow deposits from the 2006 eruption of Merapi Volcano, Java, Indonesia. J. Volcanol. Geotherm. Res. 2008, 177, 971–982. [Google Scholar] [CrossRef]
- Solikhin, A.; Pinel, V.; Vandemeulebrouck, J.; Thouret, J.-C.; Hendrasto, M. Mapping the 2010 Merapi pyroclastic deposits using dual-polarization Synthetic Aperture Radar (SAR) data. Remote Sens. Environ. 2015, 158, 180–192. [Google Scholar] [CrossRef]
- Kelfoun, K.; Legros, F.; Gourgaud, A. A statistical study of trees damaged by the 22 November 1994 eruption of Merapi volcano (Java, Indonesia): Relationships between ash-cloud surges and block-and-ash flows. J. Volcanol. Geotherm. Res. 2000, 100, 379–393. [Google Scholar] [CrossRef]
- Pierson, T.C.; Major, J.J. Hydrogeomorphic effects of explosive volcanic eruptions on drainage basins. Annu. Rev. Earth Planet. Sci. 2014, 42, 469–507. [Google Scholar] [CrossRef]
- Smith, G.A.; Fritz, W.J. Volcanic influences on terrestrial sedimentation. Geology 1989, 17, 375–376. [Google Scholar] [CrossRef]
- Smith, G.A.; Lowe, D.R. Lahars: Volcano hydrologic-events and deposition in the debris flow—Hyperconcentrated flow continuum. In Sedimentation in Volcanic Settings; Society for Sedimentary Geology: Tulsa, OK, USA, 1991. [Google Scholar]
- De Bélizal, E.; Lavigne, F.; Hadmoko, D.S.; Degeai, J.-P.; Dipayana, G.A.; Mutaqin, B.W.; Marfai, M.A.; Coquet, M.; Le Mauff, B.; Robin, A.-K.; et al. Rain-triggered lahars following the 2010 eruption of Merapi volcano, Indonesia: A major risk. J. Volcanol. Geotherm. Res. 2013, 261, 330–347. [Google Scholar] [CrossRef]
- Gob, F.; Gautier, E.; Virmoux, C.; Grancher, D.; Tamisier, V.; Primanda, K.W.; Wibowo, S.B.; Sarrazin, C.; de Belizal, E.; Ville, A.; et al. River responses to the 2010 major eruption of the Merapi volcano, central Java, Indonesia. Geomorphology 2016, 273, 244–257. [Google Scholar] [CrossRef]
- Lavigne, F.; de Bélizal, E.; Cholik, N.; Aisyah, N.; Picquout, A.; Mei, E.T.W. Lahar hazards and risks following the 2010 eruption of Merapi volcano, Indonesia. EGU Gen Assem. 2011, 13, 2011–4400. [Google Scholar]
- Lavigne, F.; Thouret, J.C.; Voight, B.; Suwa, H.; Sumaryono, A. Lahars at Merapi volcano, Central Java: An overview. J. Volcanol. Geotherm. Res. 2000, 100, 423–456. [Google Scholar] [CrossRef]
- Lavigne, F.; Thouret, J.-C. Sediment transportation and deposition by rain-triggered lahars at Merapi Volcano, Central Java, Indonesia. Geomorphology 2003, 49, 45–69. [Google Scholar] [CrossRef]
- Damby, D.E.; Horwell, C.J.; Baxter, P.J.; Delmelle, P.; Donaldson, K.; Dunster, C.; Fubini, B.; Murphy, F.A.; Nattrass, C.; Sweeney, S.; et al. The respiratory health hazard of tephra from the 2010 Centennial eruption of Merapi with implications for occupational mining of deposits. J. Volcanol. Geotherm. Res. 2013, 261, 376–387. [Google Scholar] [CrossRef] [Green Version]
- Lavigne, F.; Thouret, J.-C.; Hadmoko, D.S.; Sukatja, B. Lahars in Java: Initiations, dynamics, hazard assessment and deposition processes. Forum Geogr. 2007, 21. [Google Scholar] [CrossRef]
- Saepuloh, A.; Urai, M.; Aisyah, N.; Widiwijayanti, C.; Jousset, P. Interpretation of ground surface changes prior to the 2010 large eruption of Merapi volcano using ALOS/PALSAR, ASTER TIR and gas emission data. J. Volcanol. Geotherm. Res. 2013, 261, 130–143. [Google Scholar] [CrossRef]
- BNPB Peta Kawasan Rawan Bencana Gunung Merapi. Available online: http://www.webcitation.org/6pimWt1Fc (accessed on 20 March 2018).
- BNPB Peta Kawasan Rawan Bencana Merapi. Available online: http://geospasial.bnpb.go.id/wp-content/uploads/2011/05/2011-04-29_KRB_Area_Terdampak_Langsung_Merapi.pdf (accessed on 9 October 2015).
- Minnesota Population Center. Integrated Public Use Microdata Series, International, version 6.4; University of Minnesota: Minneapolis, MN, USA, 2015. [Google Scholar]
- BNPB Peta Lokasi dan Jumlah Pengungsi Letusan G.Api Merapi di Wilayah Kab. Sleman (15 nov). Available online: http://www.webcitation.org/6piPoQCLs (accessed on 14 April 2017).
- BNPB Peta Lokasi dan Jumlah Pengungsi Letusan G.Api Merapi di Wilayah Kab. Bantul (11 nov). Available online: http://www.webcitation.org/6pikQru7D (accessed on 14 April 2017).
- BNPB Peta Lokasi dan Jumlah Pengungsi Letusan G.Api Merapi di Wilayah Kota Yogyakarta (15 nov). Available online: http://www.webcitation.org/6pilvuYiE (accessed on 14 April 2017).
- BNPB Peta Lokasi dan Jumlah Pengungsi Letusan G.Api Merapi di Wilayah Kab. Kulon Progo (15 nov). Available online: http://www.webcitation.org/6piskXxQF (accessed on 14 April 2017).
- Budiyono, A.F. Informasi Posko Pengungsian Merapi DIY (Update 10 November 2010). Available online: http://www.webcitation.org/6pWJmis9R (accessed on 6 April 2017).
- GEOFABRIK Download OpenStreetMap Data for This Region: Indonesia. Available online: http://www.webcitation.org/6t07rwZox (accessed on 26 August 2017).
- Slemankab Update Data Korban Bencana Erupsi Gunung Merapi. 2010. Available online: http://www.webcitation.org/6xi7fofUK (accessed on 6 March 2018).
- Jumadi; Carver, S.; Quincey, D. ABM and GIS-based multi-scenarios volcanic evacuation modelling of Merapi. AIP Conf. Proc. 2016, 1730, 050005. [Google Scholar]
- Borshchev, A. The Big Book of Simulation Modeling: Multimethod Modeling with AnyLogic 6; AnyLogic North America: Lebanon, NJ, USA, 2013. [Google Scholar]
- Muhammad, A. Kemenhub Sosialisasikan Batas Kecepatan Kendaraan Di Jalan Raya. Available online: http://www.webcitation.org/6tWdf8s7A (accessed on 16 September 2017).
- Mei, E.T.W.; Lavigne, F. Mass evacuation of the 2010 Merapi eruption. Int. J. Emerg. Manag. 2013, 9, 298–311. [Google Scholar] [CrossRef]
- Anderson, W.A. Disaster Warning and Communication Processes in Two Communities. J. Commun. 1969, 19, 92–104. [Google Scholar] [CrossRef] [PubMed]
- Durage, S.W.; Wirasinghe, S.C.; Ruwanpura, J.Y. Decision Analysis for Tornado Warning and Evacuation. Nat. Hazards Rev. 2016, 17, 04015014. [Google Scholar] [CrossRef]
- Thompson, R.R.; Garfin, D.R.; Silver, R.C. Evacuation from Natural Disasters: A Systematic Review of the Literature. Risk Anal. 2017. [Google Scholar] [CrossRef] [PubMed]
- Kennedy, W.G. Modelling human behaviour in agent-based models. In Agent-Based Models of Geographical Systems; Springer: Berlin, Germany, 2012; pp. 167–179. [Google Scholar]
- Robinson, E.J.H.; Franks, N.R.; Ellis, S.; Okuda, S.; Marshall, J.A.R. A Simple Threshold Rule Is Sufficient to Explain Sophisticated Collective Decision-Making. PLoS ONE 2011, 6, e19981. [Google Scholar] [CrossRef] [PubMed]
- Huang, Z.; Williamson, P. A Comparison of Synthetic Reconstruction and Combinatorial Optimisation Approaches to the Creation of Small-Area Microdata; Department of Geography, University of Liverpool: Liverpool, UK, 2001. [Google Scholar]
- Van Dam, K.H.; Bustos-Turu, G.; Shah, N. A methodology for simulating synthetic populations for the analysis of socio-technical infrastructures. In Advances in Social Simulation 2015; Springer: Berlin, Germany, 2017; pp. 429–434. [Google Scholar]
- Heppenstall, A.J.; Harland, K.; Smith, D.M.; Birkin, M.H. Creating realistic synthetic populations at varying spatial scales: A comparative critique of population synthesis techniques. In Proceedings of the Geocomputation 2011 Conference, London, UK, 20–22 July 2011; pp. 1–8. [Google Scholar]
- Harland, K.; Heppenstall, A.; Smith, D.; Birkin, M. Creating realistic synthetic populations at varying spatial scales: A comparative critique of population synthesis techniques. J. Artif. Soc. Soc. Simul. 2012, 15, 1–15. [Google Scholar] [CrossRef]
- Moeckel, R.; Spiekermann, K.; Wegener, M. Creating a synthetic population. In Proceedings of the 8th International Conference on Computers in Urban Planning and Urban Management (CUPUM), Sendai, Japan, 27–29 May 2003; pp. 1–18. [Google Scholar]
- BPS Sleman Dalam Angka. 2011. Available online: http://www.webcitation.org/6tTCrkUPU (accessed on 14 September 2017).
- Adiga, A.; Beckman, R.; Bisset, K.; Chen, J.; Chungbaek, Y.; Eubank, S.; Marathe, H.S.; Nordberg, E.; Rivers, C.; Stretz, P.; et al. Synthetic populations for epidemic modeling. In Proceedings of the International Conference on Computation and Social Sciences (ICCSS), Helsinki, Finland, 8–11 June 2015. [Google Scholar]
- Wise, S. Using Social Media Content to Inform Agent-based Models for Humanitarian Crisis Response. Ph.D. Thesis, George Mason University, Fairfax, VA, USA, 2014. [Google Scholar]
- Troitzsch, K.G. Validating simulation models. In Proceedings of the 18th European Simulation Multiconference, Magdeburg, Germany, 13–16 June 2004; pp. 98–106. [Google Scholar]
- Local Government of Sleman Pemerintah Kabupaten Sleman Update Data Pengungsi Bencana Merapi 2010. Available online: http://www.webcitation.org/6pNWR8K4a (accessed on 31 March 2017).
- Hagen-Zanker, A. Comparing Continuous Valued Raster Data: A Cross Disciplinary Literature Scan. Available online: http://epubs.surrey.ac.uk/790371/ (accessed on 24 January 2018).
- Visser, H.; Nijs, T. The Map Comparison Kit. Environ. Model. Softw. 2006, 346–358. [Google Scholar] [CrossRef]
- Bigiarini, M.Z. Root Mean Square Error. Available online: http://www.webcitation.org/6x2E7KY2O (accessed on 5 February 2018).
- Crooks, A.; Heppenstall, A.; Malleson, N. Agent-based modeling. In Comprehensive Geographic Information Systems; Elsevier: Oxford, UK, 2018. [Google Scholar]
- Ghasemi, A.; Zahediasl, S. Normality Tests for Statistical Analysis: A Guide for Non-Statisticians. Int. J. Endocrinol. Metab. 2012, 10, 486–489. [Google Scholar] [CrossRef] [PubMed]
- Haneberg, W. Computational Geosciences with Mathematica; Springer Science & Business Media: Berlin, Germany, 2004; ISBN 978-3-540-40245-9. [Google Scholar]
- Adam, C.; Gaudou, B. Modelling Human Behaviours in Disasters from Interviews: Application to Melbourne Bushfires. J. Artif. Soc. Soc. Simul. 2017, 20, 12. [Google Scholar] [CrossRef]
- Hagen, A. Fuzzy set approach to assessing similarity of categorical maps. Int. J. Geogr. Inf. Sci. 2003, 17, 235–249. [Google Scholar] [CrossRef]
- Hagen-Zanker, A.; Straatman, B.; Uljee, I. Further developments of a fuzzy set map comparison approach. Int. J. Geogr. Inf. Sci. 2005, 19, 769–785. [Google Scholar] [CrossRef]
- Briggs, W.M.; Levine, R.A. Wavelets and Field Forecast Verification. Mon. Weather Rev. 1997, 125, 1329–1341. [Google Scholar] [CrossRef]
- Rai, V.; Robinson, S.A. Agent-based modeling of energy technology adoption: Empirical integration of social, behavioral, economic, and environmental factors. Environ. Model. Softw. 2015, 70, 163–177. [Google Scholar] [CrossRef]
- Crooks, A.T.; Hailegiorgis, A.B. An agent-based modeling approach applied to the spread of cholera. Environ. Model. Softw. 2014, 62, 164–177. [Google Scholar] [CrossRef]
- Tobin, G.A.; Whiteford, L.M. Community Resilience and Volcano Hazard: The Eruption of Tungurahua and Evacuation of the Faldas in Ecuador. Disasters 2002, 26, 28–48. [Google Scholar] [CrossRef] [PubMed]
- Elder, K.; Xirasagar, S.; Miller, N.; Bowen, S.A.; Glover, S.; Piper, C. African Americans’ Decisions Not to Evacuate New Orleans Before Hurricane Katrina: A Qualitative Study. Am. J. Public Health 2007, 97, S124–S129. [Google Scholar] [CrossRef] [PubMed]
- Riad, J.K.; Norris, F.H.; Ruback, R.B. Predicting Evacuation in Two Major Disasters: Risk Perception, Social Influence, and Access to Resources. J. Appl. Soc. Psychol. 1999, 29, 918–934. [Google Scholar] [CrossRef]
- Joglosemar Pengungsi Meningkat 10 Kali Lipat. Available online: http://www.webcitation.org/6plZ8aDi7 (accessed on 16 April 2017).
- JPNN Pengungsi Merapi Lari Ke Gunungkidul. Available online: http://www.webcitation.org/6plXZgtDJ (accessed on 16 April 2017).
- Ramdan, D.M. Pengungsi Sudah Masuk Bantul Sampai Gunung Kidul. Available online: http://www.webcitation.org/6plYQ7im5 (accessed on 16 April 2017).
- Cheng, G.; Wilmot, C.G.; Baker, E.J. A destination choice model for hurricane evacuation. In Proceedings of the 87th Annual Meeting Transportation Research Board, Washington, DC, USA, 13–17 January 2008; pp. 13–17. [Google Scholar]


| Data | Source | Use |
|---|---|---|
| ABM Development | ||
| Administrative boundary | Indonesian Geospatial Agency (BIG) | This data is used to distribute the human agents within the boundary. |
| Volcanic hazard zones | (1) National Agency for Disaster Management (BNPB), (2) Based on the evacuation order hazard zones in 2010 [76] | Setting up the hazard scenarios and spatial distribution of the eruption impact. |
| Shelter location | Geospatial BNPB [104,105,106,107], DYMDIS GEGAMA [108] | Defining evacuation destination. |
| Land use | Indonesian Geospatial Agency (BIG) | Defining the mean centre of population distribution (synthetic population generation). |
| Census microdata | Microdata of the Census of Indonesia 2010 from IPUMS [103] | Defining the sociodemographic characteristic distribution (synthetic population generation). |
| Road networks | OSM PBF File [109] | Evacuation routing |
| Survey data | Survey | Formulating the decision making. |
| Validation | ||
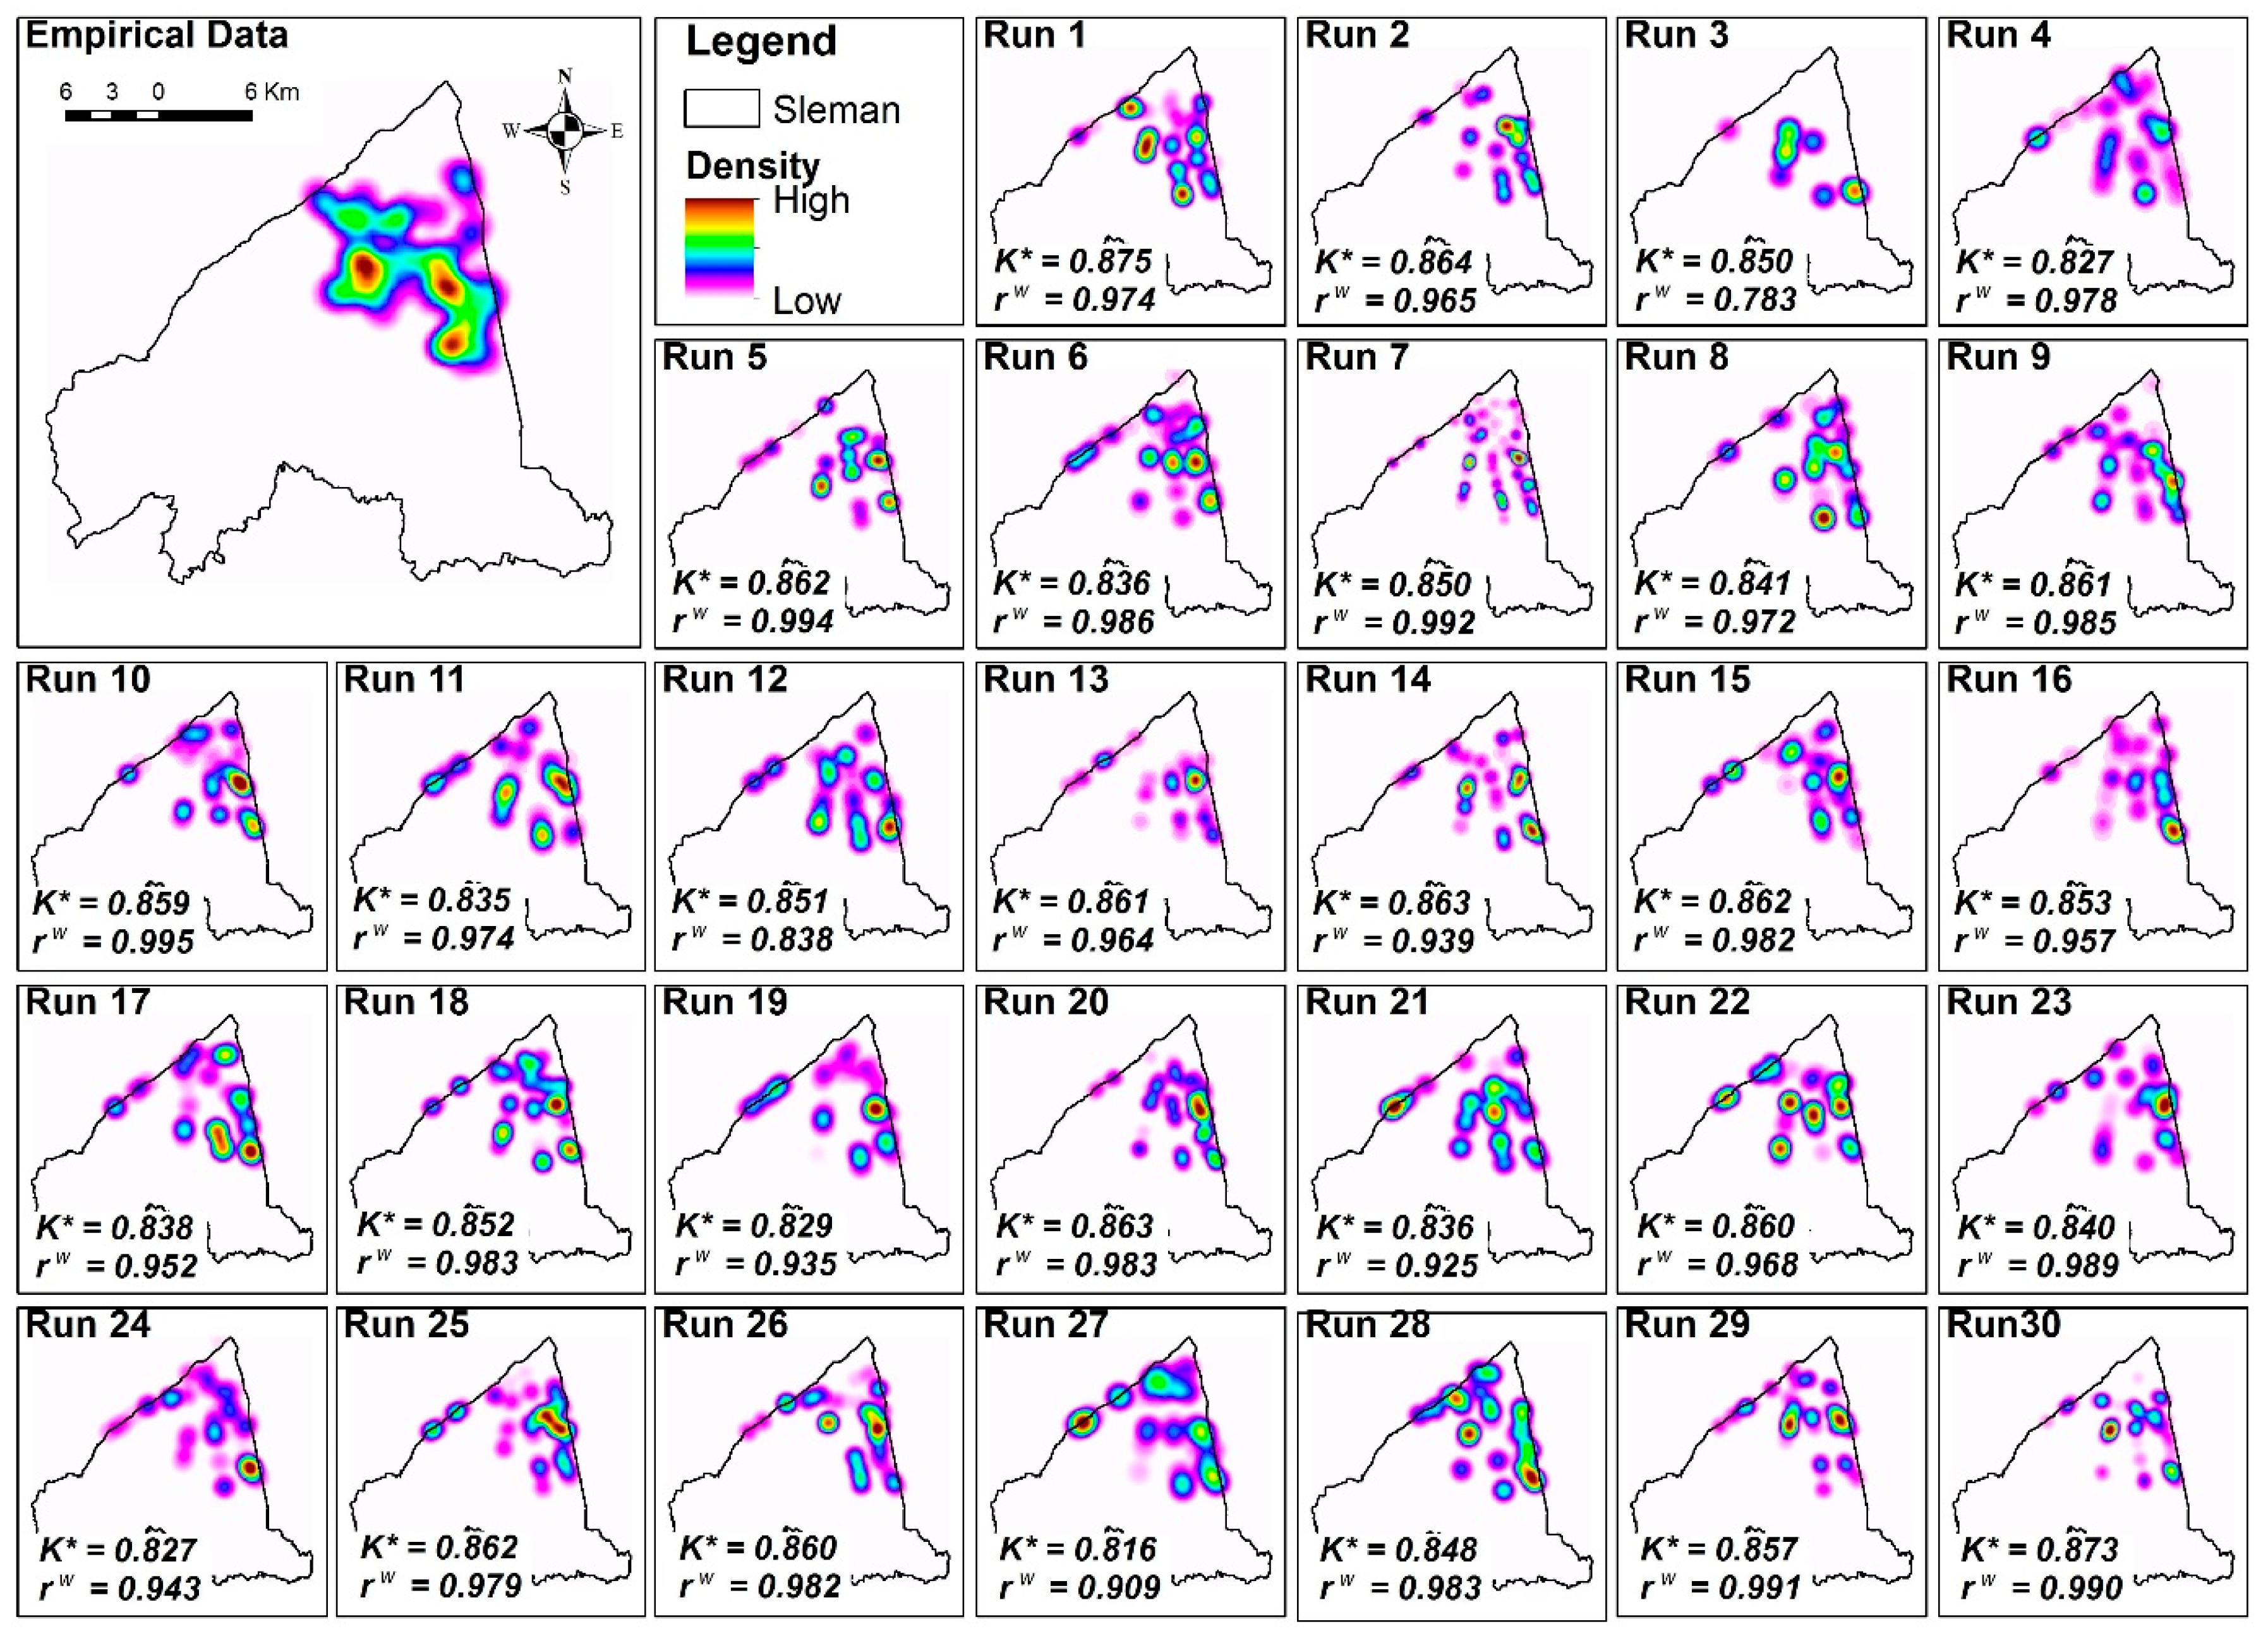
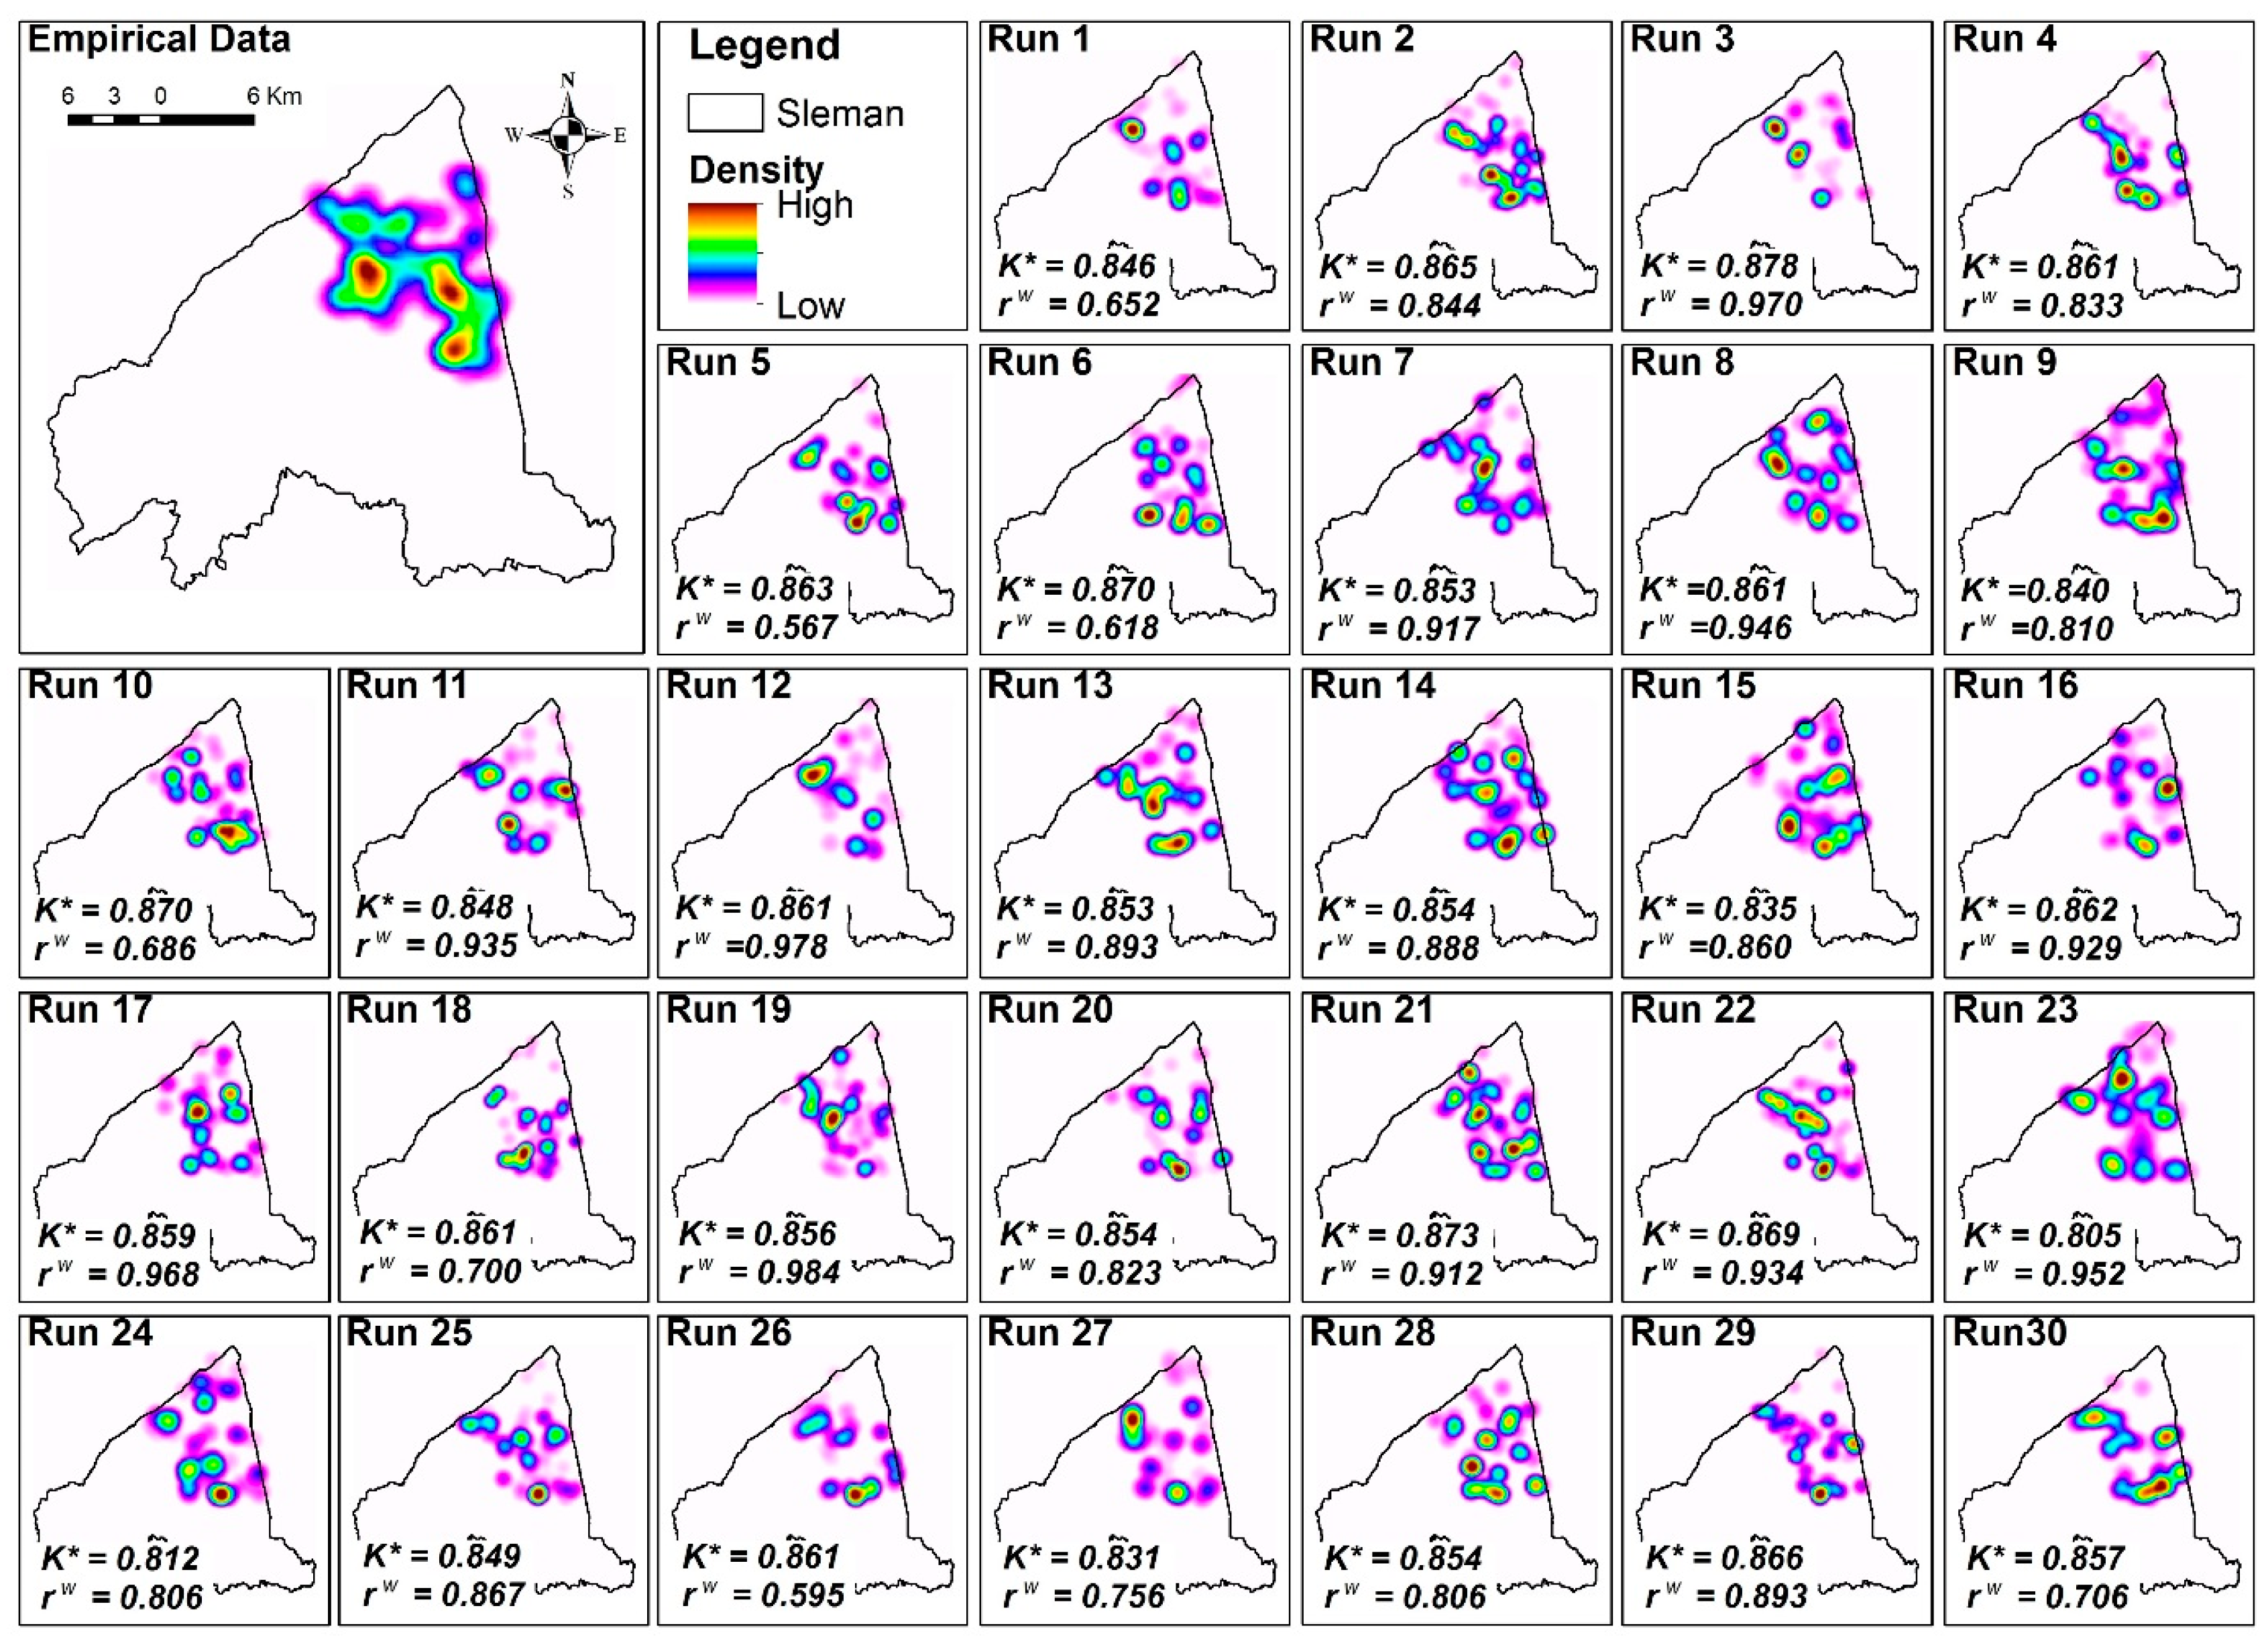
| Map of distribution of reluctant people | Evacuation refusal map [12] | Spatial validation. |
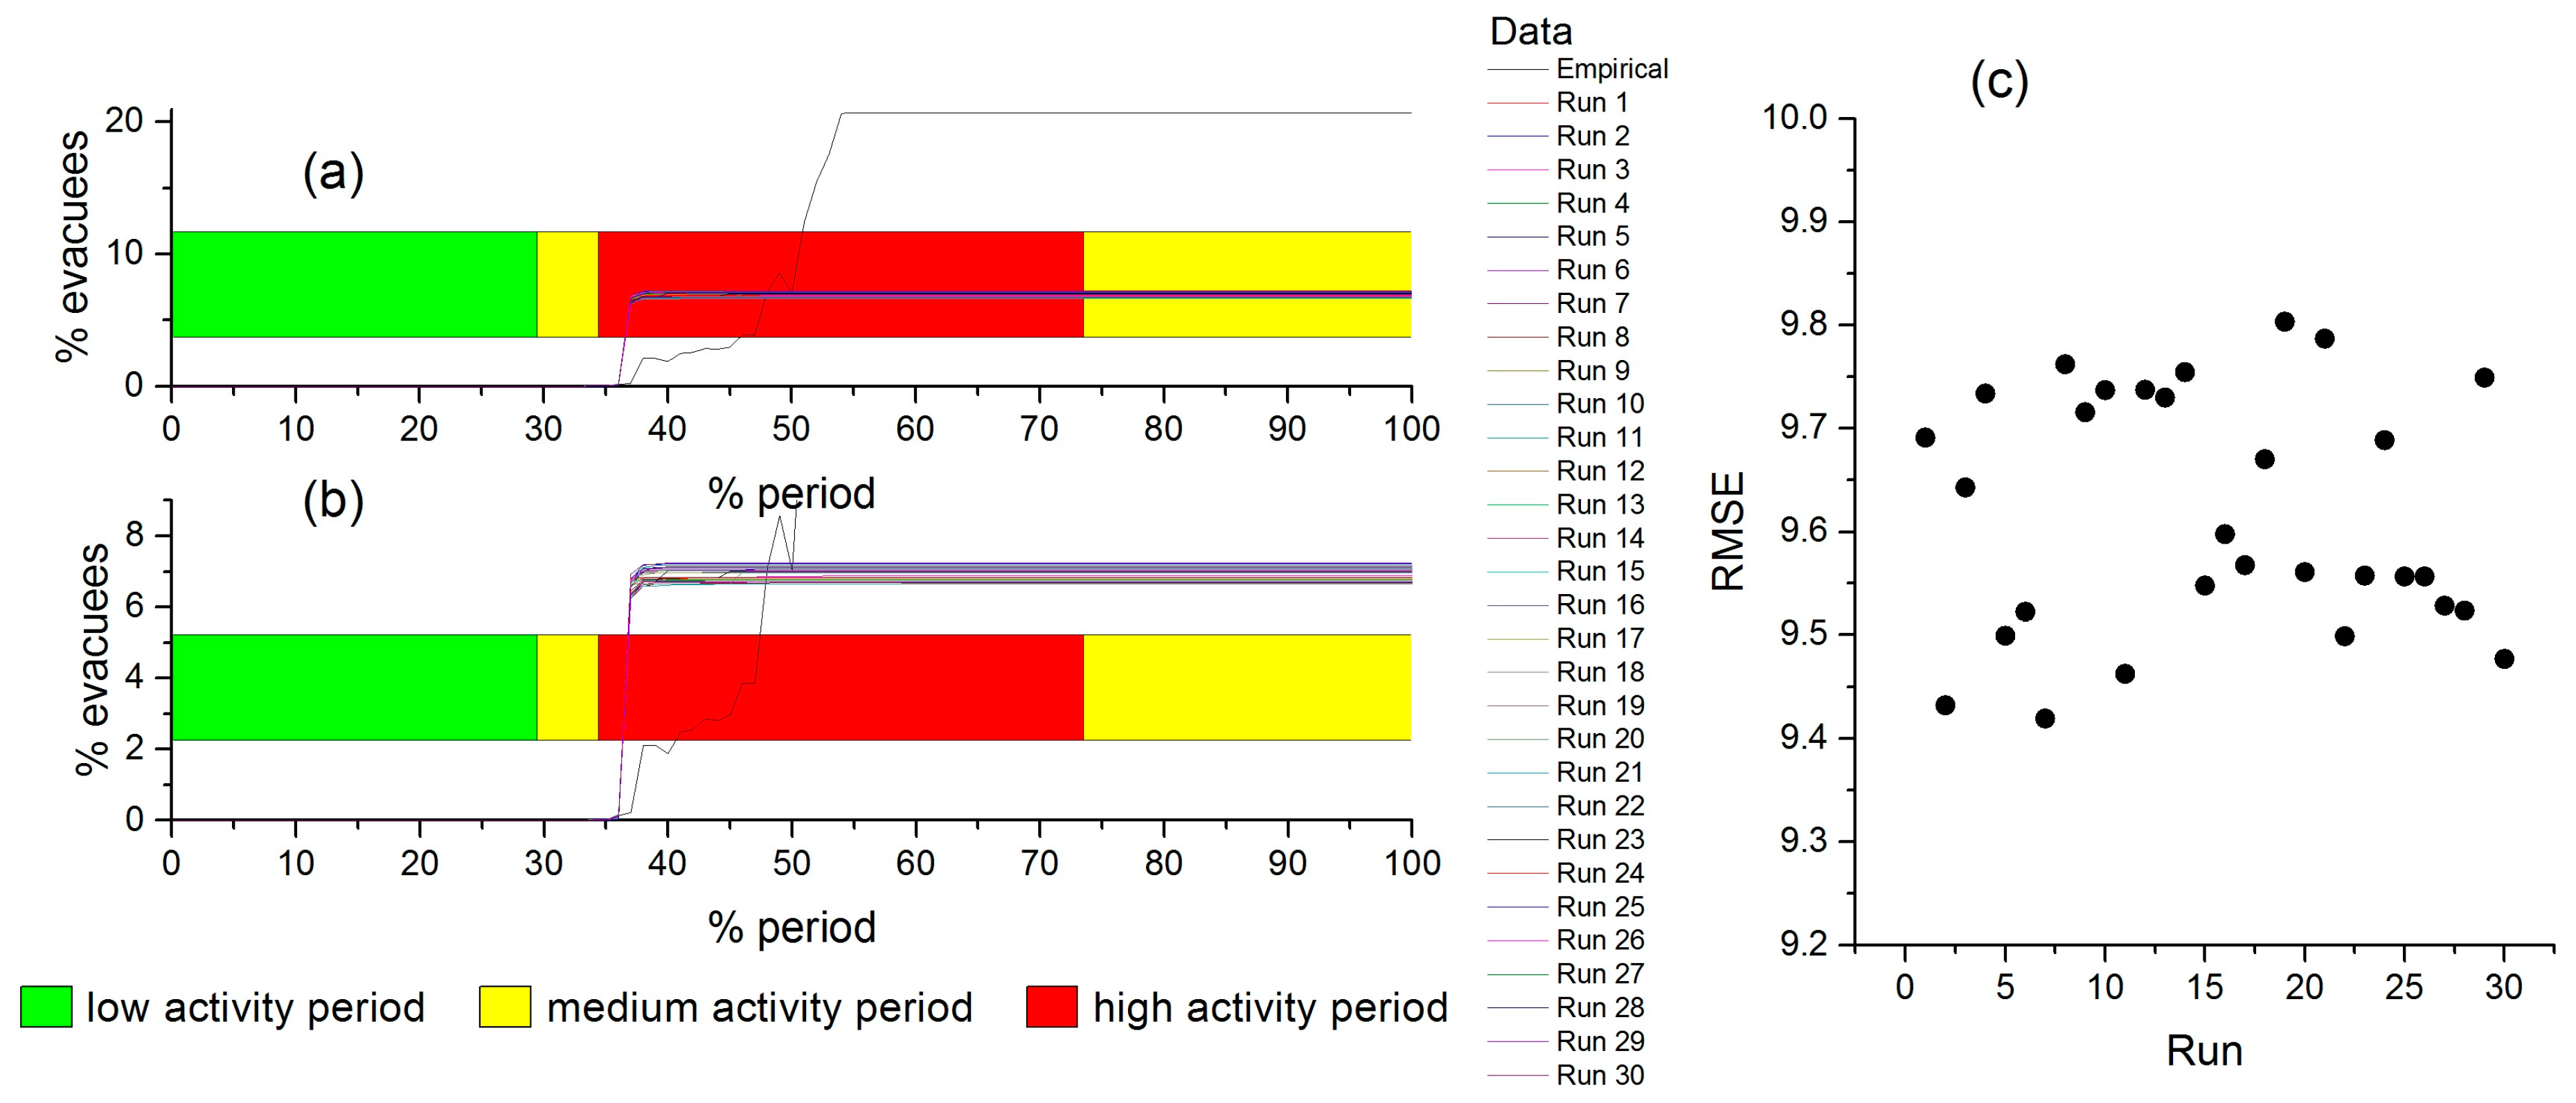
| Series of daily records of evacuees in 2010 eruption | Local Government of Sleman [110] | Temporal validation. |
| Entity | Attribute | Type | Description |
|---|---|---|---|
| People | Disability | Integer | Expresses whether the agent has a disability or not. |
| Experience | Integer | Expresses whether the agent has experienced a previous eruption or not. | |
| Income | Integer | Income class of agent. | |
| PersonalIntension (PI) | Integer | The degree to which people are motivated to evacuate by themselves (taken from the survey). | |
| ProtectProperty (PP) | Integer | The degree to which are people motivated to stay to protect their property (taken from the survey). | |
| SeeTheExplosion (SE) | Boolean | Whether the agent has seen the volcanic eruption or not. | |
| Perception | Integer | This value describes how well the agent perceives the hazard. | |
| CulturalBelief (CB) | Integer | The degree to which people are motivated to stay by their beliefs (estimated from the literature; this is only assigned to aged and poorly educated people). | |
| GovernmentAlert (GA) | Integer | The degree to which people are motivated to evacuate when they receive an alert from the stakeholder (taken from the survey). | |
| FeelingDanger (FD) | Integer | Quantification of feeling in danger. | |
| FeelingSafe (FS) | Integer | Quantification of feeling safe. This will be deduced when FD increases. | |
| NotKnowingTheDestination (ND) | Integer | The degree to which people are motivated to stay because they do not know where to go (taken from the survey). | |
| TransportConcern (TC) | Integer | The degree to which people are motivated to stay because they have a problem with transportation (taken from the survey). | |
| SocialInfluence (SI) | Integer | The degree to which people are motivated to evacuate by their social relation decisions (taken from the survey). |
| Entity | Attribute | Initial Value | Unit | Changing Mechanism | Source |
|---|---|---|---|---|---|
| Volcano | Latitude | −7.541 | Degree | Fixed | [102] |
| Longitude | 110.446 | Degree | Fixed | [102] | |
| ActivityLength | 104 | Days | [76] | ||
| ActivityLevel | 0 | - | [76] | ||
| VEI | 4 | - | Fixed | [102] | |
| Stakeholder | AlertLevel | 1 | - | Changed by changing ActivityLevel | [76] |
| People | Age | Based on custom probability | Years | Fixed | Dataset [103] |
| Disability | Based on custom probability | - | Fixed | Dataset [103] | |
| Education | Based on custom probability | - | Fixed | Dataset [103] | |
| Experience | Based on custom probability | - | Fixed | Survey Data | |
| HouseHoldID | From Simulation | - | Fixed | Simulation | |
| Income | Based on custom probability | - | Fixed | Dataset [103] | |
| DistrictID | From simulation | - | Fixed | Simulation | |
| Sex | Based on custom probability | - | Fixed | Dataset [103] | |
| Latitude | From simulation | Degree | Changed by movement | Simulation | |
| Longitude | From simulation | Degree | Changed by movement | Simulation | |
| HomeLatitude | From simulation | Degree | Fixed | Simulation | |
| HomeLongitude | From simulation | Degree | Fixed | Simulation | |
| MovementSpeed | 30–40 | km/h | Fixed | [113] | |
| PersonalIntension (PI) | 1–5 | Fixed | |||
| ProtectProperty (PP) | 1–5 | - | Fixed | Simulation | |
| SeeTheExplosion (SE) | 0 | - | Changed by the volcano activity | Simulation | |
| Perception | 1–5 | - | Fixed | Simulation | |
| CulturalBelief (CB) | 0–5 | - | Fixed | Simulation | |
| GovernmentAlert (GA) | 0 | - | Changed when alert received | Simulation | |
| FeelingDanger (FD) | 0 | - | Changed by the volcano activity and the hazard zone | Simulation | |
| FeelingSafe (FS) | 5 | - | Changed when FD changes | Simulation | |
| NotKnowTheDestination (ND) | 1–5 | - | Fixed | Simulation | |
| TransportConcern (TC) | 1–5 | - | Fixed | Simulation | |
| SocialInfluence (SI) | 0 | - | Changed when receiving alert by social network | Simulation |
| VEI | 1 | 2 | 3 | 4 | ||||||||||
|---|---|---|---|---|---|---|---|---|---|---|---|---|---|---|
| Hazard Zone | L | M | H | L | M | H | L | M | H | L | M | H | ||
| VAL | ||||||||||||||
| III (H) | L | M | M | L | M | M | M | H | H | M | H | H | ||
| II (M) | L | M | M | L | M | M | M | M | H | M | M | H | ||
| I (L) | L | L | M | L | L | M | L | M | M | L | M | M | ||
| VAL | Definition | Volcanic Activity | Evacuation Alert |
|---|---|---|---|
| I | Normal activity | No indication of activity change, either visual likelihood or seismicity level. | No Evacuation alert |
| II (Low) | On guard | Indications of activity are increasing, either from visual likelihood on the crater, or seismicity level. | No Evacuation alert |
| III (Medium) | Prepare | Seismic activity is increasing intensely, with obvious visual changes on the crater. | Prepare to Evacuate |
| IV (High) | Beware | About to erupt. | Evacuate |
| District | Population Mean Centre | Number of Households | Number of Simulated Households | Estimated Level of Simulated Population | |
|---|---|---|---|---|---|
| Longitude | Latitude | ||||
| Berbah | 110.448997 | −7.802559 | 18,927 | 473 | 1892 |
| Cangkringan | 110.456001 | −7.649149 | 9187 | 230 | 920 |
| Depok | 110.400001 | −7.773849 | 47,228 | 1181 | 4724 |
| Gamping | 110.334999 | −7.78209 | 31,724 | 793 | 3172 |
| Godean | 110.301002 | −7.77015 | 24,619 | 615 | 2460 |
| Kalasan | 110.467002 | −7.74484 | 25,277 | 632 | 2528 |
| Minggir | 110.238998 | −7.73681 | 13,432 | 336 | 1344 |
| Mlati | 110.361 | −7.75394 | 34,703 | 868 | 3472 |
| Moyudan | 110.239997 | −7.772729 | 11,677 | 292 | 1168 |
| Ngaglik | 110.378997 | −7.743549 | 39,991 | 1000 | 4000 |
| Ngemplak | 110.430999 | −7.71747 | 20,906 | 523 | 2092 |
| Pakem | 110.410003 | −7.653709 | 12,585 | 315 | 1260 |
| Prambanan | 110.496002 | −7.787529 | 28,141 | 704 | 2816 |
| Seyegan | 110.299003 | −7.72833 | 17,278 | 432 | 1728 |
| Sleman | 110.347999 | −7.70054 | 23,814 | 595 | 2,380 |
| Tempel | 110.317001 | −7.670989 | 19,977 | 499 | 1,996 |
| Turi | 110.376998 | −7.63426 | 1164 | 29 | 116 |
| 380,630 | 9517 | 38,068 | |||
| Scenario | Hazard Model | Weight of Driving Factors to Evacuate (EF) | Weight of Driving Factors to Stay (SF) | ||||||||
|---|---|---|---|---|---|---|---|---|---|---|---|
| FD | PI | GA | SI | SE | PP | ND | TC | FS | CB | ||
| 1 | a | 1 | 1 | 1 | 1 | - | 1 | 1 | 1 | 1 | 1 |
| 2 | b | 1 | 1 | 1 | 1 | 1 | 1 | 1 | 1 | 1 | 1 |
| 3 | b | 1 | 1 | 1 | 1 | 1.5 | 1 | 1 | 1 | 1 | 1 |
© 2018 by the authors. Licensee MDPI, Basel, Switzerland. This article is an open access article distributed under the terms and conditions of the Creative Commons Attribution (CC BY) license (http://creativecommons.org/licenses/by/4.0/).
Share and Cite
Jumadi; Heppenstall, A.J.; Malleson, N.S.; Carver, S.J.; Quincey, D.J.; Manville, V.R. Modelling Individual Evacuation Decisions during Natural Disasters: A Case Study of Volcanic Crisis in Merapi, Indonesia. Geosciences 2018, 8, 196. https://doi.org/10.3390/geosciences8060196
Jumadi, Heppenstall AJ, Malleson NS, Carver SJ, Quincey DJ, Manville VR. Modelling Individual Evacuation Decisions during Natural Disasters: A Case Study of Volcanic Crisis in Merapi, Indonesia. Geosciences. 2018; 8(6):196. https://doi.org/10.3390/geosciences8060196
Chicago/Turabian StyleJumadi, Alison J. Heppenstall, Nick S. Malleson, Steve J. Carver, Duncan J. Quincey, and Vern R. Manville. 2018. "Modelling Individual Evacuation Decisions during Natural Disasters: A Case Study of Volcanic Crisis in Merapi, Indonesia" Geosciences 8, no. 6: 196. https://doi.org/10.3390/geosciences8060196