Assessment of the Performance of Satellite-Based Precipitation Products for Flood Events across Diverse Spatial Scales Using GSSHA Modeling System


Abstract
:1. Introduction
2. Materials and Method
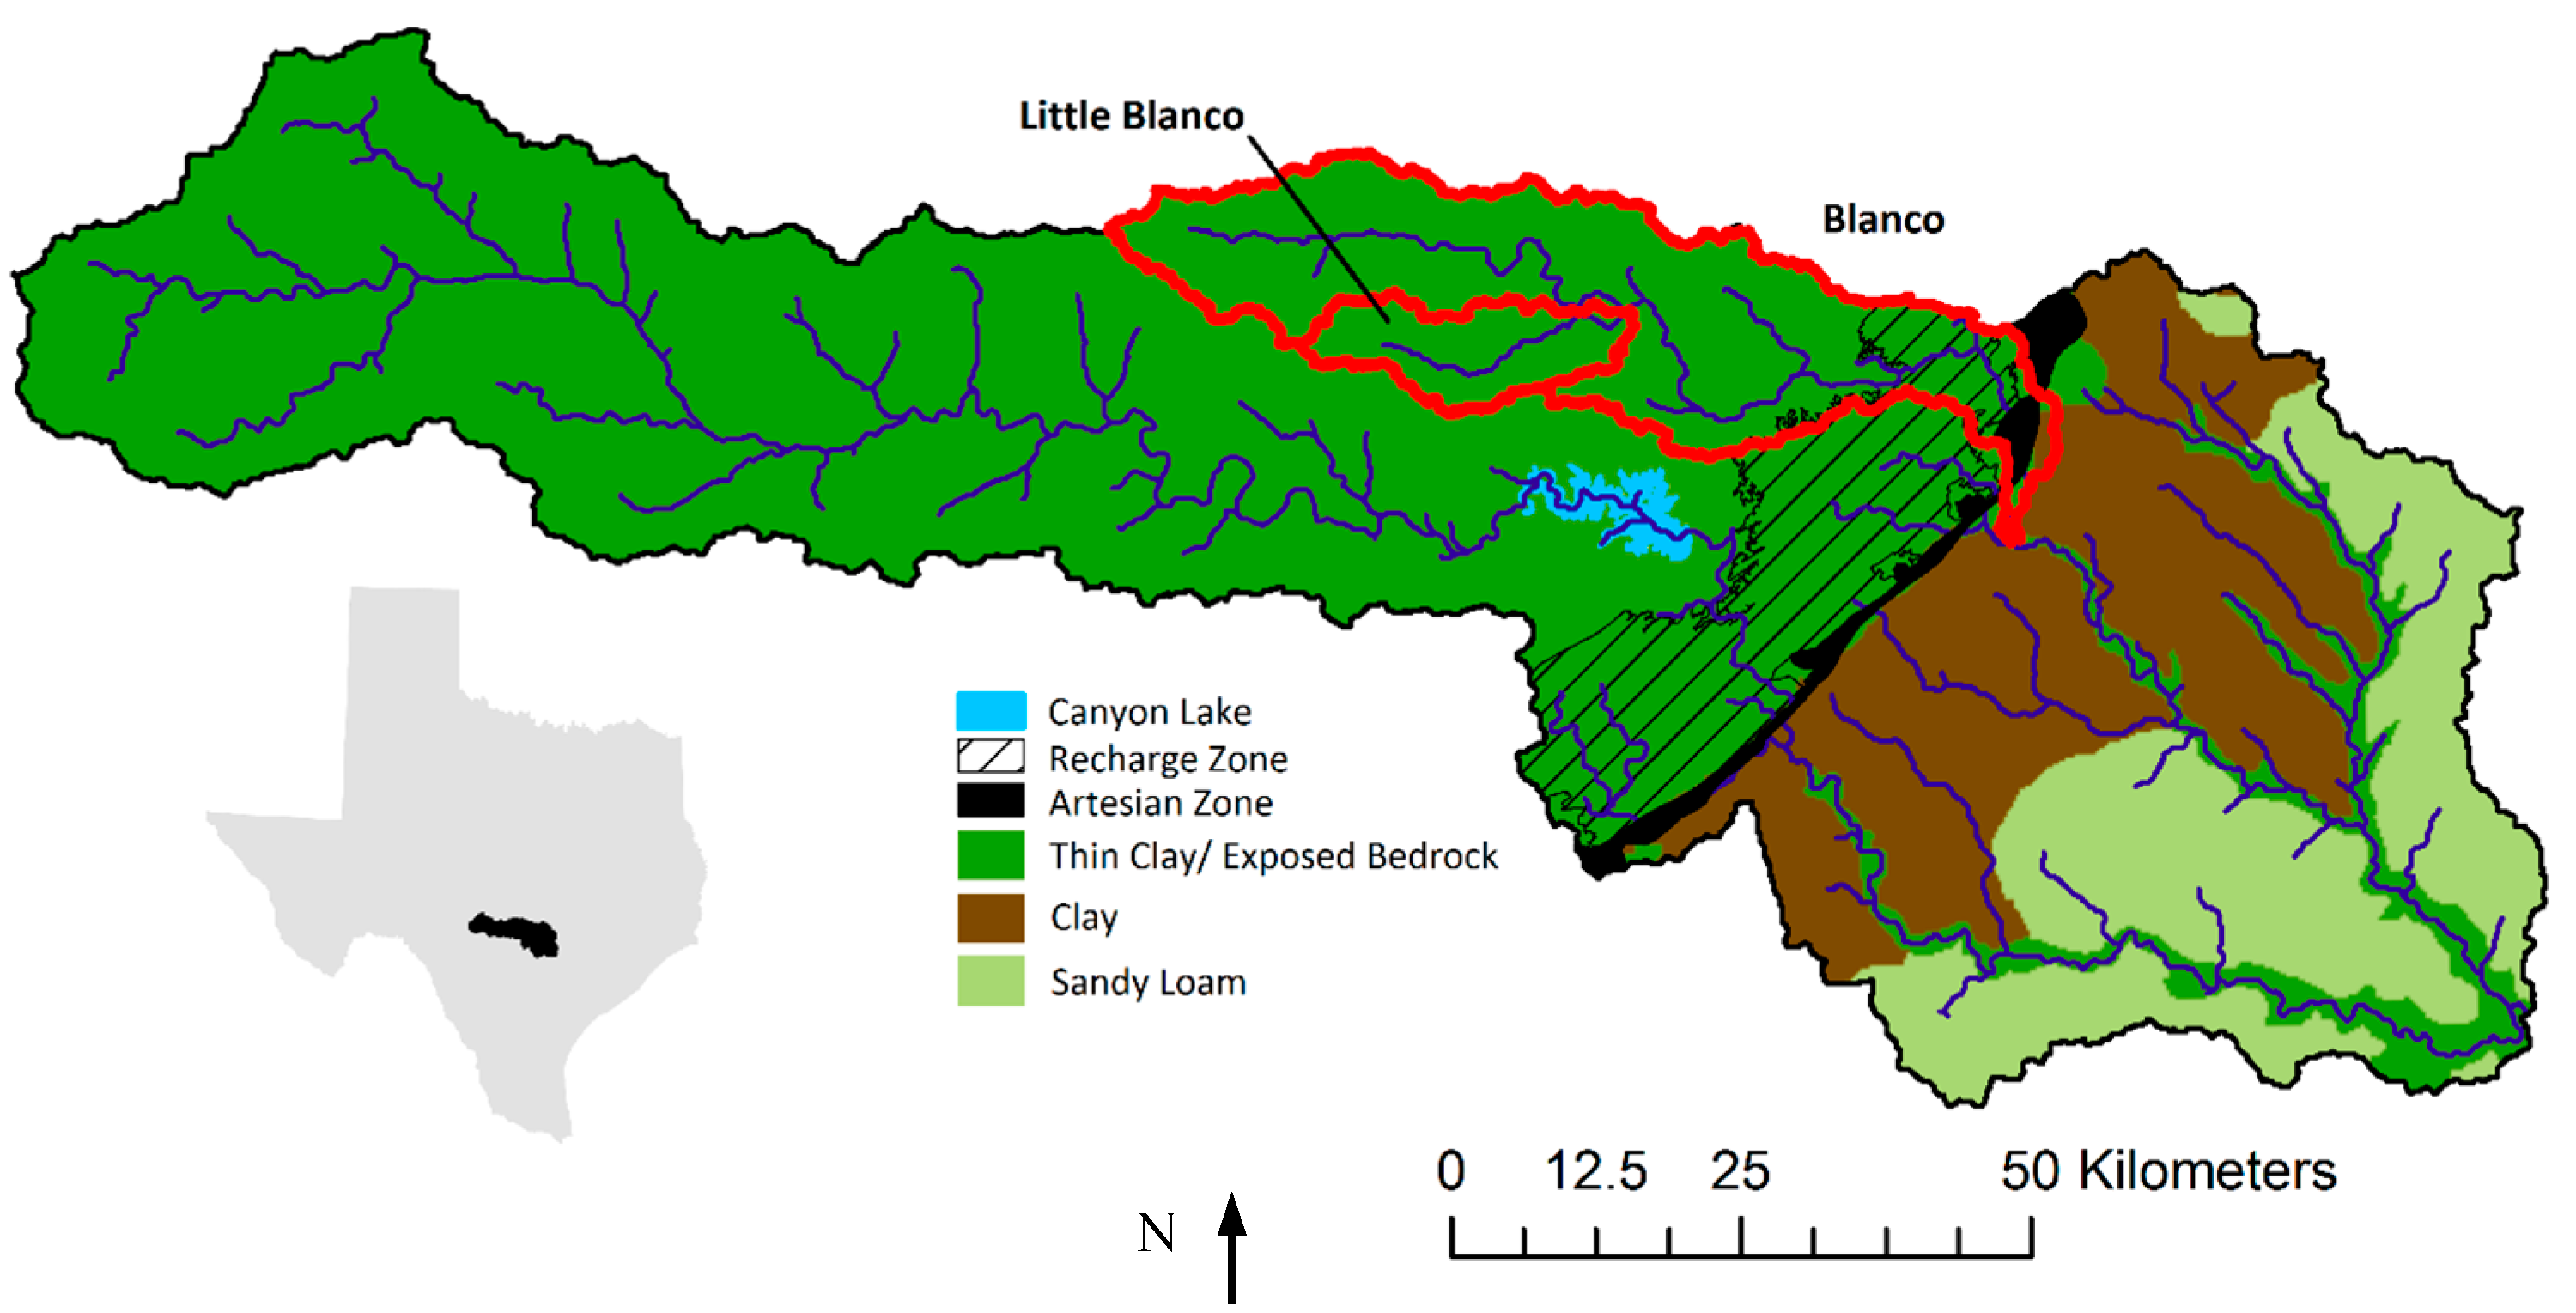
2.1. Watershed
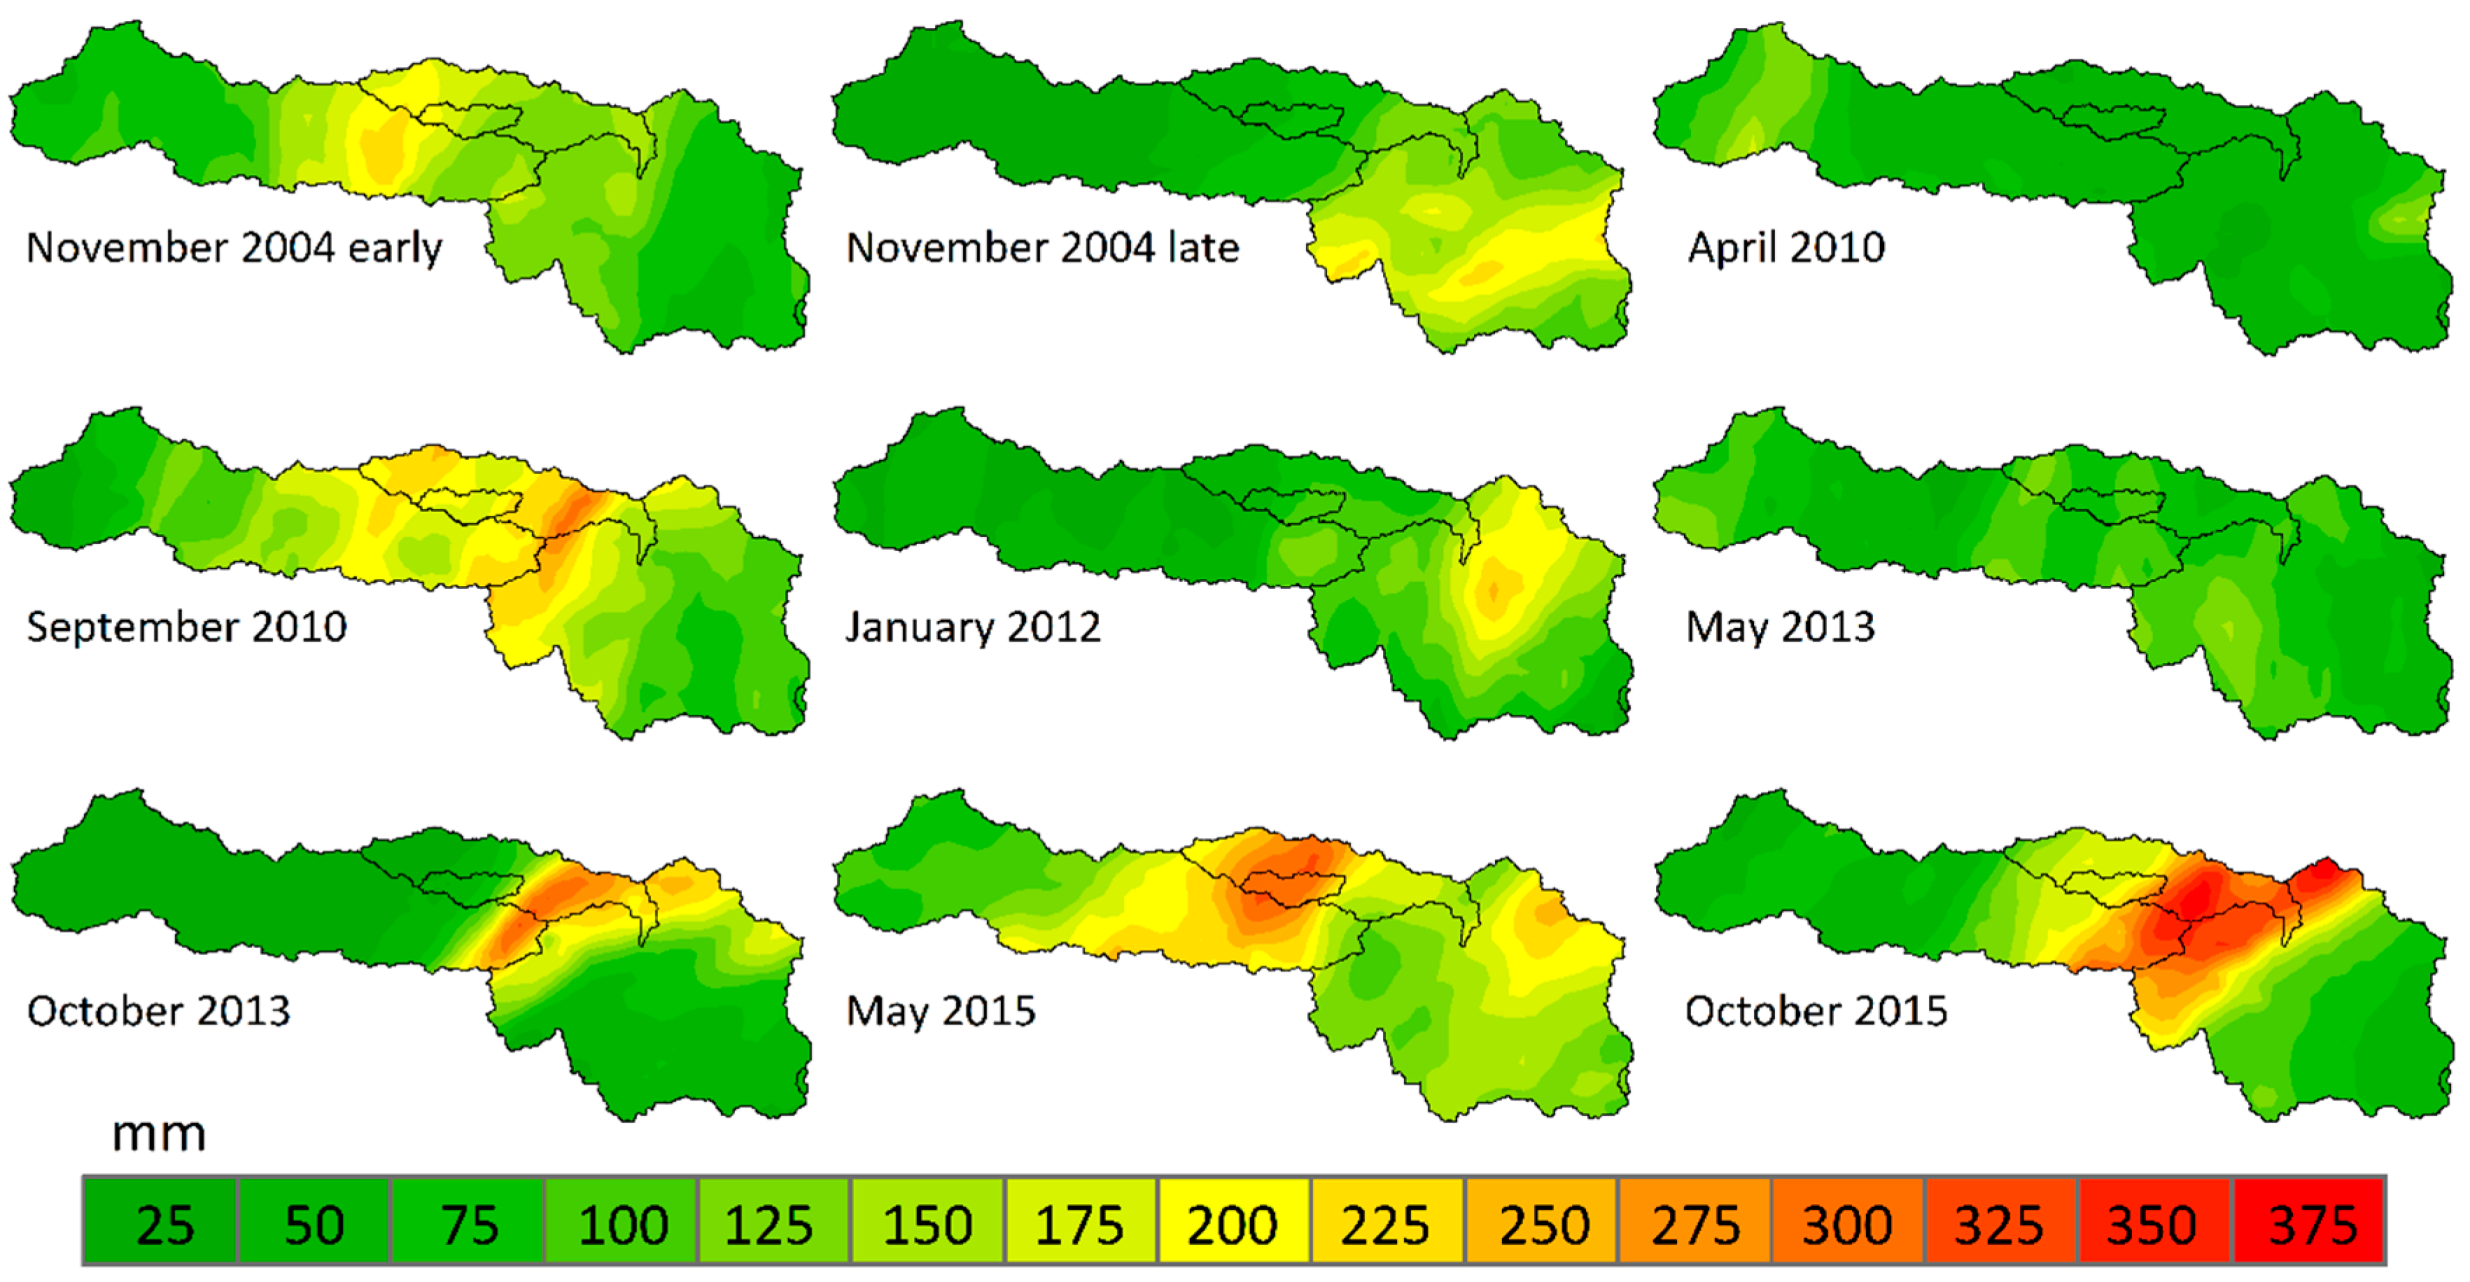
2.2. Storm Events
2.3. Precipitation Datasets
2.3.1. NEXRAD Stage IV
2.3.2. GPM
2.3.3. PERSIANN
2.3.4. CMORPH
2.3.5. TRMM
2.4. Hydrologic Model
2.5. Evaluation Criteria
- is the simulated rainfall (estimated by the product),
- is the estimated rainfall by NEXRAD stage IV,
- is the estimated rainfall by the product/precipitation/simulated peak flow with the product, and
- is the estimated rainfall NEXRAD stage IV/simulated peak flow with NEXRAD stage IV rainfall.
3. Results and Discussion
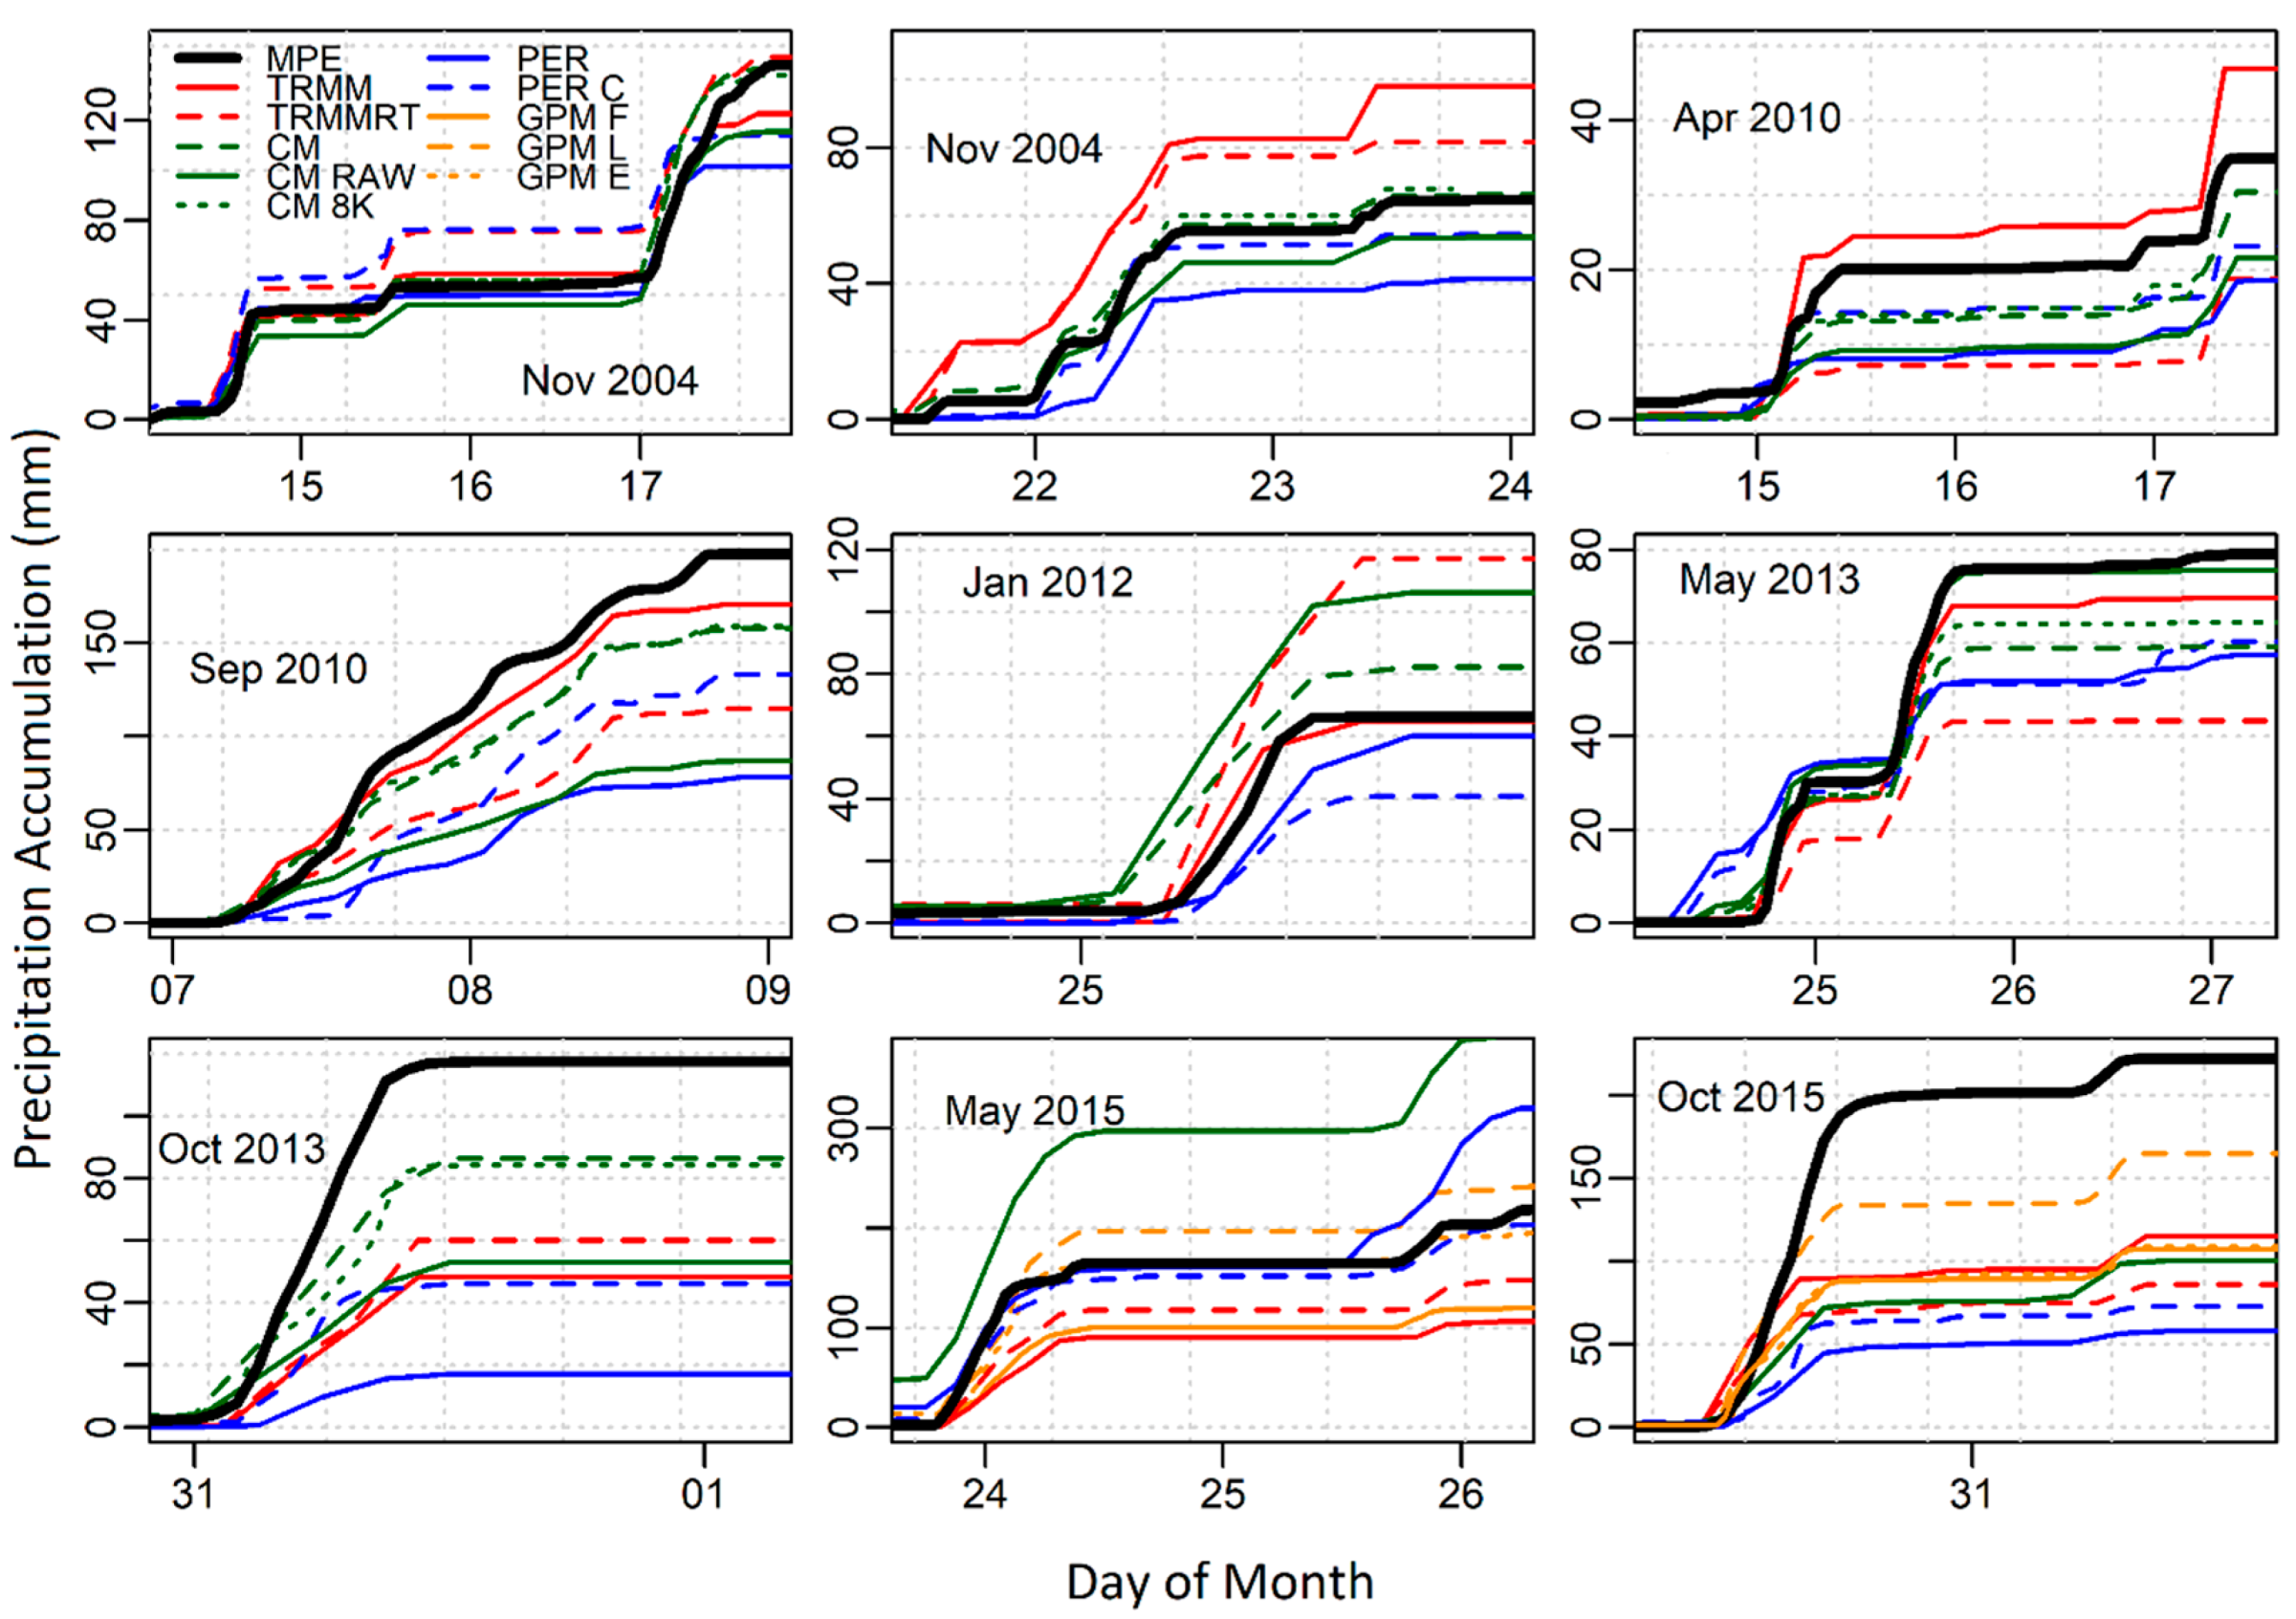
3.1. Precipitation
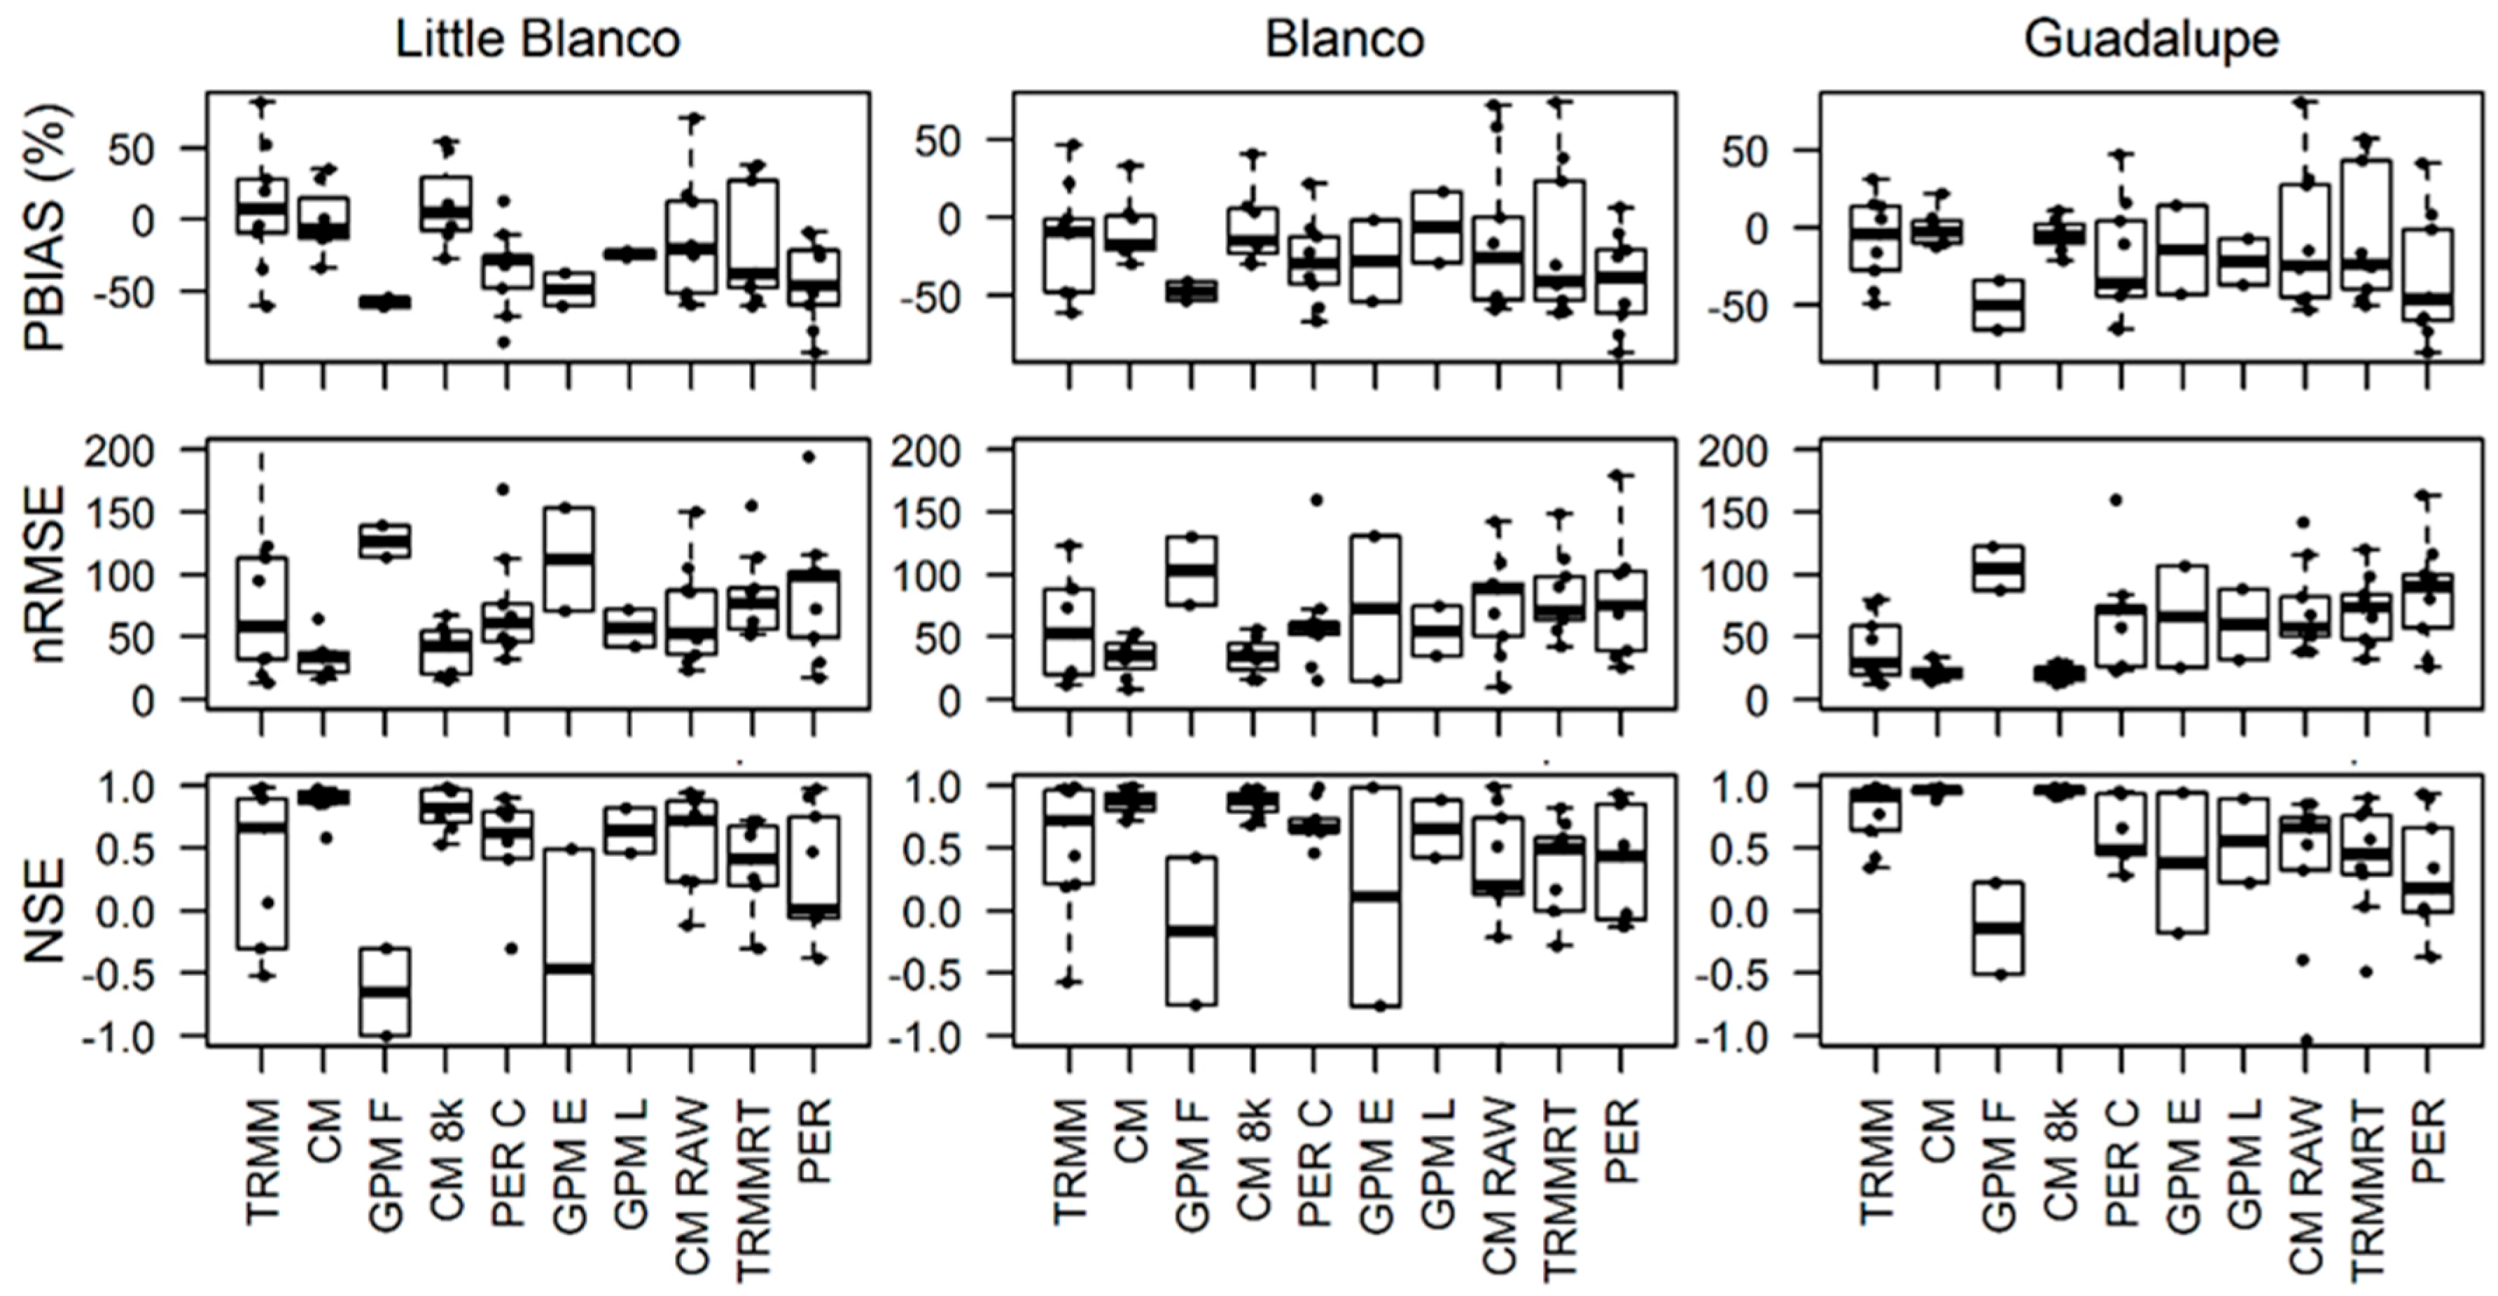
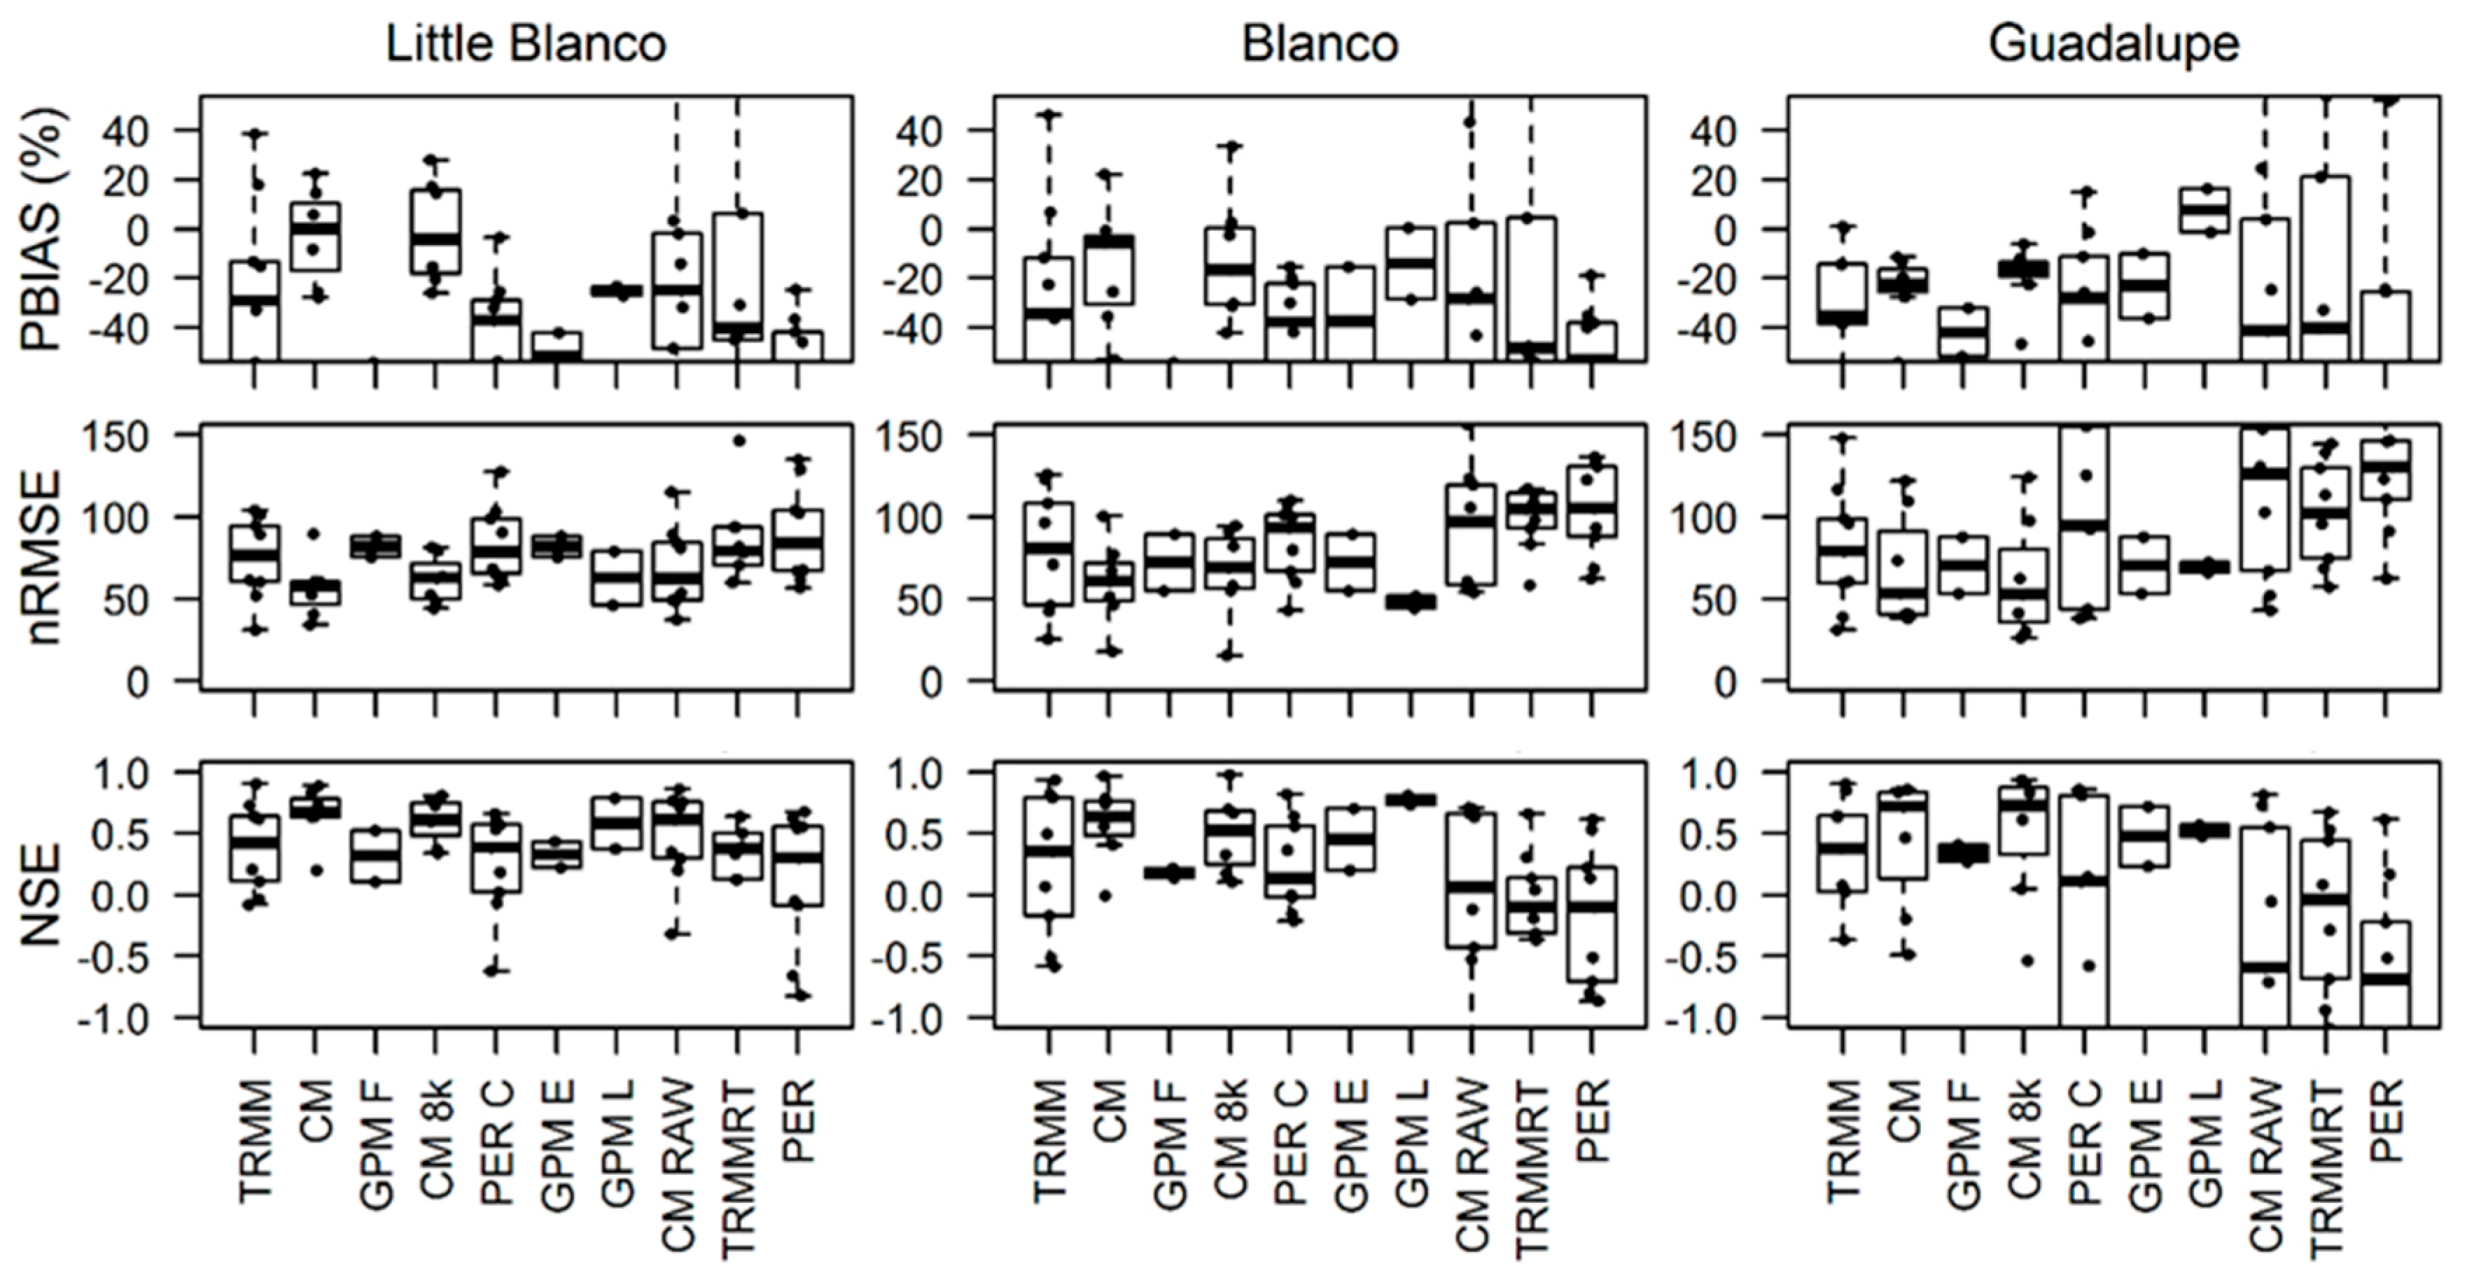
3.2. Impact of Spatial Resolution
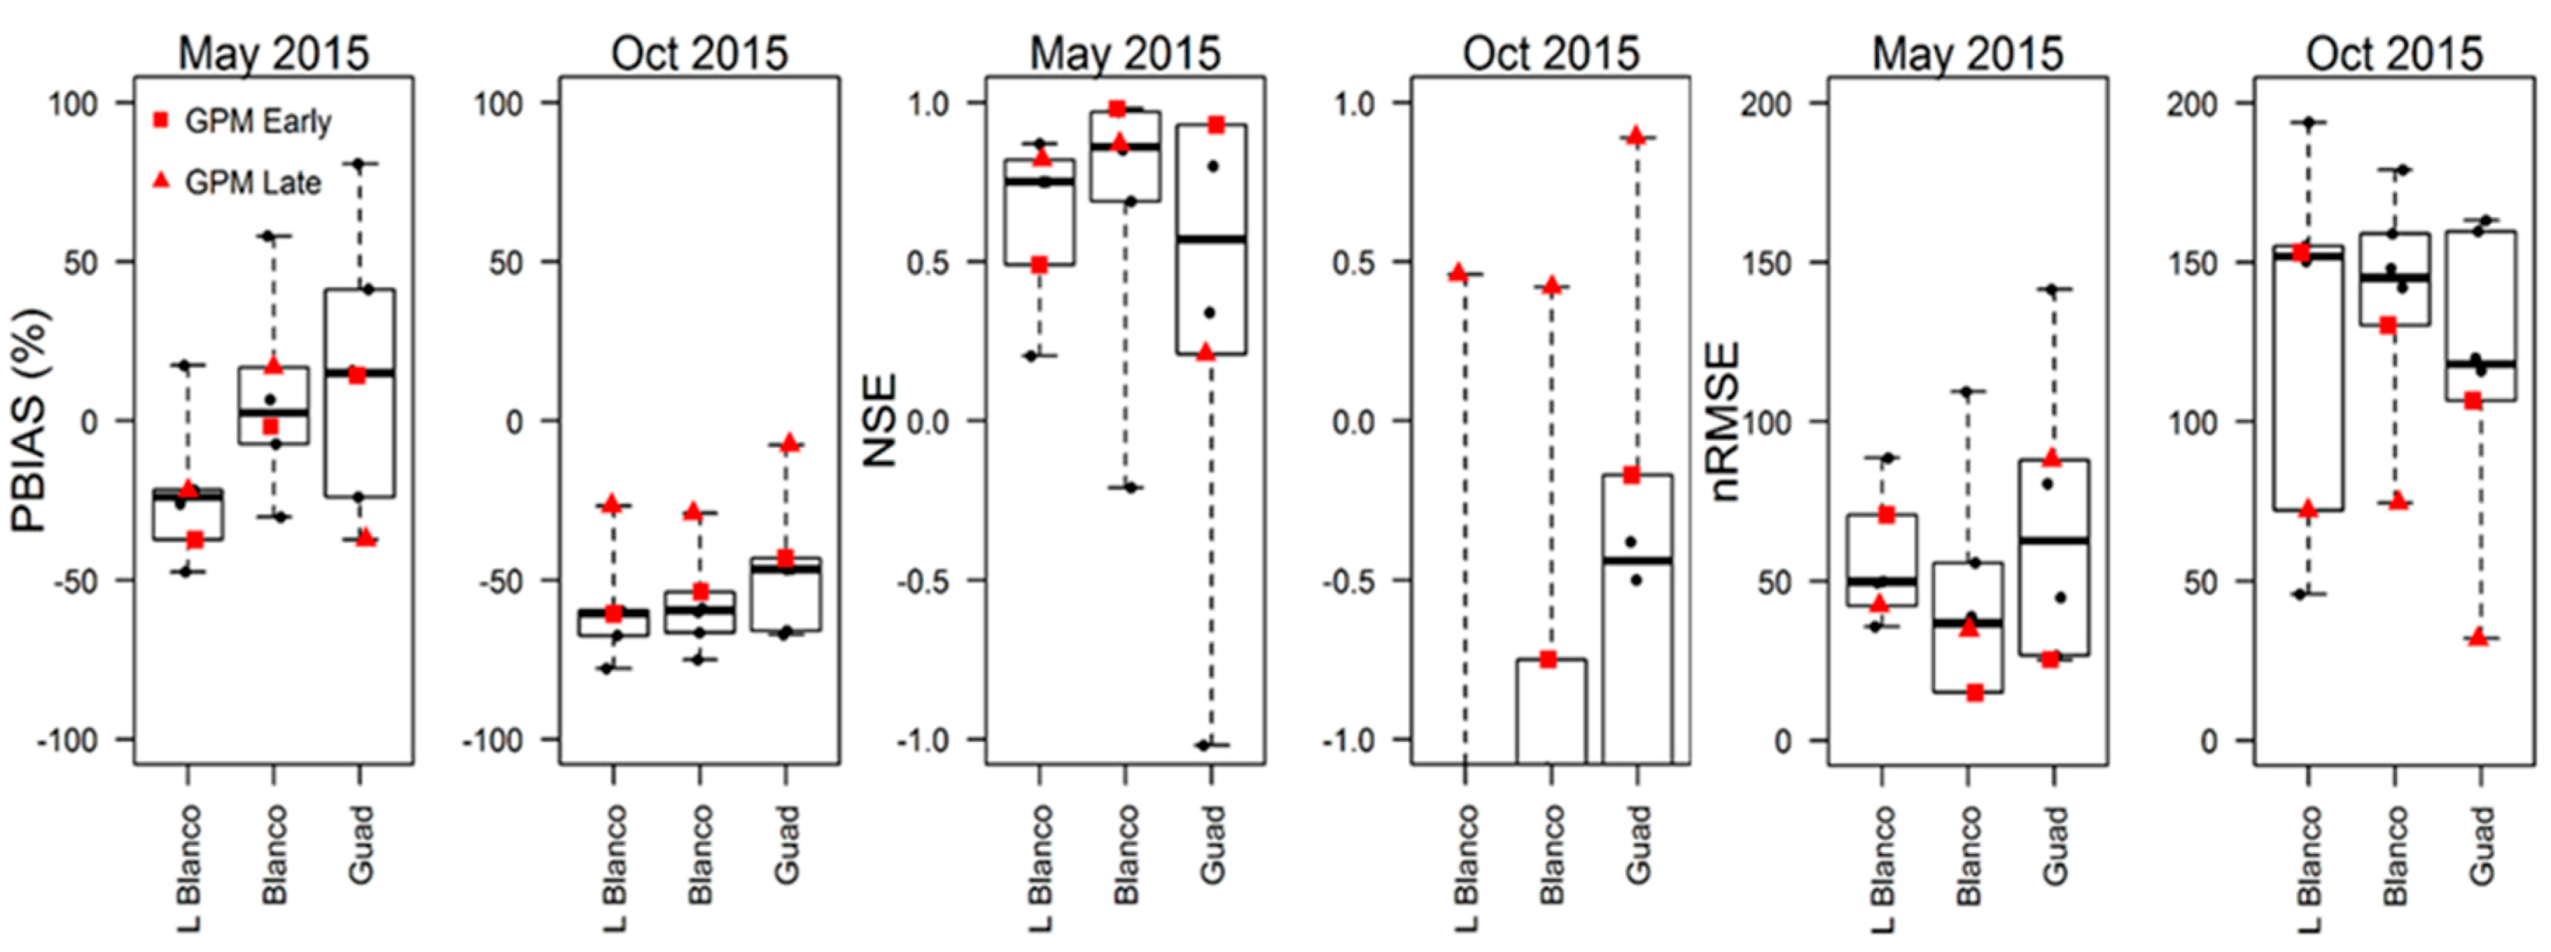
3.3. GPM Rainfall Events
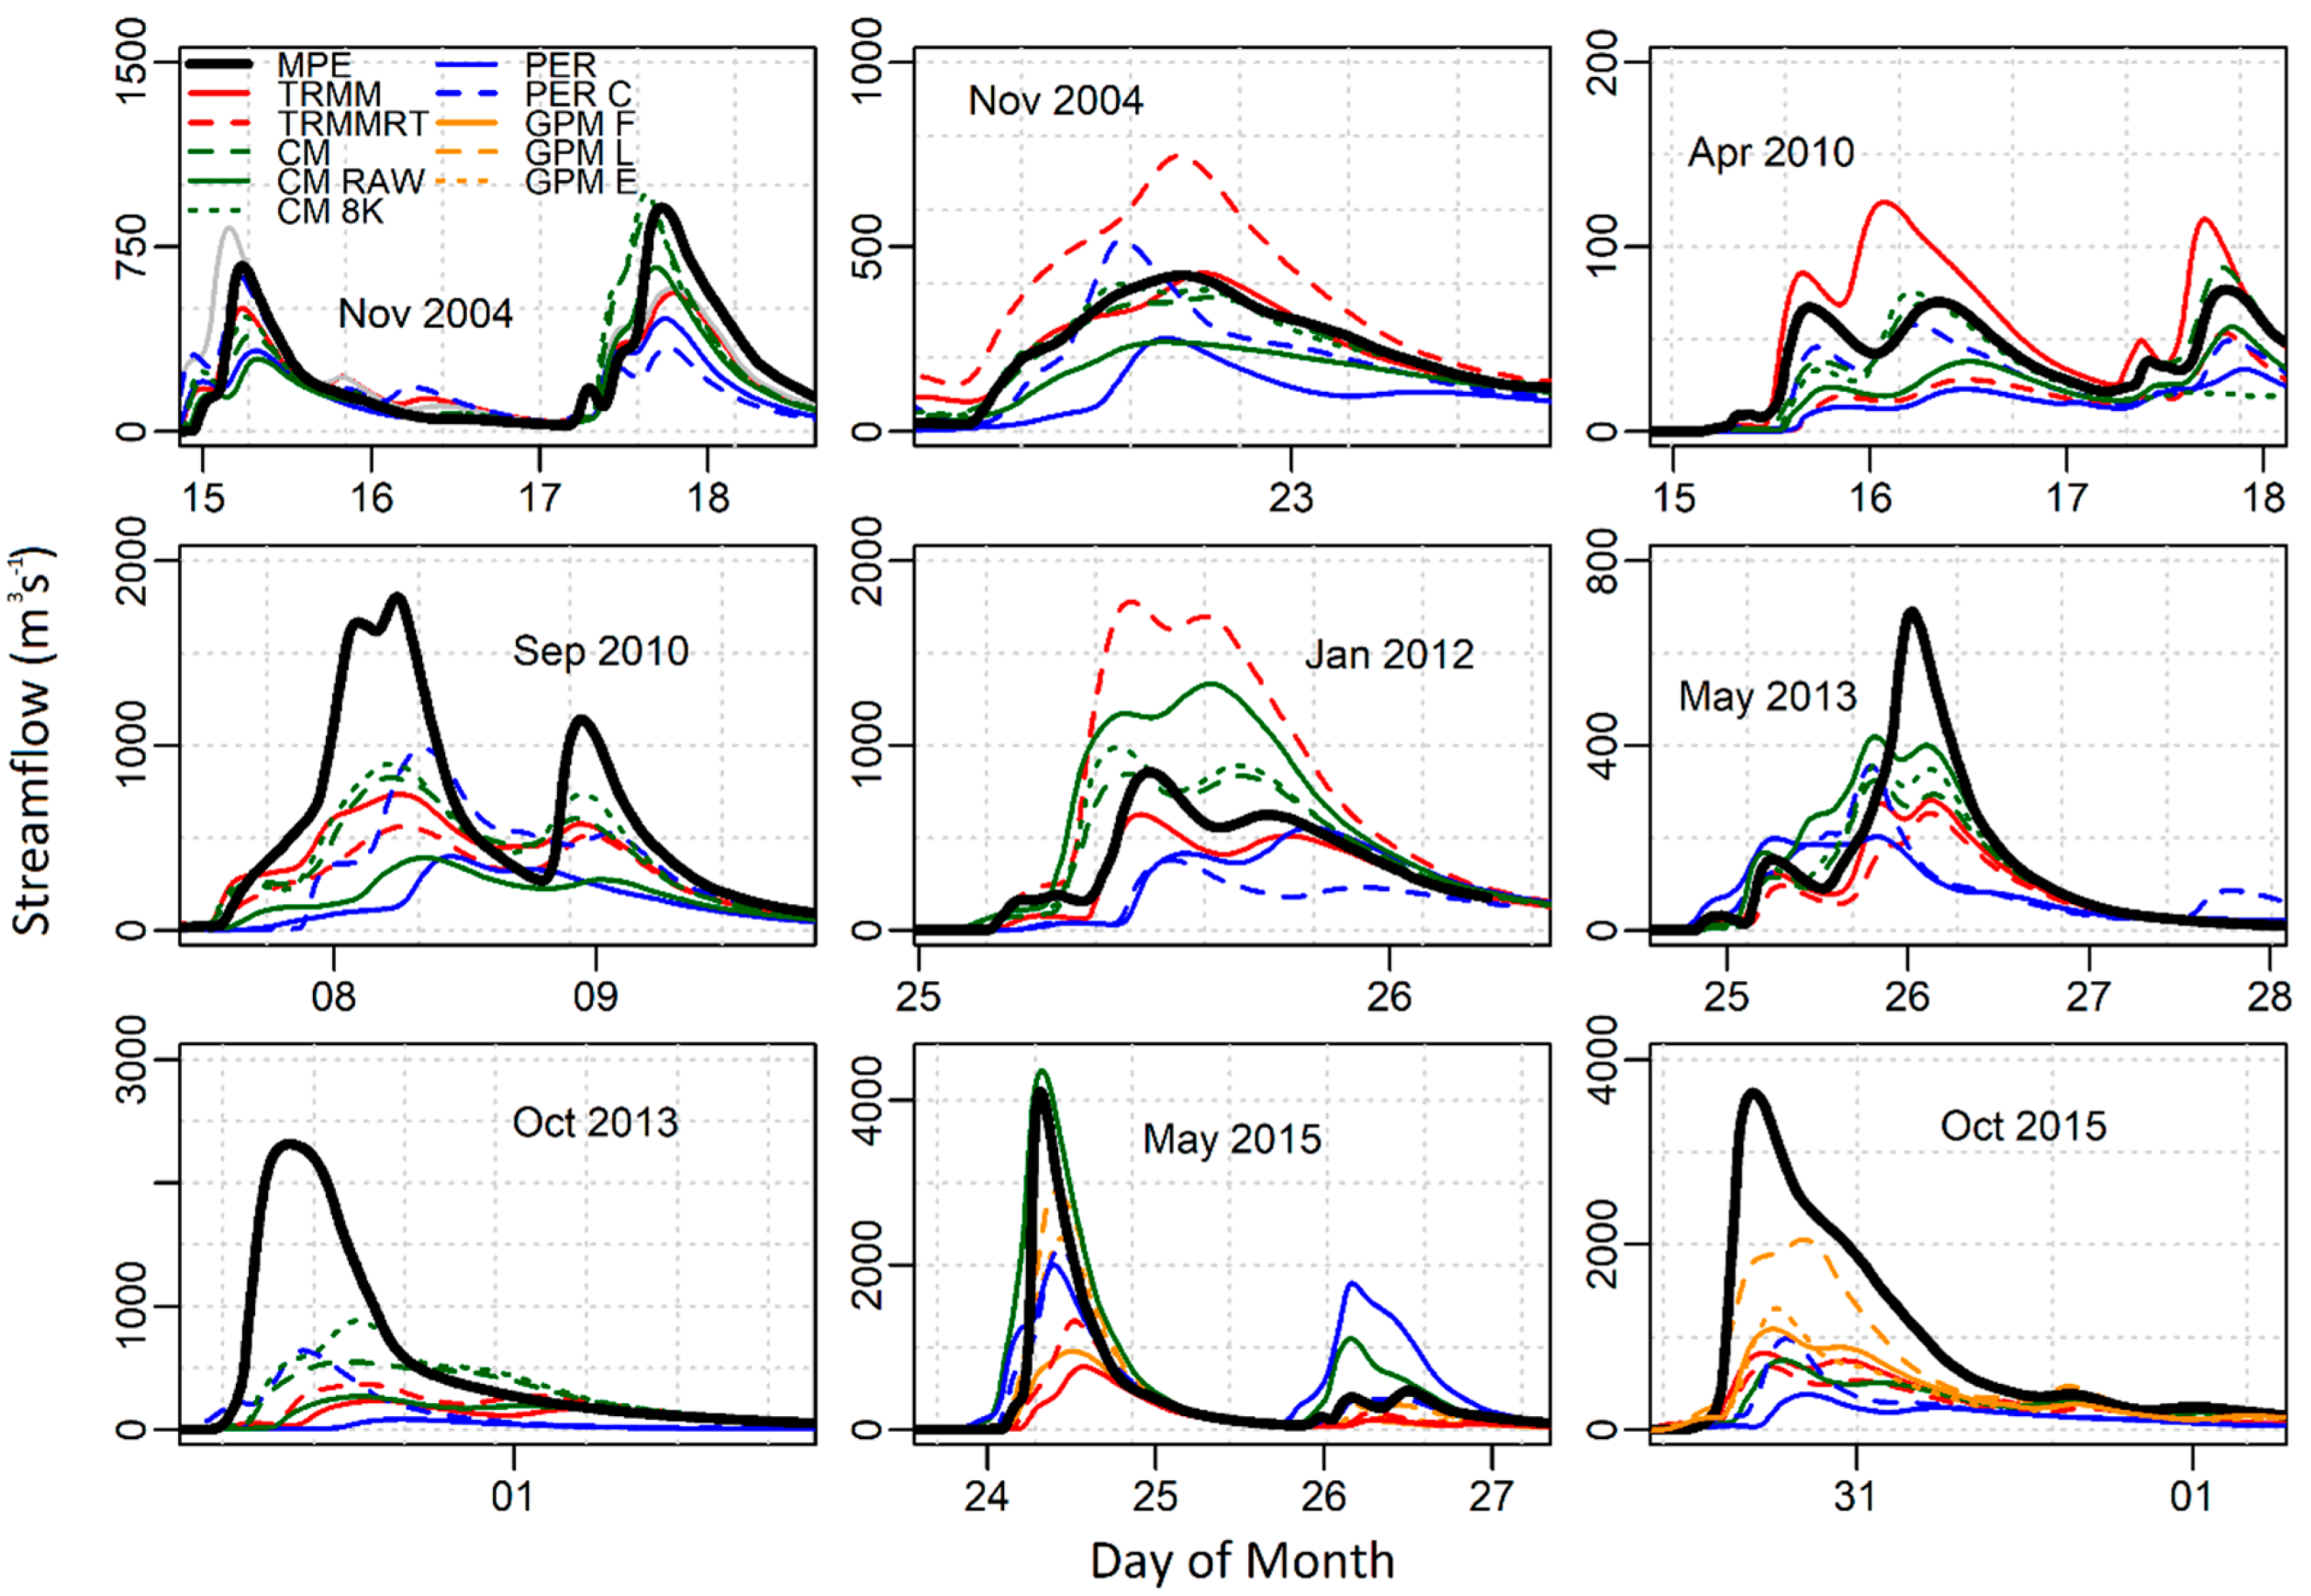
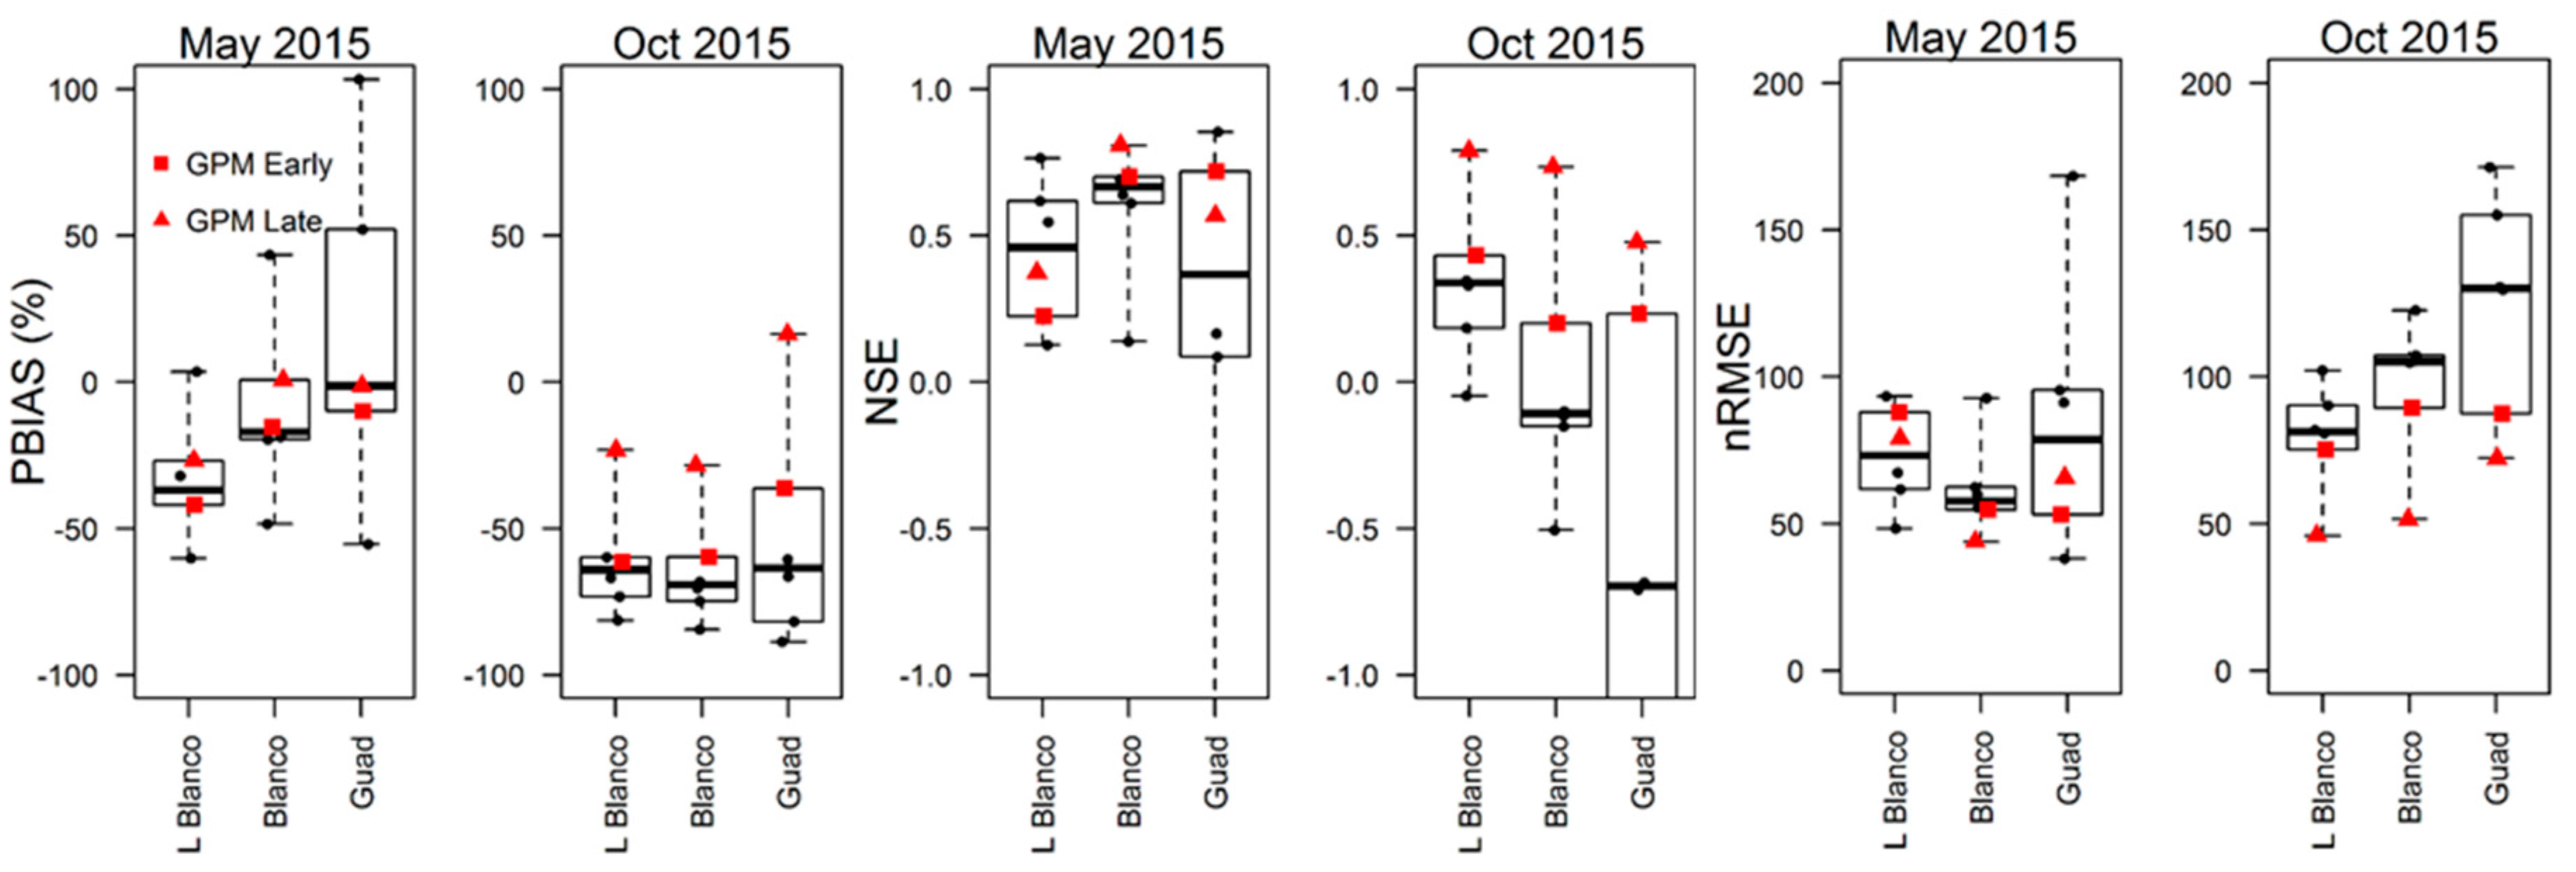
3.4. GPM Model Simulations
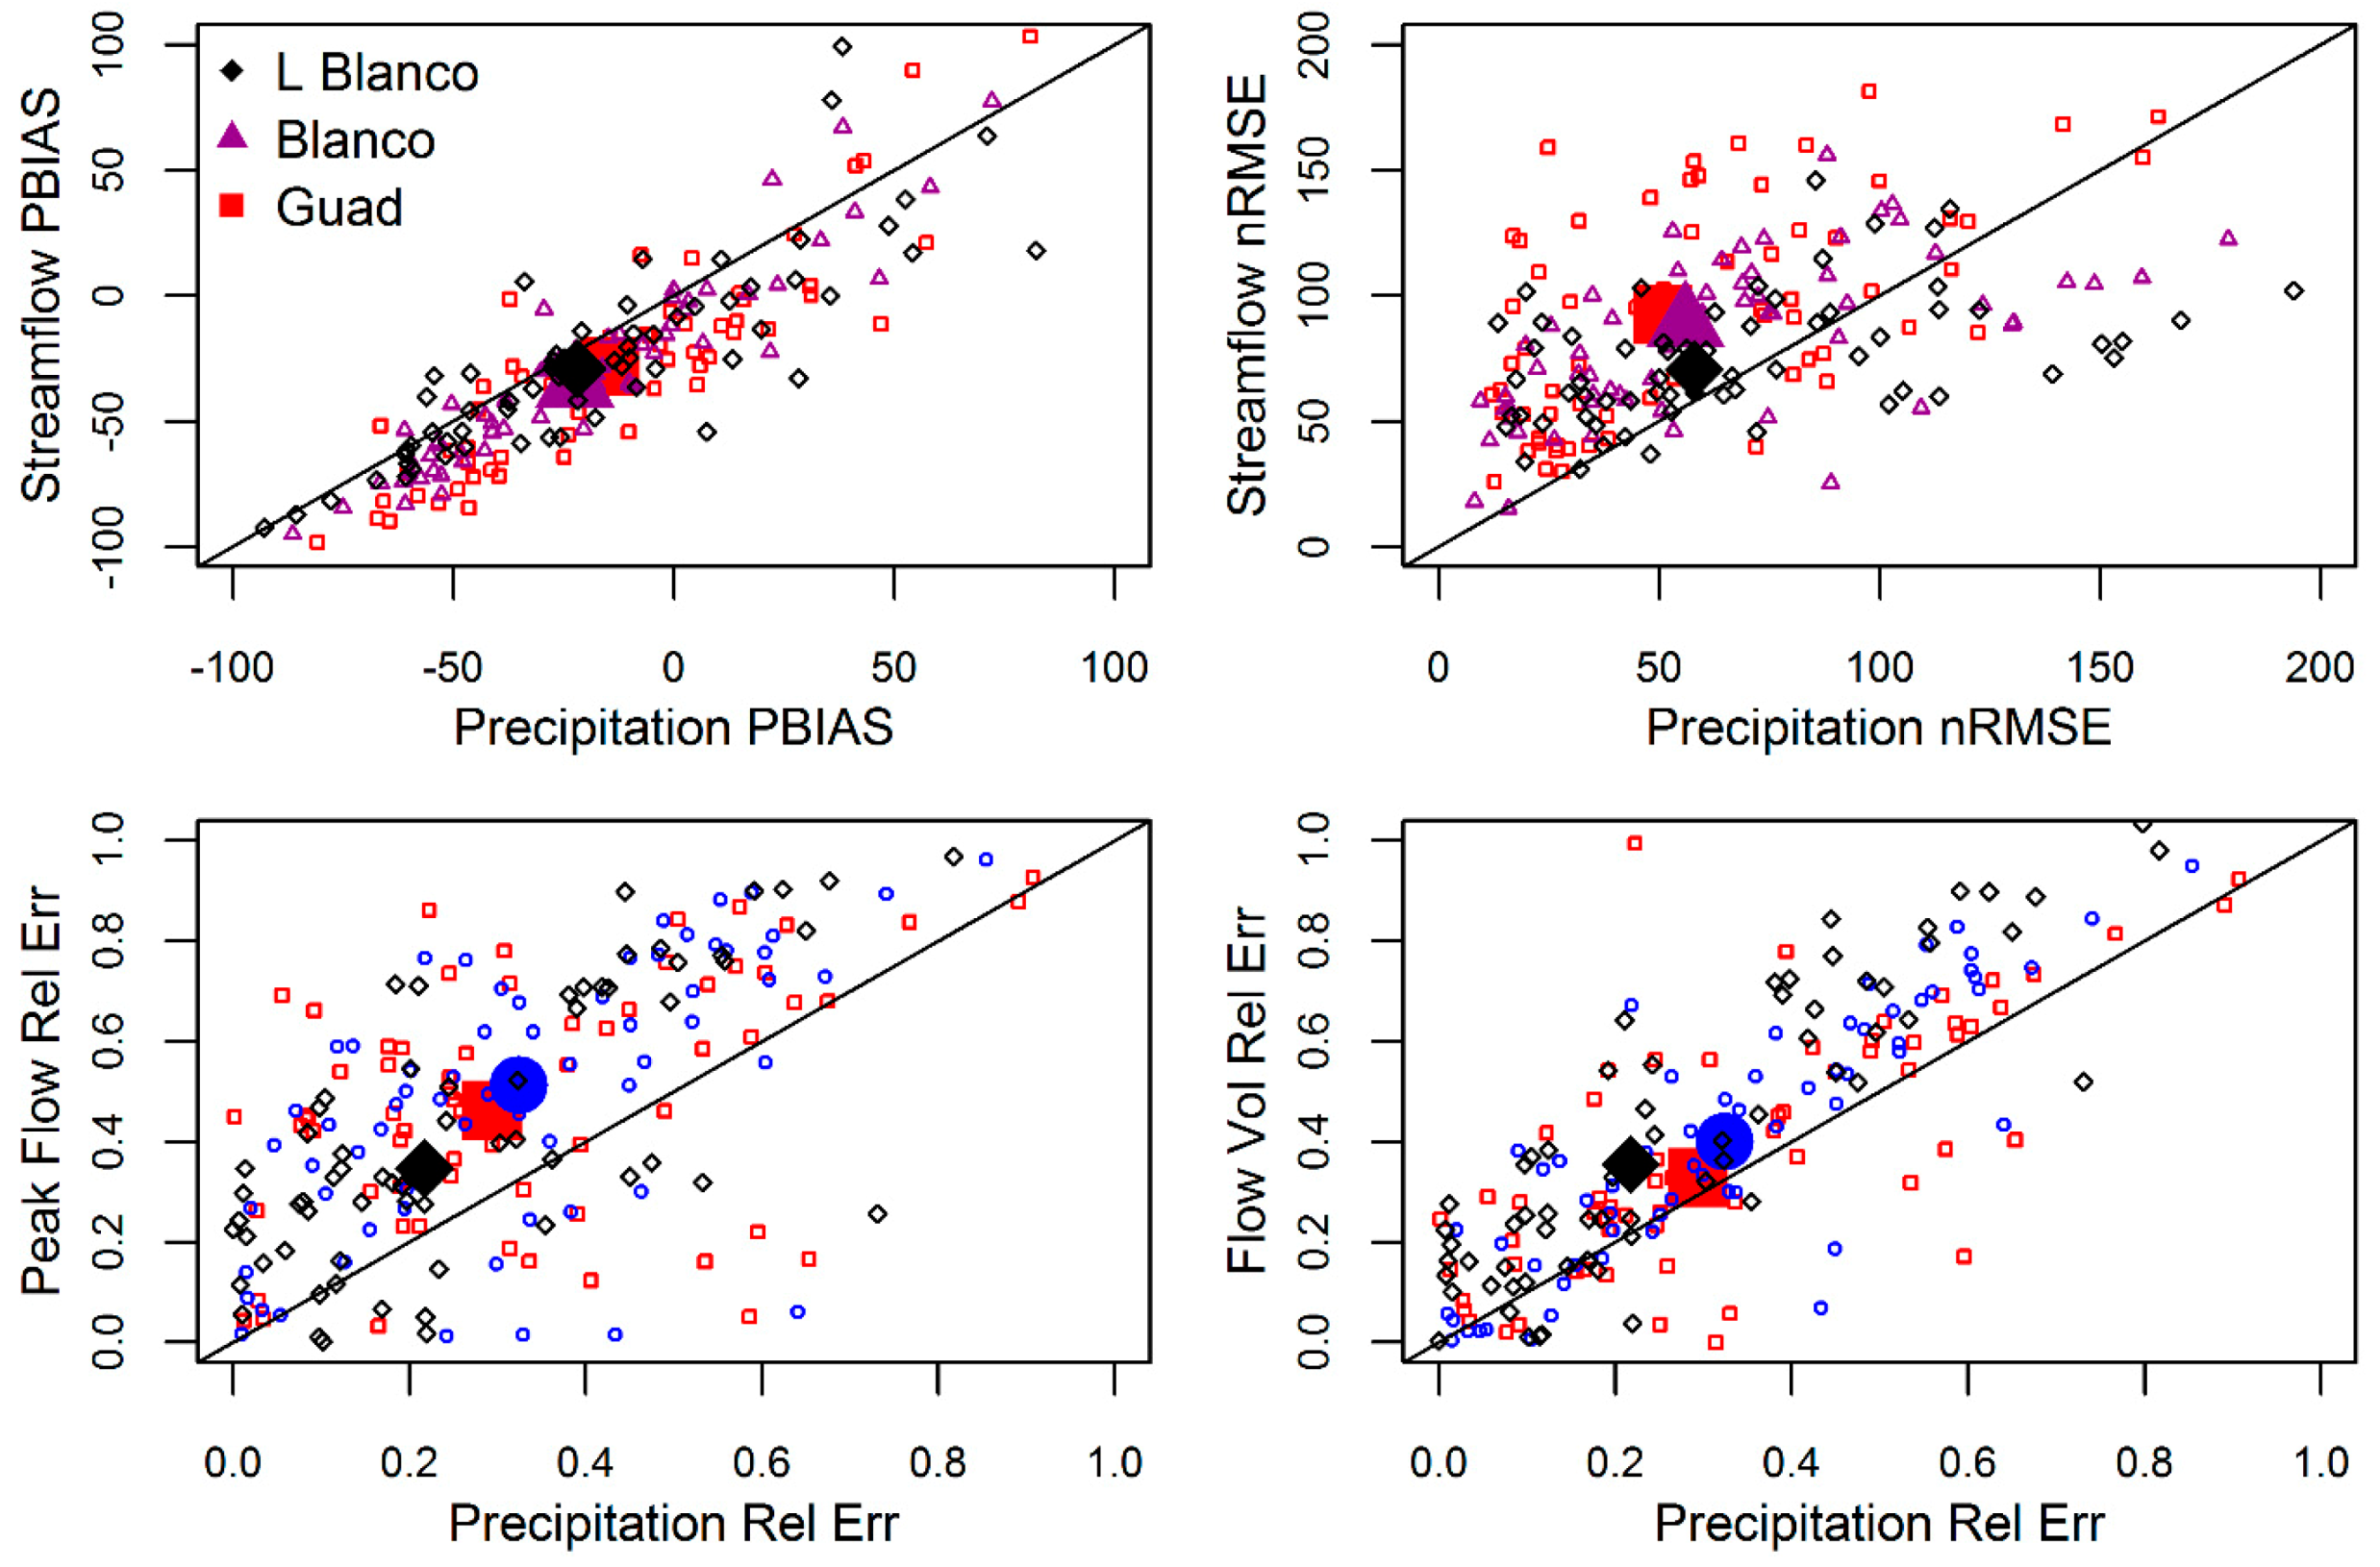
3.5. Error Propagation
4. Conclusions
Author Contributions
Funding
Acknowledgments
Conflicts of Interest
References
- Dai, A. Precipitation Characteristics in Eighteen Coupled climate models. J. Clim. 2006, 19, 4605–4630. [Google Scholar] [CrossRef]
- New, M.; Todd, M.; Hulme, M.; Jones, P. Precipitation measurements and trends in the twentieth century. Int. J. Clim. 2001, 21, 1889–1922. [Google Scholar] [CrossRef]
- Krajewski, W.; Smith, J. Radar hydrology: Rainfall estimation. Adv. Water Resour. 2002, 25, 1387–1394. [Google Scholar] [CrossRef]
- Wang, X.; Xie, H.; Sharif, H.; Zeitler, J. Validating NEXRAD MPE and Stage III precipitation products for uniform rainfall on the Upper Guadalupe River Basin of the Texas Hill Country. J. Hydrol. 2008, 348, 73–86. [Google Scholar] [CrossRef]
- Habib, E.; Larson, B.F.; Graschel, J. Validation of NEXRAD multisensor precipitation estimates using an experimental dense rain gauge network in south Louisiana. J. Hydrol. 2009, 373, 463–478. [Google Scholar] [CrossRef]
- Maddox, R.A.; Zhang, J.; Gourley, J.J.; Howard, K.W. Weather radar coverage over the contiguous United States. Weather Forecast. 2002, 17, 927–934. [Google Scholar] [CrossRef]
- Nicholson, S.E.; Some, B.; McCollum, J.; Nelkin, E.; Klotter, D.; Berte, Y.; Diallo, B.M.; Gaye, I.; Kpabeba, G.; Ndiaye, O.; et al. Validation of TRMM and other rainfall estimates with a high-density gauge dataset for West Africa. Part II: Validation of TRMM rainfall products. J. Appl. Meteorol. 2003, 42, 1355–1368. [Google Scholar] [CrossRef]
- McCollum, J.R.; Krajewski, W.F.; Ferraro, R.R.; Ba, M.B. Evaluation of biases of satellite rainfall estimation algorithms over the continental United States. J. Appl. Meteorol. 2002, 41, 1065–1080. [Google Scholar] [CrossRef]
- Ebert, E.E.; Janowiak, J.E.; Kidd, C. Comparison of near-real-time precipitation estimates from satellite observations and numerical models. Bull. Am. Meteorol. Soc. 2007, 88, 47–64. [Google Scholar] [CrossRef]
- Sapiano, M.; Arkin, P. An intercomparison and validation of high-resolution satellite precipitation estimates with 3-hourly gauge data. J. Hydrometeorol. 2009, 10, 149–166. [Google Scholar] [CrossRef]
- Thiemig, V.; Rojas, R.; Zambrano-Bigiarini, M.; Levizzani, V.; de Roo, A. Validation of satellite-based precipitation products over sparsely gauged African river basins. J. Hydrometeorol. 2012, 13, 1760–1783. [Google Scholar] [CrossRef]
- Hirpa, F.A.; Gebremichael, M.; Hopson, T. Evaluation of high-resolution satellite precipitation products over very complex terrain in Ethiopia. J. Appl. Meteorol. Climatol. 2010, 49, 1044–1051. [Google Scholar] [CrossRef]
- Mantas, V.; Liu, Z.; Caro, C.; Pereira, A.J.S.C. Validation of TRMM multi-satellite precipitation analysis (TMPA) products in the Peruvian Andes. Atmos. Res. 2015, 163, 132–145. [Google Scholar] [CrossRef]
- Nikolopoulos, E.I.; Anagnostou, E.N.; Hossain, F.; Gebremichael, M.; Borga, M. Understanding the scale relationships of uncertainty propagation of satellite rainfall through a distributed hydrologic model. J. Hydrometeorol. 2010, 11, 520–532. [Google Scholar] [CrossRef]
- AghaKouchak, A.; Behrangi, A.; Sorooshian, S.; Hsu, K.; Amitai, E. Evaluation of satellite-retrieved extreme precipitation rates across the central United States. J. Geophys. Res. Atmos. 2011, 116. [Google Scholar] [CrossRef]
- Mehran, A.; AghaKouchak, A. Capabilities of satellite precipitation datasets to estimate heavy precipitation rates at different temporal accumulations. Hydrol. Process. 2014, 28, 2262–2270. [Google Scholar] [CrossRef]
- Mei, Y.; Anagnostou, E.N.; Nikolopoulos, E.I.; Borga, M. Error analysis of satellite precipitation products in mountainous basins. J. Hydrometeorol. 2014, 15, 1778–1793. [Google Scholar] [CrossRef]
- Shen, Y.; Xiong, A.; Wang, Y.; Xie, P. Performance of high-resolution satellite precipitation products over China. J. Geophys. Res. Atmos. 2010, 115. [Google Scholar] [CrossRef]
- Vernimmen, R.; Hooijer, A.; Mamenun; Aldrian, E.; van Dijk, A.I.J.M. Evaluation and bias correction of satellite rainfall data for drought monitoring in Indonesia. Hydrol. Earth Syst. Sci. 2012, 16, 133–146. [Google Scholar] [CrossRef] [Green Version]
- Wehbe, Y.; Ghebreyesus, D.; Temimi, M.; Milewski, A.; al Mandous, A. Assessment of the consistency among global precipitation products over the United Arab Emirates. J. Hydrol. Reg. Stud. 2017, 12, 122–135. [Google Scholar] [CrossRef]
- Omranian, E.; Sharif, H.O. Evaluation of the Global Precipitation Measurement (GPM) Satellite Rainfall Products Over the Lower Colorado River Basin, Texas. J. Am. Water Resour. Assoc. 2018. [Google Scholar] [CrossRef]
- Sharif, H.O.; Ogden, F.L.; Krajewski, W.F.; Xue, M. Numerical simulations of radar rainfall error propagation. Water Resour. Res. 2002, 38, 15-1–15-14. [Google Scholar] [CrossRef]
- Sharif, H.O.; Ogden, F.L.; Krajewski, W.F.; Xue, M. Statistical analysis of radar rainfall error propagation. J. Hydrometeorol. 2004, 5, 199–212. [Google Scholar] [CrossRef]
- Borga, M. Accuracy of radar rainfall estimates for streamflow simulation. J. Hydrol. 2002, 267, 26–39. [Google Scholar] [CrossRef]
- Vivoni, E.R.; Entekhabi, D.; Hoffman, R.N. Error propagation of radar rainfall nowcasting fields through a fully distributed flood forecasting model. J. Appl. Meteorol. Climatol. 2007, 46, 932–940. [Google Scholar] [CrossRef]
- Gebregiorgis, A.S.; Tian, Y.; Peters-Lidard, C.D.; Hossain, F. Tracing hydrologic model simulation error as a function of satellite rainfall estimation bias components and land use and land cover conditions. Water Resour. Res. 2012, 48. [Google Scholar] [CrossRef]
- Maggioni, V.; Vergara, H.J.; Anagnostou, E.N.; Gourley, J.J.; Hong, Y.; Stampoulis, D. Investigating the applicability of error correction ensembles of satellite rainfall products in river flow simulations. J. Hydrometeorol. 2013, 14, 1194–1211. [Google Scholar] [CrossRef]
- Chintalapudi, S.; Sharif, H.O.; Xie, H. Sensitivity of distributed hydrologic simulations to ground and satellite based rainfall products. Water 2014, 6, 1221–1245. [Google Scholar] [CrossRef]
- Su, F.; Gao, H.; Huffman, G.J.; Lettenmaier, D.P. Potential utility of the real-time TMPA-RT precipitation estimates in streamflow prediction. J. Hydrometeorol. 2011, 12, 444–455. [Google Scholar] [CrossRef]
- Wu, H.; Adler, R.F.; Tian, Y.; Huffman, G.J.; Li, H.; Wang, J. Real-time global flood estimation using satellite-based precipitation and a coupled land surface and routing model. Water Resour. Res. 2014, 50, 2693–2717. [Google Scholar] [CrossRef]
- Vergara, H.; Hong, Y.; Gourley, J.J.; Anagnostou, E.N.; Maggioni, V.; Stampoulis, D.; Kirstetter, Pi. Effects of resolution of satellite-based rainfall estimates on hydrologic modeling skill at different scales. J. Hydrometeorol. 2014, 15, 593–613. [Google Scholar] [CrossRef]
- Mei, Y.; Nikolopoulos, E.I.; Anagnostou, E.N.; Borga, M. Evaluating satellite precipitation error propagation in runoff simulations of mountainous basins. J. Hydrometeorol. 2016, 17, 1407–1423. [Google Scholar] [CrossRef]
- Yong, B.; Ren, L.; Hong, Y.; Wang, J.; Gourley, J.J.; Jiang, S.; Chen, X.; Wang, W. Hydrologic evaluation of Multisatellite Precipitation Analysis standard precipitation products in basins beyond its inclined latitude band: A case study in Laohahe basin, China. Water Resour. Res. 2010, 46. [Google Scholar] [CrossRef]
- Downer, C.W.; Ogden, F.L. GSSHA: Model to simulate diverse stream flow producing processes. J. Hydrol. Eng. 2004, 9, 161–174. [Google Scholar] [CrossRef]
- Afshari, S.; Omranian, E.; Feng, D. Relative Sensitivity of Flood Inundation Extent by Different Physical and Semi-Empirical Models; CUAHSI Technical Report No. 13; The Consortium of Universities for the Advancement of Hydrologic Science, Inc.: Washington, DC, USA, 2016; pp. 19–24. [Google Scholar]
- Sharif, H.O.; Sparks, L.; Hassan, A.A.; Zeitler, J.; Xie, H. Application of a distributed hydrologic model to the November 17, 2004, flood of Bull Creek watershed, Austin, Texas. J. Hydrol. Eng. 2010, 15, 651–657. [Google Scholar] [CrossRef]
- Caran, S.C.; Baker, V.R. Flooding along the Balcones escarpment, central Texas. In The Balcones Escarpment-Geology, Hydrology, Ecology and Social Development in Central TEXAS; Geological Society of America: Boulder, CO, USA, 1986; pp. 1–14. [Google Scholar]
- Baker, V.R. Flood Hazards along the Balcones Escarpment inCentral Texas Alternative Approaches to Their Recognition, Mapping, and Management; Bureau of Economic Geology Circular; Bureau of Economic Geology, University of Texas at Austin: Austin, TX, USA, 1975. [Google Scholar]
- Smith, J.A.; Baeck, M.L.; Morrison, J.E.; Sturdevant-Rees, P. Catastrophic rainfall and flooding in Texas. J. Hydrometeorol. 2000, 1, 5–25. [Google Scholar] [CrossRef]
- Furl, C.; Sharif, H.O.; el Hassan, A.; Mazari, N.; Burtch, D.; Mullendore, G.L. Hydrometeorological Analysis of Tropical Storm Hermine and Central Texas Flash Flooding, September 2010. J. Hydrometeorol. 2015, 16, 2311–2327. [Google Scholar] [CrossRef]
- Patton, P.C.; Baker, V.R. Morphometry and floods in small drainage basins subject to diverse hydrogeomorphic controls. Water Resour. Res. 1976, 12, 941–952. [Google Scholar] [CrossRef]
- Furl, C.; Sharif, H.; Zeitler, J.W.; el Hassan, A.; Joseph, J. Hydrometeorology of the catastrophic Blanco river flood in South Texas, May 2015. J. Hydrol. Reg. Stud. 2018, 15, 90–104. [Google Scholar] [CrossRef]
- Lin, Y.; Mitchell, K.E. 1.2 the NCEP stage II/IV hourly precipitation analyses: Development and applications. In Proceedings of the 19th Conference Hydrology, American Meteorological Society, San Diego, CA, USA, 9–13 January 2005. [Google Scholar]
- Fulton, R.A.; Breidenbach, J.P.; Seo, Do.; Miller, D.A.; O’Bannon, T. The WSR-88D rainfall algorithm. Weather Forecast. 1998, 13, 377–395. [Google Scholar] [CrossRef]
- Nelson, B.R.; Prat, O.P.; Seo, D.-J.; Habib, E. Assessment and implications of NCEP stage IV quantitative precipitation estimates for product intercomparisons. Weather Forecast. 2016, 31, 371–394. [Google Scholar] [CrossRef]
- Huffman, G.J.; Bolvin, D.T.; Nelkin, E.J. Integrated Multi-satellitE Retrievals for GPM (IMERG) technical documentation. NASA/GSFC Code 2015, 612, 47. [Google Scholar]
- Yong, B.; Liu, D.; Gourley, J.J.; Tian, Y.; Huffman, G.J.; Ren, L.; Hong, Y. Global view of real-time TRMM multisatellite precipitation analysis: Implications for its successor global precipitation measurement mission. Bull. Am. Meteorol. Soc. 2015, 96, 283–296. [Google Scholar] [CrossRef]
- Hsu, K.; Gao, X.; Sorooshian, S.; Gupta, H.V. Precipitation estimation from remotely sensed information using artificial neural networks. J. Appl. Meteorol. 1997, 36, 1176–1190. [Google Scholar] [CrossRef]
- Sorooshian, S.; Hsu, Ku.; Gao, X.; Gupta, H.V.; Imam, B.; Braithwaite, D. Evaluation of PERSIANN system satellite–based estimates of tropical rainfall. Bull. Am. Meteorol. Soc. 2000, 81, 2035–2046. [Google Scholar] [CrossRef]
- Joyce, R.J.; Janowiak, J.E.; Arkin, P.A.; Xie, P. CMORPH: A method that produces global precipitation estimates from passive microwave and infrared data at high spatial and temporal resolution. J. Hydrometeorol. 2004, 5, 487–503. [Google Scholar] [CrossRef]
- Huffman, G.J.; Bolvin, D.T.; Nelkin, E.J.; Wolff, D.B.; Adler, R.F.; Gu, G.; Hong, Y.; Bowman, K.P.; Stocker, E.F. The TRMM multisatellite precipitation analysis (TMPA): Quasi-global, multiyear, combined-sensor precipitation estimates at fine scales. J. Hydrometeorol. 2007, 8, 38–55. [Google Scholar] [CrossRef]
- Downer, C.W.; Ogden, F.L. Gridded Surface Subsurface Hydrologic Analysis (GSSHA) User’s Manual; Version 1.43 for Watershed Modeling System 6.1.; Engineer Research and Development Center Coastal and Hydraulics Lab.: Vicksburg, MS, USA, 2006. [Google Scholar]
- Ogden, F.L.; Saghafian, B. Green and Ampt infiltration with redistribution. J. Irrig. Drain. Eng. 1997, 123, 386–393. [Google Scholar] [CrossRef]
- Rawls, W.J.; Brakensiek, D.L.; Miller, N. Green-Ampt infiltration parameters from soils data. J. Hydraul. Eng. 1983, 109, 62–70. [Google Scholar] [CrossRef]
- Zambrano-Bigiarini, M. Package ‘hydroGOF’: Goodness-of-Fit Functions for Comparison of Simulated and Observed Hydrological Time Series. R package Version 0.3-8. Available online: https://cran.r-project.org/web/packages/hydroGOF/hydroGOF.pdf (accessed on 8 February 2018).
- Su, F.; Hong, Y.; Lettenmaier, D.P. Evaluation of TRMM Multisatellite Precipitation Analysis (TMPA) and its utility in hydrologic prediction in the La Plata Basin. J. Hydrometeorol. 2008, 9, 622–640. [Google Scholar] [CrossRef]


| Nov. 2004 Early | Nov. 2004 Late | Apr. 2010 | Sept. 2010 | Jan. 2012 | May 2013 | Oct. 2013 | May 2015 | Oct. 2015 | Gauge Adjusted | |
|---|---|---|---|---|---|---|---|---|---|---|
| TRMM B42 | x | x | x | x | x | x | x | x | x | Y |
| TRMM-RT B42 | x | x | x | x | x | x | x | x | x | N |
| PERSIANN | x | x | x | x | x | x | x | x | x | N |
| PERSIANN CCS | x | x | x | x | x | x | x | x | x | N |
| CMORPH CDR | x | x | x | x | x | x | x | NA | NA | Y |
| CMORPH 8KM | x | x | x | x | x | x | x | NA | NA | Y |
| CMORPH RAW | x | x | x | x | x | x | x | x | x | N |
| GPM IMERG EARLY | NA | NA | NA | NA | NA | NA | NA | x | x | N |
| GPM IMERG LATE | NA | NA | NA | NA | NA | NA | NA | x | x | N |
| GPM IMERG FINAL | NA | NA | NA | NA | NA | NA | NA | x | x | Y |
| Soil Texture/Land Use | Saturated Hydraulic Conductivity (cm·hr−1) | Capillary Head (cm) | Effective Porosity | Manning’s Roughed Coefficient | Retention Depth (mm) |
|---|---|---|---|---|---|
| Recharge zone | 10.0 | 23.6 | 0.417 | - | - |
| Clay | 1.2 | 0.06 | 0.385 | - | - |
| Loam | 0.01 | 1.3 | 0.434 | - | - |
| Fine loam | 0.02 | 2.18 | 0.412 | - | - |
| Fine silt | 0.01 | 0.68 | 0.486 | - | - |
| Fine sand | 0.03 | 23.6 | 0.417 | - | - |
| Urban | - | - | - | 0.18 | 5.0 |
| Forest | - | - | - | 0.25 | 5.0 |
| Shrub | - | - | - | 0.20 | 5.0 |
| Grasslan/agriculture | - | - | - | 0.30 | 5.0 |
| Gauge Correction | No Gauge Correction | ||||||||||
|---|---|---|---|---|---|---|---|---|---|---|---|
| TRMM | CMORPH | GPM FINAL | CMORPH 8KM | PERSIANN CCS | GPM EARLY | GPM LATE | CMORPH RAW | TRMM-RT | PERSIANN | ||
| PBIAS | −3.9 | −2.9 | −51.9 | 0.2 | −28.2 | −30.4 | −17.6 | −12.2 | −14.2 | −39.7 | |
| nRMSE | 58.2 | 29.5 | 111.2 | 31.4 | 66.9 | 83.5 | 57.3 | 72.3 | 79.3 | 84.1 | |
| Average | NSE | 0.42 | 0.89 | −0.32 | 0.87 | 0.38 | 0.01 | 0.62 | 0.32 | 0.26 | 0.06 |
| PBIAS | −4.4 | −7.0 | −54.1 | −4.6 | −29.7 | −40.3 | −24.3 | −24.7 | −37.2 | −46.3 | |
| nRMSE | 48.0 | 26.9 | 117.8 | 28.0 | 59.8 | 88.7 | 57.2 | 67.9 | 73.2 | 90.0 | |
| Median | NSE | 0.77 | 0.93 | −0.40 | 0.92 | 0.63 | 0.16 | 0.64 | 0.53 | 0.45 | 0.18 |
| PBIAS | 143.1 | 69.3 | 32.1 | 84.3 | 132.5 | 74.8 | 54.0 | 140.4 | 135.2 | 134.0 | |
| nRMSE | 210.7 | 56.5 | 63.5 | 54.7 | 153.2 | 138.2 | 56.1 | 140.9 | 123.0 | 176.0 | |
| Range | NSE | 5.0 | 0.4 | 1.4 | 0.5 | 2.9 | 2.4 | 0.7 | 2.3 | 2.4 | 3.9 |
| Count | 27 | 21 | 6 | 21 | 27 | 6 | 6 | 27 | 27 | 27 | |
© 2018 by the authors. Licensee MDPI, Basel, Switzerland. This article is an open access article distributed under the terms and conditions of the Creative Commons Attribution (CC BY) license (http://creativecommons.org/licenses/by/4.0/).
Share and Cite
Furl, C.; Ghebreyesus, D.; Sharif, H.O. Assessment of the Performance of Satellite-Based Precipitation Products for Flood Events across Diverse Spatial Scales Using GSSHA Modeling System. Geosciences 2018, 8, 191. https://doi.org/10.3390/geosciences8060191
Furl C, Ghebreyesus D, Sharif HO. Assessment of the Performance of Satellite-Based Precipitation Products for Flood Events across Diverse Spatial Scales Using GSSHA Modeling System. Geosciences. 2018; 8(6):191. https://doi.org/10.3390/geosciences8060191
Chicago/Turabian StyleFurl, Chad, Dawit Ghebreyesus, and Hatim O. Sharif. 2018. "Assessment of the Performance of Satellite-Based Precipitation Products for Flood Events across Diverse Spatial Scales Using GSSHA Modeling System" Geosciences 8, no. 6: 191. https://doi.org/10.3390/geosciences8060191