Rock Magnetic, Petrography, and Geochemistry Studies of Lava at the Ijen Volcanic Complex (IVC), Banyuwangi, East Java, Indonesia


Abstract
:1. Introduction
2. Geological Setting
3. Materials and Methods
4. Results and Discussion
5. Conclusions
Supplementary Materials
Author Contributions
Acknowledgments
Conflicts of Interest
References
- Carr, M.J. Symmetrical and segmented variation of physical and geochemical characteristics of the Central American volcanic front. J. Volcanol. Geotherm. Res. 1984, 20, 231–252. [Google Scholar] [CrossRef]
- Cañón-Tapia, E.; Walker, G.P.; Herrero-Bervera, E. The internal structure of lava flows—Insights from AMS measurements II: Hawaiian pahoehoe, toothpaste lava and ‘a’ā. J. Volcanol. Geotherm. Res. 1997, 76, 19–46. [Google Scholar] [CrossRef]
- Rüpke, L.H.; Morgan, J.P.; Hort, M.; Connolly, J.A. Are the regional variations in Central American arc lavas due to differing basaltic versus peridotitic slab sources of fluids? Geol. Soc. Am. 2002, 30, 1035–1038. [Google Scholar] [CrossRef]
- Schaefer, C.J.; Kattenhorn, S.A. Characterization and evolution of fractures in low-volume pahoehoe lava flows, eastern Snake River Plain, Idaho. Geol. Soc. Am. Bull. 2004, 116, 322–336. [Google Scholar] [CrossRef]
- Single, R.T.; Jerram, D.A. The 3D facies architecture of flood basalt provinces and their internal heterogeneity: Examples from the Paleogene Skye Lava Field. J. Geol. Soc. 2004, 161, 911–926. [Google Scholar] [CrossRef]
- Fukuma, K. Vertical Variation of Testing Thellier Paleointensities from a Recent Lava Flow in Japan. In Proceedings of the 9th International Conference “Problems of Geocosmos”, St. Petersburg, Russia, 8–12 October 2012; pp. 29–42. [Google Scholar]
- MacDonald, G.A.; Katsura, T. Variations in the lava of the 1959 eruption in Kilauea Iki. Pac. Sci. 1961, 15, 358–369. [Google Scholar]
- Watkins, N.D.; Haggerty, S.E. Primary oxidation variation and petrogenesis in a single lava. Contrib. Mineral. Petrol. 1967, 15, 251–271. [Google Scholar] [CrossRef]
- Rhodes, J.M. Homogeneity of lava flows: Chemical data for historic Mauna Loan eruptions. J. Geophys. Res. Sol. Earth 1983, 88, A869–A879. [Google Scholar] [CrossRef]
- O’Reilly, S.Y.; Zhang, M. Geochemical characteristics of lava-field basalts from eastern Australia and inferred sources: Connections with the subcontinental lithospheric mantle? Contrib. Mineral. Petrol. 1995, 121, 148–170. [Google Scholar] [CrossRef]
- Kocak, K.; Zedef, V. Geochemical characteristics of the lava domes in Yatagan village and Sağlik town, from Erenlerdagi (Konya, Central Turkey) volcanites. Act. Geobalcanica 2016, 2, 7–19. [Google Scholar] [CrossRef]
- Polo, L.A.; Janasi, V.A.; Giordano, D.; Lima, E.F.; Cañon-Tapia, E.; Roverato, M. Effusive silicic volcanism in the Paraná Magmatic Province, South Brazil: Evidence for locally-fed lava flows and domes from detailed field work. J. Volcanol. Geotherm. Res. 2017, in press. [Google Scholar] [CrossRef]
- Cañón-Tapia, E.; Coe, R. Rock magnetic evidence of inflation of a flood basalt lava flow. Bull. Volcanol. 2002, 64, 289–302. [Google Scholar] [CrossRef]
- Wilson, R.L.; Haggerty, S.E.; Watkins, N.D. Variation of palaeomagnetic stability and other parameters in a vertical traverse of a single Icelandic lava. Geophys. J. Int. 1968, 16, 79–96. [Google Scholar] [CrossRef]
- Rolph, T.C. An investigation of the magnetic variation within two recent lava flows. Geotherm. J. Int. 1997, 130, 125–136. [Google Scholar] [CrossRef]
- Mena, M.; Orgeira, M.J.; Lagorio, S. Paleomagnetism, rock-magnetism and geochemical aspects of early Cretaceous basalts of the Paraná Magmatic Province, Misiones, Argentina. Earth Planets Space 2006, 58, 1283–1293. [Google Scholar] [CrossRef]
- Dietze, F.; Kontny, A.; Heyde, I.; Vahle, C. Magnetic anomalies and rock magnetism of basalts from Reykjanes (SW-Iceland). Stud. Geophys. Geod. 2011, 55, 109–130. [Google Scholar] [CrossRef]
- Almqvist, B.S.G.; Bosshard, S.A.; Hirt, A.M.; Mattsson, H.B.; Hetényi, G. Internal flow structures in columnar jointed basalt from Hrepphólar, Iceland: II. Magnetic anisotropy and rock magnetic properties. Bull. Volcanol. 2012, 74, 1667–1681. [Google Scholar] [CrossRef]
- Kapper, L.; Morales, J.; Calvo-Rathert, M.; Goguitchaichvili, A.; Mejia, V.; Caccavari, A.; Guevara, A.N.; Ruiz, R.C. A paleointensity study of Cretaceous volcanic rocks from the Western Cordillera, Colombia. Stud. Geophys. Geod. 2017, 61, 264–289. [Google Scholar] [CrossRef]
- Cervantes-Solano, M.; Kapper, L.; Goguitchaichvili, A.; Ruiz-Martínez, V.C.; Rosas-Elguera, J.; Morales, J.; Maciel-Peña, R.; Cejudo-Ruiz, R. A detailed paleomagnetic and rock-magnetic investigation around Cretaceous-Paleogene boundary: The Autlan (Western Mexico) volcanic sequence revisited. Stud. Geophys. Geod. 2017, 61, 233–248. [Google Scholar] [CrossRef]
- McEnroe, S.A.; Brown, L.L. Palaeomagnetism, rock magnetism and geochemistry of Jurassic dykes and correlative redbeds, Massachusetts, USA. Geotherm. J. Int. 2000, 143, 22–38. [Google Scholar] [CrossRef]
- Alva-Valdivia, L.M.; Bohnel, H.; McIntosh, G.; Caballero-Miranda, C.; Morales, J. Vertical Detailed Variation of Petromagnetic Properties in Basalt Flow Profiles, Xitle Volcano, Mexico: A Review. Latinmag Lett. 2011, 1, D14. [Google Scholar]
- Siddiq, F. Volcanostratigraphy and Petrogenesis of Mount Ijen, Banyuwangi District, East Java. Bachelor’s Thesis, Institut Teknologi Bandung, Bandung, Indonesia, 2015. [Google Scholar]
- Sujanto; Syarifuddin, M.Z.; Sitorus, K. Geological Map of the Ijen Caldera Complex, East Java; Volcanology Survey of Indonesia: Bandung, Indonesia, 1988. [Google Scholar]
- Delmelle, P.; Bernard, A. Downstream composition changes of acidic volcanic waters discharged into the Banyupahit stream, Ijen caldera, Indonesia. J. Volcanol. Geotherm. Res. 2000, 97, 55–75. [Google Scholar] [CrossRef]
- Delmelle, P.; Bernard, A.; Kusakabe, M.; Fischer, T.P.; Takano, B. Geochemistry of the magmatic–hydrothermal system of Kawah Ijen volcano, East Java, Indonesia. J. Volcanol. Geotherm. Res. 2000, 97, 31–53. [Google Scholar] [CrossRef]
- Handley, H.K.; Macpherson, C.G.; Davidson, J.P.; Berlo, K.; Lowry, D. Constraining Fluid and Sediment Contributions to Subduction-Related Magmatism in Indonesia: Ijen Volcanic Complex. J. Petrol. 2007, 48, 1155–1183. [Google Scholar] [CrossRef]
- Van Hinsberg, V.; Berlo, K.; Sumarti, S.; van Bergen, M.; Williams-Jones, A. Extreme alteration by hyperacidic brines at Kawah Ijen volcano, East Java, Indonesia: II. J. Volcanol. Geotherm. Res. 2010, 196, 169–184. [Google Scholar] [CrossRef]
- Caudron, C.; Syahbana, D.K.; Lecocq, T.; Van Hinsberg, V.; McCausland, W.; Triantafyllou, A.; Camelbeeck, T.; Bernard, A. Surono Kawah Ijen volcanic activity: A review. Bull. Volcanol. 2015, 77. [Google Scholar] [CrossRef]
- Earth Data. Available online: https://earthdata.nasa.gov/ (accessed on 2 November 2017).
- Santoso, N.A.; Bijaksana, S.; Kodama, K.; Santoso, D.; Dahrin, D. Multimethod Approach to the Study of Recent Volcanic Ashes from Tengger Volcanic Complex, Eastern Java, Indonesia. Geosciences 2017, 7, 63. [Google Scholar] [CrossRef]
- Sudarningsih, S.; Bijaksana, S.; Ramdani, R.; Hafidz, A.; Pratama, A.; Widodo, W.; Iskandar, I.; Dahrin, D.; Fajar, S.J.; Santoso, N.A. Variations in the Concentration of Magnetic Minerals and Heavy Metals in Suspended Sediments from Citarum River and Its Tributaries, West Java, Indonesia. Geosciences 2017, 7, 66. [Google Scholar] [CrossRef]
- Tugrul, A.; Gurpinar, O. The Effect of Chemical Weathering on the Engineering Properties of Eocene Basalts in Northeastern Turkey. Environ. Eng. Geosci. 1997, 3, 225–234. [Google Scholar] [CrossRef]
- Le Bas, M.J.; Le Maitre, R.W.; Streckeisen, A.; Zanettin, B. A chemical classification of volcanic rocks based on the total alkali-silica diagram. J. Petrol. 1986, 27, 745–750. [Google Scholar] [CrossRef]
- LeMaitre, R.W. Igneous Rocks: A Classification and Glossary of Terms; Cambridge University Press: Cambridge, UK, 2005; pp. 30–39. ISBN 978-0-521-66215-4. [Google Scholar]
- Peccerillo, A.; Taylor, S.R. Geochemistry of Eocene calc-alkaline volcanic rocks from the Kastamonu area, northern Turkey. Contrib. Mineral. Petrol. 1976, 58, 63–81. [Google Scholar] [CrossRef]
- Wilson, M. Igneous Petrogenesis; Springer: Dordrecht, The Netherlands, 2007; pp. 1–100. ISBN 978-0-412-53310-5. [Google Scholar]
- Metcalf, R.V.; Shervais, J.W. Suprasubduction-zone ophiolites: Is there really an ophiolite conundrum? Geol. Soc. Am. 2008, 438, 191–222. [Google Scholar] [CrossRef]
- Pratama, A.; Hafidz, A.; Bijaksana, S.; Abdurrachman, M. Basaltic lava characterization using magnetic susceptibility identification and presence of opaque minerals in Ijen volcanic complex, Banyuwangi, East Java. AIP Conf. Proc. 2017, 1861, 030054. [Google Scholar] [CrossRef]
- Dearing, J.A. Environmental Magnetic Susceptibility: Using the Bartington MS2 System; Chi Pub.: Kenilworth, UK, 1994; pp. 30–50. ISBN 0-9523409-0-9. [Google Scholar]
- Liebke, U.; Antolin, B.; Appel, E.; Basavaiah, N.; Mikes, T.; Dunkl, I.; Wemmer, K. Indication for clockwise rotation in the Siang window south of the eastern Himalayan syntaxis and new geochronological constraints for the area. Geol. Soc. Lond. Spec. Publ. 2011, 353, 71–97. [Google Scholar] [CrossRef]
- Chi, C.T.; Dorobek, S.T. Cretaceous paleomagnetism of Indochina and surrounding regions: Cenozoic tectonic implications. Geol. Soc. Lond. Spec. Publ. 2004, 226, 273–287. [Google Scholar] [CrossRef]
- Tauxe, L. Paleomagnetic Principles and Practice; Kluwer Academic Publishers: Dordrecht, The Netherlands, 2003; pp. 30–90. ISBN 978-0-306-48128-4. [Google Scholar]
- Dunlop, D.J.; Özdemir, Ö. Rock Magnetic: Fundamentals and Frontiers; Cambridge studies in magnetism; Cambridge University Press: Cambridge, NY, USA, 1997; pp. 1–120. ISBN 978-0-521-32514-1. [Google Scholar]
- Day’s, R.; Fuller, M.D.; Schmidt, V.A. Hysteresis properties of titanomagnetites: Grain size and composition dependence. Phys. Earth Planet. Inter. 1977, 13, 260–266. [Google Scholar]
- Preece, K.; Barclay, J.; Gertisser, R.; Herd, R.A. Textural and micro-petological variations in the eruptive products of the 2006 dome-forming eruption of Merapi volcano, Indonesia: Implications for sub-surface processes. J. Volcanol. Geotherm. Res. 2013, 261, 98–120. [Google Scholar] [CrossRef]
- Zhou, W.; Van der Voo, R.; Peacor, D.R.; Zhang, Y. Variable Ti-content and grain size of titanomagnetite as a function of cooling rate in very young MORB. Earth Planet. Sci. Lett. 2000, 179, 9–20. [Google Scholar] [CrossRef]
- Jordanova, N. Soil Magnetism: Applications in Pedology, Environmental Science and Agriculture; Academic Press: London, UK, 2017; pp. 2–3. [Google Scholar]
- Butler, R.F. Paleomagnetism: Magnetic Domains to Geologic Terranes; Blackwell Scientific Publications: Hoboken, NJ, USA, 1998; p. 25. [Google Scholar]
- Lauro, S.E.; Mattei, E.; Cosciotti, B.; Di Paolo, F.; Arcone, S.A.; Viccaro, M.; Pettinelli, E. Electromagnetic signal penetration in a planetary soil simulant: Estimated attenuation rates using GPR and TDR in volcanic deposits on Mt. Etna. J. Geophys. Res. Planet 2017, 122, 1392–1404. [Google Scholar] [CrossRef]
- Schaefer, L.N.; Kendrick, J.E.; Oommen, T.; Lavallée, Y.; Chigna, G. Geomechanical rock properties of a basaltic volcano. Front. Earth Sci. 2015, 3, 1–15. [Google Scholar] [CrossRef]
- Sudarningsih, S.; Maulana, L.; Bijaksana, S.; Hafidz, A.; Pratama, A.; Widodo, W.; Iskandar, I. Magnetic Characterization of Sand and Boulder Samples from Citarum River and Their Origin. J. Math. Fundam. Sci. 2017, 49, 116–126. [Google Scholar] [CrossRef]
- Gibson, P.J.; Lyle, P.; Thomas, N. Magnetic Characteristics of the Cuilcagh Dyke, Co. Fermanagh, Northern Ireland. Irish J. Earth Sci. 2009, 27, 1–9. [Google Scholar] [CrossRef]


| Sample | IJ 1 | IJ 2 | IJ 3 | IJ 4 | IJ 5 | ANY 1 | ANY 2 | ANY 3 | ANY 4 |
|---|---|---|---|---|---|---|---|---|---|
| MgO | 2.54 | 2.21 | 2.23 | 2.56 | 1.84 | 3.54 | 1.79 | 2.46 | 2.59 |
| Al2O3 | 22.4 | 20.3 | 21.9 | 19.6 | 21.9 | 21.2 | 23.2 | 20.7 | 20.7 |
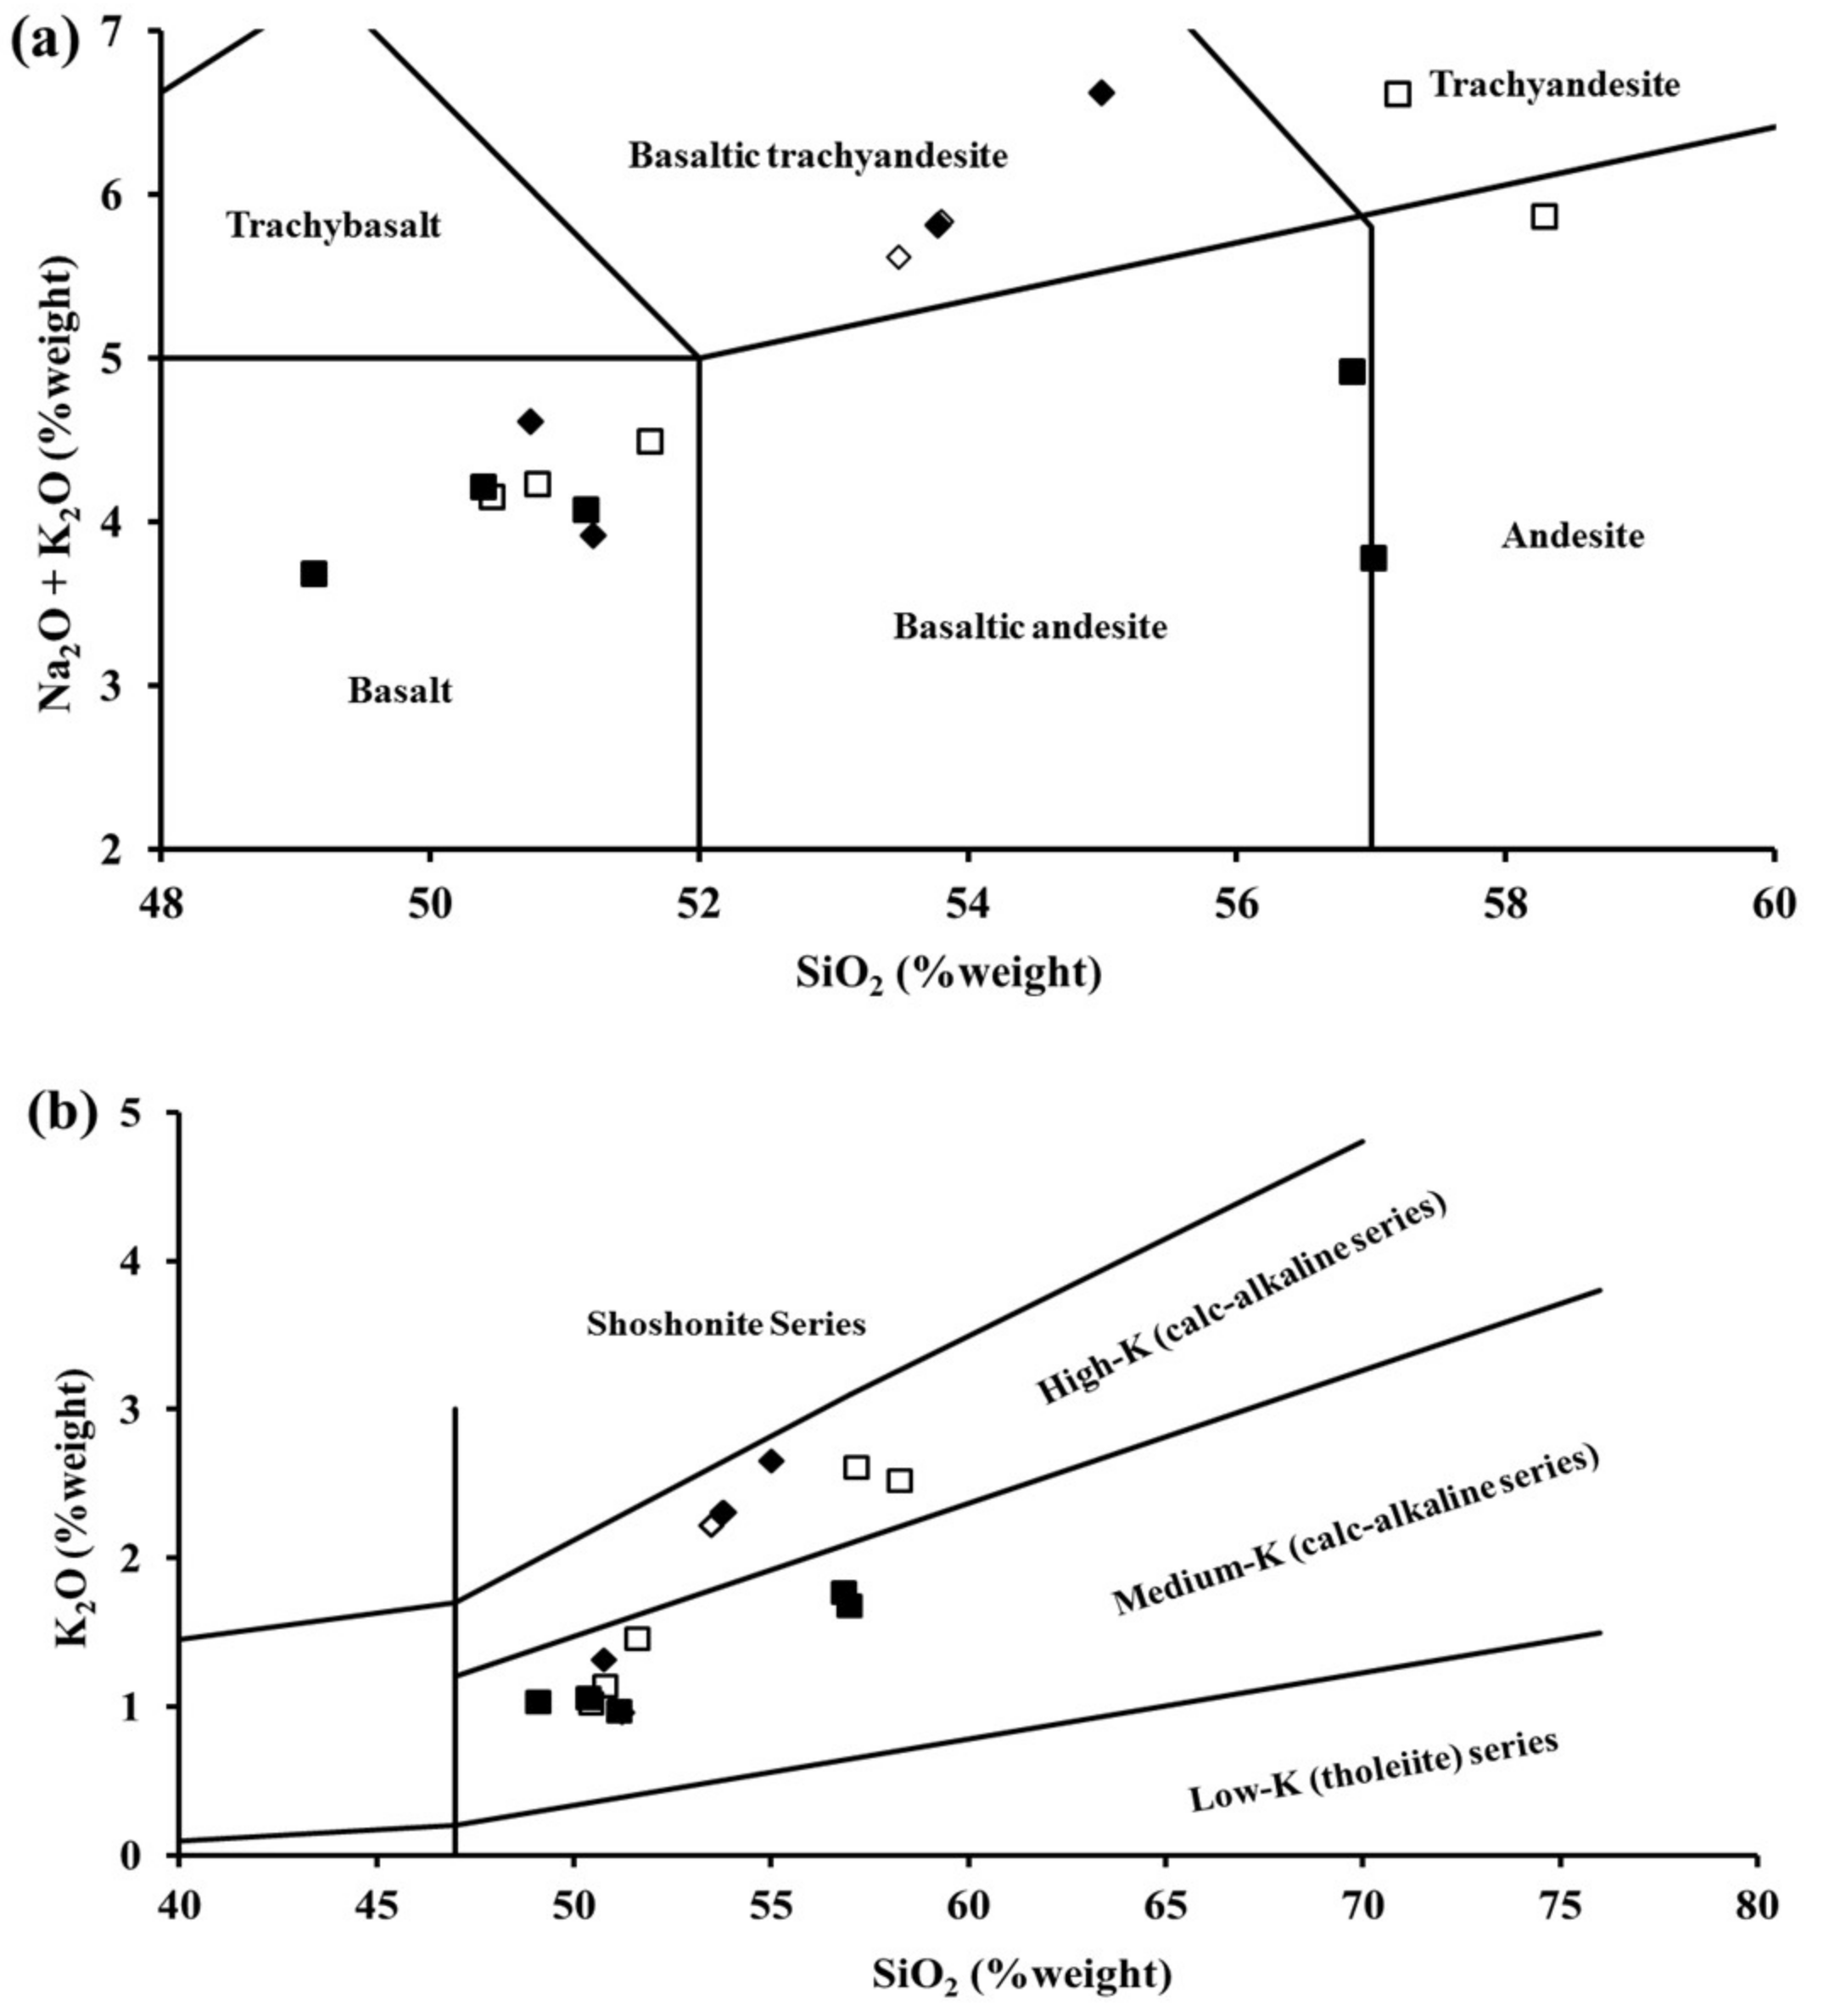
| SiO2 | 51.2 | 57.0 | 49.1 | 56.9 | 50.4 | 50.8 | 51.2 | 53.8 | 55.0 |
| P2O5 | 0.25 | 0.19 | 0.23 | 0.19 | 0.22 | 0.24 | 0.20 | 0.20 | 0.21 |
| K2O | 0.96 | 1.67 | 1.02 | 1.76 | 1.05 | 1.32 | 0.96 | 2.31 | 2.65 |
| CaO | 8.22 | 6.07 | 8.22 | 6.30 | 8.30 | 8.22 | 8.59 | 6.44 | 6.30 |
| TiO2 | 1.12 | 0.68 | 0.99 | 0.90 | 1.03 | 1.26 | 0.94 | 1.03 | 1.03 |
| MnO | 0.15 | 0.10 | 0.13 | 0.12 | 0.13 | 0.15 | 0.12 | 0.14 | 0.14 |
| Fe2O3 | 9.81 | 7.80 | 10.5 | 7.85 | 10.1 | 9.84 | 7.02 | 7.67 | 7.86 |
| Na2O | 3.10 | 2.10 | 2.65 | 3.15 | 2.85 | 3.30 | 2.95 | 3.51 | 3.97 |
| LOI | 0.80 | 2.28 | 0.52 | 1.20 | 0.92 | 0.24 | 2.56 | 2.40 | 0.08 |
| Total | 101 | 100 | 97.5 | 101 | 98.7 | 100 | 99.5 | 101 | 101 |
| Sample | χLF (×10−8 m3/kg) | χHF (×10−8 m3/kg) | χFD (%) | Saturation Field IRM (mT) | Grain Size (μm) | Mrs/Ms | Hcr/Hc |
|---|---|---|---|---|---|---|---|
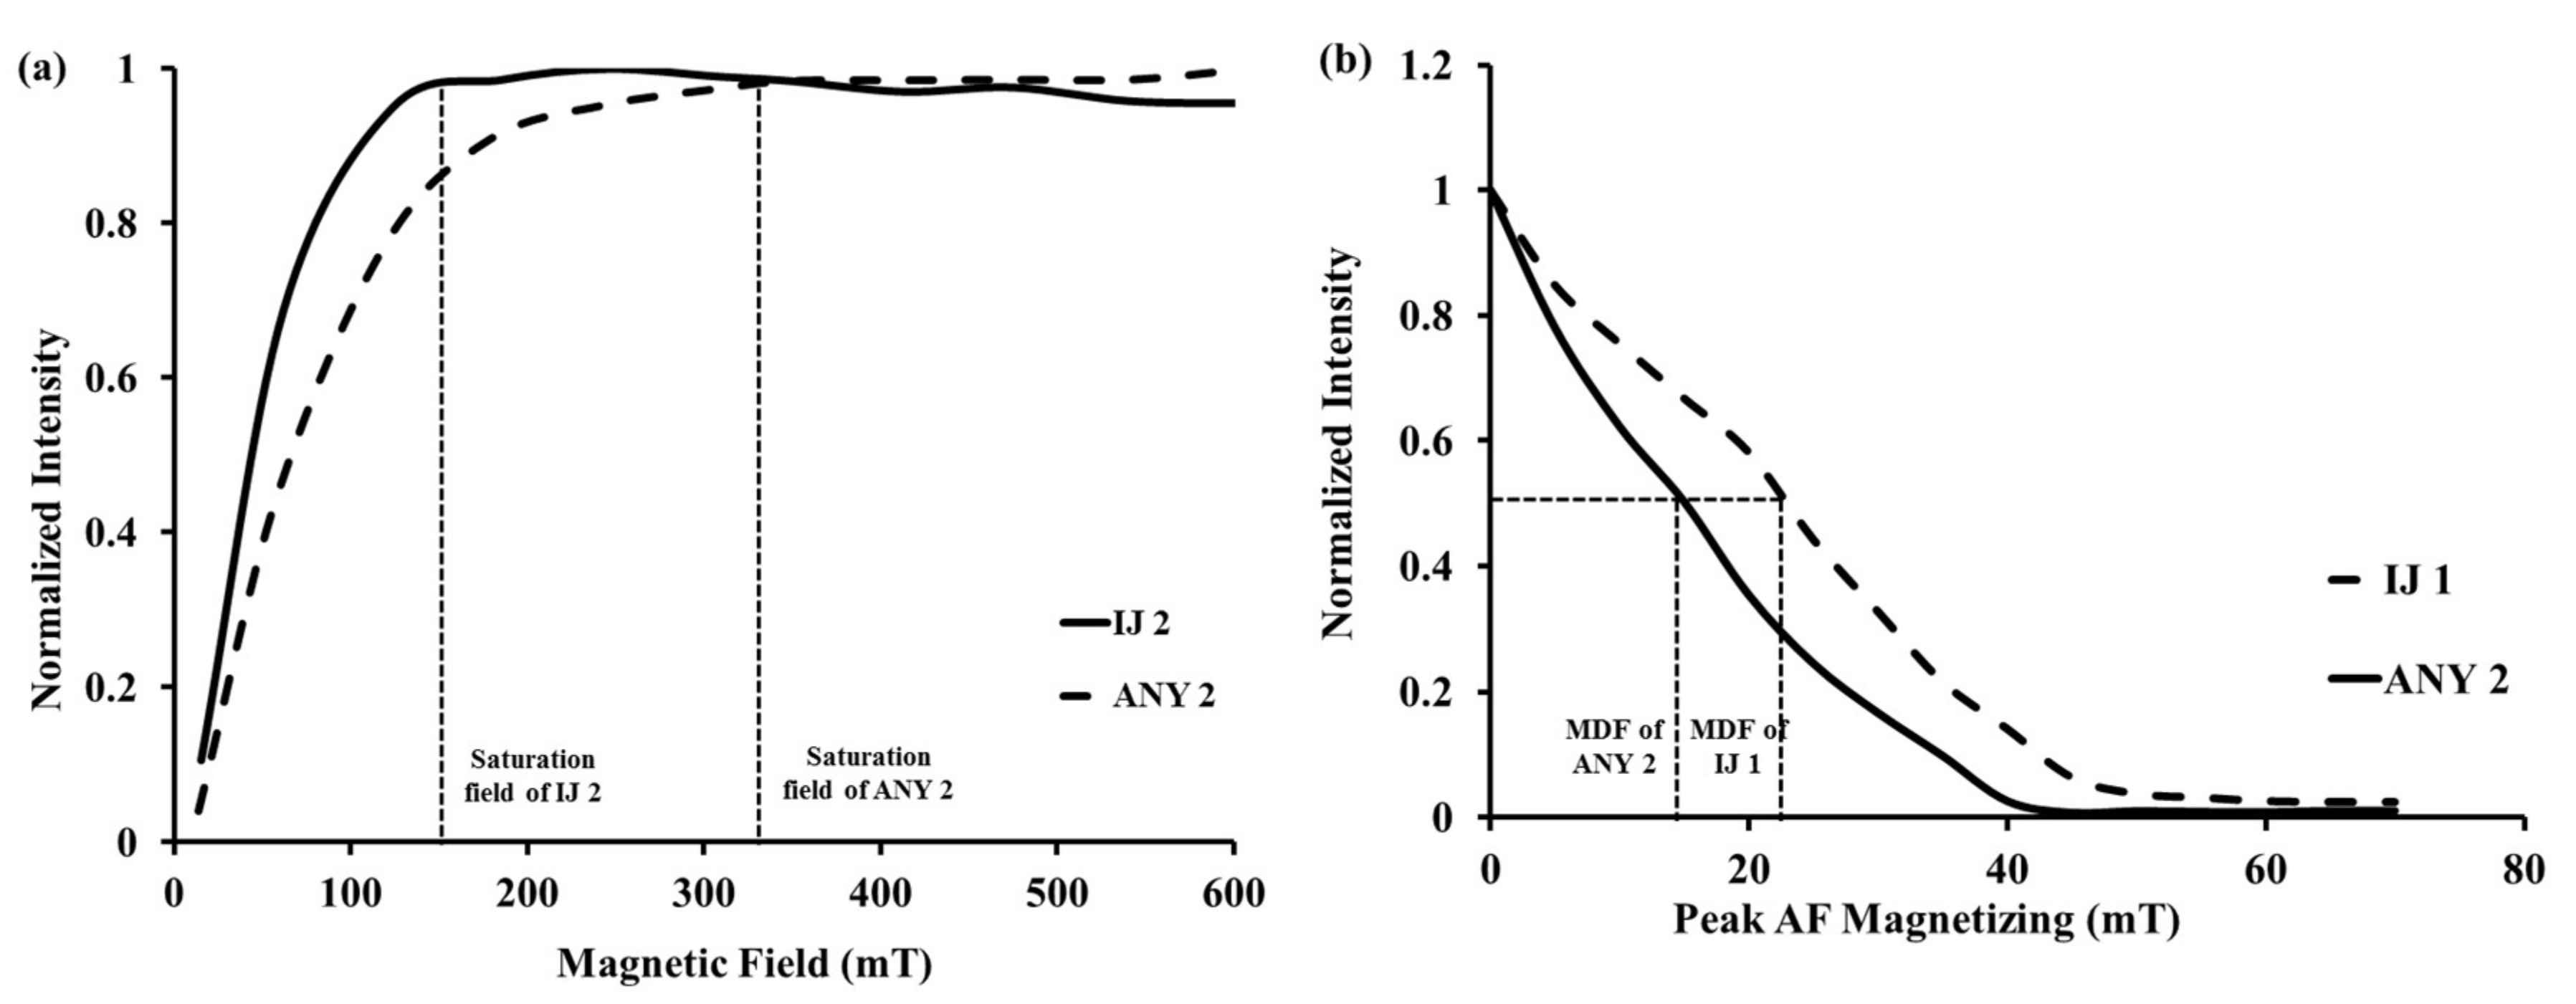
| IJ 1 | 955.000 | 949.850 | 0.54 | 250 | 1.00 | 0.39 | 1.56 |
| IJ 2 | 1735.35 | 1717.10 | 1.20 | 150 | 14.0 | 0.24 | 2.29 |
| IJ 3 | 899.570 | 882.300 | 1.92 | 400 | 1.50 | 0.34 | 1.89 |
| IJ 4 | 1795.17 | 1774.13 | 1.06 | 140 | 20.0 | 0.20 | 2.81 |
| IJ 5 | 734.870 | 720.070 | 2.02 | 340 | 0.60 | 0.32 | 1.85 |
| ANY 1 | 1669.63 | 1623.27 | 2.76 | 240 | 1.00 | 0.31 | 1.78 |
| ANY 2 | 884.530 | 865.970 | 1.58 | 340 | 5.00 | - | - |
| ANY 3 | 1085.00 | 1073.13 | 1.39 | 350 | 6.00 | 0.30 | 1.21 |
| ANY 4 | 945.830 | 921.300 | 2.59 | 337 | 6.00 | 0.26 | 1.98 |
© 2018 by the authors. Licensee MDPI, Basel, Switzerland. This article is an open access article distributed under the terms and conditions of the Creative Commons Attribution (CC BY) license (http://creativecommons.org/licenses/by/4.0/).
Share and Cite
Pratama, A.; Bijaksana, S.; Abdurrachman, M.; Santoso, N.A. Rock Magnetic, Petrography, and Geochemistry Studies of Lava at the Ijen Volcanic Complex (IVC), Banyuwangi, East Java, Indonesia. Geosciences 2018, 8, 183. https://doi.org/10.3390/geosciences8050183
Pratama A, Bijaksana S, Abdurrachman M, Santoso NA. Rock Magnetic, Petrography, and Geochemistry Studies of Lava at the Ijen Volcanic Complex (IVC), Banyuwangi, East Java, Indonesia. Geosciences. 2018; 8(5):183. https://doi.org/10.3390/geosciences8050183
Chicago/Turabian StylePratama, Aditya, Satria Bijaksana, Mirzam Abdurrachman, and Nono Agus Santoso. 2018. "Rock Magnetic, Petrography, and Geochemistry Studies of Lava at the Ijen Volcanic Complex (IVC), Banyuwangi, East Java, Indonesia" Geosciences 8, no. 5: 183. https://doi.org/10.3390/geosciences8050183