Article

Validating Rainfall-Runoff Modelling Using Satellite-Based and Reanalysis Precipitation Products in the Sre Pok Catchment, the Mekong River Basin

1
Southern Institute for Water Planning, Ho Chi Minh City 700000, Vietnam
2
IHE Delft Institute for Water Education, 2611 AX Delft, The Netherlands
3
Hydraulic Research Center, P.O. Box 318, Wad Medani, Sudan
4
Department of Water Management, Faculty of Civil Engineering and Geosciences, Delft University of Technology, 2628 CD Delft, The Netherlands
*
Author to whom correspondence should be addressed.
Geosciences 2018, 8(5), 164; https://doi.org/10.3390/geosciences8050164
Submission received: 15 February 2018 / Revised: 19 April 2018 / Accepted: 20 April 2018 / Published: 4 May 2018

Abstract

:
The limitation in quantity and quality of climate data, in particular rainfall measurements, directly affects the reliability of hydrological models, which negatively impacts on the quality of water resources planning and management. This is obviously true in poorly-gauged or in transboundary river catchments with limited practice of data sharing among the riparian states. Satellite-based and reanalysis rainfall products are increasingly recognised as a promising information source to supplement ground observations. This research aims to study the feasibility of using satellite-based and reanalysis rainfall data for rainfall-runoff modelling in the Sre Pok catchment-a poorly gauged catchment located in Vietnam and Cambodia. First, three selected rainfall products (Tropical Rainfall Measuring Mission-TRMM, CPC MORPHing Technique-CMORPH, and European Reanalysis-ERA-Interim) were compared against ground rainfall data of 13 rain-gauges, located inside and in the vicinity of the study catchment. The validation results show that the studied global datasets have a reasonably good correlation with ground observation at monthly time scale (NSE = 0.3 to 0.8, R2 = 0.4 to 0.8), but relatively poor correlation at daily scale (NSE = −0.4 to 0.3, R2 = 0.1 to 0.4). Next, a semi-distributed rainfall-runoff model based on HBV-Light was developed to validate these datasets in the Krong Ana sub-catchment of the Sre Pok. The results illustrate satisfactory to very good model performances at monthly time scale for the satellite-based and reanalysis rainfall inputs (NSE = 0.58 to 0.77, R2 = 0.59 to 0.78 for the calibration period from 2004 to 2007, while NSE = 0.59 to 0.80, R2 = 0.64 to 0.84 for the validation period from 2008 to 2010). However, only TRMM and ERA-Interim give acceptable results at daily scale with NSE = 0.52 to 0.67, R2 = 0.53 to 0.67 for the calibration period, and NSE = 0.41 to 0.61, R2 = 0.45 to 0.65 for the validation period. The study concludes that the tested satellite-based and reanalysis rainfall products, especially TRMM and ERA-Interim, could mimic reasonably well the monthly rainfall pattern in the study region. It also demonstrates a great opportunity to use satellite-based and reanalysis rainfall for runoff modelling at monthly time scale in the Sre Pok catchment and other poorly-gauged (transboundary) catchments in the region, for example in the Mekong and Red River Basins.

1. Introduction

Rainfall-runoff models offer a great opportunity to understand water resources system at the catchment scale [1,2], which is very important for water resources planning and management (IAHS 2013). However, developing a reliable rainfall-runoff model still remains a challenge due to the inadequacy and low accuracy of the input data, in particular precipitation estimates. Accurate precipitation measurement is still difficult due to its complex variability across time and space [1,3]. Traditionally, precipitation is monitored through ground-based measurement networks. The precipitation value at a station is considered to represent the average for a certain area around the station [4]. This results in inadequate representation of spatial variability of precipitation [1], which directly affects reliability of the rainfall-runoff models. This is true, especially for catchments with sparse or no rain gauge coverage [4,5,6,7,8].
In the last few decades, Satellite-Based and Reanalysis Precipitation (hereafter referred as SBRP) products has become a promising option to supplement Ground Measured Precipitation (hereafter referred as GMP) data [9,10] and facilitate researches on hydrology and modelling [11]. There has been a recognition of the advantages of satellite precipitation estimates [5] because of the high spatial and temporal resolution and the large areal coverage [12]. Thus, satellite-based and reanalysis precipitation estimates open the doors for improved hydrological assessment and water resources planning and management in poorly-gauged and un-gauged basins. This is in particular important for many regions in the world, where the density of precipitation gauges is normally low [6,10], or where data sharing is limited.
The application of different remotely sensed rainfall data in hydrological modelling has been studied for many years all over the world. However, there is no general conclusion on the accuracy and the reliability of streamflow simulation using these data sources. For example, Ref. [5] found that TMPA-3B42V6 results in simulated flows that were comparable to the ground observation at both 6-hour and monthly scales in Illinois river basin (USA). On the other hand, according to Ref. [13] this product cannot satisfactorily reproduce flows at daily scale in the Gilgel Abay watershed (the northwestern highland of Ethiopia). Similarly, Ref. [14] found that TRMM 3B42-V6 is inappropriate for daily flow simulation in Xinjiang catchment, Poyang lake basin, China. However, this rainfall product is successful in simulating the monthly flow in the same catchment. In other studies, Ref. [15] and Ref. [12], both demonstrated that flow simulation using satellite-based rainfall has a much better performance at monthly compared to daily time resolution in South America and the northeast of Tibet Plateau. In the upper Yellow river basin, daily TRMM-3B42V6 precipitation data could not simulate daily flow but good results were obtained when aggregated to monthly scale [12]. Ref. [16] suggested not using satellite-based rainfall estimates for low-flow simulation while almost all the tested satellite rainfall products result in good high-flow simulations in the 4 sub-basins of the Volta and Baro-Akobo basins. Ref. [17] also found that the satellite rainfall products will produce better results for the longer high-flow duration events.
There are some common lessons to be learned from the reviewed studies. Some authors agreed that model performance is improved when calibrated with respective satellite rainfall products compared to the calibration using observed rainfall (e.g., [13,16,17,18,19]). More promisingly, many scholars found a potential to use satellite-based rainfall sources for hydrological simulation (e.g., [5,13,15,16,17,18,19,20]. However, the quality of satellite-based rainfall products varies depending on the type of product, resolution (temporal and spatial), the season, climate, and topography of study areas [21,22,23]. For example, Ref. [23] found variable results with three precipitation products in case of seven basins of different characteristics in the southeastern United States. Therefore, a careful evaluation is required on case by case basis. This research aims to study the feasibility of using different SBRP data sources for a rainfall-runoff model to estimate runoff in the Sre Pok catchment (30,940 km2) of the Mekong River Basin, with focus on the Krong Ana sub-catchment (3080 Km2). First, the selected rainfall products were checked for their accuracy and reliability against GMP over the Sre Pok catchment. Next, a hydrological model was used to assess the accuracy of flow simulation using SBRP for the Krong Ana sub-catchment.
The paper consists of four main sections. Section 2 provides the information about the Sre Pok catchment and the selected rainfall-runoff model used for the evaluation. Section 2 also describes the required data and methods of preparing and validating them for rainfall-runoff simulation. The results and discussion are presented in Section 3. Finally, Section 4 synthesizes the summary and conclusions.

2. Materials and Methods
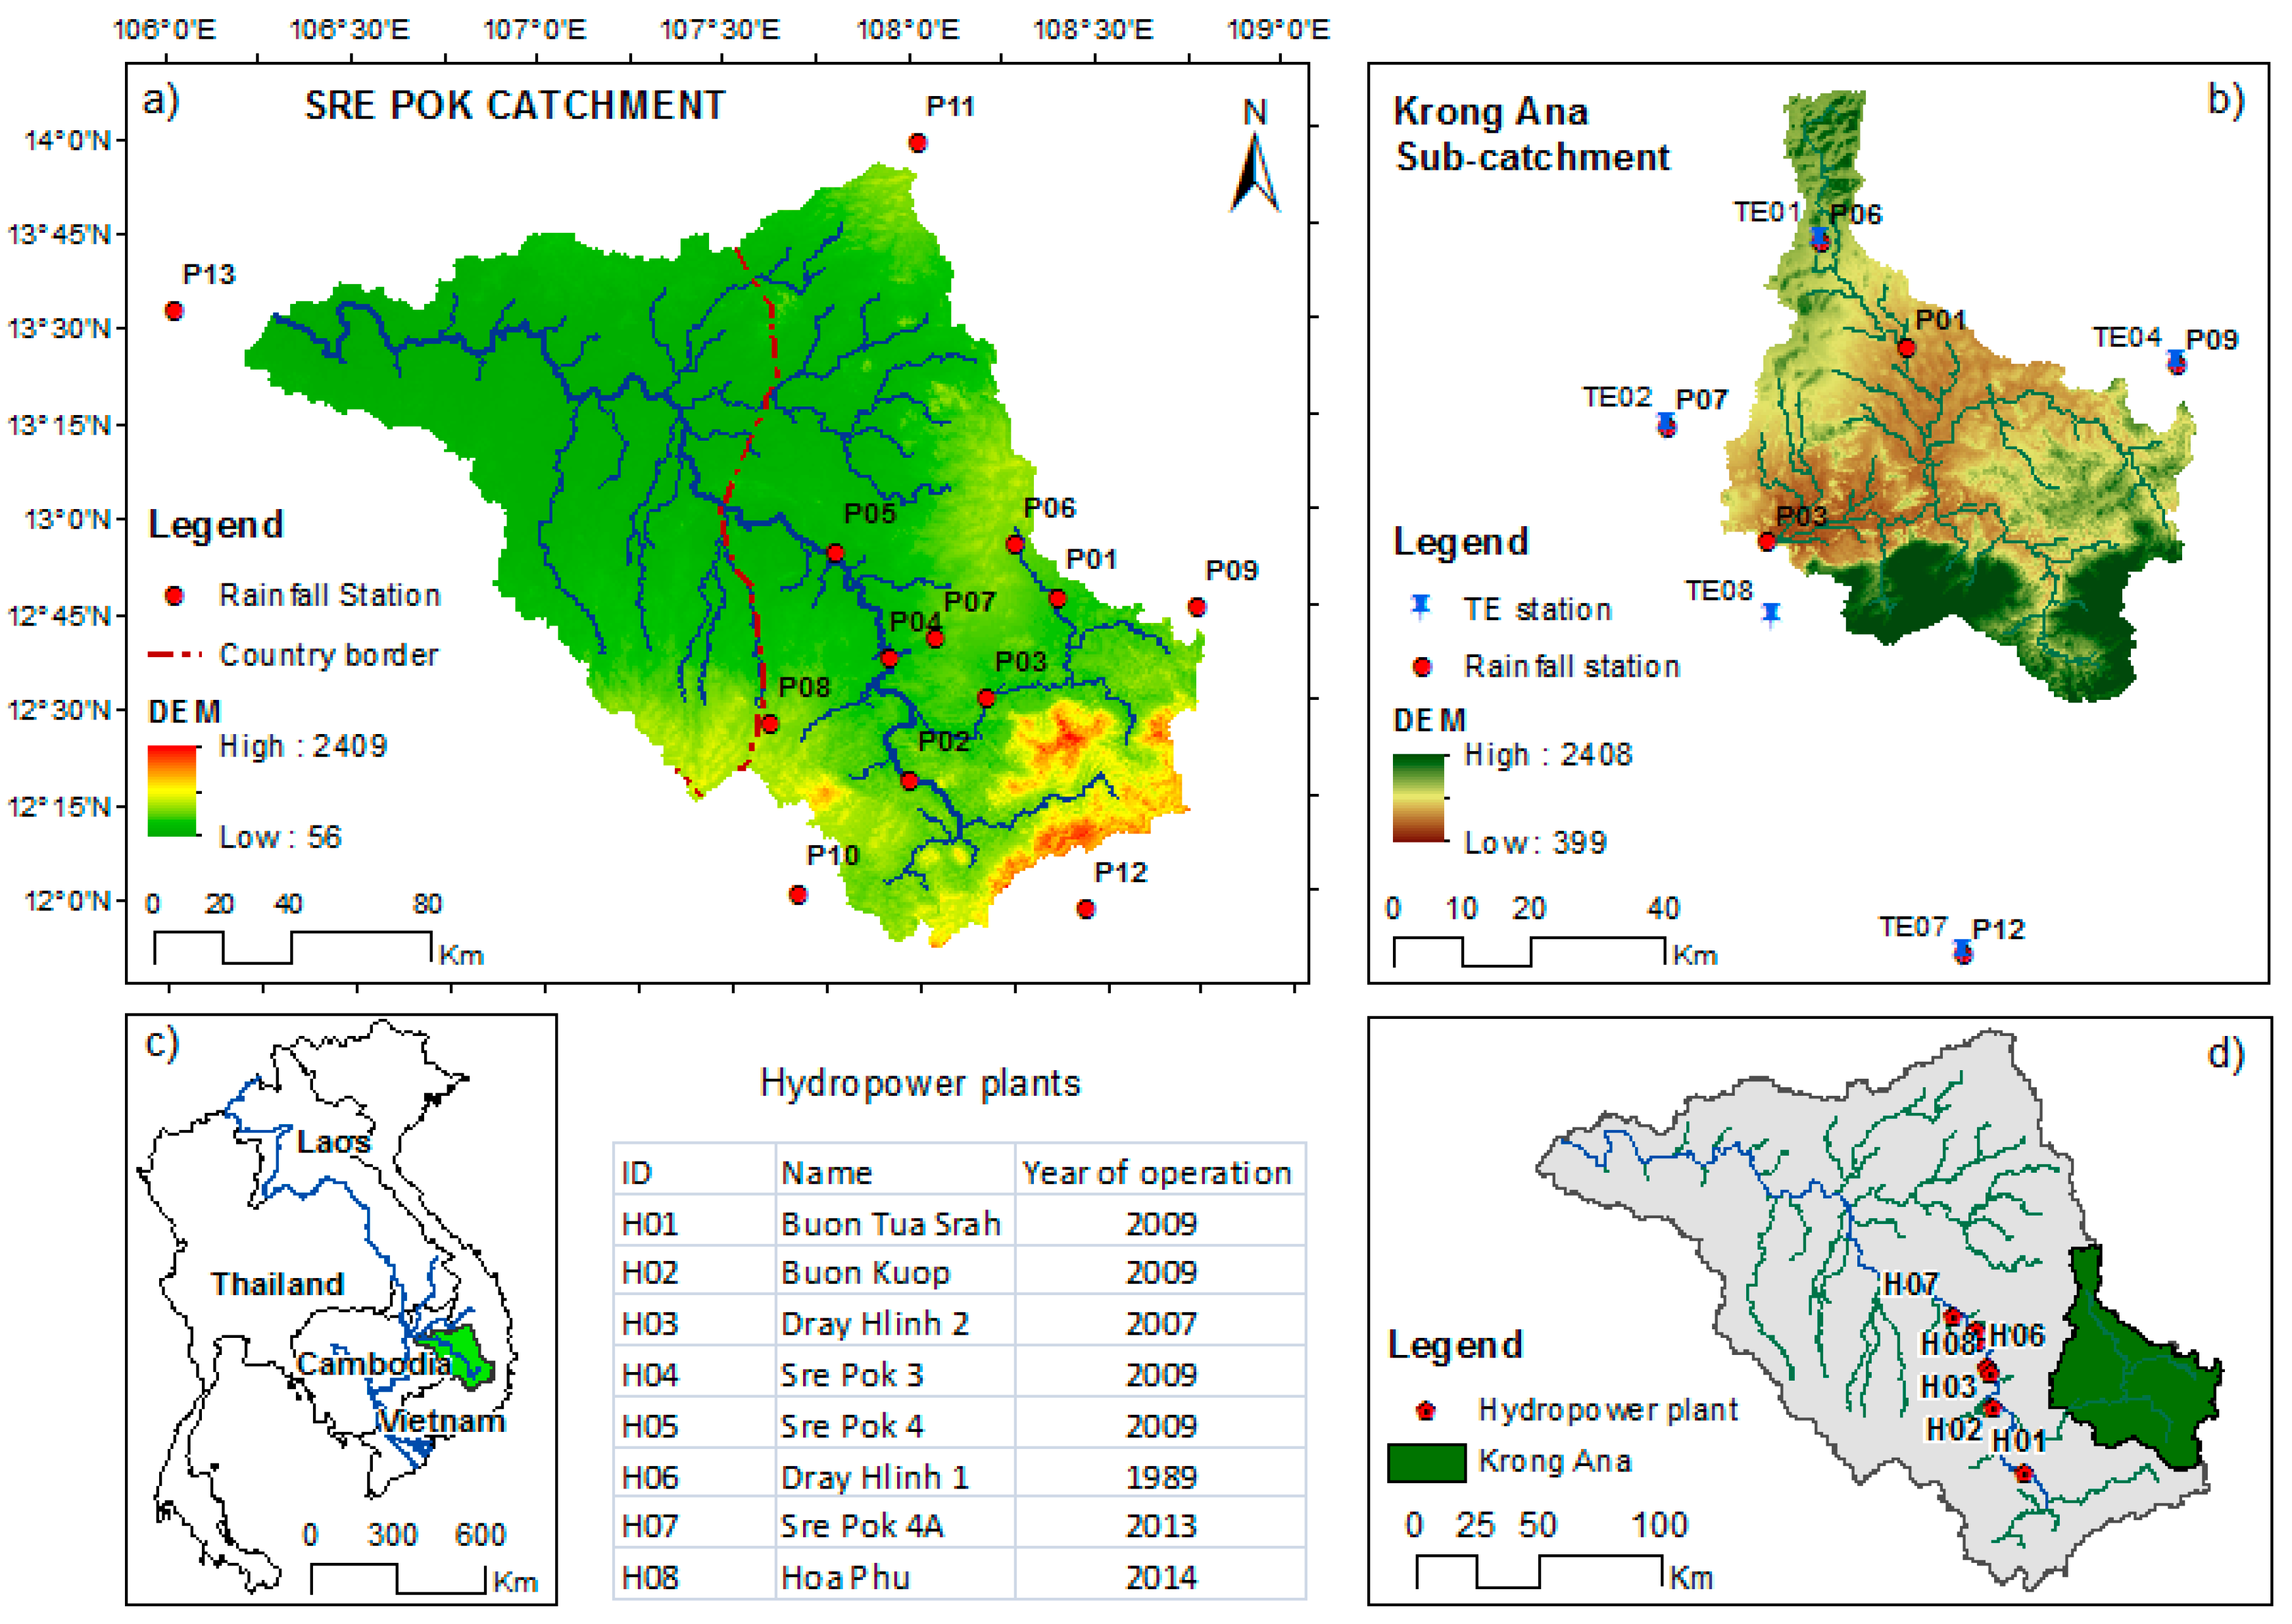
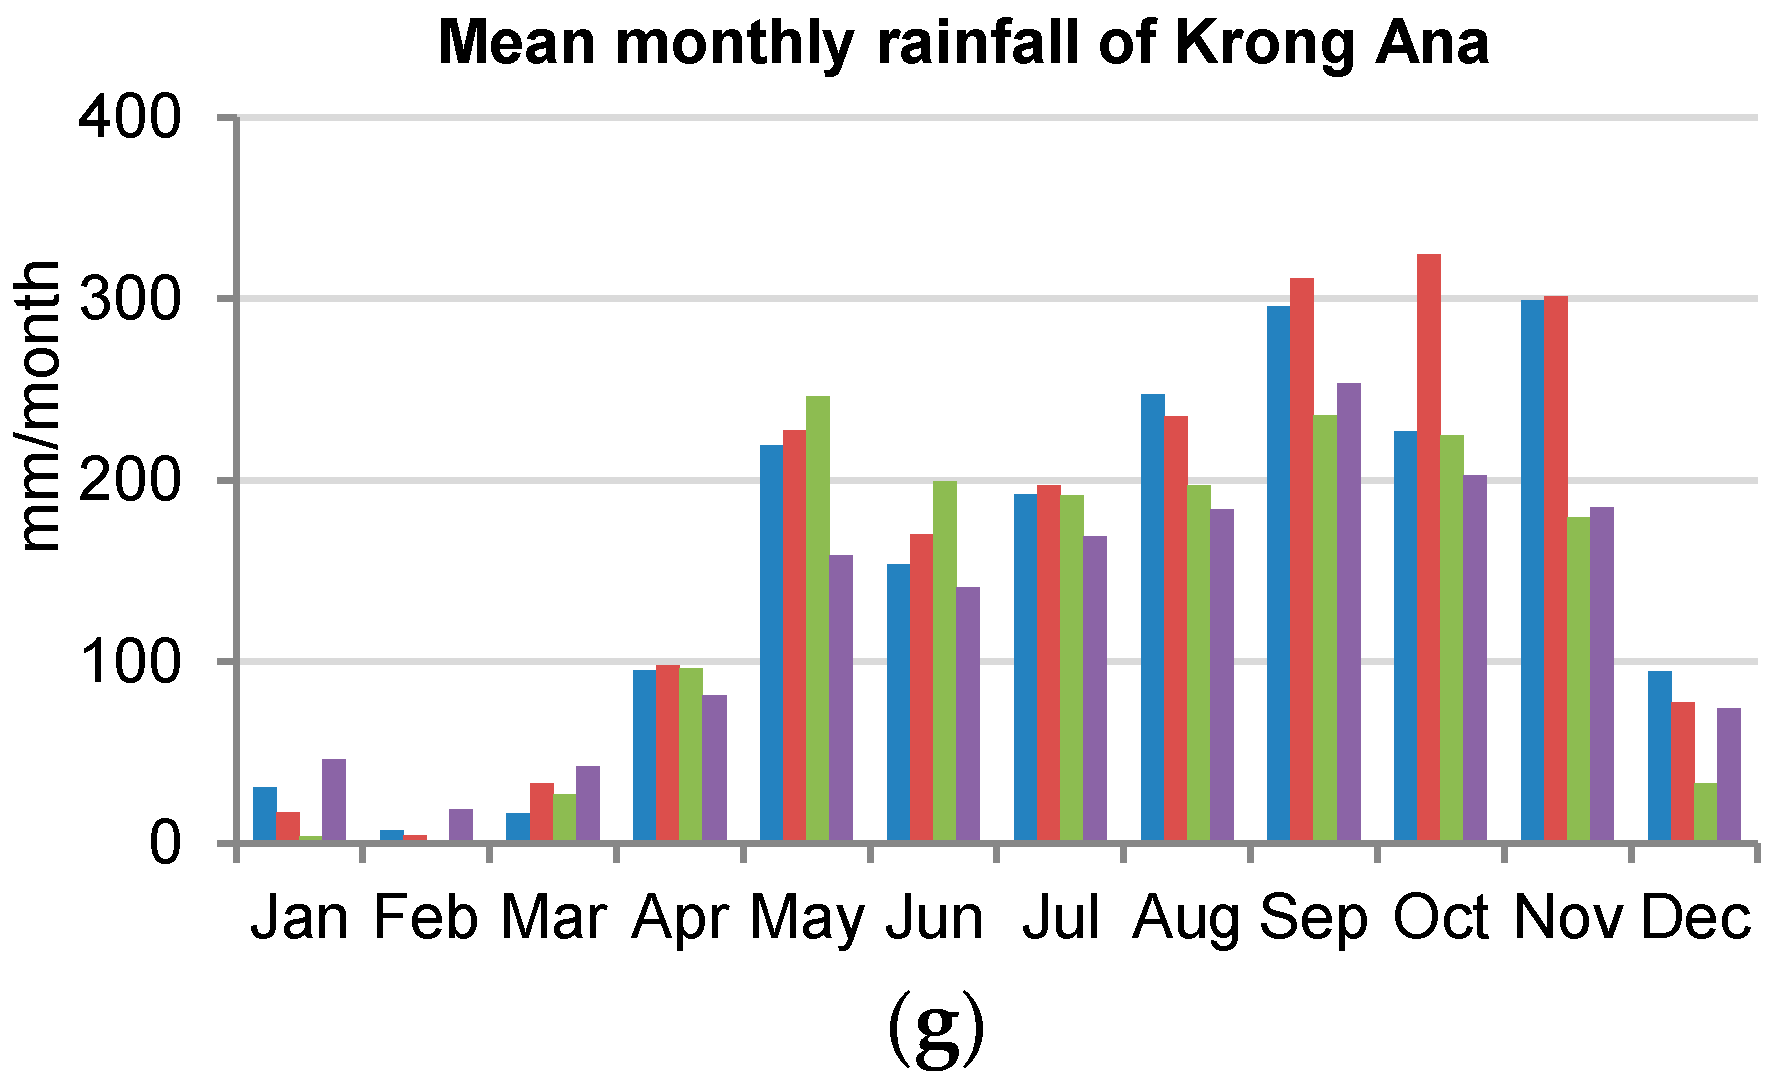
2.1. The Study Area

The Sre Pok catchment (30,940 km2) is a part of the Lower Mekong river basin, which lies on Vietnamese and Cambodian territory (Figure 1). Because of many reasons, mainly the poor resources to establish and maintain rain gauge network, the catchment has a very low density and uneven distribution of observation gauges, about 2380 km2/station (1513 km2/station in Vietnam and 12,780 km2/station in Cambodia), see Figure 1a. While data from Vietnam is available for a fairly long period and of relatively good quality, the data from Cambodia is poor and contains many gaps at all stations [24]. This situation will negatively affect reliability of hydrological modelling for the catchment, especially the sub-catchments without rain gauges.
The Sre Pok catchment has a wide range of topography with elevation varying between 56 m and 2409 m above mean sea level. Most of the catchment has low to medium elevation; only a small part in the southeast upper catchment is mountainous. The catchment is heavily influenced by tropical monsoon with two distinct seasons, rainy season from May to November and the dry season from December to April. Annual rainfall over the catchment ranges from 1400 to 2800 mm/year, which contributes about 32,000 Mm3/year to the total annual flow of the Mekong River [25]. However, the flow has a very high variability over the year. Up to 87% of annual flow is generated from the rainy season. The average temperature of the catchment is about 22 °C, slightly cooler in Vietnam (21.2 °C) and slightly hotter in Cambodia (23.2 °C) [26].

2.2. Data Used

The ground-based daily rainfall data were collected for 13 stations from: (i) Post-Doctoral Research Programme on Adaptation to Climate Change, phase 2 (PRoACC-II, IHE Delft Institution for Water Education, Delft, The Netherlands), (ii) the Regional Flood Mitigation and Management Program (RFMMP, Mekong River Commission), and (iii) the Water Resources Section (WRS, Department of Agriculture and Rural Development, Dak Lak Province), Vietnam, as given in Table 1. The rainfall data from PRoACC-II and WRS were originally obtained from Vietnam’s Hydro-Meteorological Data Center and the Central Highland Region of Hydro-Meteorological Center (both are under Vietnam Ministry of Natural Resources and Environment). The data of RFMMP were provided by the National Mekong River Committee of Cambodia originated from the Department of Hydrology and River Works (Ministry of Water Resources and Meteorology of Cambodia, Phnom Penh, Cambodia). The first eight stations, PS01 to PS08, are located inside the Sre Pok catchment while the other five stations (PS09 to PS13) are located nearby to the catchment. Only one station (Stung Treng) is in Cambodian territory, see Figure 1a and Table 1. All the data were thoroughly checked for their quality using screening, time series graphs, and double mass analysis technique. The data were found to be complete and accurate in the common period of 2001 to 2010, except Stung Treng station (from 2004 to 2010). This research has selected three SBRP products: TRMM-3B42V7, CMORPH and ERA-Interim. Table 2 indicates selected studies where these data sets were used for hydrological modelling.
These products were selected on the basis of their acceptable performance in previous studies, and because these data sets were publicly available. The TRMM (Tropical Rainfall Measuring Mission) is a joint satellite mission between NASA (The National Aeronautics and Space Administration of the USA, Washington, USA) and JAXA (the Japan Aerospace Exploration Agency, Tokyo, Japan). It was launched in November 1997 mainly for measurement of tropical and sub-tropical precipitation. The TRMM has three types of sensors including Precipitation Radar, Microwave Imager, and Visible Infrared Scanner. A wide range of TRMM products has been generated and can be freely accessed. TRMM-3B42V7 is the multiple-adjusted data product, available from 1 January 1998 for public assessment [3]. The product is available at relatively good spatial and temporal scales (0.25° × 0.25°, 3 h) and covers from 50° N to 50° S [27].
CMORPH (the Climate Prediction Center for morphing method) is the technique to generate rainfall data by combining motional vectors derived from geostationary satellite infrared data with precipitation obtained by passive microwave satellites. The rainfall product has a high temporal and spatial resolution (30 min and 8 km). It covers the globe from 60° N to 60° S. The data is available at the resolution of 3 h, 0.25° × 0.25° on the website of Climate Predict Centre (NOAA, Silver Spring, MD, USA) from 3 December 2002 [28].
The ECMWF (European Centre for Medium-Range Weather Forecasts, Reading, United Kingdom), founded in 1975 is a research institute and weather service. ERA-Interim has been developed since 2001 and is the latest reanalysis atmospheric system in the world. It is the product of the numerical model based mainly on assimilated information of humidity and temperature [29]. The data is available from 1 January 1979 to 30 June 2014 with spatial and temporal resolutions of 0.25° × 0.25° and 3 h. However, the analyzed rainfall data is available only at 6 h time resolution.
The three datasets were downloaded, for the period of 2003–2010, in the format of netCDF through websites as mentioned in Table 3. The data were then transformed to the common time series data sets using scripts developed in Python language and aggregated into daily data. During this step, the difference of times between satellite and ground-based data was considered. The ECMWF, TRMM, and CMORPH use UTC time (Coordinated Universal Time) [28,30,31], whereas gauged rainfall is measured using local time. Due to national regulation of Vietnam, rainfall is recorded at two main times per day, 7:00 and 19:00 (GMT+7). The rainfall of today is the accumulated rainfall from 19:00 yesterday to 19:00 today. Daily satellite-based rainfall for today was accumulated from 12:00 of the previous day to 12:00 today. However, TRMM uses UTC centered time which is ±90 min offset from the nominal times [27]. For instance, the rainfall at 12:00 UTC was accumulated from 10:30 UTC to 13:30 UTC. Therefore, there was still a difference of 3 h in daily TRMM estimation compared to observation.

2.3. Method of Data Comparison

Generally, there are three main methods to compare satellite-based (gridded data) and ground-based rainfall data, namely point-grid, areal, and grid-to-point comparison. The first is the direct comparison between gauged rainfall and rainfall of the respective grids in which gauges are located [32,33]. The second requires the interpolation of gauged data to be grid data; then the gauged-gridded data will be compared with grid data from remote sensing or re-analysis [12,13,32]. The third is the reversed method of the second, in that grid data are interpolated to the gauge cites by using bilinear interpolation of four adjacent-grid-cell values [34,35,36]. The second method is seen as a more meaningful comparison than the first as it compares exactly the same grids values while the first may involve large errors [13]. The second and the third demonstrate similar conclusions [34]. However, according to Ref. [35], the sparse-gauged network will significantly affect the accuracy of gauged-gridded data. Therefore, this study chose the third method using bilinear interpolation for the validation of satellite-based and reanalysis rainfall data.
After interpolation, all grid rainfall products were then compared to ground-measured rainfall at different temporal scales (daily and monthly) for the 13 stations during a common time period, from 2003 to 2010, except Stung Treng station, was from 2004 to 2010.

2.4. Rainfall-Runoff Model: HBV-Light

The HBV-Light model was chosen for the runoff simulation. The model has been developed by the Swedish Meteorological and Hydrological Institute (SMHI). HBV has been widely used for hydrological research [37,38,39,40,41]. The HBV model has been used for flood forecasting in Sweden since early 1970 [42]. The model has a simple and flexible structure and does not demand excessive datasets [40], which could be the reason for its wide application. In the Mekong region, the HBV model was applied in a study of ecosystem in Tonle Sap Lake [43], and developed for 13 Tonle Sap sub-catchments in a technical support project [44]. However, its application in the Mekong Region has not been common yet.
HBV is a conceptual rainfall-runoff model that simulates daily discharge using climatic inputs (daily rainfall, daily mean temperature, and daily potential evaporation). As many other hydrological models, the main principle of HBV is the water balance of the hydrological cycle. The model has four different routines including snow, soil moisture, response, and routing routines [37]. The model can be used as lumped or semi-distributed. For this research a Semi-distributed HBV model was developed, with different elevation bands and specific vegetation types representing the study catchment.

2.4.1. Model Setup

The rainfall-runoff model was intended to be developed for the entire Sre Pok catchment to verify the possibility of using SBRP for runoff simulation. However, the water discharge near the outlet has been modified because of the operation of hydropower plants in the upper mainstream. Moreover, with the limitation of data, it is difficult to set up a comprehensive model for the whole catchment. Therefore, the model was setup for a selected sub-catchment of Krong Ana where there is no influence of the hydropower plants, see Figure 1b,d. Its drainage area is about 3038 km2, and elevation varies from about 399 m to 2408 m above mean sea level. The agricultural land covers approximately 50% of the total natural area while forest accounts for 15%; remaining area includes bare land and other land use. The observed annual rainfall in the sub-catchment varies between 1300 mm/year to 2420 mm/year. The average daily temperature is about 23.6 °C. Although the model allowed for detailed spatial representation of the Krong Ana catchment, the resolution of rainfall dataset (0.25° × 0.25°) is much coarser, e.g., the catchment has been covered by 5 to 6 pixels. This doesn’t allow detailed analysis of model sensitivity to spatial scale, but good enough to compare model results for similar resolutions of rainfall datasets.
Ground-based rainfall data from the six ground-based rainfall stations were used to develop the model (see Figure 1b and Table 1). Temperature data were collected from Water Resources Section, Department of Agriculture and Rural Development in Dak Lak province. The data sets were then checked for quality and data gaps were filled using regression analysis before preparing and using as inputs for the modelling purpose. Daily potential evaporation was calculated from maximum, minimum, and mean temperature using Hargreaves method [45]. The observed mean daily rainfall, temperature, and potential evaporation for the sub-catchment were estimated using Thiessen polygon method. The SBRP for the sub-catchment were calculated based on areal average method. The model was setup with 10 elevation bands and 3 vegetation zones.

2.4.2. Model Simulations

Considering the availability of both SBRP and GMP data, the period from January 2003 to December 2010 was selected for runoff simulation. The year 2003 was used for warming-up the model; 2004–2007 for calibration, while 2008–2010 was used for validation. The calibration and validation were conducted separately for GMP and for each of the SBRP (TRMM, CMORPH and ERA-Interim). In fact, first we have attempted to use the same calibration parameters from the model run with MGP input, and apply it for the other datasets. The results were poor. Then, we followed automatic calibration for each model separately. This is in agreement with analysis given in the literature (e.g., [13,16,18,19]).
All results were compared with each other to assess the accuracy of runoff simulation using different types of SBRP inputs. During calibration, the Genetic Algorithm optimization method in automatic calibration was applied to find the most suitable parameters set for each simulation. The Genetic Algorithm was chosen on the basis that this method was deemed efficient and required fewer simulations compared to other optimization methods, such as Monte-Carlo method, which is also available in the HBV-Light Software. For example, trial tests indicated acceptable results with 6000 simulations using Genetic Algorithm when compared with the results of over 100,000 simulations by Monte-Carlo. The parameter ranges for optimization were based on Ref. [40].
The Nash-Sutcliffe Efficiency (NSE) was used as an objective function. The best parameter set is the one that produces maximum value of the objective function. The performance of the best parameter set was also evaluated using additional evaluation criteria, discussed below.
Daily flow at the outlet of the sub-catchment (Giang Son station) was used as a reference flow for calibration and validation.

2.4.3. Evaluation Indicators

To evaluate the accuracy of SBRP data compared to the ground observation and the performance of the model, both visual inspection and statistical criteria such as NSE, coefficient of determination (R2), and Bias (%) were applied. Besides, NSE with logarithmic values (LogNSE) was also employed for evaluating the model performance.
NSE = 1 ( Q o b s ( t ) Q s i m ( t ) ) 2 ( Q o b s ( t ) Q ¯ o b s ) 2
LogNSE = 1 ( l n Q o b s ( t ) l n Q s i m ( t ) ) 2 ( l n Q o b s ( t ) l n Q ¯ o b s ) 2
R 2 = ( ( Q o b s ( t ) Q ¯ o b s ) ( Q s i m ( t ) Q ¯ s i m ) ) 2 ( Q o b s ( t ) Q ¯ o b s ) 2 ( Q s i m ( t ) Q ¯ s i m ) 2
Bias = ( Q s i m ( t ) Q o b s ( t ) ) Q o b s ( t ) × 100
where, Qobs(t) and Qsim(t) are the observed and simulated discharge at time t, Q ¯ o b s and Q ¯ s i m are the average observed and simulated discharge.
Ref. [46] reviewed 128 cases of flow simulation and suggested general ranges of statistical indicators for model performance. According to the authors, a simulation can be ranked as satisfactory when NSE > 0.50 and bias < ±25%, as good performance when 0.65 < NSE ≤ 0.75 and ±10% ≤ bias < ±15%, and as very good when NSE > 0.75 and bias ≤ ±10%. These ranges were applied for the performance evaluation of this study. Also, in terms of R2 and LogNSE, the research used the same performance ratings as NSE.

3. Results and Discussion

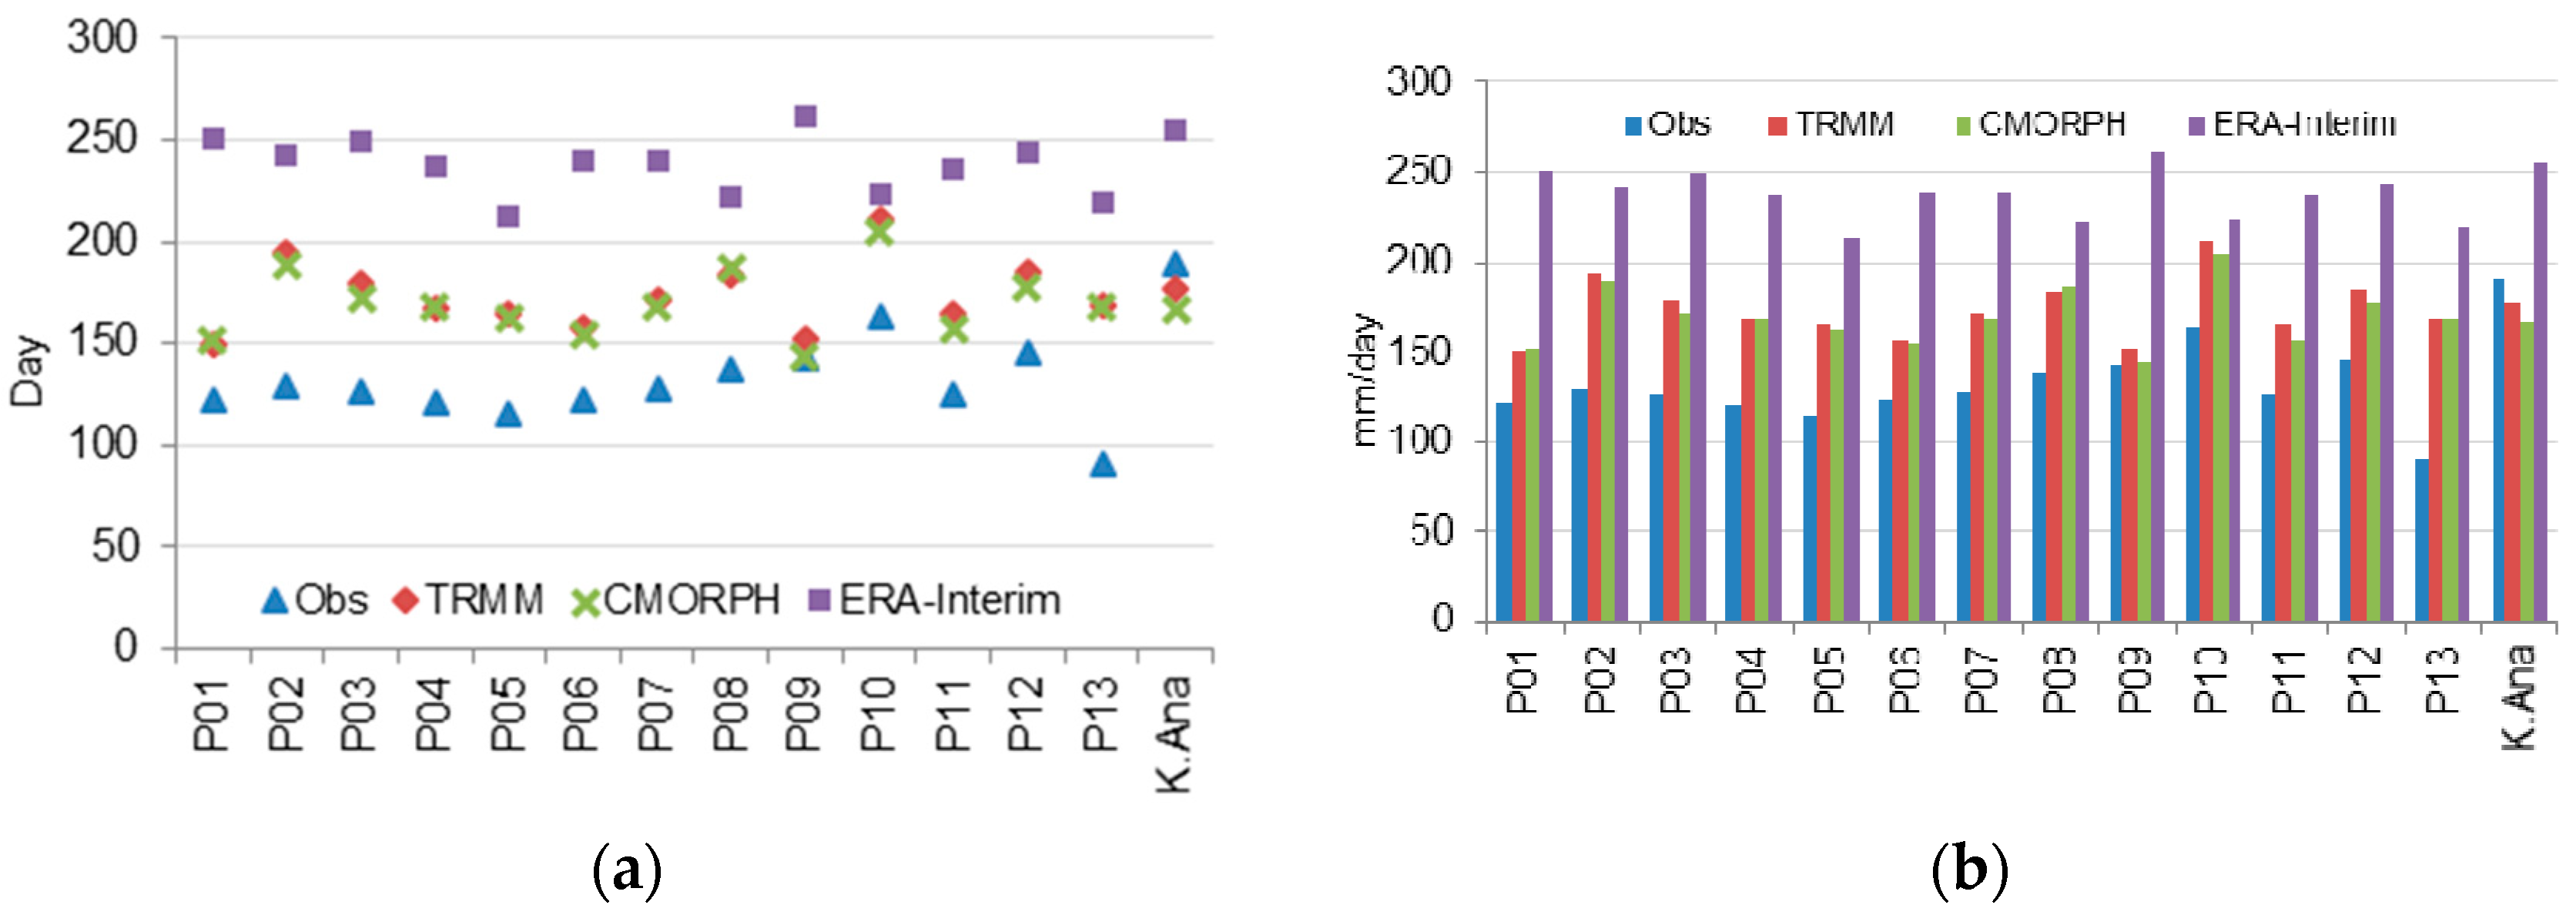
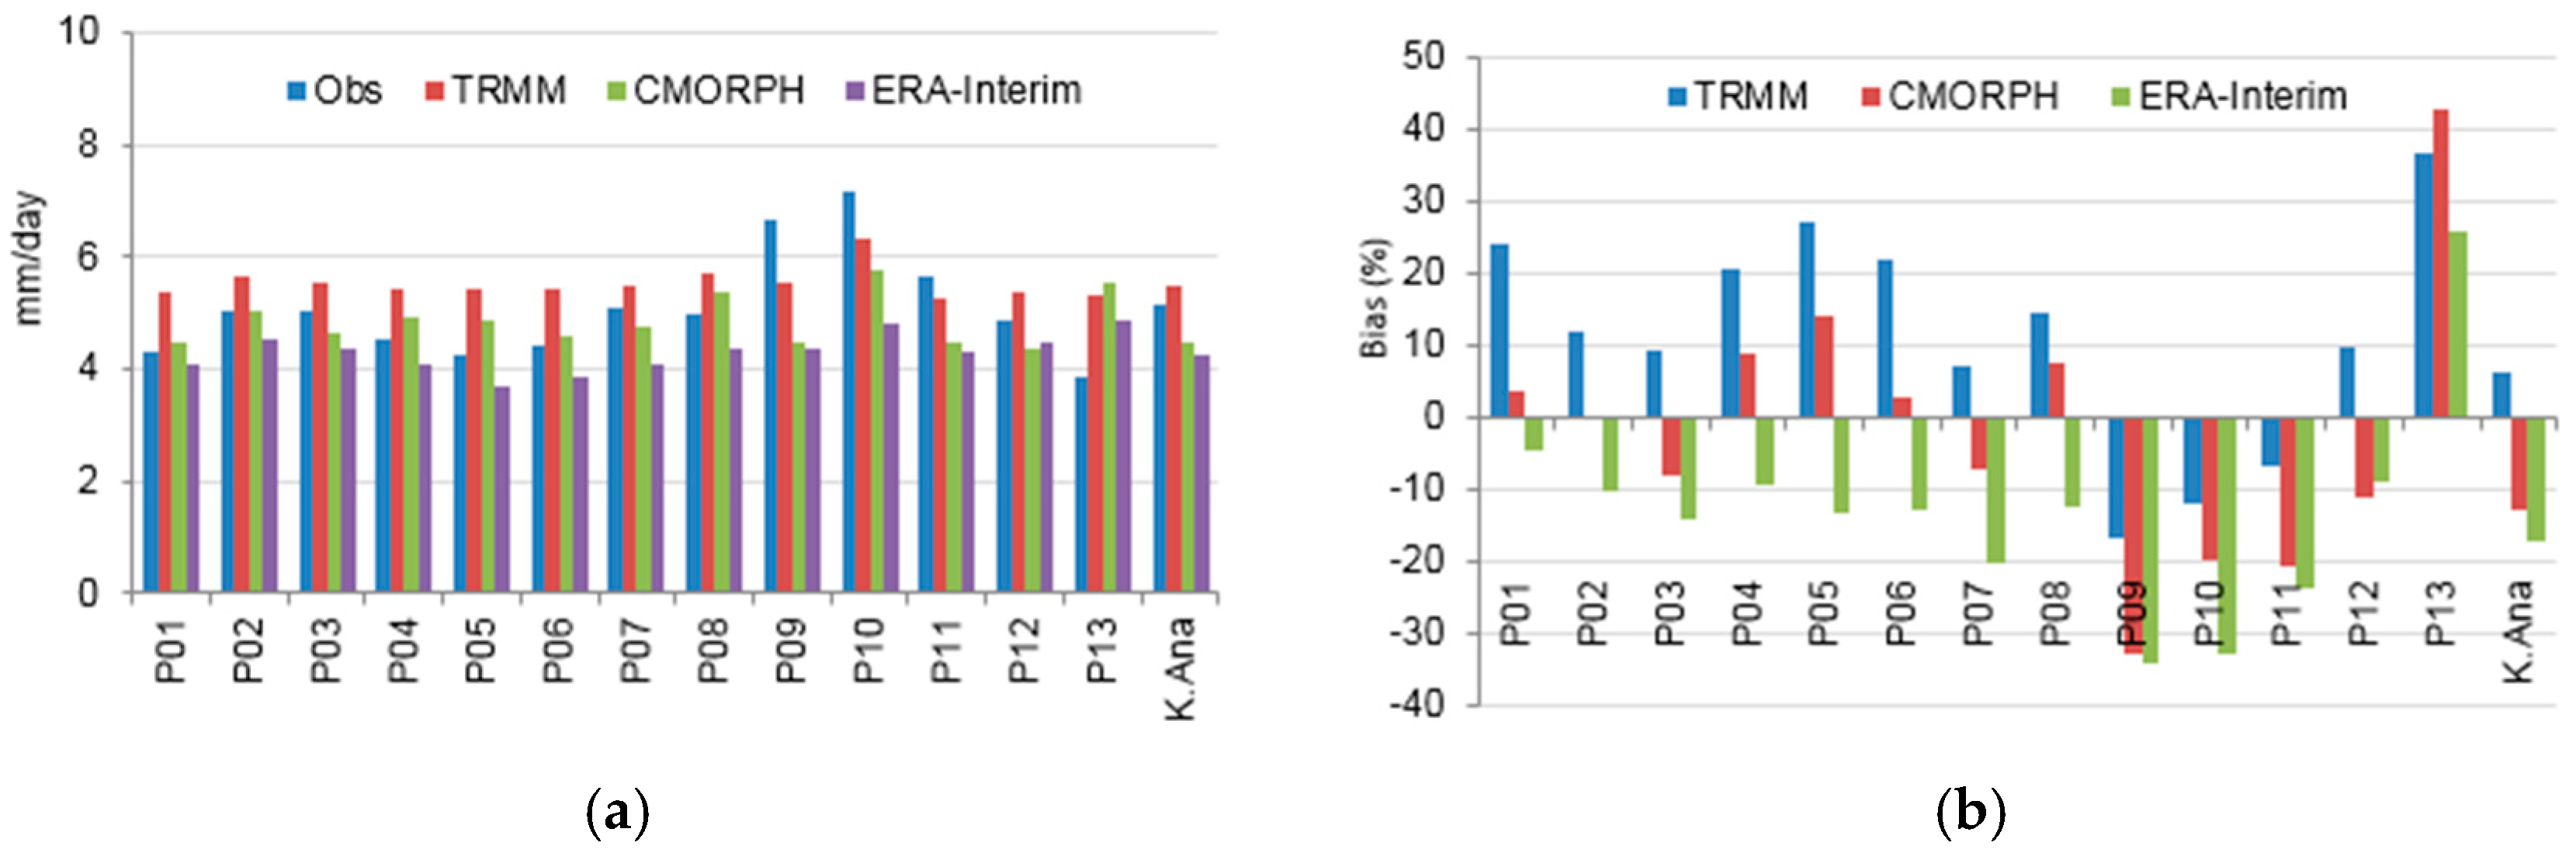
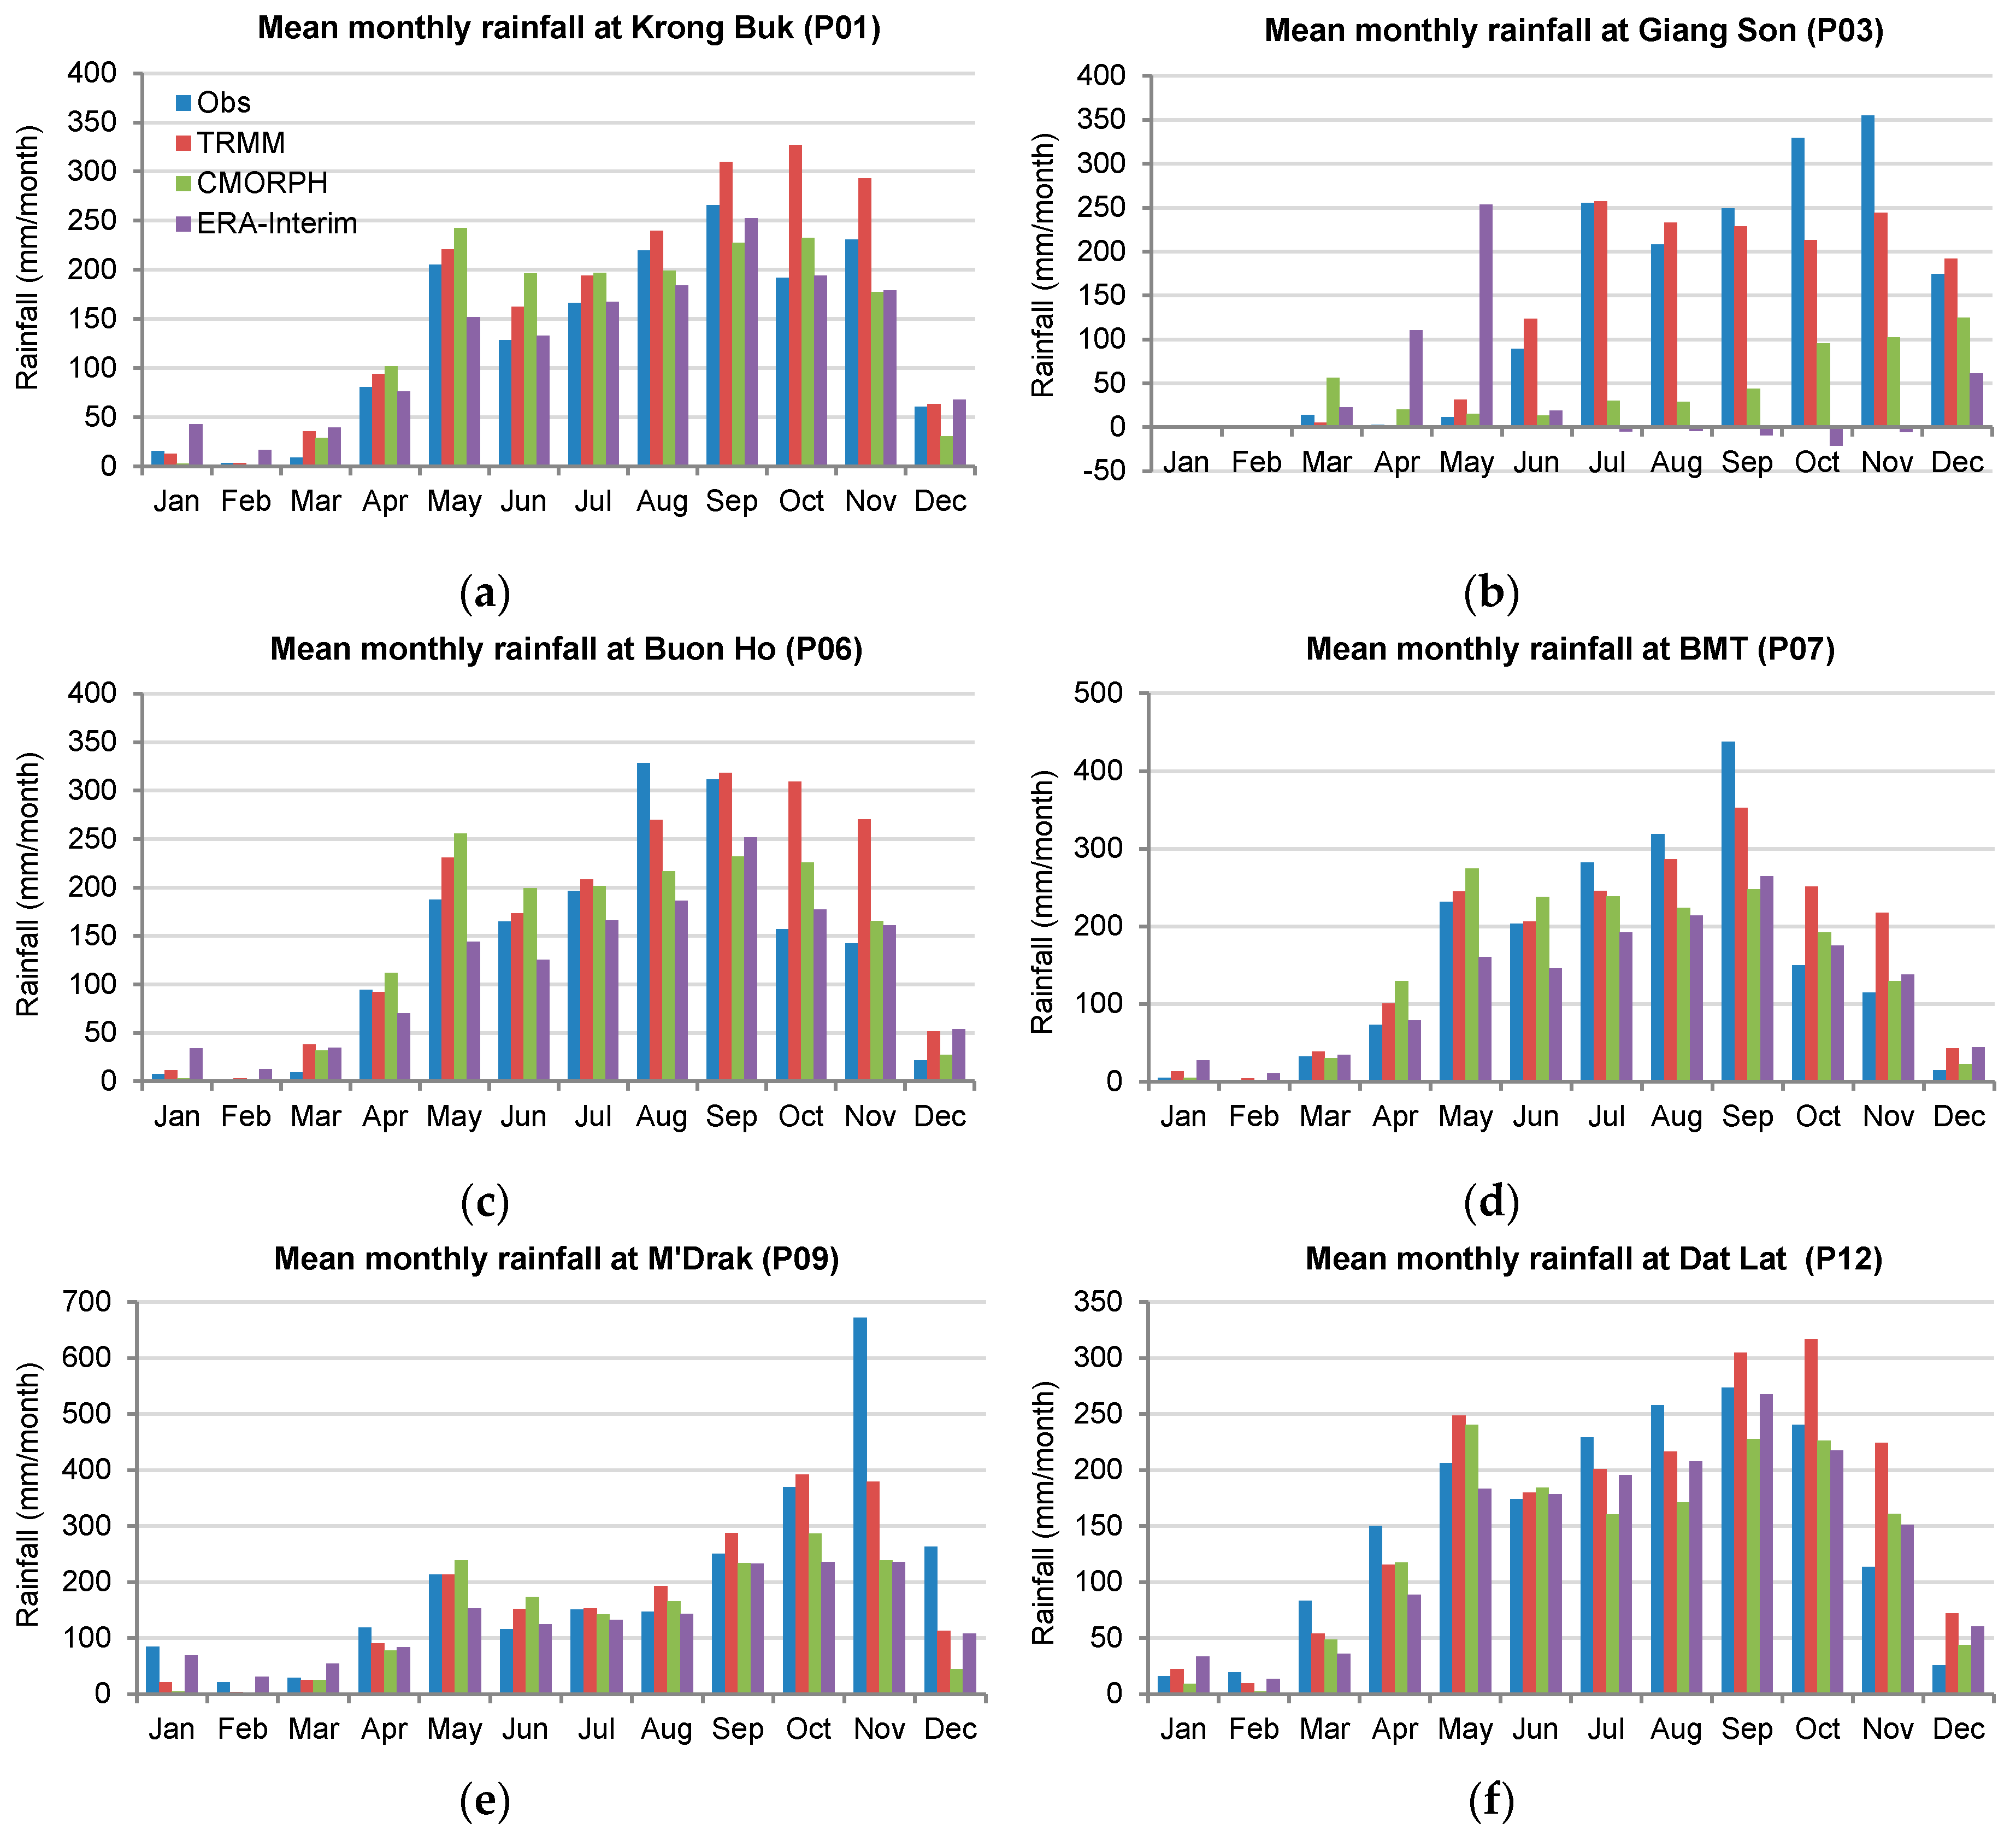
3.1. Validation of SBRP against GMP

First the performance of rainfall products for the daily time scale is presented. The studied SBRP products generally overestimate the number of rainy days per year at most of the stations (Figure 2a). TRMM and CMORPH have similar trends and perform much better than ERA-Interim. The number of rainy days by ERA-Interim is almost double to the observed values at ground stations. This result is similar to the finding of Ref. [33] in the Zambezi and Volta basins in Africa. According to the authors, this might be due to the inability of sensors to differentiate between drizzle and light rain. However, this might also reflect the ability of sensors to capture areal rainfall in the surrounding area of a ground rainfall station when there is no rain at that station [47]. Similarly, the maximum daily rainfall is also overestimated by the examined SBRP products (Figure 2b). For average rainfall over the Krong Ana Sub-catchment, the trend is quite different. Only Era-Interim significantly overestimates the number of rainy days and the value of average maximum daily rainfall. TRMM and CMORPH demonstrate a performance that slightly underestimates these factors. TRMM agrees well with GMP.
At daily time step, the estimated values of R2 and NSE (Table 4) illustrate that none of the SBRP agrees well with the GMP. The correlations between them are very poor. The values of R2 vary from 0.11 to 0.39, and most of the lowest values are for ERA-Interim (from 0.11 to 0.26). The R2 values of TRMM are slightly higher than that of CMORPH and ERA-Interim over all stations, except for Dak Mil (P08). In terms of NSE, CMORPH demonstrates best values among the examined SBRP products.
However, all the tested products have generally very low NSE values with the maximum of 0.33. At sub-catchment scale, the values of R2 and NSE for Krong Ana are also low although higher than those at all stations of the three SBRP products. As shown in Figure 3, for mean daily rainfall, TRMM overestimates rainfall at most stations of the sub-catchment. ERA-Interim tends to underestimate rainfall while CMORPH shows a mix pattern at all stations. However, both CMORPH and ERA-Interim underestimate mean rainfall for Krong Ana Sub-catchment. However, there is a also an underestimated trend evident from all products at M’Drak, Dak Nong and Pleiku station (P09, P10 and P11).
The results of the comparison of mean monthly rainfall are shown in Figure 4. The figure illustrates that the seasonal pattern is well reflected by all rainfall sources. However, three SBRP products over estimate the rainfall in the dry months (November to April, see Figure 5), while showing a relatively better agreement during the wet months (May to September, see Figure 6). The abnormal values are generally larger for the dry season than for the wet season. ERA-Interim has a tendency to underestimate the rainfall at all stations whereas TRMM and CMORPH show variable patterns.
The result of statistical indicators at the monthly timescale is more promising and far better compared to the daily time scale as given in Table 5. About two thirds of R2 are greater than 0.65, which reflect a good linear correlation between SBRP and GMP. TRMM has the best correlation at most of the stations with R2 ranging from 0.58 to 0.81, and 11 over 13 stations having an R2 greater than 0.65. ERA-Interim has slightly better R2 values compared to CMORPH in most cases. R2 values for ERA-Interim fluctuate between 0.52 and 0.74 while those of CMORPH range between 0.4 and 0.82. CMORPH has better NSE values than ERA-Interim. On the whole, TRMM demonstrates the best performance at most of the stations.

3.2. Runoff Simulations

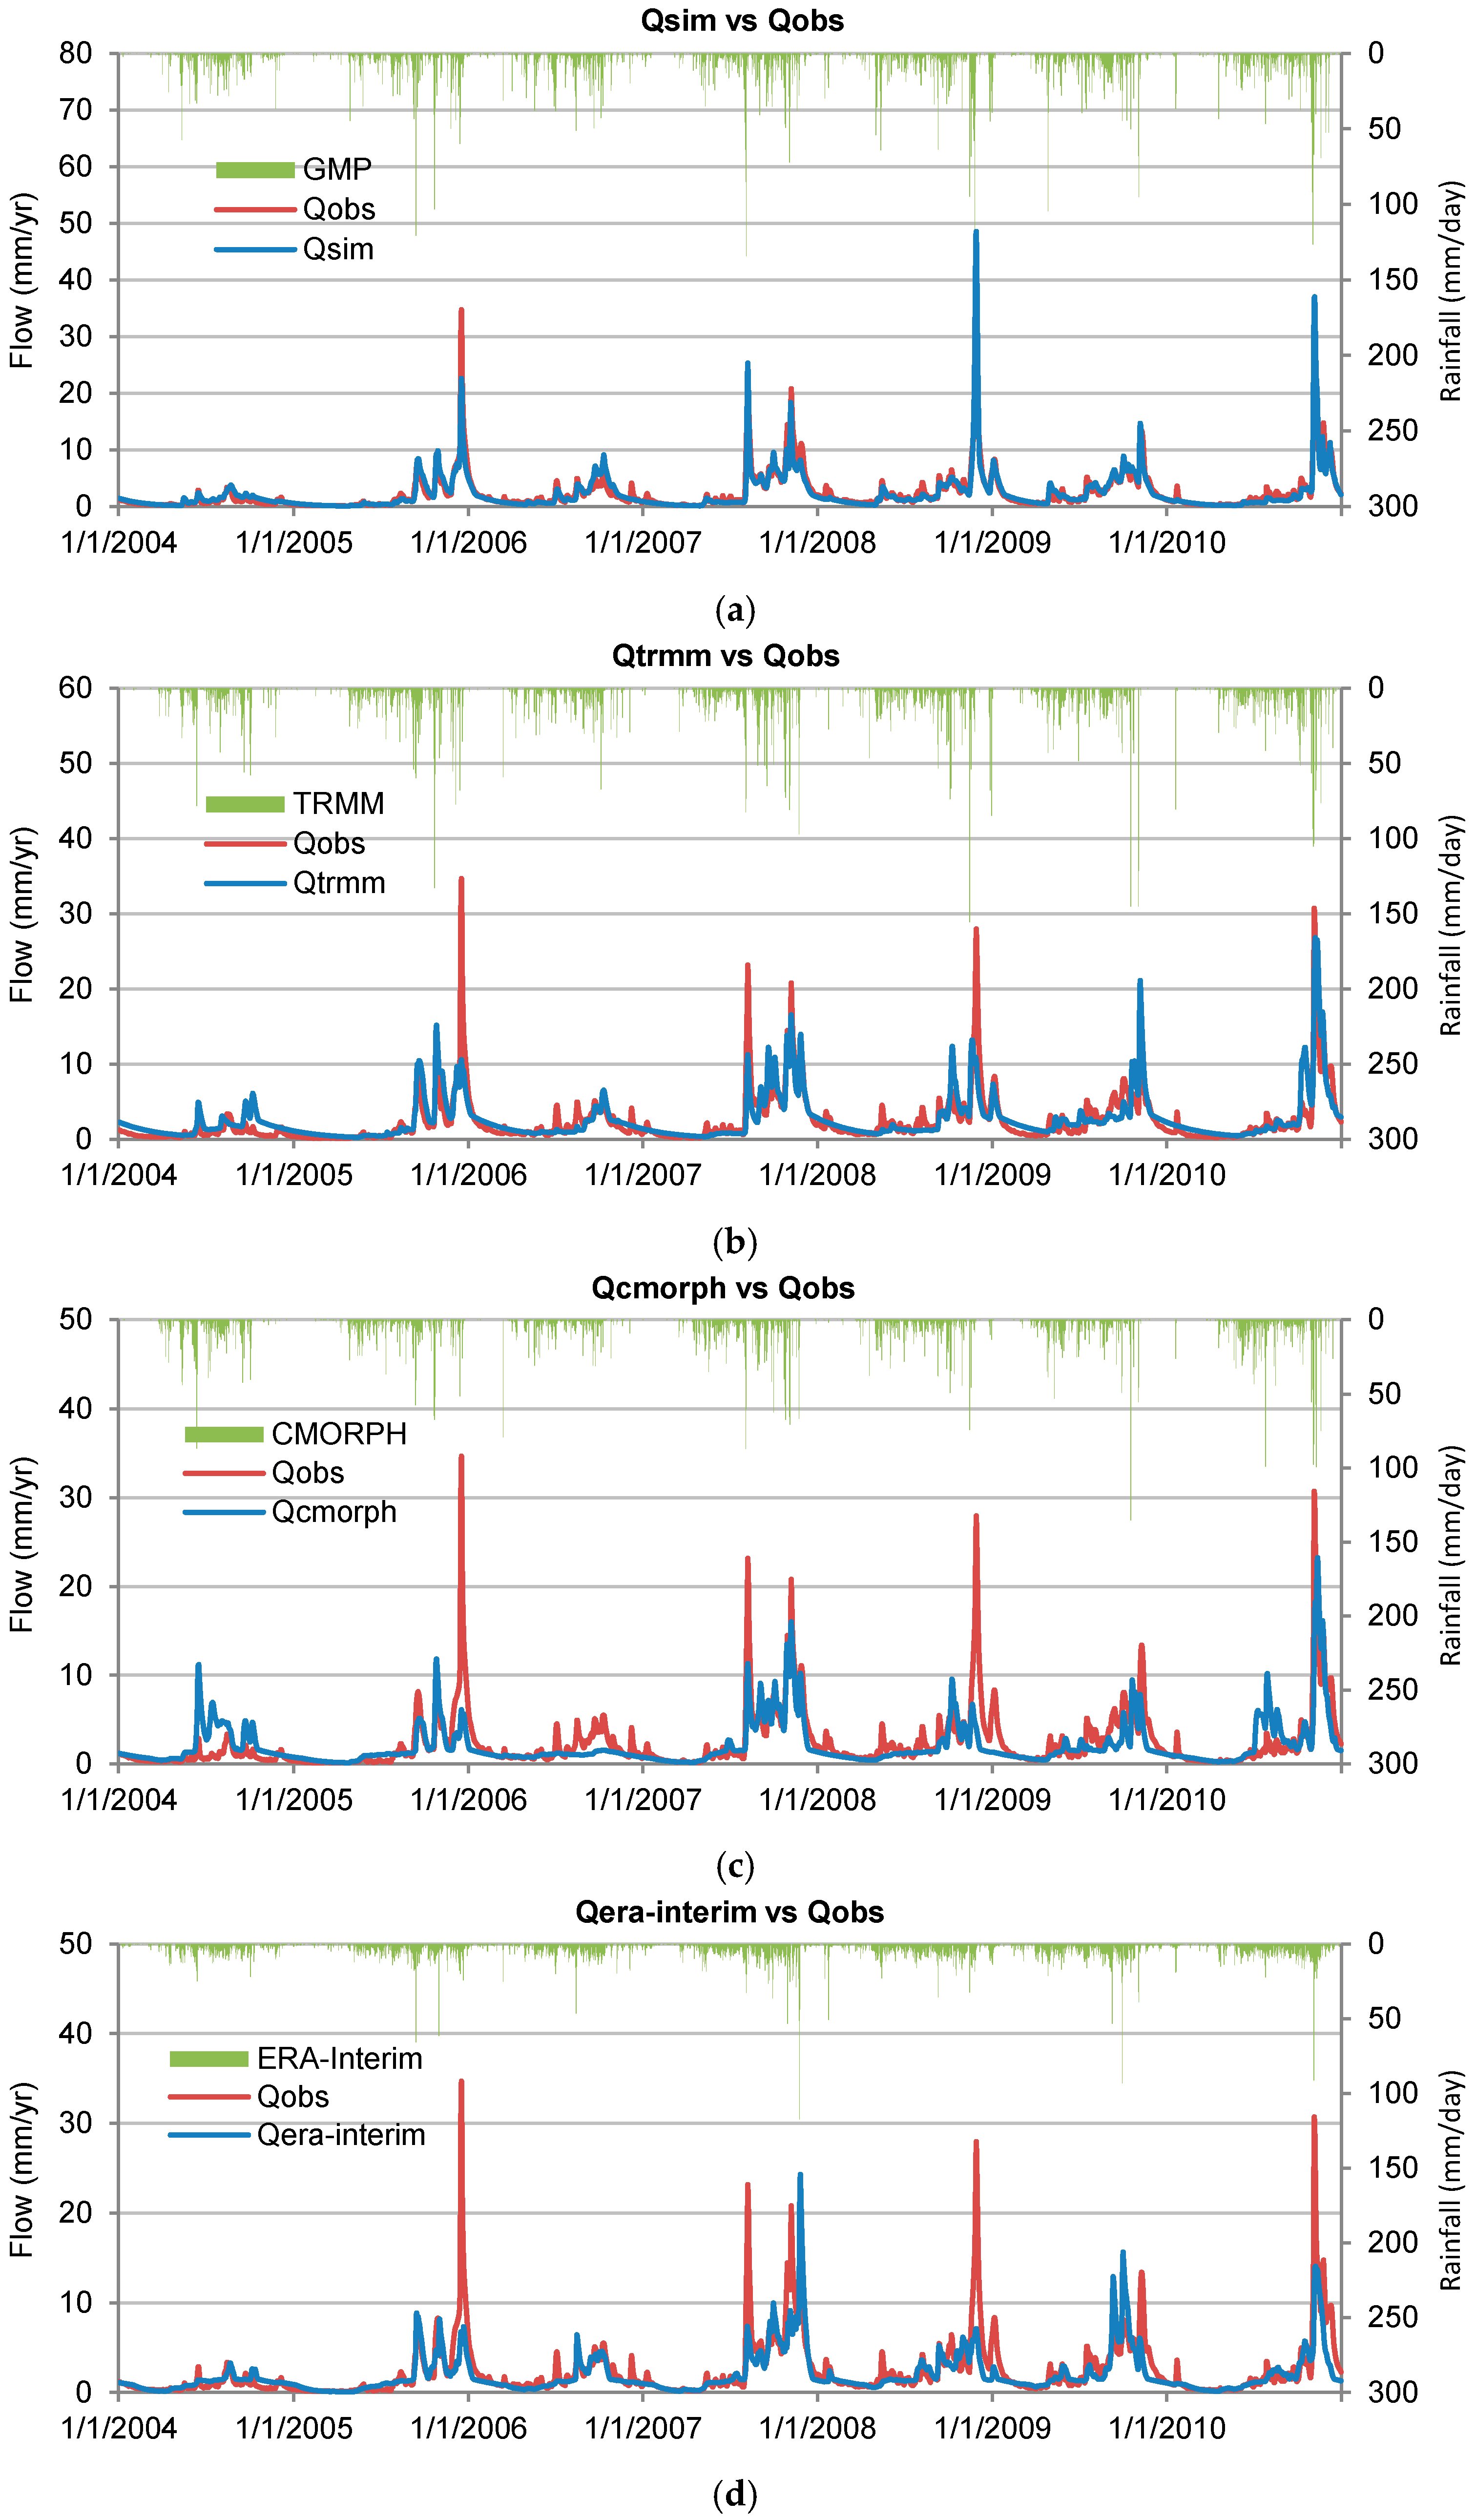
3.2.1. Runoff Simulation at Daily Timescale

We first present the results of rainfall-runoff simulation at daily timescale. Figure 7 presents the results of the simulations using different rainfall sources in comparison with the observed flow at the outlet of the Krong Ana sub-catchment. The graphs show the calibration results during 2004 to 2007 and validation results during 2008 to 2010. The performance indicators are given in Table 5.
The hydrographs of Figure 7 show that the simulated flow from ground rainfall generally has the best fit with observed flow although the simulation slightly underestimates the largest peaks during calibration (2004–2007) and overestimates them during validation (2008–2010). Also, all simulations using SBRP data are able to imitate the runoff to some extent though they have relatively low skill to capture high peaks over both calibration and validation periods. The generated flow from TRMM has the best agreement with observed flow among the three SBRP products. ERA-Interim and CMORPH are likely to simulate incorrectly the occurrence of highest peaks. However, none of the simulations (including simulation using gauged rainfall) was able to capture the highest peak in December 2005. This peak occurred in the middle of December, which was considered an abnormality in the Krong Ana sub-catchment as well as the Sre Pok catchment. The normal highest peaks usually occur in early November or October or even earlier in August.
Comparing the mean daily flows during calibration and validation period supports the above results on rainfall evaluation as depicted by Figure 8. The most comparable simulated runoff to observed values is the runoff derived by the GMP data, which is better than the three SBRP products. Although simulated flow based on GMP is lower than observed flow, the differences are insignificant, only −3.6% for calibration and −0.5% for validation. Deriving the model with the SBRP inputs, all simulations of daily flows achieve reasonable results during calibration period, with biases in the range of ±15%. However, for the validation, the bias from CMORPH and ERA-Interim increase to more than 20%, while those based on TRMM data decrease to less than 10%. In both calibration and validation periods most of the time, simulations using TRMM tend to overestimate the water flow (bias > 0) while simulations using CMORPH and ERA-Interim tend to underestimate the flow (bias < 0). These results are consistent with the validation of daily rainfall given in the previous section.

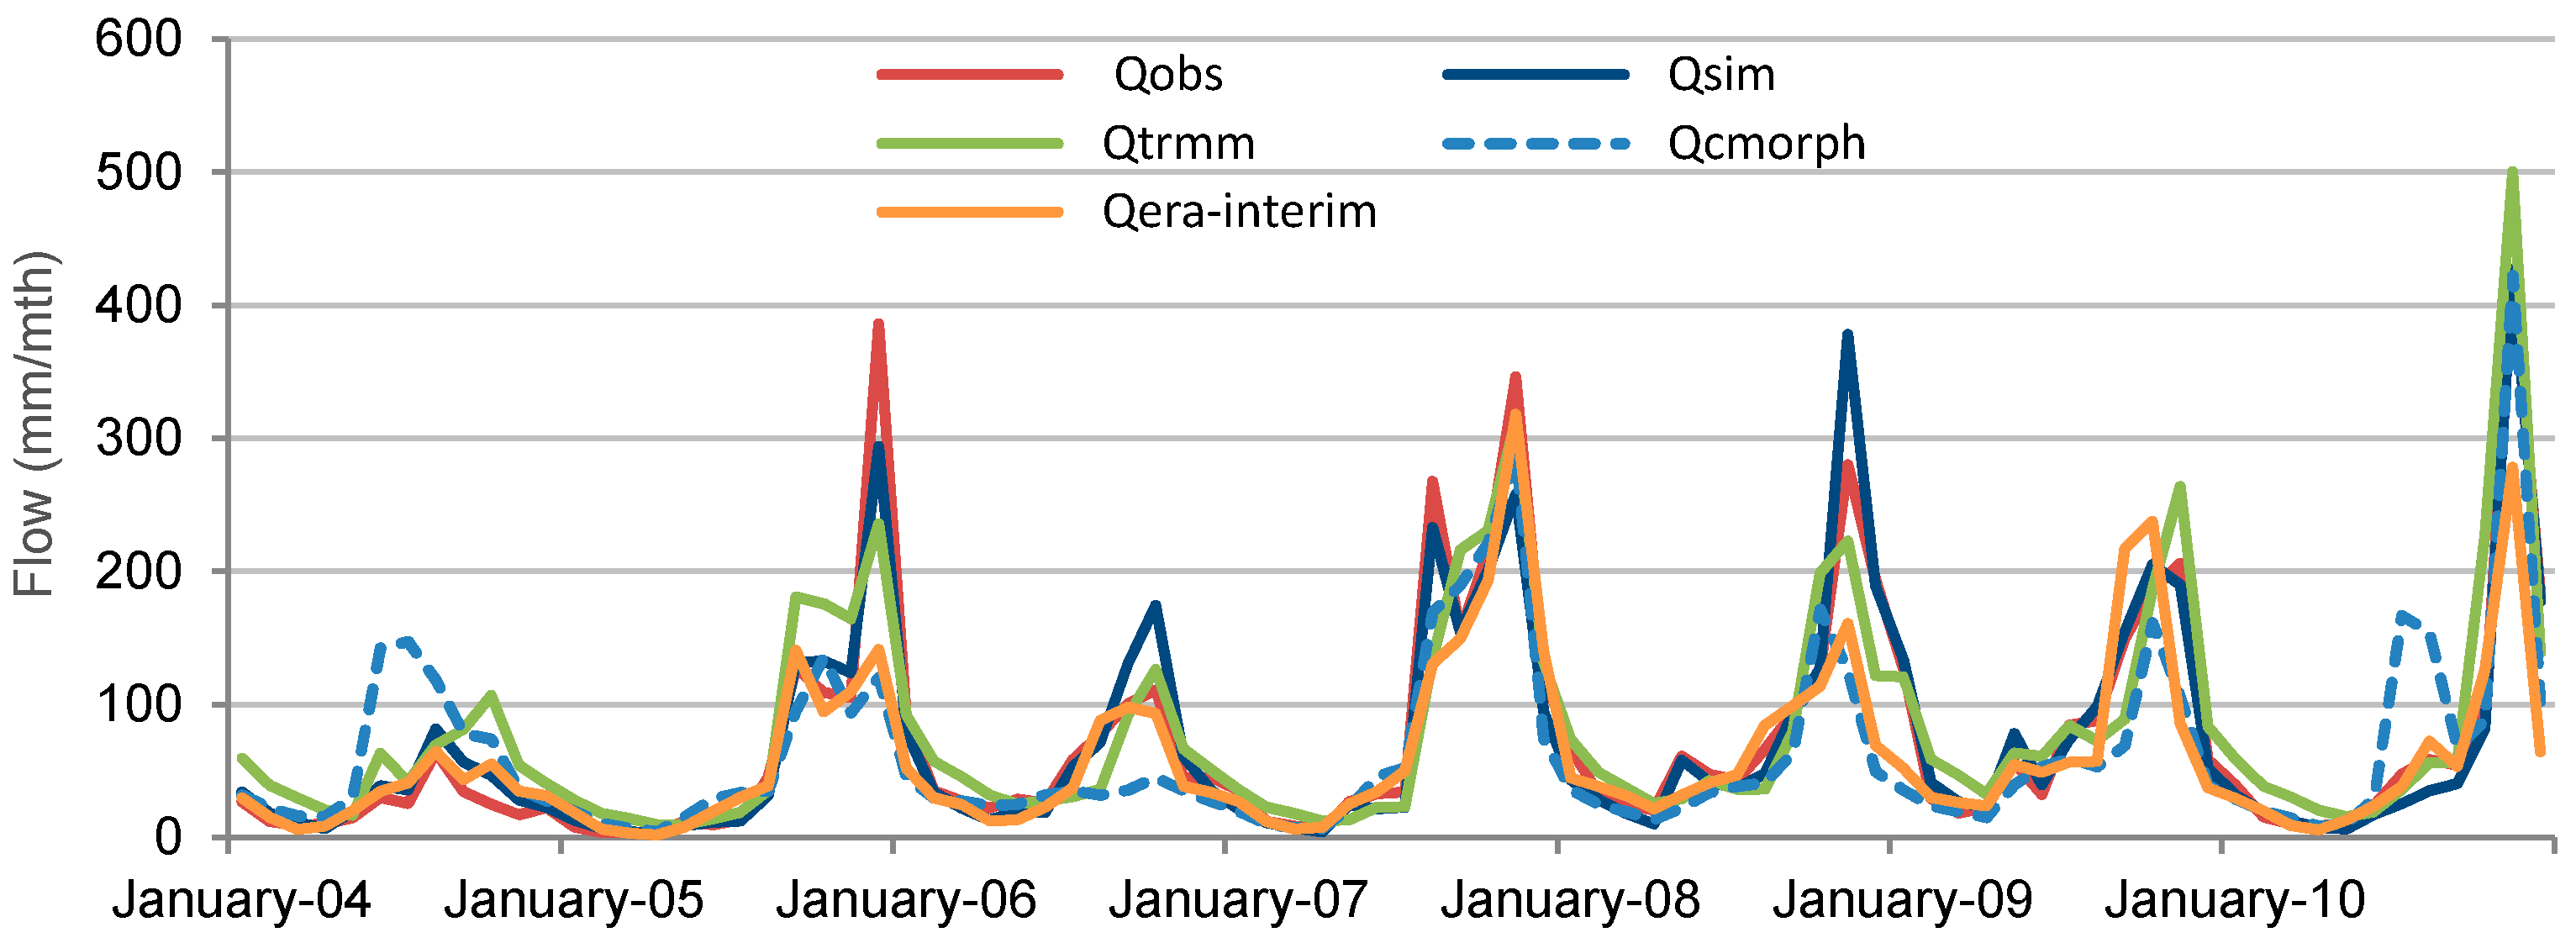
3.2.2. Runoff Aggregation at Monthly Timescale

In general, the monthly aggregated flows from daily simulations have better agreements with the observed flow, which is shown by the good fits between simulated and observed hydrographs in Figure 9. The aggregated monthly flow simulated using GMP data still shows best results with R2 of 0.93 and 0.96, NSE of 0.92 and 0.95, logNSE of 0.92 and 0.92 for calibration and validation respectively. There is a significant improvement in the performance of all three SBRP products, compared to the daily timescale, which is exhibited by the statistical indicators presented in Table 5, TRMM performing best. Although the ability of TRMM to reproduce low flow is lower than that of ERA-Interim (logNSE of TRMM < logNSE of ERA-Interim), overall it achieved a very good performance while ERA-Interim ranked good. Accumulated monthly flow using CMORPH data was acceptable. TRMM sometimes overestimates the high peaks (in 2004, 2009 and 2010) while ERA-Interim and CMORPH have a main tendency to underestimate them. TRMM captures high peaks fairly well whereas ERA-Interim and CMORPH sometimes fail to capture them, for example in 2005, 2008 and 2009.
The comparison between simulated flows from the SBRP and GMP shows that the GMP is the best input in the Krong Ana sub-catchment. The flow generated from the GMP has a better fit of hydrograph with observed flow and has much better values of the examined performance indicators compared to simulated flows from SBRP inputs. This tendency is the same for both daily flow and aggregated monthly flow. The very good result of simulation with GMP is understandable when this simulation used rainfall data from six stations over an area of 3038 km2. The density of rainfall station in this case is about 506 km2/station and therefore within the requirement for hilly and mountainous area (250–575 km2/station [48]. However, many other sub-catchments in the Sre Pok lack sufficient ground-based rainfall stations. Many located in Cambodian territory do not have any rainfall station. In this case, satellite-based and reanalysis rainfall estimates would bring significant benefits for rainfall-runoff assessment to these sub-catchments.

4. Summary and Conclusions

The main objective of this research was to study the feasibility of using different SBRP products for a reliable rainfall-runoff simulation in the Sre Pok catchment. Three SBRP products, namely TRMM, CMORPH, and ERA-Interim were selected for this purpose. The three products were first evaluated against GMP at thirteen stations using bilinear interpolation method to examine their accuracy as input for a rainfall-runoff model. The semi-distributed HBV model was then selected to test the runoff simulation using satellite-based and reanalysis rainfall for Krong Ana, an upstream sub-catchment of the Sre Pok catchment. To evaluate the performance of the satellite and reanalysis rainfall products, four main statistical indicators, NSE, logNSE, R2, and bias (%), were considered.
The results show that all satellite and reanalysis products have a reasonably good correlation with ground observation at monthly timescale but relatively poor correlation at daily scale. Although CMORPH has a slightly better performance than TRMM and ERA-Interim at daily scale, the statistical results are poor for all three products with NSE < 0.33 and R2 < 0.39. Besides, all three SBRP data sets considerably overestimate the number of rainy days per year. At monthly scale, most of the NSE and R2 values are larger than 0.5, about 44% of NSE and 67% of R2 values being greater than 0.65. In general, TRMM shows the best performance among the three datasets with NSE of 0.47 to 0.75 and R2 of 0.58 to 0.81. All products demonstrate a high ability to correctly capture rainfall patterns throughout the year as well as rainfall during the rainy months (May to September). However, they tend to overestimate rainfall in the dry months (December to April) and the last two months of rainy season (October and November).
The modelling results demonstrate a good potential to apply SBRP data for runoff simulation in the Krong Ana sub-catchment. Generally, the simulated flows from the tested SBRP data sources give a reasonable resemblance to daily observed flow over the calibration period with R2 > 0.53, NSE > 0.52, and bias < ±15%. The results are a bit lower for the validation period with only satisfactory performance for TRMM (R2 = 0.65, NSE = 0.61, bias = 7.32%) and ERA-Interim (R2 = 0.52, NSE = 0.49, bias = −20.75%) inputs. The simulation driven by TRMM has the best performance among the three rainfall products though it tends to overestimate the average daily water flow in the sub-catchment. The simulations using CMORPH and ERA-Interim are likely to underestimate the water flow. All simulations with the studied SBRP products show a relatively low skill to capture the magnitude of high peaks over both calibration and validation periods. The comparison between monthly flows obtained from the SBRP and GMP inputs shows a significant improvement, which is evident from estimated performance indicates and a better agreement in hydrographs for both calibration and validation periods. TRMM input yields the best model performance at monthly scale with R2 of 0.78 and 0.84 and NSE of 0.77 and 0.80 for calibration and validation respectively. Although ERA-Interim performs much better than CMORPH during calibration, they have similar results for validation. Both of them result in satisfactory model performance at this scale (R2 and NSE > 0.5).
Overall, this study demonstrates that SBRP data can be a valuable source of rainfall estimates at monthly scale, and as input for runoff simulation in the study sub-catchment of Krong Ana. The encouraging results from this research show a good opportunity to use SBRP for runoff modelling in the whole Sre Pok catchment or similar poorly gauged catchments of the Mekong Basin. The research only evaluated the possibility of using three satellite and reanalysis rainfall products for runoff simulation while in fact there are many other rainfall products and data from public domain sources, for example temperature, evaporation, wind speed, or solar energy. The use of these SBRP data for runoff simulation in poorly-gauged or un-gauged catchments is worth studying.

Author Contributions

T.H.N. completed data processing and analysis, model simulation, result analysis, and drafting of the manuscript. I.M. provided expertise in assessing indicators, model parameters and set up, and completed the manuscript. Y.A.M. and P.v.d.Z. contributed to the research proposal, methods, result analysis and review the manuscript.

Acknowledgments

The research was supported by the Netherland Fellowship Program and IHE Delft (formerly UNESCO-IHE) Institute for Water Education. We are thankful for the warm welcome, support, and data provision during field visit and data collection of Pham Tan Ha, the Department of Agriculture and Rural Development of Dak Lak Province, Vietnam and Nguyen Quoc Anh, the Regional Flood Mitigation and Management Programme—the Mekong River Commission, Phnom Penh, Cambodia. We also would like to extend our gratefulness to Schalk Jan van Andel (UNESCO-IHE), Isnaeni Hartanto (UNESCO-IHE) and Tim Hessels (Delft University of Technology) for their help and useful advice in processing of satellite-based and reanalysis rainfall data.

Conflicts of Interest

The authors declare no conflict of interest.

References

  1. Jeniffer, K.; Su, Z.; Woldai, T.; Maathuis, B. Estimation of spatial–temporal rainfall distribution using remote sensing techniques: A case study of Makanya catchment, Tanzania. Int. J. Appl. Earth Obs. Geoinf. 2010, 12 (Suppl. 1), S90–S99. [Google Scholar] [CrossRef]
  2. Li, F.; Zhang, Y.; Xu, Z.; Liu, C.; Zhou, Y.; Liu, W. Runoff predictions in ungauged catchments in southeast Tibetan Plateau. J. Hydrol. 2014, 511, 28–38. [Google Scholar] [CrossRef]
  3. Duan, Z.; Bastiaanssen, W.G.M. First results from Version 7 TRMM 3B43 precipitation product in combination with a new downscaling–calibration procedure. Remote Sens. Environ. 2013, 131, 1–13. [Google Scholar] [CrossRef]
  4. Woldemeskel, F.M.; Sivakumar, B.; Sharma, A. Merging gauge and satellite rainfall with specification of associated uncertainty across Australia. J. Hydrol. 2013, 499, 167–176. [Google Scholar] [CrossRef]
  5. Behrangi, A.; Khakbaz, B.; Jaw, T.C.; AghaKouchak, A.; Hsu, K.; Sorooshian, S. Hydrologic evaluation of satellite precipitation products over a mid-size basin. J. Hydrol. 2011, 397, 225–237. [Google Scholar] [CrossRef]
  6. Collischonn, B.; Collischonn, W.; Tucci, C.E.M. Daily hydrological modeling in the Amazon basin using TRMM rainfall estimates. J. Hydrol. 2008, 360, 207–216. [Google Scholar] [CrossRef]
  7. Li, M.; Shao, Q. An improved statistical approach to merge satellite rainfall estimates and raingauge data. J. Hydrol. 2010, 385, 51–64. [Google Scholar] [CrossRef]
  8. Mishra, A.K.; Gairola, R.M.; Varma, A.K.; Agarwal, V.K. Improved rainfall estimation over the Indian region using satellite infrared technique. Adv. Space Res. 2011, 48, 49–55. [Google Scholar] [CrossRef]
  9. Hunink, J.E.; Immerzeel, W.W.; Droogers, P. A High-resolution Precipitation 2-step mapping Procedure (HiP2P): Development and application to a tropical mountainous area. Remote Sens. Environ. 2014, 140, 179–188. [Google Scholar] [CrossRef]
  10. Jamandre, C.A.; Narisma, G.T. Spatio-temporal validation of satellite-based rainfall estimates in the Philippines. Atmos. Res. 2013, 122, 599–608. [Google Scholar] [CrossRef]
  11. Hrachowitz, M.; Savenije, H.; Blöschl, G.; McDonnell, J.; Sivapalan, M.; Pomeroy, J.; Arheimer, B.; Blume, T.; Clark, M.; Ehret, U. A decade of Predictions in Ungauged Basins (PUB)—A review. Hydrol. Sci. J. 2013, 58, 1198–1255. [Google Scholar] [CrossRef]
  12. Meng, J.; Li, L.; Hao, Z.; Wang, J.; Shao, Q. Suitability of TRMM satellite rainfall in driving a distributed hydrological model in the source region of Yellow River. J. Hydrol. 2014, 509, 320–332. [Google Scholar] [CrossRef]
  13. Bitew, M.M.; Gebremichael, M. Evaluation of satellite rainfall products through hydrologic simulation in a fully distributed hydrologic model. Water Resour. Res. 2011, 47. [Google Scholar] [CrossRef]
  14. Li, X.H.; Zhang, Q.; Xu, C.Y. Suitability of the TRMM satellite rainfalls in driving a distributed hydrological model for water balance computations in Xinjiang catchment, Poyang lake basin. J. Hydrol. 2012, 426, 28–38. [Google Scholar] [CrossRef]
  15. Su, F.; Hong, Y.; Lettenmaier, D.P. Evaluation of TRMM Multisatellite Precipitation Analysis (TMPA) and Its Utility in Hydrologic Prediction in the La Plata Basin. J. Hydrometeorol. 2008, 9, 622–640. [Google Scholar] [CrossRef]
  16. Thiemig, V.; Rojas, R.; Zambrano-Bigiarini, M.; De Roo, A. Hydrological evaluation of satellite-based rainfall estimates over the Volta and Baro-Akobo Basin. J. Hydrol. 2013, 499, 324–338. [Google Scholar] [CrossRef]
  17. Wu, H.; Adler, R.F.; Hong, Y.; Tian, Y.; Policelli, F. Evaluation of global flood detection using satellite-based rainfall and a hydrologic model. J. Hydrometeorol. 2012, 13, 1268–1284. [Google Scholar] [CrossRef]
  18. Artan, G.; Gadain, H.; Smith, J.L.; Asante, K.; Bandaragoda, C.J.; Verdin, J.P. Adequacy of satellite derived rainfall data for stream flow modeling. Nat. Hazards 2007, 43, 167–185. [Google Scholar] [CrossRef]
  19. Jiang, S.; Ren, L.; Hong, Y.; Yong, B.; Yang, X.; Yuan, F.; Ma, M. Comprehensive evaluation of multi-satellite precipitation products with a dense rain gauge network and optimally merging their simulated hydrological flows using the Bayesian model averaging method. J. Hydrol. 2012, 452–453, 213–225. [Google Scholar] [CrossRef]
  20. Hong, Y.; Adler, R.F.; Hossain, F.; Curtis, S.; Huffman, G.J. A first approach to global runoff simulation using satellite rainfall estimation. Water Resour. Res. 2007, 43. [Google Scholar] [CrossRef]
  21. Müller, M.F.; Thompson, S.E. Bias adjustment of satellite rainfall data through stochastic modeling: Methods development and application to Nepal. Adv. Water Resour. 2013, 60, 121–134. [Google Scholar] [CrossRef]
  22. Hong, Y.; Hsu, K.-L.; Moradkhani, H.; Sorooshian, S. Uncertainty quantification of satellite precipitation estimation and Monte Carlo assessment of the error propagation into hydrologic response. Water Resour. Res. 2006, 42. [Google Scholar] [CrossRef]
  23. Yilmaz, K.K.; Hogue, T.S.; Hsu, K.-L.; Sorooshian, S.; Gupta, H.V.; Wagener, T. Intercomparison of rain gauge, radar, and satellite-based precipitation estimates with emphasis on hydrologic forecasting. J. Hydrometeorol. 2005, 6, 497–517. [Google Scholar] [CrossRef]
  24. Mekong River Commission; Asian Development Bank. RE: Update Hydrological Model (ARCSWAT), Pakse to Kratie; Mekong River Commission; Asian Development Bank: Vientiane, Lao PDR, 2010. [Google Scholar]
  25. Building River Dialogue and Governance (BRIDGE). 3S Basin. 2014. Available online: http://www.3sbasin.org/knowledge/3ss-profile/hydrology.html (accessed on 6 September 2014).
  26. Building River Dialogue and Governance (BRIDGE). Profile: The Sre Pok Basin. 2015. Available online: http://www.3sbasin.org/publication/download-documents.html (accessed on 6 March 2015).
  27. Huffman, G.; Adler, R.; Bolvin, D.; Nelkin, E. The TRMM Multi-Satellite Precipitation Analysis (TMPA). In Satellite Rainfall Applications for Surface Hydrology; Gebremichael, M., Hossain, F., Eds.; Springer: Dordrecht, The Netherlands, 2010. [Google Scholar]
  28. Joyce, R.J.; Janowiak, J.E.; Arkin, P.A.; Xie, P. CMORPH: A Method that Produces Global Precipitation Estimates from Passive Microwave and Infrared Data at High Spatial and Temporal Resolution. J. Hydrometeorol. 2004, 5, 487–503. [Google Scholar] [CrossRef]
  29. Dee, D.P.; Uppala, S.M.; Simmons, A.J.; Berrisford, P.; Poli, P.; Kobayashi, S.; Andrae, U.; Balmaseda, M.A.; Balsamo, G.; Bauer, P.; et al. The ERA-Interim reanalysis: configuration and performance of the data assimilation system. Q. J. R. Meteorol. Soc. 2011, 137, 553–597. [Google Scholar] [CrossRef]
  30. Hagedorn, R.; Hamill, T.M.; Whitaker, J.S. Probabilistic forecast calibration using ECMWF and GFS ensemble reforecasts. Part I: Two-meter temperatures. Mon. Weather Rev. 2008, 136, 2608–2619. [Google Scholar] [CrossRef]
  31. Huffman, G.J.; Bolvin, D.T. TRMM and Other Data Precipitation Data Set Documentation. NASA; 2014. Available online: ftp://meso-a.gsfc.nasa.gov/pub/trmmdocs/3B42_3B43_doc.pdf (accessed on 20 December 2014).
  32. Derin, Y.; Yilmaz, K.K. Evaluation of Multiple Satellite-Based Precipitation Products over Complex Topography. J. Hydrometeorol. 2014, 15, 1498–1516. [Google Scholar] [CrossRef] [Green Version]
  33. Thiemig, V.; Rojas, R.; Zambrano-Bigiarini, M.; Levizzani, V.; De Roo, A. Validation of satellite-based precipitation products over sparsely gauged African river basins. J. Hydrometeorol. 2012, 13, 1760–1783. [Google Scholar] [CrossRef]
  34. Demirtas, M.; Nance, L.; Bernardet, L.; Lin, Y.; Chuang, H.-Y.; Loughe, A.; Mahoney, J.; Gall, R.; Koch, S. The Developmental Testbed Center Verification System. 2005. Available online: http://www2.mmm.ucar.edu/wrf/users/workshops/WS2005/abstracts/Session3/23-DEMIRTAS.pdf (accessed on 24 March 2018).
  35. Gao, Y.C.; Liu, M.F. Evaluation of high-resolution satellite precipitation products using rain gauge observations over the Tibetan Plateau. Hydrol. Earth Syst. Sci. 2013, 17, 837–849. [Google Scholar] [CrossRef]
  36. Sapiano, M.R.P.; Arkin, P.A. An Intercomparison and Validation of High-Resolution Satellite Precipitation Estimates with 3-Hourly Gauge Data. J. Hydrometeorol. 2009, 10, 149–166. [Google Scholar] [CrossRef]
  37. Seibert, J. HBV Light Version 2, User’s Manual; Department of Forest Engineering Corvallis, Oregon State University: Corvallis, OR, USA; Department of Earth Science, Hydrology, Uppsala University: Uppsala, Sweden, 2002. [Google Scholar]
  38. Lidén, R.; Harlin, J. Analysis of conceptual rainfall–runoff modelling performance in different climates. J. Hydrol. 2000, 238, 231–247. [Google Scholar] [CrossRef]
  39. Love, D.; Uhlenbrook, S.; Corzo-Perez, G.; Twomlow, S.; van der Zaag, P. Rainfall–interception–evaporation–runoff relationships in a semi-arid catchment, northern Limpopo basin, Zimbabwe. Hydrol. Sci. J. 2010, 55, 687–703. [Google Scholar] [CrossRef] [Green Version]
  40. Masih, I.; Uhlenbrook, S.; Maskey, S.; Ahmad, M.D. Regionalization of a conceptual rainfall–runoff model based on similarity of the flow duration curve: A case study from the semi-arid Karkheh basin, Iran. J. Hydrol. 2010, 391, 188–201. [Google Scholar] [CrossRef]
  41. Uhlenbrook, S.; Seibert, J.A.N.; Leibundgut, C.; Rodhe, A. Prediction uncertainty of conceptual rainfall–runoff models caused by problems in identifying model parameters and structure. Hydrol. Sci. J. 1999, 44, 779–797. [Google Scholar] [CrossRef]
  42. Arheimer, B.; Lindström, G.; Olsson, J. A systematic review of sensitivities in the Swedish flood-forecasting system. Atmos. Res. 2011, 100, 275–284. [Google Scholar] [CrossRef]
  43. Sarkkula, J.; Kiirikki, M.; Koponen, J.; Kummu, M. Ecosystem processes of the Tonle Sap Lake. In Proceedings of the 1st Workshop of Ecotone Phase II, Phnom Penh and Siem Reap, Cambodia, 26 October to 1 November 2003. [Google Scholar]
  44. Sarkkula, J.; Koponen, J.; Keskinen, M.; Kummu, M.; Inkala, A.; Käkönen, M.; Lamberts, D.; Lauri, H.; Varis, O.; Veijalainen, N.; et al. Hydrological, Environmental and Socio-Economic Modelling Tools for the Lower Mekong Basin Impact Assessment; Research Findings and Recommendations; Mekong River Commission; Finnish Environment Institute Consultancy Consortium: Vientiane, Lao PDR, 2007. [Google Scholar]
  45. Hargreaves, G.H.; Samani, Z.A. Reference crop evapotranspiration from ambient air temperature. Appl. Eng. Agric. 1985, 1, 96–99. [Google Scholar]
  46. Moriasi, D.; Arnold, J.; Van Liew, M.; Bingner, R.; Harmel, R.; Veith, T. Model evaluation guidelines for systematic quantification of accuracy in watershed simulations. Trans. ASABE 2007, 50, 885–900. [Google Scholar] [CrossRef]
  47. Bowman, K.P. Comparison of TRMM Precipitation Retrievals with Rain Gauge Data from Ocean Buoys. J. Clim. 2005, 18, 178–190. [Google Scholar] [CrossRef]
  48. World Meteorological Organization (WMO). Guide to Hydrological Practices: Hydrology—From Measurement to Hydrological Information; WMO: Geneva, Switzerland, 2008; Volume I. [Google Scholar]
Figure 1. Study areas: (a) Sre Pok catchment; (b) Krong Ana sub-catchment; (c) location of the Sre Pok catchment in the Lower Mekong river basin; and (d) location of the Krong Ana sub-catchment in the Sre Pok catchment; TE: temperature and evaporation.
Geosciences 08 00164 g001
Figure 2. (a) Comparison of average number of rainy days per year of different Satellite-Based and Reanalysis Precipitation (SBRP) and Ground Measured Precipitation (GMP) data sets; (b) The ability of SBRP in capturing the average maximum daily rainfall.
Geosciences 08 00164 g002
Figure 3. Validation of SBRP against GMP at daily scale: (a) Mean daily rainfall and (b) bias (%) at different stations.
Geosciences 08 00164 g003
Figure 4. Comparison of average monthly rainfall patterns (2003–2010) from different data sources at different stations and Krong Ana Sub-catchment: (a) at Krong Buk station (P01), (b) at Giang Son station (P03), (c) at Buon Ho station (P06), (d) at BMT station (P07), (e) at M’Drak station (P09), (f) at Dat Lat station (P12), and (g) at Krong Ana Sub-catchment.
Geosciences 08 00164 g004aGeosciences 08 00164 g004b
Figure 5. Monthly bias (%) of different SBRP data sets compared to GMP data in dry season at different stations and Krong Ana Sub-catchment: (a) at Krong Buk station (P01), (b) at Giang Son station (P03), (c) at Buon Ho station (P06), (d) at BMT station (P07), (e) at M’Drak station (P09), (f) at Dat Lat station (P12), and (g) at Krong Ana Sub-catchment.
Geosciences 08 00164 g005aGeosciences 08 00164 g005b
Figure 6. Monthly bias (%) of different SBRP data sets compared to GMP data in rainy season at different stations and Krong Ana Sub-catchment: (a) at Krong Buk station (P01), (b) at Giang Son station (P03), (c) at Buon Ho station (P06), (d) at BMT station (P07), (e) at M’Drak station (P09), (f) at Dat Lat station (P12), and (g) at Krong Ana Sub-catchment.
Geosciences 08 00164 g006aGeosciences 08 00164 g006b
Figure 7. Hydrographs comparing simulated and observed flow at daily time scale based on rainfall input data from (a) GMP; and the SBRP; (b) Tropical Rainfall Measuring Mission (TRMM); (c) Climate Prediction Center for morphing method (CMORPH); and (d) ERA-Interim for calibration period (January 2004–December 2007) and validation period (January 2008–December 2010).
Geosciences 08 00164 g007
Figure 8. (a) Average simulated vs. average observation daily flow and (b) Bias between simulated flow from different rainfall sources and measured flow (blue: calibration period, red pattern: validation period).
Geosciences 08 00164 g008
Figure 9. Hydrograph comparing average simulated and observed flow at monthly scale for calibration period (January 2004–December 2007) and validation period (January 2008–December 2010).
Geosciences 08 00164 g009
Table 1. Ground-based rainfall stations used in the research. In bold: stations used for the rainfall-runoff simulation of the Sre Pok sub-catchment.
IDNameLatitudeLongitudeElevationSource
P01Krong Buk108.412.8456.7PRoACC-II
P02Duc Xuyen108.012.3444.6PRoACC-II
P03Giang Son108.212.5428.0PRoACC-II
P04Cau 14107.912.6310.1WRS
P05Ban Don107.812.91186.0PRoACC-II
P06Buon Ho108.312.9707.0WRS
P07BMT108.112.7472.1WRS
P08Dak Mil107.612.4759.6WRS
P09M’Drak108.712.7424.0WRS
P10Dak Nong107.712.0623.9WRS
P11Pleiku108.014.0780.3WRS
P12Da Lat108.412.01511.0WRS
P13Stung Treng106.013.552.6RFMMP
Table 2. Previous studies on hydrological modelling using satellite-based rainfall data.
ProductsSimulated ScaleModel TypeCatchment/BasinDrainage Area (km2)LocationReference
TMPA-3B42V6Daily MonthlySemi-distributed7 sub-basin of La Plata basin62,236–1,100,000South AmericaSu et al. (2008)
CMORPH, TMPA-RT, TMPA-V6, PERSIANN, and PERSIANN-adjustment6-h our MonthlyLumpedIllinois River basin1489AmericaBehrangi et al. (2011)
CMORPH, TMPA-3B42RT, TMPA-3B42, and PERSIANNDaily DistributedGilgel Abay watershed1656EthiopiaBitew and Gebremichael (2011)
CMORPH, RFE2.0, TRMM-3B42, PERSIANN, and ERA-InterimDaily Distributed4 sub-basins of Volta and Baro-Akobo basins50,000–130,000AfricaThiemig et al. (2013)
TMPA 3B42V6, TMPA 3B42RT, and CMORPHDaily MonthlyDistributedMishui basin9972South ChinaJiang et al. (2012)
TMPA-3B42V6Daily MonthlyDistributedYellow River basin122,000ChinaMeng et al. (2014)
NOAA RFE2.0Daily Semi-distributed4 sub-basins of Nile and Mekong rivers2646–22,150Eritrean, Ethiopia and Lao PDRArtan et al. (2007)
Table 3. Satellite-based and reanalysis products used in this research.
No.Type of Satellite Based Rainfall ProductAvailabilityResolutionDownloading PeriodSource
Spatial (lat × lon)Temporal
1ECMWF (ERA-Interim)Globally (1979-present)0.25° × 0.25°6 hJanuary 2003–December 2010http://apps.ecmwf.int/
2CMORPH60N-60S (2003-present)0.25° × 0.25°3 hJanuary 2003–December 2010http://rda.ucar.edu/
3TRMM (3B42-V7)50N-50S (1998-present)0.25° × 0.25°3 hJanuary 2003–December 2010http://mirador.gsfc.nasa.gov/
Table 4. Statistical indicators for the comparison between SBRP and GMP data sets.
IDDaily IndicatorsMonthly Indicators
R2NSER2NSE
TRMMCMORPHERA-InterimTRMMCMORPHERA-InterimTRMMCMORPHERA-InterimTRMMCMORPHERA-Interim
P010.390.320.140.170.230.130.810.680.680.660.620.67
P020.260.240.120.080.130.080.730.710.630.720.710.61
P030.300.220.170.120.130.160.700.590.740.690.580.68
P040.280.270.160.020.110.140.790.690.670.740.660.65
P050.310.240.160.070.050.140.780.750.710.650.710.69
P060.320.280.190.110.180.180.580.510.630.470.480.60
P070.280.210.170.170.140.160.760.610.690.750.600.60
P080.260.280.130.040.160.090.780.820.700.720.800.68
P090.360.260.200.330.240.170.620.400.520.570.320.33
P100.270.220.170.230.190.140.740.600.720.690.540.53
P110.340.310.240.270.280.230.740.650.720.730.610.60
P120.260.240.14−0.080.100.110.670.660.650.600.610.63
P130.130.110.11−0.16−0.370.080.760.620.650.500.270.59
K.Ana0.490.370.260.340.330.240.830.650.740.810.610.67
Table 5. Statistical criteria of different simulations at daily scale.
CalibrationValidation
GMPTRMM CMORPH ERA-Interim GMPTRMM CMORPH ERA-Interim
Daily simulation
R20.890.670.530.560.880.650.450.52
NSE0.890.670.520.550.760.610.410.49
LogNSE0.890.620.640.810.880.680.590.74
Bias (%)−3.6110.93−6.66−13.61−0.527.32−21.17−20.75
Monthly accumulation
R20.930.780.590.780.960.840.640.69
NSE0.920.770.580.740.950.800.590.63
LogNSE0.920.670.680.870.920.750.640.80

