Article

Spectral Signature Characterization and Remote Mapping of Oman Exotic Limestones for Industrial Rock Resource Assessment

by
Sankaran Rajendran
1,*,
Sobhi Nasir
1,
Mohammed A. K. El-Ghali
2,
Khaled Alzebdah
3,
Ali Salim Al-Rajhi
4 and
Mohammed Al-Battashi
4
1
Earth Science Research Centre, Sultan Qaboos University, Al-Khod, 123 Muscat, Oman
2
Department of Earth Sciences, Sultan Qaboos University, Al-Khod, 123 Muscat, Oman
3
Department of Mechanical and Industrial Engineering, Sultan Qaboos University, Al-Khod, 123 Muscat, Oman
4
Public Authority for Mining, Directorate of General of Minerals, Ministry of Commerce and Industry, P.O. Box: 2088, Muscat, Oman
*
Author to whom correspondence should be addressed.
Geosciences 2018, 8(4), 145; https://doi.org/10.3390/geosciences8040145
Submission received: 11 December 2017 / Revised: 19 April 2018 / Accepted: 19 April 2018 / Published: 23 April 2018

Abstract

:
This study demonstrates the capability of Advanced Spaceborne Thermal Emission and Reflection Radiometer (ASTER) sensor data to remotely map industrial carbonate rocks known as the ‘Oman exotics’ of the Sultanate of Oman. We measured reflectance spectra of marble using a PIMA™ spectrometer and studied their spectral absorptions distinguishing calcite from spectral absorptions of dolomite of the same region. The spectral band 8 of ASTER is processed by simple decorrelation stretch image processing method to map the exotic limestone rock of the Nakhl region, Oman. Results showed that carbonate rocks displayed distinctive tonal variation on the image. A comparative study with the spectral band 7 of Landsat 7 (ETM+) does not discriminate the calcite-bearing marbles and associated carbonate formations in the studied area. ASTER data were also processed by the application of the Maximum Likelihood Classification (MLC), Spectral Angle Mapper (SAM) and Spectral Information Divergence (SID) image classification algorithms. The results were assessed by the production of a confusion matrix. The study shows the capability of visible near infrared (VNIR) and shortwave infrared (SWIR) spectral bands of the ASTER sensor and potential of the image processing methods to remotely identify industrial carbonate rocks and we recommend this technique to similar regions of the world.

Graphical Abstract

1. Introduction

Dimension stone is a natural stone with specific dimensions for use in the building industries. It includes limestone, marble, sandstone, gabbro, granite, serpentine, and gneiss [1]. The uses of dimension stone are based on several criteria such as (1) the likelihood of extracting blocks larger than 1 m2; (2) the engineering and geotechnical properties of the stone (e.g., compressive strength, water absorption, density, and porosity); (3) the appearance of the stone when cut and polished; and (4) the accessibility of the site of extraction [2]. Oman is endowed with huge natural resources for dimension stones. The major industries in Oman are based on industrial rocks and minerals mainly in the construction sector. Due to recent high economic developments in Oman, there is a corresponding increase in construction activities, relating to a high demand for construction materials (e.g., marble stones, aggregates). The identification of additional marble stone resources will provide encouragement for potential investors to develop more stone quarrying and stone processing industries.
Marble in a geological term is restricted to crystalline metamorphosed limestones. In Oman, the term “marble” is applied to rocks known as the ‘Oman exotics’. Rather than being true marbles, the Oman exotics are dense, white, and beige to yellow crystalline limestones. These limestones occur as isolated blocks within the allochthonous Hawasina Formation (Early Triassic to Cretaceous age) and are thought to represent ancient marine coral reef deposits [3]. The Hawasina Formation is well exposed in the Kawr, Hamrat, and Al Jil regions of Oman. These exotic limestones are used extensively as ornamental stones, tiles and slabs in the Oman construction industry and exported to nearby countries. However, details on the existence of exotic limestone resources, their economic potential and knowledge of exploration techniques are required to improve further exploitation. Especially, first-hand information on the occurrence, spatial distribution and physical, optical and chemical characters of the rock are still lacking. In this context, the satellite sensors appear as a strategic tool to remotely map exotic limestones utilizing image processing methods [4,5,6].
Mapping of industrial minerals and rocks has been carried out by several researchers using satellite data mainly Landsat series and ASTER sensors, and different image processing methods. These digital image processing methods include (1) false color composites [7,8]; (2) band ratios [7,9,10]; (3) principal components analysis [11,12]; (4) spectral angle mapper [13] and (5) decorrelation stretch [14,15,16]. In this study, we focus on comparing spectral bands 8 of ASTER and 7 of ETM+ (Enhanced Thematic Mapper Plus) to distinguish exotic limestone blocks for industrial resource development in the mountain region of the Sultanate of Oman.

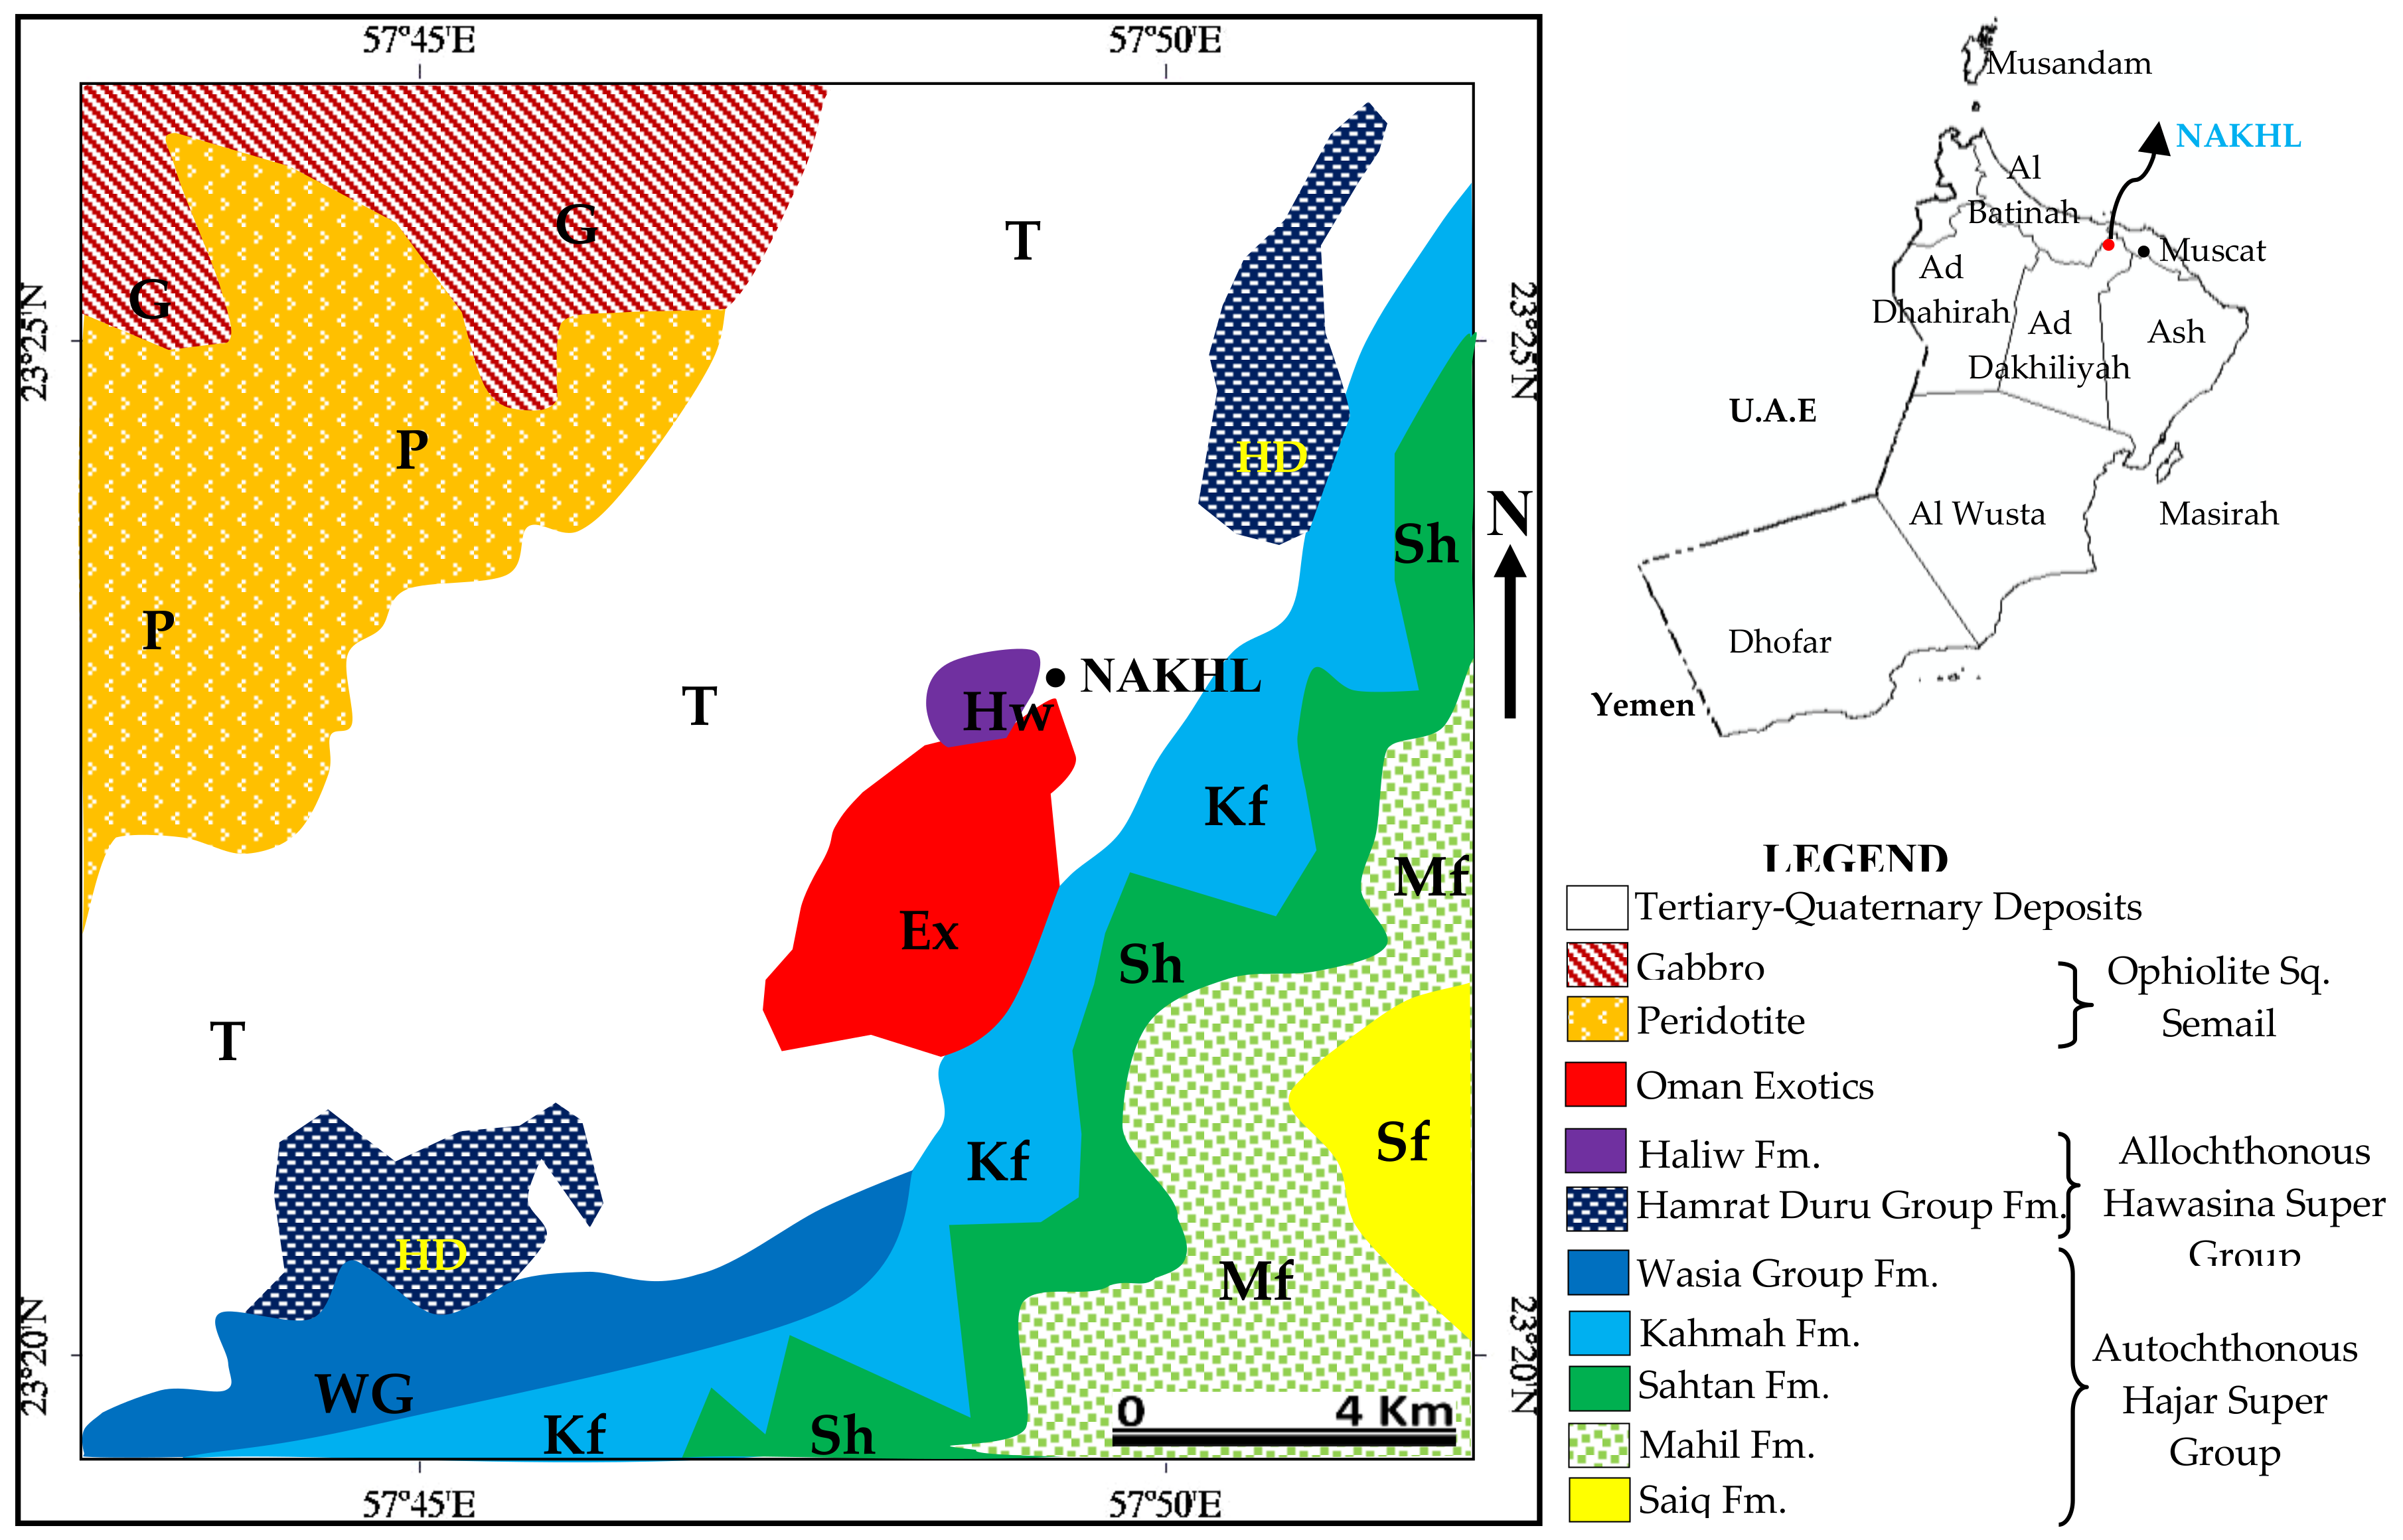
2. The Exotic Limestone of Oman

The “exotic limestones of Oman” (hereinafter referred to as exotics) are Middle to Upper Permian and Upper Triassic age fossiliferous limestone. The rocks do not extend laterally but occur as isolated outcrops underlain by volcanic rocks (Early Permian to Lower Triassic). They are mainly calcirudite made up of calcite rich limestone rubble accumulated on top of sea mounts [3]. The detailed geological studies on the Hawasina rocks, volcanic and metamorphic rocks, and ophiolite sequence show the presence of these exotics in the Oman Mountains [3,17,18,19]. The exotics are classified mainly as (1) Shallow-marine Facies (Permian and Triassic ages); (2) Deep-water Facies (Permian-Triassic Jebel Qamar Facies and Triassic-Lower Jurassic Megabreccias); and (3) Syntectonic Sediments Facies (Upper Cretaceous Oolitic limestone). The shallow-marine facies exotics of Middle-Upper Permian are massive gray exclusively of coral-algal boundstones with differing amounts of bryozoa, stromatoporoids, and skeletal fragments, including brachiopods, gastropods, and echinoderm plates and occurred less than 100 m thick (rarely exceed 200 m). The exotics of Permian age are limited to thickness of 200 m and the Upper Triassic exotics have a thickness of almost 1000 m at Jebel Kawr [3].
This study discriminates and remotely maps exotic limestones of the Nakhl region (Figure 1; Latitude: 23°22′33.83″ N; Longitude: 57°48′47.25″ E) using spectral absorption features of ASTER data. The exotic limestones occur between the Hawasina Super Group Formations and the ophiolite sequences. The Hajar Super Group Formations, namely Saiq, Mahil, Sahtan, Kahmah and Wasia Formations are found under the Hawasina Formations in the Nakhl region, where the Saiq and Mahil Formations consist mainly of dolomites, and the Sahtan and Kahmah Formations consist of limestones [20].

3. Materials and Methods

3.1. Image Data-Set

In the present study, to map the exotic limestone and to demonstrate the carbonate sensitivity of spectral bands, we used the data of spectral bands of ASTER and Landsat 7 (ETM+). We obtained ASTER Level 1B data of 10 June 2007 (AST_L1B_00306102007065154_20110110233836_21418) for the Nakhl region from NASA Land Processes Distributed Active Archive Center User Services (https://LPDAAC.usgs.gov). All data were received in a Tag Image File Format, which provides files for each band containing the imagery and an ASCII text .met file containing the metadata. The imageries have cloud cover of 0%. The data were supplied in terms of scaled radiance at sensor data with radiometric and geometric corrections already applied. These are georeferenced to the Universal Transverse Mercator (UTM) projection (Zone 40, Clark 1980 spheroid, PSD93 datum, EPSG: 3440). During the pre-processing of the data sets, atmospheric correction was applied to eliminate the spectral effect of water vapour and aerosols. The raw radiance data from the imaging spectrometer was rescaled to reflectance data using Fast line-of-sight Atmospheric Analysis of Spectral Hypercubes (FLAASH) algorithm after the cross-track illumination correction using the ENVI™ (version 5.2) software (Harris Geospatial Solutions, Broomfield, CO, USA). The resultant image spectra were further used to compare the reflectance spectra measured in the field and laboratory [21].
ASTER measures visible reflected radiation in three spectral bands, infrared reflected radiation in six spectral bands and emitted radiation in five spectral bands. The sensor characteristics of ASTER are provided in Table 1 (for further details see http://asterweb.jpl.nasa.gov/content/03_data/04_Documents/aster_user_guide_v2.pdf). The higher spectral resolution of the ASTER data in the SWIR region with respect to the Landsat images and its numerous bands in the infrared wavelength range (six vs. two spectral bands) enhances its potential for surface mineralogical and lithological mapping. Indeed, ASTER spectral band 8 correspond to the diagnostic carbonate absorption near 2.31–2.33 μm in SWIR region whereas, band 14, which has an absorption peak at 11.2 μm in thermal infrared (TIR) wavelength region, is used to map carbonate minerals and carbonate bearing rocks. ASTER bands 1 and 3 contain ferric (Fe+3) and ferrous (Fe+2) irons absorptions such as 0.45 μm and 1.0–1.1 μm. The bands are useful in discriminating iron rich weathered surface [22,23,24]. In this study, the VNIR-SWIR spectral bands of ASTER (Table 1) were processed to remotely identify exotic limestone and associated rocks using ENVI™.
This study uses Landsat 7 (ETM+) data acquired on 28 October 2000 for the Nakhl region since the data is cloud free and considered more suitable to compare with the ASTER data. Landsat 7 (ETM+) has six channels in the visible and reflected infrared regions (0.52 to 2.35 μm) and one channel in the thermal infrared region (10.4 to 12.5 μm; Table 1). To correct geometrical distortion of spectral bands, the bands (except thermal band) were resampled by nearest neighbor resampling method and orthorectified using geological and topographic maps [25] (used to identify nine ground control points in 1:100,000) in UTM projection coordinate system (Zone 40, Clark 1980 spheroid, PSD93 datum, EPSG: 3440). The estimated orthorectification of image precision of this study is 15 m [26]. The calibration of ETM+ images was based on established parameters [27]. A radiative transfer model was performed for each scene based on the Acronym 6S and 5S Codes [28,29]. The atmospheric transmission factors were calculated using the Modtran-4 code [30].

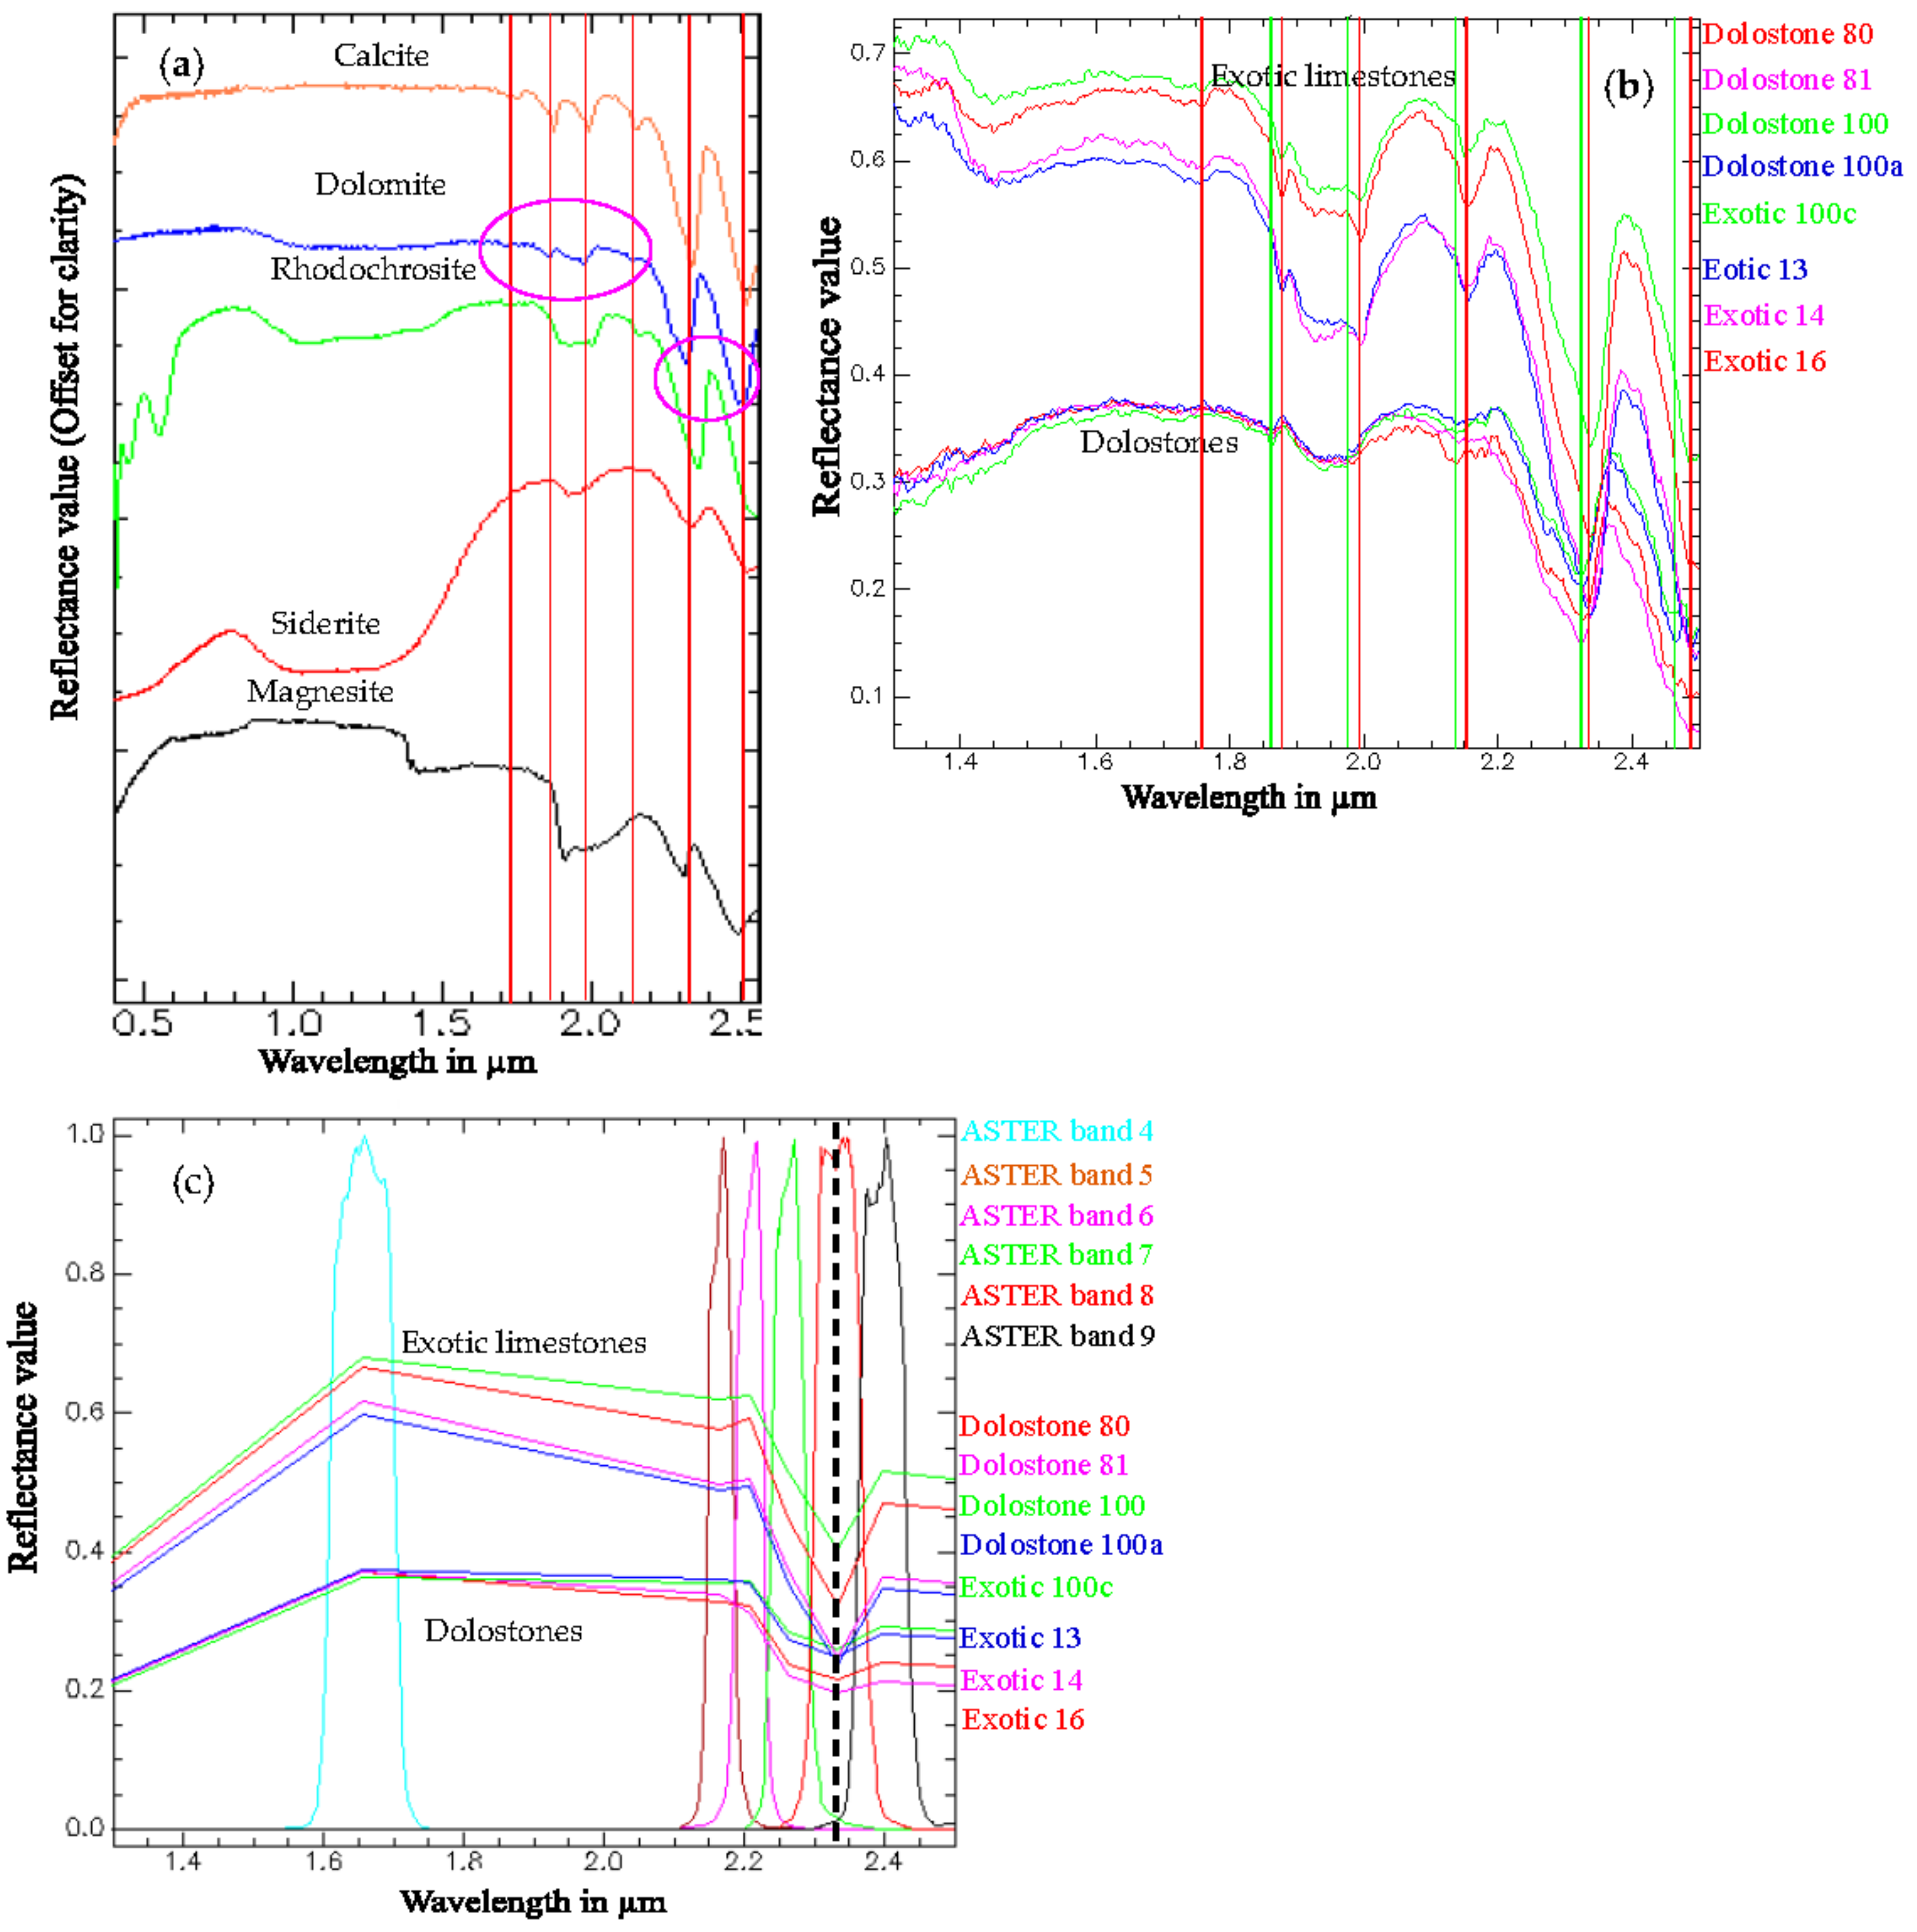
3.2. Characterization of Spectral Signature of the Exotic Limestone

In this study, the spectral absorptions of the exotic limestone are characterized using spectra of minerals stacked from the United States Geological Survey (USGS) Spectral Library for minerals (using ENVI™ in 0.3 to 2.5 µm) and by measuring spectra of exotic limestone and dolostone samples using spectrometer (in 1.3 to 2.5 µm). In order to understand spectral absorption features of the exotic limestone and massive dolomites (Mahil Formation of Oman) of study region, the reflectance spectra of representative field samples of the rocks were measured in the wavelength of 1.3 to 2.5 µm with the spectral resolution of 7 nm in SWIR region using a PIMA™ spectrometer. The instrument has a built-in wavelength calibration target plate and is capable of measuring spectra from 10 s to around 5 min speed. The instrument is provided with PIMA View Graph™ software (version 3.1; Integrated Spectronics Pty Ltd., Baulkham Hills, Australia) to process and study the spectra of samples. Spectra of more than 90 samples of exotic limestone (unweathered) were measured in the laboratory environment and spectra of selected samples are discussed in Section 3.3. Thin sections of selected samples were prepared to study the petrological characters of minerals of the samples. Moreover, the samples used for spectral studies were further powdered and analyzed using the X-ray powder diffraction method using X'Pert PRO (Malvern Panalytical, Almelo, The Netherlands) working, based on PW1710 (Cu: 1.54) for identification of minerals.
Study of spectral signatures of the exotic limestone is important to discriminate and map their occurrences and spatial distributions. Several studies have shown the absorption features of reflectance spectra of carbonate minerals [31,32,33,34]. Figure 2a shows the spectra of the predominant carbonate minerals, namely calcite (CaCO3), dolomite (CaMg(CO3)2), siderite (FeCO3), magnesite (MgCO3) and rhodochrosite (MnCO3) stacked from the USGS Spectral Library for minerals in the 0.3 to 2.5 µm spectral range. Figure 2b shows the spectra of field samples of the exotic limestone and dolostones (Mahil Formation of Hajar Super Group) of the study region measured with the PIMA spectrometer in the range of 1.3 to 2.5 µm.
The absorptions of calcite and dolomite minerals [33] and the exotic limestone and dolostone rocks in the study region are given in Table 2. As evident in Table 2 and Figure 2a, calcite and dolomite show unique spectral absorption features between 1.735 µm and 2.541 µm [33]. In particular, calcite minerals from the exotic limestones of study region show six absorption positions at 1.752, 1.875, 1.992, 2.154, 2.341 and 2.491 µm (Figure 2b, vertical lines in red). Here, the occurrence of absorption features around the 2.341 µm and 2.491 µm are due to the presence of carbonate, and the features around the 1.875 µm and 1.992 µm are due to the presence of calcium in the calcite mineral samples. The dolostones of Mahil Formation of study region shows five absorption positions at 1.863, 1.981, 2.144, 2.472 and 2.328 µm (Figure 2b, vertical lines in green). The occurrence of absorption features around the 2.328 µm and 2.472 µm are due to the presence of carbonate and the features around the 1.863 µm and 1.981 µm are due to the presence of calcium and magnesium in the dolomite minerals.
The different absorptions between the calcite and dolomite is due to the physical, optical and chemical compositions of these minerals in the exotic limestone and dolostone blocks [34]. Several studies show that calcite and dolomite can be distinguished and identified by variations in their absorptions between 2.33 µm and 2.45 μm wavelengths [6,33,34]. All the spectral plots and the values demonstrate that the carbonate minerals have unique absorptions and can be used significantly to study the spectral bands of satellite data and process them to discriminate rocks containing calcite or dolomite [31,33]. Figure 2c presents a spectral plot of the exotic limestones and dolostones of the study regions resampled to the SWIR bands (4 to 9) of ASTER to the wavelengths of 1.3 to 2.5 μm. It shows clearly that the carbonate rocks of study region have absorptions in the ASTER band 8 (black vertical dashed line in the Red band width) which can be used to discriminate exotic limestones.

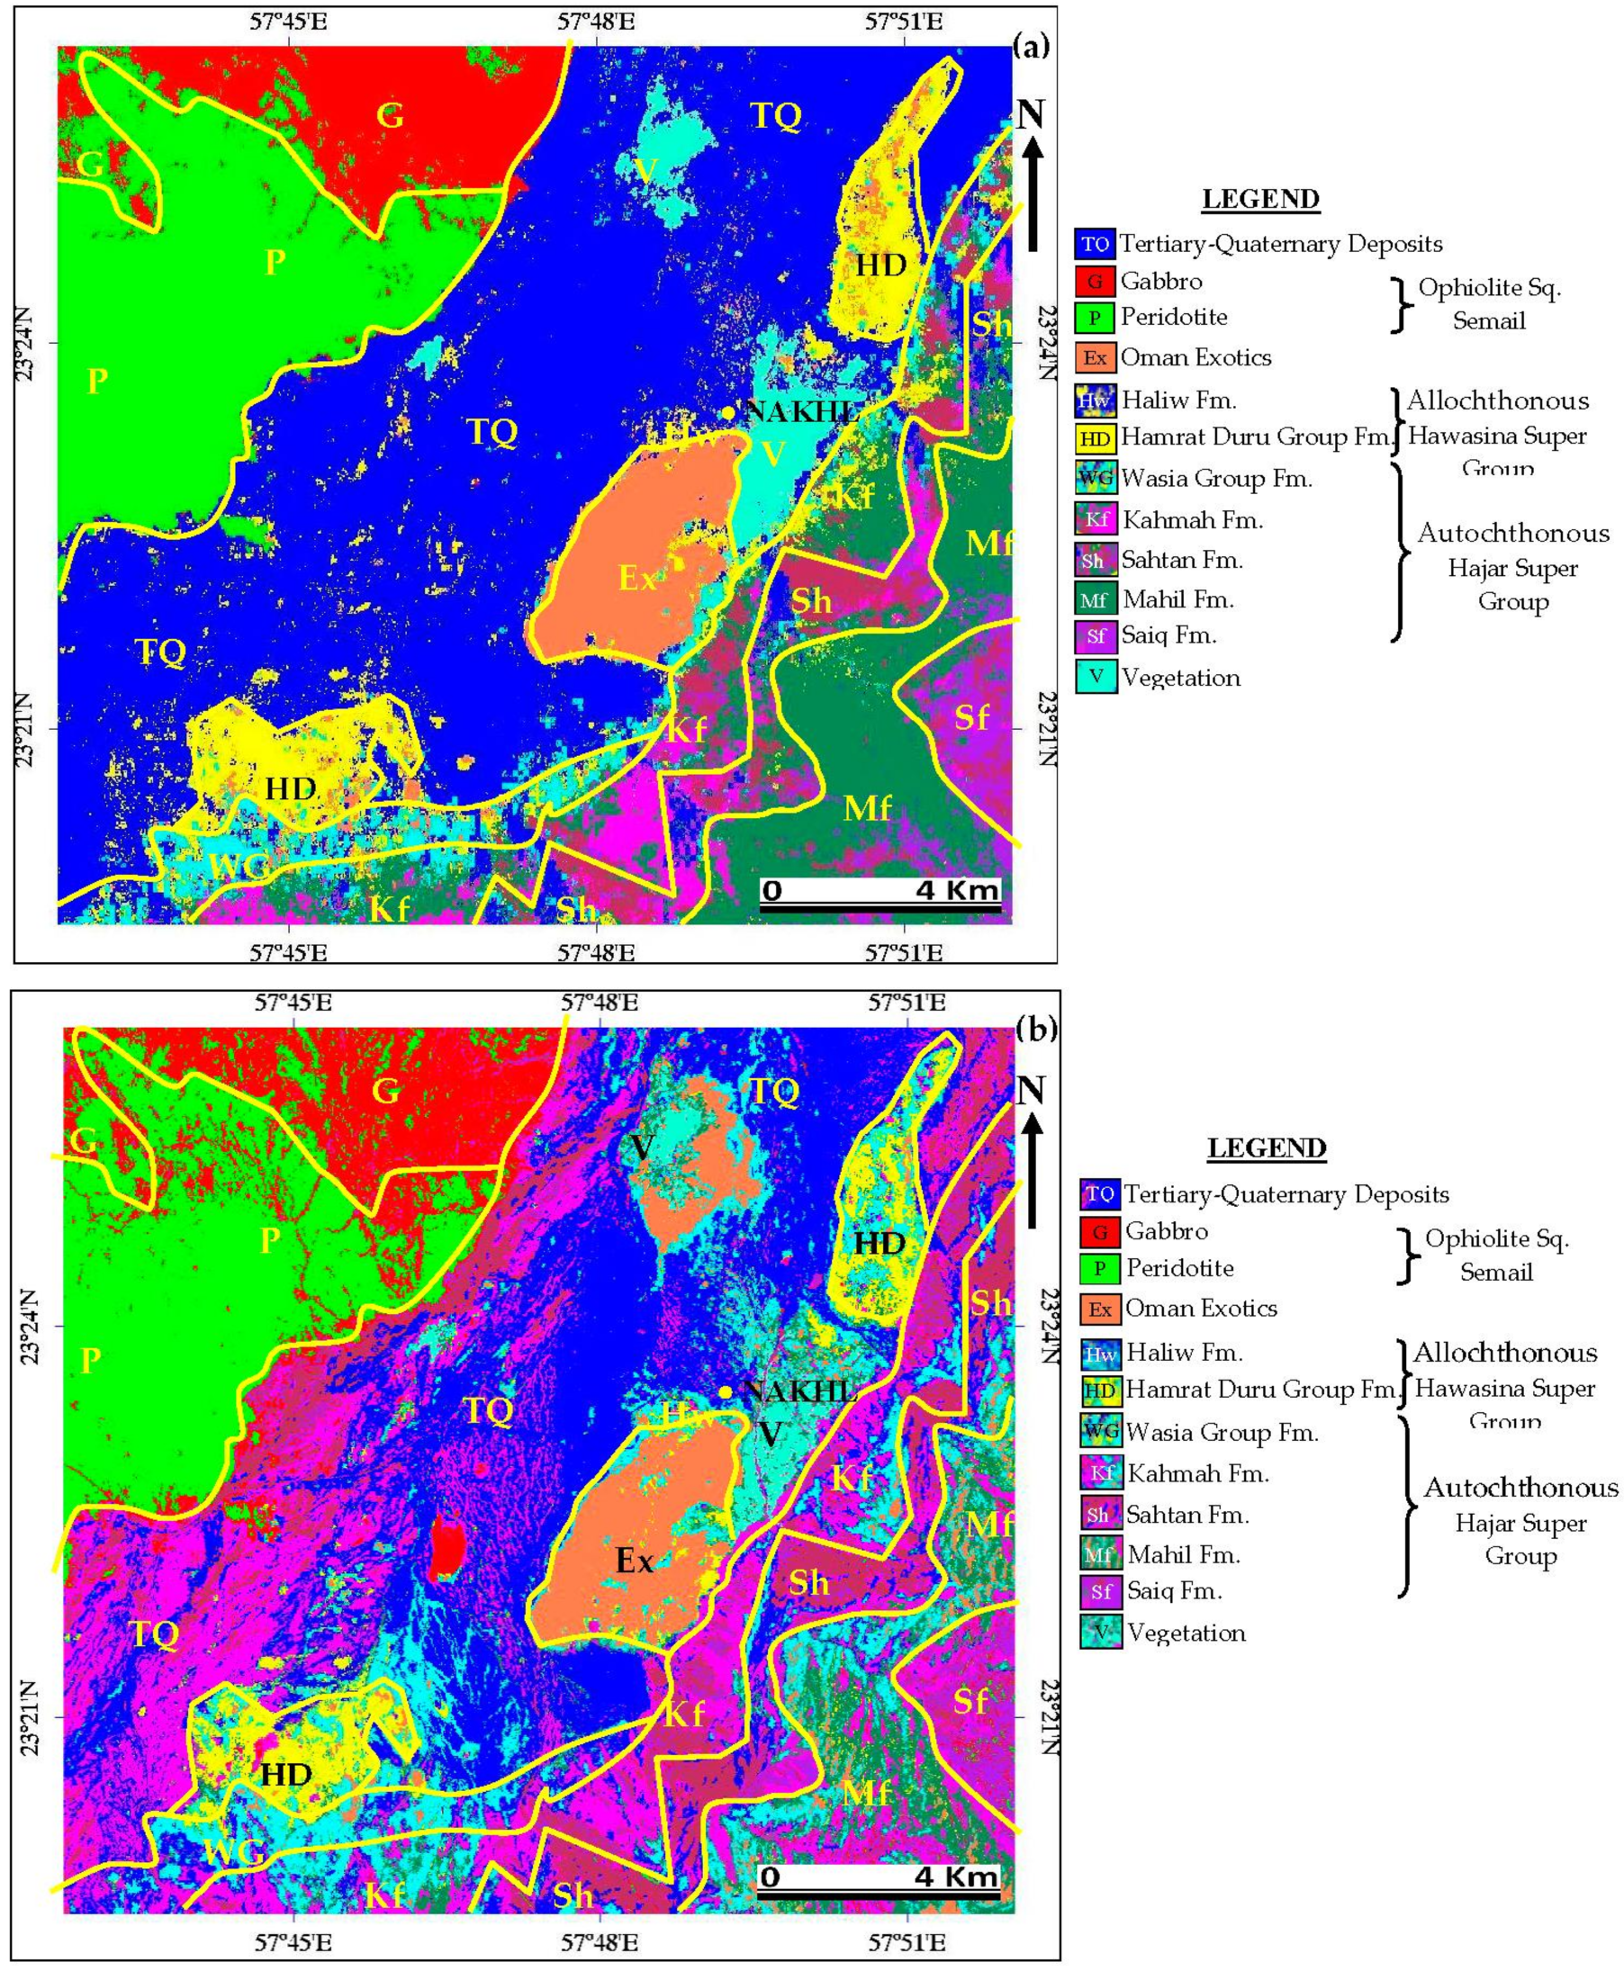
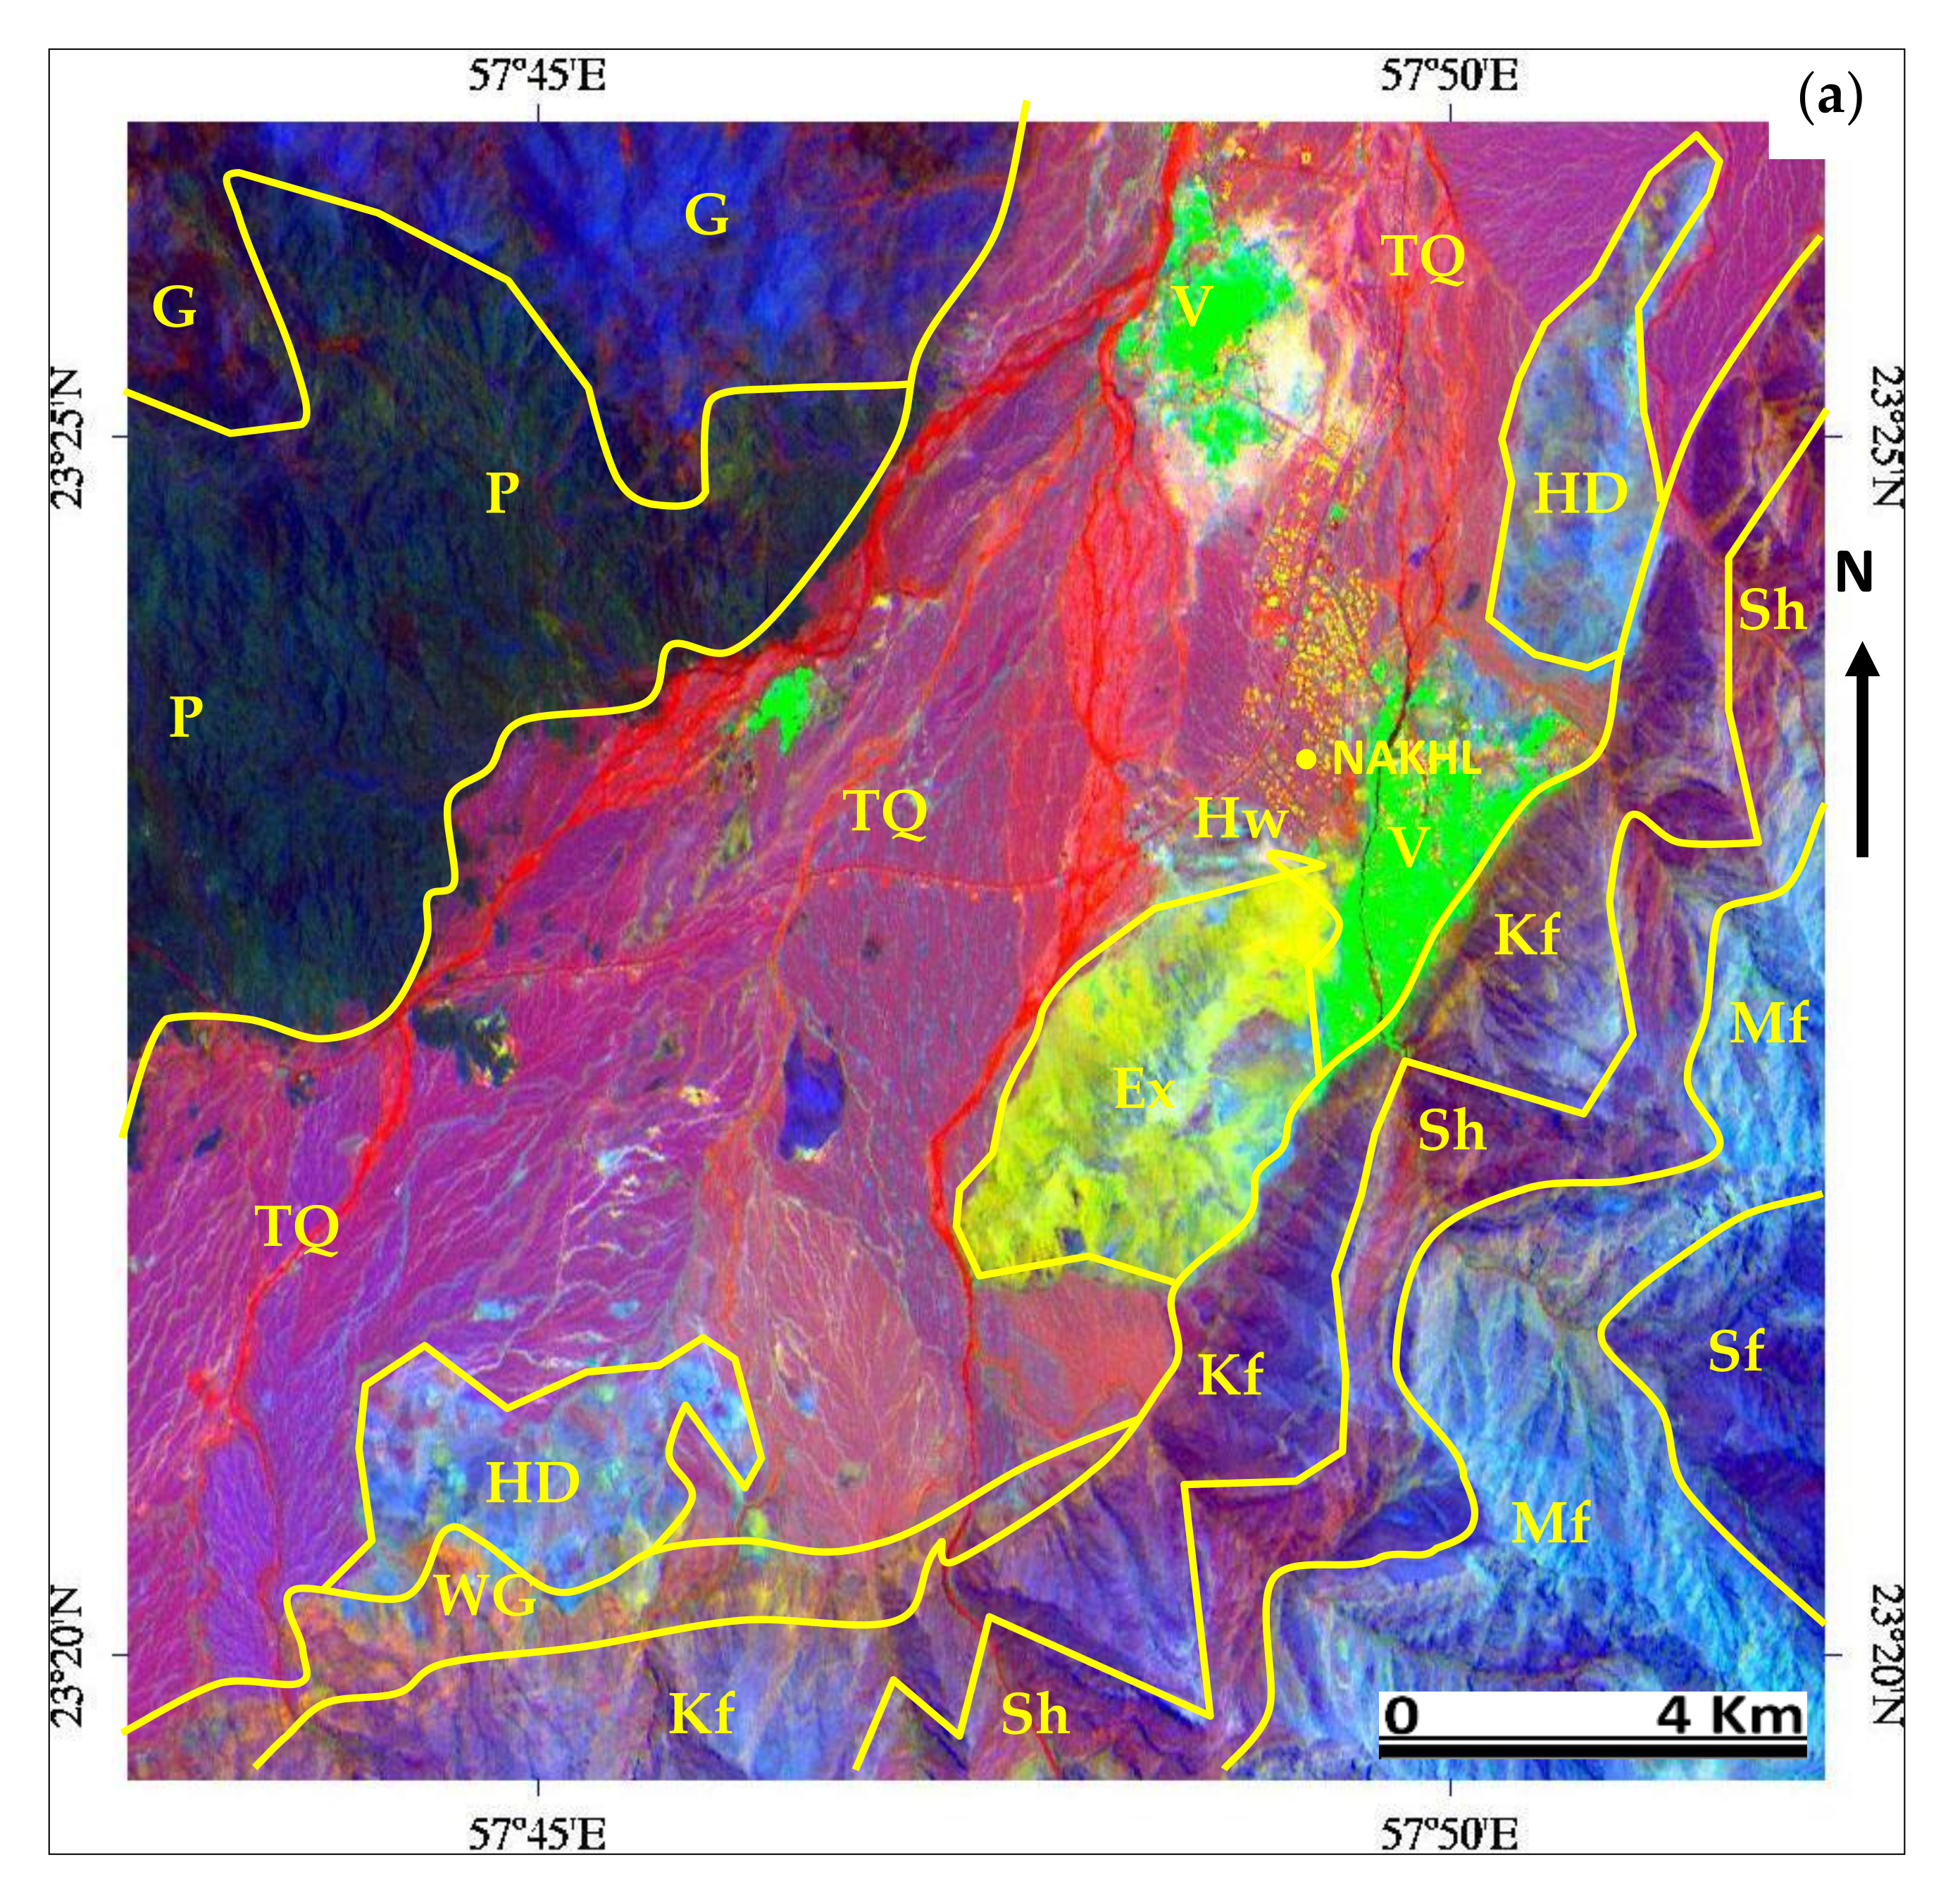
3.3. Image Elaboration Methodologies
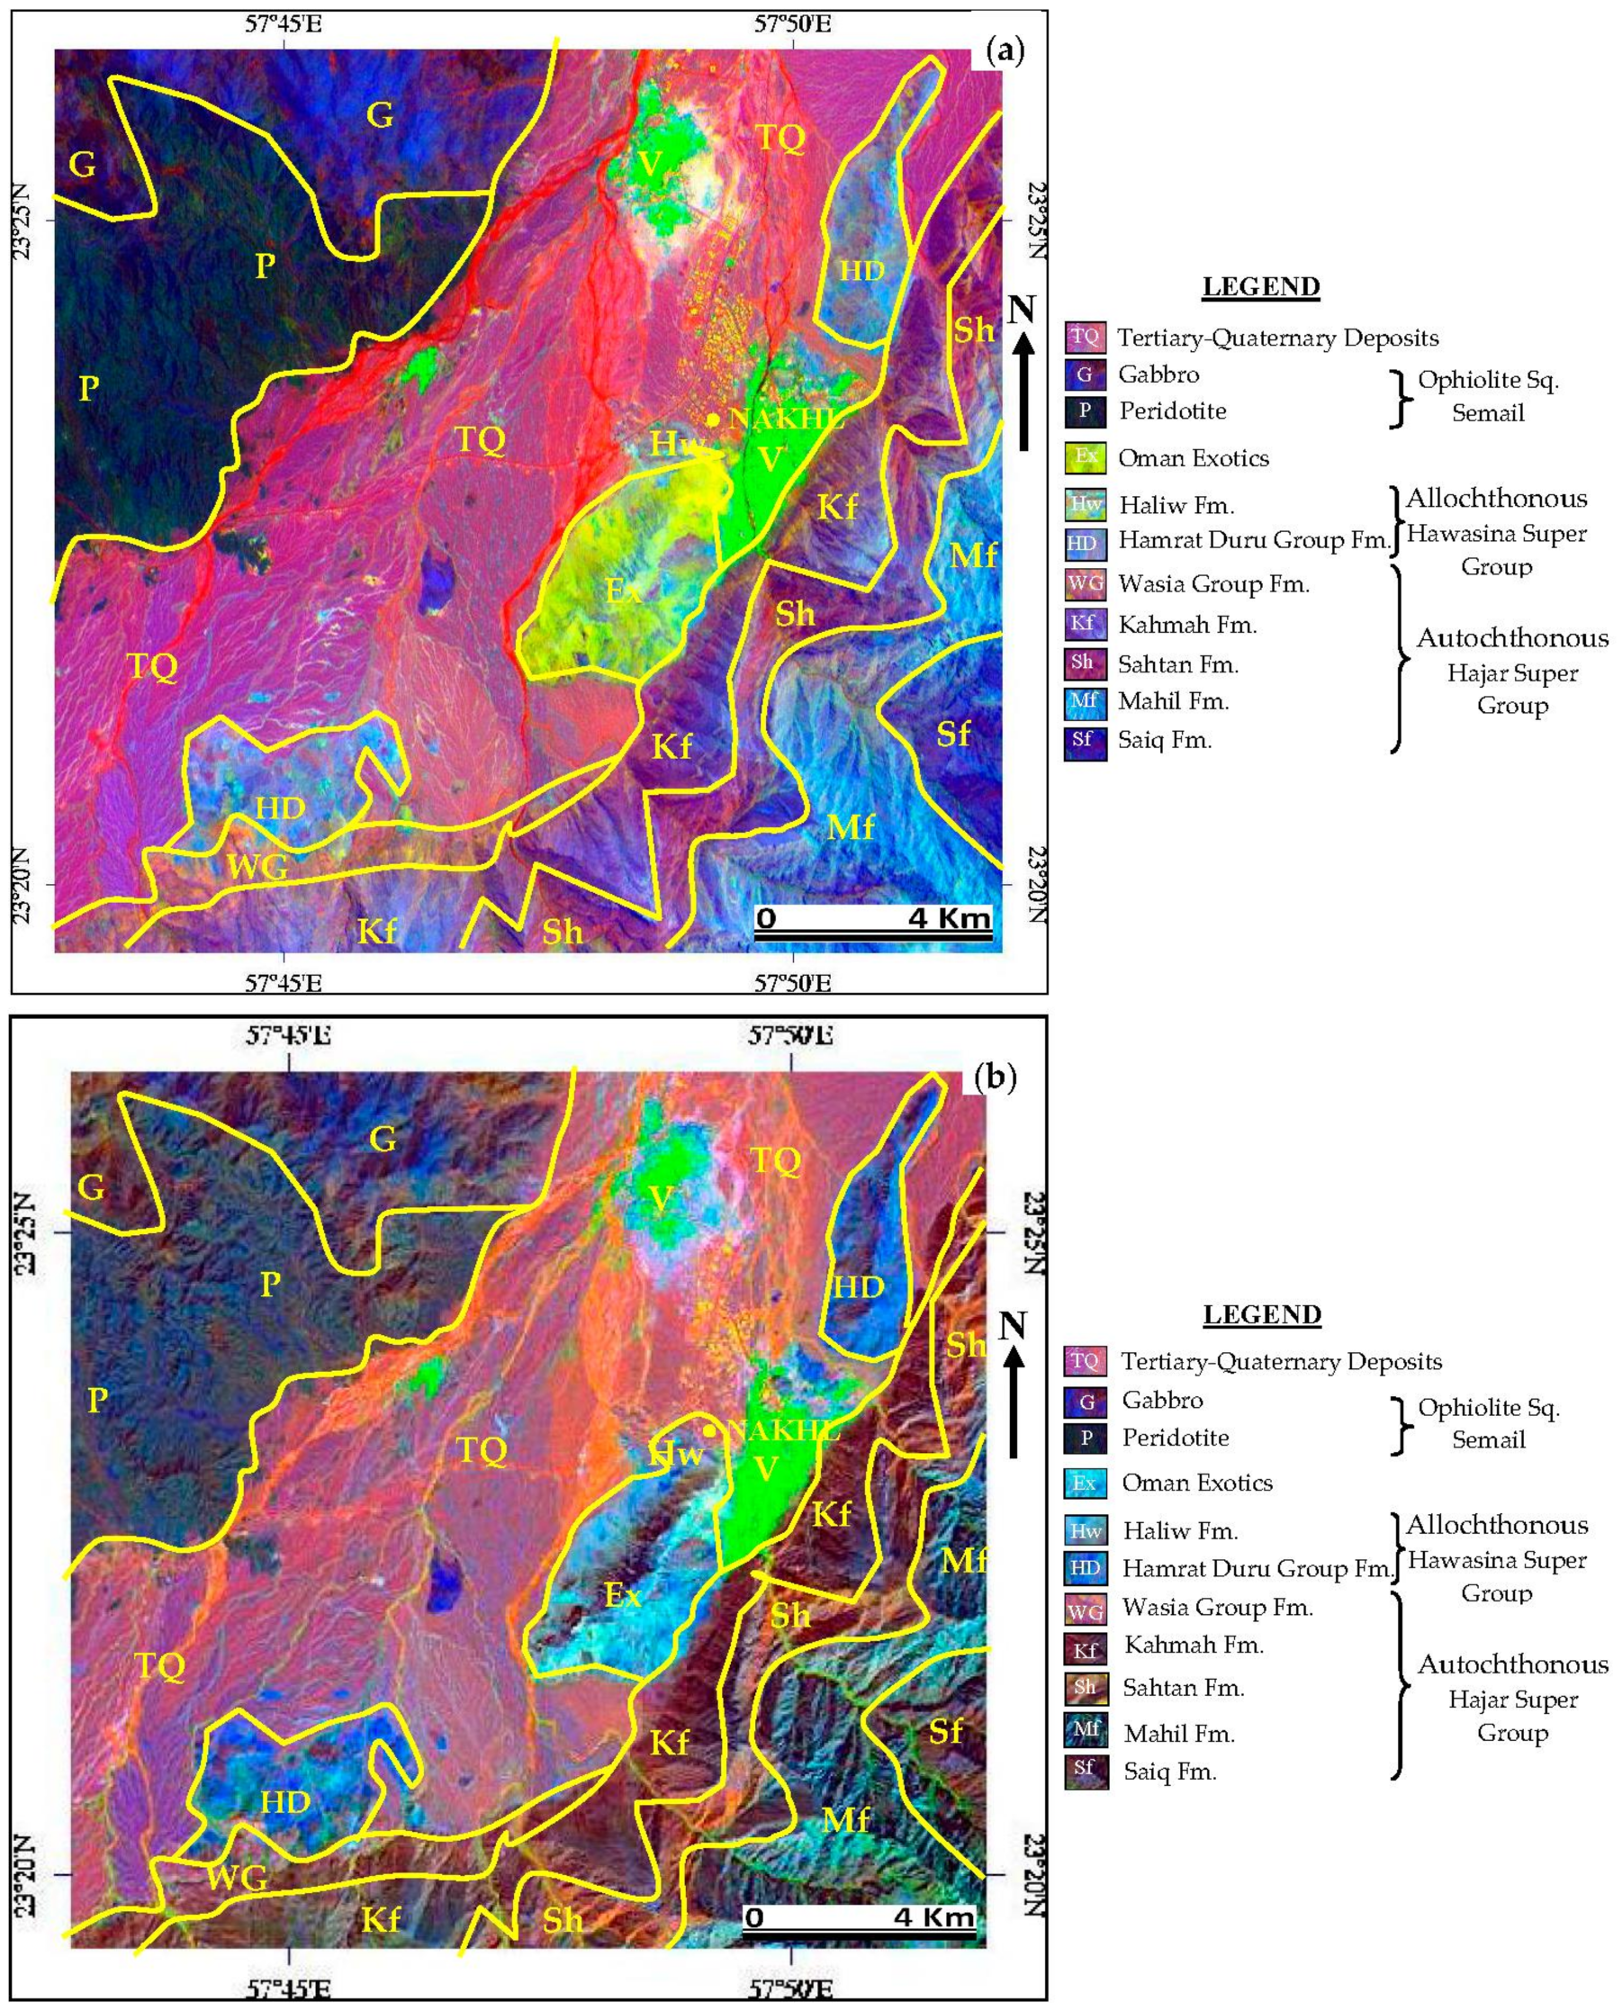
To discriminate the exotic limestone from the other rock types in the region, we utilized ASTER spectral bands 8, 3, 1 and the decorrelation stretch image processing method which was already applied in previous works [14,35,36]. The ASTER band 8 is selected to show the occurrence of calcite rich exotic limestone, the band 3 is chosen to highlight the very low response of the ferro-magnesium silicate minerals in the rocks associated with the exotic limestone, and the band 1 is preferred to characterise the iron rich ophiolites of the study region [36]. The decorrelated image of the study region is discussed in Section 5. The discrimination of exotic limestone is also compared and studied using Landsat 7 (ETM+) data. We processed spectral bands 7, 4 and 2 of Landsat 7 (ETM+), which are equivalent to the ASTER spectral bands 8, 3 and 1 (highlighted in Table 1), using the decorrelation stretching method.
The occurrence and spatial distribution of the exotic limestone of the Nakhl region (subset 882 × 840 pixels) is studied using VNIR-SWIR spectral bands of ASTER by the Maximum Likelihood Classification (MLC), Spectral Angle Mapper (SAM) and Spectral Information Divergence (SID) algorithms and assessed accuracy of the mapping by confusion matrix [37]. The ML Classification assumes that the statistics for each class in each band are normally distributed and calculates the probability that a given pixel belongs to a specific class [38,39]. Each pixel is assigned to the class that has the highest probability. If the highest probability is smaller than a specified threshold, the pixel remains unclassified [40,41]. SAM determines the spectral similarity between the spectra of each pixel and reference spectral end-members by calculating the angle between the vectors in a space with dimensionality equal to the number of bands [42,43]. The smaller angles represent closer matches to the reference spectrum; the pixels further away than the specified maximum angle threshold in radians are not classified. The SAM classification is tested to the study region using the spectral components identified by the pixel purity index (PPI) algorithms to the same samples of the respective classes of the MLC results. The threshold level is provided on the basis of reference spectrum range with the PPI iteration value of 5000 and the angle of 0.1 radians. The small angle is used to obtain high similarity of the endmember pixels. SID is a spectral classification method that uses a divergence measure to match pixels to reference spectra. The smaller is the divergence, the higher is the similarity between the pixel and the reference spectra. The pixels with a measurement greater than the specified maximum divergence threshold are not classified. The SID mapping is applied by studying the absorption characters of endmembers and ground truth Regions of Interest (ROIs) to compare the results of SAM and MLC methods [12,13]. The contingency matrixes and classification accuracies of all algorithms are provided and discussed in Section 4. The results of decorrelation stretch and confusion matrix were verified during field work carried out in this study.
The confusion matrix is analysed on the bases of training samples [44,45]. Ground-truth based training ROIs in the imagery were used since (1) the library and field spectra were not acquired under the same condition of the satellite imagery and (2) the image endmembers are directly associated with surface components detectable in the scene for accuracy assessment. To select ROIs, the absorption characters of minerals of the formations studied using the USGS spectral library (ENVI™), the spectra measured from field samples using PIMA™ spectrometer and the field study of different formations are considered. We used 11 main classes including the rock types of ophiolite sequence (Gabbro—G; Peridotite—P), the formations of Hajar Super Group (Hamrat Duru Group Fm.—HD; Exotic limestone—Ex), the Hawasina Super Group (Wasia Group Fm.—WG; Kahma Fm.—Ka; Sahtan Fm.—Sa; Mahil Fm.—Ma; Saiq Fm.—Sq), the Tertiary-Quaternary deposits (TQ) and the vegetation (V) [45,46,47]. We adopted stratified random sampling (collection of ROIs) of the diverse rock types in the region [47]. In this study, 264 samples were analyzed, representing a collection of 24 samples for each rock class.

4. Results

The decorrelated image of the ASTER spectral bands 8, 3 and 1 (Red: 8; Green: 3; Blue: 1) of the study region is given in Figure 3a. The image shows the exotic limestone of the shallow-marine facies of Nakhl region in bright yellow. The other formations associated with the exotic limestone are in different tones. The dolomite of the Hamrat Duru, Saiq and Mahil Formations appear in very light blue, dark blue, and blue respectively. The limestones of Sahtan, Kahmah and Wasia Formations appear in a mixture of pink, blue, and orange. In addition, the peridotites and gabbros of the ophiolite sequence appear in brownish dark green and brownish purple respectively. The image shows the Quaternary and Tertiary formations in red to light purple red (Figure 3a). The vegetation of the region appears in light green in the image. Topographic features and elevation changes are accentuated in this image enhancement technique.
We compared the RGB 8, 3 and 1 ASTER decorrelation stretch with the RGB 7, 4 and 2 Landsat 7 (ETM+) decorrelation stretch (Figure 3a vs. Figure 3b). In the Landsat 7 (ETM+) image (Figure 3b), the exotic limestone appears in blue and the associated formations, namely Hamrat Duru and Mahil Formations, exhibit blue and a mixture of bluish green respectively. However, the image shows no differences in discrimination of the Saiq, Sahtan, Kahmah and Wasia Formations, which appear as a mixture of light blue and orange (Figure 3b). The peridotites and gabbros of the ophiolite sequence are shown in a mixture of light blue and green and are not appreciably discernable in Figure 3b.
To assess the accuracy of mapping of exotic limestone, the confusion matrix algorithms related to MLC, SAM and SID are applied to the Nakhl region. The results of matrixes are provided in Table 3. MLC shows the best overall accuracy of 99.15% and a Kappa Coefficient of 0.99 (Table 3a) while SAM and SID show an overall accuracies of 79.71% and 80.23%, and Kappa Coefficients of 0.76 and 0.77 respectively (Table 3b,c). The MLC algorithm identified the exotic limestone with the highest User’s accuracy of 100% (Table 3a). The best result of the matrix of Maximum Likelihood algorithm is provided in Figure 4a. The gabbro (G) and peridotite (P) of the ophiolite sequence, Kahma Formation (Ka), Sahtan Formation (Sa) and Mahil Formation (Ma) of the Hajar Super Group and vegetation (V) were identified with the highest level accuracy of 100%. The algorithm also provided the 100% Producer’s accuracies to the ophiolite rocks, Hajar Super Group formations, Tertiary-Quaternary deposits (TQ) and vegetation. No significant larger commission or omission errors are reported in the confusion matrix.
On the other hand, the SAM algorithm identified the exotic limestone with the User’s accuracy of 93.92% and Producer’s accuracy of 83.26% (Table 3b; Figure 4b). Gabbros and peridotites are characterized by User’s accuracies of 89.20% and 97.37% and Producer’s accuracies of 95.28% and 97.69% respectively. The formations of Hamrat Duru Group and Hajar super Group have relatively low User’s accuracies from 41.21% to 65.15% and Producer’s accuracies from 59.55% to 77.05% (Table 3b). The SAM produced 100% User’s accuracy for vegetation. SID algorithm identified the exotic limestone with the User’s accuracy of 95.82% and Producer’s accuracy of 84.46% (Table 3c; Figure 4c). The algorithm recognized gabbro and peridotite with the User’s accuracies of 89.97% and 98.03% and Producer’s accuracies of 94.06% and 98.68% respectively. The algorithm produced User’s accuracies of 58.23%, 76.67%, 84.57% and 62.60% for Hamrat Duru formations, Sahtan, Mahil and Saiq Formations of Hajar Super Group respectively (Table 3c). The vegetation of the region is identified with 100% User’s and Producer’s accuracies.

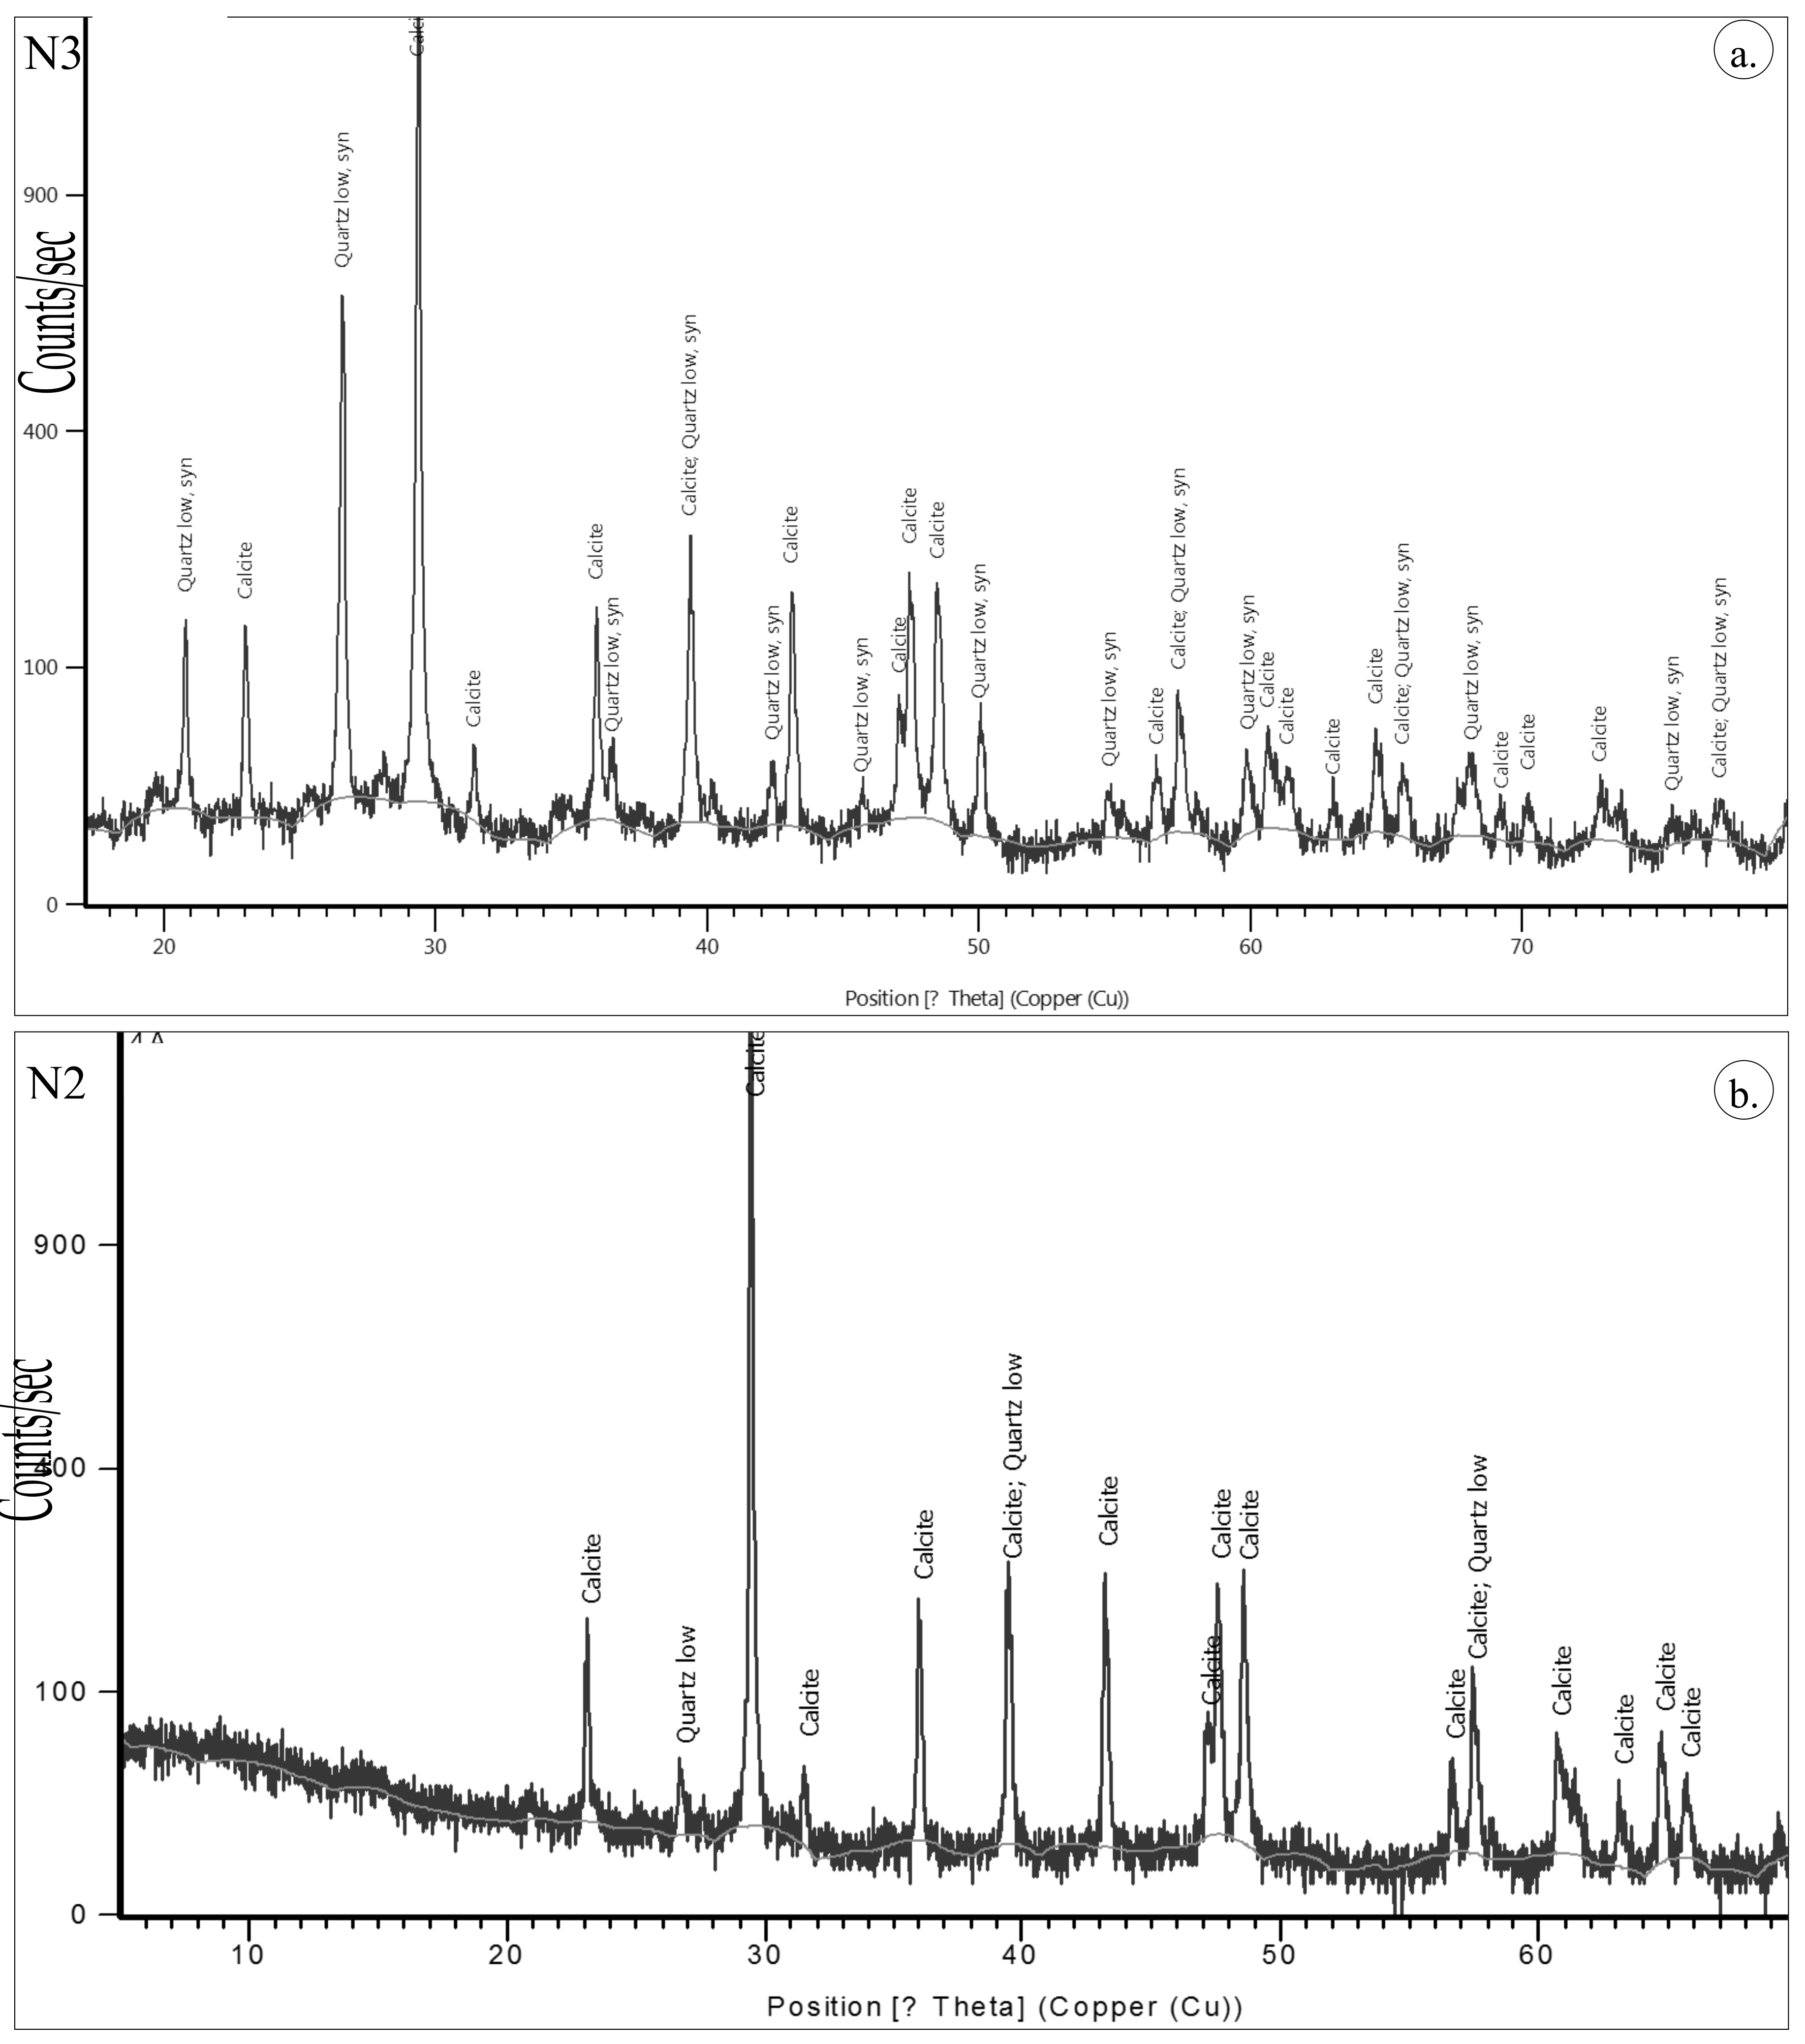
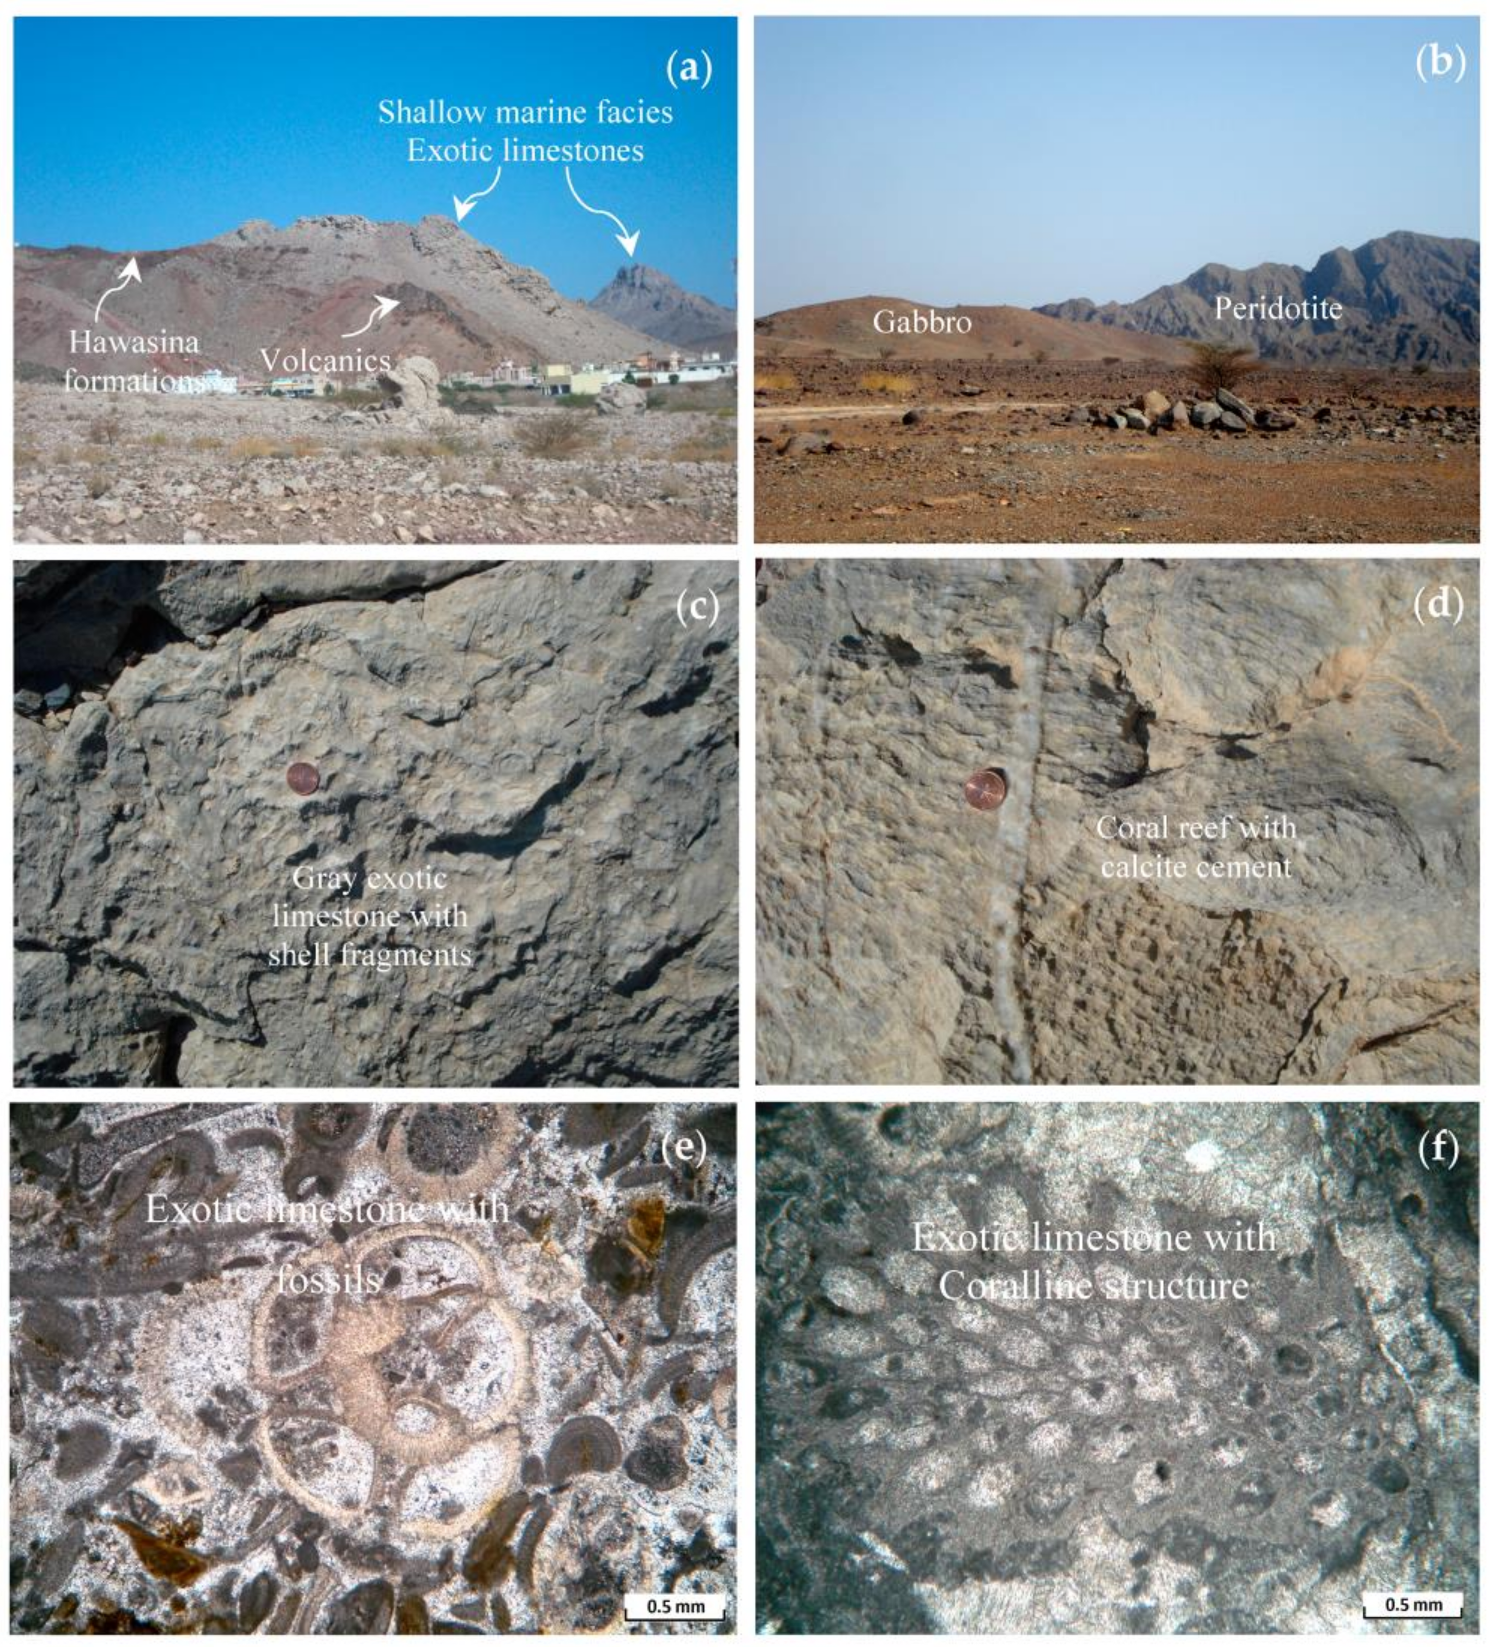
Field and Laboratory Studies

To evaluate the capability of spectral bands of ASTER, the interpreted images are verified in the field for the occurrence and distribution of the exotic limestone and other formations. In the field, the exotic limestone of Nakhl region occurs as small seamounts about 100 to 200 m thick. The exotic limestone is underlain by Haybi volcanic rocks (Figure 5a) and occurred in between Hawasina formations (Figure 5a) and Semail ophiolite sequence (Figure 5b). The exotic limestone is coral seamounts appearing in gray with massive amounts of brachiopods, gastropods and other fossils fragments (Figure 5c). In hand specimen, the limestone shows presence of coral reefs filled with calcite cement and micrite (Figure 5d). Under the microscope, occurrence of the calcite minerals rich coral fibers with fossils skeletal fragments are observed in the exotic limestone of the shallow marine facies (Figure 5e,f). The X-ray powder diffraction (XRD) analysis of the sample confirms the minerals of the exotic limestone (Figure 6a,b).

5. Discussion

In this study, the absorption wavelengths of the exotic limestone 2.333–2.340 µm (Table 2) is correlated to the wavelength of the ASTER band 8 which is 2.295–2.365 µm and the Landsat 7 (ETM+) band 7 2.09–2.35 µm. The effectiveness in recognizing the exotic limestone is much better for the ASTER sensor due to its narrow band 8. Indeed, the decorrelation of ASTER spectral bands 8, 3 and 1 well discriminated the exotic limestone of the shallow-marine facies of Nakhl region in bright yellow (Figure 3a). In particular, the discrimination is due to the spectral absorption of calcite in the exotic limestone. The decorrelated ASTER RGB 8, 3, and 1 color composite differentiated also the other formations with different tones in different topographic contexts (wadis and mountains). On the other hand, the decorrelated image of spectral bands 7, 4 and 2 of the Landsat 7 (ETM+) (Figure 3b) showed the exotic limestone in blue and the associated formations in a mixture of bluish green. However, this image is not able to discriminate the Saiq, Sahtan, Kahmah and Wasia Formations, that appear as a mixture of light blue and orange. The discrimination is due to the absorption of dolomite minerals in the formations. The peridotites and gabbros of the ophiolite sequence are shown in a mixture of light blue and green and are not discriminated appreciably in the Figure 3b. In contrast, they are well discriminated in brownish dark green and brownish purple respectively in Figure 3a. The tonal variations in the discrimination of ophiolite sequence and Hawasina Formations are due to their absorptions at bands 3 and 8. The wider bandwidth of Landsat 7 (ETM+) is not efficient enough to discriminate exotic limestone and the other formations (Figure 3b).
The accuracy exotic limestone mapping through image classification algorithms such as MLC, SAM and SID was assessed using a confusion matrix which has taken ground-truth based training ROIs as reference. According to the results of the confusion matrixes, Nakhl region showed the best overall accuracy of 99.15% and the Kappa Coefficient of 0.99 was obtained by the MLC algorithm (Table 3a). The SAM and SID produced overall accuracies of 79.71% and 80.23% and Kappa Coefficients of 0.76 and 0.77 respectively. The MLC algorithm distinctly identified the exotic limestone with the highest User’s accuracy of 100% and Producer’s accuracy of 97.46%. The high overall accuracy of 100% is due to the presence of distinct composition in the exotic limestone. A comparative assessment for mapping accuracy of exotic limestone using the SAM and SID algorithms showed the User’s accuracies of 93.92% and 95.82% and Producer’s accuracies of 83.26% and 84.46% respectively (Table 3; Figure 4b,c). If compared to MLC, both algorithms poorly identified the ophiolite sequence and the formations of Hamrat Duru Group and Hajar super Group (Table 3a–c; Figure 4a–c). However, the identification of sequence and formations by the SID algorithm is better than the SAM algorithm. It can be assessed that all the algorithms identified the vegetation with maximum accuracy of 100%. Field verifications have further confirmed the occurrence of exotic limestone in the Nakhl region. The limestone is underlain by Haybi volcanic rocks and occurred in between Hawasina formations and Semail ophiolite sequence. It consists of fossil fragments of the brachiopods, gastropods and coral reefs filled with calcite cement and micrite. The spectral reflectance measurement of samples of the exotic limestones of Nakhl region confirmed carbonate absorptions near 2.341 and 2.491 μm (Figure 2b,c; Table 2). The study of thin sections of exotic limestone under the microscope showed the presence of calcite minerals rich coral fibers with fossils skeletal fragments. The analysis of powder samples of exotic limestone by X-ray powder diffraction (XRD) method further confirmed the minerals of the exotic limestone.

6. Conclusions

In the present study, the exotic limestone of the shallow-marine facies of Nakhl region is mapped using the VNIR-SWIR spectral bands of ASTER. The spectral absorption characters of the exotic limestone and dolostone are studied and the spectral bands 8, 3 and 1 of ASTER are processed by decorrelation stretching method. The decorrelated image (R:8; G:3; B:1) clearly discriminated the exotic limestone in bright yellow. A comparative study with the decorrelated spectral bands 7, 4 and 2 of the Landsat 7 (ETM+) demonstrated that the narrow bandwidth at wavelength range 2.295–2.365 μm of ASTER is superior in the discrimination of the exotic limestone. According to the accuracy assessment through confusion matrixes applied on MLC, SID and SAM, the overall accuracy in discriminating rock types was very high (99%) for the MLC algorithm. Similarly, the MLC classification clearly identified the exotic limestone with the highest User’s accuracy of 100%. SID algorithm is relatively better than SAM in the mapping of ophiolite sequence and formations of Hamrat Duru Group and Hajar super Group. All the algorithms identified the vegetation with maximum accuracy of 100%. The mapping of exotic limestone has been validated through the field and laboratory studies. The occurrence of exotic limestone and associated rocks are verified in the field; the mineralogy of the exotic limestone is studied under microscope and by XRD analysis. This study characterized the spectral properties of the exotic limestone (Oman marble), demonstrated the capability of spectral bands of the ASTER sensor, and the potential of decorrelation image processing method to remotely map exotic limestones commonly referred to as the Oman marble. We believe that these techniques for exotic limestone detection can be widely used in other arid regions for industrial rock resources as well as for exploration and mining geology.

Acknowledgments

The authors are thankful to the NASA Land Processes Distributed Active Archive Center User Services, USGS Earth Resources Observation and Science (EROS) Center (https://LPDAAC.usgs.gov) for providing the ASTER data. This study is supported by the HM grant no SR/DVC/ESRC/15/01. The authors are very much thankful to the anonymous reviewers of the journal for their valuable reviews, providing constructive comments and suggestions that have helped to present the work lucidly.

Author Contributions

Sankaran Rajendran and Sobhi Nasir characterized, mapped, and interpreted marbles of study areas using satellite data. Mohammed A. K. El-Ghali, Khaled Alzebdah, Ali Salim Al-Rajhi and Mohammed Al-Battashi assisted the interpretation of results, enlightened their geological background and joined to validate geological ground truth data. Sankaran Rajendran and Sobhi Nasir drafted the article. We discussed the results and implications at all stages of this manuscript.

Conflicts of Interest

The authors declare no conflict of interest.

References

  1. Smith, M.R. (Ed.) Stone: Building stone, rock fill and armourstone in construction. In Geological Society Engineering Geology; Special Publication No. 16; Geological Society: London, UK, 1999. [Google Scholar]
  2. Nasir, S.; Rajendran, S.; El Ghali, M.; Hosni, T.; Elzebdeh, K.; Al-Rawas, G. Geotechnical Assessment of Dimension stone Resources in Oman. Int. J. Chem. Environ. Biol. Sci. 2015, 3, 439–443. [Google Scholar]
  3. Searle, M.P.; Graham, G.M. “Oman Exotics”—Oceanic carbonate build-ups associated with the early stages of continental rifting. Geology 1982, 10, 43–49. [Google Scholar] [CrossRef]
  4. Mwaniki, M.W.; Moeller, M.S.; Schellmann, G. A comparison of Landsat 8 (OLI) and Landsat 7 (ETM+) in mapping geology and visualising lineaments: A case study of central region Kenya. Arch. Photogramm. Remote Sens. Spat. Inf. Sci. 2015, XL-7/W3, 897–903. [Google Scholar] [CrossRef]
  5. Van der Meer, F.D.M.; Van der Werff, F.D.H.; Van Ruitenbeek, F.J.A.; Hecker, C.A.; Bakker, W.H.; Noomen, M.F.; Van der Meijde, M.; Carranza, E.J.M.; De Smeth, J.B.; Woldai, T. Multi- and hyperspectral geologic remote sensing: A review. Int. J. Appl. Earth Obs. Geoinf. 2012, 14, 112–128. [Google Scholar] [CrossRef]
  6. Rajendran, S.; Nasir, S.; Kusky, T.M.; Al-Khirbash, S. Remote sensing based approach for mapping of CO2 sequestered regions in Semail ophiolite massifs of the Sultanate of Oman. Earth Sci. Rev. 2014, 135, 122–140. [Google Scholar] [CrossRef]
  7. Bustos, E.; Báez, W.A.; Norini, G.; Chiodi, A.L.; Groppelli, G.; Arnosio, J.M. Using optical imagery data for lithological mapping of composite volcanoes in high arid Puna Plateau. Tuzgle volcano case study. Rev. Asoc. Geol. Argent. 2017, 74, 357–372. [Google Scholar]
  8. Harding, D.J.; Wirth, K.R.; Bird, J.M. Spectral mapping of Alaskan ophiolites using Landsat thematic mapper data. Remote Sens. Environ. 1989, 28, 219–232. [Google Scholar] [CrossRef]
  9. Öztan, N.S.; Süzen, M.L. Mapping evaporate minerals by ASTER. Int. J. Remote Sens. 2011, 32, 1651–1673. [Google Scholar] [CrossRef]
  10. Amer, R.; Kusky, T.M.; Ghulam, A. Lithological mapping in the central eastern desert of Egypt using ASTER data. J. Afr. Earth Sci. 2010, 56, 75–82. [Google Scholar] [CrossRef]
  11. Yuan, Y.; Kusky, T.M.; Rajendran, S. Tertiary and Quaternary Marine Terraces and Planation Surfaces of Northern Oman: Interaction of Flexural Bulge Migration Associated with the Arabian-Eurasian Collision and Eustatic Sea Level Changes. J. Earth Sci. 2016, 27, 955–970. [Google Scholar] [CrossRef]
  12. Abdelkareem, M.; El-Baz, F. Characterizing hydrothermal alteration zones in Hamama area in the central Eastern Desert of Egypt by remotely sensed data. Geocarto Int. 2017, 1–9. [Google Scholar] [CrossRef]
  13. Eslami, A.; Ghaderi, M.; Rajendran, S.; Pour, A.B.; Hashim, M. Integration of ASTER and Landsat TM remote sensing data for chromite prospecting and lithological mapping in Neyriz ophiolite zone, south Iran. Resour. Geol. 2015, 65, 375–388. [Google Scholar] [CrossRef]
  14. Rothery, D.A. Decorrelation stretching an aid to image interpretation. Int. J. Remote Sens. 1987, 8, 1253–1254. [Google Scholar] [CrossRef]
  15. Gillespie, A.R.; Kahle, A.B.; Walker, R.E. Color enhancement of highly correlated images. I. Decorrelation and HSI contrast stretches. Remote Sens. Environ. 1986, 20, 209–735. [Google Scholar] [CrossRef]
  16. Pournamdari, M.; Hashim, M. Detection of chromite bearing mineralized zones in Abdasht ophiolite complex using ASTER and ETM+ remote sensing data. Arabian J. Geosci. 2014, 7, 1973–1983. [Google Scholar] [CrossRef]
  17. Graham, G.M. Structure and Sedimentology of the Hawasina Window, Oman Mountains. Ph.D. Thesis, Open University, Milton Keynes, UK, 1980; p. 422. [Google Scholar]
  18. Searle, M.P. The Metamorphic Sheet and Underlying Volcanic Rocks Beneath the Semail Ophiolite in the Northern Oman Mountains of Arabia. Ph.D. Thesis, Open University, Milton Keynes, UK, 1980. [Google Scholar]
  19. Searle, M.P.; Malpas, J. Structure and metamorphism of rocks beneath the Semail ophiolite of Oman and their significance in ophiolite obduction: Royal Society of Edinburgh. Transactions 1980, 71, 213–228. [Google Scholar] [CrossRef]
  20. KSEPL. Geological Map of the Oman Mountains (Scale 1:500,000); KSEPL: Directorate General of Minerals, Sultanate of Oman, 1974. [Google Scholar]
  21. San, B.T.; Suzen, M.L. Evaluation of different atmospheric correction algorithms for EO-1 Hyperion imagery. Int. Arch. Photogramm. Remote Sens. Spat. Inf. Sci. 2010, XXXVII, 392–397. [Google Scholar]
  22. Rajendran, S.; Nasir, S. ASTER spectral sensitivity of carbonate rocks—Study in Sultanate of Oman. Adv. Space Res. 2014, 53, 656–673. [Google Scholar] [CrossRef]
  23. Mars, J.C.; Rowan, L.C. Spectral assessment of new ASTER SWIR surface reflectance data products for spectroscopic mapping of rocks and minerals. Remote Sens. Environ. 2010, 114, 2011–2025. [Google Scholar] [CrossRef]
  24. Baldridge, A.M.; Hook, S.J.; Grove, C.I.; Rivera, G. The ASTER spectral library version 2.0. Remote Sens. Environ. 2009, 113, 711–715. [Google Scholar] [CrossRef]
  25. Ministry of Petroleum and Minerals. Geological Map, Oman (1: 100,000). NAKHL—Sheet NF40-3E; Ministry of Petroleum and Minerals: Directorate General of Minerals, Sultanate of Oman, 1986. [Google Scholar]
  26. Baiocchi, V.; Brigante, R.; Dominici, D.; Milone, M.V.; Mormile, M.; Radicioni, F. Automatic three-dimensional features extraction: The case study of L’Aquila for collapse identification after April 06, 2009 earthquake. Eur. J. Remote Sens. 2014, 47, 413–435. [Google Scholar] [CrossRef]
  27. Chander, G.; Markham, B.L.; Helder, D.L. Summary of current radiometric calibration coefficients for Landsat MSS, TM, ETM+, and EO-1 ALI sensors. Remote Sens. Environ. 2009, 113, 893–903. [Google Scholar] [CrossRef]
  28. Vermote, E.F.; Tanre, D.; Deuzé, J.L.; Herman, M.; Morcrette, J.J. Second simulation of the satellite signal in the solar spectrum, 6S: An overview. IEEE Trans. Geosci. Remote Sens. 1997, 35, 675–686. [Google Scholar] [CrossRef]
  29. Tanre, D.; Deroo, C.; Duhaut, P.; Herman, M.; Morcrette, J.J.; Perbos, J.; Deschamps, P.Y. Technical note description of a computer code to simulate the satellite signal in the solar spectrum—The 5S code. Int. J. Remote Sens. 1990, 11, 659–668. [Google Scholar] [CrossRef]
  30. Berk, A.; Anderson, G.P.; Acharya, P.K.; Chetwynd, J.H.; Bernstein, L.S.; Shettle, E.P. MODTRAN 4 User’s Manual; Air Force Research Laboratory, Space Vehicles Directorate, Air Force Material Command: Hanscom AFB, MA, USA, 1999; pp. 1731–3010. [Google Scholar]
  31. Clark, R.N. Spectroscopy of rock and minerals and principles of spectroscopy. In Remote Sensing for the Earth Sciences: Manual of Remote Sensing, 3rd ed.; Rencz, A.N., Ed.; John Wiley & Sons: New York, NY, USA, 1999; Volume 3, pp. 3–58. [Google Scholar]
  32. Gaffey, S.J. Reflectance spectroscopy in the visible and near infrared (0.35–2.55 microns): Applications in carbonate petrology. Geology 1985, 13, 270–273. [Google Scholar] [CrossRef]
  33. Gaffey, S.J. Spectral reflectance of carbonate minerals in the visible and near infrared (0.35–2.55 microns): Calcite, aragonite, and dolomite. Am. Mineral. 1986, 71, 151–162. [Google Scholar]
  34. Gaffey, S.J. Spectral reflectance of carbonate minerals in the visible and near infrared (0.35–2.55 microns): Anhydrous carbonate minerals. J. Geophys. Res. 1987, 92, 1429–1440. [Google Scholar] [CrossRef]
  35. Abrams, M.J.; Rothery, D.A.; Pontual, A. Mapping in the Oman ophiolite using enhanced Landsat thematic mapper images. Tectonophysics 1988, 151, 387–401. [Google Scholar] [CrossRef]
  36. Rajendran, S.; Nasir, S. ASTER mapping of limestone formations and study of caves, springs and depressions in parts of Sultanate of Oman. Environ. Earth Sci. 2014, 71, 133–146. [Google Scholar] [CrossRef]
  37. Bedini, E. Mineral mapping in the Kap Simpson complex, central East Greenland, using HyMap and ASTER remote sensing data. Adv. Space Res. 2011, 47, 60–73. [Google Scholar] [CrossRef]
  38. Zhang, X.; Pazner, M.; Duke, N. Lithologic and mineral information extraction for gold exploration using ASTER data in the south Chocolate Mountains (California). Photogramm. Remote Sens. 2007, 62, 271–282. [Google Scholar] [CrossRef]
  39. Richards, J.A.; Jia, X. Remote Sensing Digital Image Analysis; Springer: Berlin/Heidelberg, Germany, 2006. [Google Scholar]
  40. Jia, X.; Richards, A. Efficient maximum likelihood classification for imaging spectrometer data sets. IEEE Trans. Geosci. Remote Sens. 1994, 32, 274–281. [Google Scholar]
  41. El Janati, M.; Soulaimani, A.; Admou, H.; Youbi, N.; Hafid, A.; Hefferan, K.P. Application of ASTER remote sensing data to geological mapping of basement domains in arid regions: A case study from the central Anti-Atlas, Iguerda inlier, Morocco. Arab. J. Geosci. 2014, 7, 2407–2422. [Google Scholar] [CrossRef]
  42. Yuhas, R.H.; Goetz, A.F.H.; Boardman, J.W. Discrimination among semi-arid landscape endmembers using the spectral angle mapper (SAM) algorithm. JPL Publ. 1992, 4, 147–149. [Google Scholar]
  43. Kruse, F.A.; Lefkoff, A.B.; Boardman, J.B.; Heidebreicht, K.B.; Shapiro, A.T.; Barloon, P.J. The spectral image processing system (SIPS)—Interactive visualization and analysis of imaging spectrometer data. Remote Sens. Environ. 1993, 44, 145–163. [Google Scholar] [CrossRef]
  44. Xu, Z.; Zhao, H. A new spectral unmixing algorithm based on spectral information divergence. Proc. SPIE 2008, 7127, 712–726. [Google Scholar]
  45. Fukunaga, K. Introduction to Statistical Pattern Recognition, 2nd ed.; Academic Press: New York, NY, USA, 1990. [Google Scholar]
  46. Jensen, J.R. Introductory Digital Image Processing: A Remote Sensing Perspective, 2nd ed.; Prentice Hall Series in Geographic Information Science; Prentice Hall: Upper Saddle River, NJ, USA, 1996. [Google Scholar]
  47. Bock, M.; Xofis, P.; Mitchley, J.; Rossner, G.; Wissen, M. Object-oriented methods for habitat mapping at multiple scales—Case studies from Northern Germany and Wye Downs, UK. J. Nat. Conserv. 2005, 13, 75–89. [Google Scholar] [CrossRef]
Figure 1. Geology of Nakhl region (Source: Geological map of the Oman Mountains, KSEPL, 1974).
Geosciences 08 00145 g001
Figure 2. Spectral plots. (a) Spectra of carbonate minerals stacked from the USGS Spectral Library for minerals in 0.3 to 2.5 µm (red vertical lines—calcite absorptions, pink ellipses—dolomite absorptions); (b) Spectra of exotic limestone and dolostone rocks measured in 1.3 to 2.5 µm (red vertical lines—exotic limestone absorptions, green vertical lines—dolostones absorptions); (c) Spectra of exotic limestone and dolostone rocks resampled to SWIR spectral bands of ASTER in 1.3 to 2.5 µm (black dashed line—carbonate absorption in ASTER band 8).
Geosciences 08 00145 g002
Figure 3. Decorrelated images of (a) the spectral bands 8, 3 and 1 of ASTER and (b) the 7, 4 and 2 of Landsat ETM+ show the occurrences of exotic limestone and other formations of the Nakhl region.
Geosciences 08 00145 g003
Figure 4. Images of (a) Maximum Likelihood Classification; (b) Spectral Angle Mapper and (c) Spectral Information Divergence show the occurrence and spatial distribution of lithological classes of the Nakhl region.
Geosciences 08 00145 g004aGeosciences 08 00145 g004b
Figure 5. Field photographs. (a) Exotic limestones of shallow marine facies; (b) Peridotite and Gabbro; (c) Massive grey exotic limestone; (d) Fossil shell fragments; Photomicrographs (crossed polarized) of (e) Fossils; (f) Corallines in the exotic limestones of shallow marine facies.
Geosciences 08 00145 g005
Figure 6. XRD analysis shows the presence of calcite minerals in the exotic limestones of Nakhl region.
Geosciences 08 00145 g006
Table 1. Sensor characters of Landsat 7 (ETM+) and ASTER instruments.
Sensor CharactersLandsat 7 (ETM+)VNIRASTER SWIRTIR
Spectral bands with range (µm)Band1 0.45–0.52Band 01 0.52–0.60
Nadir looking
Band 04 1.6–1.7Band 10 8.125–8.475
Band2 0.52–0.60Band 02 0.63–0.69
Nadir looking
Band 05 2.145–2.185Band 11 8.475–8.825
Band3 0.63–0.69Band 03N 0.76–0.86
Nadir looking
Band 06 2.185–2.225Band 12 8.925–9.275
Band4 0.77–0.90Band 03B 0.76–0.86
Backward looking
Band 07 2.235–2.285Band 13 10.25–10.95
Band5 1.55–1.75 Band 08 2.295–2.365Band 14 10.95–11.65
Band6 10.40-12.50 * Band 09 2.36–2.43
Band7 2.09–2.35
Band8 0.52-0.90 **
Spatial Resolution (m)30153090
Swath width (km)180606060
Radiometric Resolution (bits)88812
Cross Track Pointing ±318 km (±24 deg)±116 km (±8.55 deg)±116 km (±8.55 deg)
* Band 6 is acquired at 60 m spatial resolution but the product is resampled to 30 m; ** Spatial resolution of band 8 is 15 m.
Table 2. Spectral absorption positions of calcite and dolomite minerals [33] and exotic limestones and dolostones in the SWIR region.
Carbonate BandCalcite * Absorption (µm)Exotic Limestones Absorption (µm)Dolomite * Absorption (µm)Dolostones Absorption (µm)
12.530–2.5412.4912.503–2.5182.472
22.333–2.3402.3412.312–2.3222.328
32.254–2.272-2.234–2.248-
42.167–2.1792.1542.150–2.1702.144
51.974–1.9951.9921.971–1.9791.981
61.871–1.8851.8751.853–1.8821.863
71.753–1.8851.7521.735–1.740-
Table 3. Confusion matrix of MLC, SAM and SID algorithms applied to the lithological classes of Nakhl region.
ClassGPHDWGKaSaMaSqExTQVTotalUser’s Accuracy
(a) Confusion matrix of MLC algorithm
Unclassified0.000.000.000.000.000.000.000.000.000.000.000.00
G100.000.000.000.000.000.000.000.000.000.000.007.95 100.00
P0.00100.000.000.000.000.000.000.000.000.000.0012.61100.00
HD0.000.00100.000.000.000.000.000.000.000.180.009.2789.89
WG0.000.000.00100.000.650.000.000.000.002.120.006.6098.40
Ka0.000.000.000.0099.350.000.000.000.000.230.004.33100.00
Sa0.000.000.000.000.00100.000.000.000.000.000.003.26100.00
Ma0.000.000.000.000.000.0098.920.000.000.000.005.10100.00
Sq0.000.000.000.000.000.000.00100.000.000.000.0010.2898.49
Ex0.000.000.000.000.000.001.080.00100.000.000.003.68100.00
TQ0.000.000.000.000.000.000.000.000.0097.460.0029.3799.40
V0.000.000.000.000.000.000.000.000.000.00100.007.56100.00
Total100.00100.00100.00100.00100.00100.00100.00100.00100.00100.00100.00100.00
Producer’s accuracy100.00100.00100.0099.35100.0098.92100.00100.0097.46100.00100.00
Overall accuracy = 99.15%; Kappa coefficient = 0.99
(b) Confusion matrix of SAM algorithm
Unclassified0.000.000.000.000.000.000.000.000.000.002.210.17
G95.282.311.062.110.000.431.890.008.050.000.008.4989.20
P3.3297.690.000.000.000.000.270.001.530.000.0012.6597.37
HD0.170.0064.400.4711.005.115.120.000.000.050.376.9259.71
WG0.000.000.1577.0511.330.000.0013.510.003.960.007.6544.66
Ka0.000.002.876.0959.556.810.272.840.006.550.555.7241.21
Sa0.350.005.133.758.7466.814.8511.0816.090.000.555.2965.15
Ma0.520.0019.000.000.000.8581.130.0011.490.000.006.4265.75
Sq0.000.000.305.628.412.980.0064.590.386.1810.1110.1065.46
Ex0.350.000.150.000.0017.026.472.5762.450.000.003.4693.92
TQ0.000.006.944.920.970.000.005.410.0083.261.2926.7185.74
V0.000.000.000.000.000.000.000.000.000.0084.936.42100.00
Total100.00100.00100.00100.00100.00100.00100.00100.00100.00100.00100.00100.00
Producer’s accuracy95.2897.6977.0559.5566.8181.1364.5962.4583.2664.4084.93
Overall accuracy = 79.71%; Kappa coefficient = 0.76
(c) Confusion matrix of SID algorithm
Unclassified0.000.000.000.000.000.000.000.000.000.000.000.00
G94.061.320.150.000.000.002.160.8112.640.000.008.3189.97
P1.9298.680.000.000.000.000.270.002.300.000.0012.7098.03
HD0.000.0062.140.4710.3612.770.540.140.000.000.186.6758.23
WG0.000.000.0075.4119.740.000.005.810.005.860.007.6834.33
Ka0.000.000.3013.5859.550.000.0010.680.009.501.297.4533.47
Sa0.350.0019.317.495.1871.912.9615.419.960.001.297.0176.67
Ma0.000.008.450.000.002.1386.790.0014.180.000.005.8384.57
Sq0.000.000.301.414.853.830.0062.970.000.189.017.6562.60
Ex3.670.002.410.000.009.367.281.0860.920.000.183.5395.82
TQ0.000.006.941.640.320.000.003.110.0084.460.5526.5685.83
V0.000.000.000.000.000.000.000.000.000.0087.506.61100.00
Total100.00100.00100.00100.00100.00100.00100.00100.00100.00100.00100.00100.00
Producer’s accuracy94.0698.6875.4159.5571.9186.7962.9760.9284.4662.1487.50
Overall accuracy = 80.23%; Kappa coefficient = 0.77
G—Gabbro; HD—Hamrat Duru Group Fm.; Ka—Kahma Fm.; Ma—Mahil Fm.; Ex—Exotic limestone; P—Peridotite; WG—Wasia Group Fm.; Sa—Sahtan Fm.; Sq—Saiq Fm.; TQ—Tertiary-Quaternary deposits; V—Vegetation.

