Article

Determining Earthquake Susceptible Areas Southeast of Yogyakarta, Indonesia—Outcrop Analysis from Structure from Motion (SfM) and Geographic Information System (GIS)

by
Aditya Saputra
1,2,*,
Christopher Gomez
3,
Ioannis Delikostidis
1,
Peyman Zawar-Reza
1,
Danang Sri Hadmoko
4,
Junun Sartohadi
5 and
Muhammad Anggri Setiawan
4
1
Department of Geography, University of Canterbury, Private Bag 4800, Christchurch 8140, New Zealand
2
Geography Faculty, Universitas Muhammadiyah Surakarta 57162, Central Java, Indonesia
3
Research Centre of Volcanic Risk at Sea, Faculty of Maritime Sciences, University of Kobe, Kobe 658-0022, Japan
4
Department of Environmental Geography, Geography Faculty, Universitas Gadjah Mada, Yogyakarta 55281, Indonesia
5
Department of Soil Science, Faculty of Agriculture, Universitas Gadjah Mada, Yogyakarta 55281, Indonesia
*
Author to whom correspondence should be addressed.
Geosciences 2018, 8(4), 132; https://doi.org/10.3390/geosciences8040132
Submission received: 27 February 2018 / Revised: 27 March 2018 / Accepted: 2 April 2018 / Published: 12 April 2018

Abstract

:
Located approximately a hundred kilometres north of Java Subduction Zone, Java Island has a complicated geology and geomorphology. The north zone is dominated by the folded area, the centre is dominated by the active volcanic arc and the south of Java including the study area (Southeast part of Yogyakarta City), is dominated by the uplifted southern mountain. In general, the study area is part of the Bantul’s Graben. In the middle part of study area flows the Opak River, which is often associated with normal faults of Opak Fault. The Opak Fault is such a complex fault system which has a complex local fault which can cause worst local site effect when earthquakes occur. However, the geology map of Yogyakarta is the only data that gives the characteristics of Opak Fault roughly. Thus, the effort to identify unchartered fault system needs to be done. The aims of this study are to conduct the outcrop study, to identify the micro faults and to improve the understanding of faults system to support the earthquake hazard and risk assessment. The integrated method of remote sensing, structure from motion (SfM), geographic information system (GIS) and direct outcrop observation was conducted in the study area. Remote sensing was applied to recognize the outcrop location and to extract the nature lineament feature which can be used as fault indicator. The structure from motion was used to support characterising the outcrop in the field, to identify the fault evidence, and to measure the fault displacement on the outcrops. The direct outcrop observation is very useful to reveal the lithofacies characteristics and to reconstruct the lithostratigraphic correlation among the outcrops. Meanwhile, GIS was used to analyse all the data from remote sensing, SfM, and direct outcrop observation. The main findings of this study were as follows: the middle part of study area has the most complicated geologic structure. At least 56 faults evidence with the maximum displacement of 2.39 m was found on the study area. Administratively, the north part of Segoroyoso Village, the middle part of Wonolelo Village, and the middle part of Bawuran village are very unstable and vulnerable to the ground motion amplification due to their faults configuration. The further studies such as geo-electric survey, boreholes survey, and detail geological mapping still need to be conducted in the study area to get better understanding of Opak Fault. Additionally, the carbon testing of charcoal that found in the outcrop and identification of exact location of the ancient eruption source also need to be done.

1. Introduction

Java is one of the Indonesian islands that located above the Benioff zone of subduction plate between Indo-Australian and Eurasian Plates. The island extends from the east to the west approximately located a hundred kilometre from the subduction zone. As a result, Java Island has the highest density of active volcanoes in the world [1] and large numbers of earthquake occurrences. Java Island has several major inland faults which were responsible for the shallow earthquake occurrences. One of the big earthquake was the Yogyakarta earthquake 27 May 2006. The epicentre was located in the Opak Fault 30 km southeast part of Yogyakarta City. This earthquake caused severe damage in some parts of Yogyakarta Province including the study area (Figure 1) which is located 30 km southeast part of Yogyakarta City.
The study area (Pleret Sub-District) is greatly affected by the structural processes in the southern mountain zone of Java and the Quaternary Volcanic belt in the middle zone of Java (Figure 2). The study area is located exactly in the border area between the extensive flat area of grabens (west area) and escarpment area (extreme relief) in the east. In general, the study area has complicated geological structure characteristics (Figure 3). Based on the geology map of Yogyakarta scale 1:100,000, the Opak Fault (SW-NE normal fault) pass through the study area. The others important fault that lies in the southeast part of Yogyakarta City are Bawuran Fault which has the same orientation as the Opak Fault and two major strike-slip faults namely Punthuk-Bawuran-Cinomati and Becucu-Tekek faults. All of the identified faults contribute to the seismic activities in the study area.
The seismicity of Java Island including the study area is greatly affected from the subduction earthquake especially the Java Megathrust segment [2]. This segment has a maximum historical magnitude of 8.1 Mw and b-value of 1.10. Additionally, some of earthquakes in the study area were caused by the local fault such as Opak and Dengkeng Faults. The slip-rate of Opak Fault is 2.4 mm/year with a maximum historical magnitude of 6.80 Mw.
Previous studies have tried to characterise the Opak Faults; however, they have reported different characteristics of the Opak Fault. The first opinion stated that the Opak Fault is an SW–NE normal fault [5]. The west part of the Opak River is moving downward, and the east part of the Opak River is moving upward. The other studies such as research done by Natawidjaja [6] described the Opak Fault as a strike-slip mechanism and another study [7] showed that the Opak Fault has a sinistral fault (fault-lateral) with strike angle about 480° and dip angle of 89°. This conclusion was made after applying the GPS measurements in 1998, 2006 and 2008. The comparison of Opak Fault based on these studies can be shown in Figure 4 below.
Due to the lack of local fault data and poorly understood geological characteristics to support the earthquake hazard assessment in the study area, the fieldwork based on the outcrop study needs to be done in this area. Rock outcrop is the vertical exposure at the surface of a rock formation [8]. Outcrops can provide essential data for geological analysis including past earthquake evidence [9,10,11]. Outcrops also give the general link between surface geological structure and subsurface geological characteristic [12,13,14]. Previously, the outcrop study has been conducted in the active seismic region, the Middle Durance Fault Zone, southeastern France by [12]. They successfully reconstructed the Middle Durance Fault and concluded that Durance is a segmented faulting system in sedimentary layers. Furthermore, they found that Middle Durance Fault zone is a transfer fault which affect the deformation of the South-East Basin through fold geometry modification.
The outcrop study requires a large amount and variety of field observations using equipment such as total station, differential GPS (dGPS), cameras for digital photogrammetry, light detection and ranging (LIDAR), and Terrestrial Laser Scanning (TLS). Table 1 provides the comparison of several types of equipment used in the outcrop studies. Total station surveying and TLS are the most commonly used methods to conduct the outcrop study [15]. However, Total station and TLS equipment are costly. The other technique that can be used to support the outcrop study is close range photogrammetry or structure from motion (SfM) which refers to the low-cost alternative method for generating the 3D model of outcrops [10]. By using photogrammetry technique, this technique is advantageous to reconstruct and visualise the outcrop characteristics [16].
The main objective of this study is to identify the fault and other geological microstructures through the outcrop observation in Pleret Sub-District, 15 km southeast of Yogyakarta City to support the earthquake hazard assessment.

2. Overview of the Study Area

Pleret Sub District is one of the severe damage areas caused by the Yogyakarta earthquake, 27 May 2006. Approximately, 8300 of residential units had been reported collapsed and 579 people died [21]. This intensive damage occurred because most of Pleret Sub District consists of quaternary sediment of Merapi Volcano which can amplify the ground motion [22,23,24]. Additionally, the high density of population in affected areas and lack of well construction design of housing units before 2006 also caused the severe damages in Pleret Sub District [25].
Presently, Pleret Sub District has been developing into densely populated areas in southeast part of Yogyakarta City. Pleret’s population growth rate was 1.59 between 2000 and 2010 and the population reached 46,559 people in 2016 [26]. As the population increased, the demand of housing in Pleret Sub District will also increase. It means that the number of structures at risk will also increase. As the lack of earthquake hazard zonation and building code in the study site, the local resident rebuilds their house without concerning the seismic resistant design and located in more vulnerable area due to the ground amplification and the proximity to the active fault [22,27] (Figure 5).

3. Method

We used the integrated method of remote sensing, fieldwork and GIS analysis in this study. The remote sensing was used to obtain the geological lineament and the lithological boundary, while the fieldwork was conducted to characterise the outcrops deposits and to identify the micro fault, joint, and fracture pattern that found in the outcrop. Finally, all the data from the remote sensing and fieldwork were analysed under the GIS platform. The fieldwork activities were mainly focused on the structure from motion (SfM) procedure. Meanwhile, the remote sensing and GIS were mainly focused on the visual interpretation and the map generation procedure. Both the remote sensing technique and GIS analysis has been well developed in the study area, but SfM technique for outcrop study is rarely applied in Indonesia especially in the study area. Some outcrop studies have been conducted overseas by applying SfM, for instance, [9,10,15,16,18,19,20].
For the present study, two major rock formations in Pleret Sub District (Semilir Formation and Nglanggran Formation) have been analysed. Both of them are tertiary (late Oligocene-early Miocene/28.5–16.5 millions of years before present (Ma)) rock formation [5,28,29,30]. These rock formations are widely exposed along the western flank of Baturagung Escarpment due to extensive erosion. About 73 outcrops in study site have been recognised and analysed. This study consists of four main steps, i.e., outcrops identification using satellite imagery, lineament interpretation, fieldworks, and analysis. The remote sensing data were used to support the analysis such as Quickbird and Landsat 8. The Quickbird was used to locate the outcrops before the fieldwork step and to support the lineament identification. The Landsat data was used to identify the lineament of geological features. In general term, a lineament is an interpreted line drawn to describe the linear or semi-linear terrain such as ridge, valley, and slopes [31]. Additionally, lineaments are often expressed as scarps, narrow depressions, linear zone of abundant watering, drainage network, peculiar vegetation, landscape and geologic anomalies. Lineament is important aspect in geological study because some lineaments are not only related to surface structures but also related to the structural characteristics of the underlying bedrock. In many cases, lineaments represent the surface expression of faults, fractures, or lithologic discontinuities. Especially, when it is difficult to finds and joints in the field due to the sedimentation covers, erosion, over-growth of vegetation, scale and other factors, remote sensing is a valuable additional tool. Additionally, the geomorphological characteristics also can be used to indicate the existence of important lineament [32]. For instance, the crest of ridges, boundaries of elevated areas, river lines, coastlines, and boundaries of geological formations. The summary of the data used here is shown in Table 2 below.

3.1. Outcrop Identification, Geological Units and Lineament Interpretation

The Quickbird satellite imagery was used to locate the outcrops in the study area. The Quickbird resolution is 61 cm for the panchromatic sensor and 2.44 m for the multispectral sensor at the nadir. This remote sensing image brings one band (black and white: 405–1053 nm) of the panchromatic sensor and four bands (blue: 430–545 nm; green: 466–620 nm; red: 590–710 nm; near-infrared: 715–918 nm) of the multispectral sensor. The RGB colour composite of 123 or natural colour composite was used to identify the location of the outcrops. Most of the outcrops are the member of the Semilir Formation which consisting of interbedded tuff breccia, pumice breccia, dacite tuff, andesite tuff, and tuffaceous claystone. In general, the Semilir Formation rock has a white or grey colour. Thus, when the rock of Semilir Formation is exposed on the surface, it will give striking white and grey colour in Quickbird image. The association concept was also used to locate the outcrop because the Semilir outcrops in the study area are highly correlated with the location of breccia pumice traditional mining.
A series of interpretation elements such as colour or tone, texture, pattern, and association were used to determine the geological units and lineament. The geology map of Yogyakarta 1:100,000 and the topographic map with 12.5 m of contour interval were used as the reference in the interpretation process. The Landsat 8 with the RGB composite of 567 (equal with RGB 457 in Landsat 7 ETM+) was used to distinguish the surface geological units. The RGB 567 is the best composite and efficiently composite to display the major lithological units including lineament at the regional scale [33,34,35,36]. Similar to the Landsat 7 ETM+, band 5 (near-infrared: 0.851–0.879 µm) is a useful tool for displaying water or land surface because most of the radiation in this wavelength range is absorbed by water. Band 6 (first shortwave infrared: 1.566–1.651 µm) is very suitable to monitor the vegetation due to the sensitivity to the moisture. Band 7 (second shortwave infrared: 2.107–2.294 µm) is good for the soil and geological interpretation.
The lineament identification was undertaken visually based on the geomorphological characteristics, for example, the lineament of valleys, ridges, and river; the sudden shifting of the river, ridges line, scarp face; and straight drainage segments [37,38]. Rivers and other drainage features are the most prominent indicator of underlying fracture zones. Thus, straight river segments are usually interpreted as geological lineament. The other useful method to identify the geological lineament is the vegetation indicator. Geological lineament can also be identified from the pattern of vegetated and less vegetated zone especially in the dry season [38]. The lineament results were used to understand the geological complexity of the study site based on the outcrop study and also the earthquake hazard zonation. The complete workflow of outcrop identification, geological unit, and lineament interpretation is provided in Figure 6 below.

3.2. Fieldwork and Analysis

At least, 73 outcrops of tertiary rock along the western flank of Baturagung Escarpment have been digitally recorded and analysed. The outcrops images have been taken by using a point and shoot digital camera (Fujifilm Finepix S2950, Fujifilm, Tokyo, Japan and Go Pro Hero 5, GoPro Inc, San Mateo, CA, USA). Structure from motion (SfM) method was used to photograph the outcrop surface at the ground level. The outcrops were sequentially photographed by moving the camera step by step (Figure 7). The number of photographs needed to cover one outcrop depends on the size of the outcrop. A large outcrop was divided into 2–5 segments. The segmentation of the outcrop is very useful in the 3D model construction stage. The number of photographs used in the 3D analysis is directly proportional to the 3D processing time. Additionally, the higher quality of the camera resolution is the better quality of output model will be produced [39], however high-quality input needs longer processing times especially in dense point cloud production [16]. SfM method captures the outcrop photographs based on the basic photogrammetry concept of stereoscopic image (50–60% overlapping images). On average, at least 32 stereoscopic images are needed to cover 10 m high and 12 m wide of the outcrop.
The main purpose of the field work was to take a stereoscopic image of all the outcrops. We applied the SfM method using the Agisoft PhotoScan-Pro software (Version 1.1.6 build 2038 (64 bit), Agisoft LLC, St. Petersburg, Russia). This software enables the automated reconstruction of a 3D model based on the stereoscopic images. Moreover, this software is equipped with the georeferencing tool and the error analysis. The 3D reconstruction starts by aligning the stereoscopic images and generating sparse point cloud, dense point cloud, texture, and the surface model. A typical photo-based outcrop studies and 3D reconstruction workflow is summarized in Figure 8 below.
A field identification was also conducted to identify the border between Qmi (Young Merapi Volcano deposits) and Qa (Alluvium). Both of Qmi and Qa are Quartenary deposits, which have similar surface characteristics. The first approach was to locate the boulder location. Qmi is dominated by the fluvial processes. Qmi consists of very well sorted sediment with very fine sediment located on the upper layer and coarse sediment on the lower layer. The existence of rock boulder in the flat area indicates that the particular area is influenced by the colluvial processes from the denudation process. The colluvium is characterised as a badly sorted deposit located near the border areas between flat and hilly areas. The second approach was to check the clay content of both Qmi and Qa. Qmi has less clay content, while the Qa tends to have more clay content as it is the denudation material. The traditional brick maker along the Opak River can be used as the indicator of the clay content level in the soil. The brick maker tends to open their workshop in the particular location which has the best soil with less clay content. The reason is that the brick will often crack during the burning process if there is a lot of clay content in the brick. By locating the location of the brick maker, the Qmi area can be determined.
Two main analyses, fault identification and outcrop description have been conducted in this study. The fault identification and measurement were mostly analysed in the Agisoft PhotoScan-Pro software, while the lithological log of the outcrops was generated by using the Sedlog 3.1 software (version 3.1, South East Asia Research Group, Department of Earth Sciences, Royal Holloway, University of London, London, UK). The sedimentary log of the outcrop is very useful to understand the pattern of outcrop and sedimentary processes of the outcrop. Finally, the identified fault was analysed and reconstructed to obtain the micro fault configuration in the study area. Further, the fault configuration, lineament, geological data and sedimentary log data were used to generate the local geological characteristics and to define the area which is more prone to the earthquake hazard.

4. Results of the Study

4.1. Finding Unchartered Faults

4.1.1. The Improved Geological Map Based on the Interpretation Results

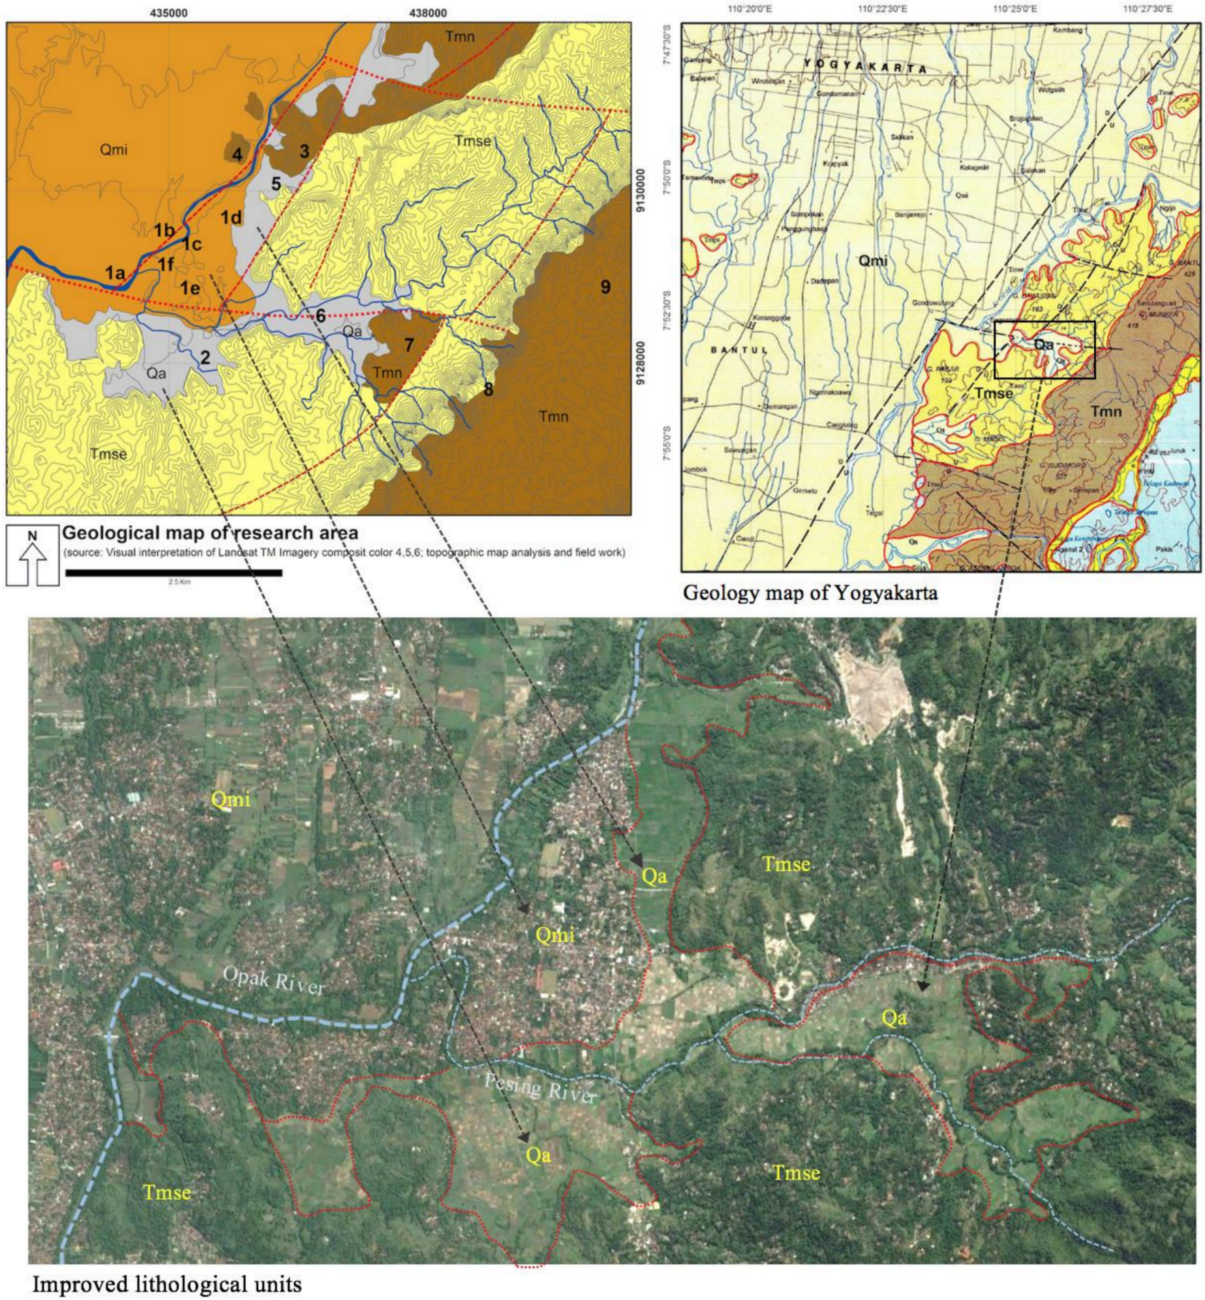
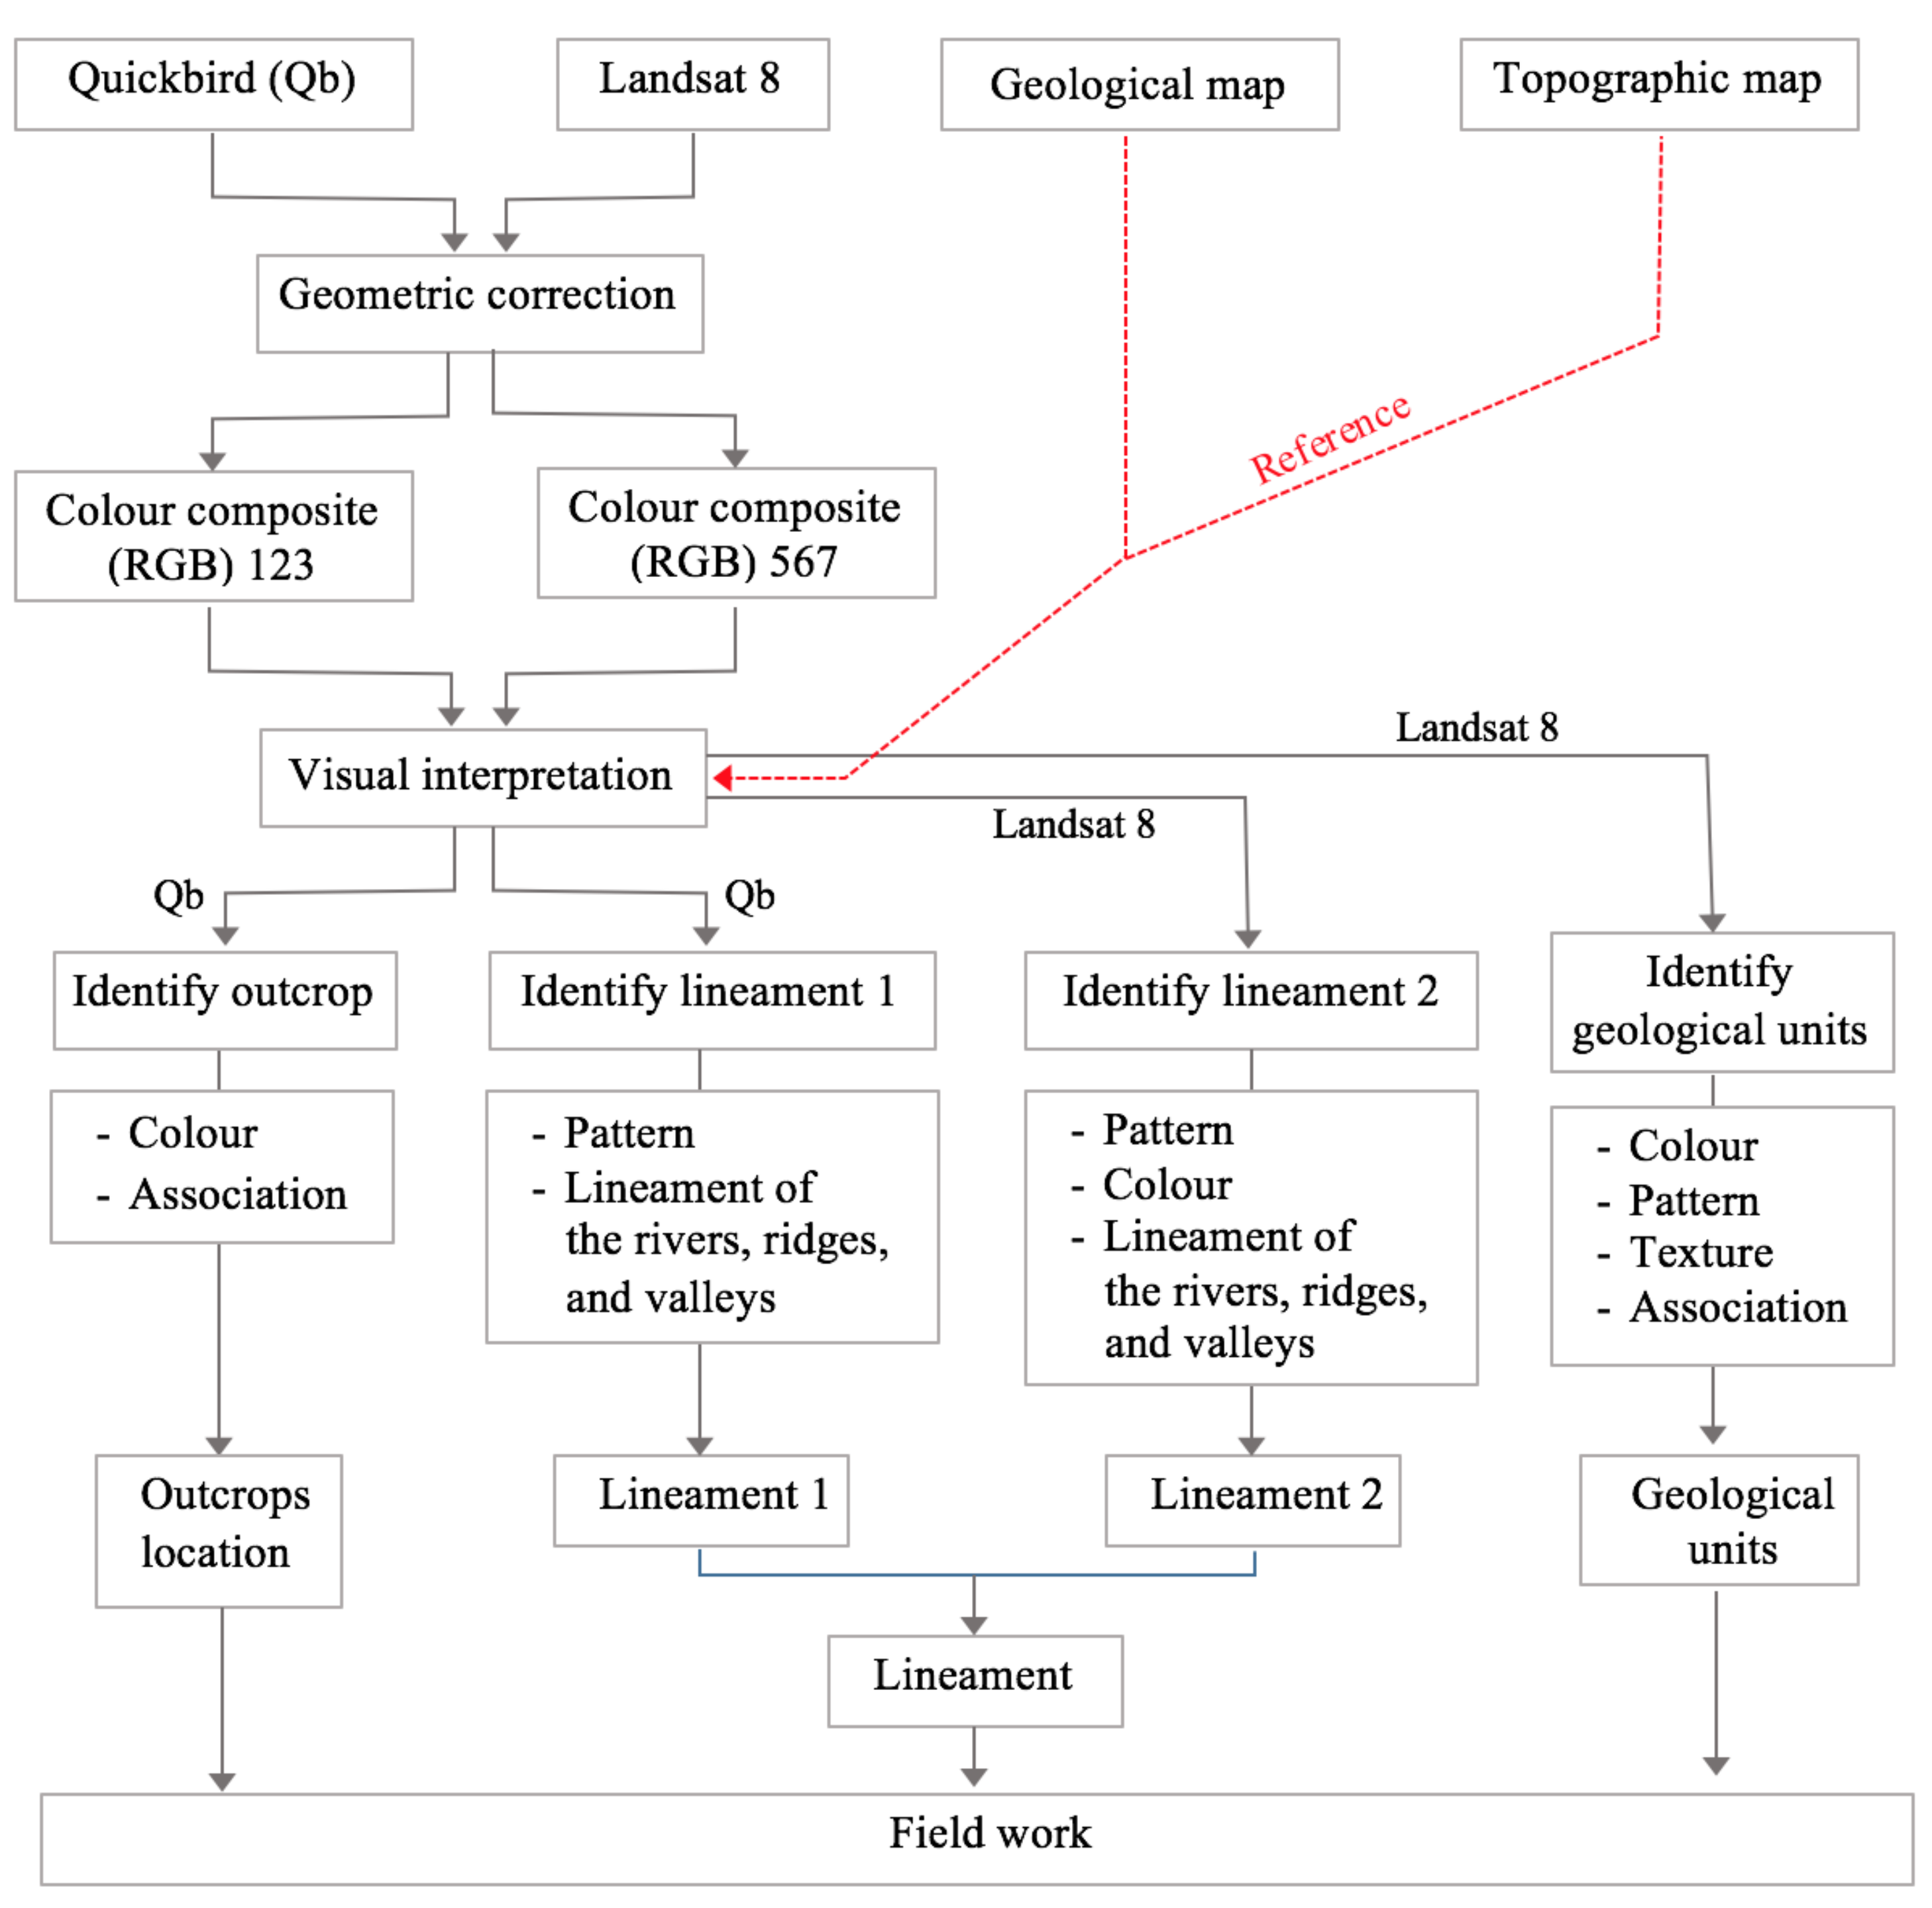
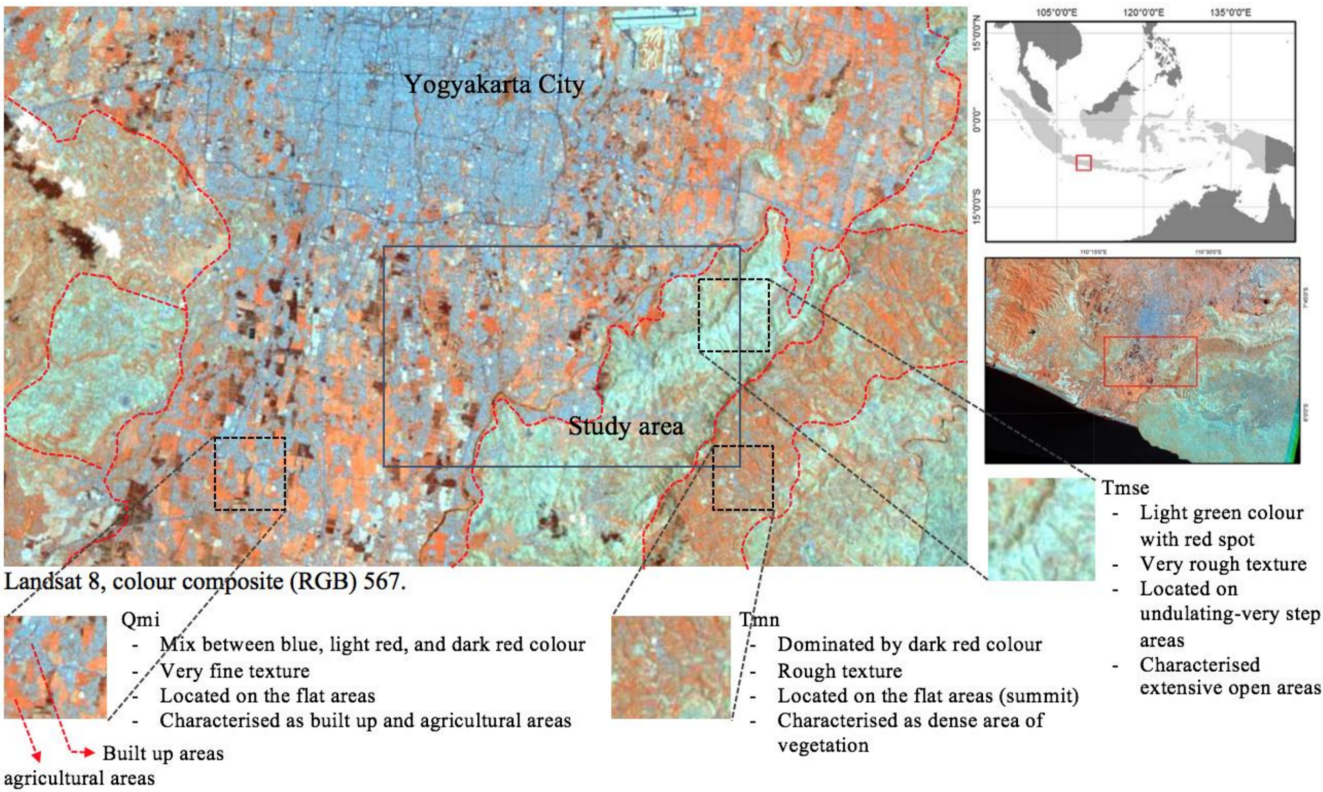
According to the result of visual interpretation using Landsat 8, the research area can be divided into four lithological units including Young Merapi Volcano deposits (Qmi), Alluvium (Qa), Nglanggran Formation (Tmn), and Semilir Formation (Tmse). All lithological units have distinctive colour, relief, and texture. The Qmi consists of undifferentiated tuff, ash, breccia, agglomerate and, lava. This lithology is widely distributed in the fluvial-volcanic plain of Merapi volcano, south part of Merapi Volcano, including the study area. Qmi is characterised as an extensive flat area which has high soil fertility due to the volcanic activity. Additionally, Qmi is also characterised as a dense soil which has abundant of groundwater. Therefore, Qmi is often utilised as residential areas or agricultural areas. Based on Landsat 8 imagery, the Qmi is characterised by blue, light red, and dark red colour (Figure 9). The blue colour represents the built-up areas, light and dark red show the agricultural areas and other vegetation covers. The Qmi unit covers the majority area of the study area. It extends from the middle part near the Opak River to the west area of Bantul’s Grabens. This area extends approximately 1086.68 ha or 45.62% of the study area.
The Qa consists of gravel, sand, silt, and clay along the river. The Qa deposits have the same characteristics as Qmi deposits. It is formed of the denudation materials of the mountainous areas in the east part of the study site. Qa is characterised as narrow flat areas that located on the border area between flat and mountainous area. The main difference with the Qmi deposit is the clay content. Qa tends to have higher clay content rather than Qmi deposits because Qa is formed from the denudation materials which have clay texture. This lithological unit is usually used for residential area or dry agricultural area. Based on the Landsat 8 imagery, Qa has the same appearance as Qmi. It has blue and light red colour and very fine texture. However, due to the spatial distribution, Qa often associated with the narrow flat area located on the border area of the mountainous areas. This area covers only 267.94 ha or 11.25% of the study area.
The Tmn is described as a volcanic breccia, lava flow containing breccia, agglomerate rock, and tuff. Tmn was formed in the middle Miocene as a result of an effusive eruption and deposited on the top of Semilir Formation. The Miocene deposits were buried by the younger deposits such as Qmi and Qa. In study site, Tmn is widespread along the summit of Baturagung Escarpment. From the Landsat satellite image, Tmn has a striking dark red colour with a few of light blue spot. The dark red colour reflects that the area is covered by dense vegetation, while the light blue spot refers to the open areas. Tmn is also characterised by the rough texture in the eastern part, and most of them are located in the flat areas (summit of Baturagung Escarpment) with the highest elevation being 334.70 m above sea level. This lithological unit covers about 82.16 ha or 3.45% of the study area.
The Tmse is a tertiary volcanic deposit which consists of interbedded tuff-breccia, pumice breccia, dacite tuff and andesite tuff. Tmse is the oldest rock formation in the study area. It was formed between late Oligocene until early Miocene. According to Yusliandi’s study, Tmse is a volcanic clastic deposit with the pumice as the main material [40]. The abundance of pumice fragments indicates that Tmse is a co-ignimbrite deposit which was generated by the close explosive eruption [28,29,40]. From Landsat 8 image, Tmse is indicated by the light green colour with a few light blue colour of spot (Figure 9). The light green colour refers to the extensive open areas, while the light blue colour spot refers to the residential areas. Tmse has very rough texture, indicating that extensive erosion occurs especially in the east part of this lithological unit. Tmse is mainly distributed in the middle part of the study site. It is located between undulating and very steep slope areas (40 < slope < 350). The total area of Tmse is about 945.03 ha or about 39.67% of the study area.
Qa and Qmi are robust to differentiate from Landsat 8 because both units have the similar visual characteristic of morphology, colour, texture, and relief. However, the association concept can be used to identify the Qa deposits. As formed from the denudation processes, Qa is mostly accumulated in the foot slope of denudation hills. Thus, Qa is often referred to the narrow flat areas which are located in the border areas between mountainous and flat areas. Additionally, it has bad sortation of materials and high clay content, due to the colluvial processes near the denudation hills.
There are some differences between the geological units described in the geology map of Yogyakarta and visual interpretation results. The geology map of Yogyakarta shows that the border between Tmse and Tmn is located in the foot slope of Baturagung Escarpment near the Guyangan Villages, but we found that the contact lithic between Tmn and Tmse is located on the upper slope of Baturagung Escarpment (outcrop 39, 48, 39 and 50). Moreover, we found some isolated denudation hills of Tmn in the north part of the study area (Figure 10). The other difference is the extent of Qmi area. Based on the visual interpretation and field investigation results, Qmi is spread along the left and the right side of Opak River, while the Qa only occupies the narrow plain near the hilly area of Semilir Formation. Based on the brickmaker location, the Qmi was still found on the east part of Opak river until the Bawuran I Villages (500 m from eastern Opak’s riverbank) (
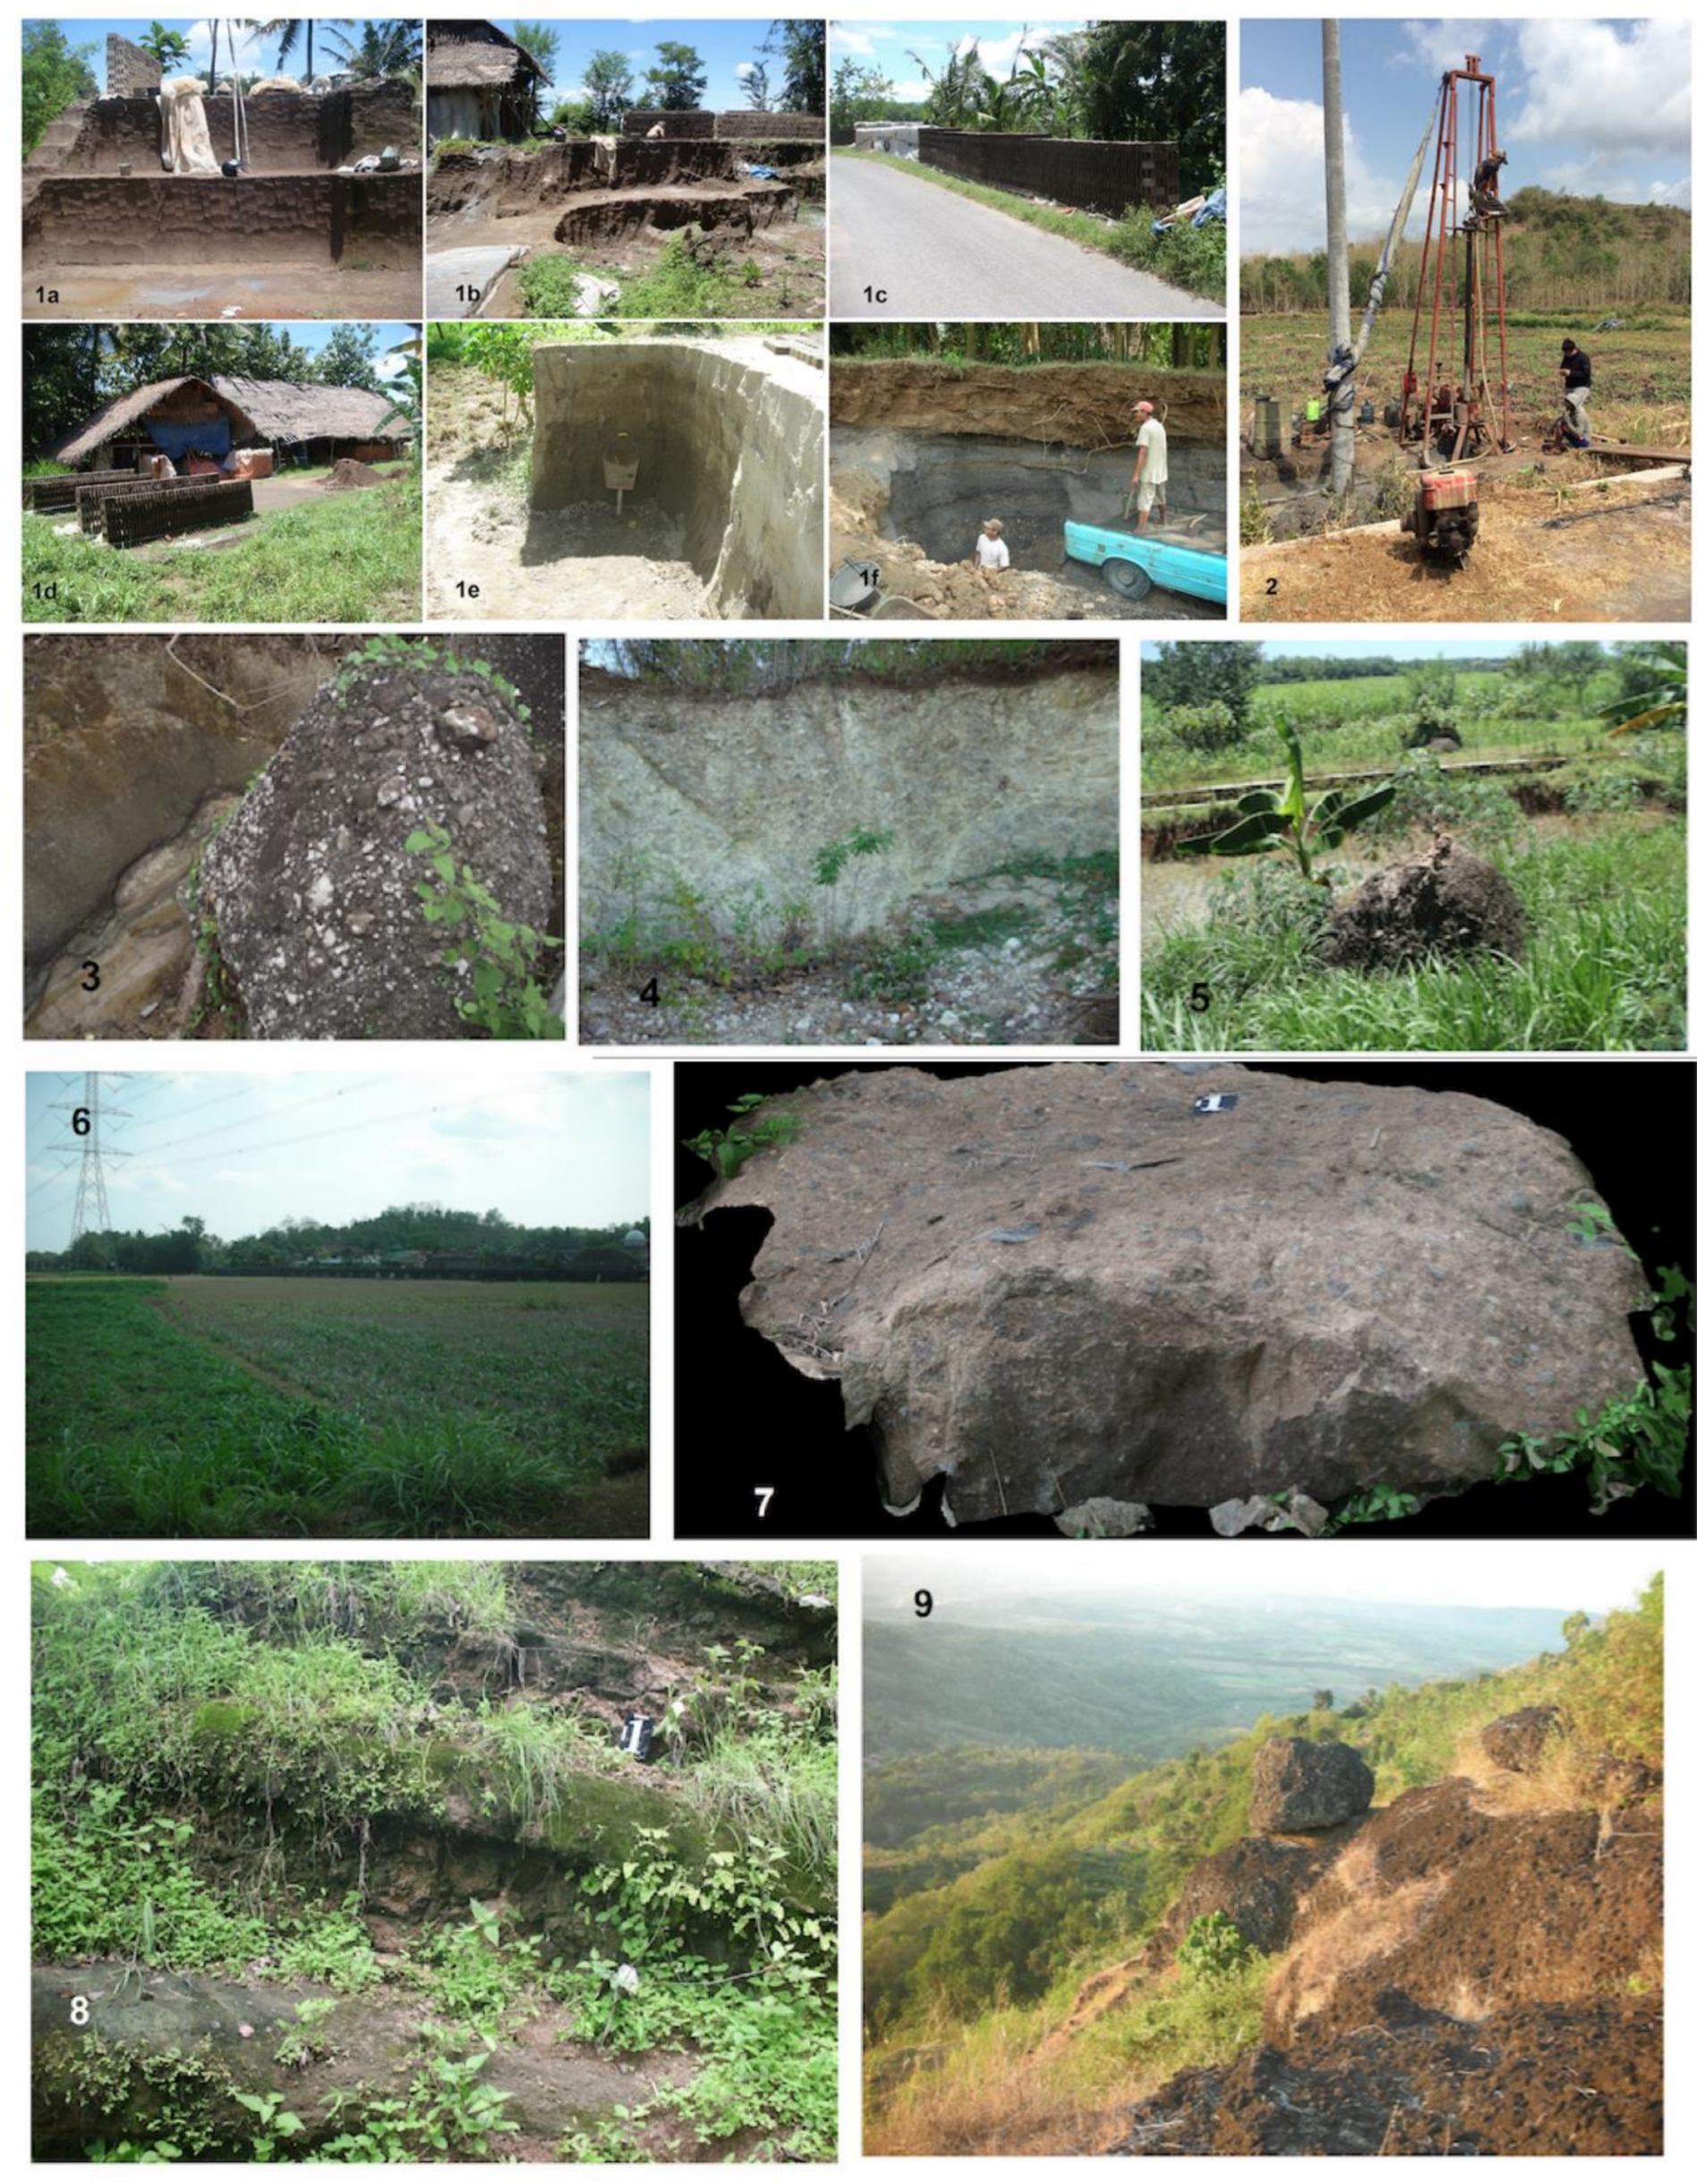
Figure 11). The documentation of lithological check in the field is shown in the Figure 11.

4.1.2. Lineament Interpretation

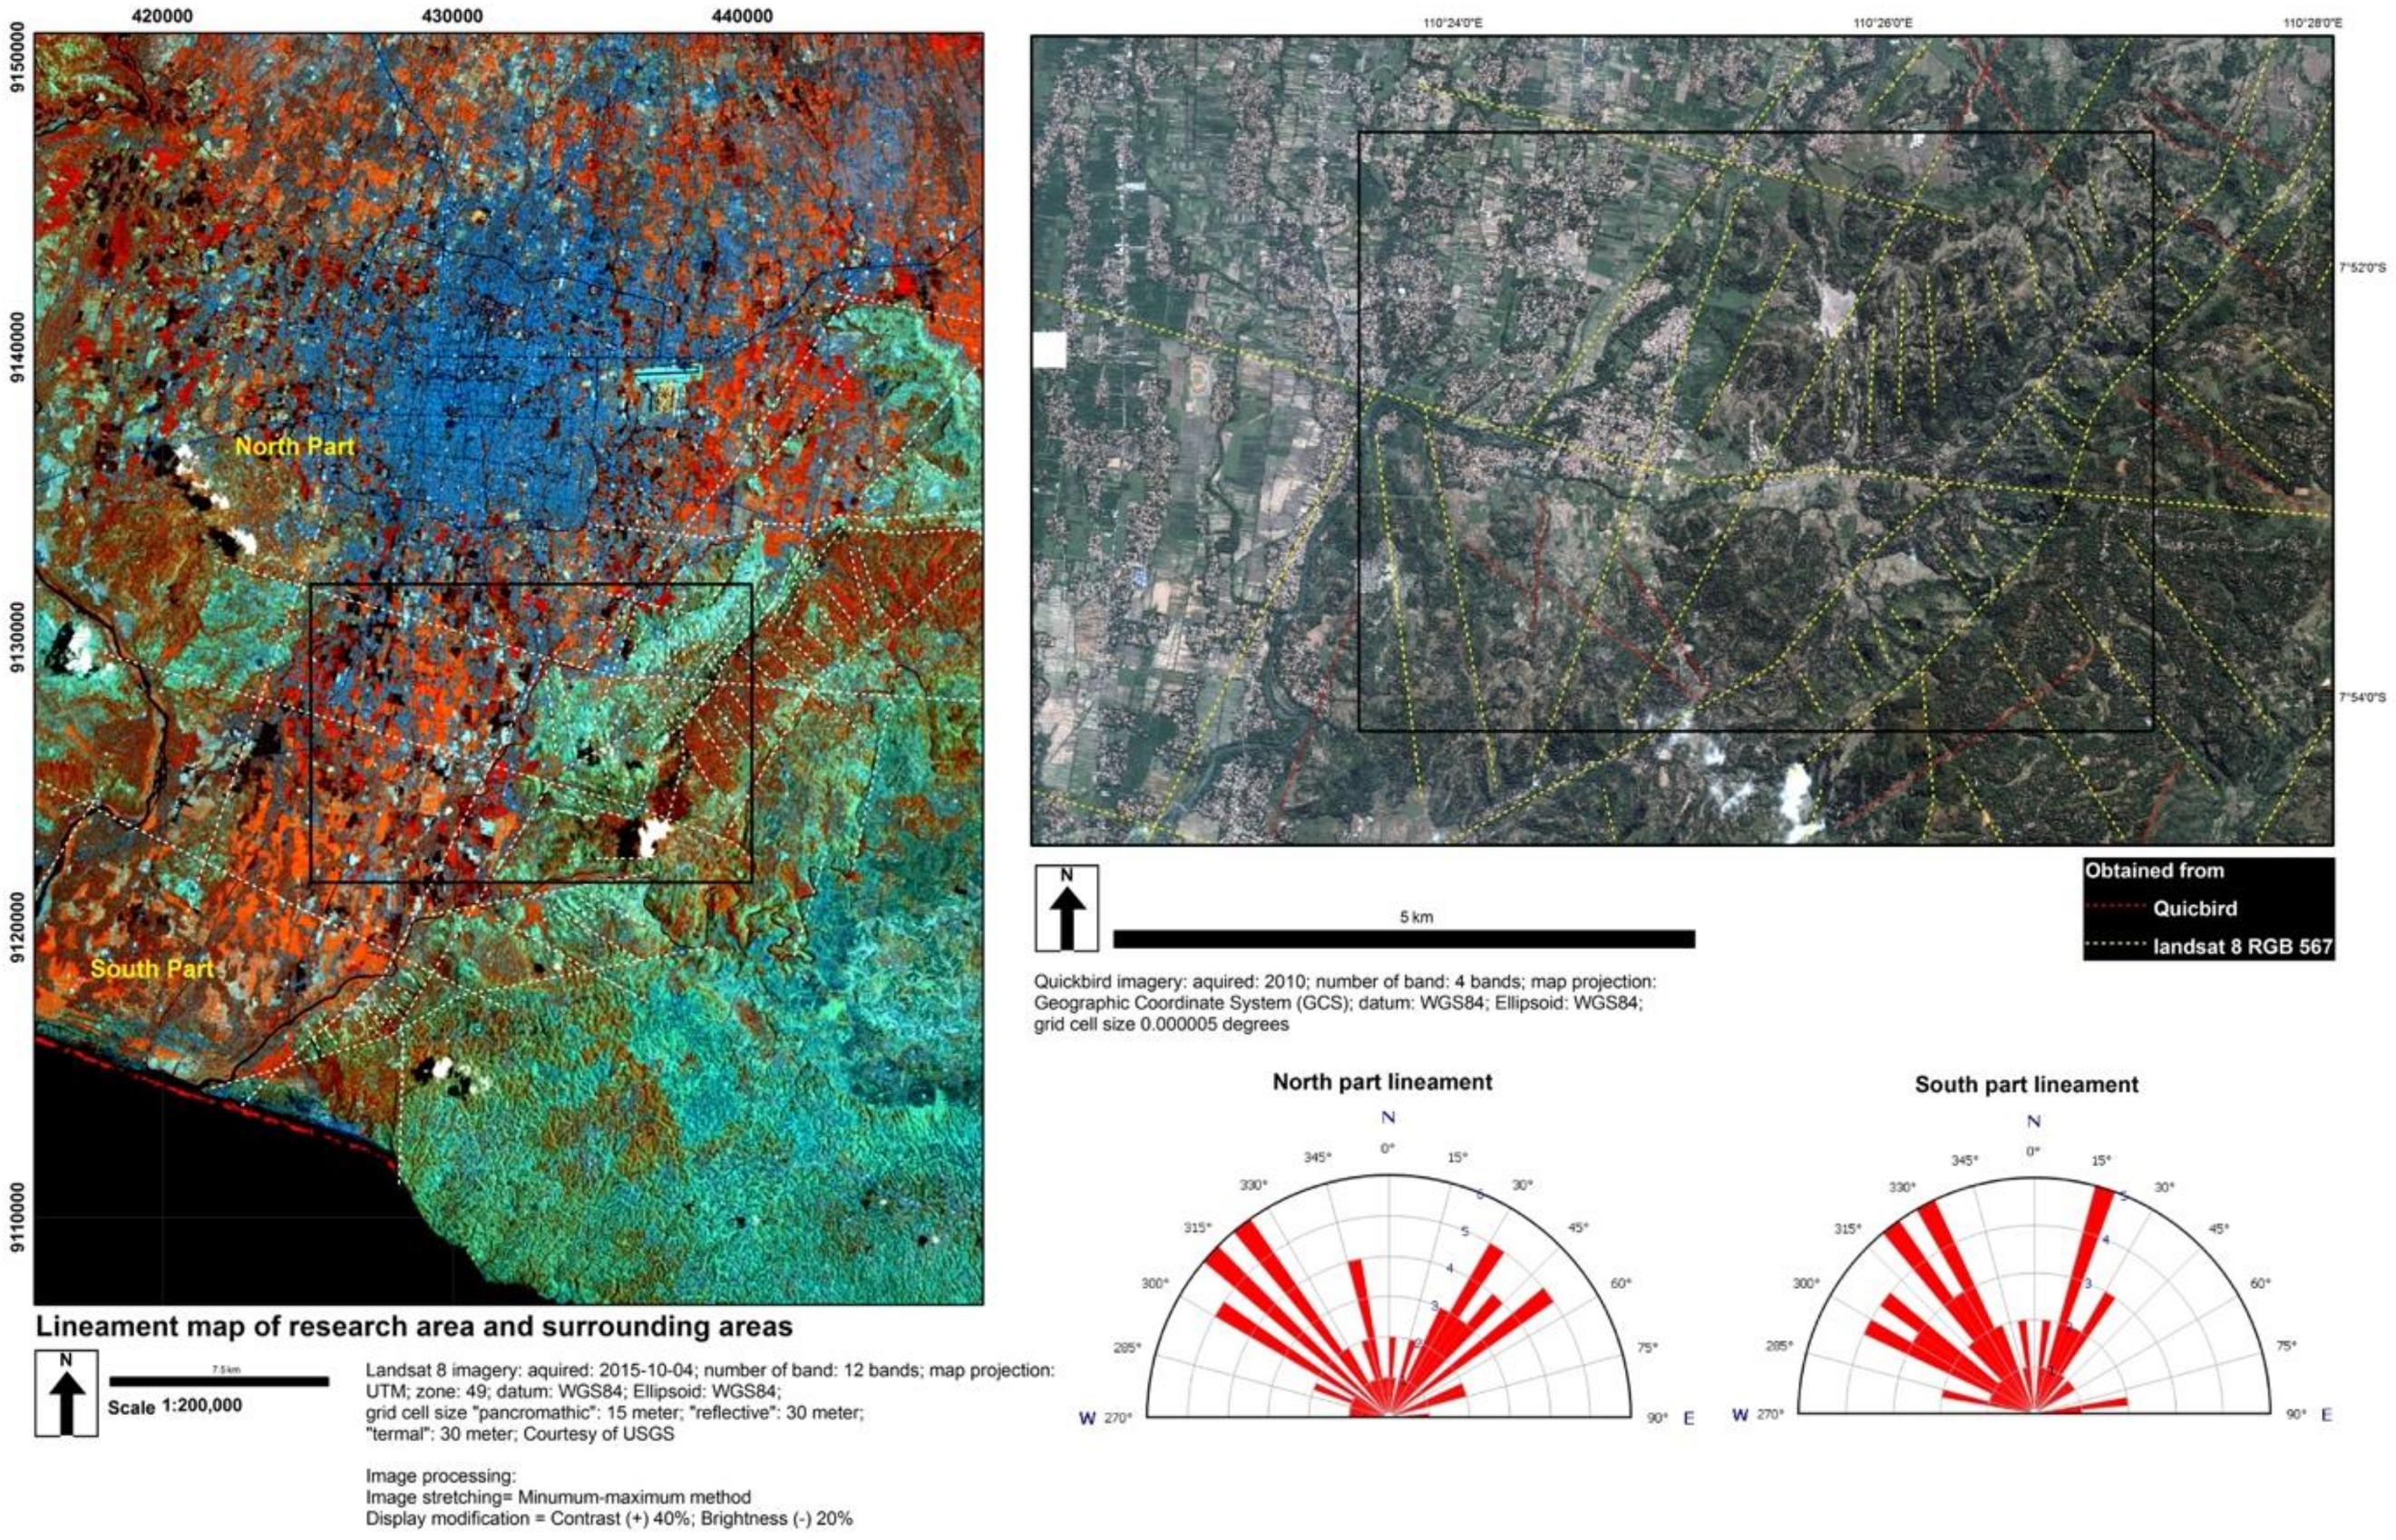
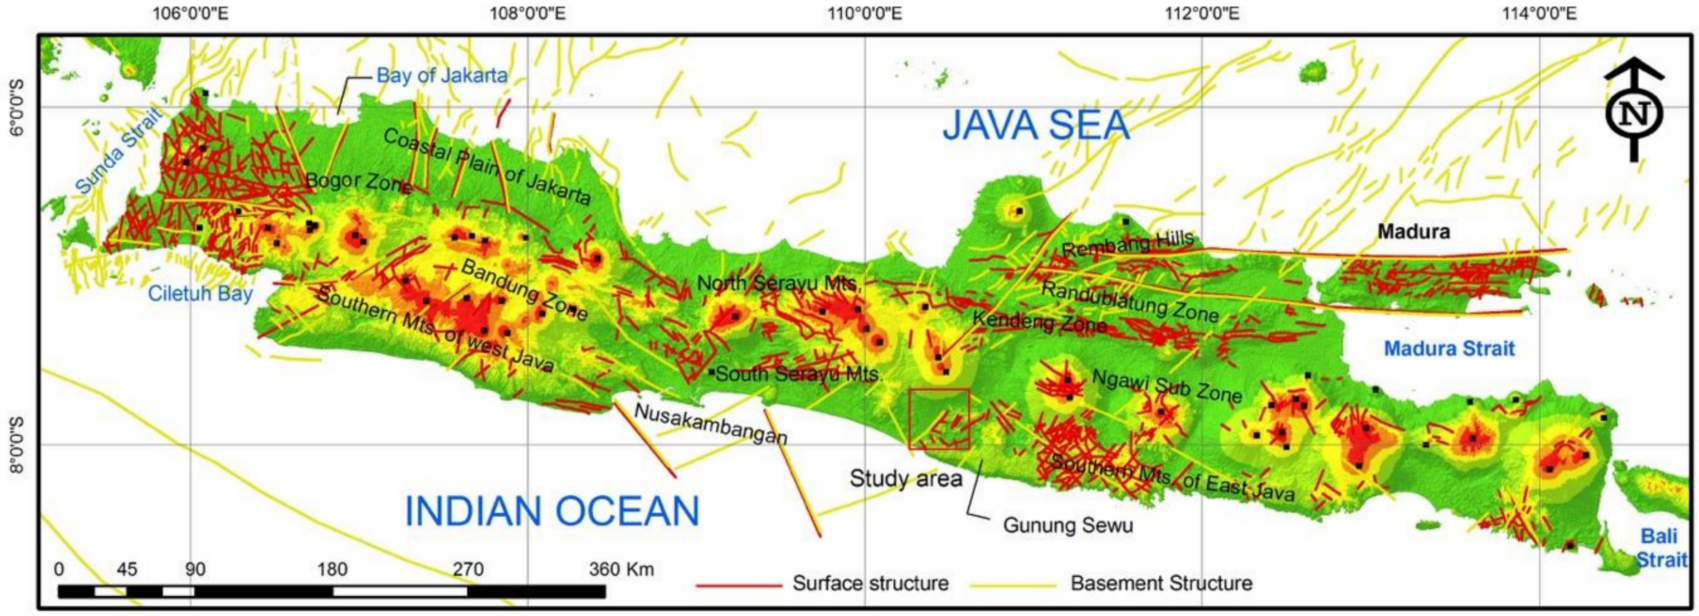
Based on the interpretation of Landsat 8 and Quickbird, some lineament has been detected in the study site. These lineaments are closely related to the geomorphological characteristics. It was noticed that most of the lineaments have similar orientation and pattern to the direction of the fault. Most of them are NW-SE and NE-SW oriented which have the same orientation as the major faults. This fact signifies that the fault controls the erosion of the rock, and also controls the landforms.
The boundaries of the elevated areas in study areas (west and east part of Opak River) indicates an existing of geological lineament. The sudden change of the flat area in the west to the high areas in the east (from 40 to 487.97 m above sea level) indicates the existence of the fault in this area. Based on the geology map of Yogyakarta this lineament is close to the major fault in Yogyakarta city namely, Opak Fault. Additionally, this sudden change of topography can be shown in the Landsat 8 imagery. There is a definite difference of colour characteristic between the flat and undulating areas in the west and the elevated flat area in the east part. This colour characteristic reflects the surface condition (vegetation, land cover, or surface lithology). As discussed in previous section (Section 4.1.1, and Figure 10), the middle part of study site is the border area between three main lithological units and formations: First, the young volcanic deposits of Merapi Volcano (Qmi); second, The Semilir Formation (Tmse); and third, The Nglanggran Formation (Tmn). These boundaries of the lithological unit and geological formations show the semi-linear or linear feature that can be indicated as a geological lineament (
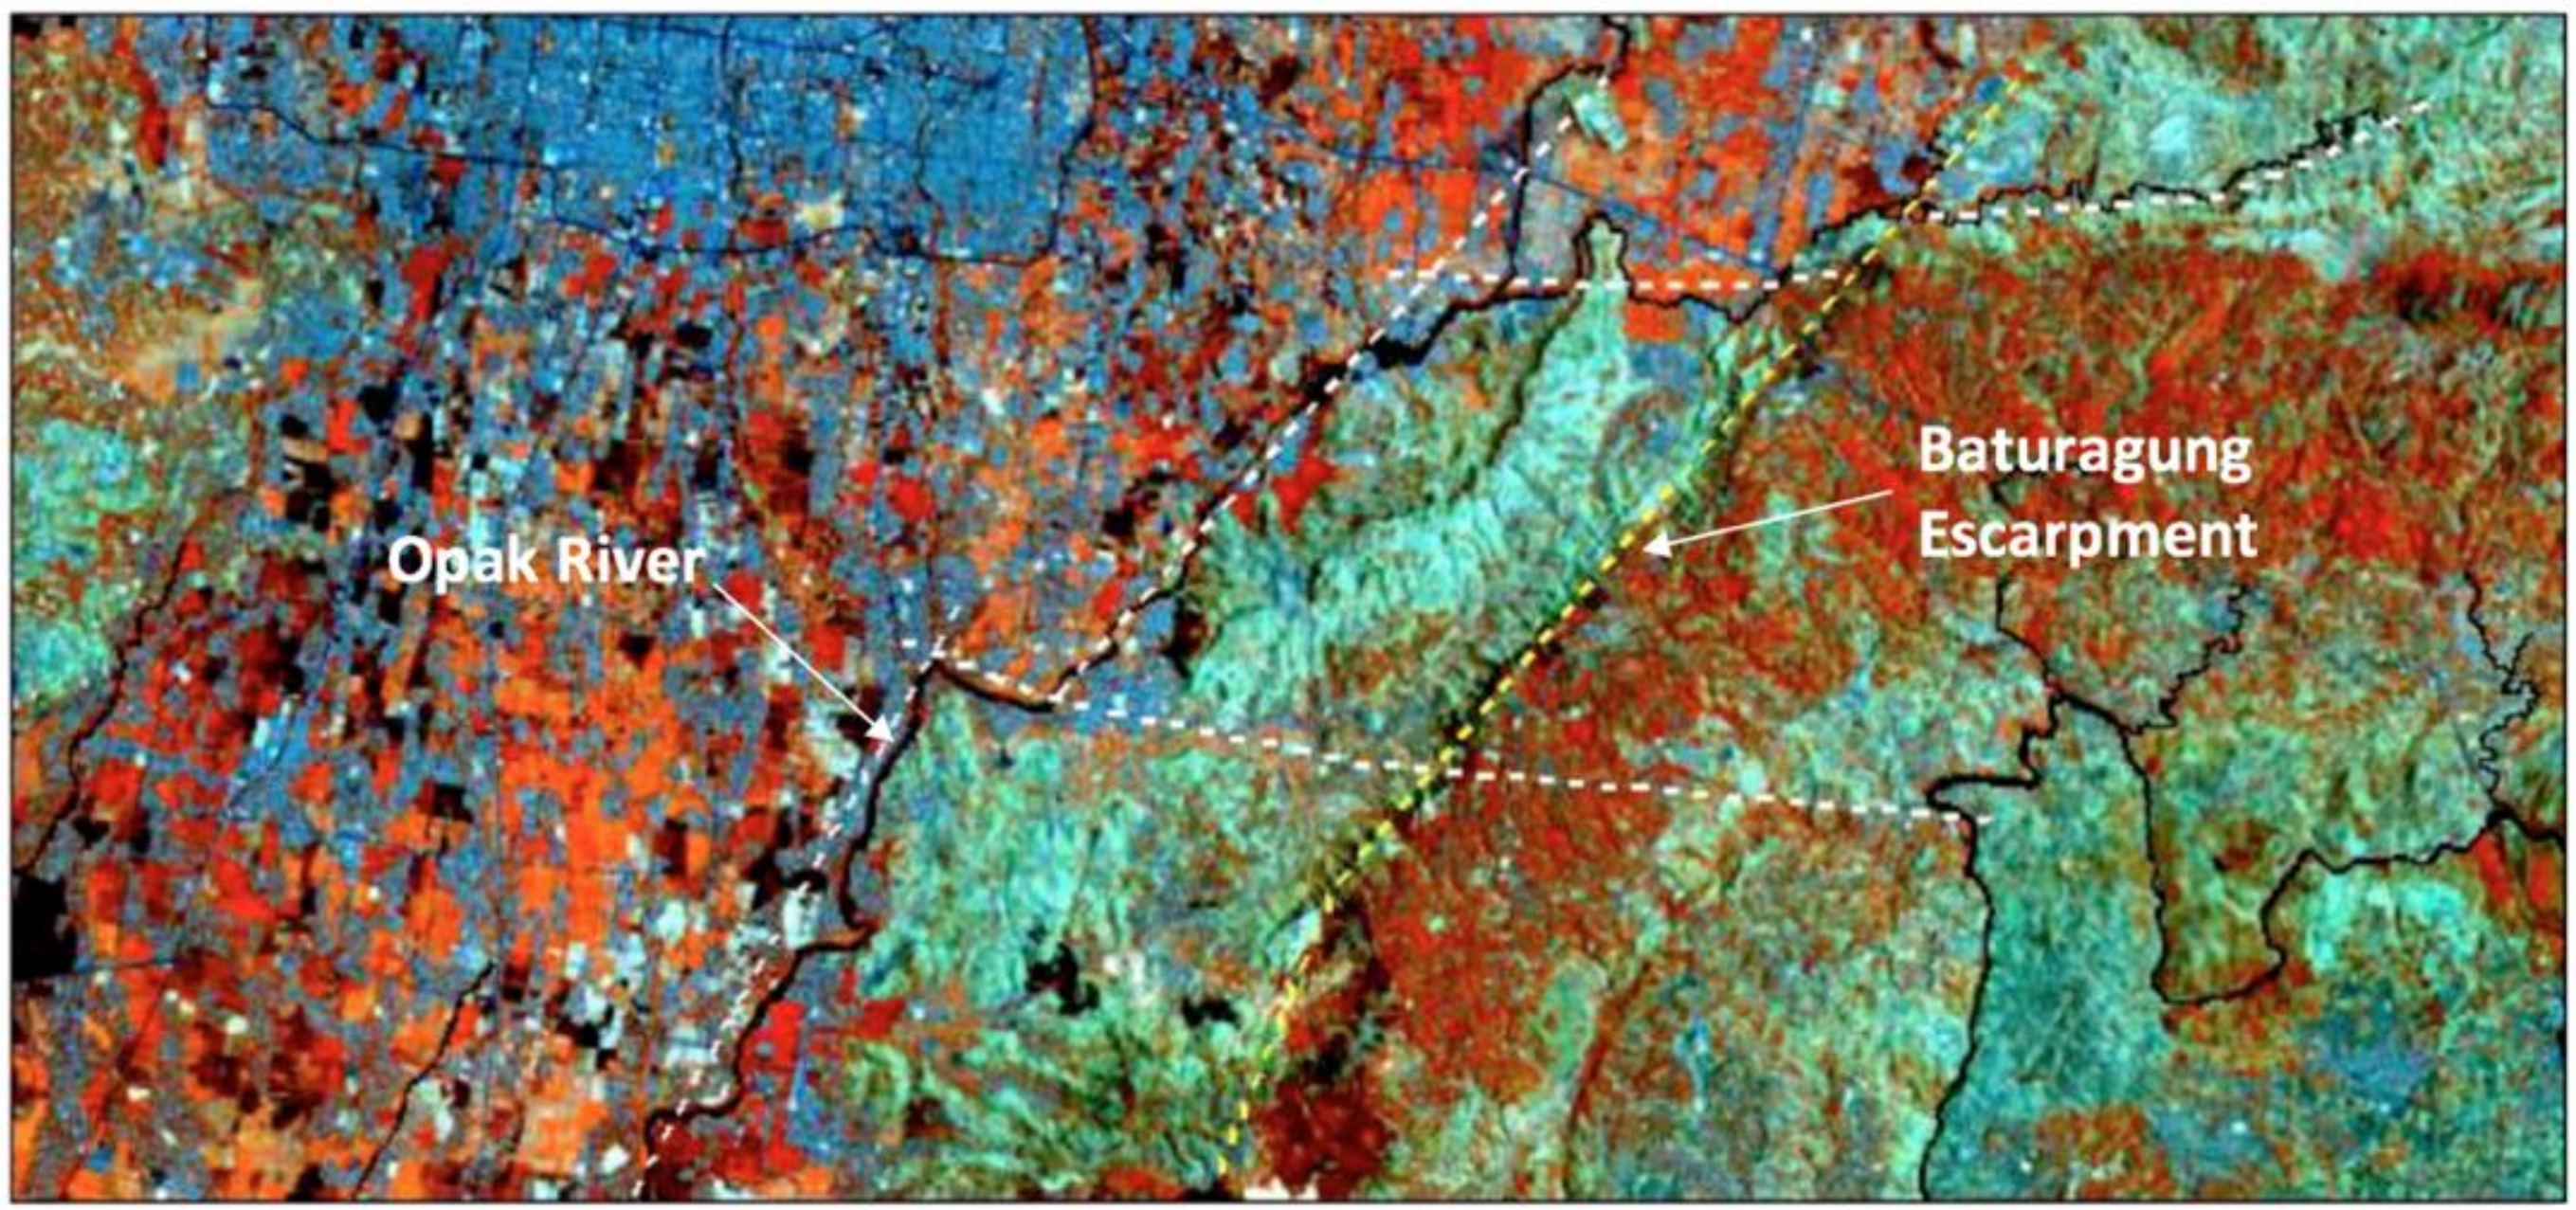
Figure 12).
Based on the Landsat 8 imagery, there are some linear or semi-linear features in the study area. Opak, Oya, and Pesing Rivers have some linear features indicating the geological lineament. The Opak River flows from the north to the south and shows the NE-SW lineament. This river is often associated with the famous Opak Fault in Yogyakarta City. The other lineaments were found in Pesing and Oya Rivers. They have the same orientation (West–East) of lineament. These lineaments are closely related to strike-slip faults (W–E) which trims The Opak Fault in the north and middle of the study area. This phenomenon explains why the Opak River turns westward in some locations (Figure 13).
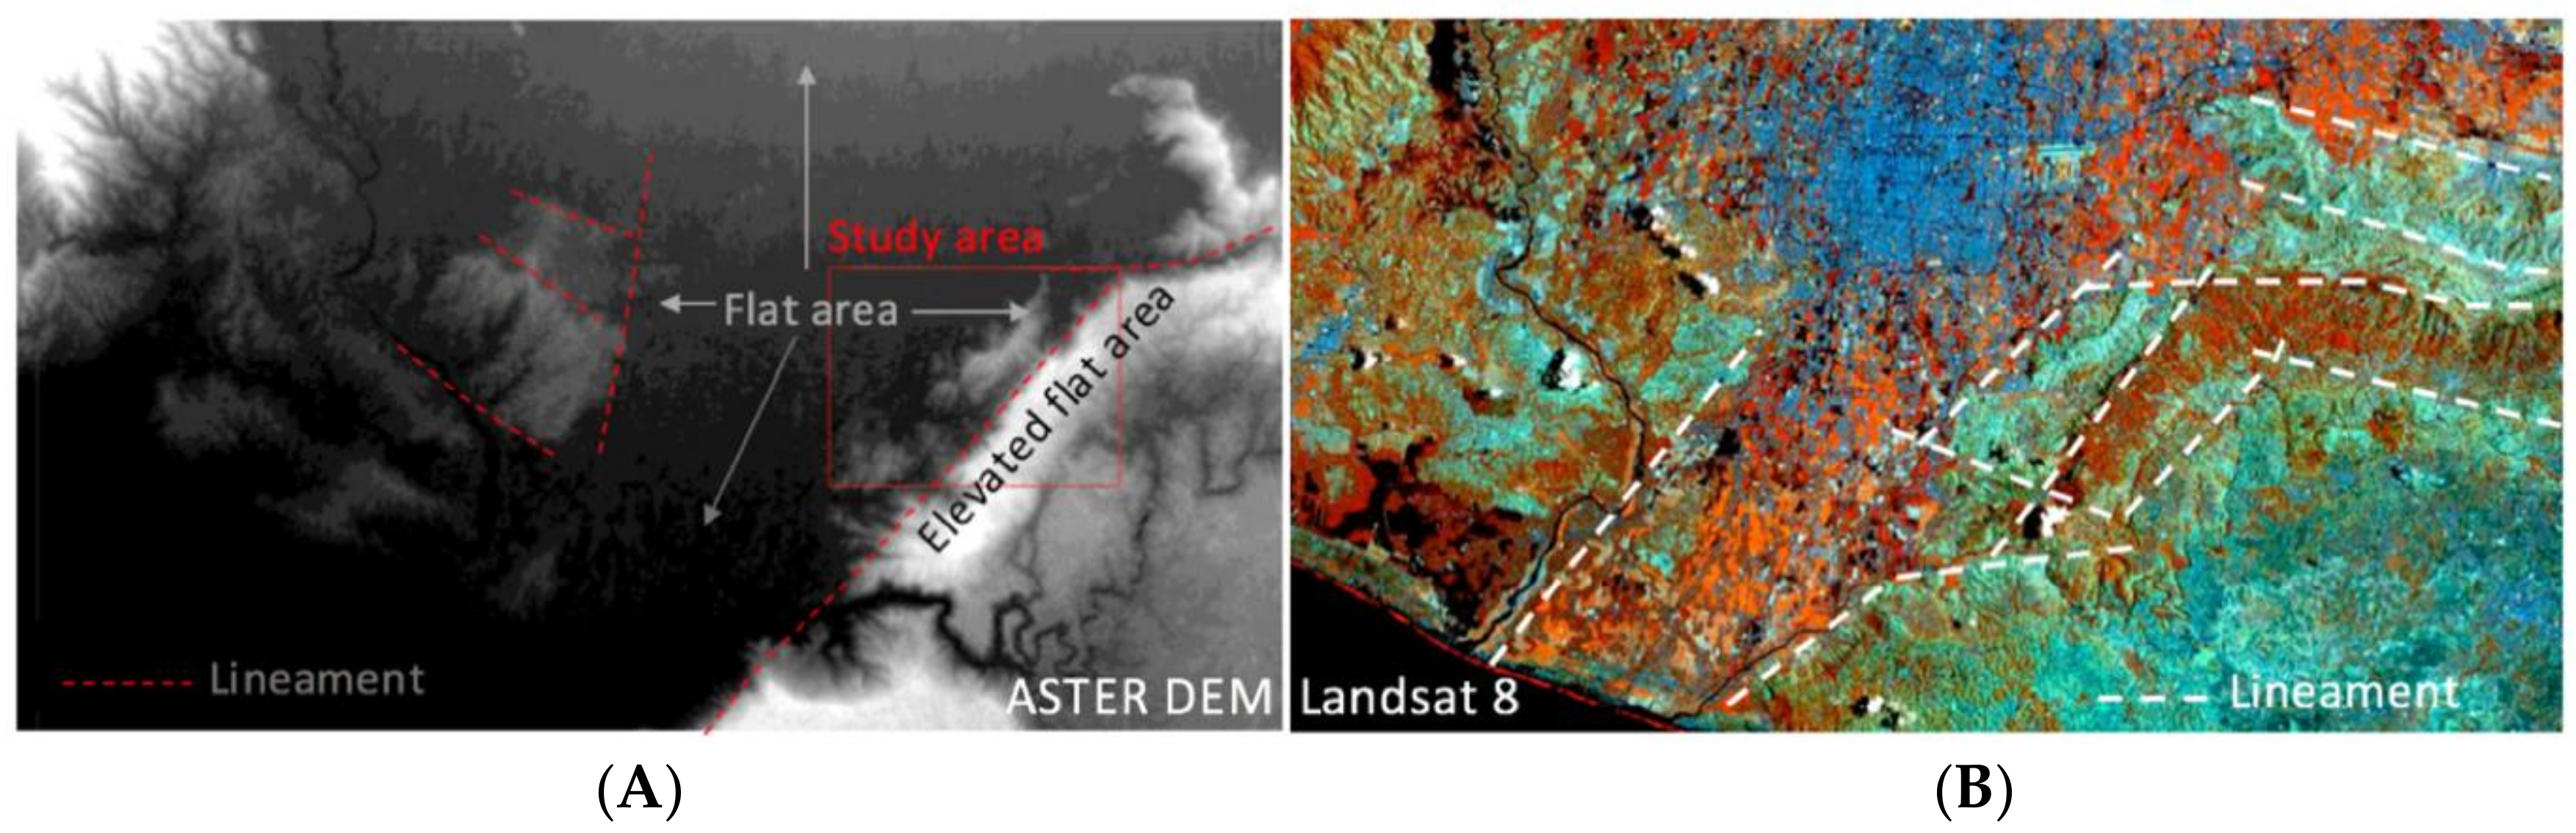
The most prominent lineament in the study site is the lineament of Baturagung Escarpment and Opak River. Both of them have NE-SW orientation. The Baturagung escarpment is a ridge lineament which can be identified from the lineament of boundaries of elevated areas. Based on the advanced spaceborne thermal emission and reflection radiometer (ASTER) DEM (Figure 12A), there is a distinct difference of flat area in the west part and the elevated flat area in the east part of the study area. The flat areas are expressed with the black colour and have very fine texture, while the elevated flat areas are expressed with the white colour with the rough texture on the left and right side areas. From the south (Parangtritis beach) to the north (Berbah Village, near the Yogyakarta International Airport), this lineament has approximately 35 km of total length with NE-SW orientation and continues to Prambanan, Gantiwarno, Wedi Villages in Klaten Regency with E-W orientation. The lineament in this area is closely related to the Dengkeng Fault (E–W orientation) which is located 8 km north part of the study area. The complete lineament of the study area and their orientation is presented in Figure 14 below.
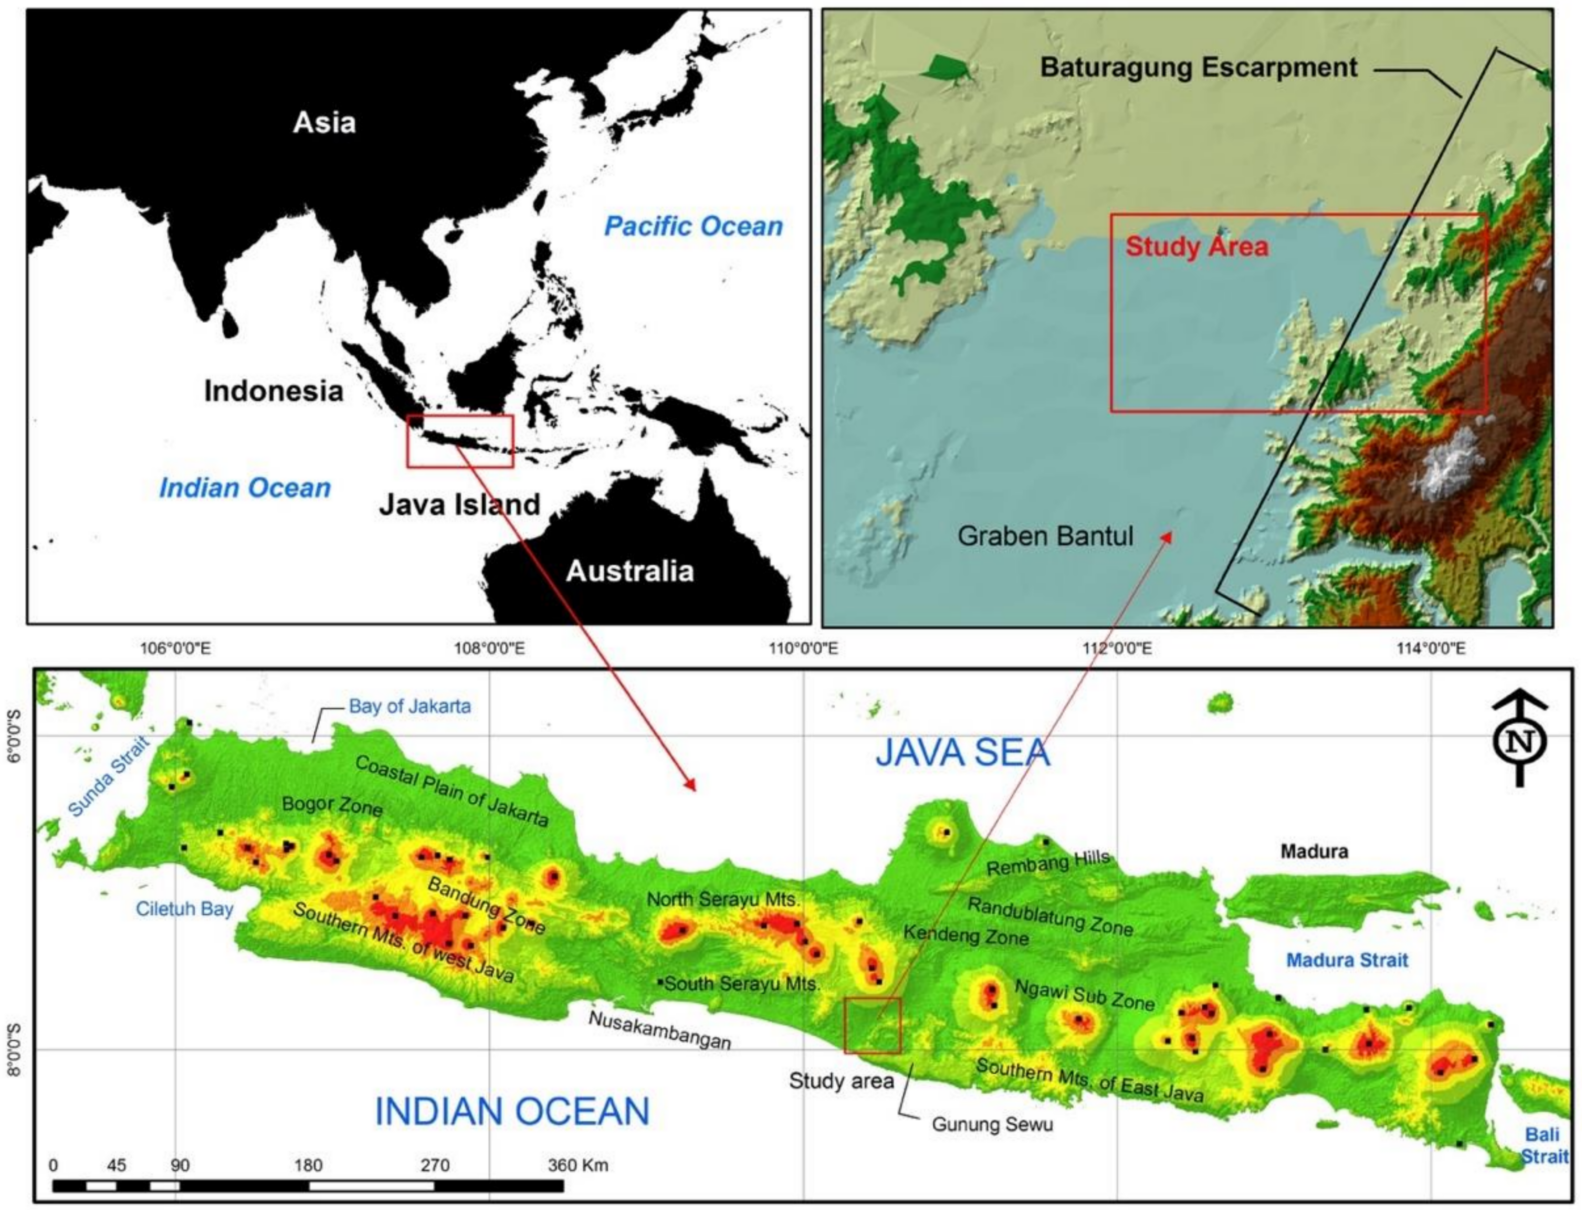
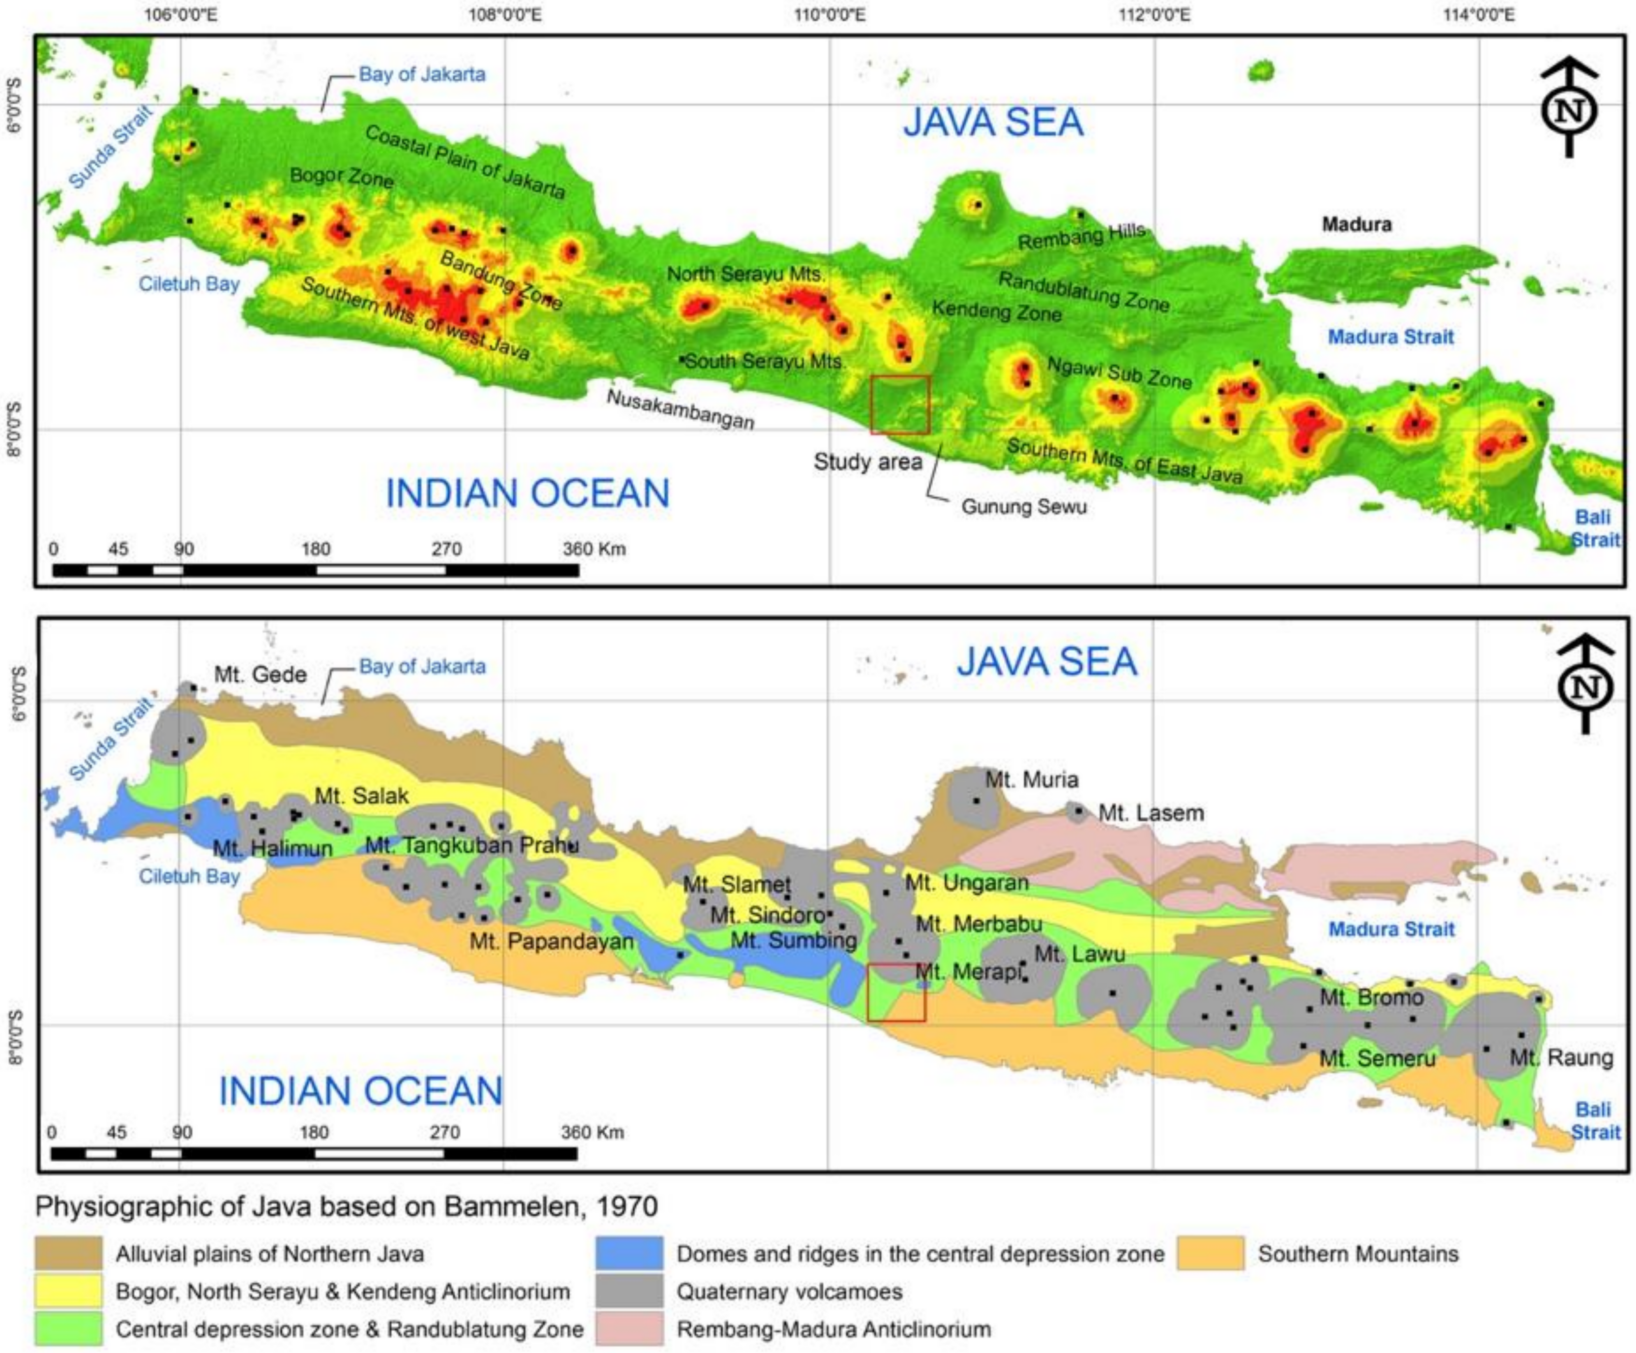
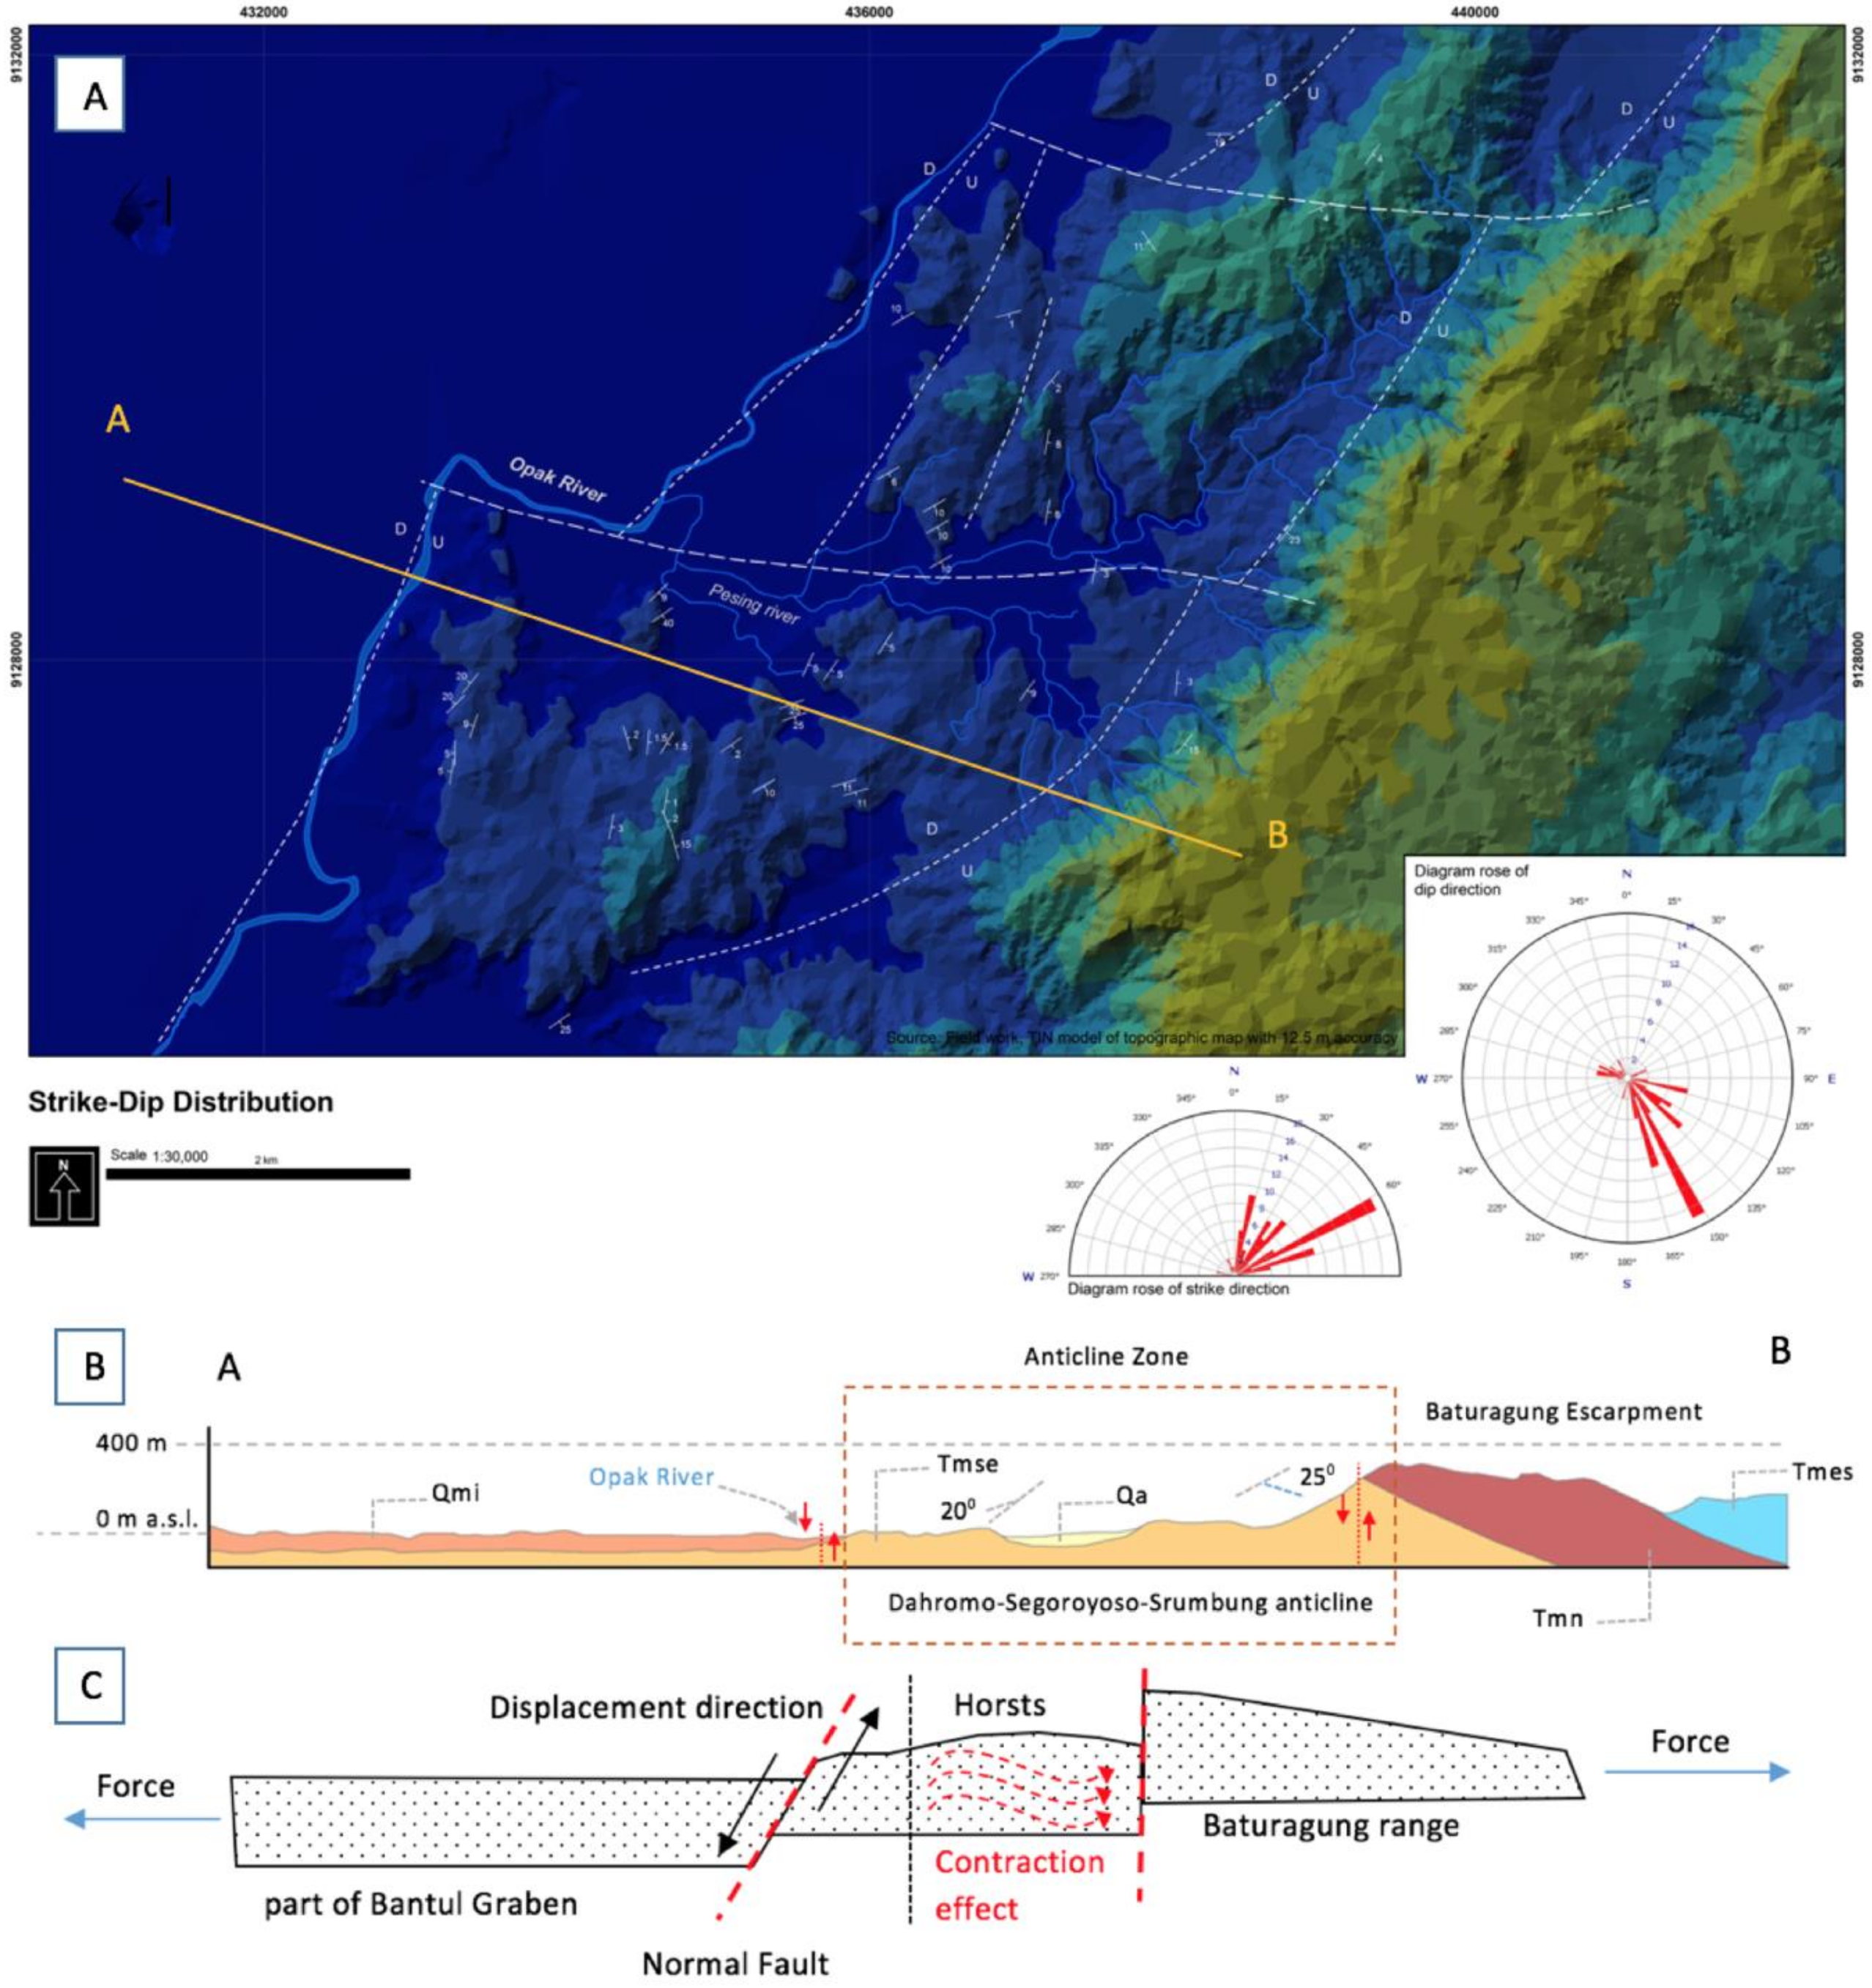
In term of physiographic characteristic, the study area is located in the border area between the central depression zone of Java and Northern part of Southern Mountains [3]. In the study area, the central depression zone consists of young volcanic deposits of Merapi Volcano (Qmi), while the northern part of Southern Mountains consists of Semilir (Tmse) and Nglanggran Formation (Tmn). Geomorphologically, the study area is located in the eastern part of Bantul’s Grabens. This area is characterised as an extensive flat area in the west and suddenly change to an elevated area in the east or known as the Baturagung escarpment which has specific characteristic of morphology. Baturagung has a steep slope on the NW flank and gentle slope on the SW flank. Additionally, Baturagung forms a distinctive morphology of hogback as most of the rocks layer dipping to the southeast (SE) direction (Figure 15A).
The hogback mountain can be identified by the strike and dip direction of each outcrop that mostly located on the west flank of Baturagung Escarpment. Based on the 73 outcrops, the most outcrops are dipping to the SE direction (100°–165°). Additionally, based on the strike and dip characteristic of the several outcrops such as Trimulyo outcrops (outcrop 1a, 1b, 2, 3 and 57) and Banyakan outcrop (outcrop 54), we found a folded hill between the Opak River and Baturagung Escarpment. This folded hill has the opposite rock dipping in NW direction (290°–330°) with the other dip directions of the eastern folded hills. Thus, it indicates that an anticline hill exists between the Opak River and Baturagung Escarpment. The anticline area extends from the south to the north part and has similar direction with the Opak River (SW-NE). Administratively, this anticline area is located in the Dahromo, Segoroyoso, and Srumbung Villages (South part of study area) also Bawuran and north Wonolelo Villages (north part of the study area).
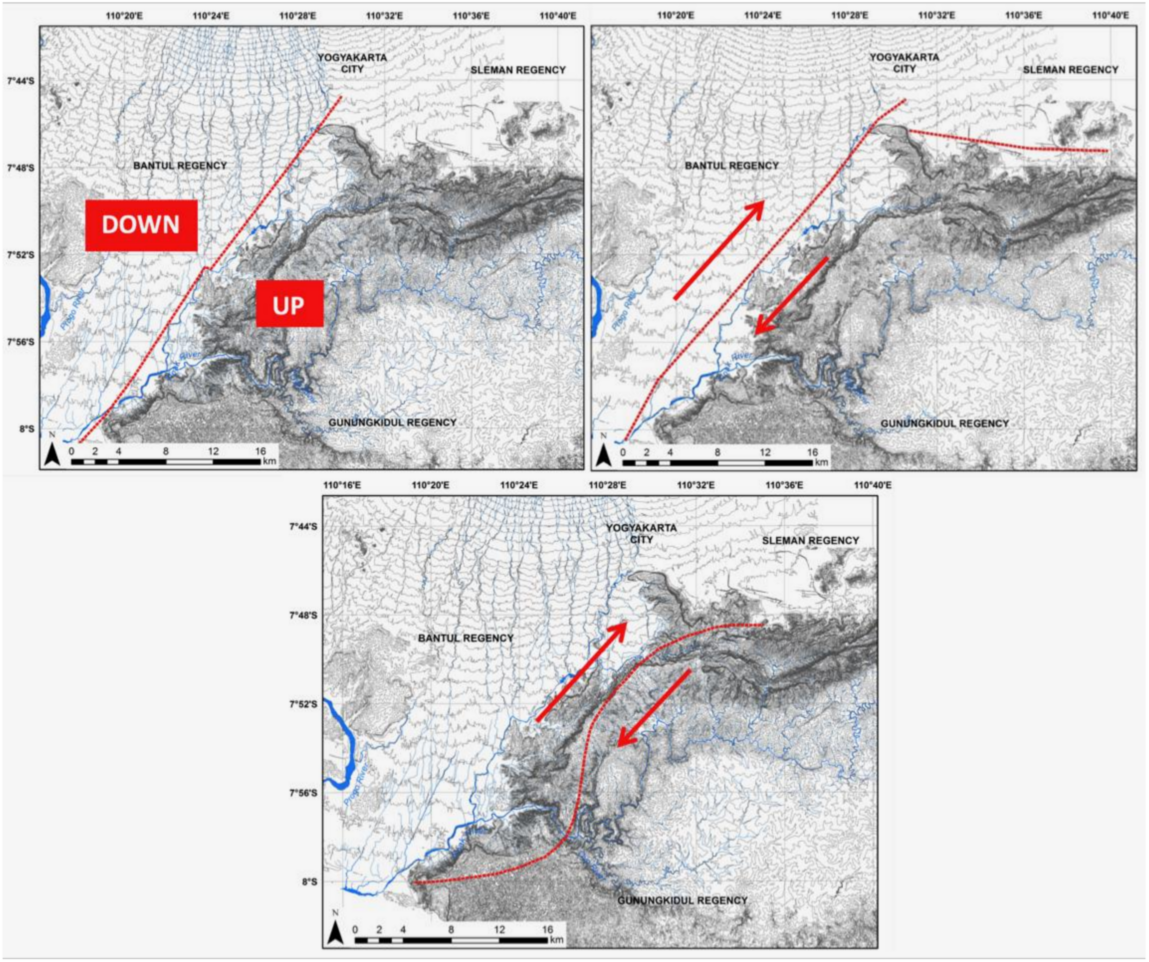
The folded hills are usually formed in the fault zone especially in the adjacent area of normal fault. This phenomenon is known as normal fault amplitude [41]. During the normal fault formation, the rocks are displaced along the fault line upward and downward. In this case, the west part of the study area is a downthrown component, while the east part of the study area is upthrow component. The displacement of the upthrow component in the east part also affected the adjacent lithologies. Since any displacement along the shear surface needs space to accommodate the displaced blocks, the adjacent lithologies received the expansion forced by the moving block. There are three general impacts of expansion force by the moving block toward the adjacent lithologies such as the lengthening (expansion) the shortening (contraction); and no change in length effects [41].
Based on the strike and dip characteristics in the eastern hills of Opak Fault, it can be concluded that the folded hills between the Opak River and Baturagung escarpment experienced a shortening effect due to the expansion force of the moving blocks (Figure 15B,C). As a result, the lithologies in the eastern part of Opak fault is obliged to fold and forms the folded hills. Additionally, this area consists of Semilir Formation which has relatively soft volcanic deposits. The anticline landform of the folded hill, and the map of the distribution of strike and dip of the outcrops in the study area can be seen in Figure 15 below.

4.2. The Outcrop Characteristic

Most of the identified outcrops were located in middle part of the study area. They consist of 66 Tmse outcrops, three Tmn outcrops, and an outcrop of transitional area between Tmse and Tmn. Additionally, about three outcrops which are located northeast outside the study area (Prambanan and Berbah), were also observed to obtain the characteristic of the outcrop that located in the adjacent area. Tmse outcrops were located in the traditional mining areas of breccia pumice or the abandoned mining areas which are located in the middle and east part of the study area, while the Tmn is located mostly in the summit of Baturagung Escarpment, the eastern part of the study area (Supplementary Materials, part 1). Tmse outcrops have characteristic of white or grey outcrop with the interbedded layer between breccia pumice (more compact) and the tuff, tuffaceous clay, and tuff dacite deposits which is typically more loose and breakable deposits. In contrast with Tmse, the Tmn outcrops were characterised as the compact hard rock with the dark colour. Most of the Tmn outcrops in the study area are consist of one single layer of compact rock.
Semilir Formation (Tmse) is typically formed of pyroclastic density currents deposits [28,29]. This deposits can be classified into ignimbrites, pyroclastic surge, and block and ash flow deposits. Ignimbrites are commonly characterised as pumices and ash-rich deposits [42]. Ignimbrites may vary in thickness from many hundreds of metres to a few of centimetres. It commonly consists of the subordinate pumice-poor layer such as lithic breccia and scoria agglomerates. Pyroclastic surge and ash flow deposits differ from ignimbrites. Pyroclastic surges are often deposited as stratified and laminated sediment [43]. This kind of deposit was formed when a volcanic eruption generates a low-density mixture of volcanic debris and fluids or known as base surges. This deposit can travel at high velocity in a horizontal direction.
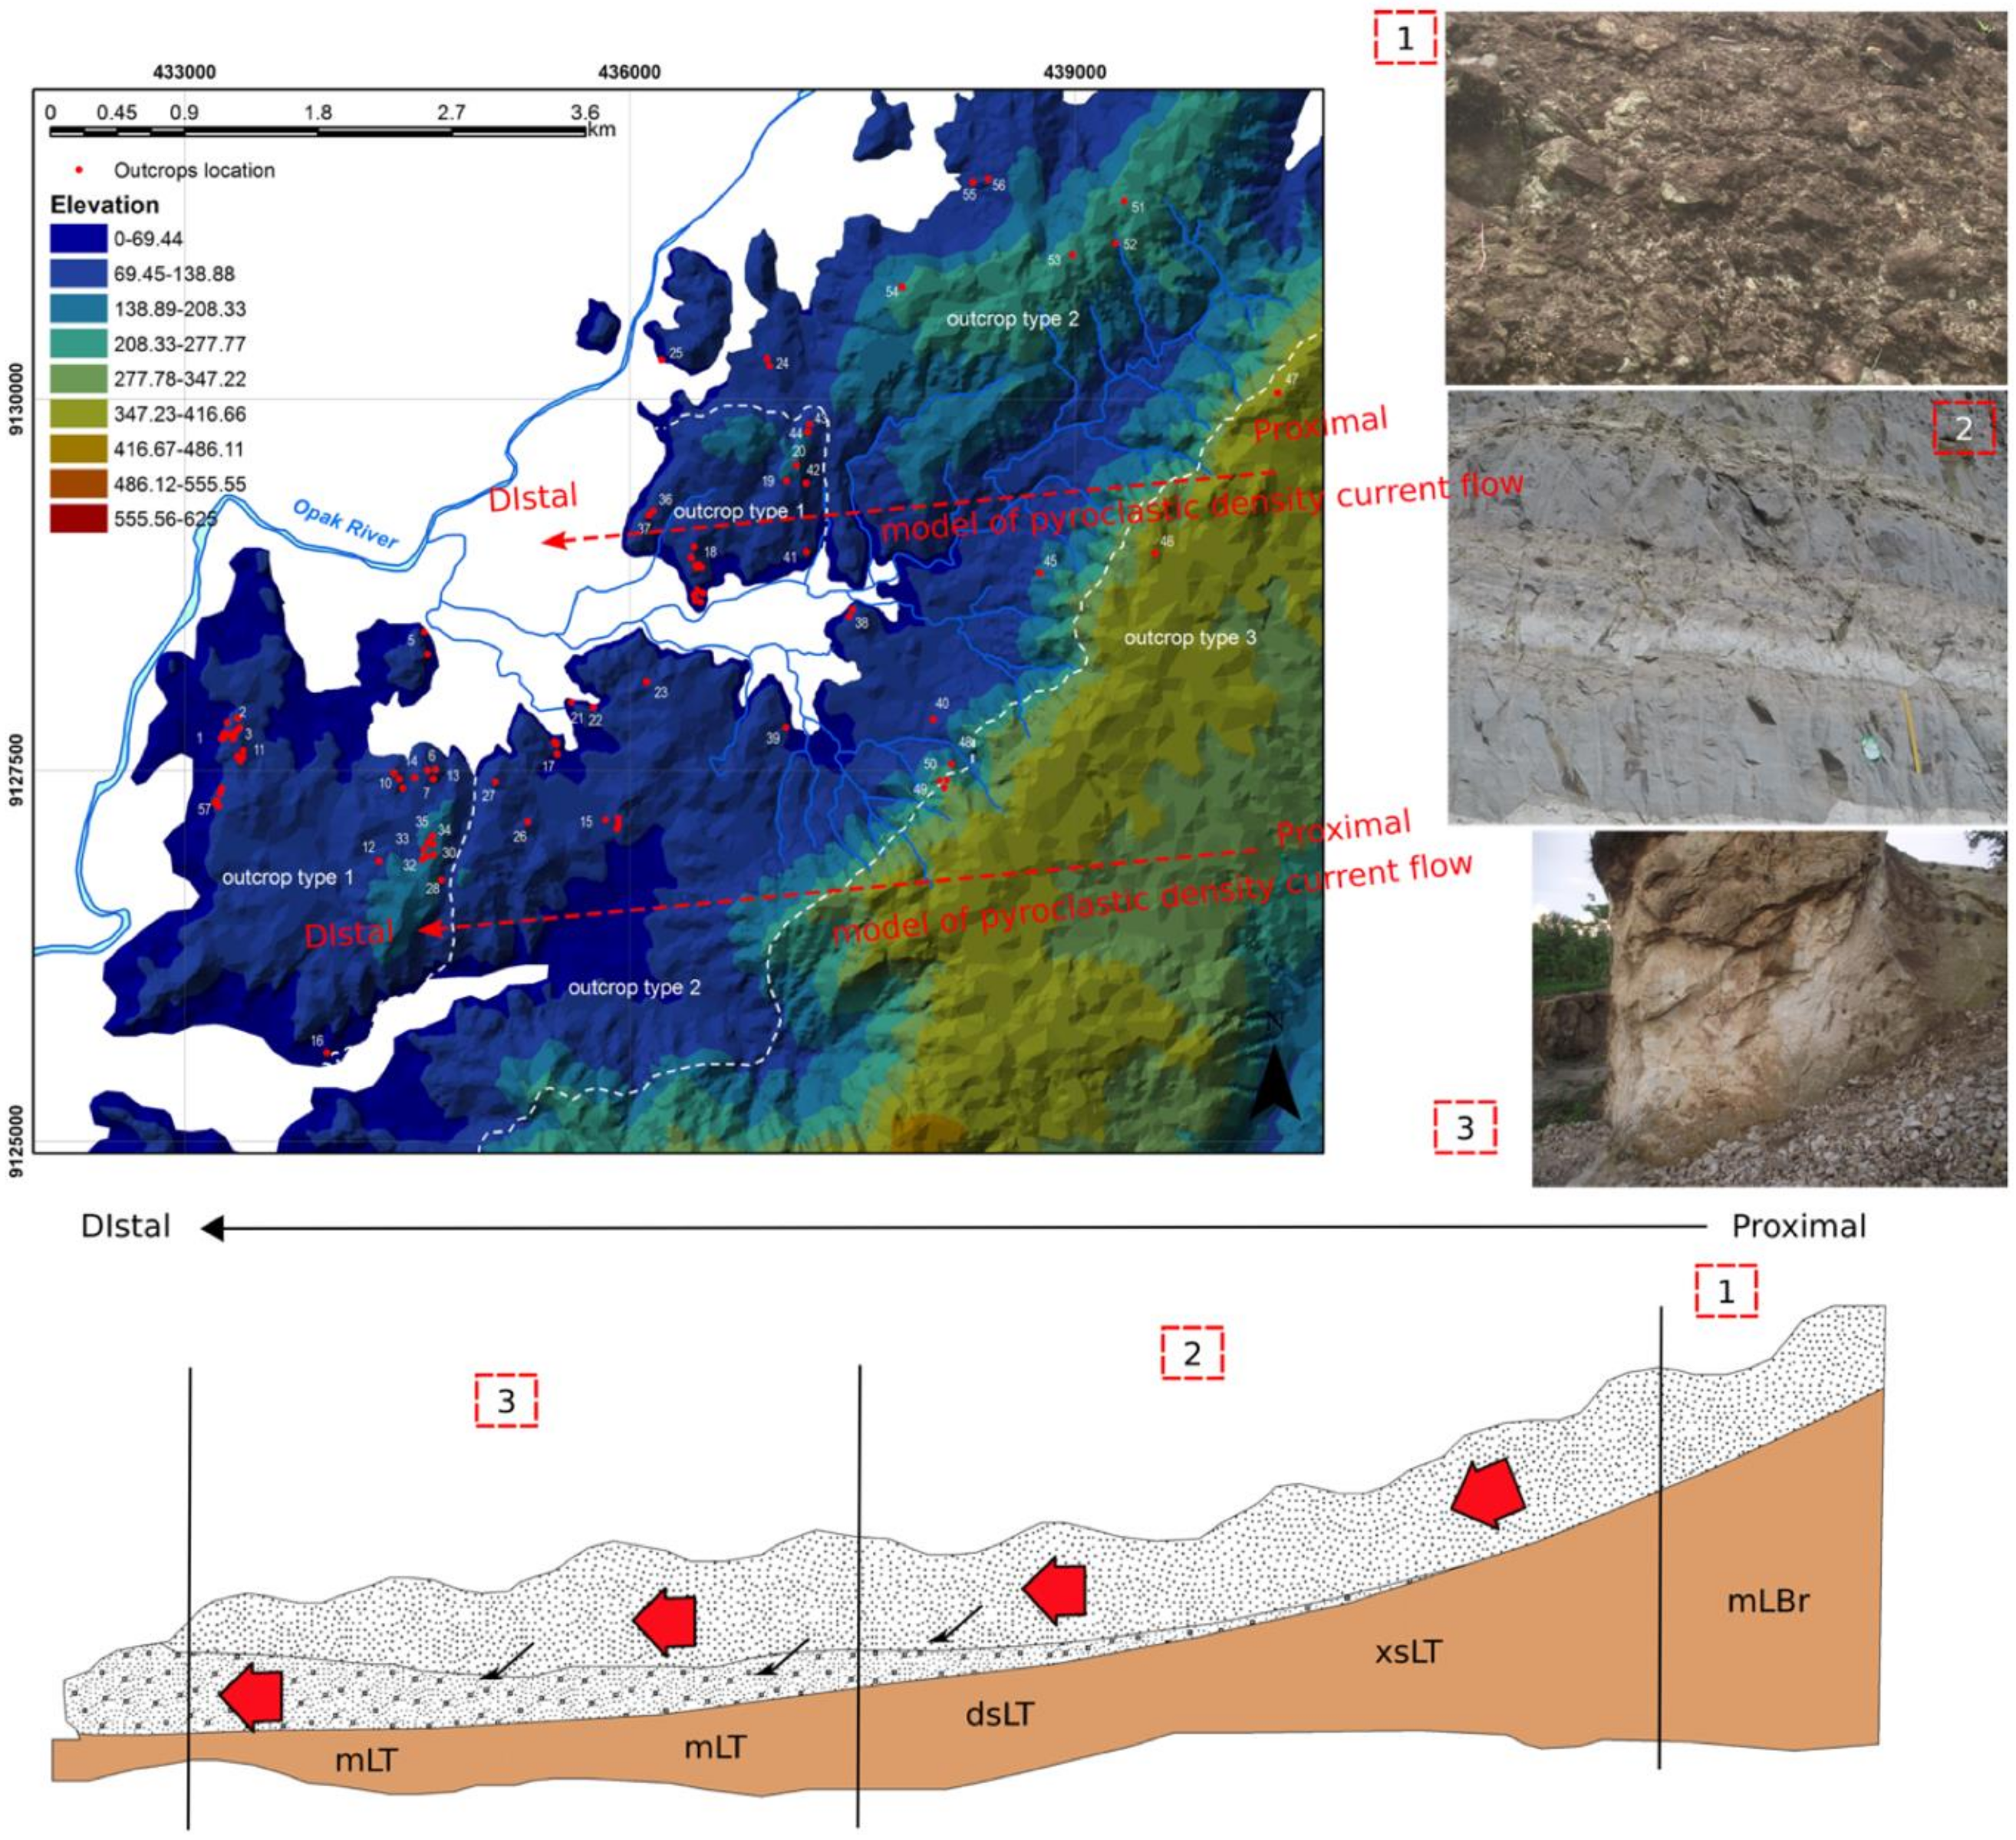
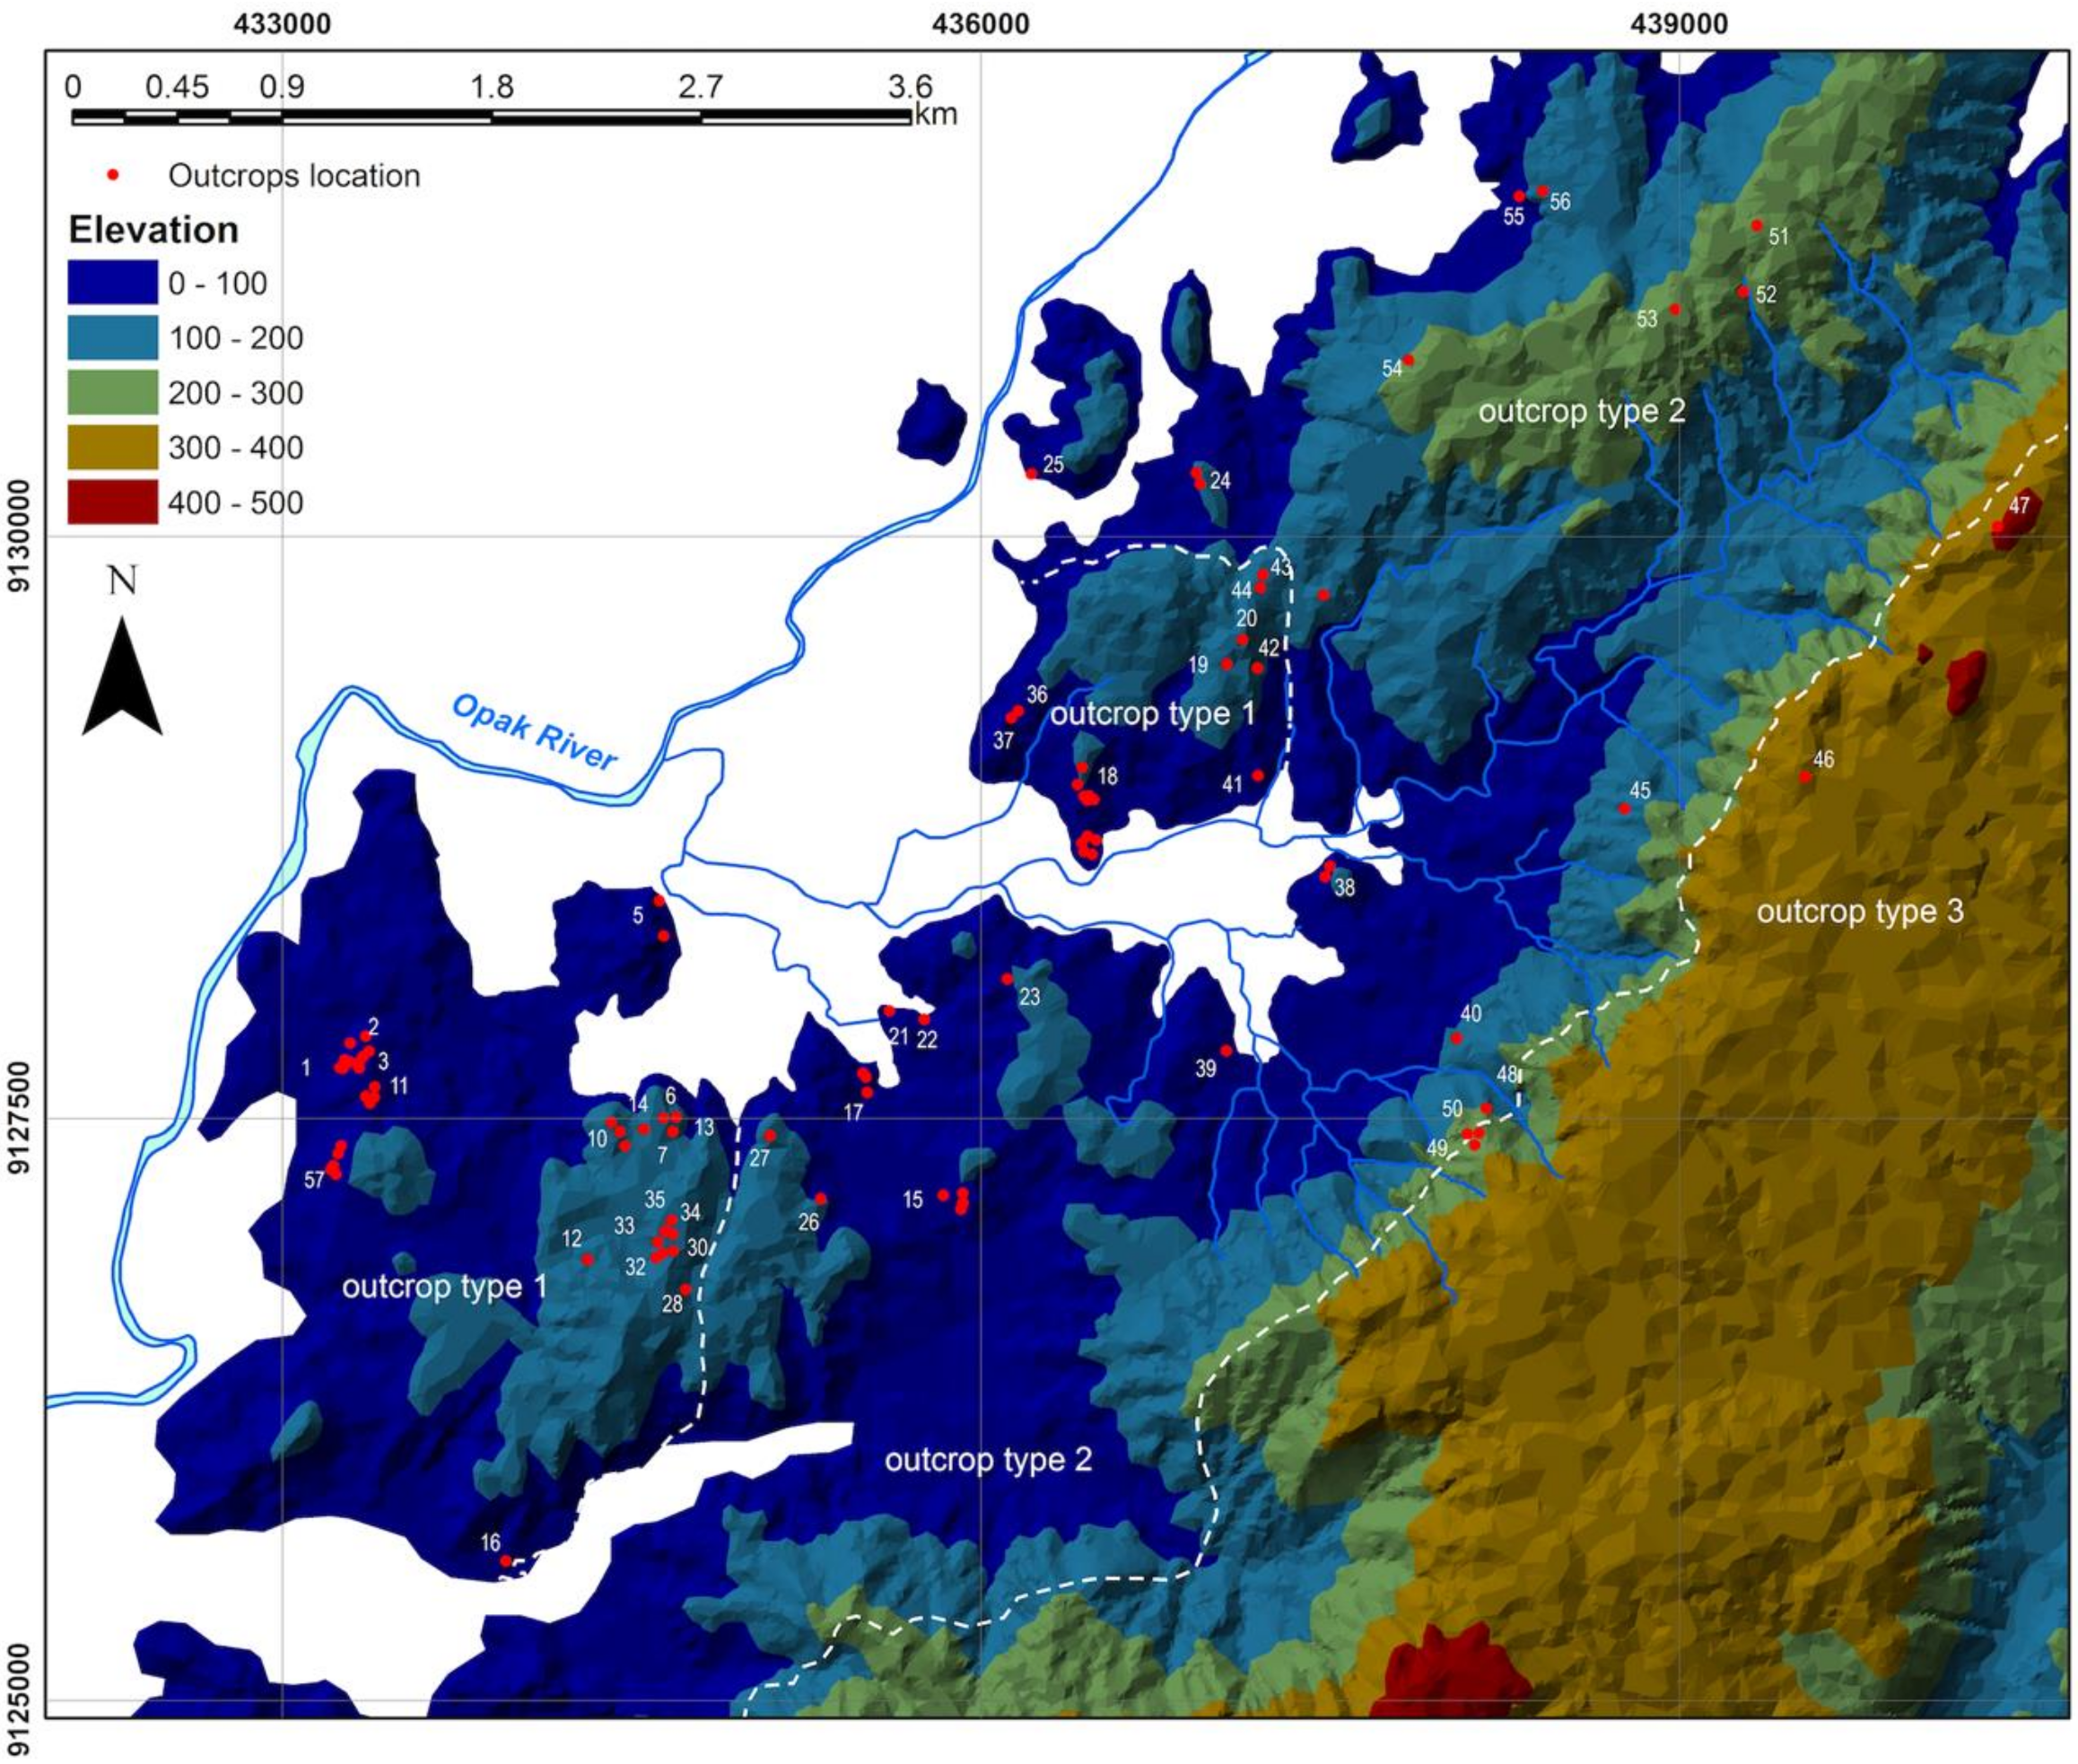
The study areas are categorised into three major types of outcrop, i.e., type 1, 2 and 3. The outcrop type 1 include zone 1, 2, 3 and 5 (western part of Semilir Formation). The outcrop type 2 including zone 4, 6 and 7. The outcrop type 3 is located in the eastern part of the study area and the small area in the middle. Most of the outcrop type 3 belongs to the Nglanggran Formation (Figure 16). The type 1 usually consists of two distinc layers: the lower and upper layers. The lower layer consists of interbedded layers between diffuse stratified Lapilli-Tuff (dsLT), thin-bedded Lapilli-Tuff (bLT), and massive Lapilli-Tiff (mLT). Meanwhile, the upper layer consists of the interbedded layer of stratified Tuff (sT), parallel stratified Tuff (//sT), and cross-stratified Tuff (xsT). The type 2 is similar to the type 1 which consists of the interbedded layer of dsLT, bLT, mLT and sT. However, the outcrops type 2 has a complicated layer configuration and has various thin layers. Additionally, based on the structure from motion analysis (SfM) the fault evidence was mainly found on outcrops type 2 in the middle part of the study area. The outcrops type 3 is entirely different from the outcrops type 1 and 2. The outcrops type 3 consists of volcanic breccia, lava flow containing breccia, agglomerate rock, and tuff. This type of outcrop is characterised as massive and compact outcrops with the bigger fragment of breccia. The outcrops type 3 has the different colour from the other outcrops. This outcrop has a darker colour (black or dark brown) comparing to the outcrop 1 and 2 (see Figure 16).
Outcrops type 1 consists of outcrop 1–14; 18–20; 28–37; 41–43 and 57. These outcrops are located in the eastern of Semilir Formation in the adjacent area with Alluvium (Qa) and Young volcanic deposits of Merapi Volcano (Qmi). The outcrop type 1 has characteristics as the light grey to the dark grey outcrop with the aphanitic to the medium texture, hardness more than 2.5 of Mohs scale, compact rock and has distinct bLT (thin-bedded Lapilli and Tuff) or sometimes have diffuse (dsLT: diffuse stratified Lapilli-Tuff) bedding plane. The dsLT and bLT layers usually deposited in the middle layer of the outcrops (near the flow boundary zone or above the aggradations deposits). For example, the outcrops in the Trimulyo zone (zone 1). This zone is located in the most southwest part of the study area. Geomorphologically, this area is located on the foot slope of medium denudation hills with the medium level of erosion process. This zone is located 700 m on the west side of Opak River (Figure 16). In general, the outcrops in zone 1 have SW-NE direction, and the bedding direction (dip) is 5.5°. The dip angle is closely related to the micro geological structure in this area. The highest elevation is 137.5 m, and the lowest elevation is 37.5 m. There are four big outcrops in this zone such as outcrop 1, 2, 3 and 57 and one small outcrops 11. The outcrop 1 has an average dimension of 172.13 m of width and 9.96 m of height (the west outcrop); 223.56 m of width and 12.75 m of height (east outcrop). The outcrop 2 has an average dimension of 129.48 m of width and 3.41 m of height. The outcrop 3 has an average dimension of 76.46 m of width and 11.76 m of height. The outcrop 11 has an average dimension of 17.46 m of width and 1.80 of height. The outcrop 57 has an average dimension of 270.76 m of width and 10.25 m of height. The outcrop 1 has 7 segments (3 segments on the west outcrop and 4 segments on the east outcrop), outcrop 2 has 4 segments, outcrop 3 has 2 segments, outcrop 11 has 1 segment, and outcrop 57 has 4 segments. The detail information about the outcrop type 1 can be found in Supplementary Materials, part 2.
The outcrop type 2 spreads in the middle of the study area. All of these outcrops belongs to the Semilir Formation (Qmi). In general, the layer’s configuration of this outcrop is similar to the outcrop type 1. It consists of interbedded layer of mLT, dsLT, bLT and //sT. However, the outcrop type 2 has much more thin layers. The outcrop type 2 consists of several outcrops in zone 3 (Sindet-Srumbung Zone), zone 4 (Srumbung-Sanan Zone), zone 6 (Banyakan Zone) and zone 7 (Ngelosari Zone) (Figure 16). There are four big outcrops that can be categorised as outcrop type 2 such as outcrop 15 (Dengkeng area), outcrop 24, outcrop 54 (Piyungan area) and outcrop 56 (Banyakan area). The detail information about the outcrop type 2 can be found in Supplementary Materials, part 3.
The outcrops type 3 are mostly located in the east part of the study area. Geomorphologically, the eastern part of the study area is the Baturagung Escarpment summit which belongs to the Formation Nglanggran. This formation consists of volcanic breccia, lava flow containing breccia, agglomerate rock, and tuff. In the field, this lithology is characterised as the very hard rock, dark colour, and the bigger grain size. There are at least six outcrops classified as the type 3 (outcrop 38, 46, 47, 49, 50, 70 and 71). All of them have the same characteristic of dark grey outside and light grey inside. It has angular blocks (>64 mm) grain size, very poorly sorted, and random configuration of pumice and lithic. According to the research done by Kokelaar team [42], this layer is categorised as a massive lithic breccia lithofacies (mlBr). This kind of lithofacies are usually known as a common proximal lithofacies, and they can deposit at the bottom, in the middle, or on the top of the other ignimbrites deposits. The mlBr layer can be easily distinguished from the other ignimbrites deposits due to the pumice and lithic grain size. mlBr contains fragment with the size of blocks from several centimetres to decimetres. Similar to the others ignimbrites deposits, the mlBr layer was formed from the coarse facies of ignimbrites which deposits in the lower flow boundary of the pyroclastic flow. The block in the mlBr was formed from the collapse of the vent wall during the eruption or additional avalanche into the pyroclastic density current or the lithics from the other materials due to the pyroclastic erosion [42]. The mlBr thickness significantly depends on the topography condition and is closely related to the caldera deposits.
The spatial distribution of outcrop type 3 in the study area proves that the Opak Fault is a normal fault. The outcrop with the Nglanggran Formation characteristic was found in the west part of the study area near the Opak River. These outcrops are located in Gunung Gelap near the Piyungan landfill. These outcrops have the same characteristic with the outcrop 49 and 50 which are located in the middle slope of Baturagung Escarpment (transition zone between Semilir and Nglanggran Formation). These outcrops (Gunung Gelap, outcrop 49, and outcrop 50) have the transition characteristics of Semilir and Nglanggran Formations. The detail information about the characteristic of outcrop type 3 can be found in Supplementary Materials, part 4.

4.3. Faults Evidence

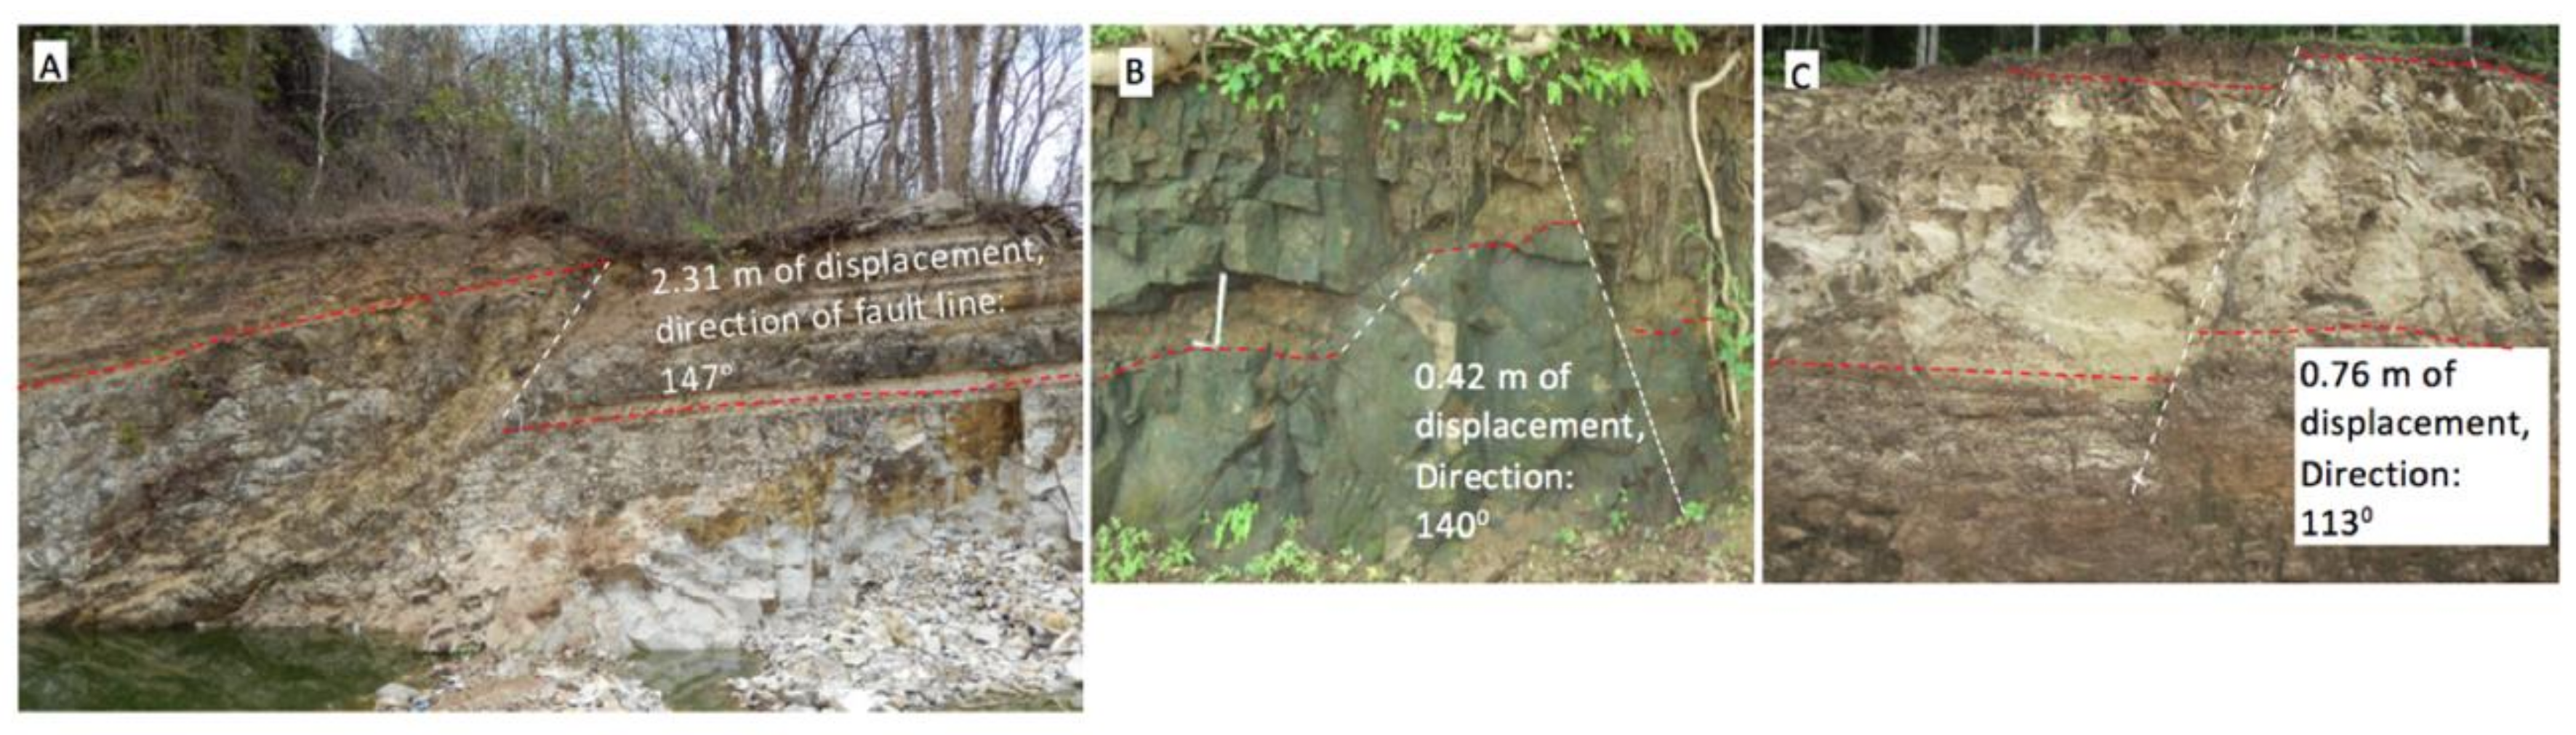
Based on the field observation and the structure from motion (SfM) results, there are loads of evidence of fault which were recorded on the outcrop. At least 31 faults were found in the study area. Most of them are located in the outcrop type 1 and 2 which belongs to the Semilir Formation. Most of them spread between the main normal fault (Opak Fault) and the main strike-slip fault (Bawuran Fault and Punthuk-Cinomati Fault) or in the centre of the study area. The biggest fault displacement is located in the outcrop 17 segment 3 in Srumbung Village. The fault was seen in the field with the direction of 147°–327° or Southeast and Northwest direction. The layer displacement was about 2.31 m with the south part moves upward and north part moves downward (Figure 17A). The other big displacements were found in the outcrop 26 (Srumbung Village) (0.42 m) and outcrop 56 (Banyakan Village) (0.76 m). Most of these faults are the normal fault. It was challenging to identify the strike-slip in the field or through the structure from motion analysis because there is no vertical displacement in a strike-slip fault.
The outcrop study also describes when the fault occurred. Most of the faults in the study area cut the outcrop’s layers from the bottom to the top. It means that the faults occurred after the layer of the outcrop perfectly formed. Based on the Yogyakarta geological map, it can be concluded that the fault was formed after the middle Miocene epoch. It can be late Miocene, early Pliocene or other younger epoch. The further study of the Opak Fault and the other related fault in study area also need to be conducted to know exactly when the fault occurred. The study of fault is beneficial to characterise the seismic and earthquake activities in the study area to support the earthquake hazard and risk management. The list of the faults displacement and the faults direction can be seen in Table 3.
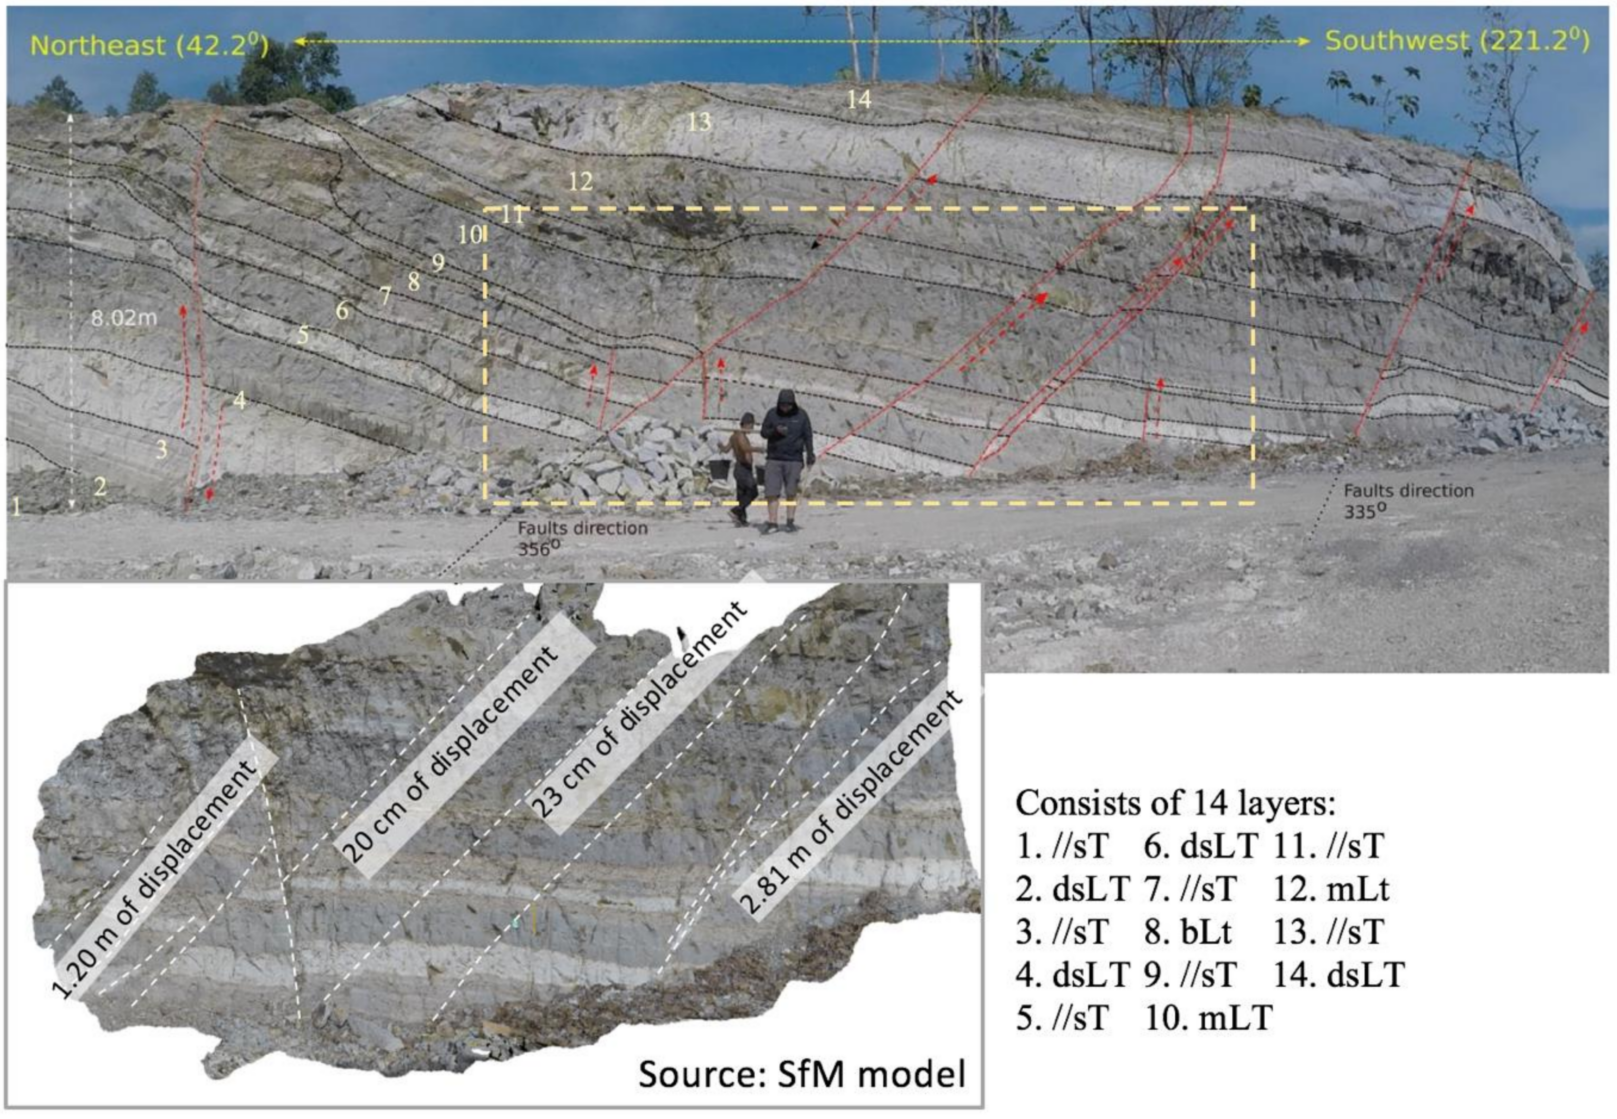
The other interesting fault evidence was also found in the middle part of the study area (Outcrop 73) and the north part area outside the study area in the Piyungan and Prambanan Village (Outcrop 65 and 66). The outcrop 73 is located on the upper slope of strongly eroded denudation hills in the middle of the study area. This location is a border area between the Bawuran Village and Piyungan Village and also near the Piyungan landfill. The outcrop 73 is a massive big outcrop which has the average height and width of 8.02 and 18.35 m, respectively. This outcrop belongs to the Semilir Formation and consists of the interbedded layer between dsLT, //sT and mLT. At least seven faults were found in the outcrop 73. All of the faults have the similar direction of North to South). These faults can be classified as step fault with the southwest block are moving upward relatively than the Northeast block. The biggest displacement in this outcrop is 2.81 m (Figure 18).
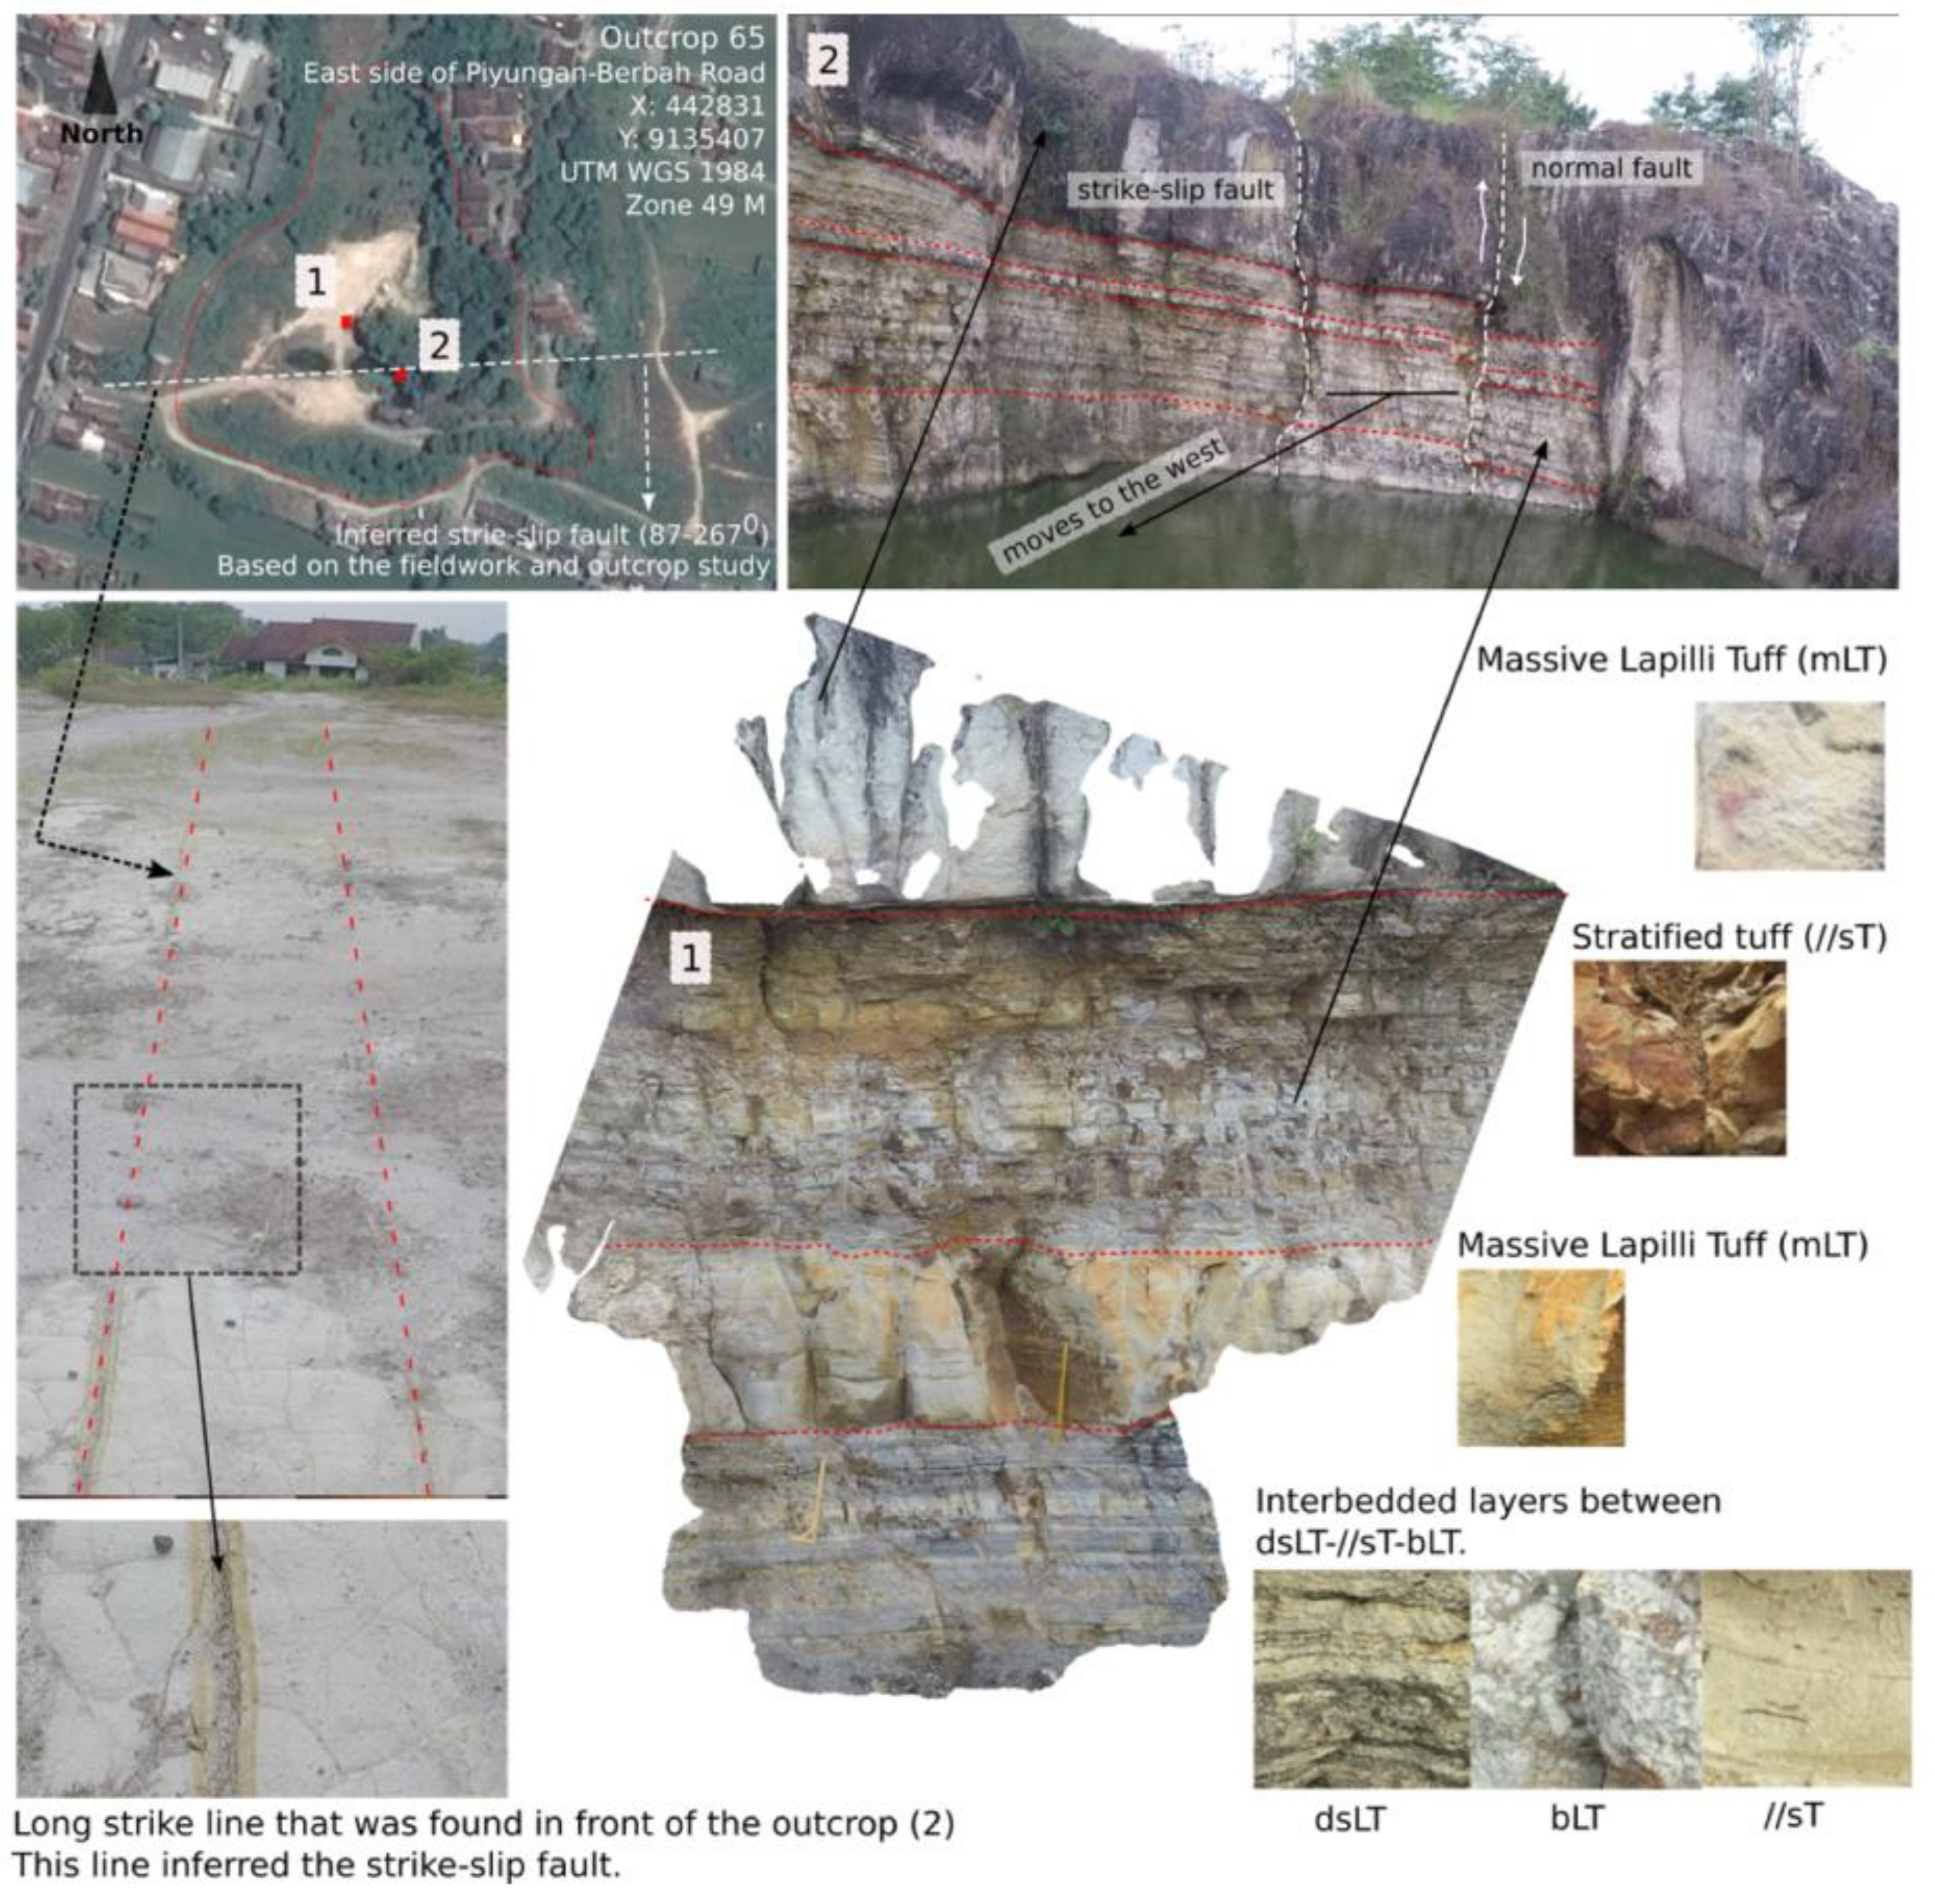
The outcrop 65 is located approximately 7.5 km Northeast of Pleret Sub-District. Geomorphologically, this location is a border area between the Baturagung Escarpment and the flat area. Based on the geological map of Yogyakarta and Surakarta, the outcrop 65 belongs to the Semilir Formation which consists of the interbedded layer of breccia pumice, dacite tuff, sandy tuff, etc. This outcrop has an average height of 3.5 m and consists of interbedded layers of //sT, dsLT, bLT and mLT. The outcrop has a dominant outer surface colour of yellowish brown and has strong sulphur odour. The strong sulphur smell indicates that the rock contains a lot of sulphur element (S) which gives the yellow colour of the outer rock surface. The stronger sulphur odour also indicates that this location was close to the source of the eruption. The pure sulphur element has no smell. The sulphur becomes smelly when the burning sulphur produces the sulphur dioxide. In nature, the burning sulphur is caused by the volcanic eruption.
Two type of faults were found in the outcrop 65, normal and strike-slip fault. Both normal and strike-slip faults have the same direction of 87°–267° (East-West oriented). The normal fault was found in the most southern block of this outcrop. This normal fault was relatively easier to identify rather than the strike-slip fault due to the displacement of the rock layers. The faults displacement is about 25 cm with the north block is relatively moving upward, while the south block is moving downward (Figure 19). The strike-slip fault was found next to the normal fault approximately 1.80 m north of the normal fault line. The strike-slip fault was more difficult to identify because there is no layer displacement. The strike-slip fault was identified based on the geology map and also based on the long strike line that was found on the ground surface in front of the outcrop (Figure 19). The fault displacement of the strike-slip fault is still unknown because the lateral movement could not be identified in the fieldwork. The only way to know the fault movement especially the strike-slip fault is to plan the Global Positioning System (GPS) and conduct continuously real-time monitoring for the certain period [7]. However, both of these faults are susceptible to the earthquake movement. The surrounding areas will receive a relatively high earthquake shaking due to the movement of both faults. The fault evidence of the Outcrop 65 can be seen in Figure 19 below.
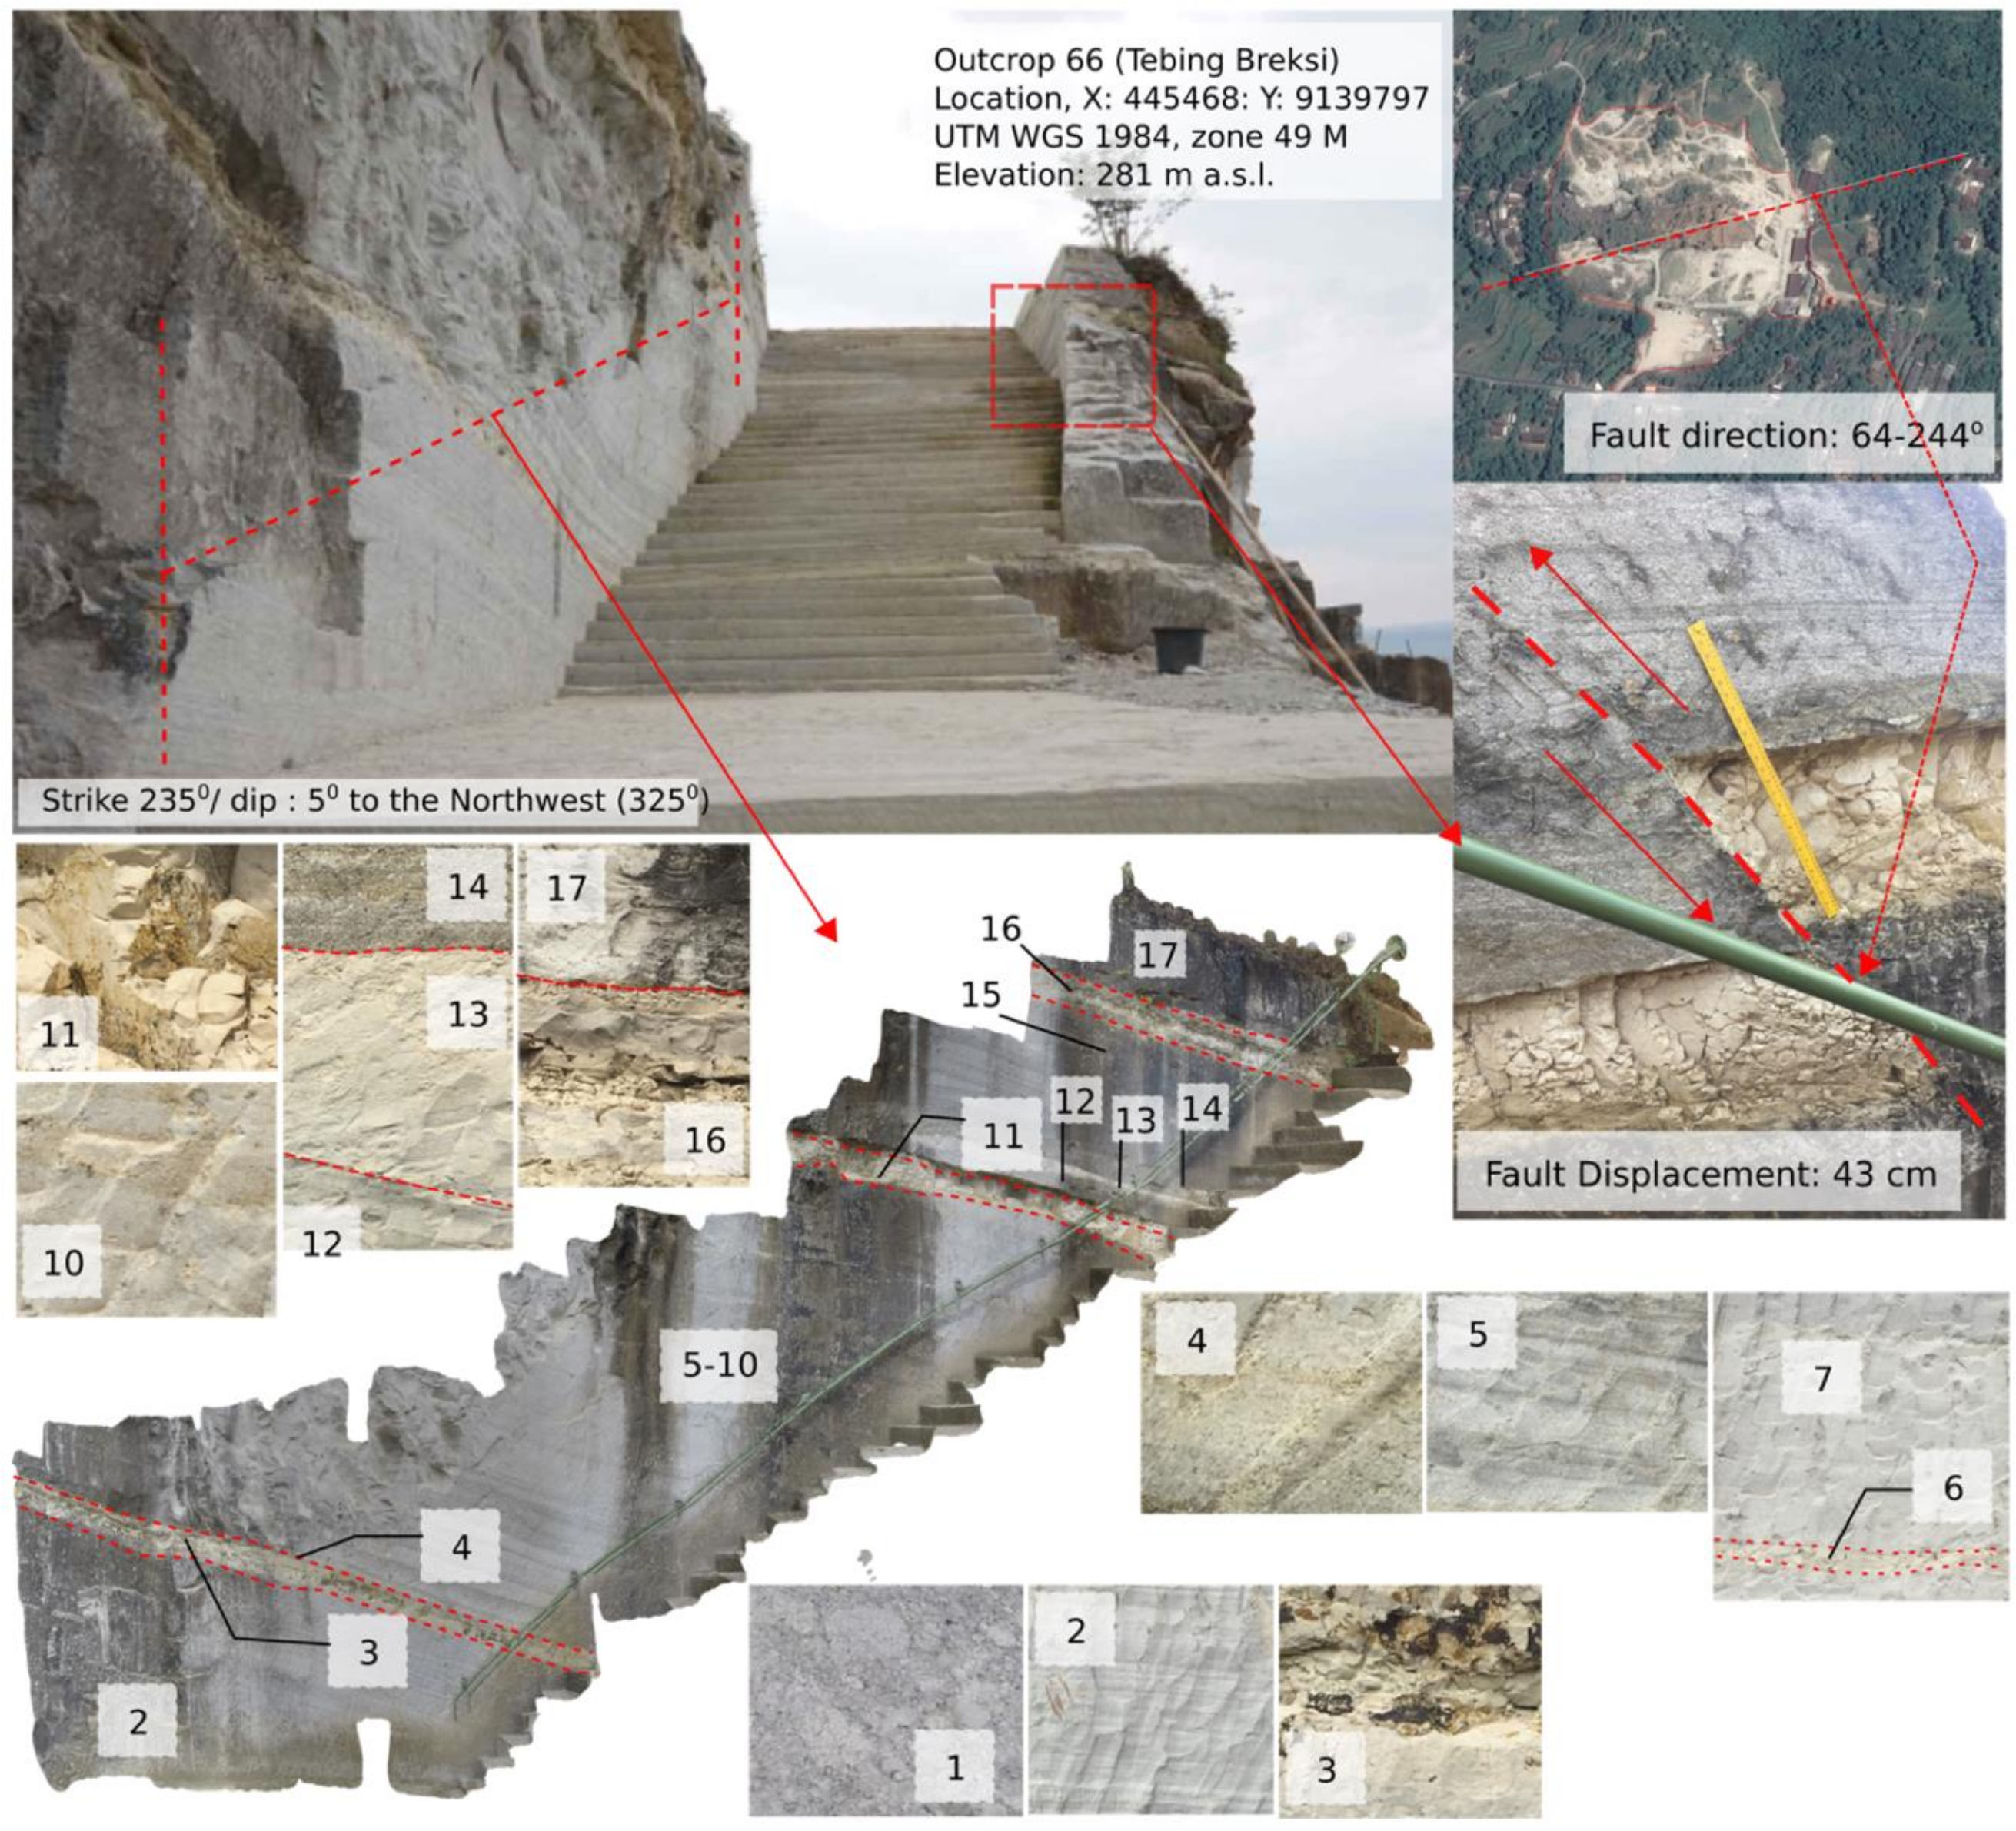
The outcrop 66 is located in Prambanan District, Central Java. Outcrop 66 is located approximately 14 km Northeast of study area. Previously, this area was an active mining area. Recently, the local people developed this area become a tourism spot that supports the main tourist attraction of Prambanan and Boko Temple. Situated in the foot slope of north part of Baturagung Escarpment, this area offers beautiful scenery with handmade sculpture attached to the outcrop. According to the Geology map and also the field observation, this area belongs to the Semilir Formation. The outcrop can be categorised as the Outcrop type 2 which is characterised as the outcrop with the multiple layers of lithofacies. This outcrop has 17 layers, which consist of interbedded layers of mLT, bLT, dsLT and //sT. The most bottom layer of this outcrop is the mLT layer of rich pumice. This layer has approximately 2.7 m of thickness and has the normal grading of pumice fragment with the grain size of 2–64 mm. The interbedded layer of dsLT rich pumice and //sT were deposited on the top of that. The bLT layer also found on the layer number 3. This layer has very well sorted fragment configuration and has coarse ash grain size. This layer was formed during the direct fall out of Plinian eruption of the ancient volcano nearby. There are approximately 7 m of interbedded layers between dsLT and //sT were deposited on the upper layer of this outcrop (Figure 20). Normal fault evidence was found on the upper layer of this outcrop. The fault has a direction of northeast-southwest (64°–244°). The fault displacement is 43 cm with the southeast block moves upward and the northwest block moves downward (Figure 20).
In general, the fault evidence of the study area and surrounding that were found in the outcrops have the dominant direction of Northwest-Southeast, and only a few of them have the direction of Northeast-Southwest (Table 2 above). Most of the faults that found on the outcrop are typical of Normal Fault. Only two faults were suspected as the strike-slip fault (outcrop 27 segment 2 and outcrop 65). The combination of the fault evidence and the identified lineament give the general description of the micro fault configuration in the study area. This result is very important because by knowing the fault configuration including the micro fault, the zonation of the earthquake vulnerability based on the existing fault can be determined. Moreover, the geology map of Yogyakarta scale 1:100,000 are only inform the main fault such as the Opak Fault and Bawuran Fault.
The results show that the south part of the study area (south part of Bawuran Fault) has more fault movement rather than the north part of the study area (north part of Bawuran Fault). Additionally, another geologic structure such as joint often found in the south part of the study area. Usually, the closer to the fault area, the number of joint or the joint density on the outcrop become denser. In the south part of the study area, the joints have the average space of less than 60 cm, while the northern part has the space between joints about more than 200 cm [44]. This fact signifies that the south part of the study area has more micro faults than the north part. For example, the outcrop 17 segment 3, this outcrop has the much micro fault and joint. Also, the structure of the rock in the outcrop 17 segment 3 is very brittle. Therefore, based on the analysis, this area is very vulnerable when the earthquake occurs. The surface tremor due to the earthquake will cause extensive damage in the area that has a lot of joint and fault. The fault reconstruction based on the lineament and outcrop study can be seen in Supplementary Materials, part 5.
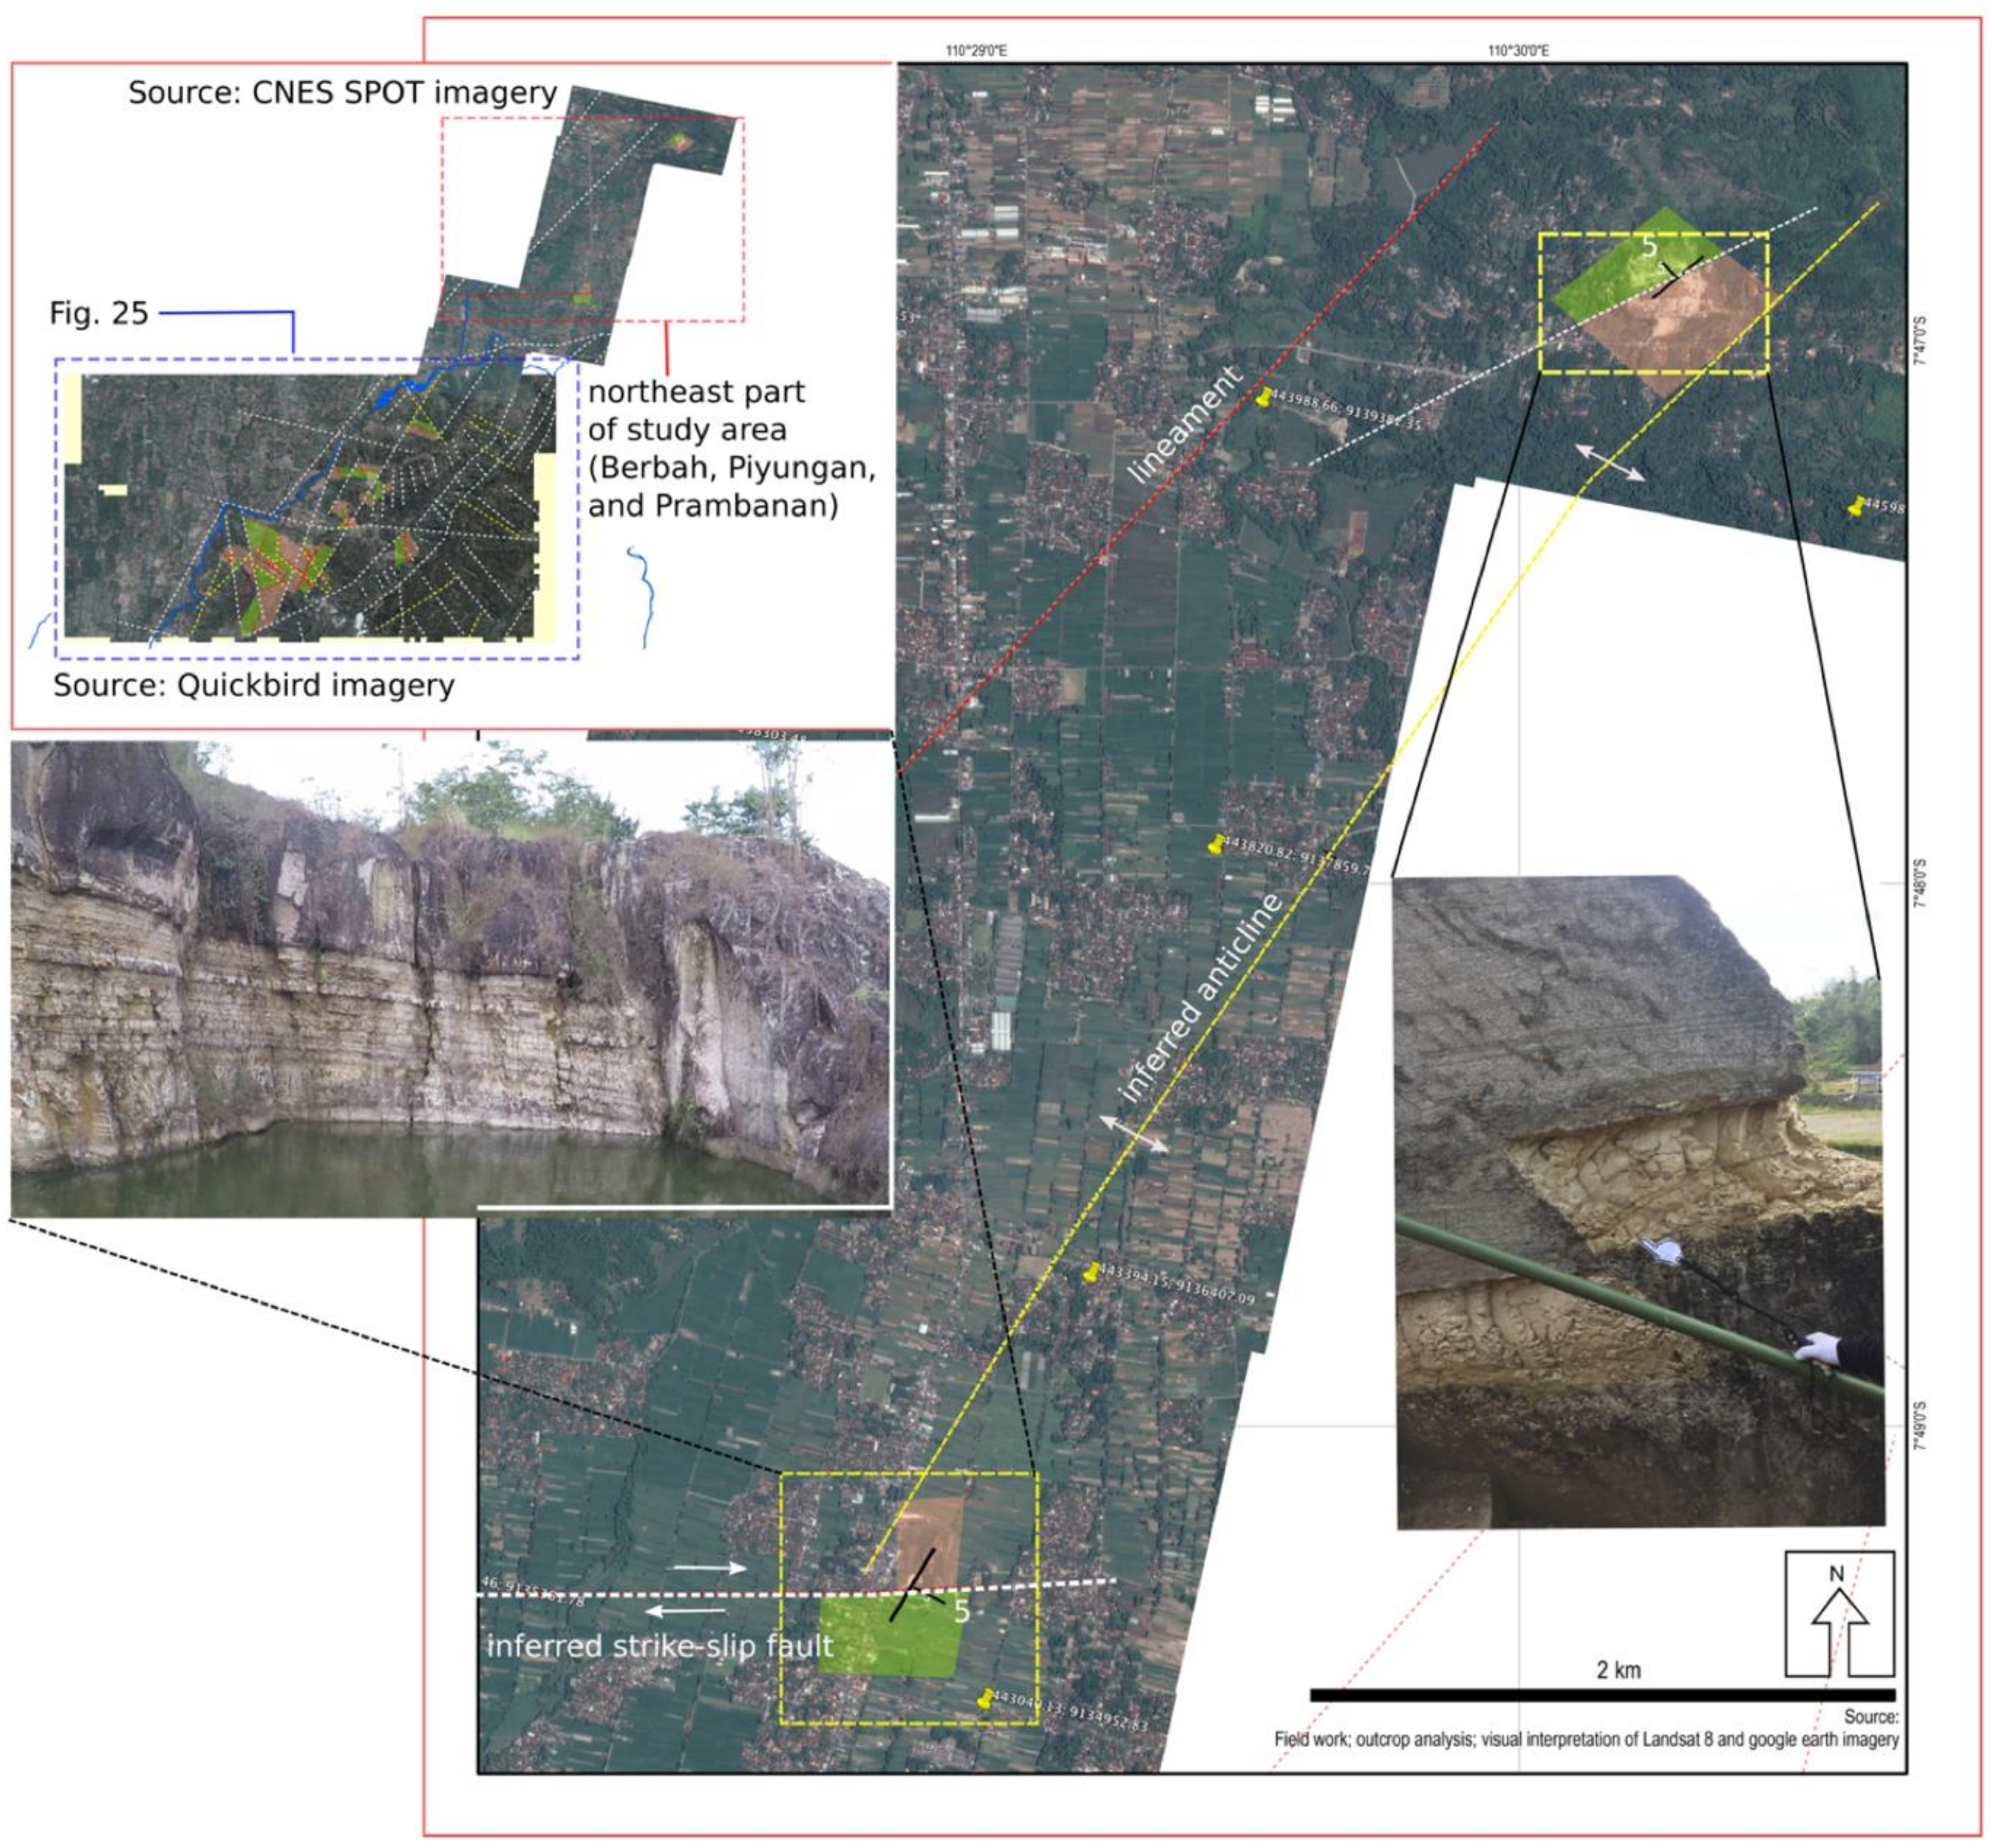
The reconstruction result shows that the north part of study area (north part of Bawuran Fault) lacks of fault movement. Only 8 out of 32 fault evidence are located in the north part of the study area. Therefore, the second fieldwork in March 2017 was conducted to find the fault evidence in the north part of the study area. The scope of the observation area was expanded which covers the area in northeast part of study areas such as Berbah, Piyungan and Prambanan Village. Two important outcrops were found in Berbah-Piyungan and Prambanan Village. The step fault was found in the Piyungan village. The other normal faults were also found in Berbah-Piyungan and Prambanan. Moreover, we found the evidence of strike-slip fault in the Berbah-Piyungan Village in Outcrop 65. This evidence signifies that beside the Dengkeng Fault (Strike-Slip fault, west-east oriented), there are also several micro faults that have the same type and orientation. Based on the second field observation, the additional fault data can support describing the micro fault and another geological structure such as anticline in the north and northeast part of the study area. The indicated anticline was found by combining the strike and dip direction between outcrop 65 and 66. Both of them have the similar direction of strike, i.e., 40° and 235°, respectively. Both of them have the same bedding angle of 5 degrees but have the opposite direction of dip orientation. The outcrop 65 has the dip orientation of 130° (Southwest), while the outcrop 66 has the dip orientation of 325° (Northwest). This north anticline is located exactly in the front of the Baturagung Escarpment, same with the south anticline (Trimulyo anticline, Figure 15A,B). This fact signifies that the northeast part of the study area (Berbah, Piyungan, and Prambanan) also experienced a contraction effect due to tectonic deformation and caused the formation of anticline landform along the escarpment area. The additional fault reconstruction in the north and northeast part of the study area can be seen in Figure 21 below.

4.4. Lateral Variation of Ignimbrite Deposits Based on the Outcrop Study

In the volcanology, the analysis and interpretation of longitudinal lithofacies variations of the outcrops are very important. Beside outcrop is the only one of the data source to study pyroclastic density current, the longitudinal variation (proximal-distal) lithofacies is also useful to identify the dynamic characteristic of pyroclastic density current, and it is very important to trace the ancient volcanic activities. According to Kokelaar’s research in general, the ignimbrites lithofacies may be diachronous [42]. A diachronous deposit is the similar sedimentary rock formation that varies in age from place to place. Therefore, the lithofacies analysis needs to consider about the time and distance. It is very important to divide the outcrop lithofacies based on the timeline in cross section. In this study, the lithofacies lateral variations analysis was used to support the better understanding of the outcrop characteristic including the characteristic of the pyroclastic density current (PCD) and the volcanic source that produces the PCD.
Based on the outcrop analysis, three types of outcrops (Outcrop type 1, 2 and 3) were found in the study area and its surrounding (Figure 16). In general, the outcrop type 1 is thicker and massive mLT with sometimes consist of the pumice-rich layer and lapilli tuff from the direct fallout. The outcrop type 2 dominant consists of relatively thin stratified lithofacies such as //sT, dsLT and bLT, while the outcrop type 3 is typical of large of lithic clastic deposit such as mlBr. Outcrop type 1 is located on the most western part of the mountainous area, while the outcrop type 2 is located in the middle mountainous area to the middle slope of Baturagung Escarpment, and outcrop type 3 is located on the top of Baturagung Escarpment. Based on this pattern, it can be concluded that the study area and its surrounding has the longitudinal pattern of down current lithofacies changes from stratified to massive [42]. This pattern is characterised by a decrease of clastic lithic size from the proximal area (mlBr) to the distal area (mLT) in the east part of the study area. This lithofacies probably was formed because of the significant decrease of the pyroclastic current during the quasi-steady flow. The middle-west part of the study area is a transitional area from relatively thin to stratified lithofacies such as sT, dsLT and bLT on steep proximal slopes to thicker deposits of mLT. Such down current occurred when the flow transformation from turbulent current to laminar current [42,45].
To sum up, the study area has a pattern of mIBr in the proximal area (the particular area that close to the centre or the source of the eruption), dsLT, //st and bLT in the medial area, and the thicker mLT as a distal facies on the lower slope. Thus, it can be concluded that the source of eruption was located in the proximal area or the east to northeast part of the study area. The possible location of the source of the eruption is in the top of the Baturagung Escarpment or more to the northeast in Berbah-Piyungan area (nearby outcrop 65) or Wonosari Basin in Gunung Kidul Regency. The general description of the horizontal variations of pyroclastic density current is presented in Figure 22 below.
The direction of the Semilir eruption source is in line with the previous studies [15,28,29,46]. However, there is a slightly different in the estimation of eruption location. Astuti team and Hartono team were estimated that the source of Semilir Eruption was located in the east part of Baturagung far away from the study area [28,46]. They believed the Semilir eruption source was located approximately 60 km to the east of study area (near Wonogiri District, Central Java). Meanwhile, Quincey team has an opinion that the source of the eruption was not too far to the east part of Baturagung Escarpment [15]. This fact is totally in line with the findings of this study. Based on the lateral variation of ignimbrite deposits, it can be concluded that the source of Semilir eruption was close to the eastern part of Baturagung Escarpment.
Additionally, based on the close investigation in Trimulyo Zone especially outcrop 1a (facing east), it can be seen that the ignimbrite deposits were produced from direct eruption or one single eruption or multi eruption with the short interval of eruption time. It can be shown from the absent of soil deposits in between each lithofacies layers. Moreover, the ignimbrite deposits are dominated by horizontal lamination which indicates that this ignimbrite was deposited in the land environment (not in water environmental).

4.5. The Accuracy of Structure from Motion (SfM)

For the present study, at least 73 outcrops of the rock formation that located on the western flank of Baturagung Escarpment had been digitally recorded and observed. Most of them belong to the Semilir Formation which consists of the interbedded layers between breccia pumice, dacite tuff, sandy tuff, and tuffaceous clay. Each outcrop might consist of several segments of outcrop observation. The segment determination depends on the size of the observed outcrop. The number of the picture that used in the SfM process determine the quality of the resulted point cloud. The SfM will match automatically all the imaged taken from the various camera angle, perspective and scale. However, SfM needs the adequate overlapping images. Usually, 50–60% of overlapping images is needed to apply the stereoscopies photography within the SfM process [39,47]
The results show that the outcrop model from the SfM surface provides important additional information to support the visual analysis of the outcrops. The SfM model can reserve the condition of the outcrop and its surrounding characteristic in the 3D model which is very useful to complement the fieldwork analysis. At least 32 of fault evidence were identified through fieldwork analysis and the SfM analysis. Most of the fault evidence are the normal fault with the biggest offset is about 2.39 m. SfM can provide the accurate model of the outcrop surface. Based on the calculation of the root mean square error (RMSE) of several measurement objects (Table 4). The SfM model provides approximately 0.25 m of RMSE. This result show that the SfM model has same accuracy as the LIDAR, Airborne Laser Scanning (ALS), and Terrestrial Laser Scanning (TLS).

4.6. Earthquake Susceptibility Based on the Fault Configuration

Based on the outcrop study, it can be shown that various earthquakes often occurred in the study area. The earthquake was closely related to the main fault (Opak and Bawuran Fault) and the configuration of the micro fault. Based on the spatial planning guidance of the volcanic eruption prone area and earthquake-prone area PP No. 21/PRT/M/2007. The more complicated and the closer particular to the fault, fold, and joint area indicates that the area is relatively more unstable.
The middle part of the study area (south part of Bawuran Fault) has more complicated geologic structure. It can be indicated form the fault evidence that was found in the outcrop and also from the density of the fault. For example, Outcrop 17 segment 3 (Srumbung Village), the outcrop has a complicated fault evidence. At least more than five faults evidence were found in the one segment of this outcrop. Additionally, the various number of joint with space less than 10 cm were also found in this outcrops (compare Figure 17A,C). It can be seen in Figure 17A that the rock structure in the outcrop 56 (Figure 17C) is more compact than the rock structure in the outcrop 17 segment 3 (Figure 17A). This phenomenon shows that the outcrop 17 segment 2 experienced a great tectonic force and caused various joints and also faults in the rock. This condition also impacted the quality of the rock itself. Based on the laboratory analysis of the rock sample that conducted by Fisher [44]), the rock sample from the middle part of the study area has the value of compressive strength lower than the northern and the southern part of the study area. Additionally, the area which has a complex configuration of geologic structure (fault, joint, and fold) indicates the area is more unstable if the earthquake occurs. The unstable area will amplify the ground motion and will increase the vulnerable level of the particular area. Therefore, based on this study, the middle part of the study area is more vulnerable rather than the north part and south part of the study area. Administratively, the north part of Segoroyoso, the middle part of Bawuran and middle part of Wonolelo village are very unstable and vulnerable to the ground motion amplification.

5. Conclusions

The SfM produced an accurate model of the outcrop surface model. It has the RMSE value of 0.25 m from the 60 points observation. By using the surface model, the fault displacement that recorded in the outcrops can be identified and calculated. At least there is 30 faults displacement were found in the study area. Most of them were normal faults, and few of them were strike-slip faults. The maximum displacement was 2.39 m which is located in outcrop 17 Segment 3, Srumbung Sub-Village, Segoroyoso, Pleret. The minimum displacement was found in the outcrop 20 segment 2 which is located in the upper region of Bawuran village. Based on the fault configuration of the study area, the middle part of study areas such as the north Segoroso, the middle part of Bawuran and Wonolelo are very unstable and vulnerable to ground amplification.
All the outcrops in the study area are ignimbrite deposits from the pyroclastic of the ancient volcano. The ignimbrite was deposited in late Pleistocene until early Miocene. However, the geologic time assessment based on the charcoal that found in the outcrop is needed to confirm the deposition time of this pyroclastic. Based on the geology map of Yogyakarta most of the outcrop belongs to the Semilir Formation which consists of the interbedded layer of breccia pumice, dacite tuff, sandy tuff tuffaceous clay. According to the lithofacies type, the outcrop in the study area can be categorised into three types. The first type is category outcrop 1; second, category outcrop 2, and the last type is category outcrop 1. The outcrop 1 and 2 are dominated by the lithofacies of mlT and dsLT. However, the outcrop type 2 has more thin layer rather than the outcrop 3. The outcrop 1 is dominated by the mIBr lithofacies, which has distinct characteristic from the other two types. mIBr has the bigger fragment of lithic and pumice. This lithofacies can be found in the Nglanggran Formation which located in the eastern part of the study area. Additionally, based on the lithofacies study of the outcrop, the horizontal (proximal and distal) distribution of the lithofacies characteristic shows that the source of the pyroclastic deposits is in the northeast part of the study area (Baturagung Escarpment or Berbah or Piyungan or Prambanan Village). Also, the pyroclastic was produced from the quasi-steady phase during the ancient volcanic eruption.

Supplementary Materials

The following are available online at https://www.mdpi.com/2076-3263/8/4/132/s1, supplementary part 1: the outcrops distribution; supplementary part 2: the brief description of outcrop type 1 characteristics; supplementary part 3: the brief description of outcrop type 2 characteristics; supplementary part 4: the brief description of outcrop type 3 characteristics; supplementary part 5; the tentative of polygonal micro-fault in study area.

Acknowledgments

This paper is part of the PhD research at Department of Geography, University of Canterbury, New Zealand, which is funded by the Indonesia Endowment Fund for Education (LPDP-Indonesia). The author is thankful to main supervisor, Christopher Gomez, who has supported this project, co supervisor Ioannis Delikostidis, Peyma Zawar-Reza, Danang Sri Hadmoko and Junun Sartohadi. We also acknowledge the University of Canterbury New Zealand who provided adequate reference for this project.

Author Contributions

Aditya Saputra and Christopher Gomez collected the data, Aditya Saputra carried out the analysis of coseismic landslide, Christopher Gomez and Ioannis Delikostidis support on the interpretation of the results. Aditya Saputra drafted the manuscript, Christopher Gomez, Danang Sri Hadmoko, Junun Sartohadi, Ioannis Delikostidis and Peyman Zawar-Reza, Muhammad Anggri Setiawan revised the manuscript. All the authors drafted, read and approved the final manuscript.

Conflicts of Interest

The authors declare no conflict of interest.

References

  1. Gomez, C.; Janin, M.; Lavigne, F.; Gertisser, R.; Charbonnier, S.; Lahitte, P.; Hadmoko, S.R.; Fort, M.; Wassmer, P.; Degroot, V.; et al. Borobudur a basin under volcanic influence: 361,000 years BP to present. J. Volcanol. Geotherm. Res. 2010, 196, 245–264. [Google Scholar] [CrossRef]
  2. Irsyam, M.; Sengara, I.W.; Aldiamar, F.; Widiyantoro, S.; Triyoso, W.; Natawidjaja, D.H.; Kertapati, E.; Meilano, I.; Suhardjono, A.M.; Ridwan, M. Ringkasan Hasil Studi Tim Revisi Peta Gempa Indonesia 2010; KemenPU: Bandung, Indonesia, 2010. [Google Scholar]
  3. Van Bemmelen, R.W. The Geology of Indonesia, 2nd ed.; Martinus Nijhoff: The Hague, The Netherlands, 1970. [Google Scholar]
  4. Clements, B.; Hall, R.; Smyth, H.R.; Cottam, M.A. Thrusting of volcanic arc: A new structural model for Java. Petroleum Geosci. 2009, 15, 159–174. [Google Scholar] [CrossRef] [Green Version]
  5. Rahardjo, W.; Sukandarrumidi; Rosidi, H.M.D. Geological Map of the Yogyakarta Sheet, JAWA; Geological Research and Development Centre: Bandung, Indonesia, 1995. [Google Scholar]
  6. Natawidjaja, D.H. Tectonic Setting Indonesia Dan Pemodelan Sumber Gempabumi Dan Tsunami. Pelatihan Pemodelan Run up Tsunami; Ministry of Research, Technology and Higher Education of the Republic of Indonesia: Jakarta, Indonesia, 2007.
  7. Abidin, H.Z.; Andreas, H.; Meilano, I.; Gamal, M.; Gumilar, I.; Abdullah, C.I. Deformasi koseismik dan pascaseismik gempa Yogyakarta 2006 dari hasil survey GPS. Jurnal Geologi Indones. 2009, 4, 275–284. [Google Scholar]
  8. Allaby, M. A Dictionary of Geology and Earth Sciences; Oxford University Press: Oxford, UK, 2013. [Google Scholar]
  9. Pringle, J.; Gardiner, A.; Westeman, R. Virtual geological outcorps—Fieldwork and analysis made less exhaustive? Geol. Today 2004, 20, 67–71. [Google Scholar] [CrossRef]
  10. Gomez, C. Structure from-Motion and Wavelet Decomposition for Outcrop Analysis. HAL Archives-Ouvertes.fr. 2014. Available online: https://hal.archives-ouvertes.fr/hal-00939994 (accessed on 31 January 2014).
  11. Reheis, M.C.; Adams, K.D.; Oviatt, C.G.; Bacon, S.N. Pluvial lakes in the Great Basin of the western United States—A view from the outcrop. Quat. Sci. Rev. 2014, 97, 33–57. [Google Scholar] [CrossRef]
  12. Guyonnet-Benaize, C.; Lamarche, J.; Hollander, F.; Viseur, S.; Munch, P.; Borgomano, J. Three-dimensional structural modeling of an active fault zone based on complex outcrop and subsurface data: The Middle Durance Fault Zone inherited from polyphase Meso-Cenozoic tectonics (southeastern France). Tectonics 2015, 34, 265–289. [Google Scholar] [CrossRef]
  13. Back, S.; Morley, C.K. Growth faults above shale-Seismic scale outcrop analogues from the Makran foreland, SW Pakistan. Mar. Pet. Geol. 2016, 70, 144–162. [Google Scholar] [CrossRef]
  14. Tewksbury, B.J.; Hogan, J.P.; Kattenhom, S.A.; Mehrtens, C.J.; Tarabees, E.A. Polygonal faults in chalk: Insights from extensive exposures of the Khoman Formation, Western Desert, Egypt. Geology 2014, 42, 479–482. [Google Scholar] [CrossRef]
  15. Smith, M.; Carrivick, J.; Quincey, D. Structure from motion photogrammetry in physical Gbeography. Prog. Phyis. Geogr. 2016, 40, 247–275. [Google Scholar] [CrossRef]
  16. Westoby, M.; Brasington, J.; Glasser, N.; Hambrey, M.; Reynolds, J. ‘Structure-from-Motion’ photogrammetry: A low-cost, effective tool for geoscience applications. Geomorphology 2012, 179, 300–314. [Google Scholar] [CrossRef] [Green Version]
  17. Tortosa, D.; Beach, P. Accuracy and Precision Tests Using Differential GPS for Natural Resource Applicatons; NODA Note No. 8; Ministry of Natural Resource: Canada, ON, Ottawa, 1996. Available online: http://www.cfs.nrcan.gc.ca/pubwarehouse/pdfs/9523.pdf (accessed on 7 April 2018).
  18. Fonstad, M.; Dietrich, J.; Courville, B.; Jensen, J.; Carbonneau, P. Topographic structure form motion: A new development in photogrammetric measurement. Earth Surf. Process Landf. 2013, 38, 421–430. [Google Scholar] [CrossRef]
  19. Gomez, C.; Kataoka, K.; Saputra, A.; Wassmer, P.; Urabe, A.; Morgenroth, J.; Kato, A. Photogrammetry-based texture analysis of a volcano clastic outcrop-peel: Low-cost alternative to TLS and automation potentialities using Haar Wavelet and spatial analysis logarithm. Forum Geogr. 2017, 31, 16–27. [Google Scholar] [CrossRef]
  20. Dietrich, J.T. Application of Structure-from-Motion Photogrammetry to Fluvial Geomorphology. Ph.D. Thesis, University of Oregon, Eugene, OR, USA, 2014. [Google Scholar]
  21. Statistics Indonesia. Kecamatan Pleret dalam Angka. In Kecamatan Pleret Dalam Angka; Statistics Indonesia: Yogyakarta, Indonesia, 2010. [Google Scholar]
  22. Daryono, S.S. Indeks Kerentanan Seismik Berdasarkan Mikrotremor Pada Setiap Satuan Bentuklahan di Zona Graben Bantul Daerah Istimewa Yogyakarta. Master’s Thesis, Universitas Gadjah Mada, Yogyakarta, Indonesia, 2011. [Google Scholar]
  23. Nurwihastuti, D.W.; Sartohadi, J.; Mardiatno, D.; Nehren, U. Understanding of earthquake damage pattern through geomorphological approach: A case study of 2006 earthquake in Bantul, Yogyajarta, Indonesia. World J. Eng. Technol. 2014, 2, 61–70. [Google Scholar] [CrossRef]
  24. Saputra, A.; Gomez, C.; Hadmoko, D.S.; Sartohadi, J. Coseismic landslide susceptibility assessment using geographic information system. Geoenviron. Disaster 2016, 3, 27. [Google Scholar] [CrossRef]
  25. Elnashai, A.; Kim, S.J.; Yun, G.J.; Sidarta, D. The Yogyakarta Earthquake of May 27, 2006; University of Illinois at Urbana-Champaign: Champaign, IL, USA, 2007. [Google Scholar]
  26. Statistics Indonesia. Bantul in Figures, 2017; Statistics Indonesia: Yogyakarta, Indonesia, 2017.
  27. Roumelioti, Z.; Kiratzi, A.; Margaris, B.; Chatzipetros, A. Simulation of strong ground motion on near-fault rock outcrop for engineering purposes: The case of the city of Xanthi (Northern Greece). Bull. Earthq. Eng. 2016, 15, 25–49. [Google Scholar] [CrossRef]
  28. Bronto, S.; Mulyaningsih, S.; Hartono, G.; Astuti, B. Gunung api purba Watuadeg: Sumber erupsi dan posisi stratigrafi. Indones. J. Geosci. 2008, 3, 117–128. [Google Scholar] [CrossRef]
  29. Mulyaningsih, S.; Husadani, Y.; Umboro, P.; Sanyoto, S.; Purnawati, D. Aktivitas vulkanisme eksplosif penghasil Formasi Semilir bagian bawah di daerah Jetis Imogiri. Jurnal Teknologi Technoscientia 2011, 4, 64–78. [Google Scholar]
  30. Pandita, H.; Sukartono, S.; Isjudarto, A. Geological identification of seismic source at Opak Fault based on stratigraphic sections of Southern Mountains. Forum Geogr. 2016, 31, 77–85. [Google Scholar] [CrossRef]
  31. Tiren, S. Lineament Interpretation, Short Review and Methodology. In Swedish Radiation Safety Methology; Swedish Radiation Safety Authority: Stockholm, Sweden, 2010. [Google Scholar]
  32. Hobbs, W. Lineaments of the Atlantic border regions. Geol. Soc. Am. Bull. 1911, 22, 123–176. [Google Scholar] [CrossRef]
  33. Eslami, A.; Ghaderi, M.; Rajendran, S.; Pour, A.B.; Hashim, M. Integration of ASTER and Landsat TM remote sensing data for chromite prospecting and lithological mapping in Neyritz Ophiolite zone, South Iran. Reosur. Geol. 2015, 65, 375–388. [Google Scholar] [CrossRef]
  34. Pornamdari, M.; Hashim, M.; Pour, A.B. Application of ASTER and Landsat TM data for geological mapping of Esfandagheh Ophiolite Complex, Southern Iran. Resour. Geol. 2014, 64, 233–246. [Google Scholar] [CrossRef]
  35. Yazdi, M.; Sadati, N.; Matkan, A.A.; Ashoorloo, D. Application of remote sensing in monitoring of faults. Int. J. Environ. Resour. 2011, 5, 457–468. [Google Scholar]
  36. Saintot, A.; Angelier, J.; Chorowicz, J. Tectonic paleostress fields and structural evelution of the NW-Caucasus fold-and-thrust belt from Late Cretaceous to Quaternary. Tectonicphysics 2011, 5, 457–468. [Google Scholar]
  37. Gannouni, S.; Gabtni, H. Structural interpretation of lineaments by satellite image processing (Landsat TM) in the region of Zahret Medien (Northern Tunisia). J. Geogr. Inf. Syst. 2015, 7, 119–127. [Google Scholar] [CrossRef]
  38. Lloyd, J.W. Water Resources of Hard Rock Aquifers in Arid and Semi-Arid Zones; United Nations Educational, Scientific and Cultural Organization (UNESCO): Paris, France, 1999. [Google Scholar]
  39. Bemis, S.; Micklethwaite, S.; Turner, D.; James, M.; Akciz, S.; Thiele, S.T.; Bangash, H.A. Ground-based and UAV-based photogrammetry: A multi-scale, high-resolution mapping tool for structural geology and Palersismology. J. Struct. Geol. 2014, 69, 163–178. [Google Scholar] [CrossRef]
  40. Yusliandi, A.; Hartono, H.G.; Bernadeta, S. Studi genesis co-ignimbrite daerah Pasekan dan sekitarnya, Kecamatan Eromoko, Kabupaten Wonogiri, Provinsi Jawa Tengah. In Proceedings of the Seminar Nasional Ke 8: Rekayasa Teknologi Industri dan Informasi, Yogyakarta, Indonesia, 23–24 October 2013; pp. 32–36. [Google Scholar]
  41. Jaroszewski, W. Fault and Fold Tectonics. Kirk, W., Ed.; E. Horwood: New York, NY, USA, 1984. [Google Scholar]
  42. Branney, M.J.; Kokelaar, P. Pyroclastic Density Currents and the Sedimentation of Ignimbrites; The Geological Society: London, UK, 2002. [Google Scholar]
  43. Nichols, G. Sedimentary and Stratigraphy, 2nd ed.; A John Wiley and Sons, Ltd., Publication: West Sussex, UK, 2009. [Google Scholar]
  44. Sanjoto, S. Pengaruh Komposisi Terhadap Kualitas dan Pengaruh Struktur Geologi Terhadap Breksi Pumice Formasi Semilir Sebagai Bahan Bangunan Interior Daerah Bawuran Kecamatan Pleret, Kabupaten Bantul, Yogyakarta. Master’s Thesis, Universitas Gadjah Mada, Yogyakarta, Indonesia, 2004. [Google Scholar]
  45. Fisher, R.V. Models for pyroclastic surges and pyroclastic flows. J. Volcanol. Geotherm. Res. 1979, 6, 305–318. [Google Scholar] [CrossRef]
  46. Winarti; Hartono, H.G. Ancient volcanic rocks identification in the western part of Yogyakarta southern mountains based on geoelectrical measurement. Eksplorium 2015, 36, 57–70. [Google Scholar]
  47. Saputra, A.; Rahardianto, T.; Revindo, M.D.; Delikostidis, I.; Hadmoko, D.S.; Sartohadi, J.; Gomez, C. Seiemic vulnerability assessment of residential buildings using logistic regression and geographic information system (GIS) in Pleret Sub District (Yogyakarta, Indonesia). Geoenviron. Disaster 2017, 4, 11. [Google Scholar] [CrossRef]
Figure 1. The location of study area.
Geosciences 08 00132 g001
Figure 2. (Top) The elevation of Java, Source: SRTM USGS (https://earthexplorer.usgs.gov/); (Bottom) Physiographic of Java Islands (modified from [3]).
Geosciences 08 00132 g002
Figure 3. Fault configuration of Java (modified from [4]).
Geosciences 08 00132 g003
Figure 4. The normal fault of Opak Fault (modified from [5]) (top left); Strike slip fault mechanism of Opak Fault (modified from [6]) (top right); the sinistral fault of Opak Fault (modified from [7] (bottom).
Geosciences 08 00132 g004
Figure 5. New building which was built close to fault zone in Srumbung Village.
Geosciences 08 00132 g005
Figure 6. Pre-fieldwork framework.
Geosciences 08 00132 g006
Figure 7. Stereoscopies images in structure from motion (SfM).
Geosciences 08 00132 g007
Figure 8. General framework of outcrop studies.
Geosciences 08 00132 g008
Figure 9. The lithological characteristics based on the Landsat 8 image, colour composite (RGB) 567.
Geosciences 08 00132 g009
Figure 10. The improved geological map (top left), the geology map of Yogyakarta (top right), source: systematic geological map of Java, sheet Yogyakarta 1408-2 & 1407-5, scale 1:100,000, Edition 2, 1995. And the improved lithological units (bottom).
Geosciences 08 00132 g010
Figure 11. Documentation of lithological observation in the field (the numbers of the picture refer to the improved geological map Figure 11 Top left).
Geosciences 08 00132 g011
Figure 12. Lineament identification, (A) Lineament interpretation based on ASTER DEM; (B) Lineament interpretation based on the Landsat 8.
Geosciences 08 00132 g012
Figure 13. Opak River and Baturagung Escarpment lineament.
Geosciences 08 00132 g013
Figure 14. Lineament map of study area.
Geosciences 08 00132 g014
Figure 15. (A) Strike and dip map; (B) Cross sectional view of profile A–B; (C) Illustration of contraction effect and anticlinal formation in the folded hill between Opak Fault and Baturagung Escarpment.
Geosciences 08 00132 g015
Figure 16. Outcrops classification.
Geosciences 08 00132 g016
Figure 17. (A) Fault displacement in the outcrop 17 segment 3; (B) displacement in outcrop 26 segment 1; (C) Fault displacement in outcrop 56.
Geosciences 08 00132 g017
Figure 18. The outcrop 73.
Geosciences 08 00132 g018
Figure 19. The fault evidence on the outcrop 65 segment 2 (picture no. 2).
Geosciences 08 00132 g019
Figure 20. Fault evidence on the outcrop 66 (Tebing Breksi), Prambanan, Central Java.
Geosciences 08 00132 g020
Figure 21. The outcrop reconstruction in the northeast part of the study area.
Geosciences 08 00132 g021
Figure 22. The horizontal distribution model of pyroclastic density current in study area.
Geosciences 08 00132 g022
Table 1. The comparison of the used survey equipment for outcrop study.
EquipmentAccuracyTime ConsumeCostSpecific SkillsOutcrop StudyReference
Total Station20 mmRapid (100 location per hour)Very expensiveYes√ √ √[9,15]
TLS-LIDAR6 mmVery rapid (50,000 points per second)Very expensiveYes√ √ √ √[9]
dGPS1–2 mRapidExpensiveNo√ √[9,17]
SfM (photogrammetry)0.25 mmoderateLowNo√ √ √ √[9,10,15]; [18,19,20]
Table 2. The summary of the data used in the study.
Type of dataLandsat 8
Geosciences 08 00132 i001
Quickbird
Geosciences 08 00132 i002
Outcrop
Geosciences 08 00132 i003
ScaleGeosciences 08 00132 i004zoom
30 m2.44 m (colour); 61 cm (panchromatic)-
Acquired10 March 201520122015–2016
Pre-processLayer stacking Geometric correction composite (RGB) 457Geometric correction composite (RGB) 123-
ProcessingVisual interpretation (lineament)Visual interpretation (outcrops and lineament)Structure from motion (SfM) and the outcrop characterisation
ResultsLineamentOutcrop location and lineament3d surface of outcrops, sedimentary log of outcrop, fault displacement
SourceUSGS dataRemote sensing and geographic information system laboratory, Geography Faculty, Universitas Muhammadiyah SurakartaFieldwork
Table 3. Fault evidence and their displacement in study area.
OutcropFault DirectionDisplacement (m)
1a segment 11350.78
2 segment 11350.19
2 segment 11350.08
2 segment 41451.41
550.05
7 segment 11300.14
9 segment 21270.24
11 segment 11280.34
10 segment 11260.11
15 segment 31450.47
16200.05
17 segment 3350.17
17 segment 31700.28
17 segment 31472.39
18 segment 3300.18
18 segment 41320.20
18 segment 4b700.12
191300.06
211600.07
24 segment 2980.23
251651.99
26 segment 11400.36
26 segment 11400.42
26 segment 2200.10
27 segment 21280.00
32700.03
34300.06
37250.12
401750.21
561130.76
Table 4. The measurement result of several object (layer thickness, outcrop’s height, or fault offset) based on the SfM model and field observation.
No.SfM (m)Field Measurement (m)Object
10.200.28layer 2, Outcrop 1a sg 1
20.830.85offset, Outcrop 1 sg 2
32.002.45Layer 2, Outcrop 2 sg 1
40.110.20Top soil, Outcrop 2 sg 2
50.330.30scale, outcrop 2 sg 2
60.080.15scale, outcrop 2 sg 4b
70.901.60layer 1, outcrop 3 sg 2
80.100.30layer 2, outcrop 4
90.120.19top soil, Outcrop 5
100.420.56top soil, Outcrop 6
115.835.35outcrop 7
121.942.10layer 1, outcrop 8
131.852.00Layer 3, Outcrop 9 sg 2
140.310.30scale, outcrop 10 sg 1
150.270.30layer 1, outcrop 11
160.160.15scale, outcrop 12
172.502.34layer 1, outcrop 13
1811.3812.04layer 1, outcrop 14
191.761.50Outcrop 15 sg 2
200.080.07Outcrop 16
211.861.70Outcrop 17 sg 3
220.090.11Outcrop 18 sg 2
230.450.28Outcrop 18 sg 6
240.070.13Outcrop 18 sg 7a
250.710.93Outcrop 18 sg 8
260.380.45Outcrop 18 sg 9
270.880.75Outcrop 19
280.330.25Outcrop 20
290.560.95Outcrop 21
300.920.78Outcrop 22
310.410.30Outcrop 23
320.580.60Outcrop 24 sg 2
330.340.32Outcrop 25
340.310.30Outcrop 26 sg 1
350.340.32Outcrop 27
360.360.32Outcrop 28
372.742.33Outcrop 29
381.071.00Outcrop 30
390.110.12Outcrop 31
400.560.53Outcrop 32
411.611.80Outcrop 33
421.501.20Outcrop 34
430.980.80Outcrop 35
443.462.78Outcrop 36
451.701.20Outcrop 37
4612.6713.43Outcrop 38 sg 1
470.100.10Boulder, Outcrop 38
480.170.15Outcrop 40
490.180.15Outcrop 41
501.702.00Outcrop 43
510.230.15Outcrop 44
522.301.95Outcrop 45
530.320.29Outcrop 48
540.360.30Outcrop 49
550.040.09Outcrop 53
560.720.56Outcrop 54
571.501.43Outcrop 56
583.252.75Outcrop 57 sg 1
590.050.07Outcrop 57 sg 2
600.320.30Outcrop 57 sg 5

