The Influence of Pre-Existing Deformation and Alteration Textures on Rock Strength, Failure Modes and Shear Strength Parameters

Economic Geology Research Centre (EGRU), James Cook University, Townsville QLD 4811, Australia
*
Author to whom correspondence should be addressed.
Geosciences 2018, 8(4), 124; https://doi.org/10.3390/geosciences8040124
Submission received: 7 December 2017
/
Revised: 21 March 2018
/
Accepted: 27 March 2018
/
Published: 5 April 2018
Abstract
:This study uses the uniaxial compressive strength (UCS), the indirect tensile strength (ITS) and the point load tests (PLT) to determine the strength and deformation behavior of previously deformed and altered tonalite and anorthosite. In general, veined samples show higher strength because the vein material has both cohesive and adhesive properties while fractures have no cohesion, only frictional resistance. This implies that each rock category has to be treated independently and absolute strength predictions are inaccurate. Thus, the conversion factor k is a sample specific parameter and does not have a universal value. The ratio of UCS/ITS appears to be related to the rock strength and can be used to classify rocks based on their strength. The shear strength parameters, the friction angle and the cohesion, cannot be calculated for rocks with pre-existing planes of weakness. Reactivation is favoured only for planes oriented less than 20° to the maximum stress. For planes oriented between 20° and 50° to the maximum stress, failure occurs by a combination of reactivation and newly formed fractures, while for orientations above 50°, new shear fractures are favoured. This suggest that the Byerlee’s law of reactivation operates exclusively for planes oriented ≤10° to the maximum stress.

1. Introduction
Rock strength and rock deformation mechanisms are important parameters for understanding not only geological processes in general but also for geohazards as well as geotechnical problems. For example, pluton emplacement and volcanism are structurally controlled so that magma [1] takes advantage of pre-existing structures [2,3] to migrate through the crust. That leads to redistribution of heat within the crust, which, in turn, affects the deformation behavior of the rock [4,5]. Furthermore, localization of deformation [6,7] into fault zones has been used to explain fluid flow at crustal scale levels that can lead to redistribution and/or concentration of elements and eventually, to the formation of ore deposits [8,9]. It is particularly worth noting that there is a tendency for older structures to get reactivated during younger deformation events, which leads to prolonged tectonic activity along the same structures [10,11]. This has been observed along active seismic zones with the occurrence of earthquakes preferentially occurring along pre-existing fault zones [12].
Many civil engineering and construction projects involve the control of the mechanical behavior of host rocks to ensure the stability of construction [13]. To control the host rocks, many underground mine operations use reinforcements, such as roof bolting and pillars [14]. Knowing the rock strength parameters is essential for ensuring the reinforcements are applicable and the design is appropriate [15]. Understanding the structural capability of the rock and how it may fail is fundamental, especially when the rock mass has pre-existing flaws. Many cases when rock has failed in the mining industry have been due to toppling failure in rock slopes [16]. This type of failure is commonly induced when the rock mass is heavily fractured, and the rock is overturned due to its own weight. Therefore, it is essential to classify rock materials based on their strength to determine the appropriate method and design approach for underground structures, such as dam walls, mine slope design and tunnel infrastructure [17].
To predict conditions under which solid materials may fail under the action of external loads, the Mohr–Coulomb failure criterion is the most widely used because of its simplicity and wide applicability. The application of the Mohr–Coulomb failure criteria requires knowledge of a series of strength parameters [15]. These are the cohesive strength, the angle of internal friction and the compressive strength. These parameters are normally determined by triaxial and shear box experiments [18,19]. However, uniaxial compressive strength (UCS), indirect tensile strength (ITS) and the point load test (PLT) tests can also be used to determine rock strength properties. The testing procedure for PLT and ITS implies that tensile failure occurs between the opposing loads [20]. Thus, the magnitude of the applied load at the instant of failure is related to both the tensile strength and the uniaxial compressive strength. Because PLT and ITS are easier and quicker to perform compared to the UCS, many authors have tried to relate the PLT and ITS to UCS [21,22,23]. Experiments performed on a large variety of intact rock types have shown that indeed tensile strength can be correlated to the UCS by a conversion factor, k [22,23,24]. However, conversion factor k is non-unique (varies between 8 and 30 for PLS to UCS conversions and between 2.7 and 50 for the ITS to UCS conversion) and depends on the degree of anisotropy of the rocks [25,26]. The most important factor controlling the strength of an anisotropic rock is the pre-existence of weakness planes due to previous deformation [27,28,29]. For example, the orientation of pre-existing foliation to maximum principal stress can control whether the failure plane is exploiting pre-existing foliation (reducing the rock strength) or forming new shear fractures [27]. Fractures also have the ability to influence the rock strength [28,29] even if they are inclined at a less favourable orientation to the maximum principal stress. During loading, new fractures form adjacent to the pre-existing fractures and either propagate or coalesce with surrounding fractures, causing a shear softening effect [30], decreasing the uniaxial compressive strength dramatically. The influence of veins [29] on rock strength has not been extensively studied. However, the process of infilling a fracture, called grouting, has proven successful for improving the mechanical properties of rock samples. This process simply transfers stress and reduces concentrations of stress, delaying failure and therefore, increasing the strength of the sample [31]. Thus, filled fractures can increase the strength of a rock sample; therefore, we can expect to see an increase in strength in veined samples as opposed to the fractured samples. It is necessary to know how pre-existing textures directly influence the strength of rocks to truly understand rock failure. Deformed and altered rocks are common within the crust and can be a serious problem in rock engineering applications; they have many pre-existing planes of weakness (macro and micro structures) that can easily be re-activated when subjected to an external load. The aim of this study is to apply existing empirical and quantifiable methods used for intact rocks to deformed and altered rocks to understand their behavior under an applied load.
2. Materials and Methods
Samples were collected from drill cores coming from the core library of the engineering department at James Cook University (Townsville, Australia). The drill cores originated from the Ernest Henry Cu–Au mine near Cloncurry in NW Queensland. The samples were variably altered and deformed. Care was taken to select the same rock types but with different degrees of alteration and deformation. The least altered and deformed samples from each rock type were selected based on visual inspection and used as the reference samples. Based on their grain sizes and compositions, the reference samples were determined to belong to two main rock types (Figure 1A,B). These were coarse-grained (>5 mm diameter) tonalite (Figure 2A) and medium-grained (<5 mm diameter) anorthosite (Figure 2B). All samples were subsequently classified based on their alteration and deformation style. Their alteration and pre-existing structure groups included alteration (no visible deformation), foliation, veins, fractures and breccia. Figure 1C shows a photograph of each pre-existing texture focused on in this study.
The altered samples (AL) generally had medium to large grain sizes, and the original textures were weakly to mostly preserved. Silicification alteration had overprinted the original phaneritic texture, with some later stage hydration and sulfidation alteration. The degree of this alteration varied across all specimens. The samples had minimal deformation features which were only visible under microscope. These were microfracture networks, weak foliation and carbonate veining. The degree of foliation (FO) varied between well and moderately developed samples with most samples showing well-developed foliation. The foliation bands were typically at millimeter scale and were due to compositional separation. The foliation varied from high to low angle to the longitudinal axis of the sample. Crosscutting the foliation were late stage carbonate and sulphide veins. The veins (VO) either occurred as a single vein along the longitudinal axis or followed the pre-existing foliation orientation. The composition of the dominant veins was carbonate, mainly calcite. The minor veins were actinolite and occurred with the calcite veins, each with multiple orientations. The fractured samples (FR) had medium-grained texture and their degree of fracturing was specimen dependent. The orientation of the fracture network was either multiple and single orientations. The breccia (BO) samples could be separated into clast-supported with polymictic clasts- and matrix-supported with monomictic clasts. The clast-supported breccia had poorly sorted, rounded clasts with cross cutting calcite veins. The matrix-supported breccia had calcite infill between the large clasts and was either matrix or clast-dominated, depending on the specimen. Table 1 summarizes all the pre-existing textures for each sample and shows the classification of the textures.
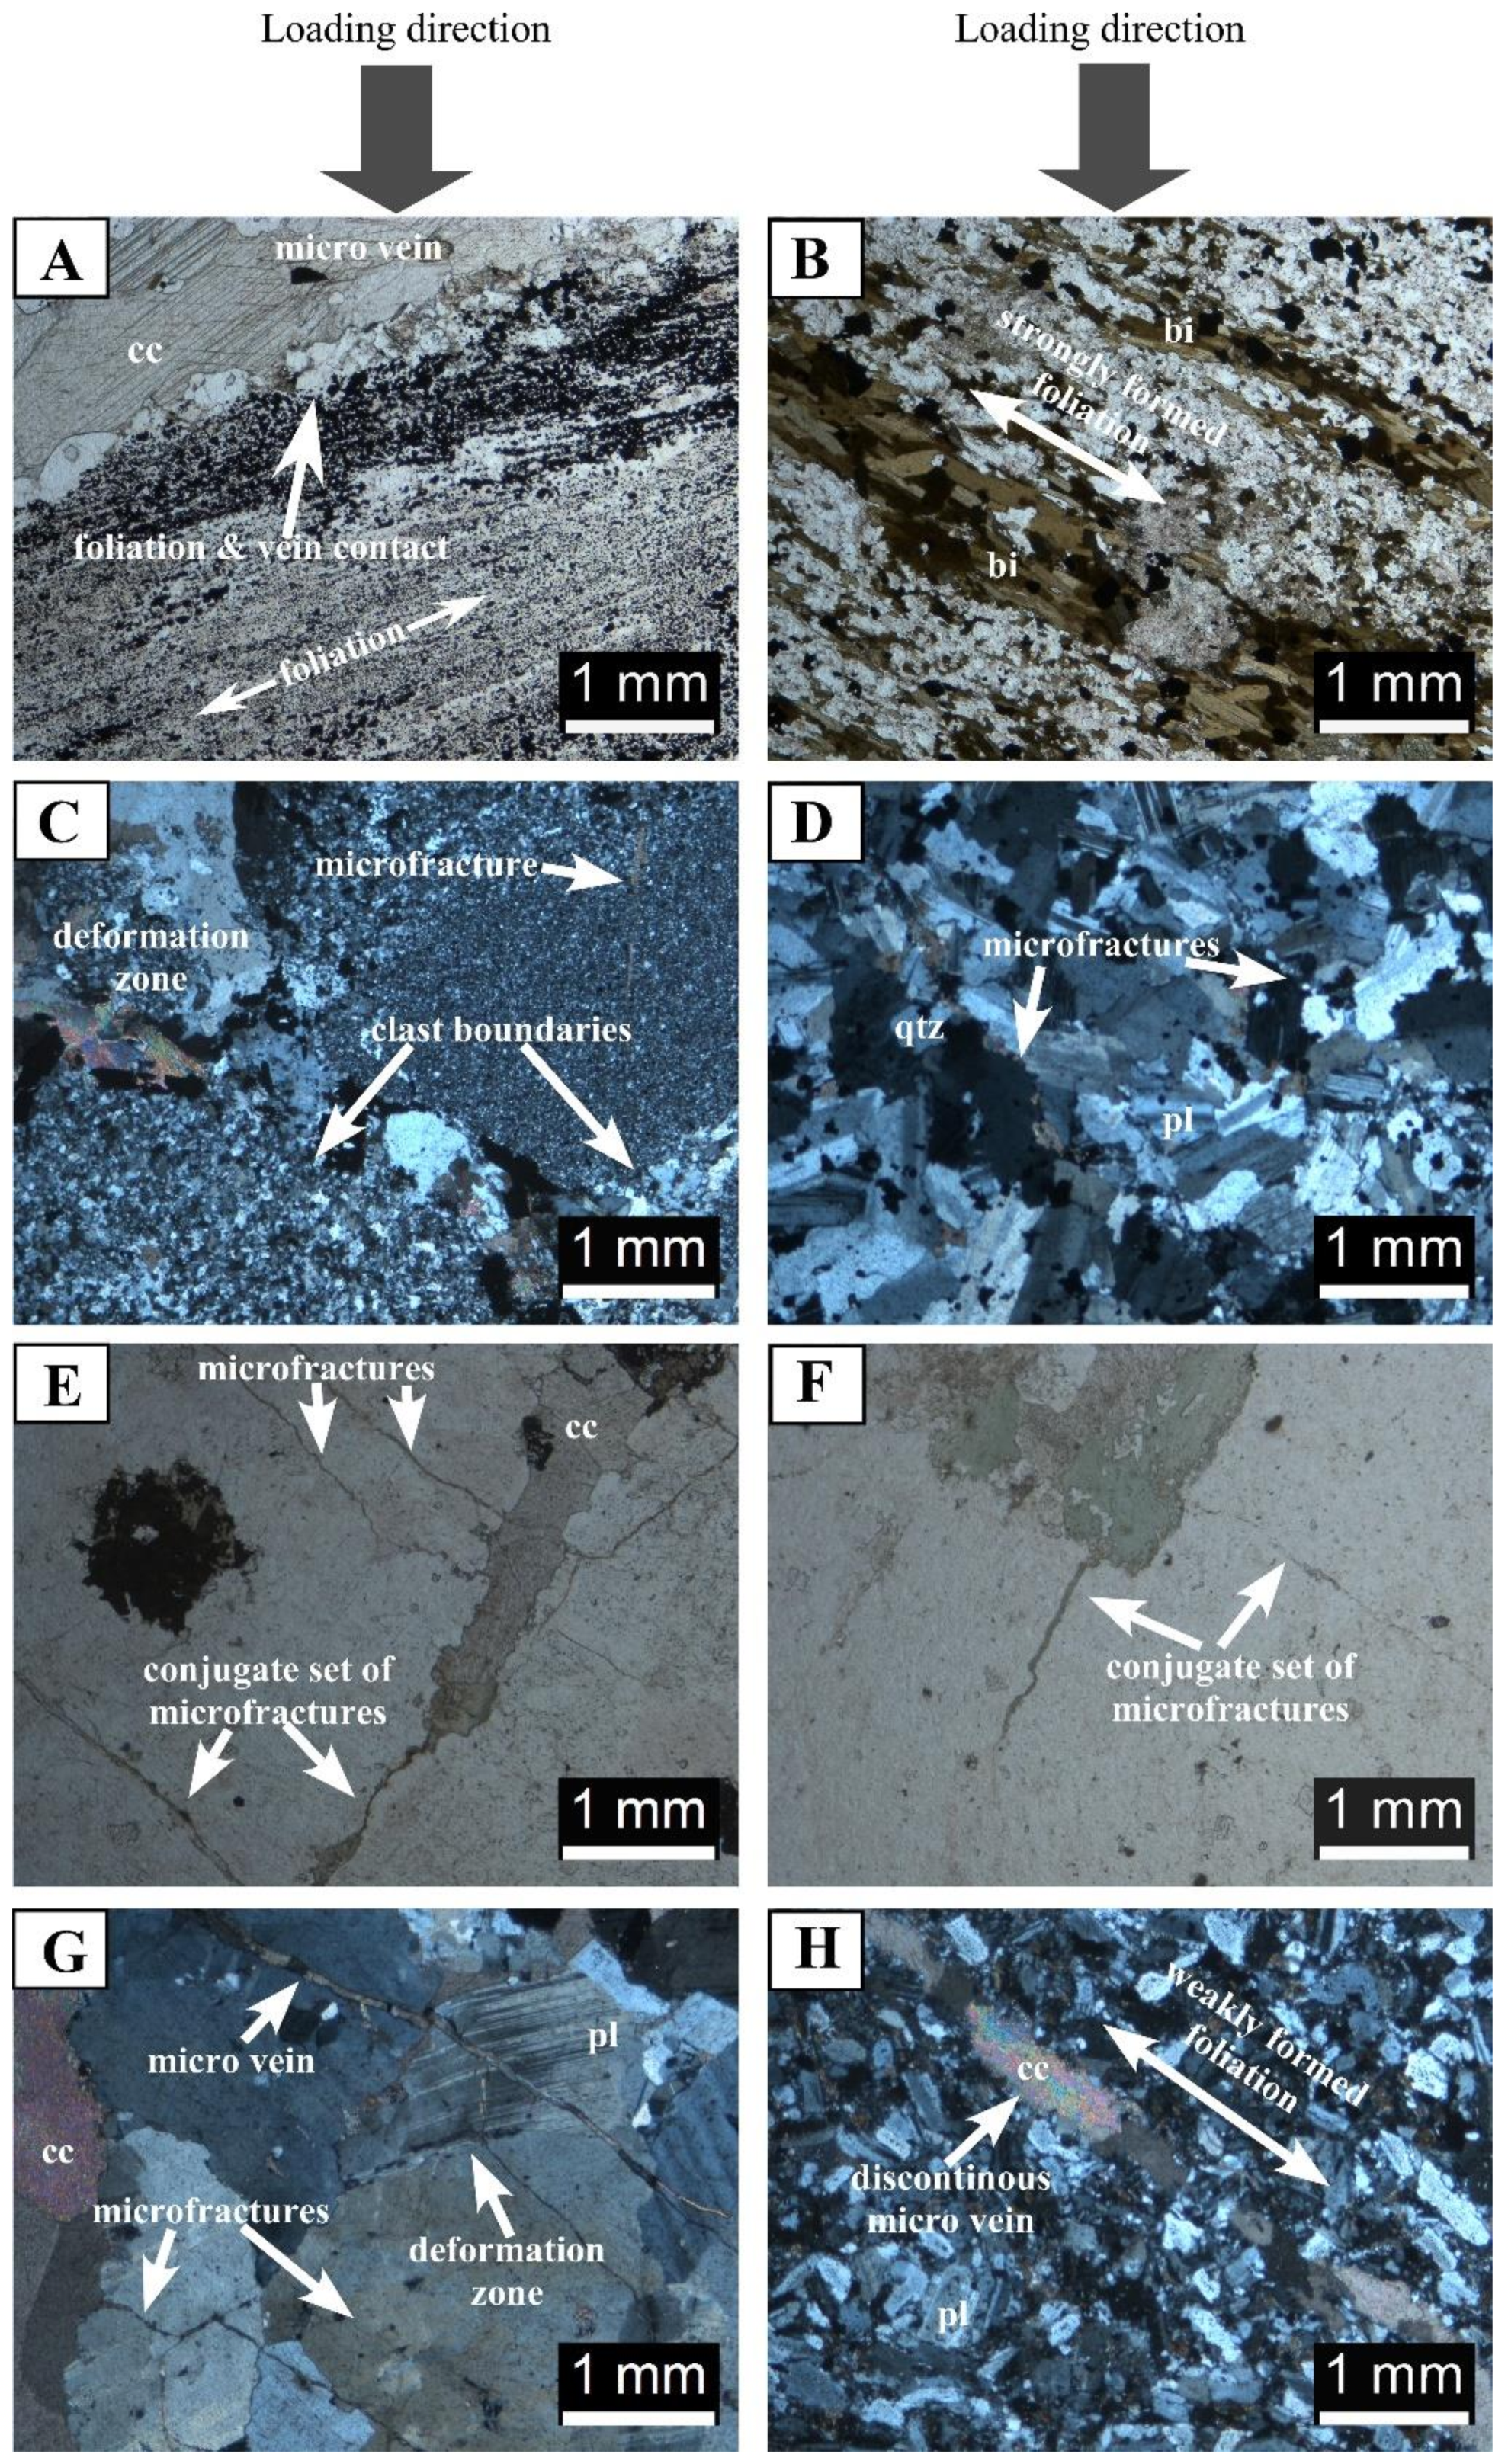
Thin section investigation of the studied samples was done with the purpose of identifying pre-existing weakness planes (fractures, veins, foliations) that could not be identified in hand samples and to confirm the rock types. The mineralogy of the samples was dominated by quartz and plagioclase, followed by biotite, calcite and, in a few samples, magnetite and sulphides. The primary tonalite and anorthosite were variably deformed and altered. The most prominent deformation feature was the development of a mylonitic foliation (Figure 2A,B), which resulted in significant grain size reduction, and the development of sub-parallel bands of quartz-plagioclase rich domains (Figure 2A) alternating with biotite rich domains (Figure 2B). Many samples had significant amounts of magnetite and sulphides precipitated along the foliation planes. Some of these samples had late calcite veins (Figure 2A) crosscutting the mylonitic foliation. The brecciated samples appeared undeformed in hand specimen. However, thin section study revealed that the matrix between the breccia clasts was deformed (Figure 2C) and had experienced grain size reduction and recrystallization forming narrow deformation zones. The breccia clasts were variably deformed and had altered tonalite and/or anorthosite clasts. Most of the tonalite and anorthosite samples had very thin fractures (Figure 2D–F) and/or veins that were not visible in hand specimens. Many of these micro-fractures formed conjugate sets (Figure 2E,F) without any displacement. There were also thin deformation zones between quartz and plagioclase grain boundaries (Figure 2G). Some of the calcite micro veins (Figure 2H) were discontinuous and aligned within a weakly defined foliation.
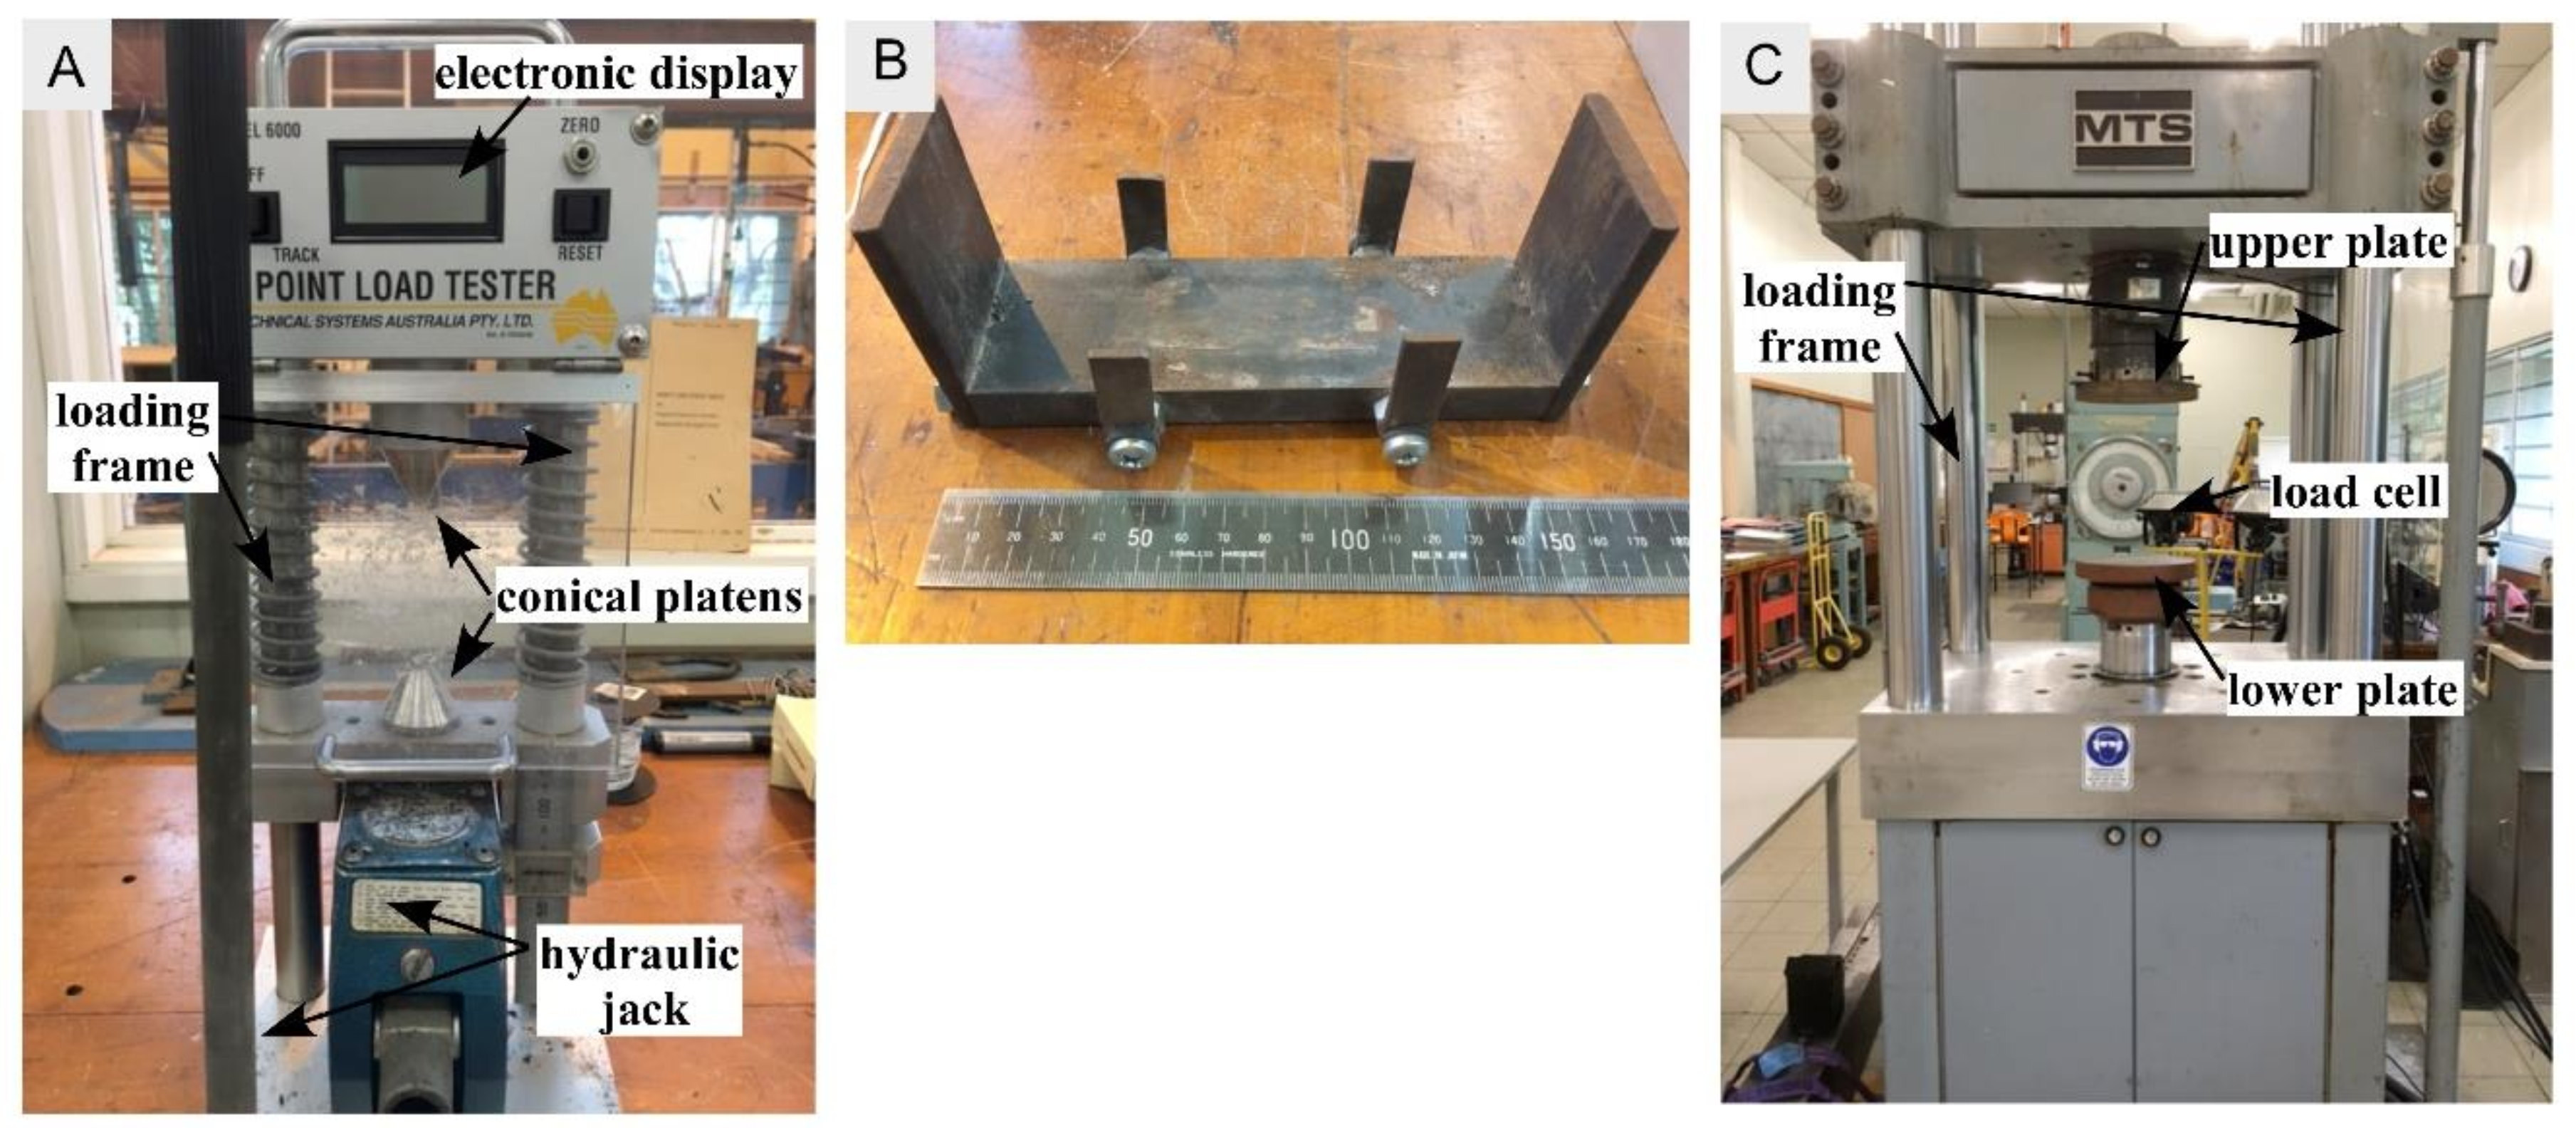
Three testing methods were conducted on specimens from each sample: the PLT, the ITS (also known as the Brazilian test) and the UCS. The results of these tests can be used to calculate the point load strength, the tensile strength and the compressive strength for each specimen. These quantities are the fundamental parameters that are used to assess rock strength. The cylindrical cores used for testing had diameters of 47 mm or 63 mm. All experiments were recorded with a GoPro Hero 4 camera (GoPro Inc., San Mateo, CA, USA) at a frame rate of 240 s−1. Sample preparation and experiments were conducted following the procedures outlined in the Australian Standard Testing Methods (ASTM) [32,33,34,35].
The PLT procedure is simple and extremely quick. The ASTM [35] requires that the length to diameter ratio for all tested samples is one to one. The test was carried out using the axial loading direction; this involved the cylindrical core being held between two conical ends perpendicular to the axial plane. The samples were held in the point load tester and the load was applied until failure occurred (Figure 3A). This test is extremely quick as failure usually occurs between 10–60 s. Every sample failure was video recorded and photographs were taken before and after failure for each sample.
For UCS according to the ASTM [33,34], the length to diameter ratio must be between 2 and 3. For all tested samples, the length to diameter ratio was 2.5. The UCS testing was conducted using an MTS (material testing) universal testing machine (Figure 3C). The samples were held in the MTS between the cells and were subjected to a fixed rate of stress of 17.17 kN/min. The samples usually reached failure within 5–15 min of applied stress. Every sample failure was video recorded, and photographs were taken before and after failure. These were used to observe the initiation and propagation of the developing fracture pattern from the applied stress.
The ITS procedure was a bit more laborious compared to the point load test and the UCS. The specimen sat in a handmade jig to stop the sample from rolling and had to be re-centered to the axis of the sample before every test (Figure 3B). According to the ASTM [36] recommendations, the diameter to length ratio must be 1, which makes all specimens have a disc like shape. The test was conducted using the MTS machine and was subjected to a fixed rate of stress at 17.17 kN/min (Figure 3C). The specimens reached failure within 10 min of applied stress. Every sample failure was video recorded, and photographs were taken before and after each experiment.
3. Results
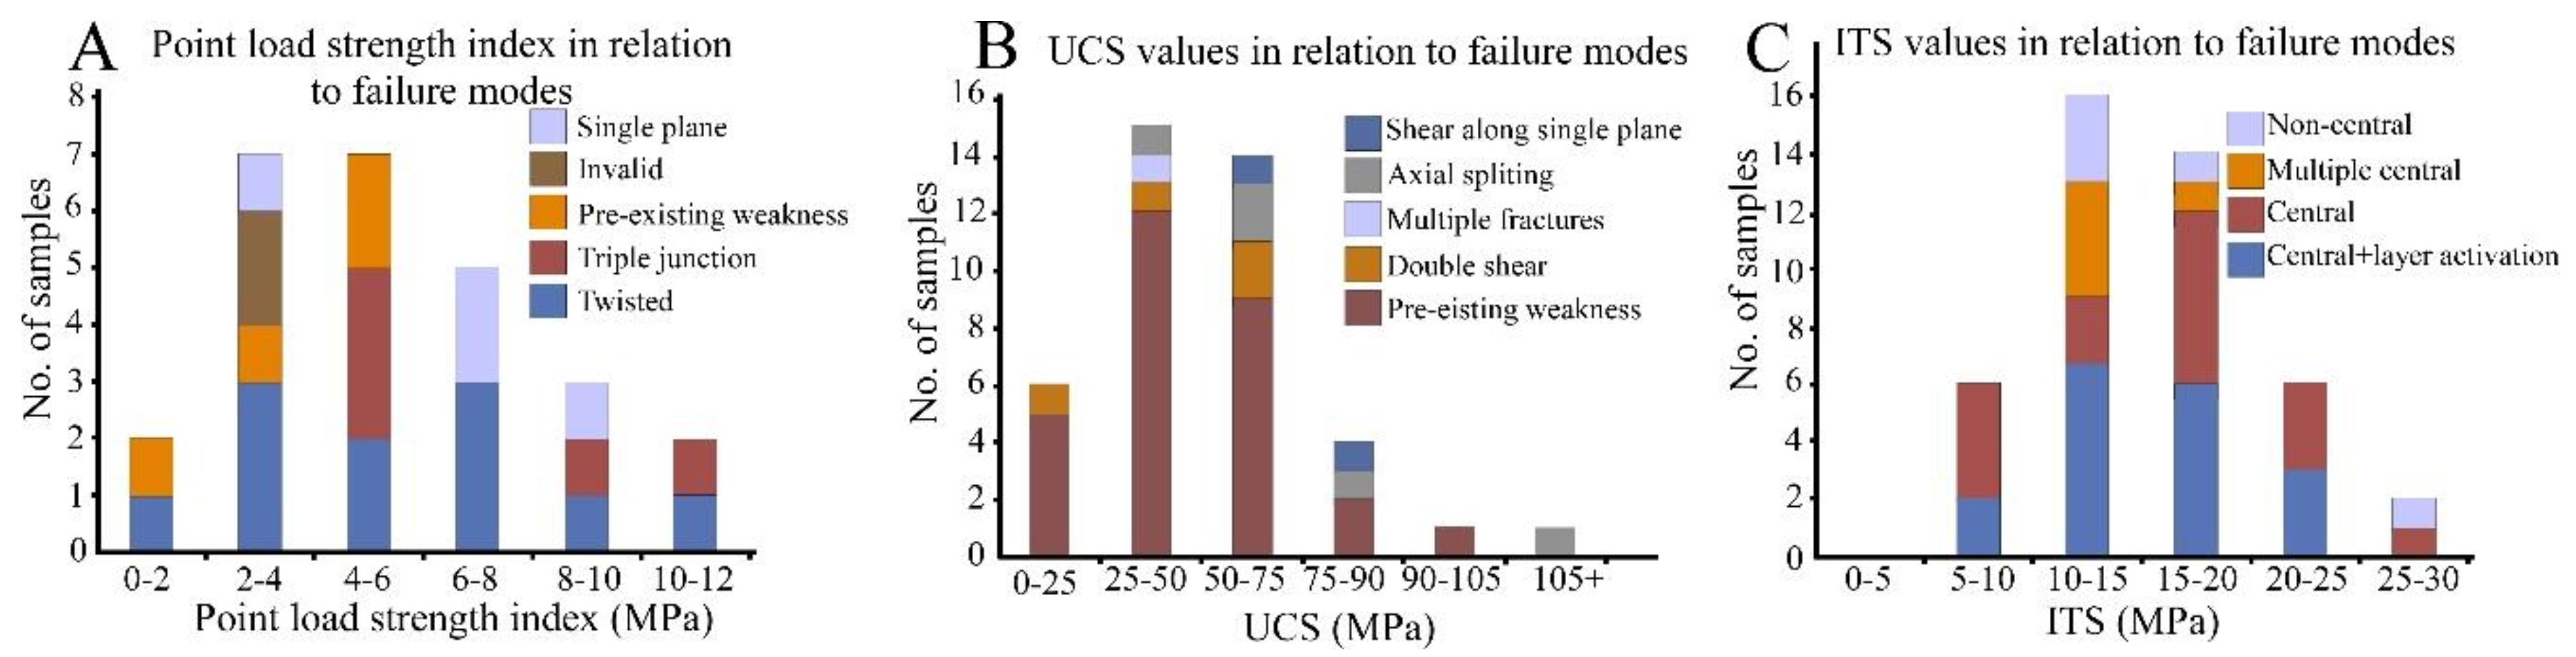
The three testing methods—UCS, ITS and PLT—were conducted on each specimen type. After each test, the samples were classified into a failure mode based on the fracture pattern (Figure 4, Figure 5 and Figure 6). Five different failure modes were identified for the PLT test (Table 2), five different failure modes were identified for the UCS test (Table 3), and four different failure modes were identified for the ITS test (Table 4) The failure mode and strength results for each test were correlated using bar charts (Figure 7). The bar charts show how the dominant failure mode changes with the increasing strength of a rock. The failure mode is therefore a characteristic of the amount of strain energy a rock can withstand. Young’s modulus was computed for each of the specimens and used with the UCS to further classify the samples’ strengths. This rock strength classification was used to determine how the textural differences between the samples could influence the strength of the rock.
3.1. Failure Modes
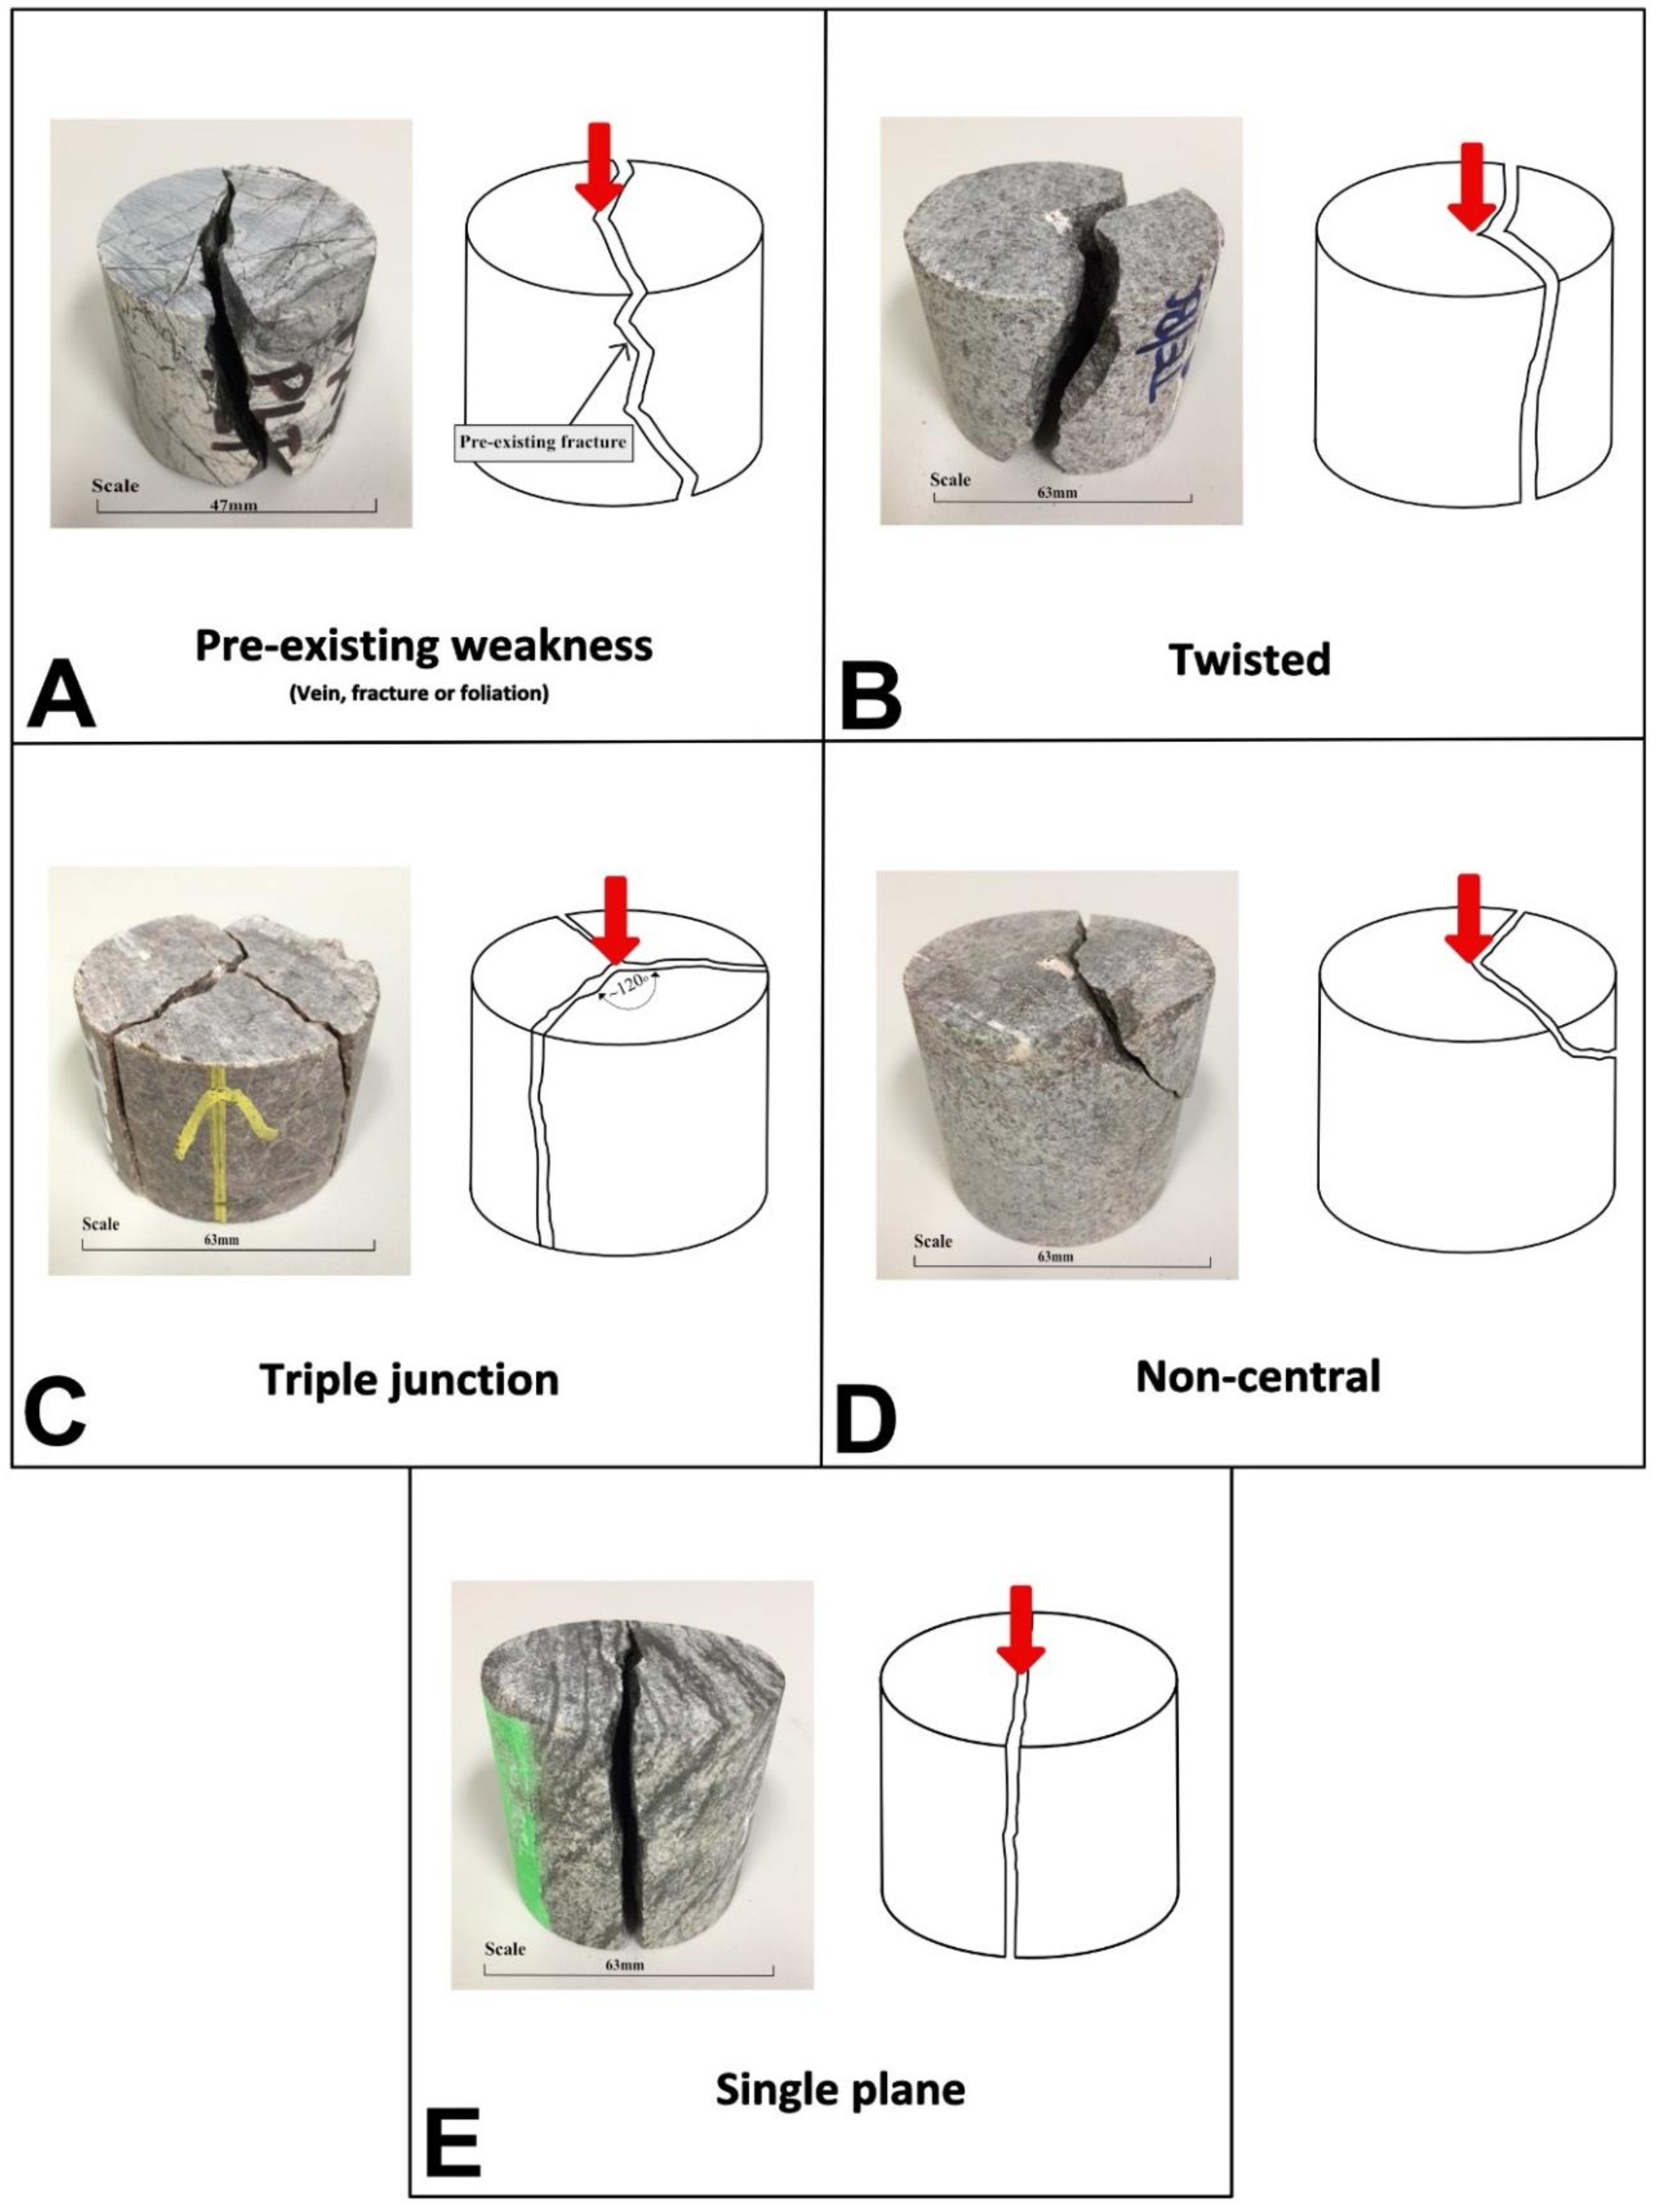
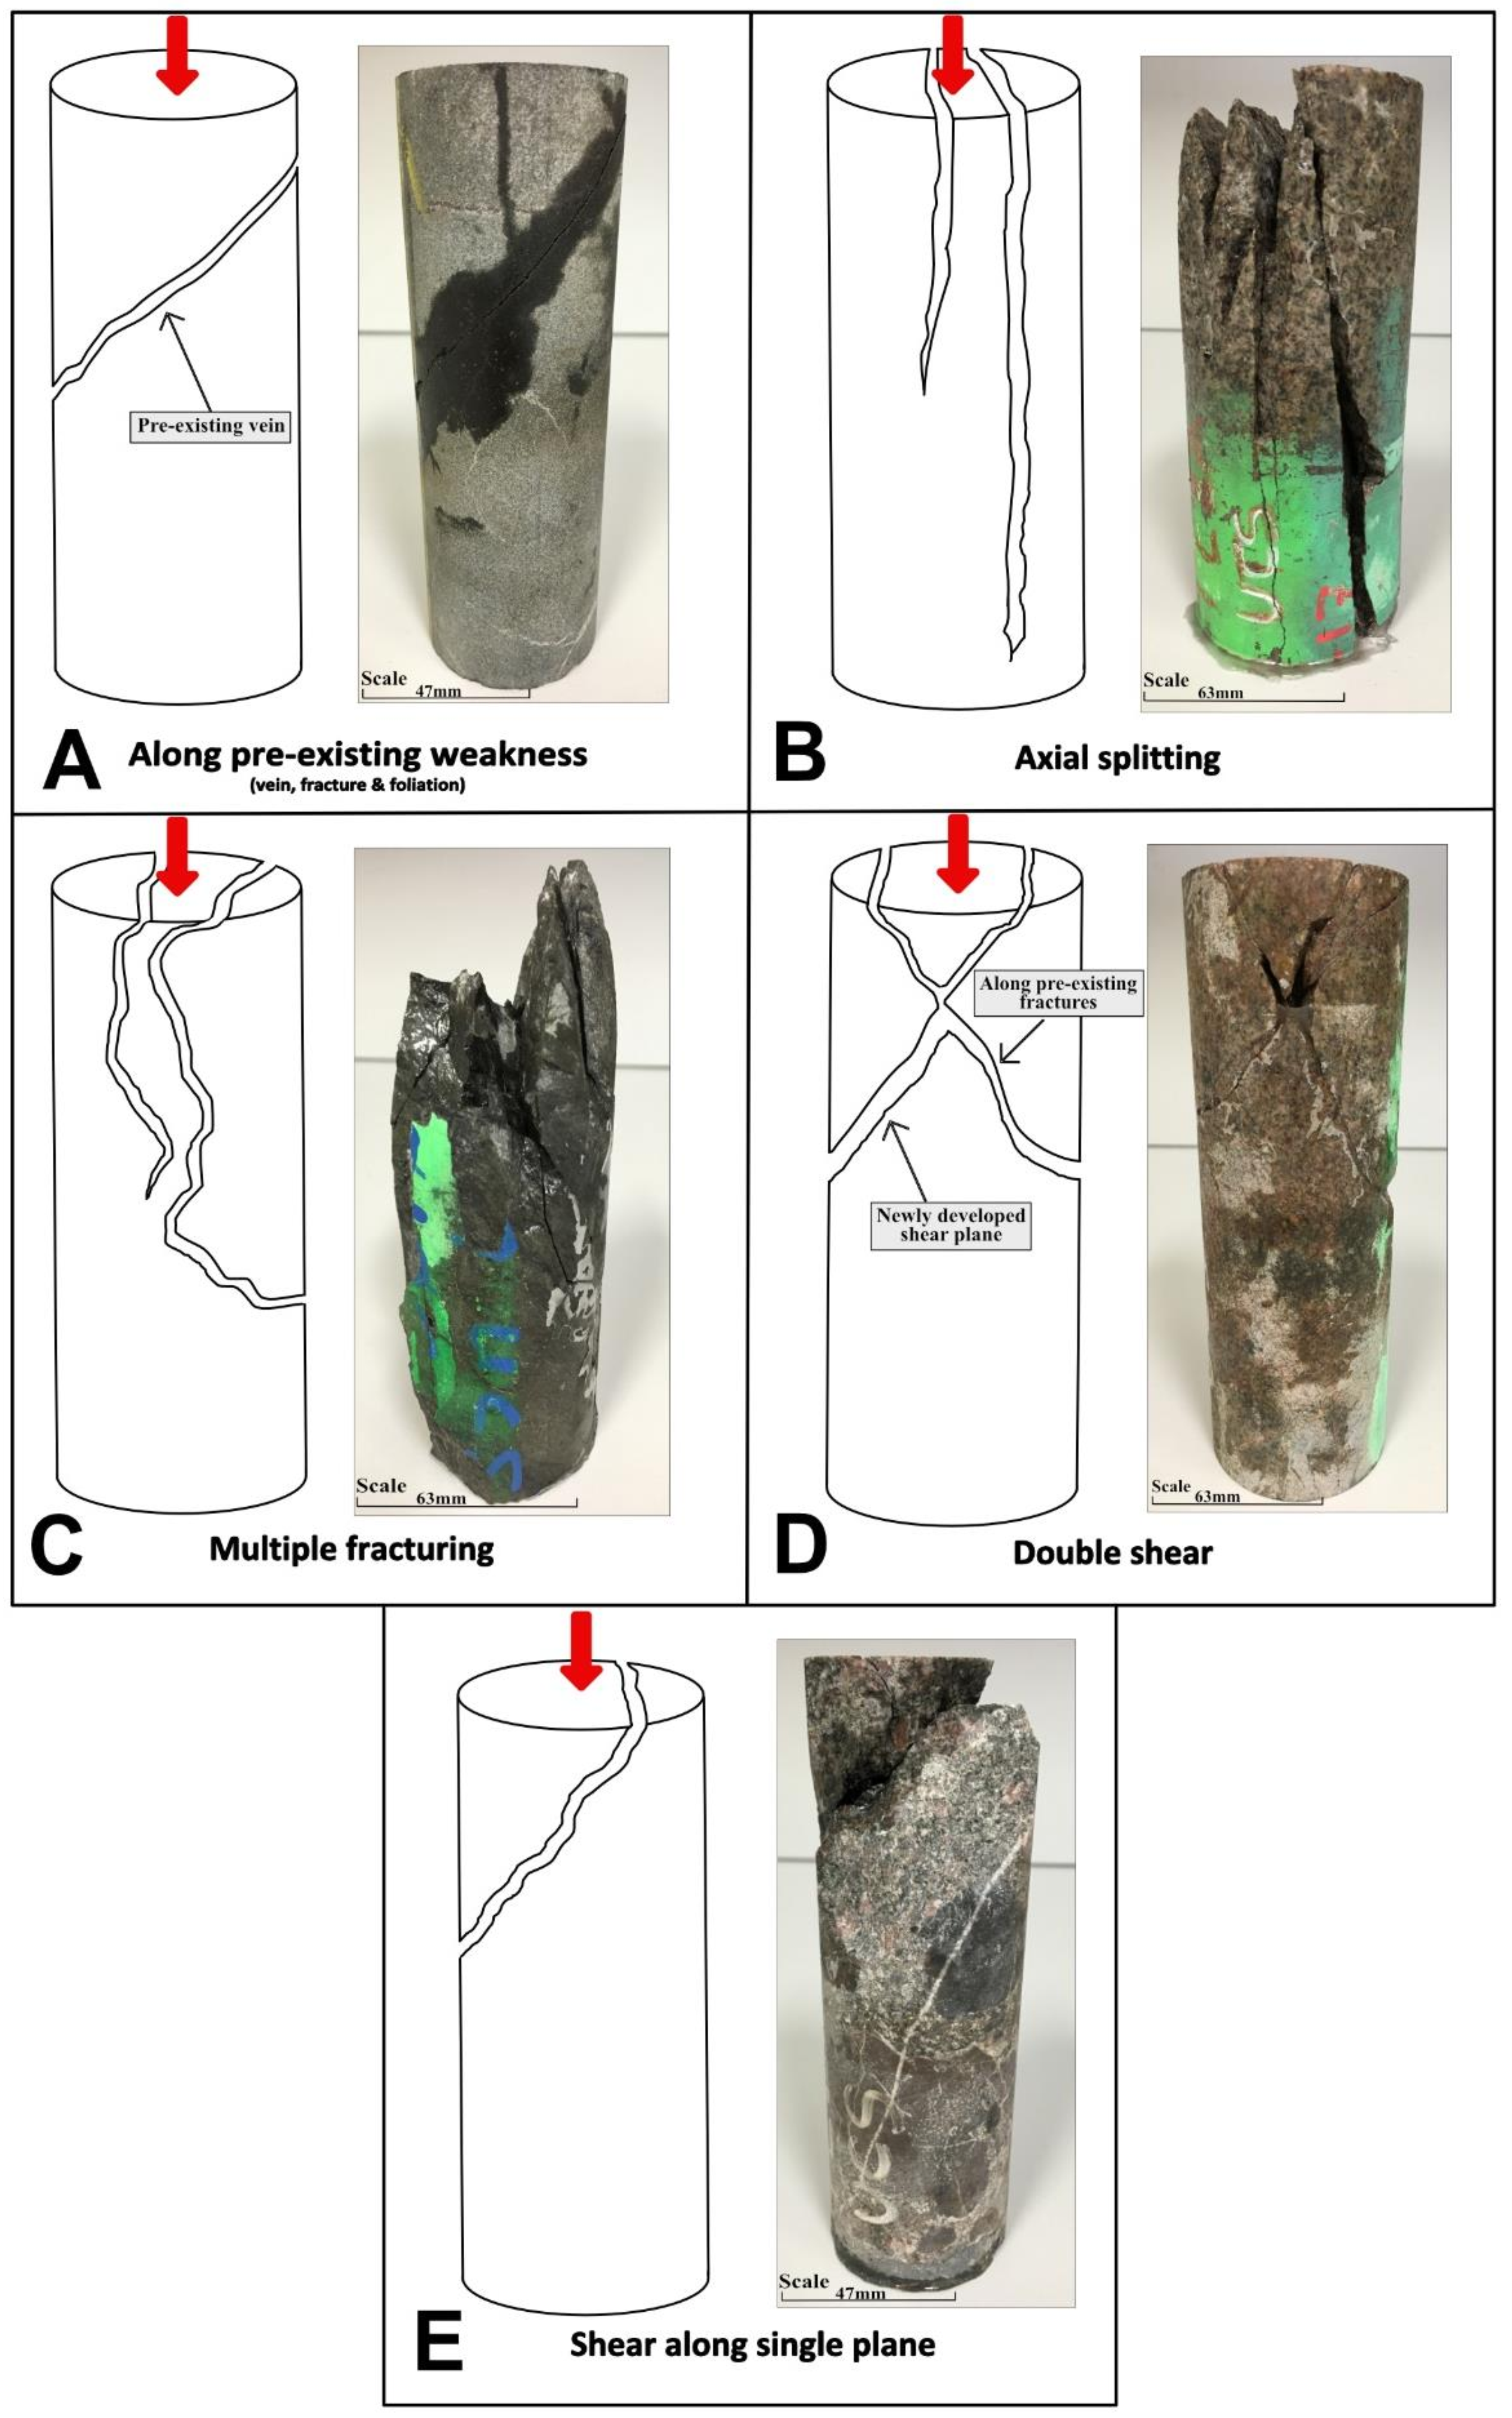
The failure modes in this study were based on [36]. The failure modes for UCS tests were failure along a pre-existing weaknesses (vein, fracture or foliation), axial splitting, multiple fracturing, double shear and shear along a single plane (Figure 5). The failure modes for ITS tests were central failure, central failures with layer activation, multiple central and non-central failure (Figure 6). The failure modes for the point load test were failure along a pre-existing weakness (vein, fracture or foliation), twisted, triple junction failure, non-central and single plane failure (Figure 4). For samples that failed in multiple modes, the dominant or the initial failure mode was used for classification. Slow motion video recordings of samples failure were used to determine the failure mode where the sample failure was too quick for normal observation.
3.1.1. Failure under Point Load
The most frequently encountered failure mode for the point load test was twisted (Table 2; Figure 7A). The fracture initiated in the central area where the load was applied and propagated away, along curved planes (Figure 4B), giving the failure plane a twisted nature. There were no clear indications that the fractures propagated along pre-existing weaknesses. When the failure occurred along a single shear fracture, it originated in the loading point and propagated laterally and across the pre-existing weaknesses. In the cases where samples failed along triple junctions, the fractures initiated at the loading point and propagated away in three different directions, forming angles oriented ~120° from each other (Figure 4C). At least one of the fractures followed pre-existing weaknesses, and at least one fracture appeared to be a newly formed fracture. For the two samples that experienced non-central failure mode, the fracture was initiated at the loading point and propagated across the sample at a low angle. This occurred along pre-existing veins that were oblique to the loading area. The samples that failed straight along pre-existing weaknesses developed a single shear plane that followed the geometry of the pre-existing weakness.
The failures of the samples occurred at relatively low applied stresses (Figure 7A). The twisted mode of failure covered the entire range of applied stresses, the triple junction mode of failure occurred only above 4 MPa, the failure along pre-existing weaknesses, and the non-central failure mode occurred only below 6 MPa, and the failure along a single plane occurred between 2 and 10 MPa.
3.1.2. Failure under Uniaxial Compressive Test
The majority of samples failed along pre-existing planes of weakness—that is, 29 samples out of the 40 samples tested (Table 3). Samples that failed by double-shear had a combination of failure modes—one failure plane propagated along pre-existing planes of weakness and one failure plane developed along a newly formed shear plane. In all situations, the failure was initiated along one of the pre-existing planes of weakness, and once the fracture propagated for ~1 cm, a new failure plane developed at a conjugate angle to the first one. The thin section study did not reveal any obvious micro-fracturing following the same orientation as the newly developed shear plane, indicating that most likely of these were newly formed shear planes. Alternatively, the scale of the micro-fracturing was less than the thin section scale. The sample that failed by multiple fracturing did not contain through-going fractures but rather, a network of micro-fractures and veins (visible under microscope; Figure 2H) that eventually controlled the rock failure. The fractures propagated from one micro-fracture to the next, resulting into a network of coalesced micro-fractures. The samples that failed by axial splitting had no visible pre-existing planes of weakness parallel to the long axis of the sample. Some samples had weakly developed micro-veins, foliation or fractures at high angle to the loading direction. However, these weakness planes were not reactivated and re-used during the sample failure. Two samples failed along a single plane of shear. Both samples were matrix-supported breccia. The shear plane cut across the clasts and did not follow the clast-matrix boundaries. The thin section study did not reveal many visible pre-existing fractures.
The UCS tests results (Figure 7B) show that samples failed under a wide range of compressive stresses. The majority of samples failed under a compressive stress of less than 75 MPa (Figure 7B). This was particularly obvious for the samples that failed along pre-existing planes of weakness and for samples that failed by double-shear as well as multiple fractures. The remaining samples failed at higher compressive stresses with only one sample failing at stresses above 100 MPa.
3.1.3. Failure under Indirect Tensile Test
The majority of samples failed along a central shear plane with only five samples failing along a non-central fracture (Table 4; Figure 7C). The pre-existing planes of weakness controlled the location of the failure plane for most samples. For example, the samples that failed along a single central shear plane had micro-fractures or veins oriented parallel to the failure plane. One of these weaknesses, located near the centre of the samples was reactivated and re-used during loading, thus controlling the location of the failure plane. The shear fracture propagated across the layering. For samples that failed due to central shear and layer activation, the fracture was initiated along one of the pre-existing weaknesses that were oriented parallel to the loading direction, and after propagating about halfway through the sample, it deviated along the layering at a high angle to the loading direction. The layering in all samples consisted of pre-existing veins or foliation planes. The samples that failed due to multiple central fractures were characterised by simultaneous reactivation of weakness planes oriented parallel to the loading direction. For some samples (Table 1), the pre-existing weakness planes were visible only under microscope. The few samples that developed non-central shear planes failed along pre-existing weaknesses that were sub-parallel to the loading direction band and did not have any visible fractures or micro-fractures parallel to the loading direction.
The ITS test results show that all samples failed under a narrow range of stresses—5 to 30 MPa—with the majority of samples failing between 10 and 20 MPa (Figure 7C). Samples that developed central or central plus layer activation shear planes failed under a similar range of stresses while the samples that developed multiple central shear fractures failed within a narrow range of stress. In general, the non-central failure mode appears to occur at higher stress levels.
3.2. Young’s Modulus
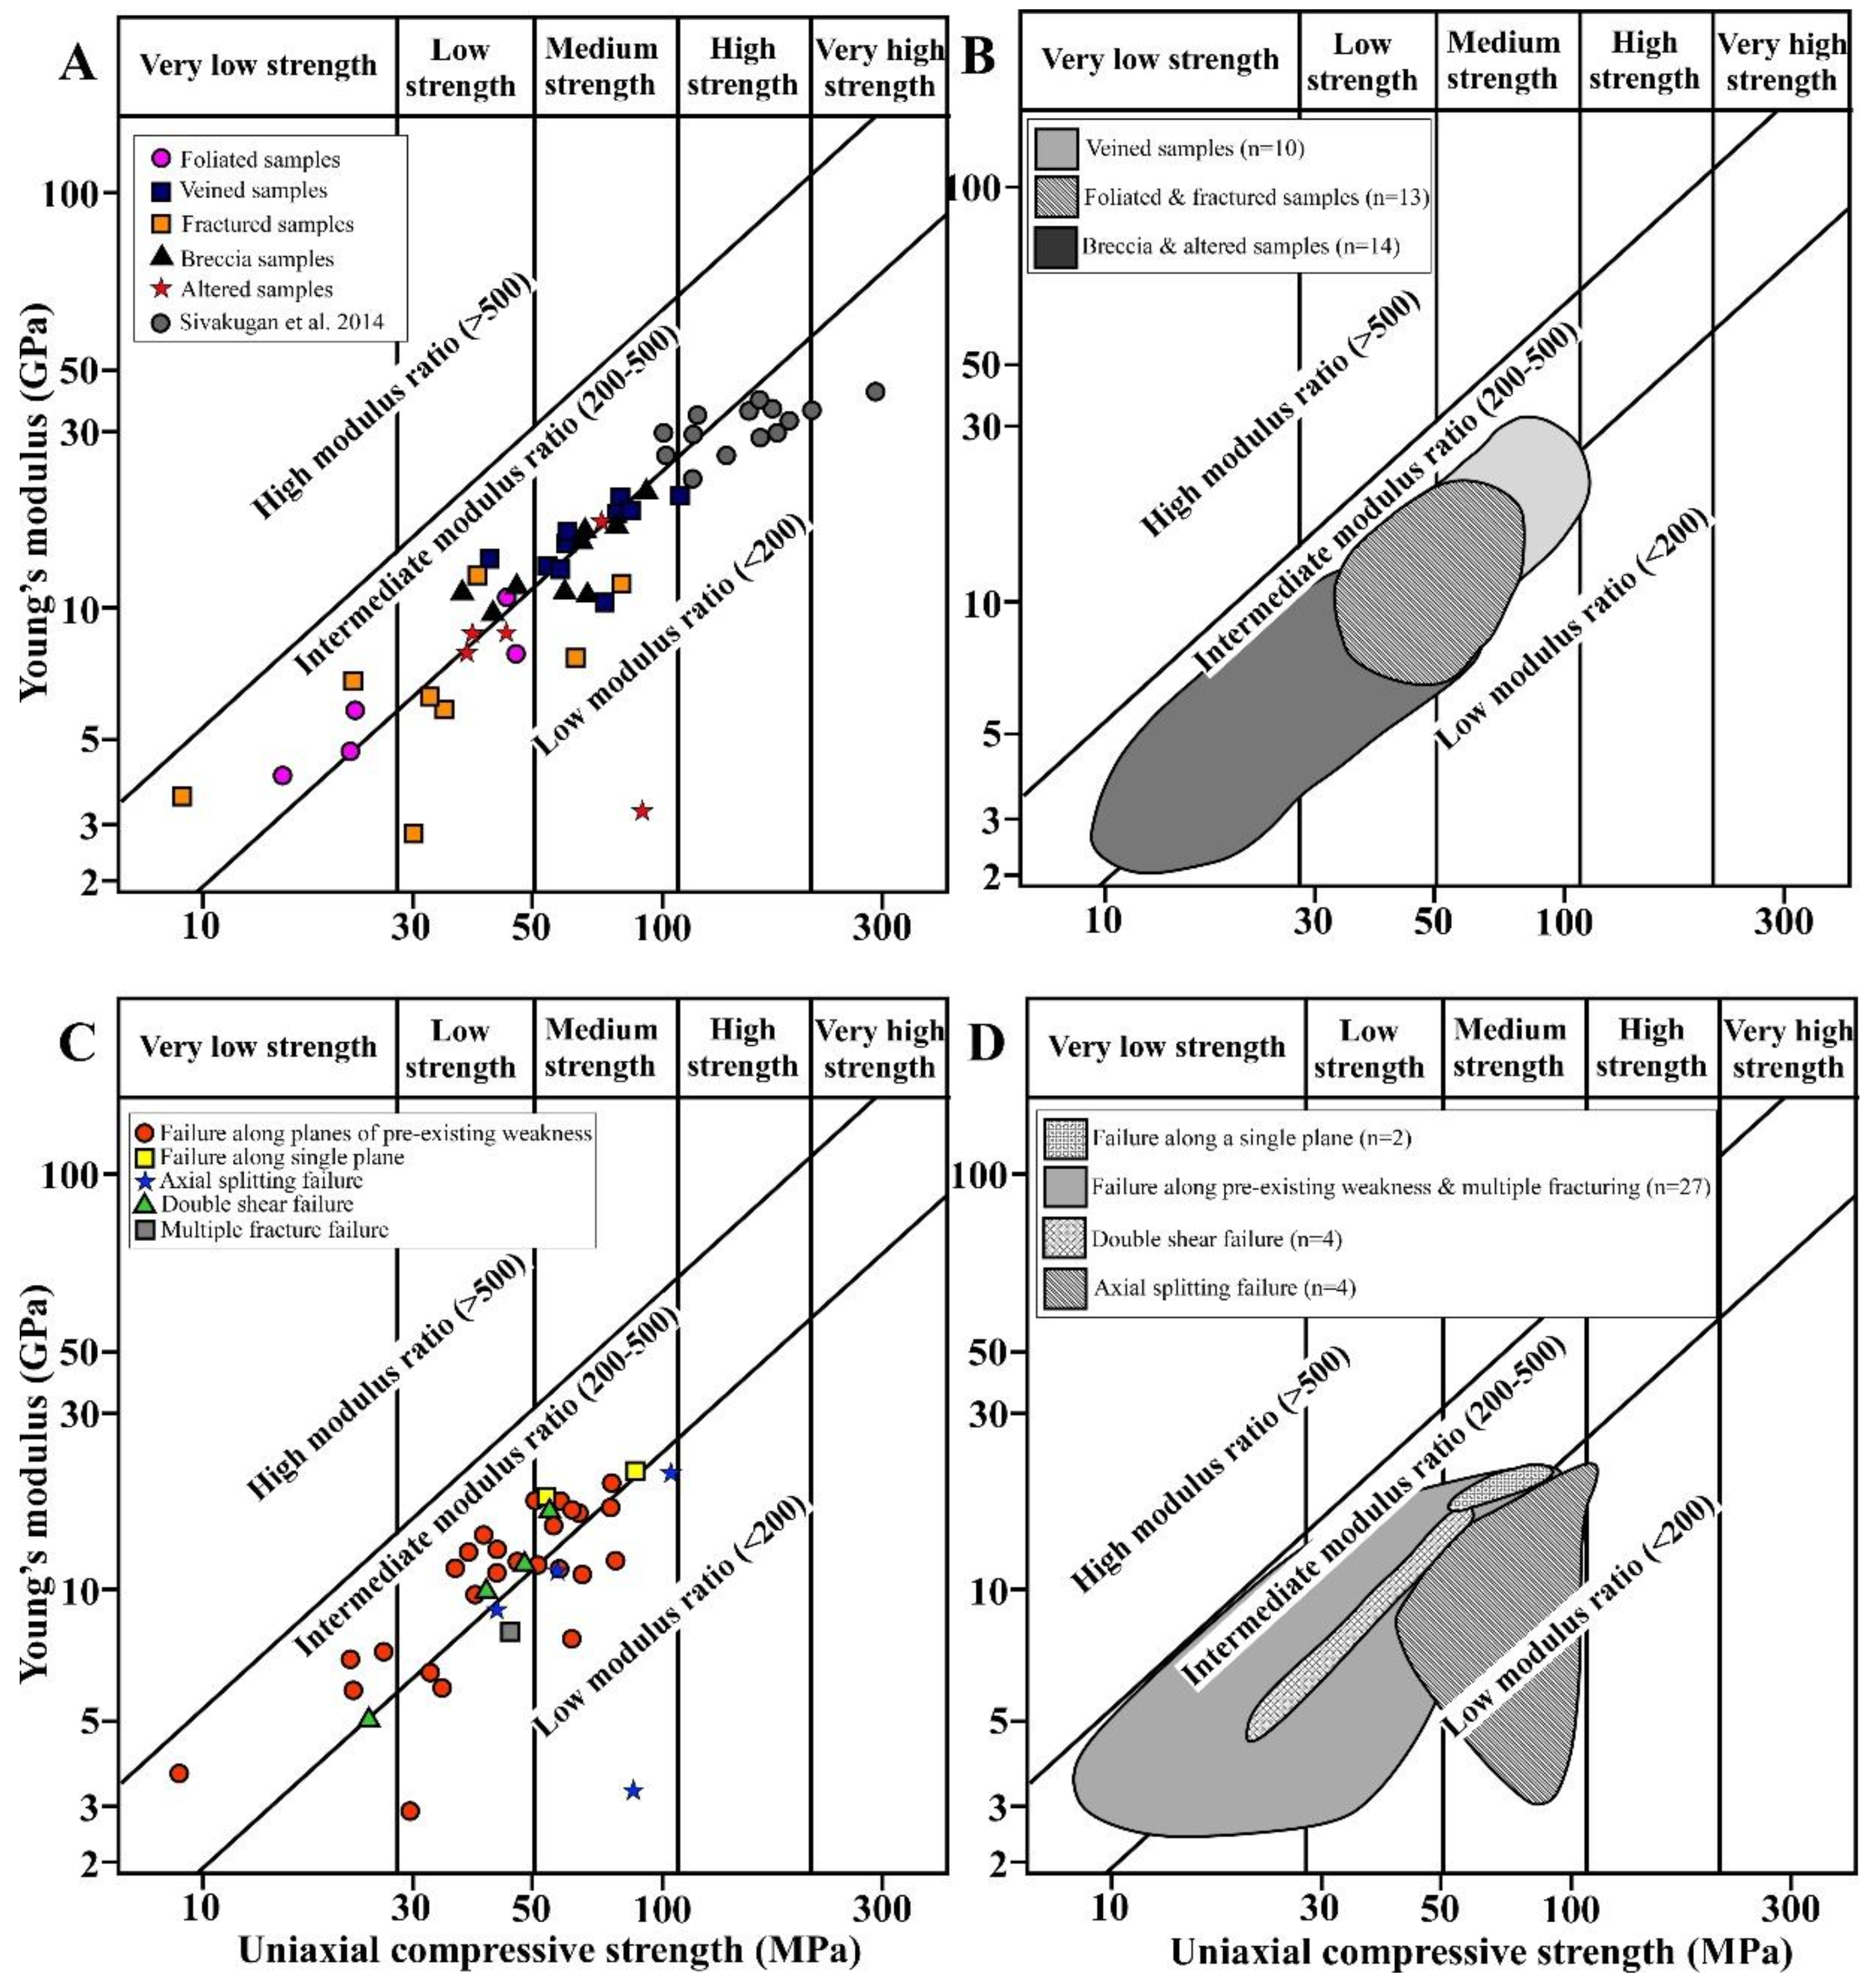
A plot of Young’s modulus vs. the UCS results can be used to classify rocks based on their strength [37,38]. All tested samples were plotted along a line (Figure 8A) to separate the rocks with a low modulus ratio (<200) from samples with an intermediate modulus ratio (200–500). In terms of uniaxial compressive strength, the samples were spread between medium strength and very low strength. Two samples did not follow this linear relationship. One of the samples, classified as altered, failed at a medium compressive stress but with a very low Young’s modulus. This sample was highly silicified and the rock texture was completely overprinted by silicification, rendering the sample, most probably, very brittle. The other sample, a fractured sample, failed directly along one of the fractures so that the elastic response of the sample was very low. The controlling factor appeared to be the pre-existing rock texture (Figure 8B), whereby the veined samples had medium strength, the breccia and altered samples had medium to low strengths and the foliated and fractured samples had low to very low strengths. Most samples failed along pre-existing planes of weakness indicating a connection between the failure mode and rock texture. This was true for most samples. In Figure 8C,D, it can be seen that the samples that failed along pre-existing weaknesses were spread between medium strength and very low strength. However, samples that failed mainly along newly formed fractures or a combination of newly formed and pre-existing fractures were classified as medium to low strength.
3.3. Shear Strength Parameters
The angle of internal friction (phi) and the cohesion (C) were calculated for 44 samples (Table 5) using empirical equations [15] based on UCS and ITS results. The calculation for the angle of internal friction revealed positive values for 15 samples, negative values for eight samples and for 21 samples, the results were inconclusive. The positive values for the angle of internal friction varied between 2.68° and 40.73°, while the negative values varied between −53.35° and −2.1°. In terms of cohesion, 23 samples returned positive values while for the remaining 21 samples, the results were inconclusive. The cohesion values varied between 13.6 MPa and 99.9 MPa.
4. Discussion
4.1. Estimating the UCS from the ITS and the PLT
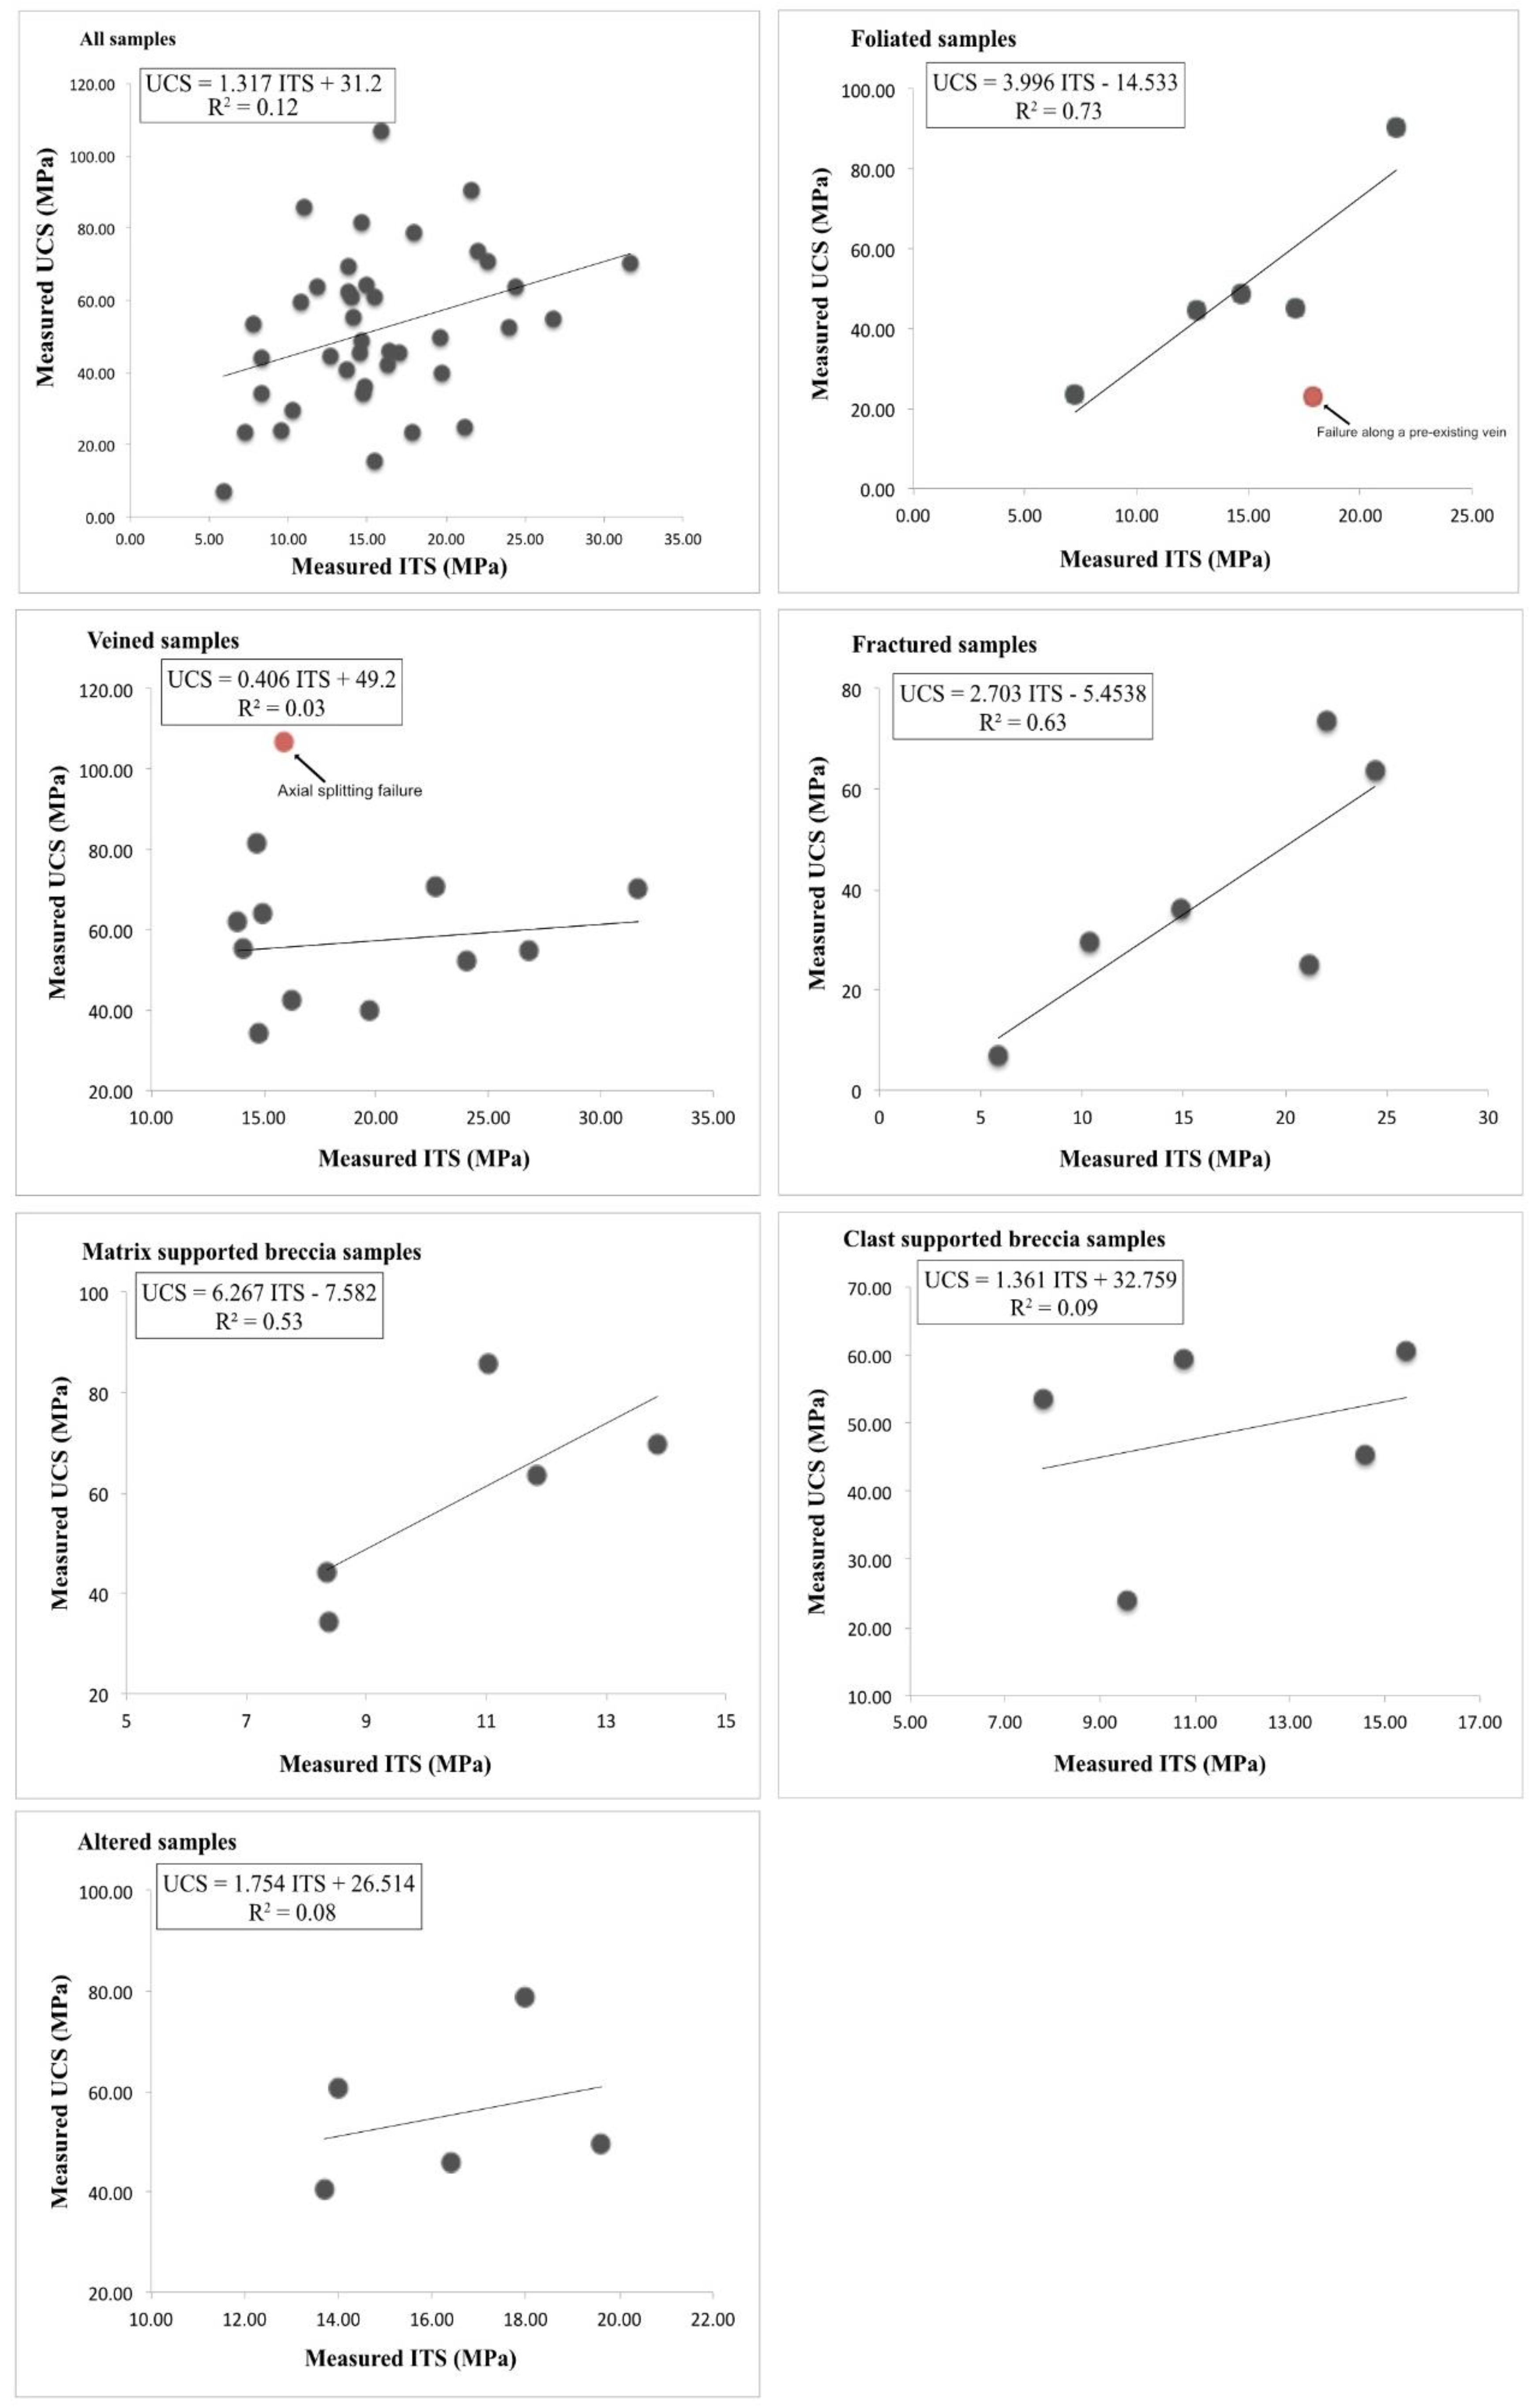
In general, the UCS can be estimated within a reasonable degree of confidence from PLT and ITS experimental data [21,23,39,40,41]. However, this was not the case for the samples investigated during this study. There were no correlations between the UCS and the PLT and the ITS (Figure 9 and Figure 10). The anisotropy of the tested samples can be invoked to explain the lack of correlation, but numerous studies have shown that even for anisotropic rocks, a correlation exists between the UCS and PLT and ITS [42]. It is important to note that although the majority of experiments in the literature have reported a good correlation between the UCS and PLT and ITS, the conversion factor is variable. For example, the PLT to UCS conversion factor can vary from as low as 8 [17] to as high as 30, while the ITS to UCS conversion factor values vary between 2.7 and 50 [43,44]. This implies that the conversion factor is a rock characteristic parameter and not a universal value; therefore, its applicability must be assessed on a case by case basis. The protolith of the samples (equigranular tonalite and anorthosite, Figure 1A,B) used in the present study would have been most likely classified as isotropic from a geotechnical point of view, but that was not the case in the current study. The samples are variably altered and deformed to the point that without a detailed petrographic study, their original protolith cannot be identified. In such situations, the results of the UCS, ITS and PLT experiments should be analyzed based on rock texture rather than rock composition. To investigate the relationship between the UCS and the ITS and PLT, the experimental data were plotted based on the samples’ textures (Figure 9 and Figure 10). There was no correlation between the UCS and the PLT for the veined, brecciated and altered samples, but there was a good correlation between the foliated and fractured samples (Figure 9). Similarly, there was no correlation between the UCS and the ITS for the veined, breccia and the altered samples, but there was a good correlation between the foliated and the fractured samples (Figure 10).
The presence or absence of a correlation between the test results can alternately be attributed to the small sample size, but careful investigation has revealed that it is the failure mode and the change in the sample anisotropy (due to size difference) that controls whether or not the UCS can be related to the PLT and the ITS. For example, foliated and fractured samples failed consistently along foliation or fracture planes, not only during the UCS tests, but also during the ITS and PLT tests. This is because both the foliation and the fracturing were pervasive and even though the samples were cut into different sizes for each test, the degree of anisotropy was preserved. On contrary, the brecciated, veined and altered samples failed in different modes during the UCS, ITS and PLT tests. This is because the anisotropy of the sample changed with the sample size. For example, the brecciated samples comprised a few different clasts for the UCS tests, but in most situations, they were formed by only one or two clasts for the ITS and PLT tests. For example, similar experiments [42] have shown that even for foliated rocks with failure modes along foliation planes (pre-existing weakness), there is a good correlation between the UCS and PLT tests. Although only three foliated samples were tested for both UCS and PLT (Figure 9), a good correlation was found. UCS and PLT data concerning foliated rocks in the literature [36,42] plotted on the same diagram (Figure 9) confirms that, indeed, for foliated rocks, the UCS and the PLT can be related to each other. The zero-intercept regression equation obtained for each data set has given conversion factors of seven (current data set), 12 [36] and 20 [42]. This difference could be due to different orientations of the foliation planes in relation to the applied load direction.
4.2. The Role of Pre-Existing Planes of Weakness
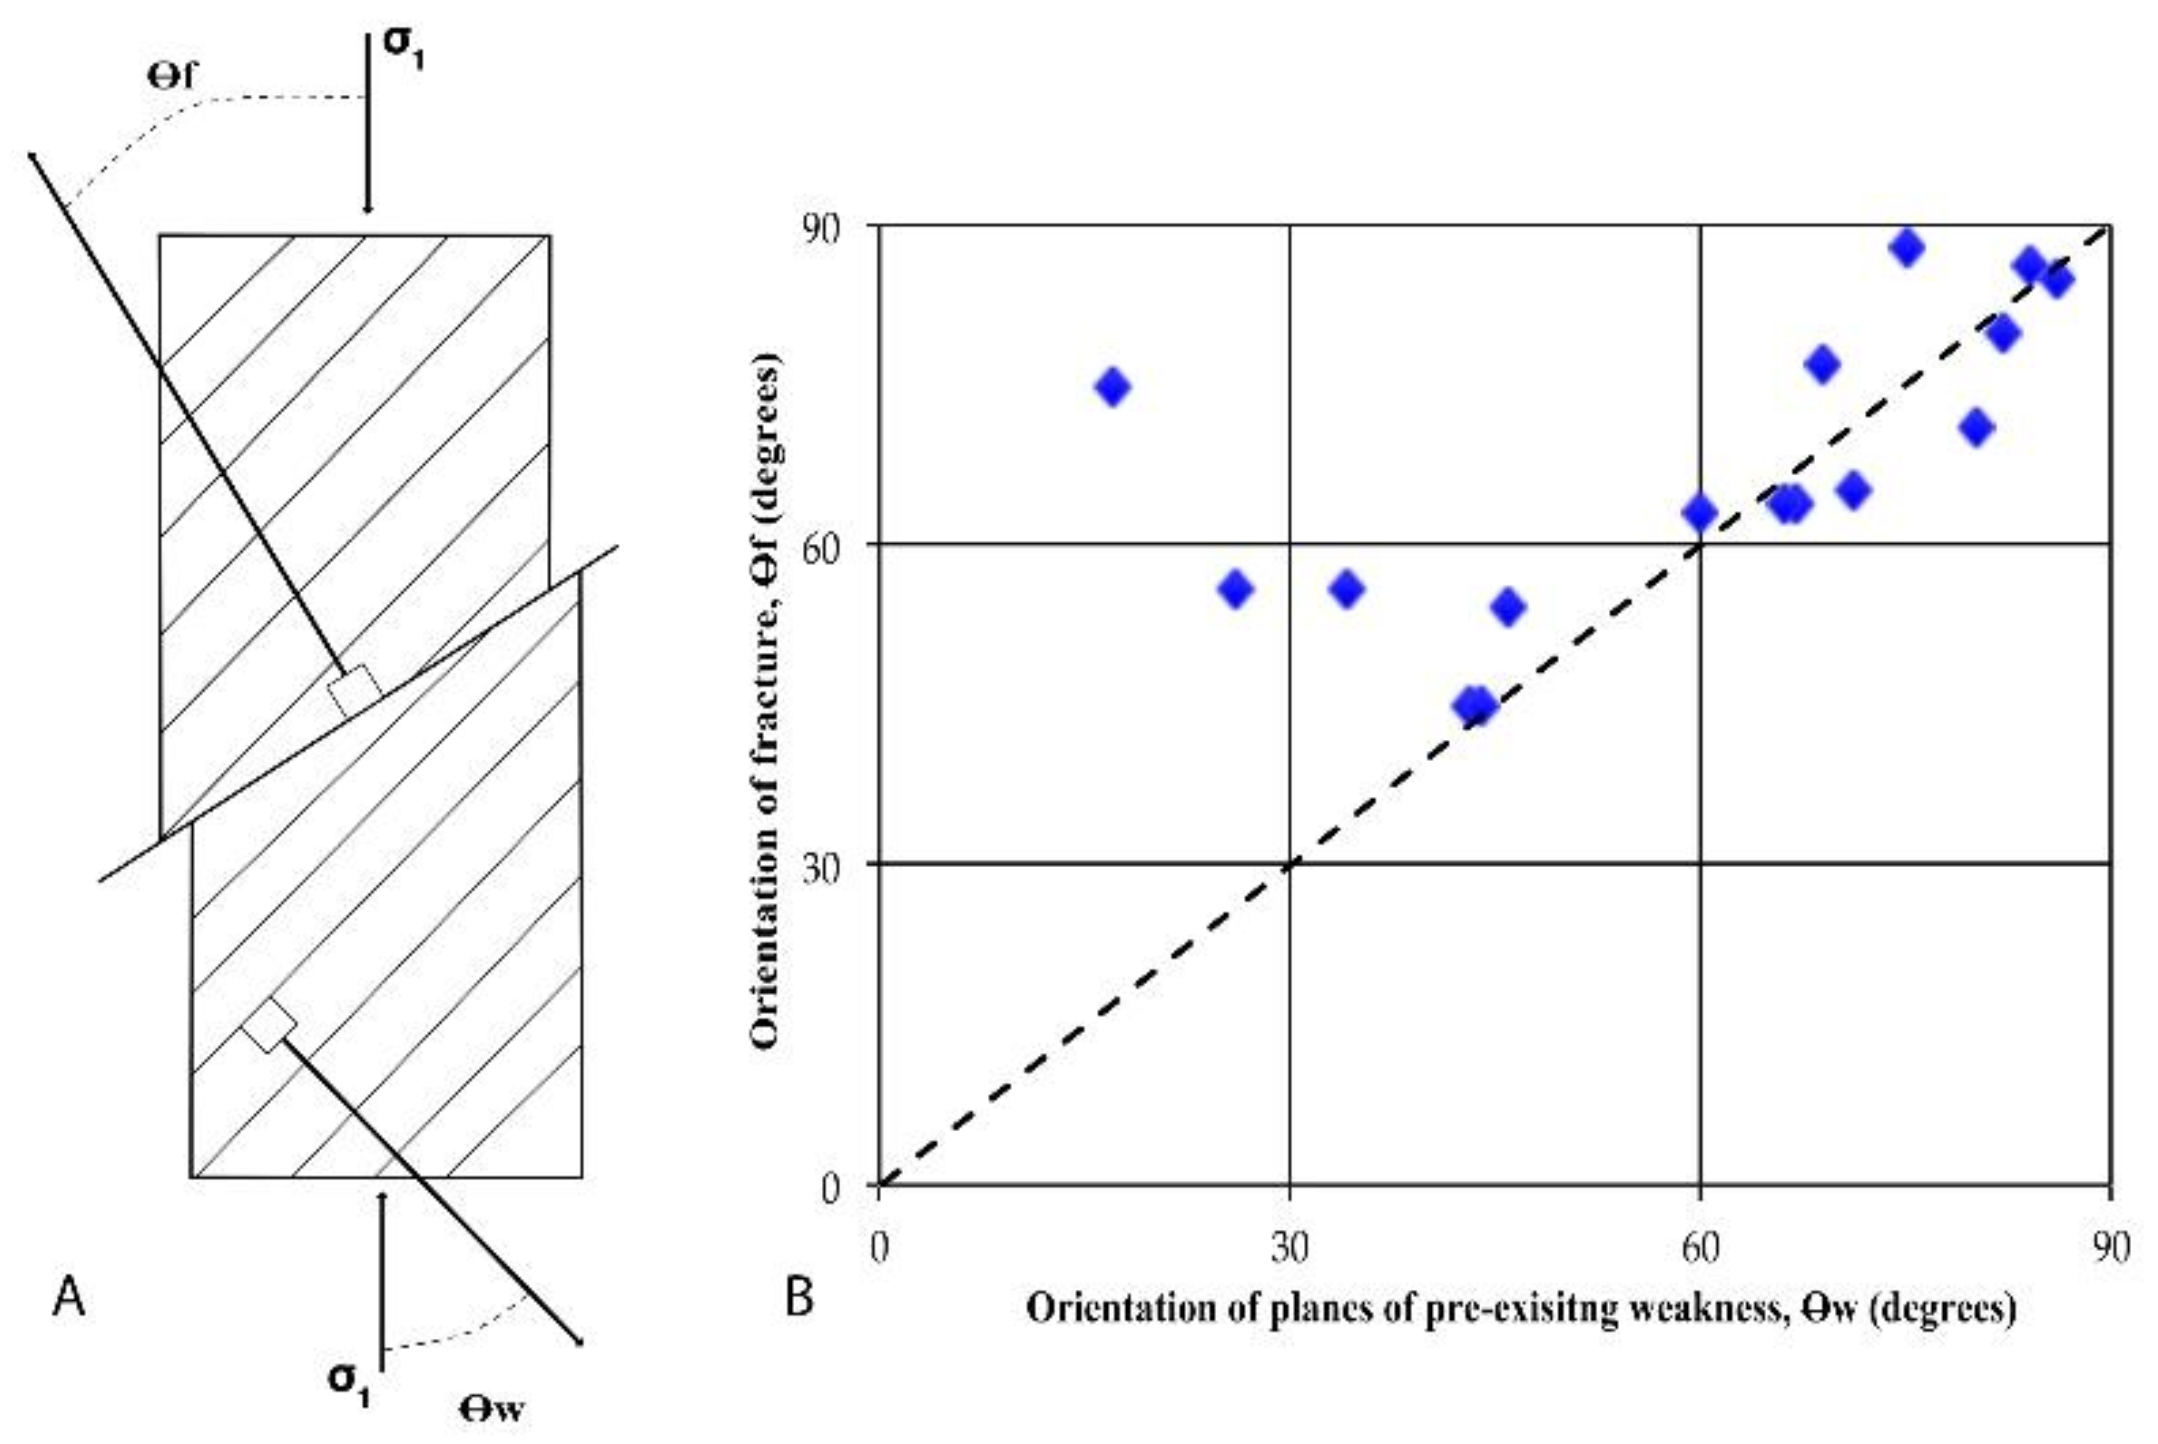
The investigation into failure modes during the UCS, ITS and PLT show that for the tested samples, the pre-existing planes of weakness control the failure mode and the rock strength. For example, previous experiments performed on cleaved rocks have shown that for inclinations of the cleavage as much as 45°, the sample always fails parallel to the cleavage [45]. Only in situations where the plane of anisotropy is nearly perpendicular to the loading direction, the sample failed along newly developed fractures. During the current experiments, if the investigated samples had foliations, fractures or veins inclined more than 45° relative to the normal stress of the plane in the loading direction, they failed along the planes of weakness as opposed to forming new fractures (Figure 11). If the plane of weakness was at an angle less than 40°, the sample failed along newly formed fractures (Figure 11). The strength of the rock is significantly reduced along the planes of weakness [27]. Therefore, the UCS is significantly reduced if the sample fails along pre-existing weakness planes, compared to the sample failing along newly formed fractures. For example, normal UCS results for intact tonalite are in the range of 200–250 MPa [17,46]. This is in contrast with the results of our experiments, which show UCS results of less than 100 MPa (Figure 7B), indicating that failure along pre-existing weakness planes reduces the UCS of tonalite by at least two times, compared to the intact tonalite. However, different types of weakness planes affect the UCS by different amounts. For example, the UCS (MPa) vs. Young modulus (GPa) plot (Figure 8B) shows that there is a significant difference in strength between the foliated or fractured samples and the veined samples. The veined samples are classified as medium strength, while the fractured and foliated samples are classified as weak to very weak strength. This behavior is controlled by the cohesive strength of the weakness. For example, the stress required for frictional sliding along a pre-existing fracture or foliation is much less than for failure to occur along a vein [27]. Veins are mineral filled fractures, and the vein material influences the strength of the fracture. The behavior of vein is dependent on various factors, including the strength and morphology of growing crystals (cohesion) and more importantly, their adhesion to the host rock [47]. Therefore, veins have cohesive and adhesive properties that contribute to the strength of a rock. If the vein material is stronger than the host rock, the contact between the vein and the wall rock (if the adhesive strength is lower than the wall rock strength) will control the plane of failure. However, if the vein material is weaker than the host rock, the failure will be localized along the vein, and the strength of the vein material controls the UCS. The majority of veins in the studied samples are calcite bearing and the failure occurs along the veins. The average UCS strength of calcite is 78 MPa [48], which is similar to the average UCS results (66 MPa) for the veined samples. This suggests that it is the vein material that controls the UCS strength of the veined samples.
4.3. The Angle of Internal Friction and the Cohesion
Laboratory experiments on a large range of rock types have shown that the angle of internal friction (φ) for intact rocks ranges between 20° and 45° [19,49]. The angle of internal friction and the cohesion are usually determined from triaxial or shear box experiments [19], which are less convenient to perform. Based on empirical equations [15], for most samples (21 samples), the angle of internal friction could not be calculated and for a small number of samples (eight samples), the calculated angle of internal friction returned negative values, which is unrealistic. The cohesion (c) values are more realistic, although some values are extremely high. For the fifteen samples that returned positive values for the angle of internal friction, most values are well below 20°, which is still different from the expected values (between 20° and 45°) reported UCS and ITS results for intact granite and sandstone and for schist. The calculated angles of internal friction for intact granite are between 40° and 55° and for intact sandstone are between 26° and 55° which are almost identical to the values obtained from triaxial and shear box experiments [49]. This suggests that the empirical equations [15] work very well for intact rock. However, for the schists, the calculated angles of internal friction are mostly negative, similar to the results obtained during this study. This can be readily explained by the fact that the samples did not fail by shear fracture but along pre-existing planes of weakness. Thus, the UCS of the sample is greatly reduced affecting the ratio of UCS to ITS. Figure 12A shows that for samples with a UCS/ITS ratio of 5 or above, the calculated angles of internal friction fall within the expected values, while for UCS/ITS ratios between 4 and 5, the calculated angles of internal friction are unrealistically low. For UCS/ITS ratios less than 4, the calculated angles of internal friction become negative. This decrease in UCS/ITS ratio correlates very well with the rock strength classification derived from Figure 12B and shows that the UCS/ITS ratio can be used to classify rock strength. Rocks with UCS/ITS above 8 are high strength, UCS/ITS between 5 and 8 are medium strength, UCS/ITS between 4 and 5 low strength and UCS/ITS less than 4 are very low strength.
4.4. The Role of Frictional Reactivation
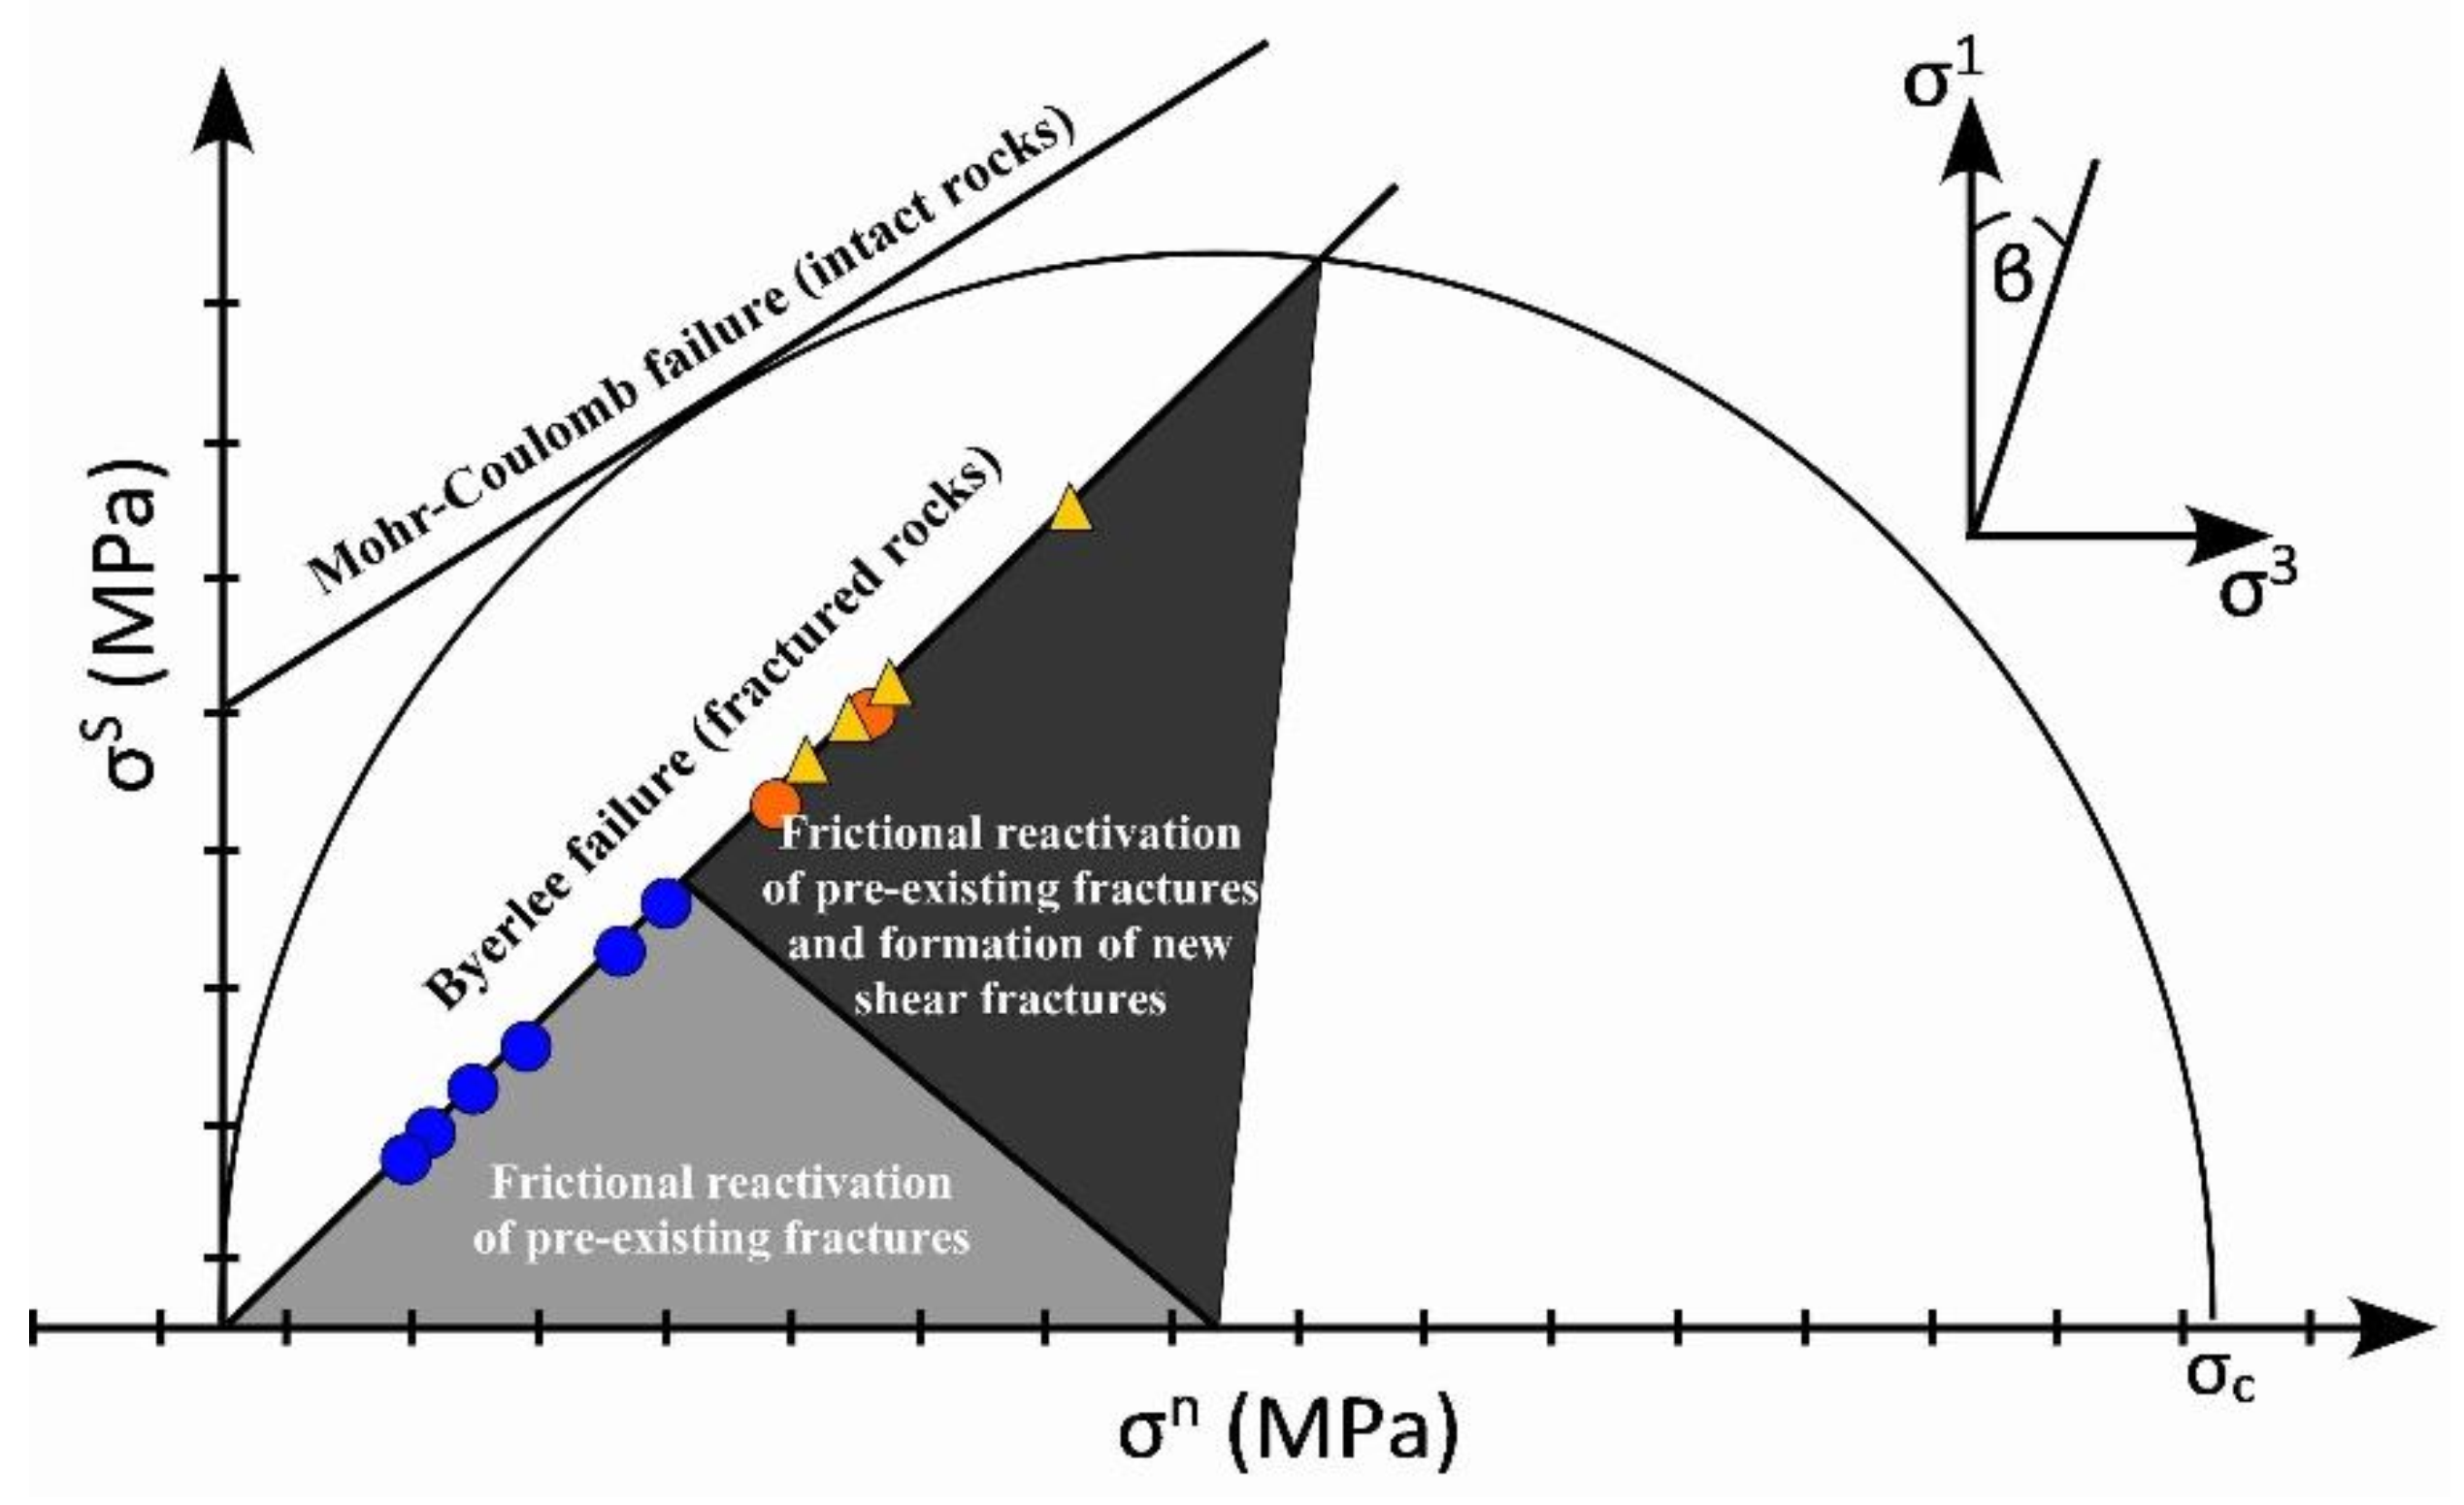
Most of the tested samples failed due to reactivation of pre-existing planes of weakness, such as fractures, foliations or veins. The Mohr–Coulomb criterion describes rock failure under compression [50], with the main assumption being that the rock will fail by shear fracturing. Therefore, the Mohr–Coulomb criterion is not suitable for describing the failure of rocks with pre-existing planes of weakness, because failure will occur along these planes if they are favorably oriented (Figure 13). Thus, the failure mechanism is driven by frictional reactivation of pre-existing fractures and not by shear fracturing. This is because pre-existing fractures have no cohesive strength, only frictional resistance [27]. The frictional reactivation of the pre-existing fractures for normal stresses up to 200 MPa is described by the following equation:
where σs is the shear stress and σn is the normal stress [51]. Thus, frictional reactivation requires much lower compressive stresses compared to the formation of new fractures [27]. This explains why the samples have a low UCS (MPa) value when failure occurs along a plane of pre-existing weakness (Figure 13). As the effective stress increases, frictional reactivation occurs until the orientation of the pre-existing weakness becomes unfavourable and the angle of frictional lock up is reached (Figure 13), and new fractures will develop. The reactivation field is defined by the slope (Figure 13) which also constrains the maximum reactivation angle to ≤50° relative to the maximum principal stress. However, a close look at the failure mode for the tested samples reveals that samples with pre-existing fractures at ≤10° relative to the maximum principal stress failed only by reactivation. However, samples with pre-existing fractures at >10° relative to the maximum principal stress failed due to a combination of reactivation and new shear fractures.
5. Conclusions
The results of this study show that because deformed and altered rocks are highly anisotropic, there is no mathematical solution for predicting rock failure modes accurately, making it difficult to understand deformed rock behaviour under an applied load. However, a series of useful conclusions can be drawn:
- Deformed rocks fail by a variety of failure modes, but the dominant failure mode is the reactivation of pre-existing planes of weakness. Failure by shear is only rarely achieved.
- The UCS is significantly reduced if the sample fails along pre-existing weakness planes, compared to the sample failing along newly formed shear fractures.
- Thus, the failure mode and the change in sample anisotropy (due to size difference) controls whether or not the UCS can be related to the PLS and the ITS.
- The Young’s modulus and the UCS can be used to classify the strength of the rocks. Observations show that veined and breccia samples are medium to low strength rocks. Fractured and foliated samples are weak to very weak rocks. This strength difference is controlled by the cohesive strength of the pre-existing planes of weakness.
- The empirical equations derived by [15] for the friction angle and the cohesions from UTS and ITS tests can be used accurately to calculate the shear parameters for intact rock. However, they yield unrealistic results for foliated, fractured or veined rocks.
- The UCS/ITS ratio can be used to classify rock strength: UCS/ITS ≥8 indicates high strength rocks, 5 < UCS/ITS ≤ 8 indicates medium strengths rocks, 4 < UCS/ITS < 5 indicates low strength rocks and UCS/ITS <4 are very low strength rocks.
- This study confirms previous observations that samples with foliations, fractures or veins inclined more than 40° from the normal to the plane will fail along the planes of weakness as opposed to forming new fractures. However, this study subdivides, for the first time, the failure along pre-existing structures into two failure modes: (1) if the angle of the weakened plane is ≤20° from the maximum principal stress, the sample will fail only along the pre-existing weakness and (2) if the weakness plane is between 20° and 45° relative to the maximum principal stress, the sample will fail along a combination of pre-existing weakness planes and newly formed shear fractures.
Acknowledgments
The authors would like to acknowledge Sivakugan for organizing the samples for the experiments and for reading an early version of this manuscript.
Author Contributions
T.E. and I.S. conceived and designed the experiments; T.E. performed the experiments; T.E. and I.S. analyzed the data; T.E. and I.S. wrote the paper.
Conflicts of Interest
The authors declare no conflict of interest.
References
- Himmelberg, G.R.; Haeussler, P.J.; Brew, D.A. Emplacement, rapid burial, and exhumation of 90-ma plutons in southeastern alaska. Can. J. Earth Sci. 2004, 41, 87–102. [Google Scholar] [CrossRef]
- Davis, B.K. Mechanism of emplacement of the cannibal creek granite with special reference to timing and deformation history of the aureole. Tectonophysics 1993, 224, 337–362. [Google Scholar] [CrossRef]
- Jayko, A.S.; Blake, M.C. Deformation of the eastern franciscan belt, Northern California. J. Struct. Geol. 1988, 11, 375–390. [Google Scholar] [CrossRef]
- Martinez, L.F.; Zuluaga, C.C.A. Thermal modeling of pluton emplacement and associated contact metamorphism: Parashi stock emplacement in the Serrania de Jarara (Alta Guajira, Colombia). Earth Sci. Res. J. 2010, 14, 16–23. [Google Scholar]
- Molina, P.G.; Parada, M.A.; Gutiérrez, F.J.; Ma, C.; Li, J.; Yuanyuan, L.; Reich, M.; Aravena, Á. Protracted late magmatic stage of the caleu pluton (central Chile) as a consequence of heat redistribution by diking: Insights from zircon data and thermal modeling. Lithos 2015, 227, 255–268. [Google Scholar] [CrossRef]
- Bell, T.H.; Sanislav, I.V.; Sapkota, J. The control of deformation partitioning and strain localization on porphyroblast behaviour in rocks and experiments. Geosci. J. 2018, 22, 65–77. [Google Scholar] [CrossRef]
- Sanislav, I.V. Porphyroblast rotation and strain localization: Debate settled!: Comment. Geology 2010, 38, e204. [Google Scholar] [CrossRef]
- Noronha, F.; Cathelineau, M.; Boiron, M.C.; Banks, D.A.; Doria, A.; Ribeiro, M.A.; Nogueira, P.; Guedes, A. A three stage fluid flow model for variscan gold metallogenesis in northern portugal. Geochem. Eng. 2000, 71, 209–224. [Google Scholar] [CrossRef]
- Zhang, Y.; Hobbs, B.E.; Ord, A.; Barnicoat, A.; Zhao, C.; Walshe, J.L.; Lin, G. The influence of faulting on host-rock permeability, fluid flow and ore genesis of gold deposits: A theoretical 2d numerical model. J. Geochem. Explor. 2003, 78–79, 279–284. [Google Scholar] [CrossRef]
- Rutqvist, J.; Rinaldi, A.P.; Cappa, F.; Moridis, G.J. Modeling of fault reactivation and induced seismicity during hydraulic fracturing of shale-gas reservoirs. J. Pet. Sci. Eng. 2013, 107, 31–44. [Google Scholar] [CrossRef]
- O’Brien, G.W.; Lisk, M.; Duddy, I.R.; Hamilton, J.; Woods, P.; Cowley, R. Plate convergence, foreland development and fault reactivation-primary controls on brine migration, thermal histories and trap breach in the timor sea, australia. Mar. Pet. Geol. 1999, 16, 533–560. [Google Scholar] [CrossRef]
- Klinger, Y.; Etchebes, M.; Tapponnier, P.; Narteau, C. Characteristic slip for five great earthquakes along the fuyun fault in china. Nat. Geosci. 2011, 4, 389–392. [Google Scholar] [CrossRef]
- Brady, B.H.G.; Brown, E.T. Rock Mechanics for Underground Mining; Springer: Dordrecht, The Netherlands, 2006; Volume 628. [Google Scholar]
- Nomikos, P.P.; Sofianos, A.I. An analytical probability distribution for the factor of safety in underground rock mechanics. Int. J. Rock Mech. Min. Sci. 2011, 48, 597–605. [Google Scholar] [CrossRef]
- Sivakugan, N.; Das, B.M.; Lovisa, J.; Patra, C.R. Determination of c and φ of rocks from indirect tensile strength and uniaxial compression tests. Int. J. Geotech. Eng. 2014, 8, 59–65. [Google Scholar] [CrossRef]
- Amini, M.; Majdi, A.; Veshadi, M.A. Stability analysis of rock slopes against block-flexure toppling failure. Rock Mech. Rock Eng. 2012, 45, 519–532. [Google Scholar] [CrossRef]
- Sivakugan, N.; Shukla, S.K.; Das, B.M. Rock Mechanics an Introduction; Taylor and Francis Group: Boca Raton, FL, USA, 2013. [Google Scholar]
- Kožušníková, A.; Marečková, K. Analysis of rock failure after triaxial testing. Int. J. Rock Mech. Min. Sci. 1999, 36, 243–251. [Google Scholar] [CrossRef]
- Haimson, B.; Chang, C. A new true triaxial cell for testing mechanical properties of rock, and its use to determine rock strength and deformability of westerly granite. Int. J. Rock Mech. Min. Sci. 2000, 37, 285–296. [Google Scholar] [CrossRef]
- Hoek, E. Rock mechanics laboratory testing in the context of a consulting engineering organization. Int. J. Rock Mech. Min. Sci. Geomech. Abstr. 1977, 14, 93–101. [Google Scholar] [CrossRef]
- Singh, T.N.; Kainthola, A.; Venkatesh, A. Correlation between point load index and uniaxial compressive strength for different rock types. Rock Mech. Rock Eng. 2011, 45, 259–264. [Google Scholar] [CrossRef]
- Kaya, A.; Karaman, K. Utilizing the strength conversion factor in the estimation of uniaxial compressive strength from the point load index. Bull. Eng. Geol. Environ. 2015, 75, 341–357. [Google Scholar] [CrossRef]
- Karaman, K.; Cihangir, F.; Ercikdi, B.; Kesimal, A.; Demirel, S. Utilization of the brazilian test for estimating the uniaxial compressive strength and shear strength parameters. J. South. Afr. Inst. Min. Metall. 2015, 115, 185–192. [Google Scholar] [CrossRef]
- Broch, E.; Franklin, J.A. The point-load strength test. Int. J. Rock Mech. Min. Sci. Geomech. Abstr. 1972, 9, 669–676. [Google Scholar] [CrossRef]
- Greminger, M. Experimental studies of the influence of rock anisotropy on size and shape effects in point-load testing. Int. J. Rock Mech. Min. Sci. Geomech. Abstr. 1982, 19, 241–246. [Google Scholar] [CrossRef]
- Forster, I.R. The influence of core sample geometry on the axial point-load test. Int. J. Rock Mech. Min. Sci. Geomech. Abstr. 1983, 20, 291–295. [Google Scholar] [CrossRef]
- Doglioni, C.; Carminati, E. Structural Style and Dolomites Field Trip; Memorie Descrittive della Carta Geologica d’Italia; ISPRA: Roma, 2008; Volume LXXXII ed APATI, p. 301. [Google Scholar]
- Attewell, P.B.; Sandford, M.R. Intrinsic shear strength of a brittle, anisotropic rock—I: Experimental and mechanical interpretation. Int. J. Rock Mech. Min. Sci. Geomech. Abstr. 1974, 11, 423–430. [Google Scholar] [CrossRef]
- Lei, X.L.; Nishizawa, O.; Kusunose, K.; Cho, A.; Satoh, T.; Nishizawa, O. Compressive failure of mudstone samples containing quartz veins using rapid AE monitoring: The role of asperities. Tectonophysics 2000, 328, 329–340. [Google Scholar] [CrossRef]
- Cao, R.-H.; Cao, P.; Lin, H.; Pu, C.-Z.; Ou, K. Mechanical behavior of brittle rock-like specimens with pre-existing fissures under uniaxial loading: Experimental studies and particle mechanics approach. Rock Mech. Rock Eng. 2015, 49, 763–783. [Google Scholar] [CrossRef]
- Zhao, Z.; Zhou, D. Mechanical properties and failure modes of rock samples with grout-infilled flaws: A particle mechanics modeling. J. Nat. Gas Sci. Eng. 2016, 34, 702–715. [Google Scholar] [CrossRef]
- Australia, S. Methods of testing concrete. In Method 10: Determination of Indirect Tensile Strength of Concrete Cylinders (‘Brazil’ or Splitting Test); Standards Australia International Ltd.: Strathfield, Australia, 2014; Volume 10, pp. 1–5. [Google Scholar]
- Australia, S. Methods of testing rocks for engineering purposes. In Methods 4.2.2: Rock Strength Tests—Determination of Uniaxial Compressive Strength-Rock Strength Less Than 50 MPa; Standards Australia Limited: Sydney, Australia, 2013; Volume 4.2.2, pp. 1–3. [Google Scholar]
- Australia, S. Methods of testing rocks for engineering purposes. In Method 4.2.1: Rock Strength Tests—Determination of Uniaxial Compressive Strength of 50 MPa and Greater; Australia Standards Limited: Sydney, Australia, 2007; Volume 4.2.1, pp. 1–3. [Google Scholar]
- Australia, S. Methods of testing rocks for engineering purposes. In Method 4.1: Rock Strength Test—Determination of Point Load Strength Index; Standards Australia Limited: Sydney, Australia, 2007; Volume 4.1, pp. 1–5. [Google Scholar]
- Basu, A.; Mishra, D.A.; Roychowdhury, K. Rock failure modes under uniaxial compression, brazilian, and point load tests. Bull. Eng. Geol. Environ. 2013, 72, 457–475. [Google Scholar] [CrossRef]
- Deere, D.U.; Miller, R.P.; Dentith, M.; Clark, D.; Featherstone, W. Engineering Classification and Index Properties of Intact Rock; Technical Report; No. AFWL-TR-65-116 AFWL-TR; No. 65–116; Air Force Weapons Laboratory: Dayton, OH, USA, 1966; Volume 308. [Google Scholar]
- Hawkes, I.; Mellor, M. Uniaxial testing in rock mechanics laboratories. Eng. Geol. 1970, 4, 179–285. [Google Scholar] [CrossRef]
- Akram, M.; Bakar, M.A.A. Correlation between uniaxial compressive strength and point load index for salt-range rocks. Pak. J. Eng. Appl. Sci. 2007, 1, 1–7. [Google Scholar]
- Kohno, M.; Maeda, H. Relationship between point load strength index and uniaxial compressive strength of hydrothermally altered soft rocks. Int. J. Rock Mech. Min. Sci. 2012, 50, 147–157. [Google Scholar] [CrossRef]
- Nazir, R.; Momeni, E.; Armaghani, D.J.; Amin, M.F.M. Correlation between unconfined compressive strength and indirect tensile strength of limestone rock samples. Electr. J. Geotech. Eng. 2013, 18, 1737–1746. [Google Scholar]
- Basu, A.; Kamran, M. Point load test on schistose rocks and its applicability in predicting uniaxial compressive strength. Int. J. Rock Mech. Min. Sci. 2010, 47, 823–828. [Google Scholar] [CrossRef]
- Sheorey, P.R. Empirical Rock Failure Criteria; A. A. Balkema: Rotterdam, The Netherlands, 1997. [Google Scholar]
- Vutukuri, V.S.; Lama, R.D.; Saluja, S.S. Handbook on Mechanical Properties of Rocks: Testing Techniques and Results, 1st ed.; Trans Tech Publications: Bay Village, OH, USA, 1974. [Google Scholar]
- Suppe, J. Principles of Structural Geology; Prentice-Hall: Englewood Cliffs, NJ, USA, 1985. [Google Scholar]
- Perkins, R.D.; Green, S.J.; Friedman, M. Uniaxial stress behavior of porphyritic tonalite at strain rates to 103/second. Int. J. Rock Mech. Min. Sci. Geomech. Abstr. 1970, 7, 527–535. [Google Scholar] [CrossRef]
- Nicholas, H.S.O.; Paul, D.B. Mechanisms of fluid flow and fluid-rock interaction in fossil metamorphic hydrothermal systems inferred from vein-wallrock patterns, geometry and microstructure. Geofluids 2001, 1, 137–162. [Google Scholar]
- Saliu, M.A.; Akindoyeni, A.F.; Okewale, I.A. Correlation between blast efficiency and uniaxial compressive strength. Eng. Technol. 2013, 3, 799–805. [Google Scholar]
- Jaeger, J.C.; Cook, N.G. Fundamentals of Rock Mechanics; Chapman and Hall: London, UK, 1979; p. 593. [Google Scholar]
- Labuz, J.F.; Zang, A. Mohr–coulomb failure criterion. Rock Mech. Rock Eng. 2012, 45, 975–979. [Google Scholar] [CrossRef]
- Byerlee, J. Friction of rocks. Pure Appl. Geophys. 1978, 116, 615–626. [Google Scholar] [CrossRef]
Figure 1.
Photographs of the two reference samples (A,B); they are the least altered and deformed. (A) Sample TE3A, a coarse-grained tonalite with phaneritic texture. (B) Sample TE2A, a medium-grained anorthosite with visible calcite veins. (C) Photograph of samples used in the uniaxial compressive strength (UCS) test, classified by pre-existing textures. FR: fractured; VO: veined; AL: alteration overprint; BO: brecciated; FO: foliated.
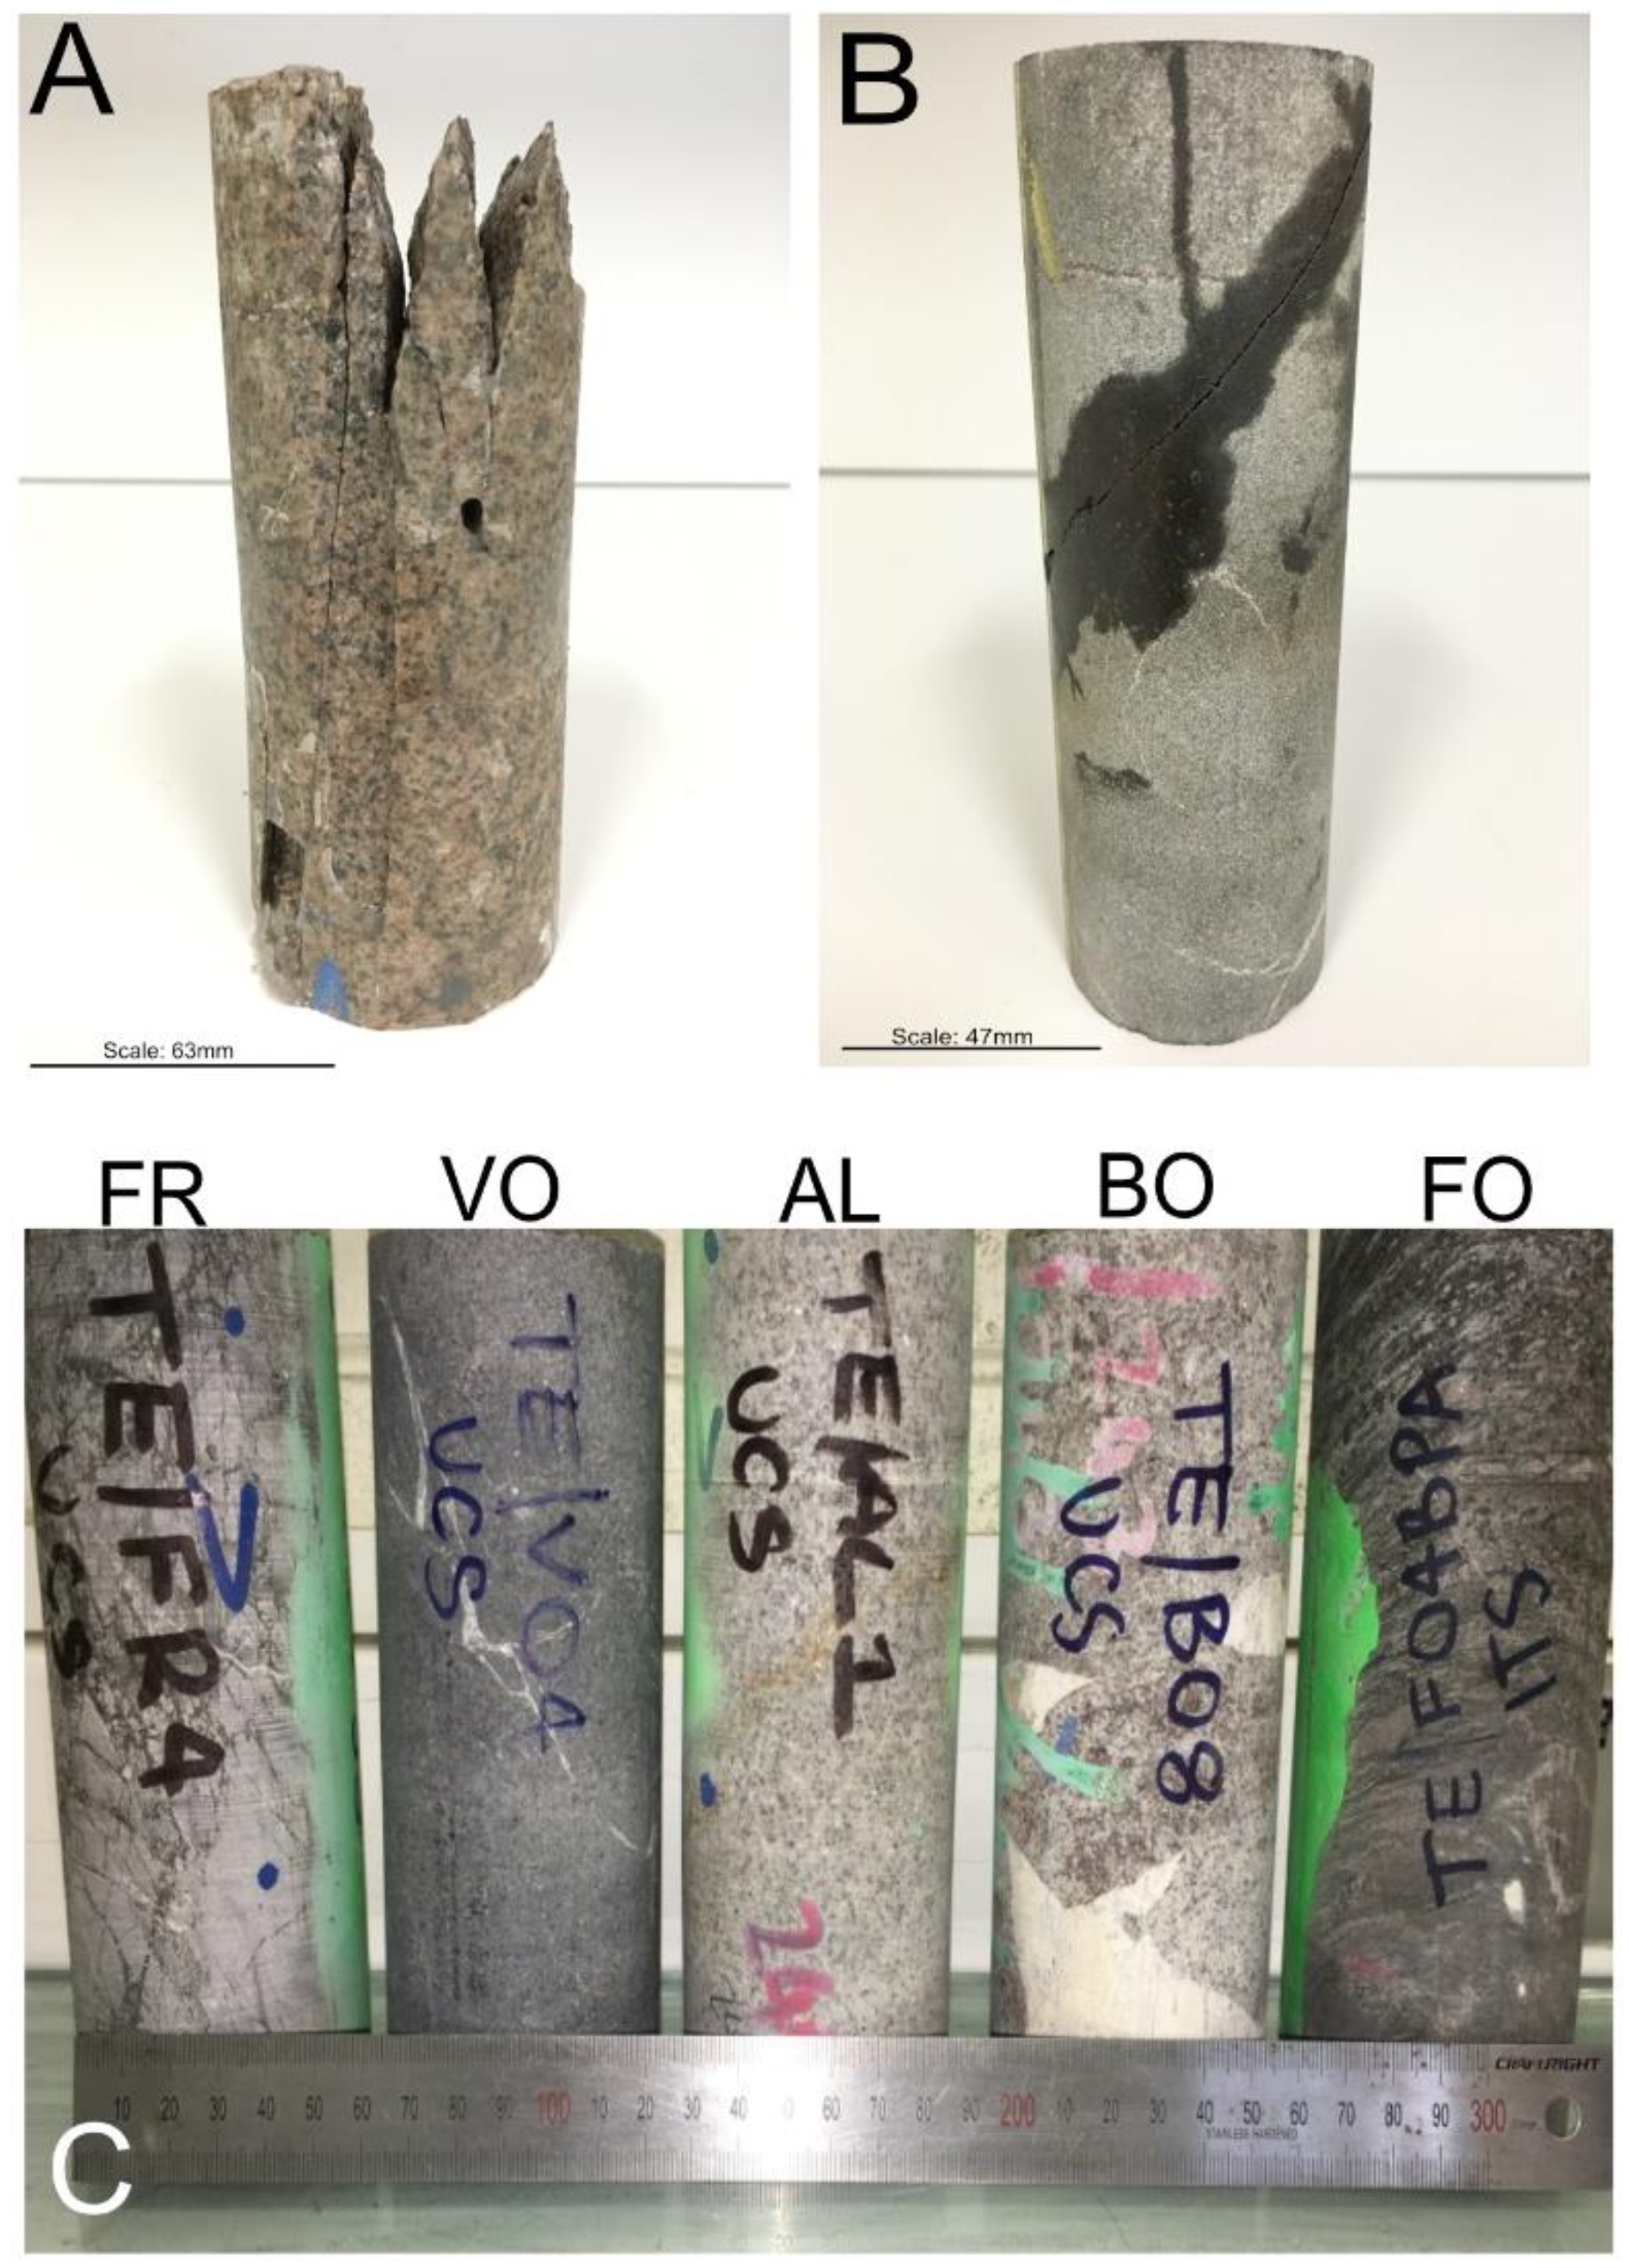
Figure 2.
Microphotographs of the investigated samples showing the range of deformation features not visible in the hand sample. (A) Sample TE2B: sub-parallel quartz—plagioclase mylonitic foliation that is cross cut by a late stage calcite micro-vein. (B) Sample TE1C: biotite rich foliation bands. (C) Sample TE2D: clast-supported breccia with deformed zones of matrix and micro-fractures within the anorthosite clasts. (D) Sample TE3C: tonalite with micro-fractures. (E) Sample TE3B: tonalite with micro-veins and conjugate sets of micro-fractures. (F) Sample TE1B: tonalite with conjugate sets of micro-fractures. (G) Sample TE3B: tonalite with deformation zones between plagioclase and quartz grains, micro-veins and micro-fractures. (H) Sample TE1A: anorthosite with a discontinuous calcite micro-vein following weakly formed foliation.

Figure 3.
(A) Photograph of the portable point load tester used for the point load tests. (B) Photograph of the jig used to hold the samples in place for the indirect tensile strength (ITS) test. (C) Photograph of the MTS machine used for the UCS tests. All testing equipment is located in the engineering laboratory at James Cook University, Townsville.

Figure 4.
Photographs and schematic drawings showing the failure modes observed during the point load tests. Red arrows indicate the direction of the maximum principal stress. (A) Example of failure along a pre-existing weakness (here, a vein); sample TE/FR4. (B) Example of twisted failure mode; sample TE/BO8. (C) Example of failure by triple junction; sample TE3B. (D) Example of non-central failure; sample TE3C. (E) Example of failure along a single plane; sample TE1D.

Figure 5.
Photographs and schematic drawings showing the failure modes observed during the UCS tests. The red arrows indicate the direction of the maximum principal stress. (A) Failure mode along pre-existing weakness (veins, fractures or foliation); sample TE2A. (B) Example of axial splitting failure; sample TE3A. (C) Example of failure by multiple fractures; sample TE1A. (D) Example of failure by double shearing (along pre-existing planes of weakness and newly developed shear planes); sample TE3C. (E) Example of failure along a single plane (newly developed failure plane); sample TE2D.

Figure 6.
Photographs and schematic drawings showing the failure modes observed during the ITS tests. Red dashed lines indicate planes parallel to the maximum principal stress. (A) Example of central failure where the fracture is parallel to maximum principal stress; sample TE/BO3. (B) Example of failure by central fracture and layer activation. The fractures are sub-parallel and at high angles to the maximum principal stress; sample TE/VO1. (C) Example of failure along multiple central fractures. The fractures develop sub-parallel to the maximum principal stress; sample TE1A. (D) Example of non-central failure. The fracture is independent of the maximum principal stress and follows pre-existing planes of weakness; sample TE/FO3.
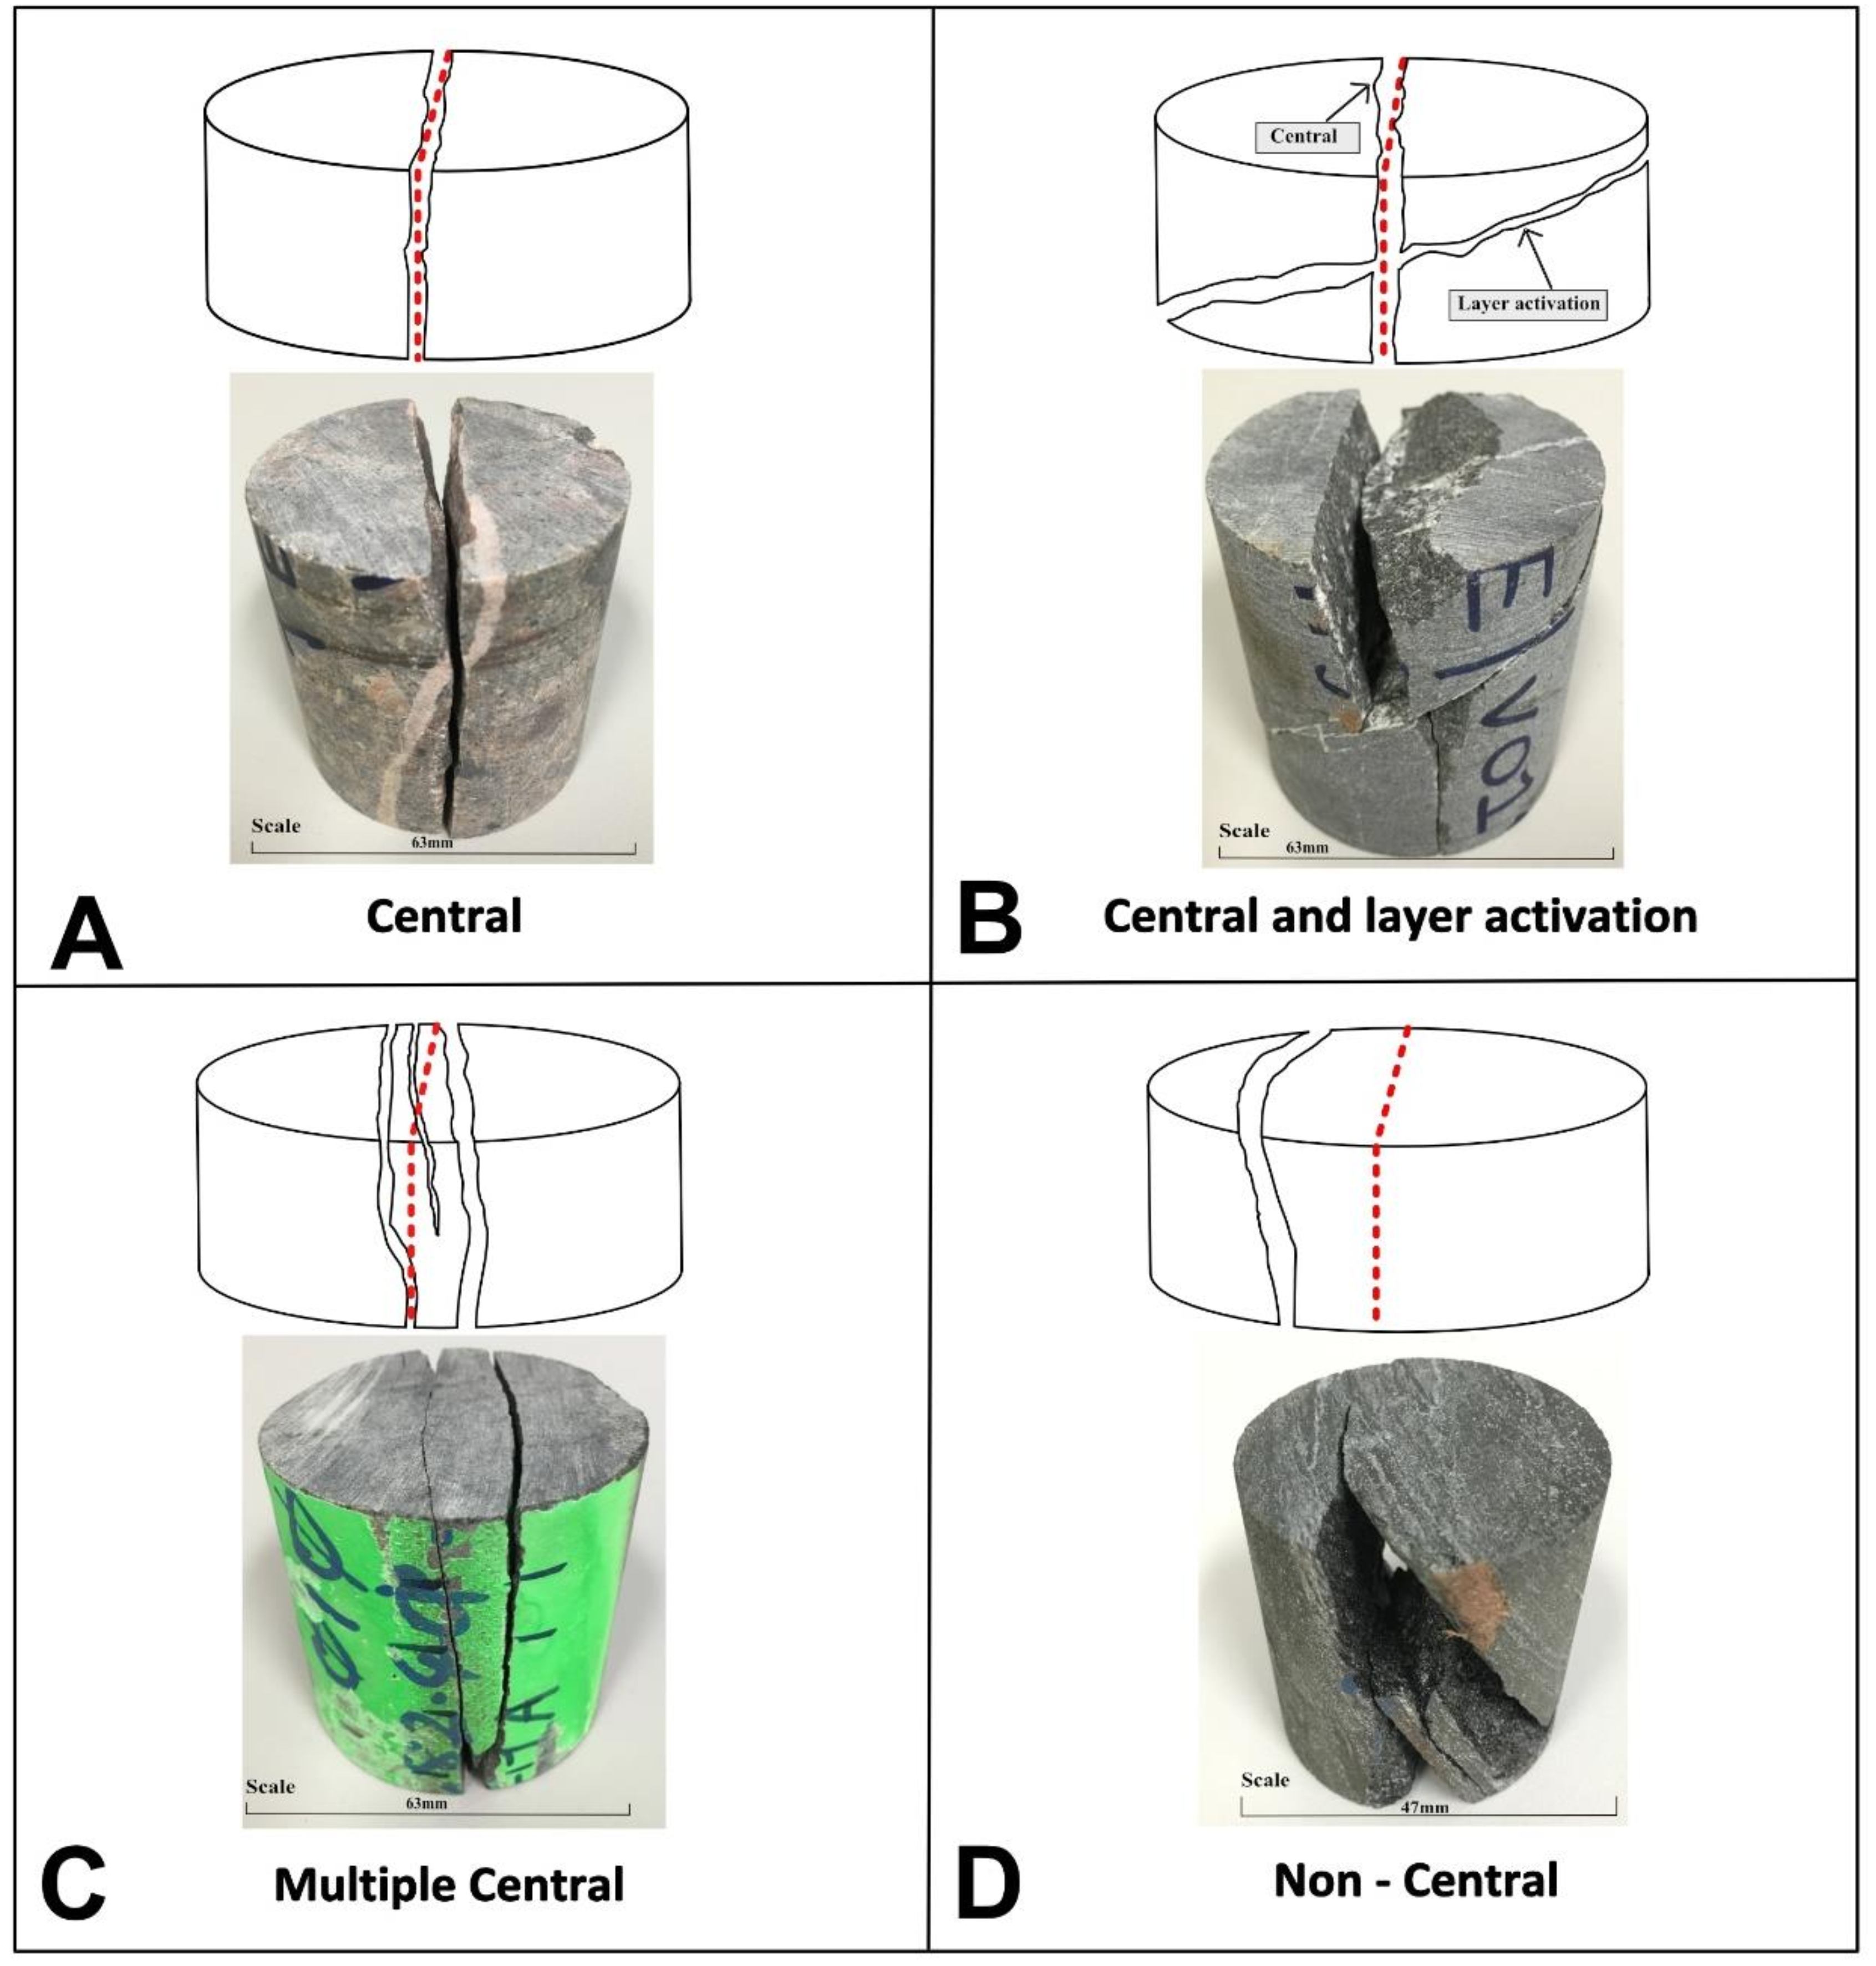
Figure 7.
(A) Bar diagram showing the different ranges of point load (MPa) values in relation to the failure modes. (B) Bar diagram showing the different ranges of UCS (MPa) values in relation to the failure modes. (C) Bar diagram showing the different ranges of ITS (MPa) values in relation to the failure modes.

Figure 8.
Rock strength classification based on UCS and Young’s modulus. (A) Each sample has a colour representing a texture (foliated, veined, fractured, breccia, or altered). Samples [17] plotted in grey illustrate high strength rocks. (B) The investigated samples are classified into groups: veined samples, foliated and fractured samples, and breccia and altered samples. The fields are based on the cluster of the samples in (A). (C) Each sample has a colour representing a different failure mode: failure along a plane of pre-existing weakness, failure along a single plane, axial splitting failure, double shear failure and multiple fractures. (D) The samples are classified into four main failure groups. The fields are based on the cluster of samples in (C).

Figure 9.
Measured PLT (MPa) vs. measured UCS (MPa) for the investigated rocks. Each plot represents a pre-existing texture. The plot for foliated samples also contains data from the literature [36,40] for schistose rocks. The regression line of best fit is only applied to the investigated rocks.
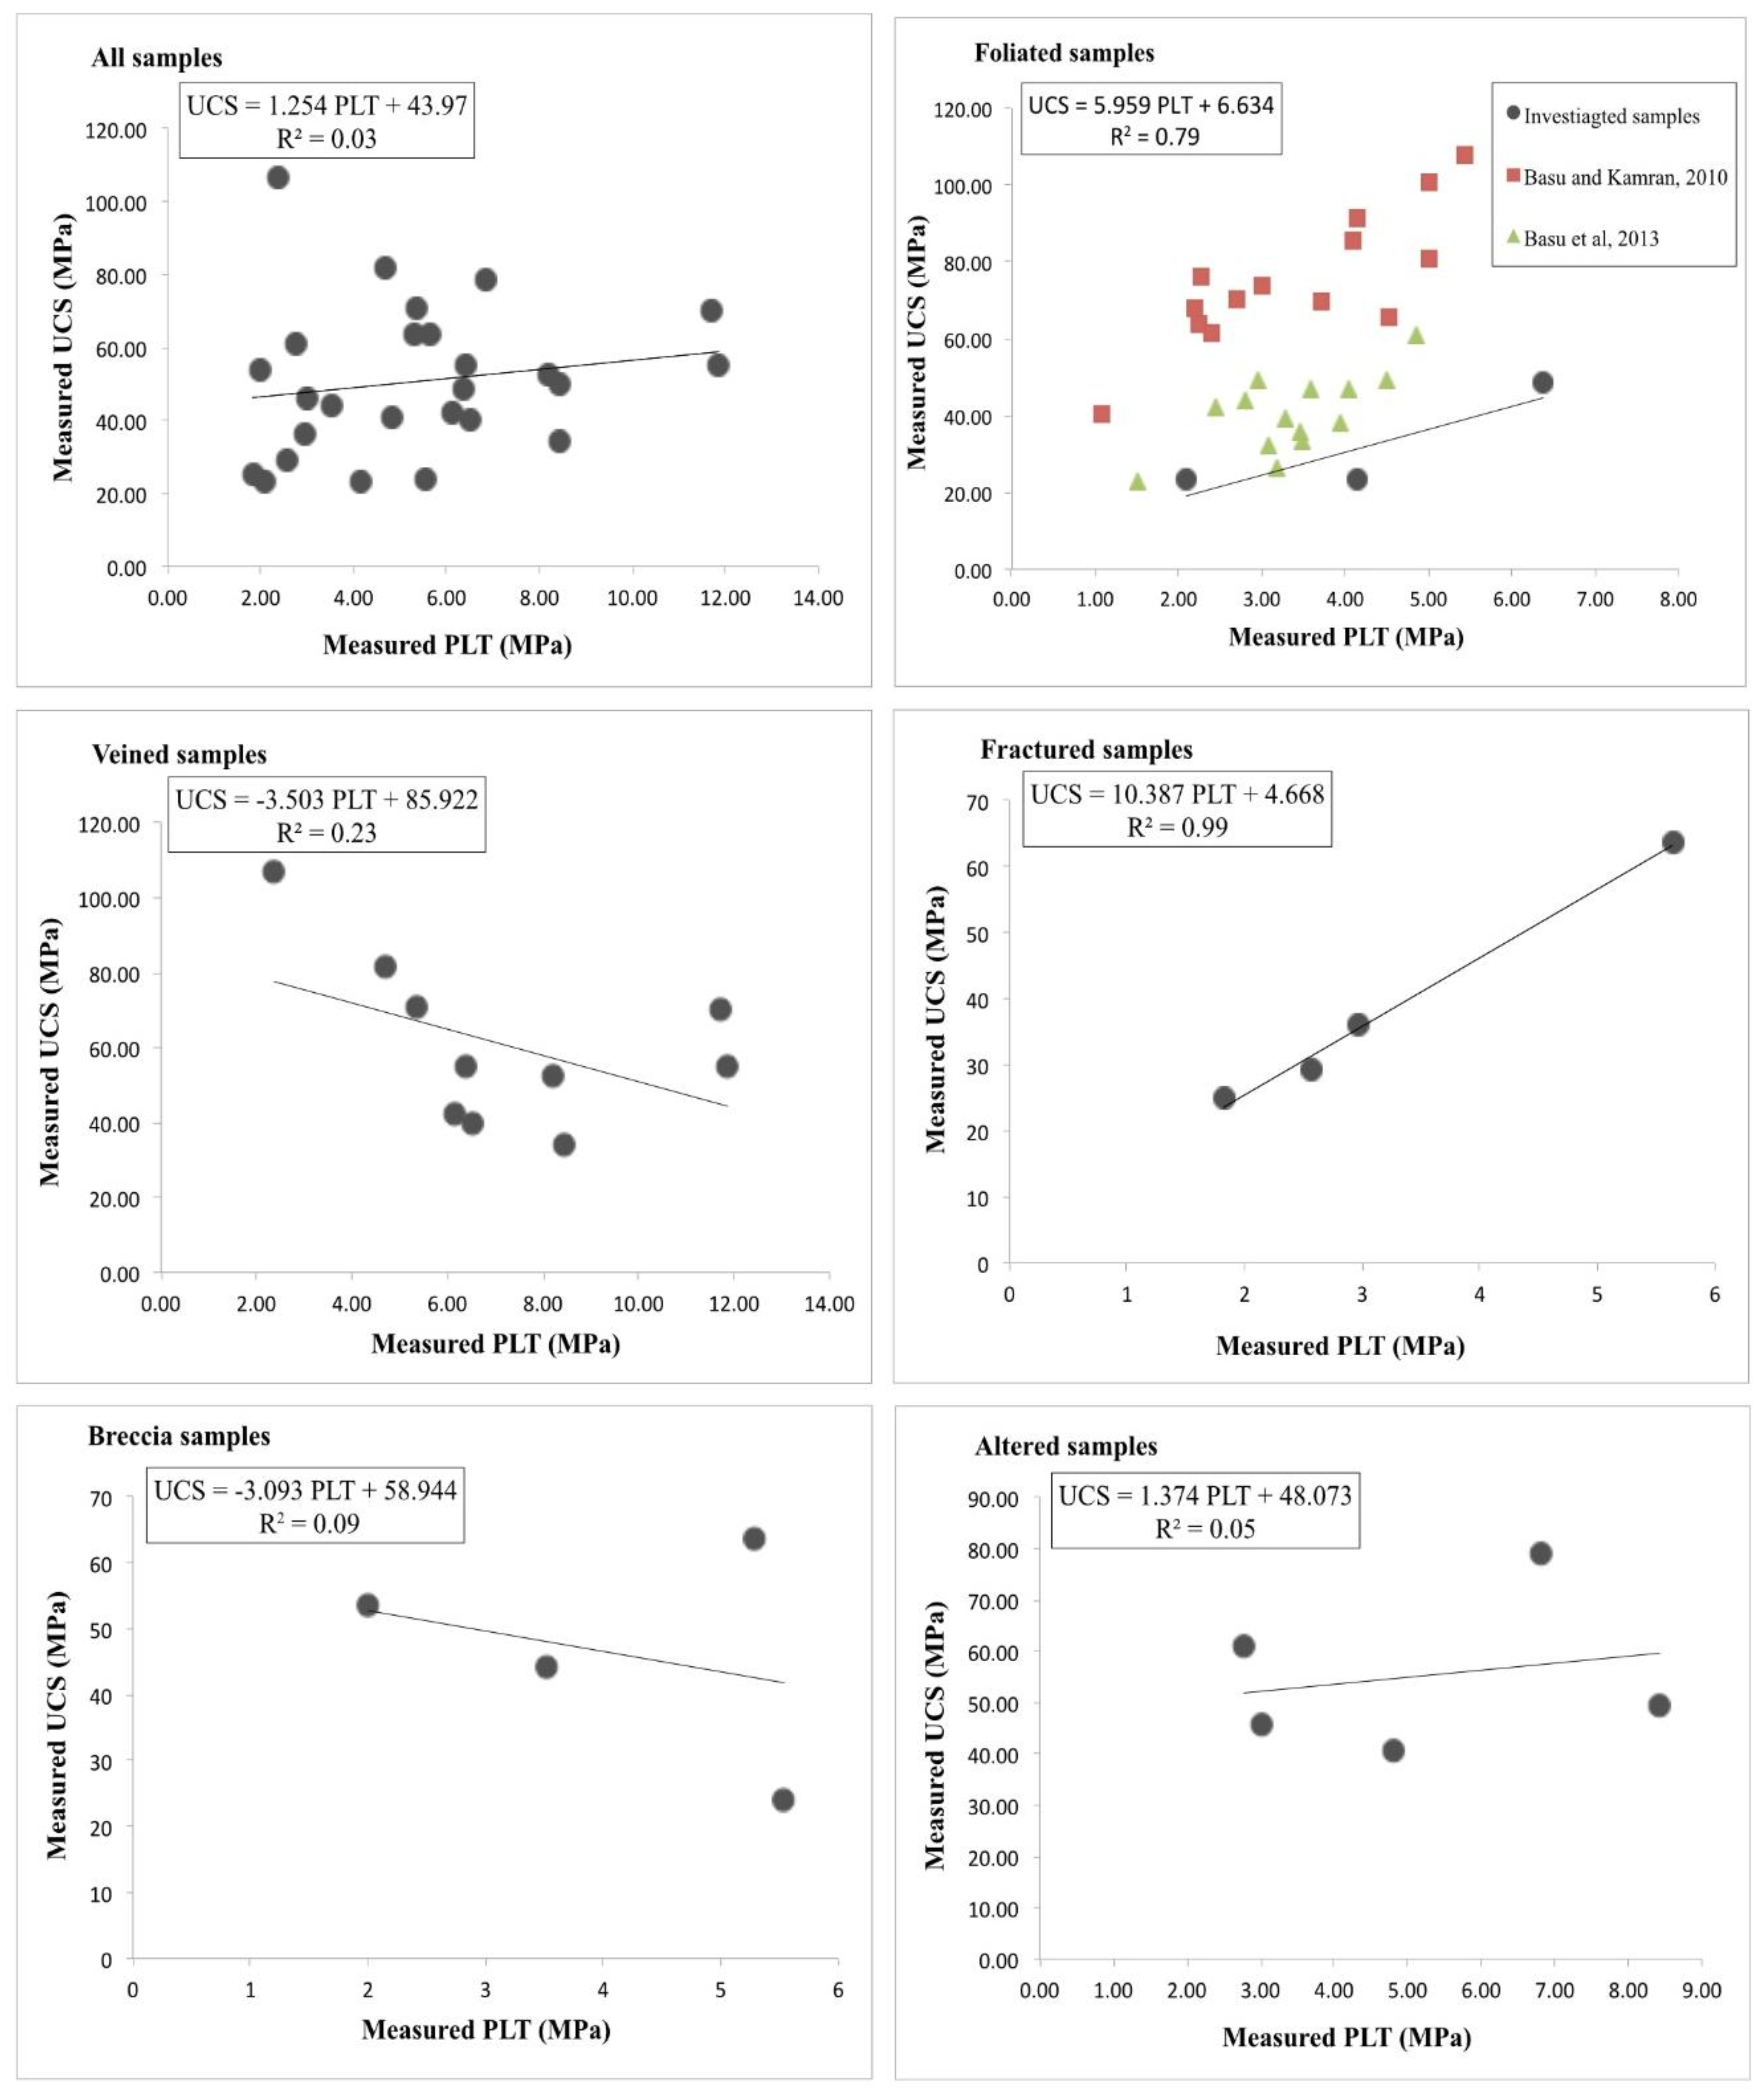
Figure 10.
Measured ITS (MPa) vs. measured UCS (MPa) for the investigated rocks. Each plot represents a pre-existing texture. The red point represents a sample that has a different failure mode to the other samples, causing that sample to deviate from the trend line.
Figure 10.
Measured ITS (MPa) vs. measured UCS (MPa) for the investigated rocks. Each plot represents a pre-existing texture. The red point represents a sample that has a different failure mode to the other samples, causing that sample to deviate from the trend line.

Figure 11.
(A) Schematic diagram showing the relationship between the orientation of a newly formed fracture and a plane of a pre-existing weakness. (B) Plot showing that for samples with pre-existing planes of weakness that make an angle >45° to the loading direction, failure occurs along the pre-existing planes of weakness. For samples with pre-existing planes of weakness that make an angle <45° to the loading direction, failure occurs along newly formed shear fractures.

Figure 12.
(A) Plot showing the relationship between the calculated friction angle and the (σc/σt) ratio for the investigated samples and data from the literature. (B) Classification of rocks based on their strength. The rock strength estimate is based on the field occupied by the same samples in Figure 8A, whereas the fields in (B) are derived from the cluster of points in (A). Grouping of the (σc/σt) ratio shows a relationship between the (σc/σt) and the strength classification; therefore, it appears that the (σc/σt) can potentially be used to classify rock strength.
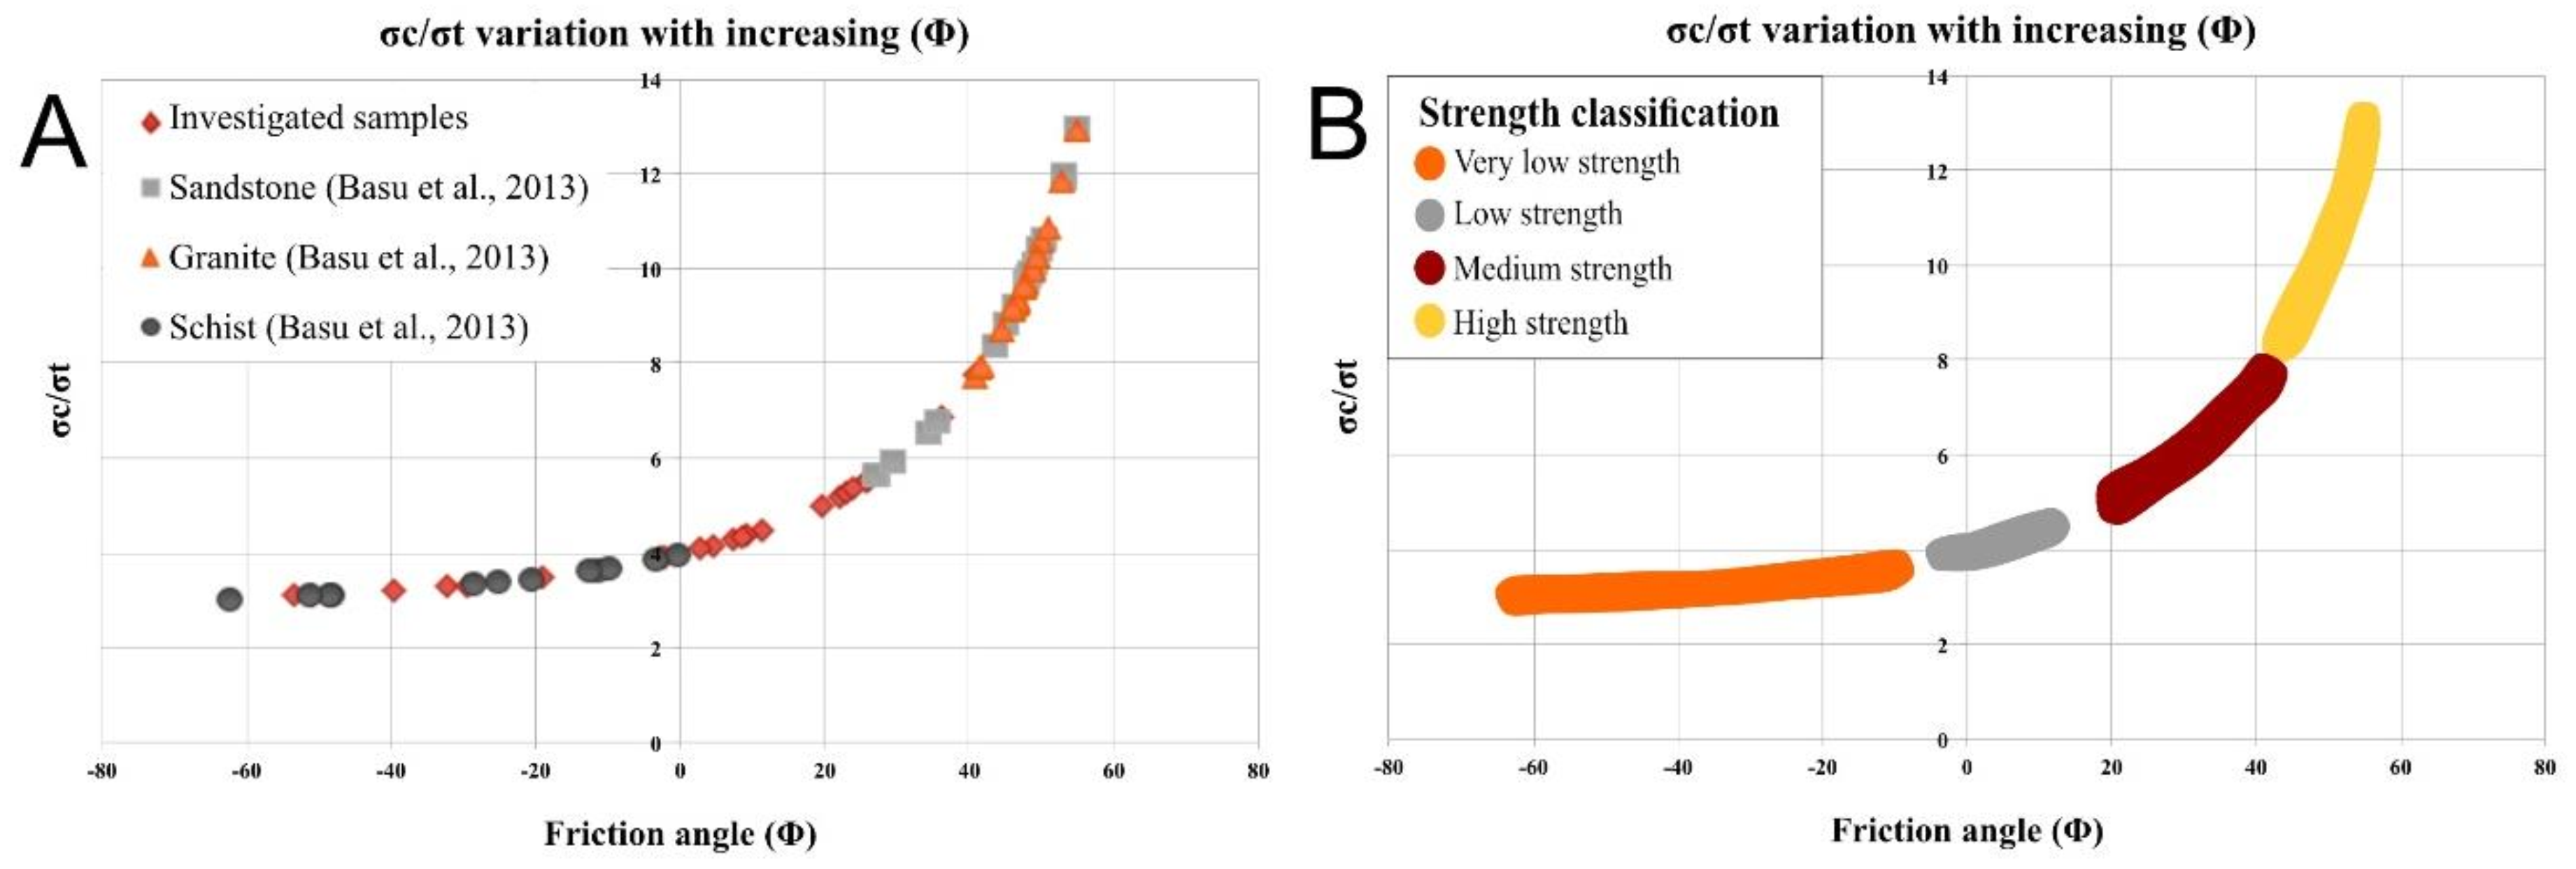
Figure 13.
Mohr circle with the envelope for the faulting of intact rock and the envelope for frictional reactivation of pre-existing fractures. The envelope for failure of intact rock follows the Mohr–Coulomb criterion σs = c + tan(φ) σn, and the envelope of frictional reactivation follows Byerlee’s law σs = 0.85σn. The frictional reactivation envelope can be subdivided based on the beta angles—if the beta angle is <20, only reactivation of pre-existing fractures occurs and higher beta angle failure occurs through a combination of reactivation of pre-existing fractures and the formation of new shear fractures. The fractured samples (circles) used in this study are plotted along the frictional reactivation envelope, blue samples represent only the reactivation of pre-existing fractures and the orange samples represent failure along new shear fractures and reactivation of pre-existing fractures. The foliated samples (triangles) used in this study failed due to a combination of pre-existing fractures (i.e., foliation) and newly formed shear fractures.


Table 1.
Summary table of rock descriptions and rock classifications.
| Group | Sample ID | Texture | Pre-Existing Structures |
|---|---|---|---|
| 1 | TE1A | Medium-grained (anorthosite) | Weak foliation and calcite veins visible under microscope |
| 1 | TE/2A | Medium-grained (anorthosite) | Calcite veins visible under microscope |
| 1 | TE3A | Coarse-grained, phaneritic (tonalite) | Weakly developed fractures visible only under microscope |
| 2 | TE1C | Foliated | Well-developed foliation at a high angle to the axis; one carbonate-sulfide vein ~parallel to the axis |
| 2 | TE1D | Foliated | Well-developed foliation at a low angle to the axis |
| 2 | TE/FO1 | Foliated | Moderately developed foliation parallel to the vein network |
| 2 | TE/FO2 | Foliated | Well-developed foliation at a moderate angle to the axis; few carbonate veins ~parallel to the axis |
| 2 | TE/FO3 | Foliated | Moderate foliation with carbonate deposited along the foliation planes |
| 2 | TE/FO4 | Foliated | Well-developed foliation overprinted by small ~1 mm carbonate veins |
| 3 | TE/2B | Mylonitic, veins | Veins are coalesced; multiple orientations |
| 3 | TE/VO1 | Medium-grained, veins | Two vein types (actinolite and calcite) up to 5 mm width |
| 3 | TE/VO2 | Medium-grained, veins | Two vein types (actinolite and calcite) up to 5 mm width; multiple orientations |
| 3 | TE/VO3 | Medium-grained, veins | Fine and dense micro-vein network, mostly calcite; multiple orientations |
| 3 | TE/VO4 | Medium-grained, veins | Fine to coarse calcite veins; mainly one orientation |
| 3 | TE/VO5 | Medium-grained, veins | Fine to coarse carbonate veins; one preferred orientation |
| 3 | TE/VO6 | Medium-grained, veins | Fine to coarse calcite veins; mainly one orientation |
| 3 | TE/VO7 | Medium-grained, veins | Fine calcite and actinolite vein network; multiple orientations; one vein ~parallel to the axis |
| 3 | TE/VO8 | Medium-grained, veins | Two main vein orientations: ~parallel to axis and ~perpendicular to the axis |
| 4 | TE2C | Medium-grained; fracture network | Multiple orientations; fractures and veins |
| 4 | TE/FR1 | Medium-grained; fracture network | Two main fracture networks. One ~parallel to the axis and one conjugate set at low-angle to the axis |
| 4 | TE/FR2 | Medium-grained; fracture network | Multiple orientations; fractures and veins |
| 4 | TE/FR3 | Medium-grained; fracture network | Multiple orientations; fractures and veins; calcite veins ~parallel to the axis |
| 4 | TE/FR4 | Medium-grained; fracture network | One preferred orientation; low angle to the axis |
| 4 | TE/FR5 | Medium-grained; fracture network | Two main fracture networks. One ~parallel to the axis and one conjugate set at a low-angle to the axis |
| 4 | TE/FR6 | Medium-grained; fracture network | Multiple orientations; fractures and veins; Low angle fractures better developed |
| 4 | TE/FR7 | Medium-grained; fracture network | Two main fracture networks. One ~parallel to the axis and one conjugate set at a low-angle to the axis |
| 5 | TE2D | Brecciated | Polymict; poorly sorted; clast-supported breccia; rounded clasts; few overprinting veins |
| 5 | TE/BO1 | Brecciated | Polymict; clast-supported breccia with large clast size |
| 5 | TE/BO2 | Brecciated | Polymict; poorly sorted; clast-supported breccia; rounded clasts; |
| 5 | TE/BO3 | Brecciated | Polymict; poorly sorted; clast-supported breccia; rounded clasts; fine overprinting vein network |
| 5 | TE/BO4 | Brecciated | Monomict, matrix-supported breccia; large angular clasts; calcite infill; |
| 5 | TE/BO5 | Brecciated | Monomict, matrix-supported breccia; large angular clasts; calcite infill; clast-dominated |
| 5 | TE/BO6 | Brecciated | Monomict, matrix-supported breccia; large angular clasts; calcite infill; clast-dominated |
| 5 | TE/BO7 | Brecciated | Monomict, matrix-supported breccia; large angular clasts; calcite infill; infill-dominated |
| 5 | TE/BO8 | Brecciated | Monomict, matrix-supported breccia; large angular clasts; calcite infill; clast-dominated |
| 5 | TE/BO9 | Brecciated | Polymict; poorly sorted; clast-supported breccia; rounded clasts; few overprinting veins |
| 6 | TE1B | Altered; phaneritic texture mostly preserved | Fractures visible only under microscope; carbonate, chlorite altered and weakly silicified |
| 6 | TE3B | Altered; phaneritic texture weakly preserved | Fractures visible under microscope; highly silicified and weak carbonate alteration |
| 6 | TE3C | Altered; phaneritic texture weakly preserved | Moderately to highly silicified; weak foliation; rare calcite veins |
| 6 | TE/AL1 | Altered; phaneritic texture well preserved | Weakly silicified; micro-fracture network |
Group 1: reference samples; Group 2: foliated rocks; Group 3: veined rocks; Group 4: fractured rocks; 5: brecciated rocks; Group 6: altered rocks.
Table 2.
Table with samples grouped based on their failure mode in the point load test (PLT).
| Test Type | Failure Mode | No. of Samples Failed |
|---|---|---|
| PLT | Single plane | 4 |
| PLT | Triple junction | 5 |
| PLT | Invalid | 2 |
| PLT | Twisted | 11 |
| PLT | Along pre-existing weakness (fracture, vein or foliation) | 4 |
| Total | 26 |
Table 3.
Table with samples grouped based on their failure mode during the UCS tests.
| Test Type | Failure Mode | Number |
|---|---|---|
| UCS | Along pre-existing weakness (fracture, vein or foliation) | 29 |
| UCS | Axial splitting | 4 |
| UCS | Shear along single plane | 2 |
| UCS | Double shear | 4 |
| UCS | Multiple fractures | 1 |
| Total | 40 |
Table 4.
Table with samples grouped based on their failure mode during the ITS test.
| Test Type | Failure Mode | No. of Samples Failed |
|---|---|---|
| ITS | Central | 15 |
| ITS | Central + layer activation | 19 |
| ITS | Multiple central | 5 |
| ITS | Non-central | 5 |
| Total | 44 |
Table 5.
Table with the calculated angle of internal friction and cohesion based on the UCS and ITS results [15].
Table 5.
Table with the calculated angle of internal friction and cohesion based on the UCS and ITS results [15].
| Specimens | Measured Parameters | Estimated Parameters | Ratios | ||||||
|---|---|---|---|---|---|---|---|---|---|
| Group | Sample ID | PLT/Mpa | σt/MPa | σc/MPa | E/GPa | Φ° | C/MPa | E/σc | σc/σt |
| 1 | TE1A | 6.37 | 14.68 | 48.49 | 7.4 | −32.3 | 44 | 152.61 | 3.3 |
| 1 | TE/2A | 6.13 | 16.27 | 42.26 | 15.2 | - | - | 359.68 | 2.6 |
| 1 | TE3A | 8.42 | 19.62 | 49.65 | 9.6 | - | - | 193.35 | 2.53 |
| 2 | TE1C | 4.14 | 17.90 | 23.16 | 6.6 | - | - | 284.97 | 1.29 |
| 2 | TE1D | 2.09 | 7.24 | 23.33 | 4.8 | −39.5 | 24.7 | 205.74 | 3.22 |
| 2 | TE/FO1 (PA) | - | 12.65 | 44.37 | 1.1 | −19.07 | 31.14 | 24.79 | 3.51 |
| 2 | TE/FO1 (PE) | - | 15.69 | 44.37 | 1.1 | - | - | 24.79 | 2.83 |
| 2 | TE/FO2 (PA) | - | 21.61 | 90.25 | 1.7 | 4.65 | 41.61 | 18.84 | 4.18 |
| 2 | TE/FO2 (PA2) | - | 17.33 | 90.25 | 1.7 | 22.12 | 30.37 | 18.84 | 5.21 |
| 2 | TE/FO3 (PA) | - | 15.45 | 15.4 | 4.7 | - | - | 305.19 | 1 |
| 2 | TE/FO3 (PE) | - | 18.13 | 15.4 | 4.7 | - | - | 305.19 | 0.85 |
| 2 | TE/FO4 (PE) | - | 17.07 | 45.36 | 10.8 | - | - | 238.1 | 2.84 |
| 2 | TE/FO4 (PE2) | - | 15.99 | 45.36 | 10.8 | - | - | 238.1 | 2.66 |
| 3 | TE/2B | 6.39 | 14.09 | 55.11 | 16.1 | −2.7 | 28.9 | 292.14 | 3.91 |
| 3 | TE/VO1 | - | 13.86 | 62.16 | 15.8 | 11.25 | 25.51 | 254.18 | 4.48 |
| 3 | TE/VO2 | - | 14.95 | 64.08 | 15.7 | 7.19 | 28.25 | 245.01 | 4.29 |
| 3 | TE/VO3 | 2.37 | 15.87 | 106.66 | 18.9 | 35.2 | 27.6 | 177.2 | 6.72 |
| 3 | TE/VO4 | 4.7 | 14.68 | 81.63 | 17.9 | 26 | 25.5 | 219.3 | 5.56 |
| 3 | TE/VO5 | 5.33 | 22.69 | 70.93 | 18.3 | −50.9 | 99.9 | 258.0 | 3.13 |
| 3 | TE/VO6 | 8.21 | 23.99 | 52.32 | 11.2 | - | - | 214.1 | 2.18 |
| 3 | TE/VO7 | 11.71 | 31.66 | 70.16 | 10.3 | - | - | 146.8 | 2.22 |
| 3 | TE/VO8 | 11.86 | 26.81 | 54.97 | 11.3 | - | - | 205.6 | 2.05 |
| 4 | TE2C | 6.52 | 19.74 | 40.00 | 13 | - | - | 325 | 2.03 |
| 4 | TE/FR1 | - | 5.88 | 6.81 | 3.9 | - | - | 572.69 | 1.16 |
| 4 | TE/FR2 | - | 22.05 | 73.64 | 12.8 | −29.53 | 63.18 | 173.82 | 3.34 |
| 4 | TE/FR3 | 2.57 | 10.34 | 29.33 | 2.8 | - | - | 95.47 | 2.84 |
| 4 | TE/FR4 | 1.82 | 21.2 | 24.9 | 7 | - | - | 281.12 | 1.17 |
| 4 | TE/FR5 | 2.97 | 14.88 | 35.96 | 6 | - | - | 166.85 | 2.42 |
| 4 | TE/FR6 | 8.42 | 14.78 | 34.23 | 6.8 | - | - | 198.66 | 2.32 |
| 4 | TE/FR7 | 5.64 | 24.4 | 63.52 | 7.5 | - | - | 118.07 | 2.6 |
| 5 | TE2D | 2.00 | 7.79 | 53.56 | 17.1 | 36.1 | 13.6 | 319.27 | 6.88 |
| 5 | TE/BO1 | - | 10.76 | 59.41 | 11.2 | 25.6 | 18.17 | 188.52 | 5.52 |
| 5 | TE/BO2 | - | 14.59 | 45.37 | 12.4 | −53.35 | 68.5 | 273.31 | 3.11 |
| 5 | TE/BO3 | - | 15.45 | 60.71 | 14.3 | −2.1 | 31.49 | 235.55 | 3.93 |
| 5 | TE/BO4 | - | 13.86 | 69.53 | 16.9 | 19.69 | 24.48 | 243.06 | 5.02 |
| 5 | TE/BO5 | - | 8.36 | 34.26 | 13.1 | 2.68 | 16.35 | 382.37 | 4.1 |
| 5 | TE/BO6 | - | 11.03 | 85.55 | 17.9 | 40.73 | 19.61 | 209.23 | 7.76 |
| 5 | TE/BO7 | 3.52 | 8.35 | 44.04 | 9.9 | 22.9 | 14.6 | 224.80 | 5.27 |
| 5 | TE/BO8 | 5.29 | 11.85 | 63.66 | 11.5 | 24 | 20.7 | 180.65 | 5.37 |
| 5 | TE/BO9 | 5.54 | 9.59 | 23.94 | 5.7 | - | - | 238.1 | 2.5 |
| 6 | TE1B | 6.82 | 17.97 | 78.84 | 3.1 | 9.3 | 33.5 | 39.32 | 4.39 |
| 6 | TE3B | 4.81 | 13.70 | 40.59 | 9.6 | - | - | 236.51 | 2.96 |
| 6 | TE3C | 2.77 | 14.01 | 60.81 | 15.5 | 8.4 | 26.3 | 254.89 | 4.34 |
| 6 | TE/AL1 | 3.01 | 16.4 | 45.95 | 8.7 | - | - | 189.34 | 2.8 |
Group 1: reference samples; Group 2: foliated rocks; Group 3: veined rocks; Group 4: fractured rocks; 5: brecciated rocks; Group 6: altered rocks. PA: foliation was loaded parallel to the maximum principal stress; PE: foliation was loaded perpendicular to the maximum principal stress.
© 2018 by the authors. Licensee MDPI, Basel, Switzerland. This article is an open access article distributed under the terms and conditions of the Creative Commons Attribution (CC BY) license (http://creativecommons.org/licenses/by/4.0/).
Share and Cite
MDPI and ACS Style
Everall, T.J.; Sanislav, I.V. The Influence of Pre-Existing Deformation and Alteration Textures on Rock Strength, Failure Modes and Shear Strength Parameters. Geosciences 2018, 8, 124. https://doi.org/10.3390/geosciences8040124
AMA Style
Everall TJ, Sanislav IV. The Influence of Pre-Existing Deformation and Alteration Textures on Rock Strength, Failure Modes and Shear Strength Parameters. Geosciences. 2018; 8(4):124. https://doi.org/10.3390/geosciences8040124
Chicago/Turabian StyleEverall, Tamara J., and Ioan V. Sanislav. 2018. "The Influence of Pre-Existing Deformation and Alteration Textures on Rock Strength, Failure Modes and Shear Strength Parameters" Geosciences 8, no. 4: 124. https://doi.org/10.3390/geosciences8040124
Note that from the first issue of 2016, this journal uses article numbers instead of page numbers. See further details here.