Membrane Separation of Ammonium Bisulfate from Ammonium Sulfate in Aqueous Solutions for CO2 Mineralisation


Thermal and Flow Engineering Laboratory, Åbo Akademi University, Piispankatu 8, 20500 Turku, Finland
*
Author to whom correspondence should be addressed.
Geosciences 2018, 8(4), 123; https://doi.org/10.3390/geosciences8040123
Submission received: 24 February 2018
/
Revised: 29 March 2018
/
Accepted: 2 April 2018
/
Published: 4 April 2018
(This article belongs to the Special Issue Carbon Sequestration)
Abstract
:The separation of ammonium bisulfate (ABS) from ammonium sulfate (AS) in aqueous solutions by monovalent ion selective membranes was studied. Optimised usage of these chemicals is both an important and challenging step towards a more efficient CO2 mineralisation process route developed at Åbo Akademi University (ÅA). The membranes were placed in a three or five-compartment electrodialysis stack. Silver, stainless steel and platinum electrodes were tested, of which a combination of Pt (anode) and stainless steel (cathode) electrodes were found to be most suitable. Separation efficiencies close to 100% were reached based on ABS concentrations in the feed solution. The tests were performed with an initial voltage of either 10 V–20 V, but limitations in the electrical power supply equipment eventually resulted in a voltage drop as separation proceeded. Exergy calculations for energy efficiency assessment show that the input exergy (electrical power) is many times higher than the reversible mixing exergy, which indicates that design modifications must be made. Further work will focus on the possibilities to make the separation even more efficient and to develop the analysis methods, besides the use of another anode material.
1. Introduction
CO2 mineralisation is one method to sequester CO2, especially at locations where underground storage is impossible or where the market potential of the solid products is recognised. The ÅA route and some modified ÅA routes have been developed at Åbo Akademi University (ÅA), Finland, as an example of CO2 mineralisation processing. The main idea is to extract magnesium from magnesium silicate rock by the use of ammonium sulfate ((NH4)2SO4, AS) and/or ammonium bisulfate (NH4HSO4, ABS) and by pH control and addition of ammonia and flue gas, finally carbonate the magnesium, which results in a stable magnesium carbonate or hydrated magnesium carbonate [1,2]. There is still, however, a need for efficient ways to recover the chemicals involved for re-use. Some research was recently done with reverse osmosis (RO) membrane separation for the same purpose [3].
Focus in this study is put on the separation of ABS from AS in aqueous solutions, and electrodialysis using monovalent ion-selective membranes [4], separating monovalent bisulfate from bivalent sulfate. The separation is nonetheless challenging since the pH control must be very accurate as even small pH changes will change the ratio between ammonium sulfate and ammonium bisulfate. It is beneficial to separate ABS from AS because ABS is a better flux salt for Mg extraction [5] from magnesium silicate rock while the downstream carbonation process step will convert it to AS. The presence of ABS will decrease with increasing pH as a result of conversion of bisulfate ions to sulfate ions. Already at pH > 2 the presence of bisulfate is less than 50%. (More detail is given below.) The aim is therefore to recover ABS before the solution proceeds to the carbonation step where pH is high (≈10). This motivates placing a separation unit at the beginning of the process, immediately after the initial extraction step. Furthermore, iron (from the silicate rock) present in the solution will start to precipitate at pH above 3 so pH must be kept <3 in order to be able to apply electrodialysis to solutions free from precipitated particles. The presence of combined AS and ABS will improve the extraction, which makes it interesting to put attention to both species [5].
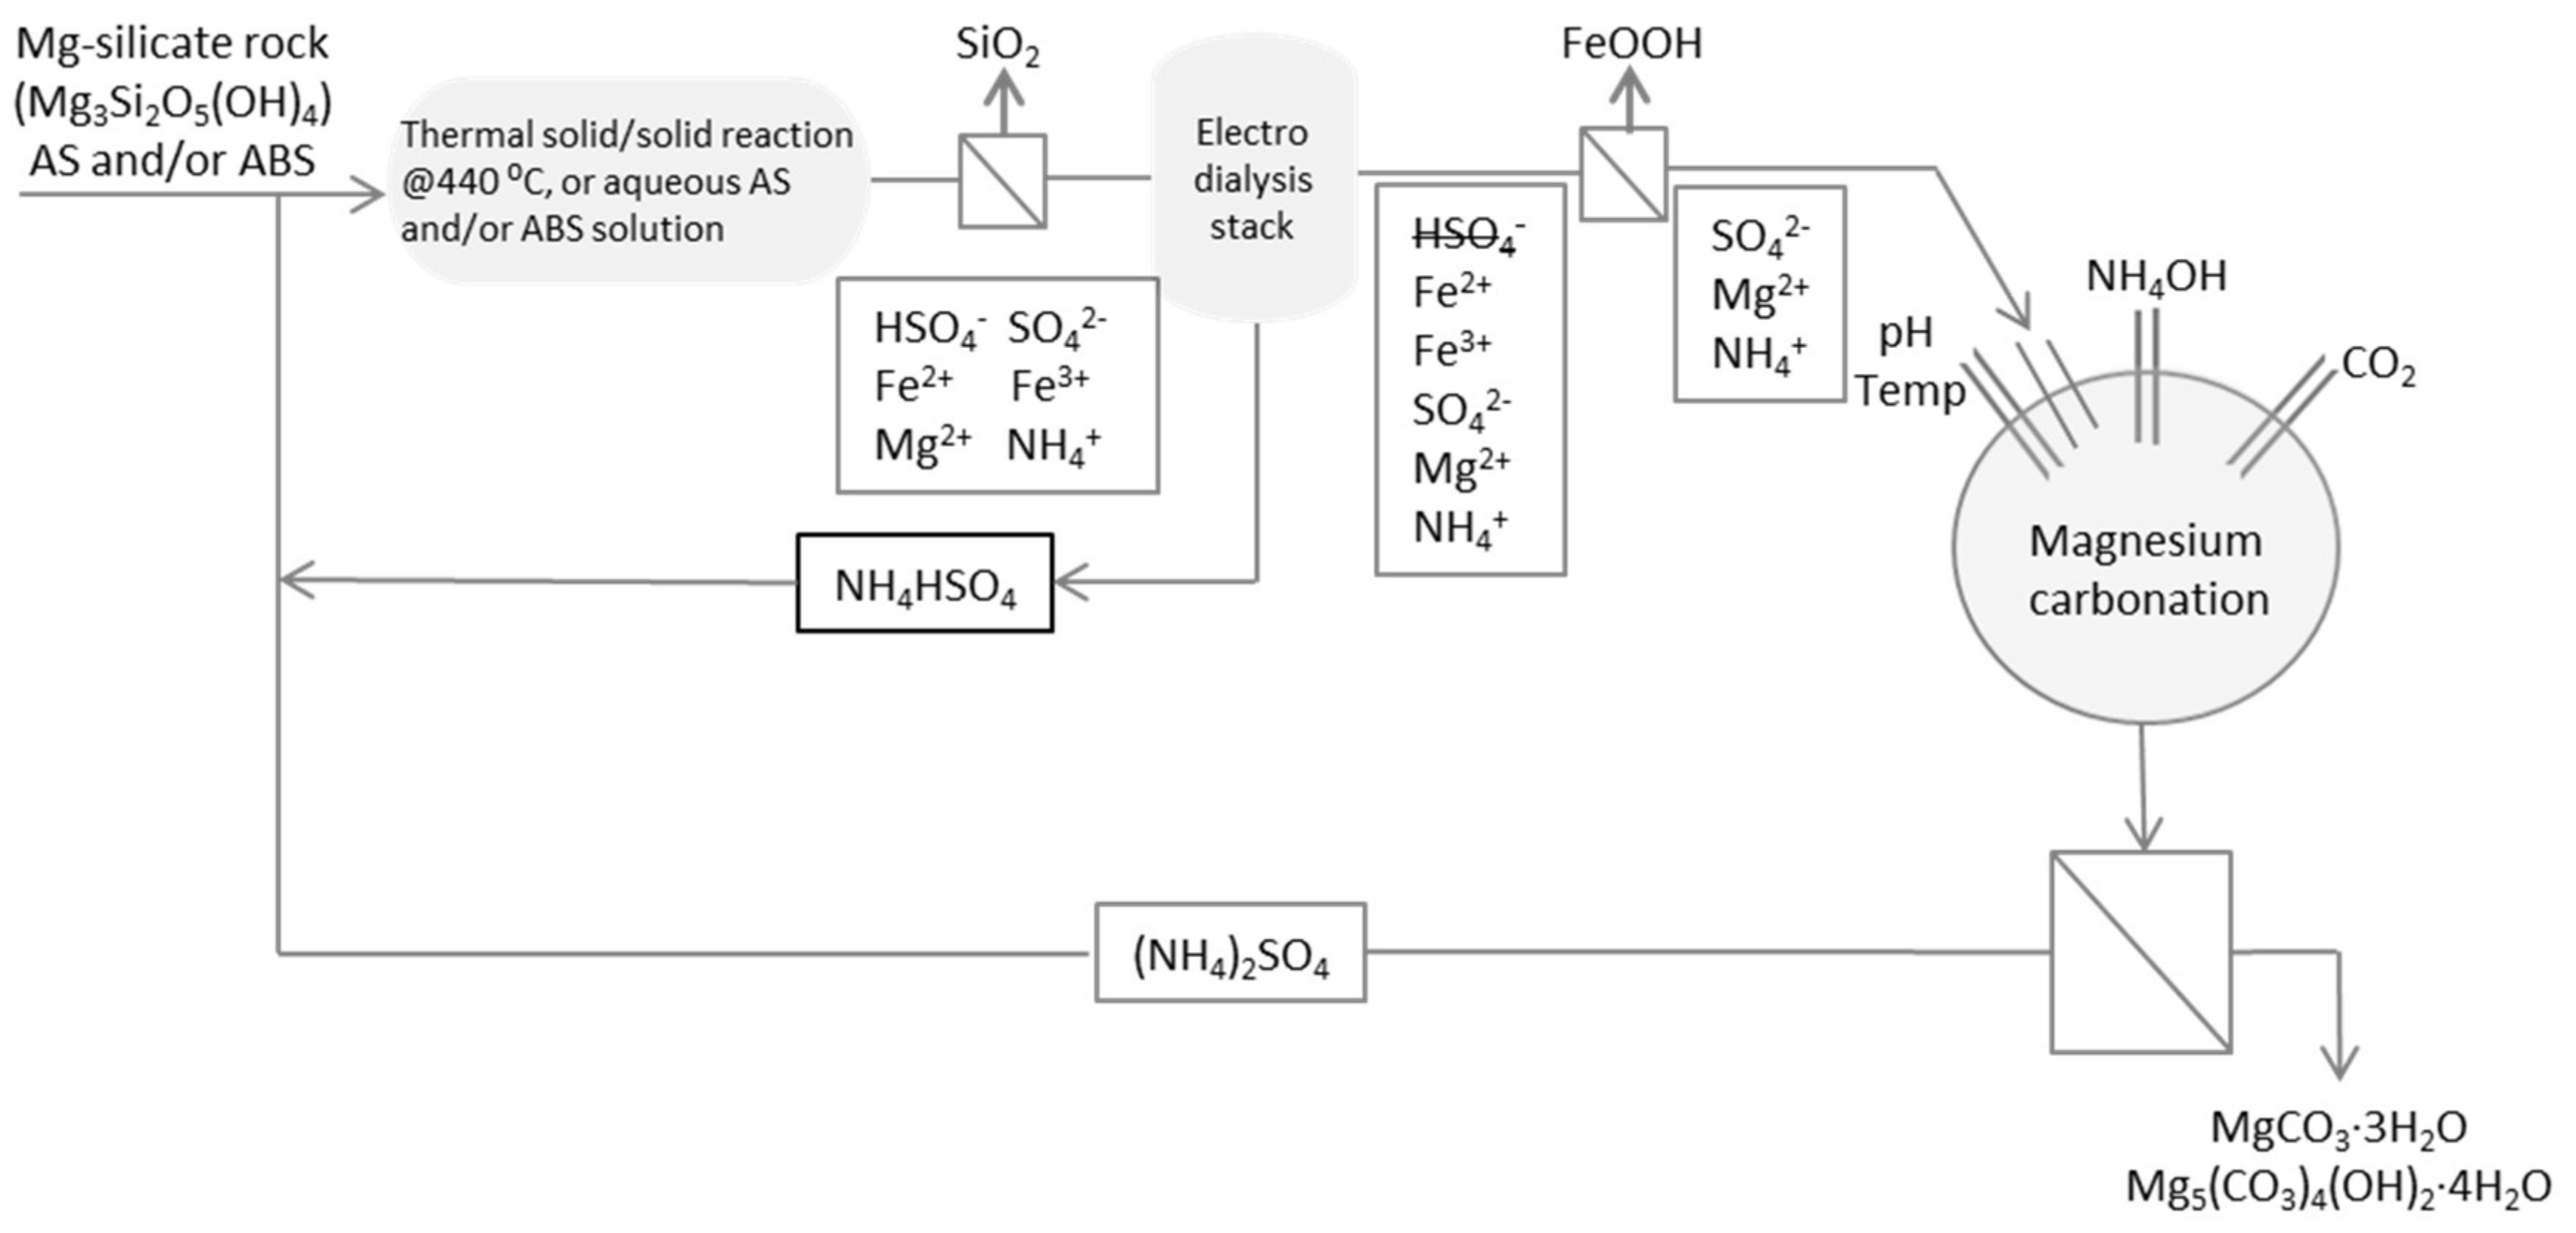
Very little has been reported on the separation of ammonium bisulfate from ammonium sulfate, which therefore put demands on designing a novel method for this. We recently [6] presented several options for making the recirculation and usage of input material more efficient. One suggestion for minimising the losses of AS and ABS was to investigate the suitability to use ion exchange membranes or resins to separate ABS from AS in the process stream. Monovalent membranes and electrodialysis were suggested and have been tested in this study. Figure 1 presents this option for the separation and shows where electrodialysis could be integrated to the (alternative, wet-wet) ÅA route [7].
1.1. Electrodialysis and Sulfate Separation
Despite the fact that little has been reported about the separation of ABS from AS, there is some valuable reporting on the usage of monovalent membranes that is applicable to what has been tested here. The very recent review paper by Campione et al. makes on briefly mention of electrodialysis for selective separation of monovalent ions from divalent ions [8]. A recent study by Yusuf et al. [9] investigated the possibility to use electrodialysis as an option to treat RO concentrates. Seawater concentrate was led through an electrodialysis stack with three compartments and different parameters such as salinity, chloride, pH and voltage were monitored. Salt recoveries of approximately 15% were reported using Ag-electrodes with a current density at 2.5 mA/cm2. Silver electrodes as well as platinum and stainless steel electrodes were compared in the study. The separation of mono and divalent ions from aqueous solutions has also been studied by Van der Bruggen et al. [10]. Both nanofiltration and electrodialysis were tested and nanofiltration seemed to perform somewhat better than electrodialysis, but electrodialysis with ion selective monovalent anion and cation membranes (ACS/CMS) still gave a separation efficiency close to 50% for a Na2SO4-MgSO4 solution applying 5V for 35 min.
A similar approach to what has been studied here was presented by Koter et al. [11] who studied the influence of initial concentrations and applied voltage in the separation of ammonium nitrate and sulfate solutions. The study concluded that it was possible to reduce the concentration of sulfate below 0.002 M in a solution initially containing not higher than 0.8 M. It also discussed the decrease in current efficiency as a maximum of electric current is reached, and when the electrodialysis process should be stopped as a result of increased electricity consumption. Modeling of a three-compartment membrane electrodialysis stack was done by Gao et al. [12] with the aim of predicting exit concentrations in the desalting cell and to optimise the electrodialysis process. Some experimental work was also carried out at constant current density and an operating time of 1 h. No studies or literature has been found about electrodialysis separation of ammonium bisulfate solutions, which stresses the need for finding and designing a way to process and recirculate this type of process streams.
Gamala et al. [13] aimed at selectively removing divalent ions from seawater using electrodialysis, reporting the important finding that lower applied current density gave a better preferential removal of divalent ions. Very recently, focusing on selective mono- and divalent cation separation from brackish water by electrodialysis at several equipment sizes. Xu et al. [14] reported very similar performance of bench-scale and pilot-scale process units.
1.2. Exergy Calculations
Exergy calculations [15] may be used in order to determine the energy efficiency of the separation using electrodialysis. This could be done by comparing the input energy for the separation with the exergy of mixing, ∆Exmix. The input energy, i.e., electric power, is equal to the input exergy. By knowing the electric current (I, C/s) the voltage (U, J/C) and the time (t, s), it is possible to calculate the input exergy in joules after time t as
The reversible exergy of (un-)mixing could according to Szargut et al. [15] be calculated as
where T0 is the surrounding temperature, nip and nif the molar amounts of “i” in the product “p” and feed “f” streams, respectively and xi the molar fraction of the components. The compositions of the initial and obtained solutions must thus be known in order to be able to calculate the exergy of mixing. This could be achieved by measuring the concentration of ammonium ions and pH, of which the latter could give an indication about the ratio between HSO4− and SO42− ions in the solution. Furthermore, the sum of concentrations of NH4+ + H+ is equal to the sum of 2·SO42− + OH− + HSO4−, adding up to zero net charge. (See Appendix A for a brief discussion on taking into consideration activity coefficients.)
2. Materials and Methods
2.1. Material
Electrodialysis stacks made of two types of polyvinylchloride (PVC) plastic were used for the experimental part of the work. It consisted of three or five compartments (cells). The width of one cell was either 18 or 40 mm, the inner diameter 99 mm and the membranes were placed in between the separate cells. Simple schematic figures of the experimental setup with three or five cells is shown in Figure 2. The experimental setup as it was arranged with three 40 mm cells is shown in Figure 3. Process solution is initially fed to the anode and cathode compartments (cell 1 and 3, respectively) and distilled water to the middle cell (cell 2). In the case with five cells every other cell is filled, i.e., also the middle cell (cell 3) is filled with process solution from the start. It will become depleted with ammonium and bisulfate ions as these ions are transported towards the anode and cathode, respectively.
Recirculation was applied for some tests. For this setup it means that solution was pumped between the anode and cathode cells at a volume flow rate of 20 mL/min. Recirculation enables ions that otherwise would accumulate at one side of the stack to be transported to the middle section, since cell 1 and 3 (or 5 in case of five compartments) only let either positively or negatively charged ions through the membrane, respectively. The objective with recirculation was to create a situation similar to a continuous process, where a feed would be entered from the upstream extraction with the bisulfate-containing stream from the eletrodialysis returning upstream while the other product stream from the separation would proceed to carbonation. The setup is shown in Figure 4.
EURODIA cationic monovalent membranes (CMS) and anionic monovalent membranes (ACS) were used in the experimental setup. The membranes were suitable for pH ranges between 0–10 and 0–8, respectively. A more detailed specification list is found in Appendix B.
Analytical solutions containing equal concentrations of both ammonium sulfate (Merck, 99.5%) and ammonium bisulfate (Fluka, 98.0%) were dissolved in distilled water. One test was also done that involved adding magnesium sulphate (Alfa Aesar, 99.5%) to a AS + ABS solution. Three point calibrations of the ion selective electrodes (ISE) used were made using ammonium chloride (Merck, 99.8%) solution concentrations between 0.0001 and 0.1M.
Both plate-shaped 99.9% pure silver electrodes and 316 stainless steel electrodes with size 6.25 or 8 mm × 100 mm, respectively, were used for the tests. At a later stage also platinum wire was used as anode electrode. The voltage was adjusted to between 10 and 20 V and the electrical current variation was continuously recorded.
2.2. Methods
2.2.1. Experimental Procedures
Initially, the transport of ions without any electric power use was tested by adding distilled water to the middle cell while solutions containing both 0.03 M ammonium sulfate (AS) and 0.03 M ammonium bisulfate (ABS) were added to both the anode and cathode cells (left and right cell, respectively). Conductivity, pH and the NH4+ concentration of the solutions were measured before they were added to the stack. These parameters were also measured after 24 h and 48 h, respectively.
The electrodialysis stack was thereafter connected to a power supply and a multimeter with electrodes immersed to the anode and cathode cells of the stack, respectively, Figure 3. Solutions with concentrations of AS and ABS, respectively, varying between 0.03 and 1 M, and an initial voltage varying between 10 V or 20 V were tested. One test was also done with only 0.1 M ABS at 20 V with the aim to see how the absence of AS would affect the separation efficiency, and another test was done adding magnesium sulfate to a 0.1 M AS + ABS solution. At a later stage also pumping of (i.e., circulating) the solutions between the anode and cathode cells was done with a flow rate of 20 mL/min.
Sampling was done by taking a 10 mL or 20 mL sample from the middle cell (depending on if 18 mm or 40 mm cell width was used) and analysing the sample for pH, conductivity and NH4+ concentration.
2.2.2. Analysis Methods and Devices, Calibration Curves
A NICO 2000 ELIT ISE NH4+ electrode was used together with a ELIT 003N double junction reference electrode in order to measure the ammonium concentration in the solutions. pH was measured with a METTLER TOLEDO InLab Expert NTC30 pH electrode connected to a MeterLab PHM220 pH meter. The conductivity was measured using a PASCO scientific 699-06621 conductivity meter connected to a PASCO Xplorer GLX datalogger. A multimeter was used to continuously measure the current in mA.
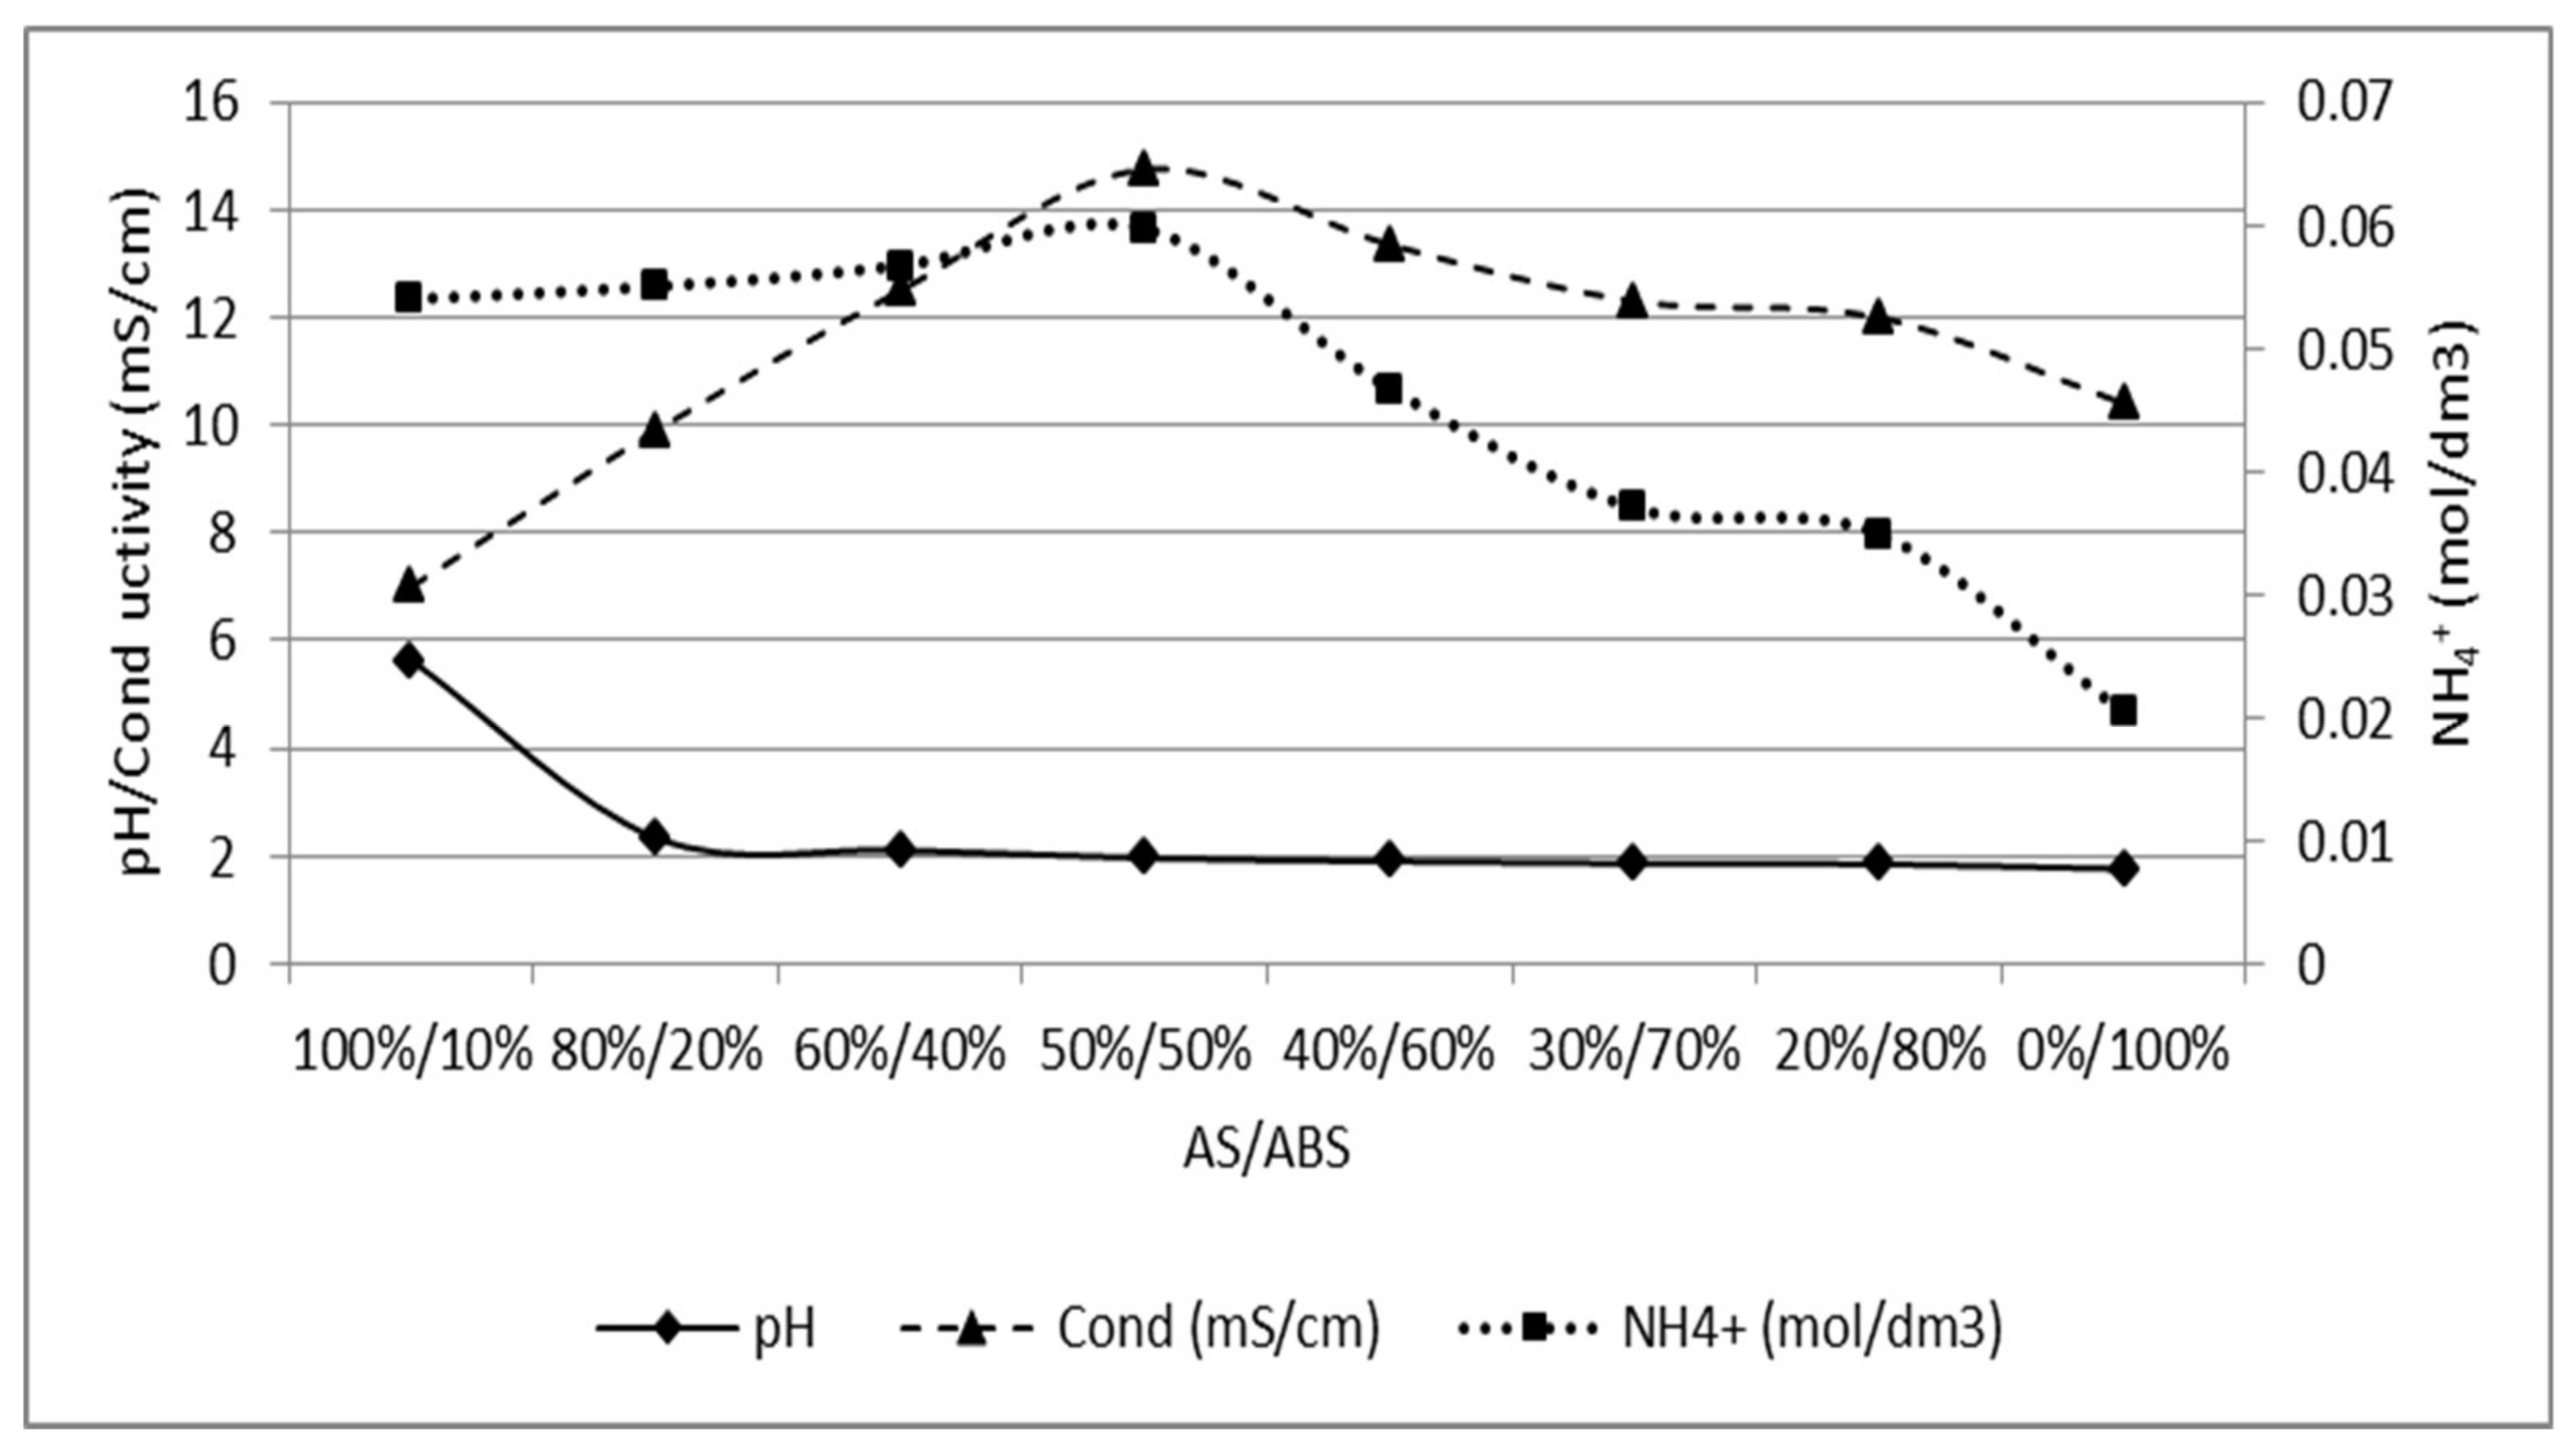
NH4+ and pH were measured in solutions with varying concentrations of AS and ABS, respectively. This was done to determine the correlation between NH4+ concentration and pH. Knowing both makes it possible to determine the ratio of AS/ABS in the solutions. A calibration curve was prepared for solutions containing up to 0.03 M of AS and ABS, respectively, and is given in Appendix C.
3. Results and Discussion
3.1. Reference State of the Electrodialysis Stack
The test with 0.03 M AS and 0.03 M ABS solution resulted in separation even if no power supply was connected to the electrodialysis stack. The separation of ions was expected since transport will take place as a result of a driving force to even out the concentration differences between the cells. It was ensured that the membranes do not have the possibility to let water molecules pass while also the possibility of leaking was checked since such a case obviously will result in concentrations evening out in between the cells. Table 1 shows how pH, conductivity and ammonium concentration slowly changed over time. There are some challenges to measure the ammonium concentration, as a result of possible evaporation of ammonia gas (NH3).
3.2. Separation of ABS with a Three Compartment Setup
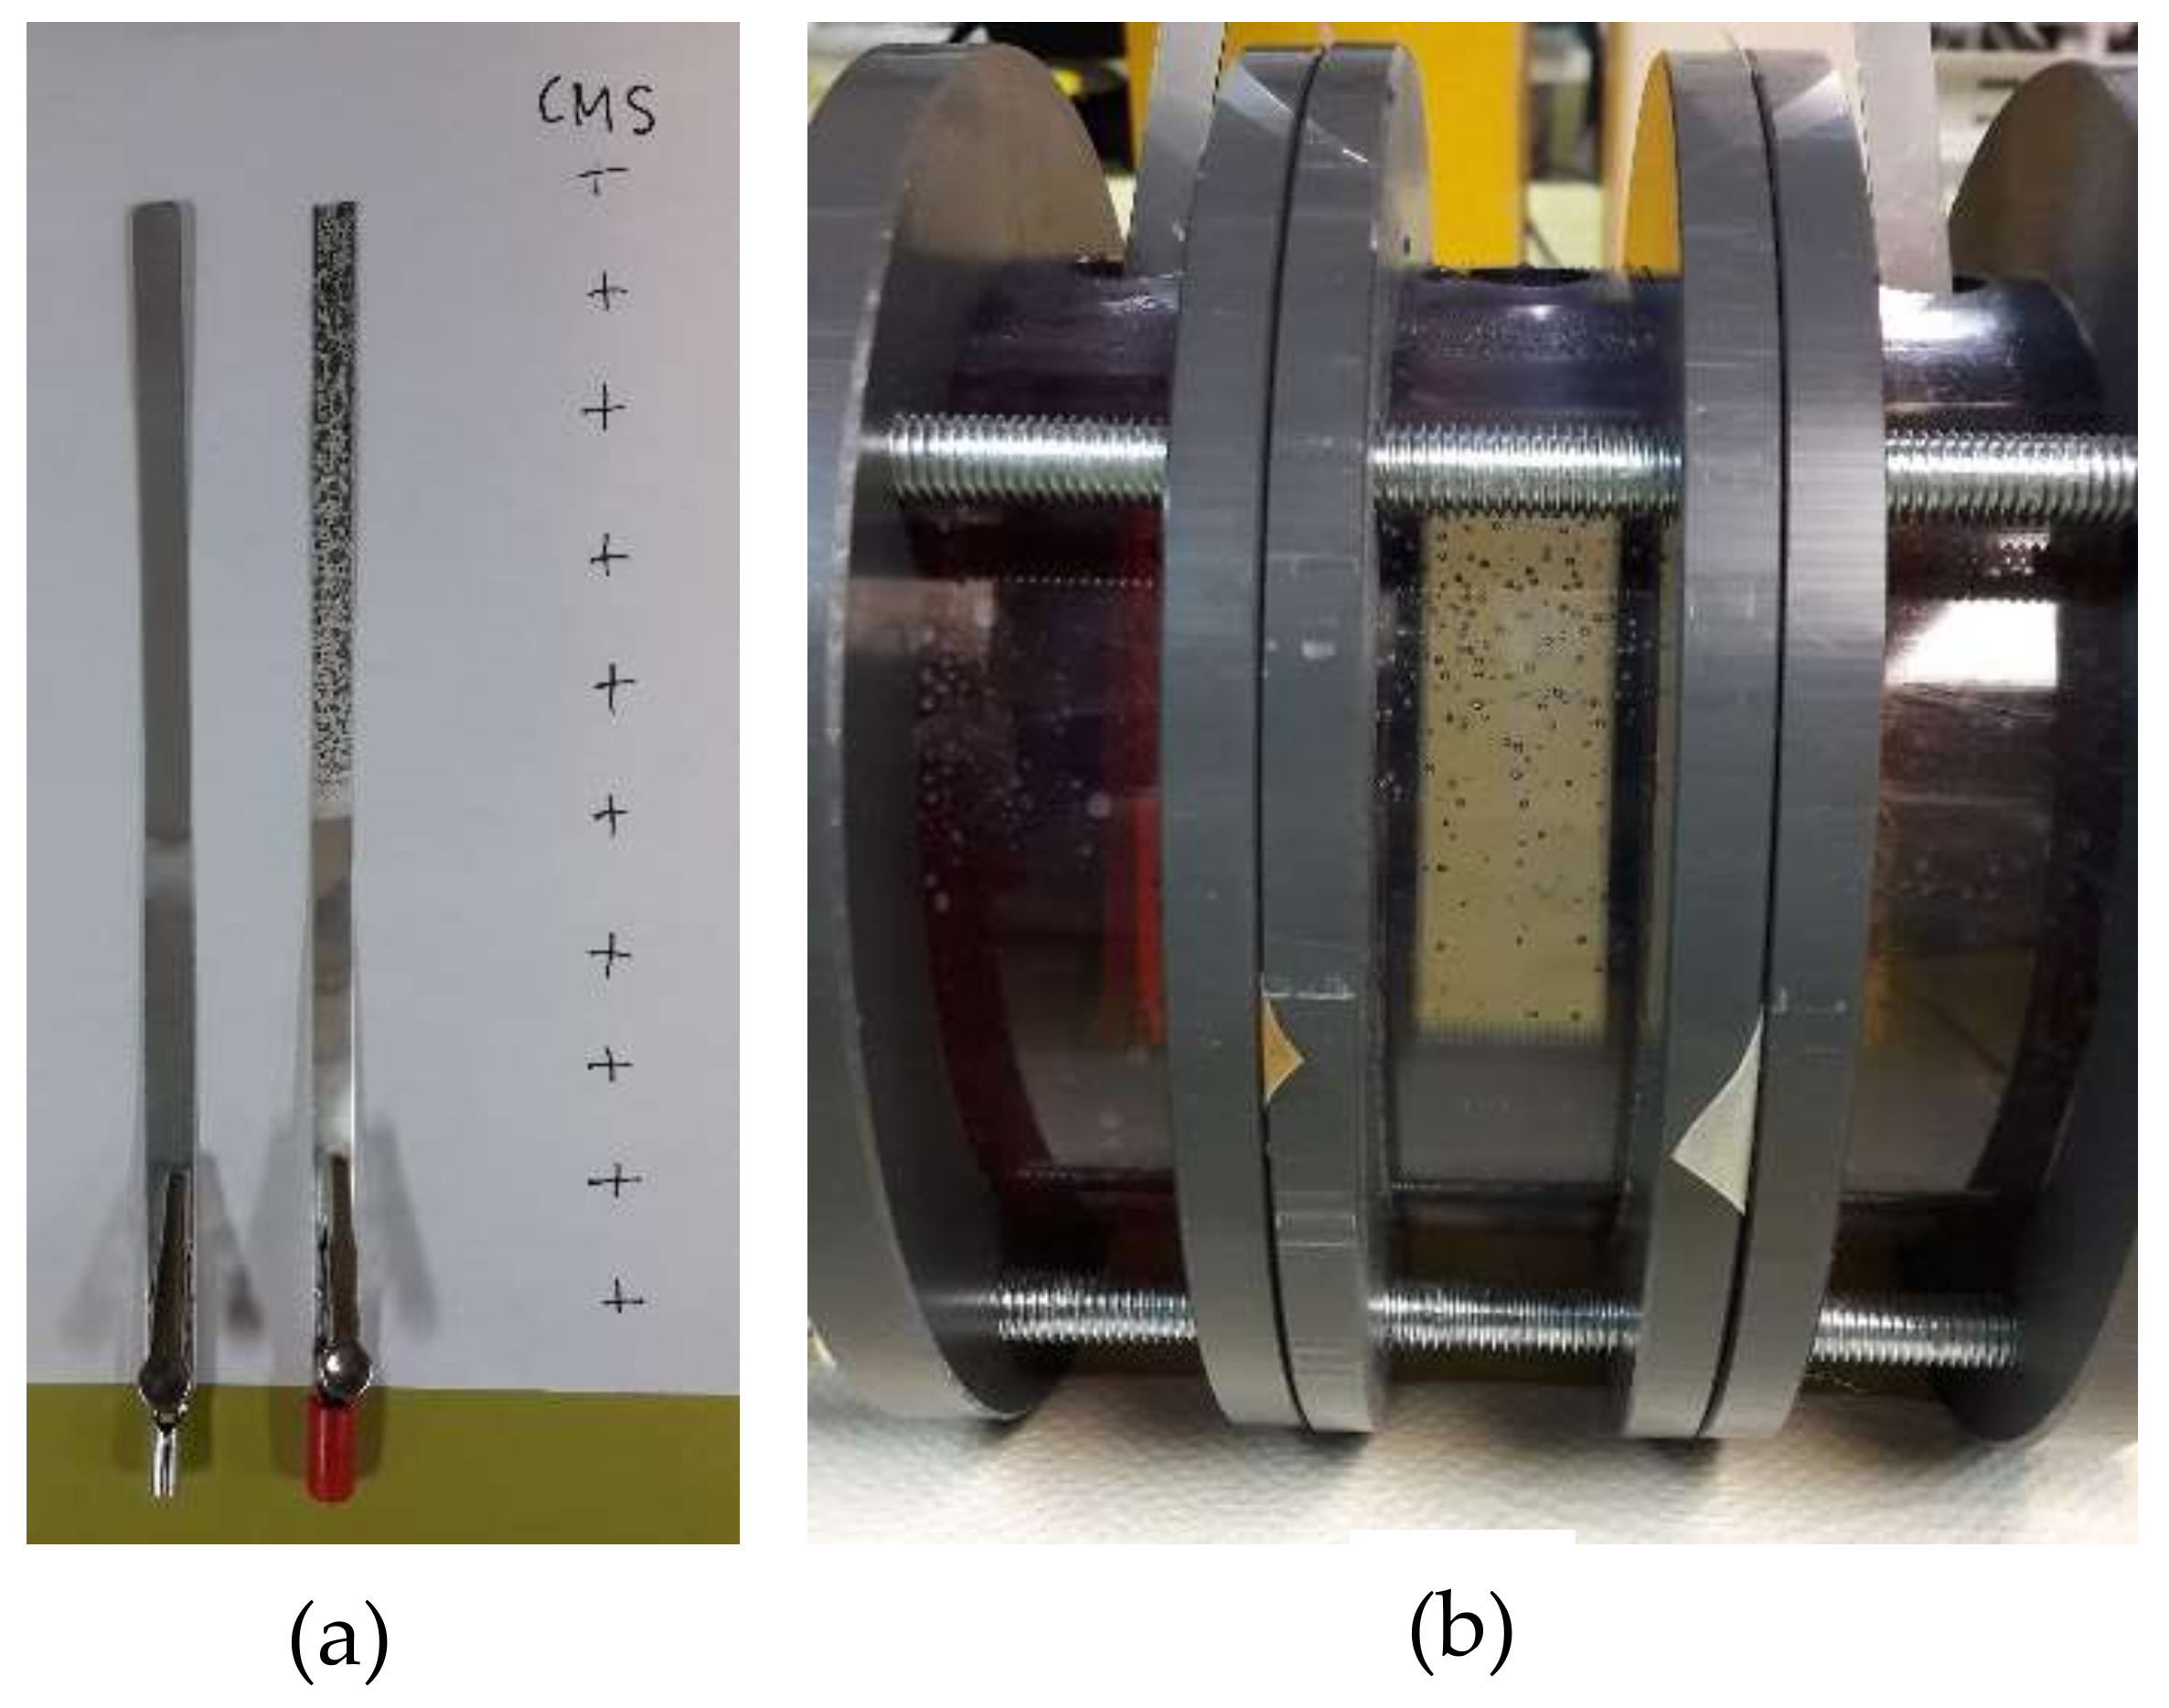
Six tests were done according to Table 2 with varying electrode type, voltage and concentration of AS and ABS, respectively. It was concluded after one test that silver is not a suitable anode electrode material. Precipitation occurred on the electrode already after short time (20 min, test 2). Sulfuric acid may dissolve silver, which could be an explanation why this happened. No data from this test (3) will be presented in following figures. In the anode cell H+ formation occurs, which in combination with SO42− will result in sulfuric acid conditions. The stainless steel electrodes performed better, even if there were some issues with colouring in the anode cell. This could be explained by minor iron dissolution, since the anode electrode was found to decrease in weight after every test (approximately 2.5 wt %), while the cathode electrode weight remained constant. Images of the electrodes and the red solution obtained are shown in Appendix D.
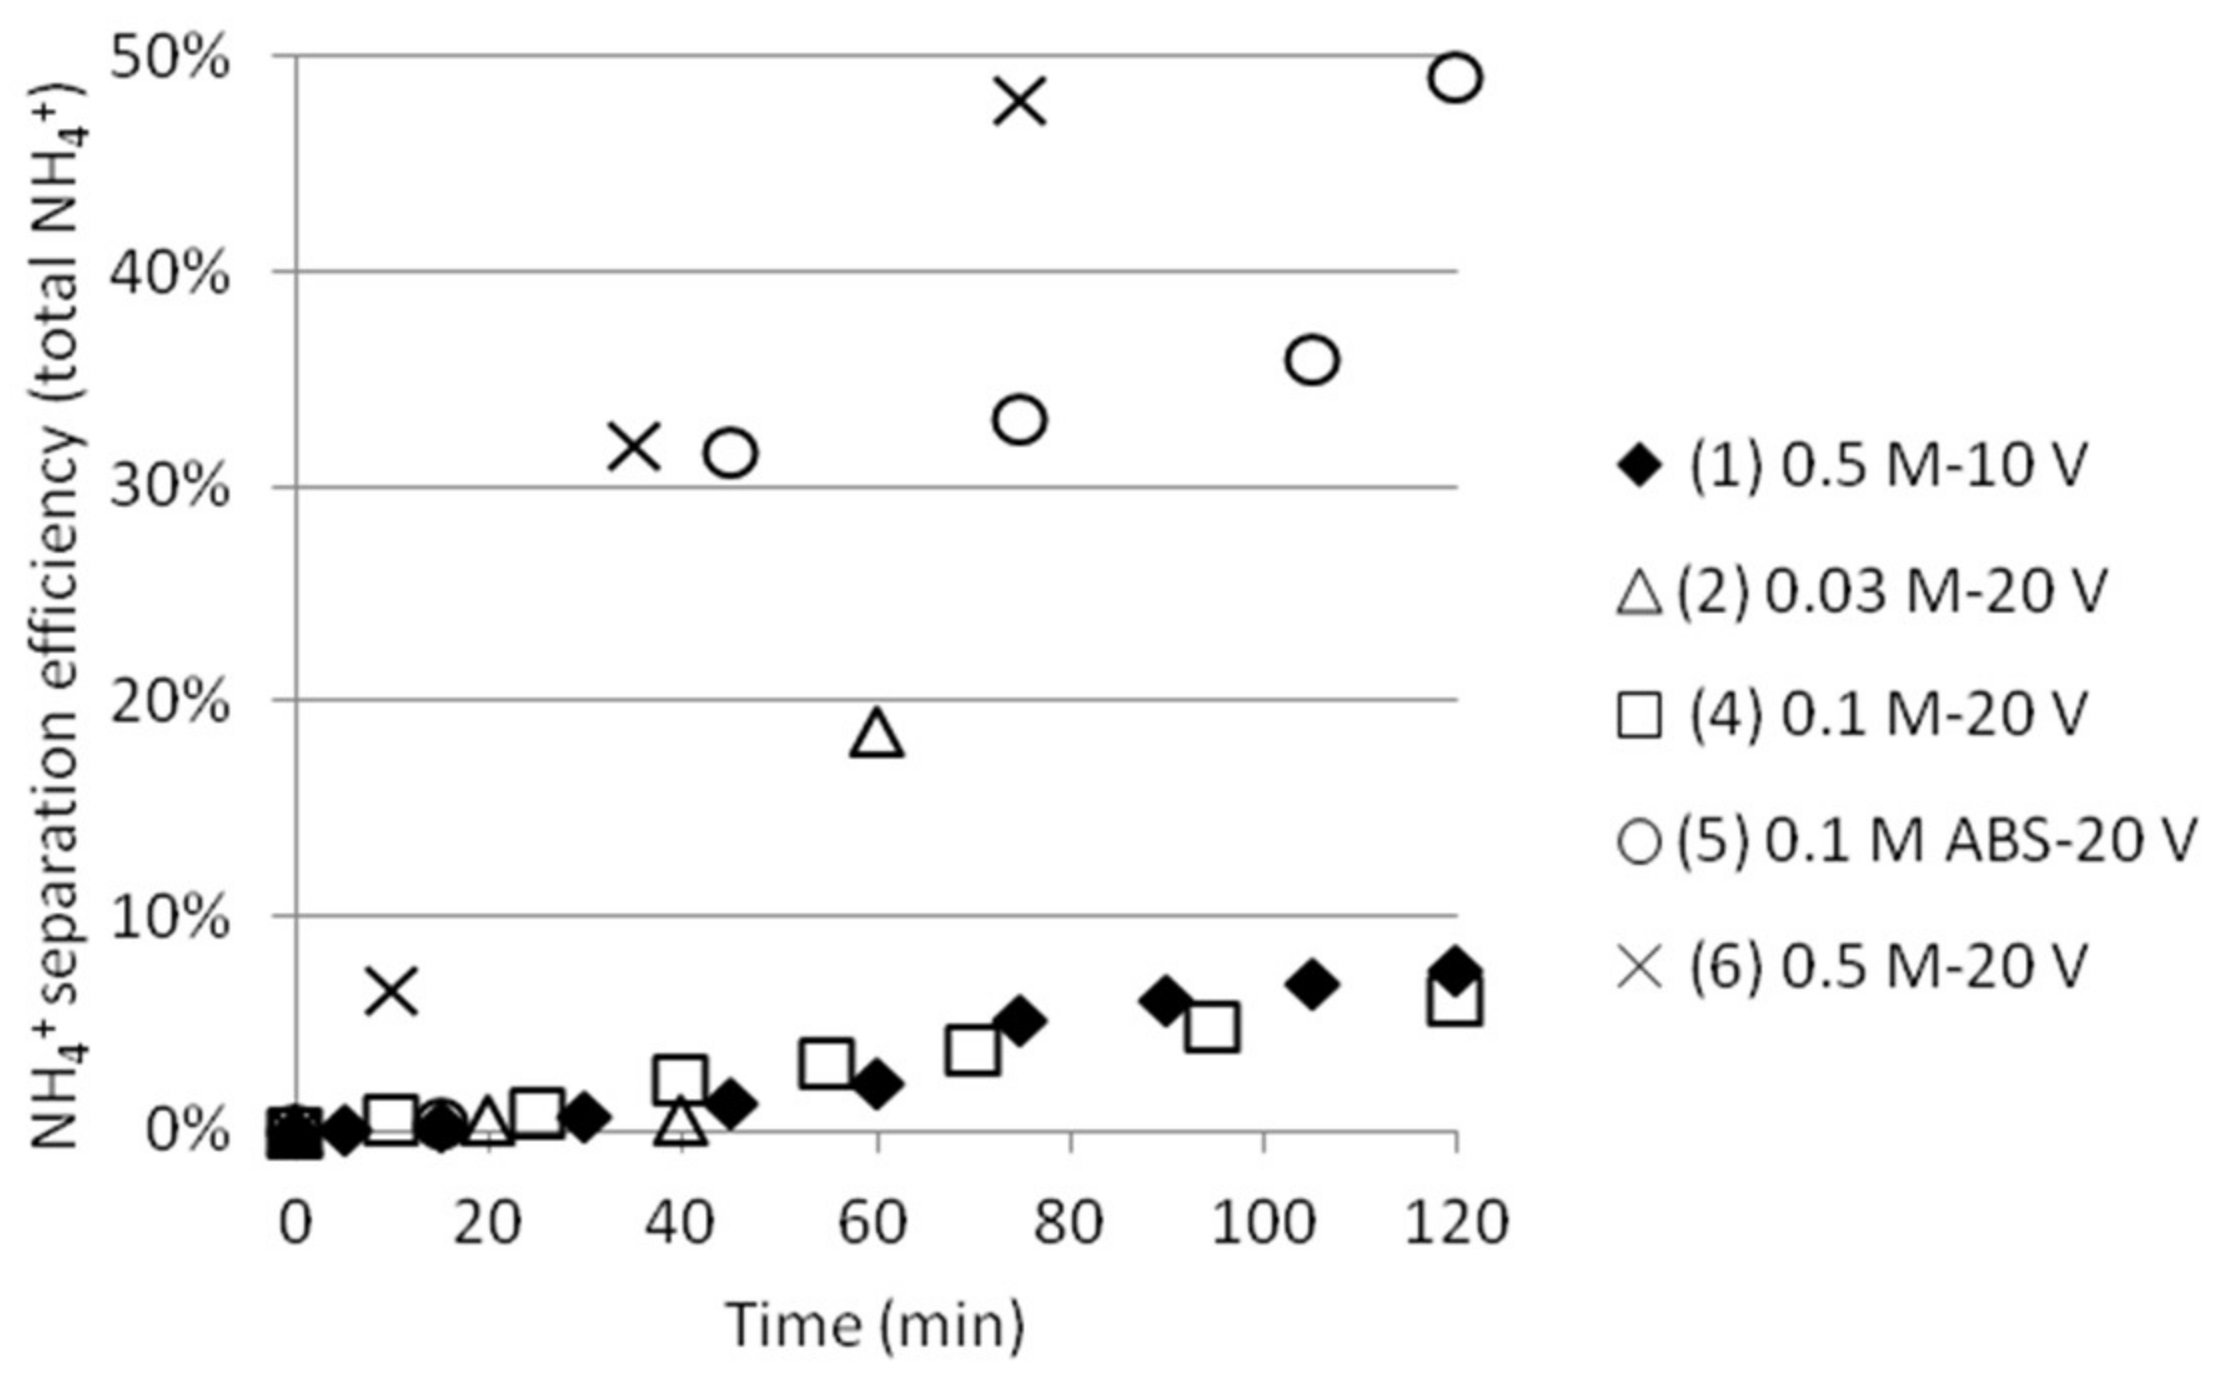
The ammonium separation efficiency was calculated based on the measured total initial concentration of NH4+ in cell 1. Separation efficiencies based on the total initial ammonium concentration in cell 1 compared to the achieved ammonium concentration in cell 2 are shown in Figure 5. Even if the theoretical concentrations of NH4+ were set to 3 × 0.03, 0.1 and 0.5 M (two ammonium from AS and one ammonium from ABS, except in the case where only ABS was used), respectively, the ammonium concentrations measured by the ISE electrode were lower. (The reason for this is currently being investigated.) Efficiency is calculated from the difference in measurements at time 0 and at the moment of sampling at any times, which to some extent cancels out this analysis anomaly. Test 5 gave better separation efficiency than test 4 by using this method of calculating. This could be explained by the fact that the initial total ammonium concentration was lower and that no ammonium from AS can contribute to the total ammonium concentration in this case, automatically resulting in higher separation efficiency values. SO42− ions should not be able to pass the ACS membrane between cell 2 and 3. This, together with the fact that a significant amount of NH4+ will stay outside the middle cell, indicates that ABS actually will separate from AS. More tests should, however, be conducted before any stronger conclusions can be drawn.
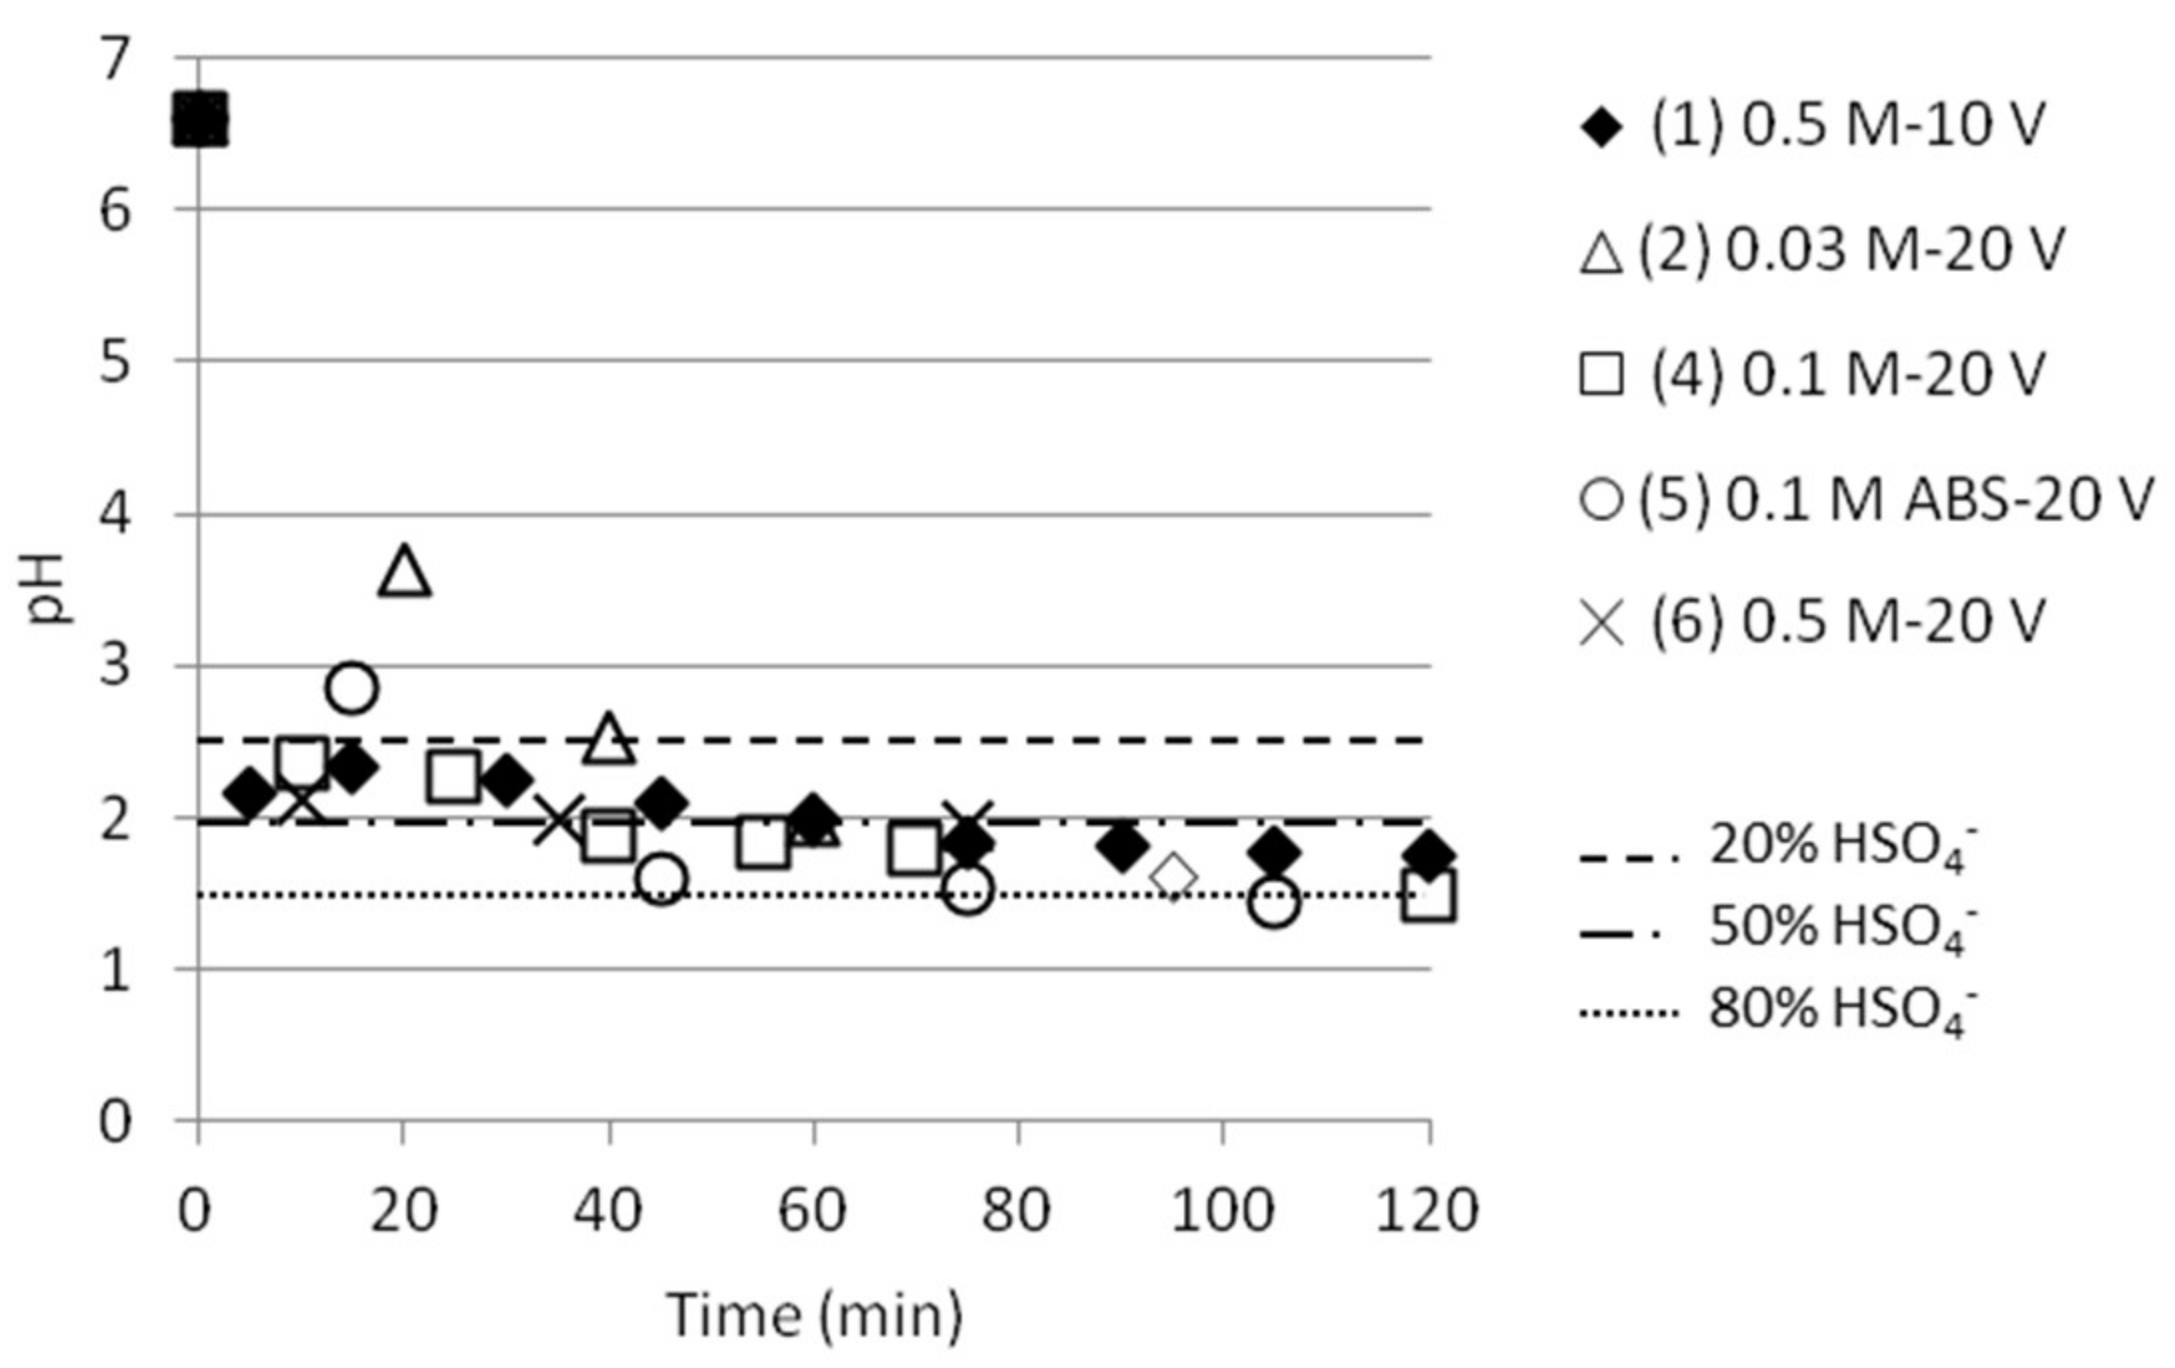
pH was measured in the cell 2 in conjunction with measurements of NH4+ and the measured values are presented in Figure 6. The same trend is followed independent of (starting) concentration, but a slightly slower decrease in pH (i.e., increase in ABS concentration in cell 2) could be noticed for the lowest concentration at 0.03 M. Figure 6 also points out the pH values where the presence of HSO4− is 20%, 50% or 80%, the rest being SO42−. Most tests reached pH values around 1.5, which corresponds to approximately 76% HSO4− and 24% SO42−, respectively. This makes it possible to calculate how much ABS is present in cell 2, and thus the ABS separation presented in Table 3.
The presence of bisulfate ions needs to be calculated in order to obtain values of the ABS separation efficiency. This is done using the expression for the reaction of bisulfate to sulfate;
The equilibrium constant, Ka, and the equilibrium ratio are thereafter used in order to calculate the ratio between sulfate and bisulfate ions
which gives the expression
Knowing the ratio and the concentration of ammonium ions in the solution makes it possible to calculate the concentration of bisulfate ions, using also the electroneutrality (sum negative charges = sum positive charges). Table 3 also shows the measured parameters and the calculated concentration of bisulfate ions together with the ABS separation efficiency for every test. pH and [NH4+]final were measured in the middle cell and [NH4+]initially as ABS comes from measurements in the initial solution that was added initially in cell 1 and 3. The results show that the efficiency could be calculated in different ways, and that the NH4+ efficiency (Figure 5) does not necessarily say everything about the efficiency of ABS separation efficiency. Proper analysis methods have to be developed in order to get comparable results independent of concentrations and analytical solutions used. In Table 3, test 4 gives a better separation than test 5, even if test 5 with only ABS showed better NH4+ separation efficiency. One option is therefore to also to take pH into account and calculate the presence of the different species using Equations (3)–(6).
Perhaps more accurate AS and ABS concentrations could be achieved by using activity coefficients—these were not used in this study, however, as only insufficient or incomplete data could be found in the open literature [16]. A Gibbs energy minimisation software may allow for gaining more insight, depending on what information is available in the databases for the software. (See also Appendix A.)
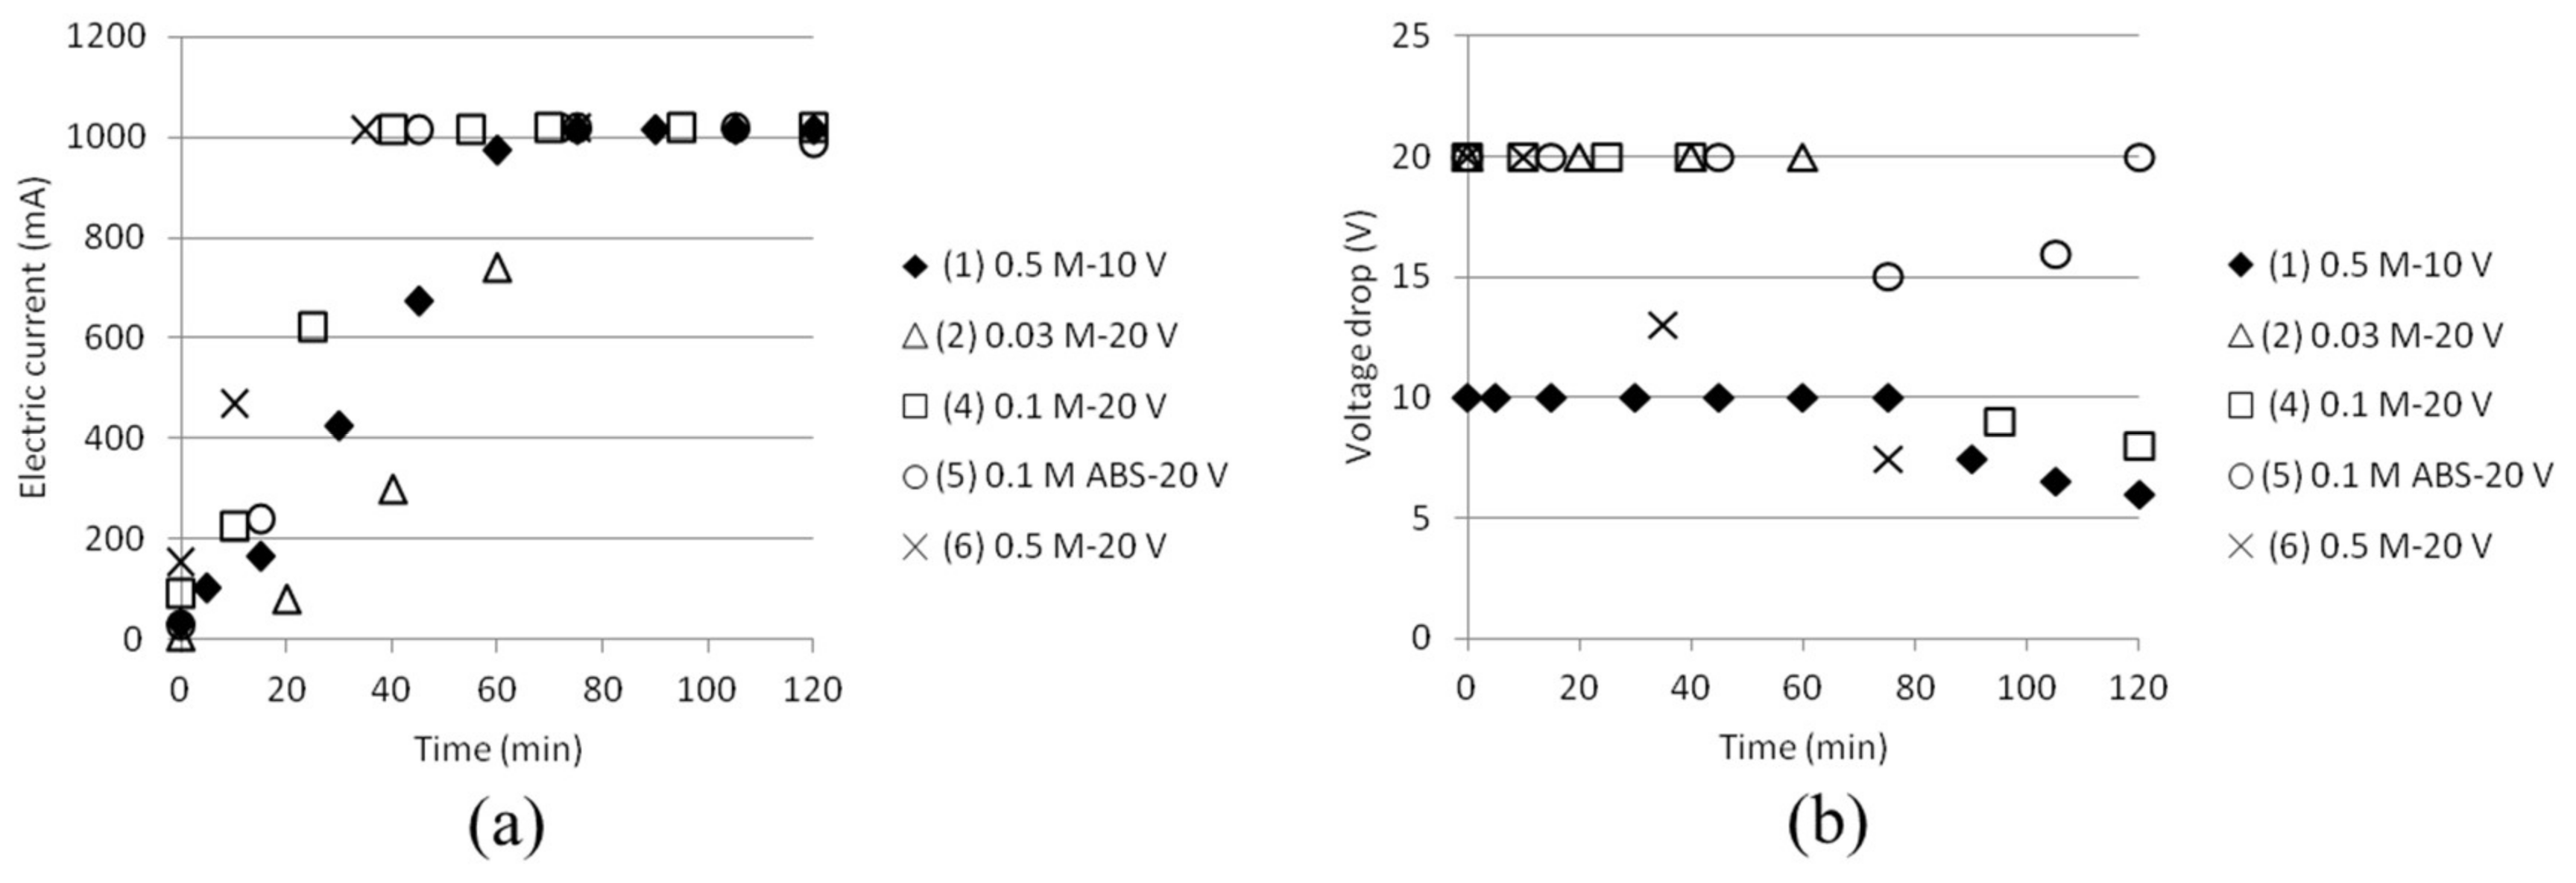
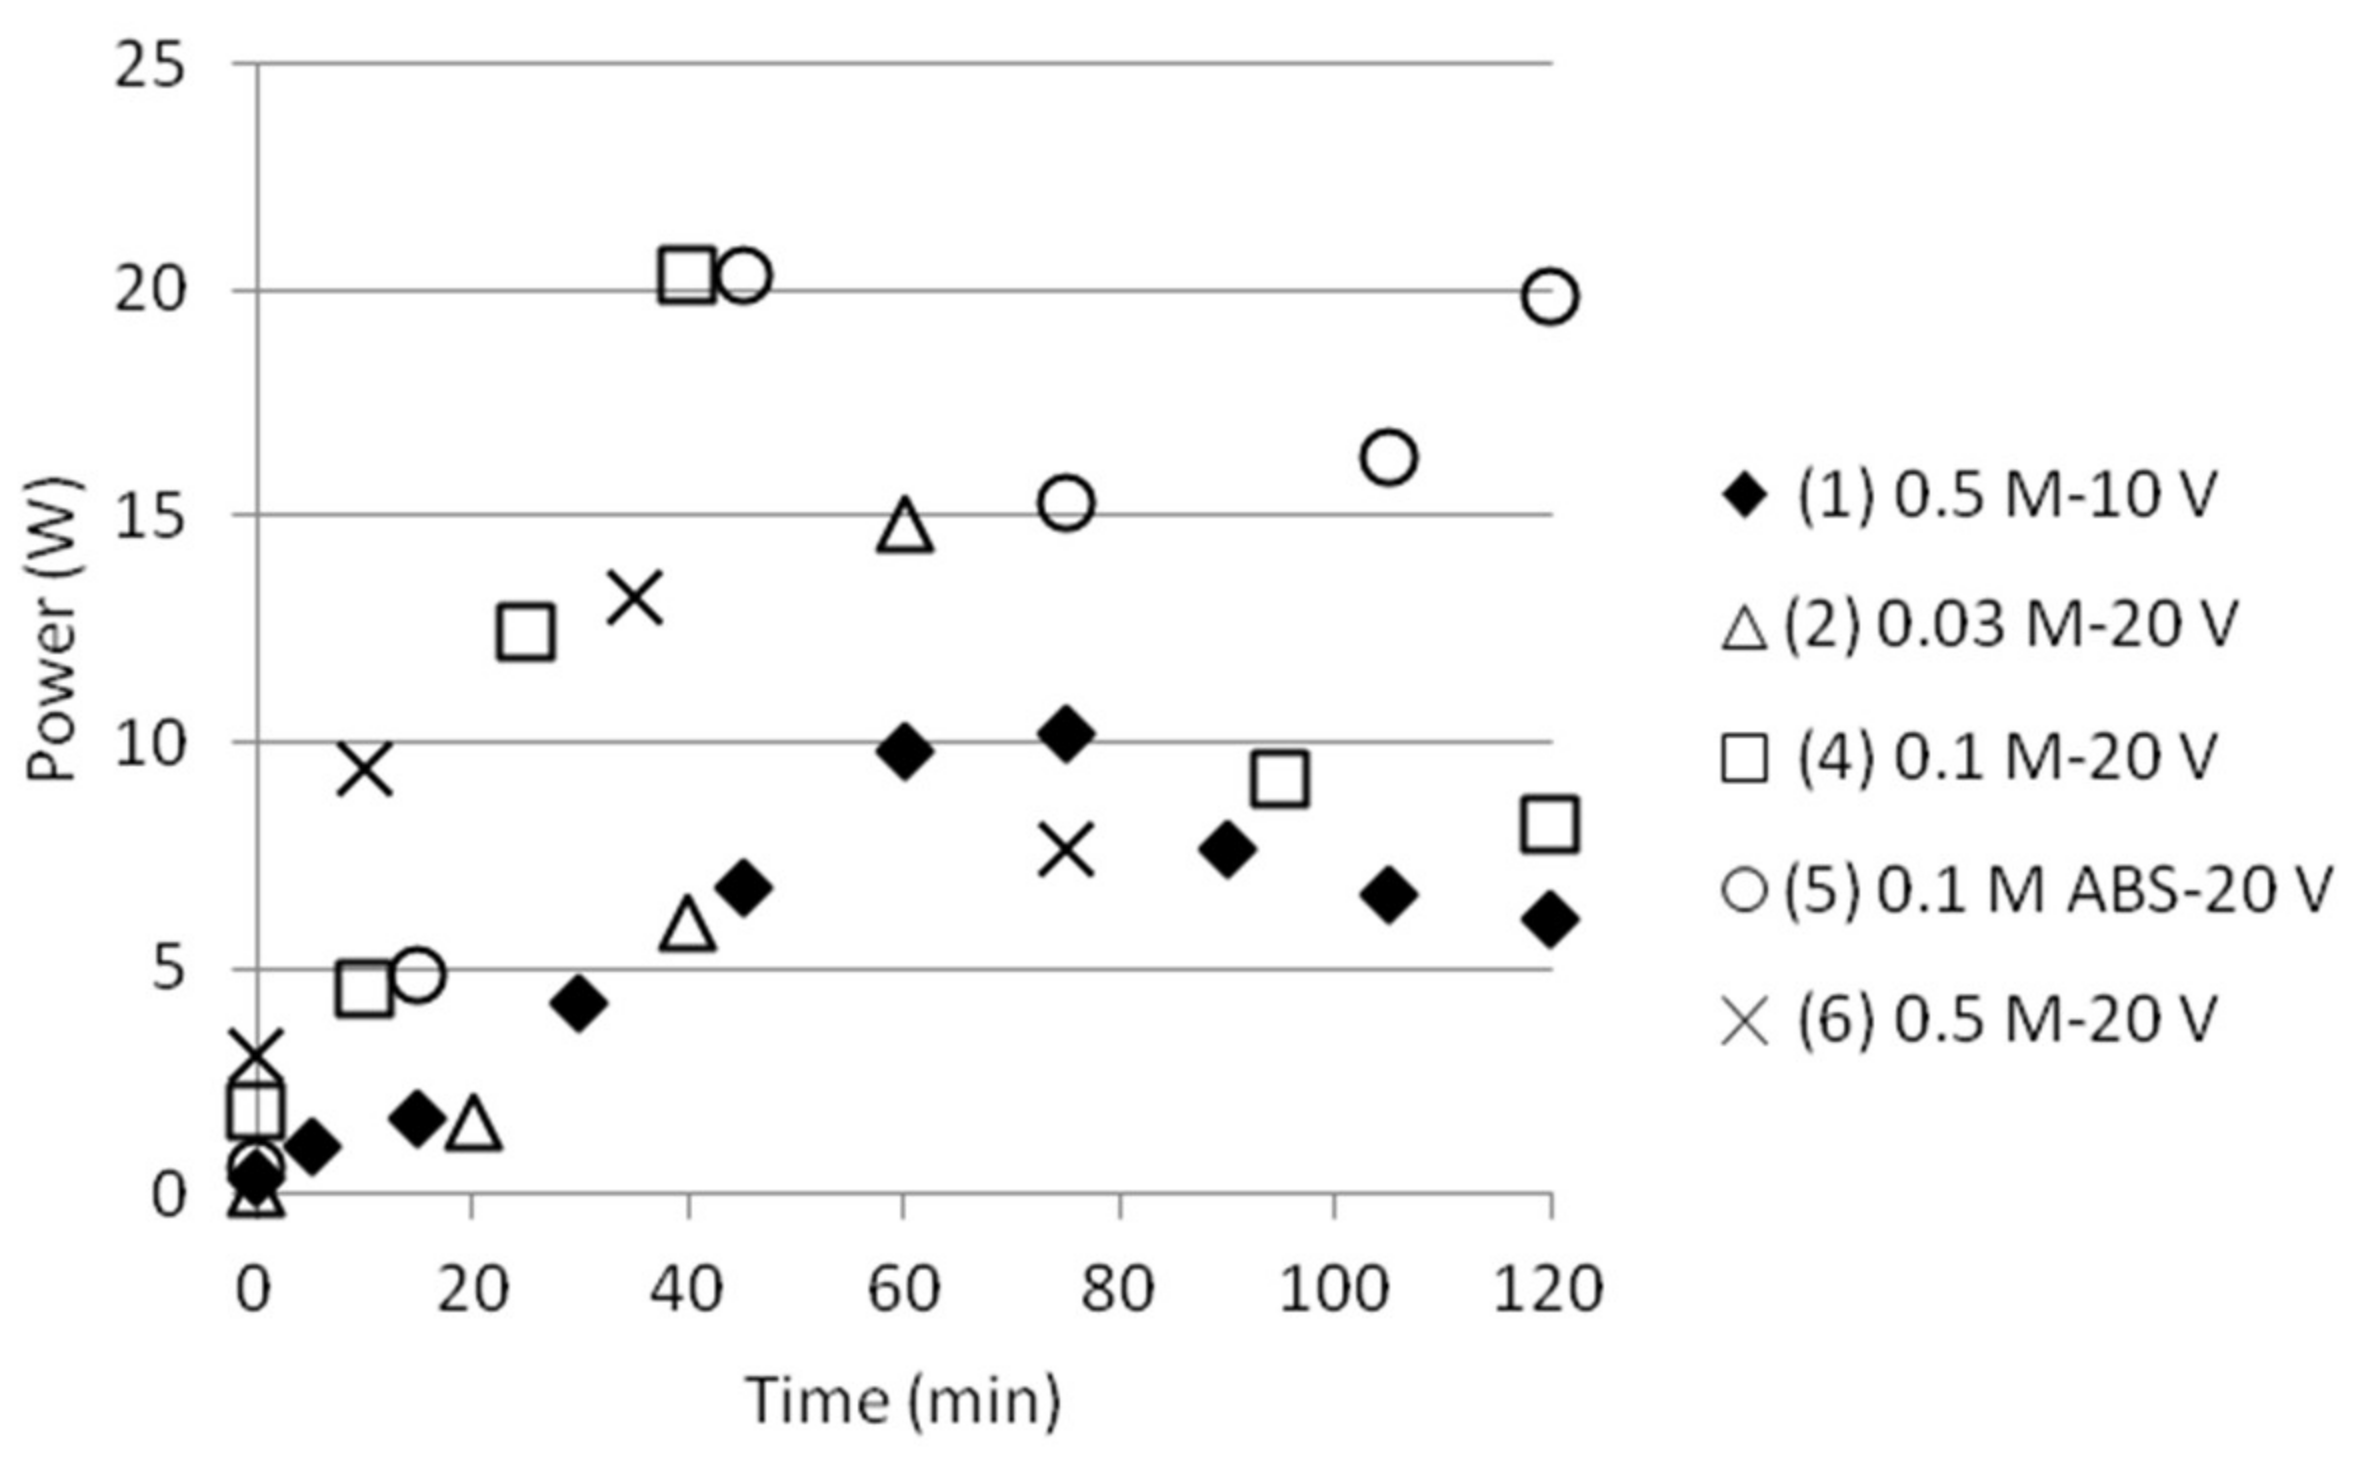
The electric current was continuously measured and is presented in Figure 7 (left). It increased while the ion concentration increased in the middle cell. The power supply, however, had a capacity of up to 1 A. Reaching this current density resulted in a voltage drop shown in Figure 7 (right). These variations have to be taken into account later when calculating for the exergy input to the stack, as will be given below.
3.3. Separation of ABS in Double Distance Anode and Cathode Cells
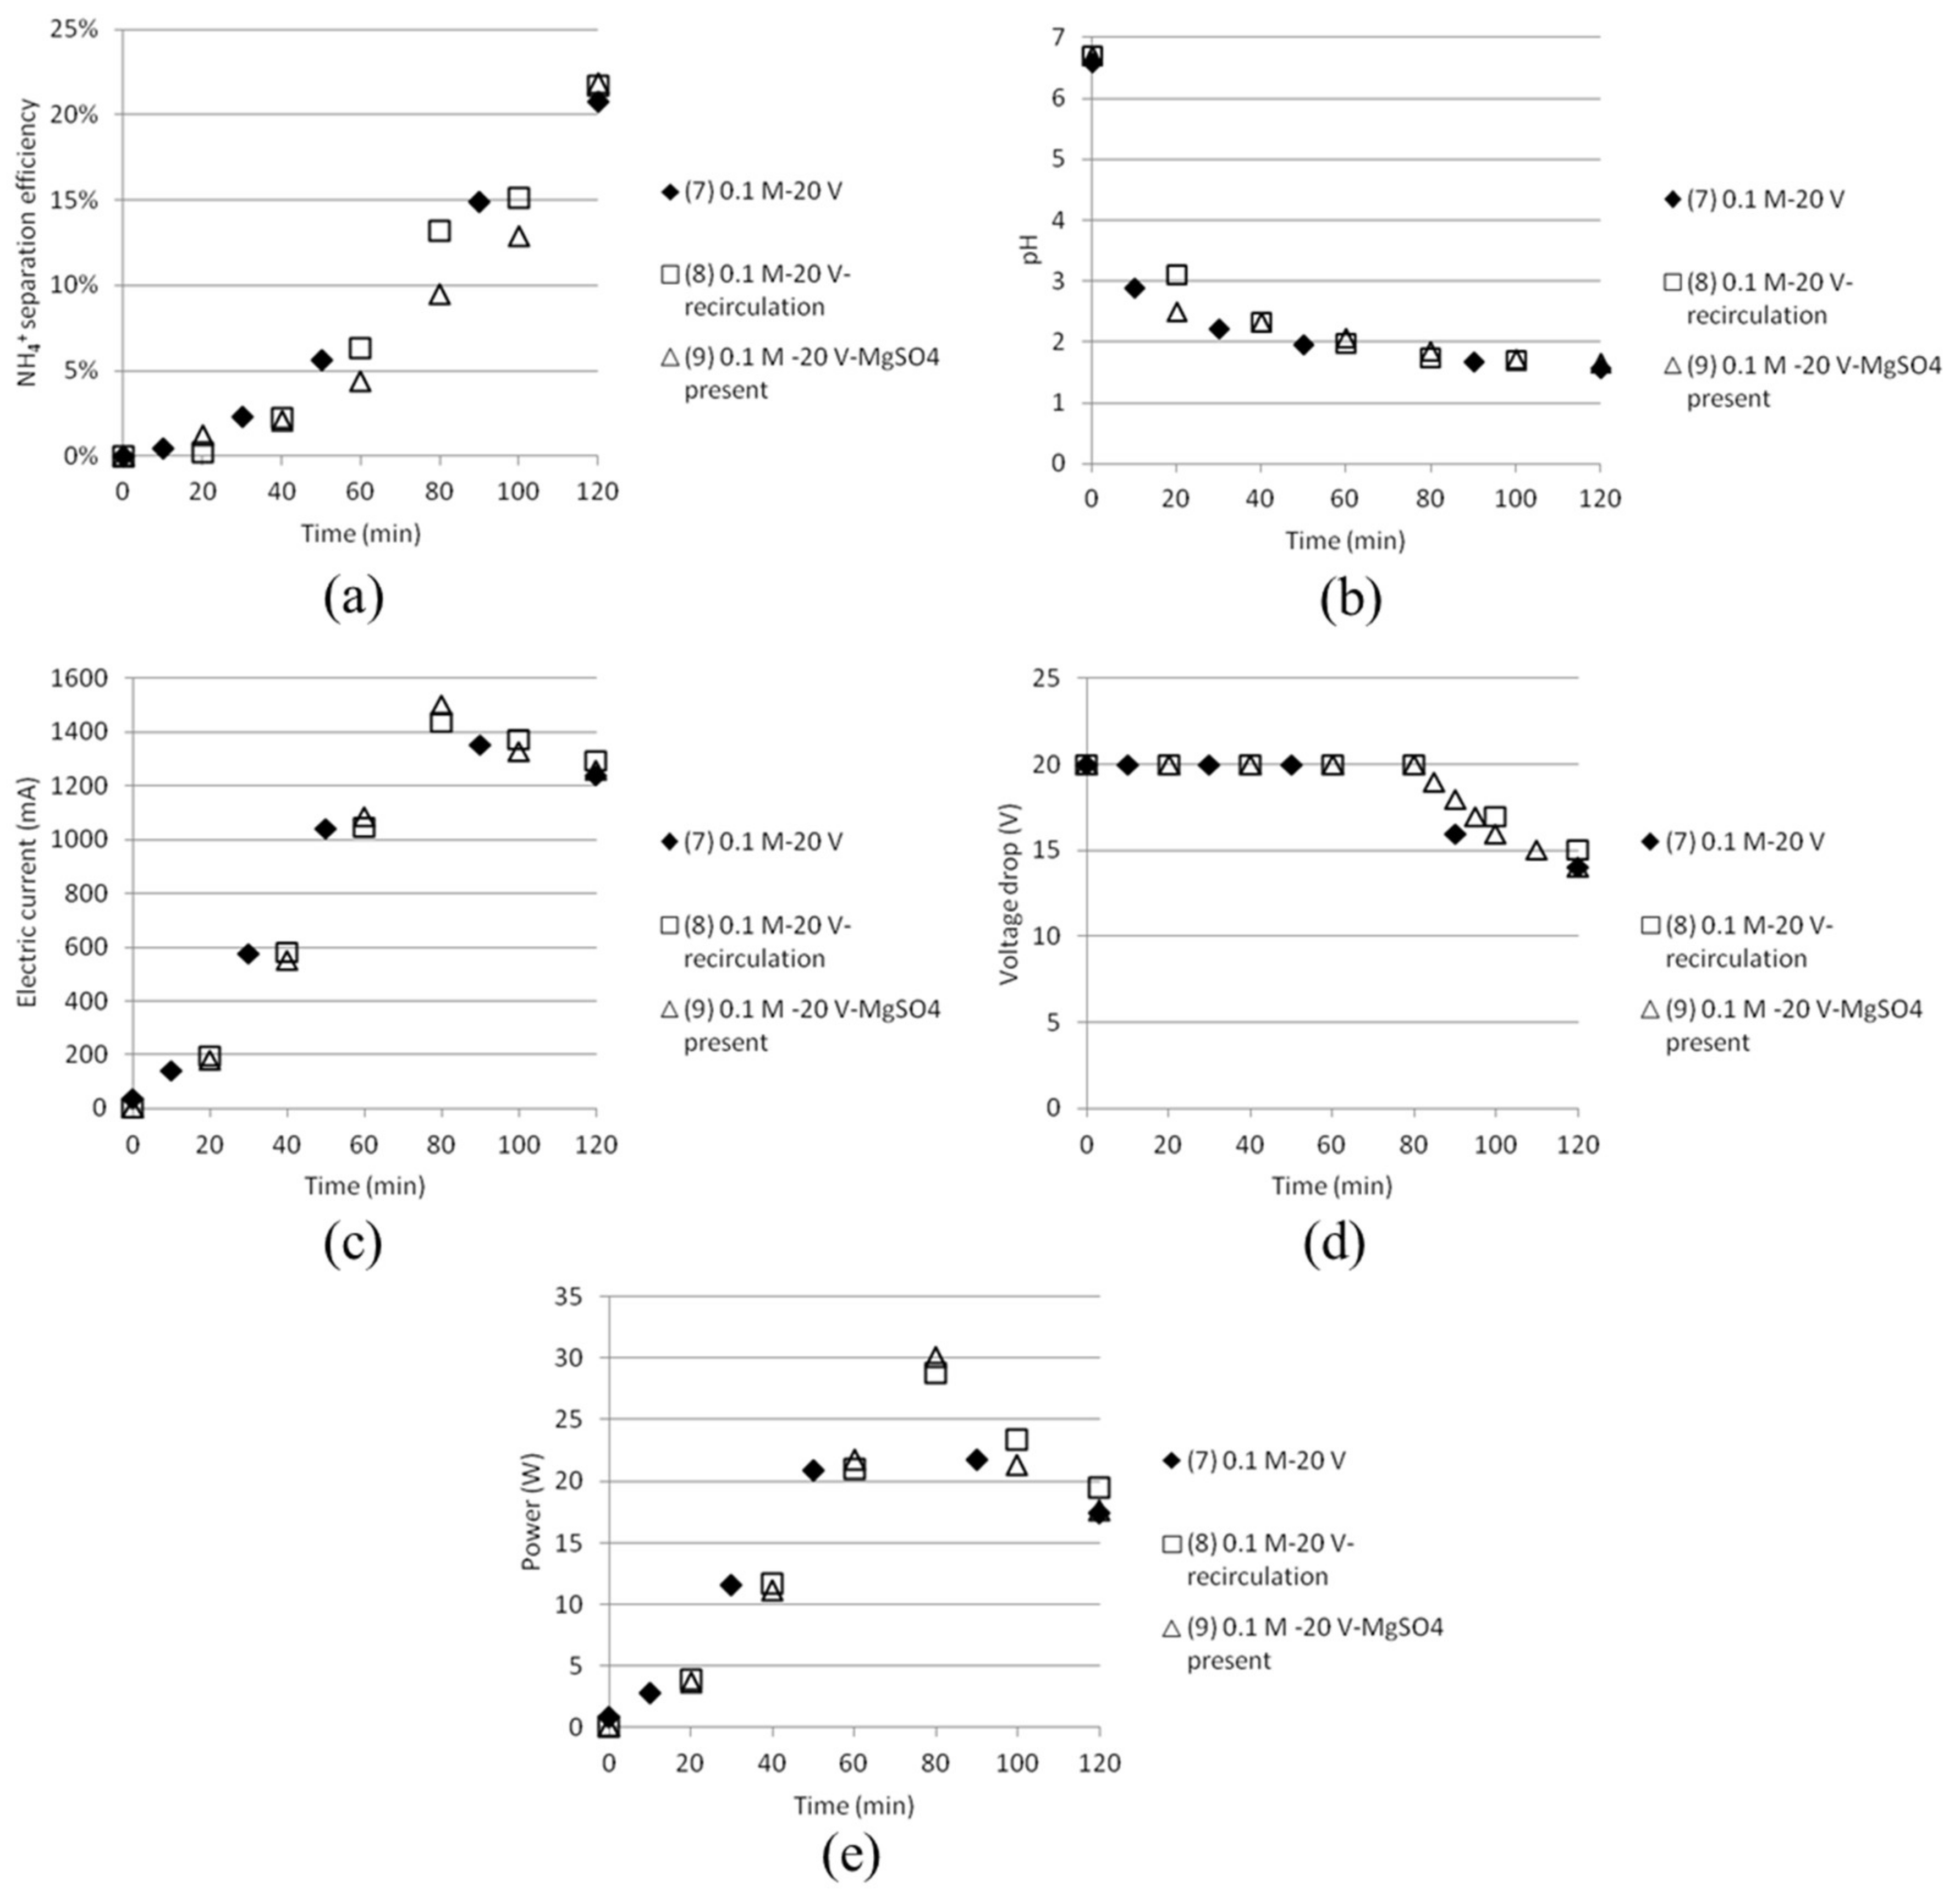
Some tests were done with double anode and cathode cell distance, i.e., two 40 mm cells in a row without a membrane between them at every side of the middle cell of 40 mm. The middle cell still initially contained distilled water and the anode and cathode cells solutions of 0.1 M AS + 0.1 M ABS. The experimental parameters are given in Table 4.
The final NH4+ separation efficiency after 120 min were measured to just above 20% for all tests, independent of the presence of MgSO4 or pumping of the solutions between the anode and cathode cell. Similar trends were found for all the tests for the other measured parameters like electric current, voltage, pH and power consumption, see Figure 9. The effect of pumping, however, must be investigated further and will preferably be done by modifying the experimental setup in such a way that sampling could tell how much this affects the distribution of different ions between the different compartments.
3.4. Separation of ABS with a Five Compartment Setup
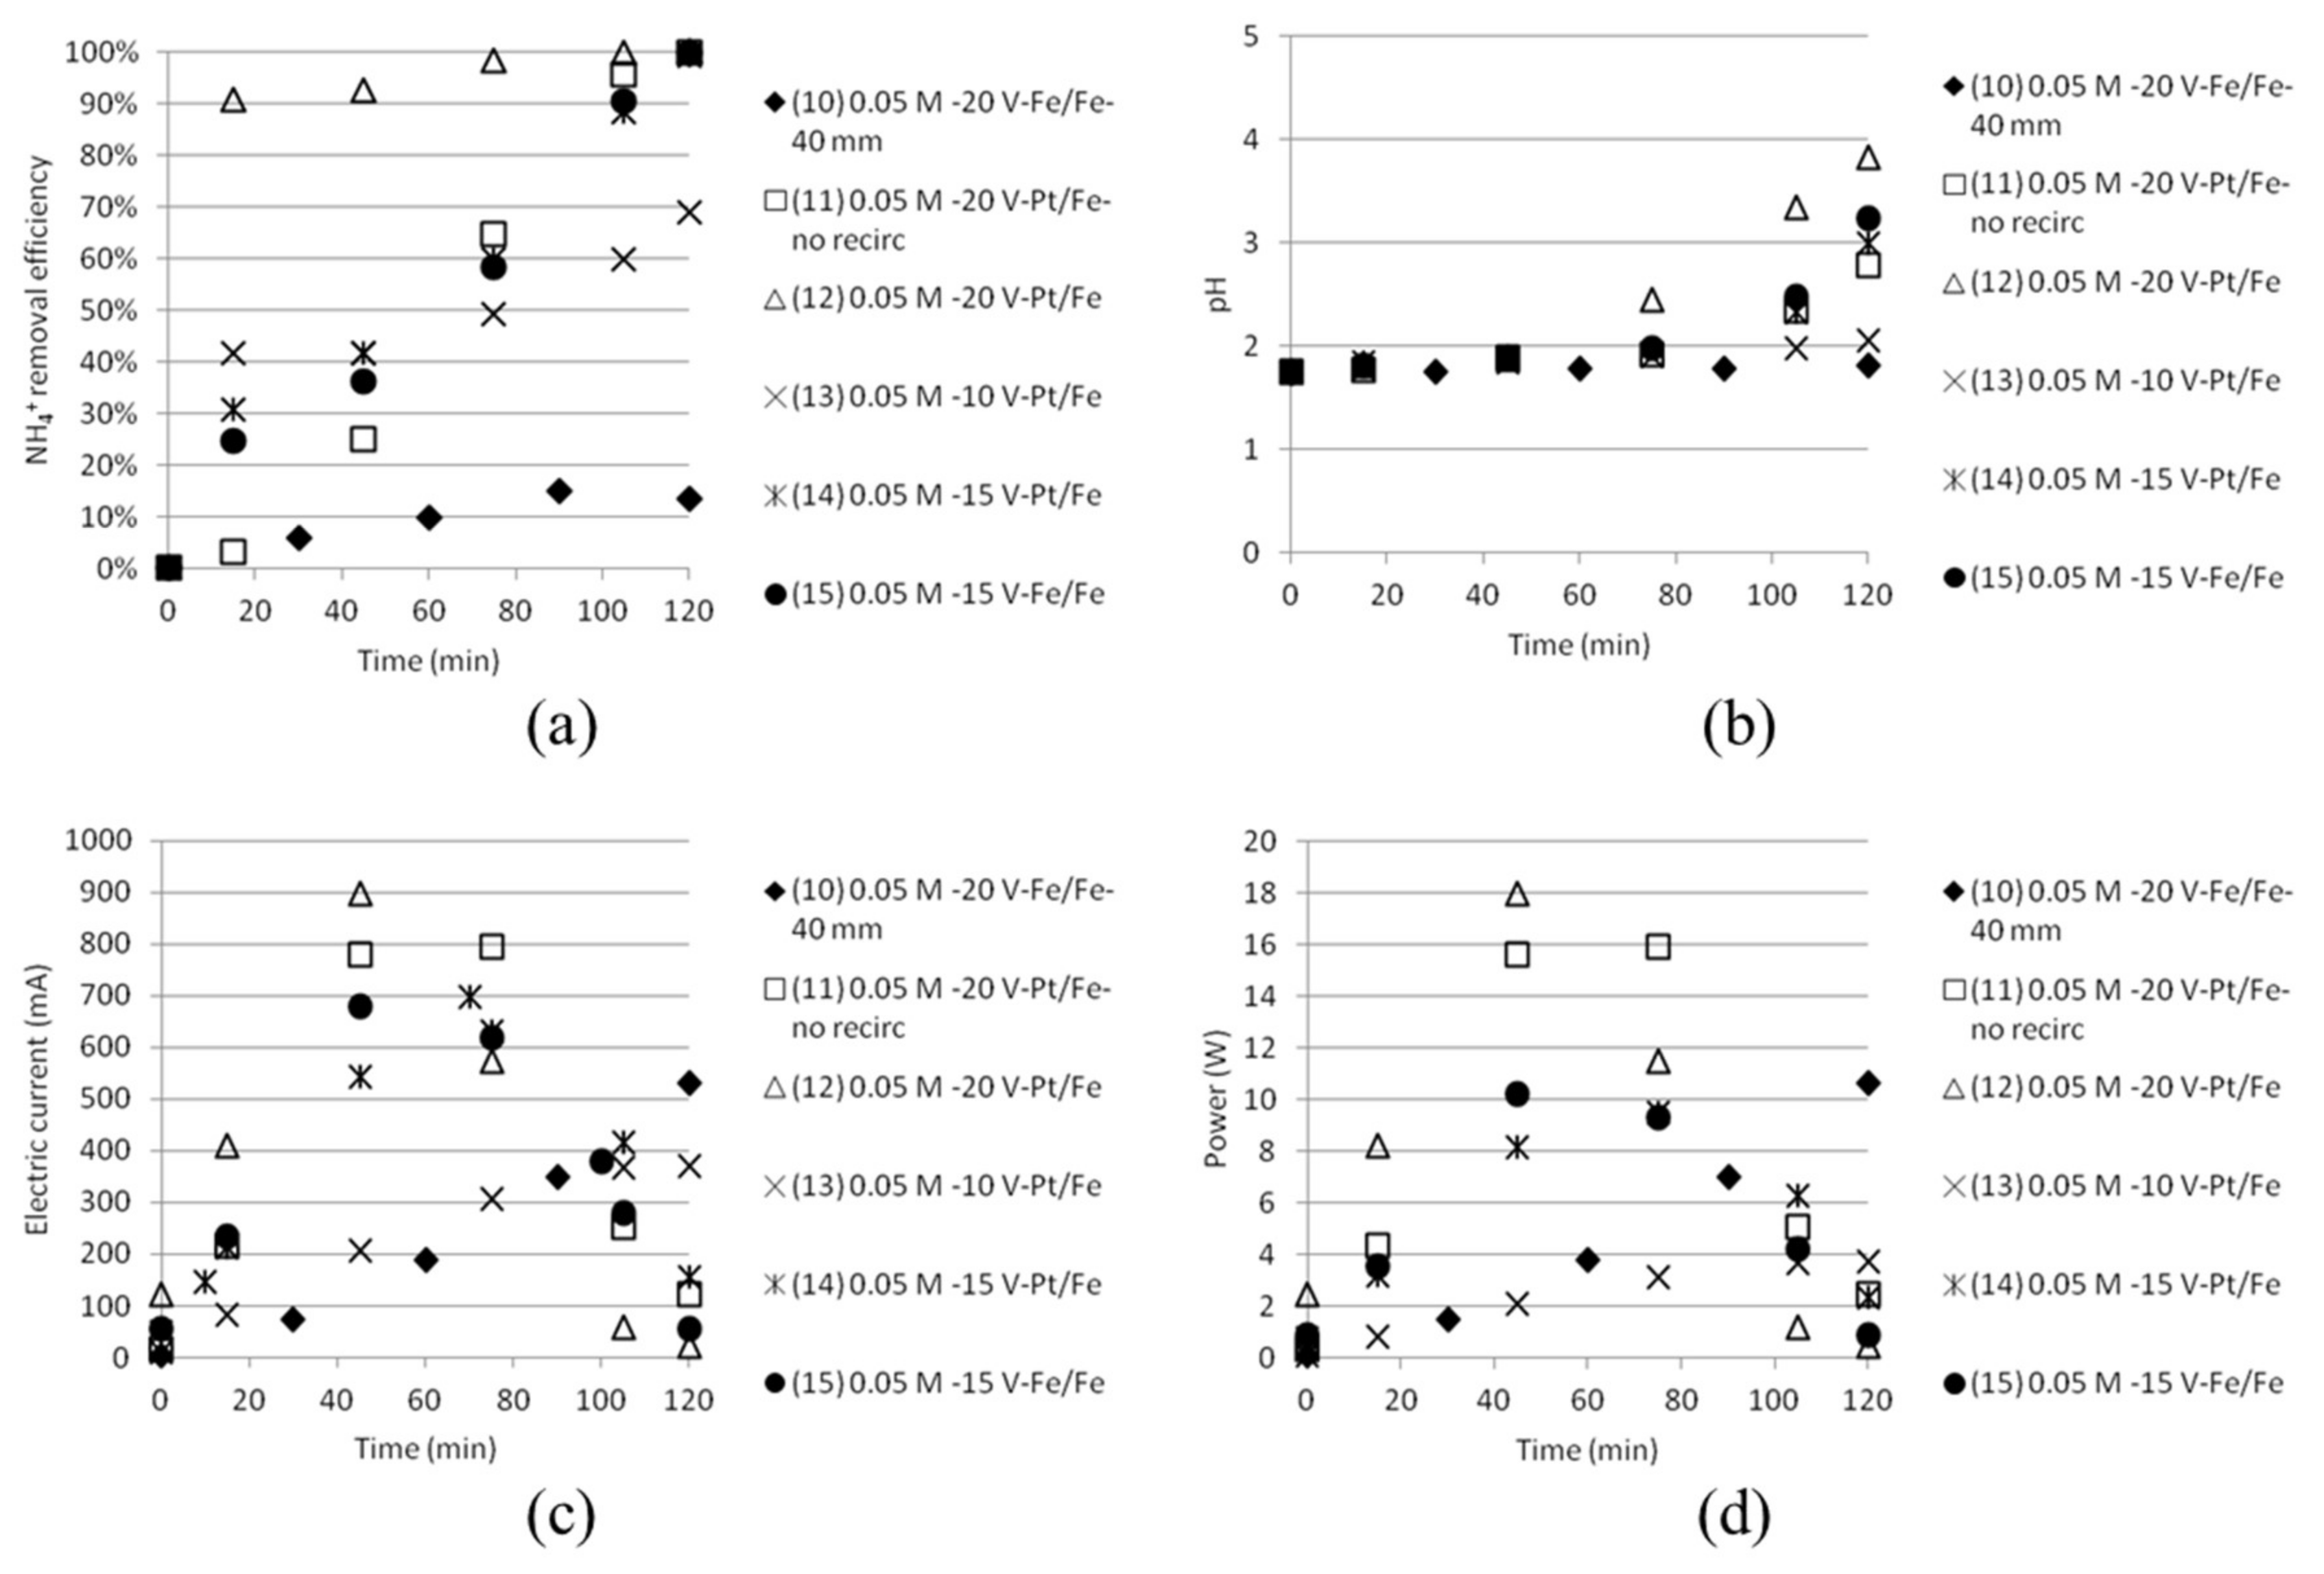
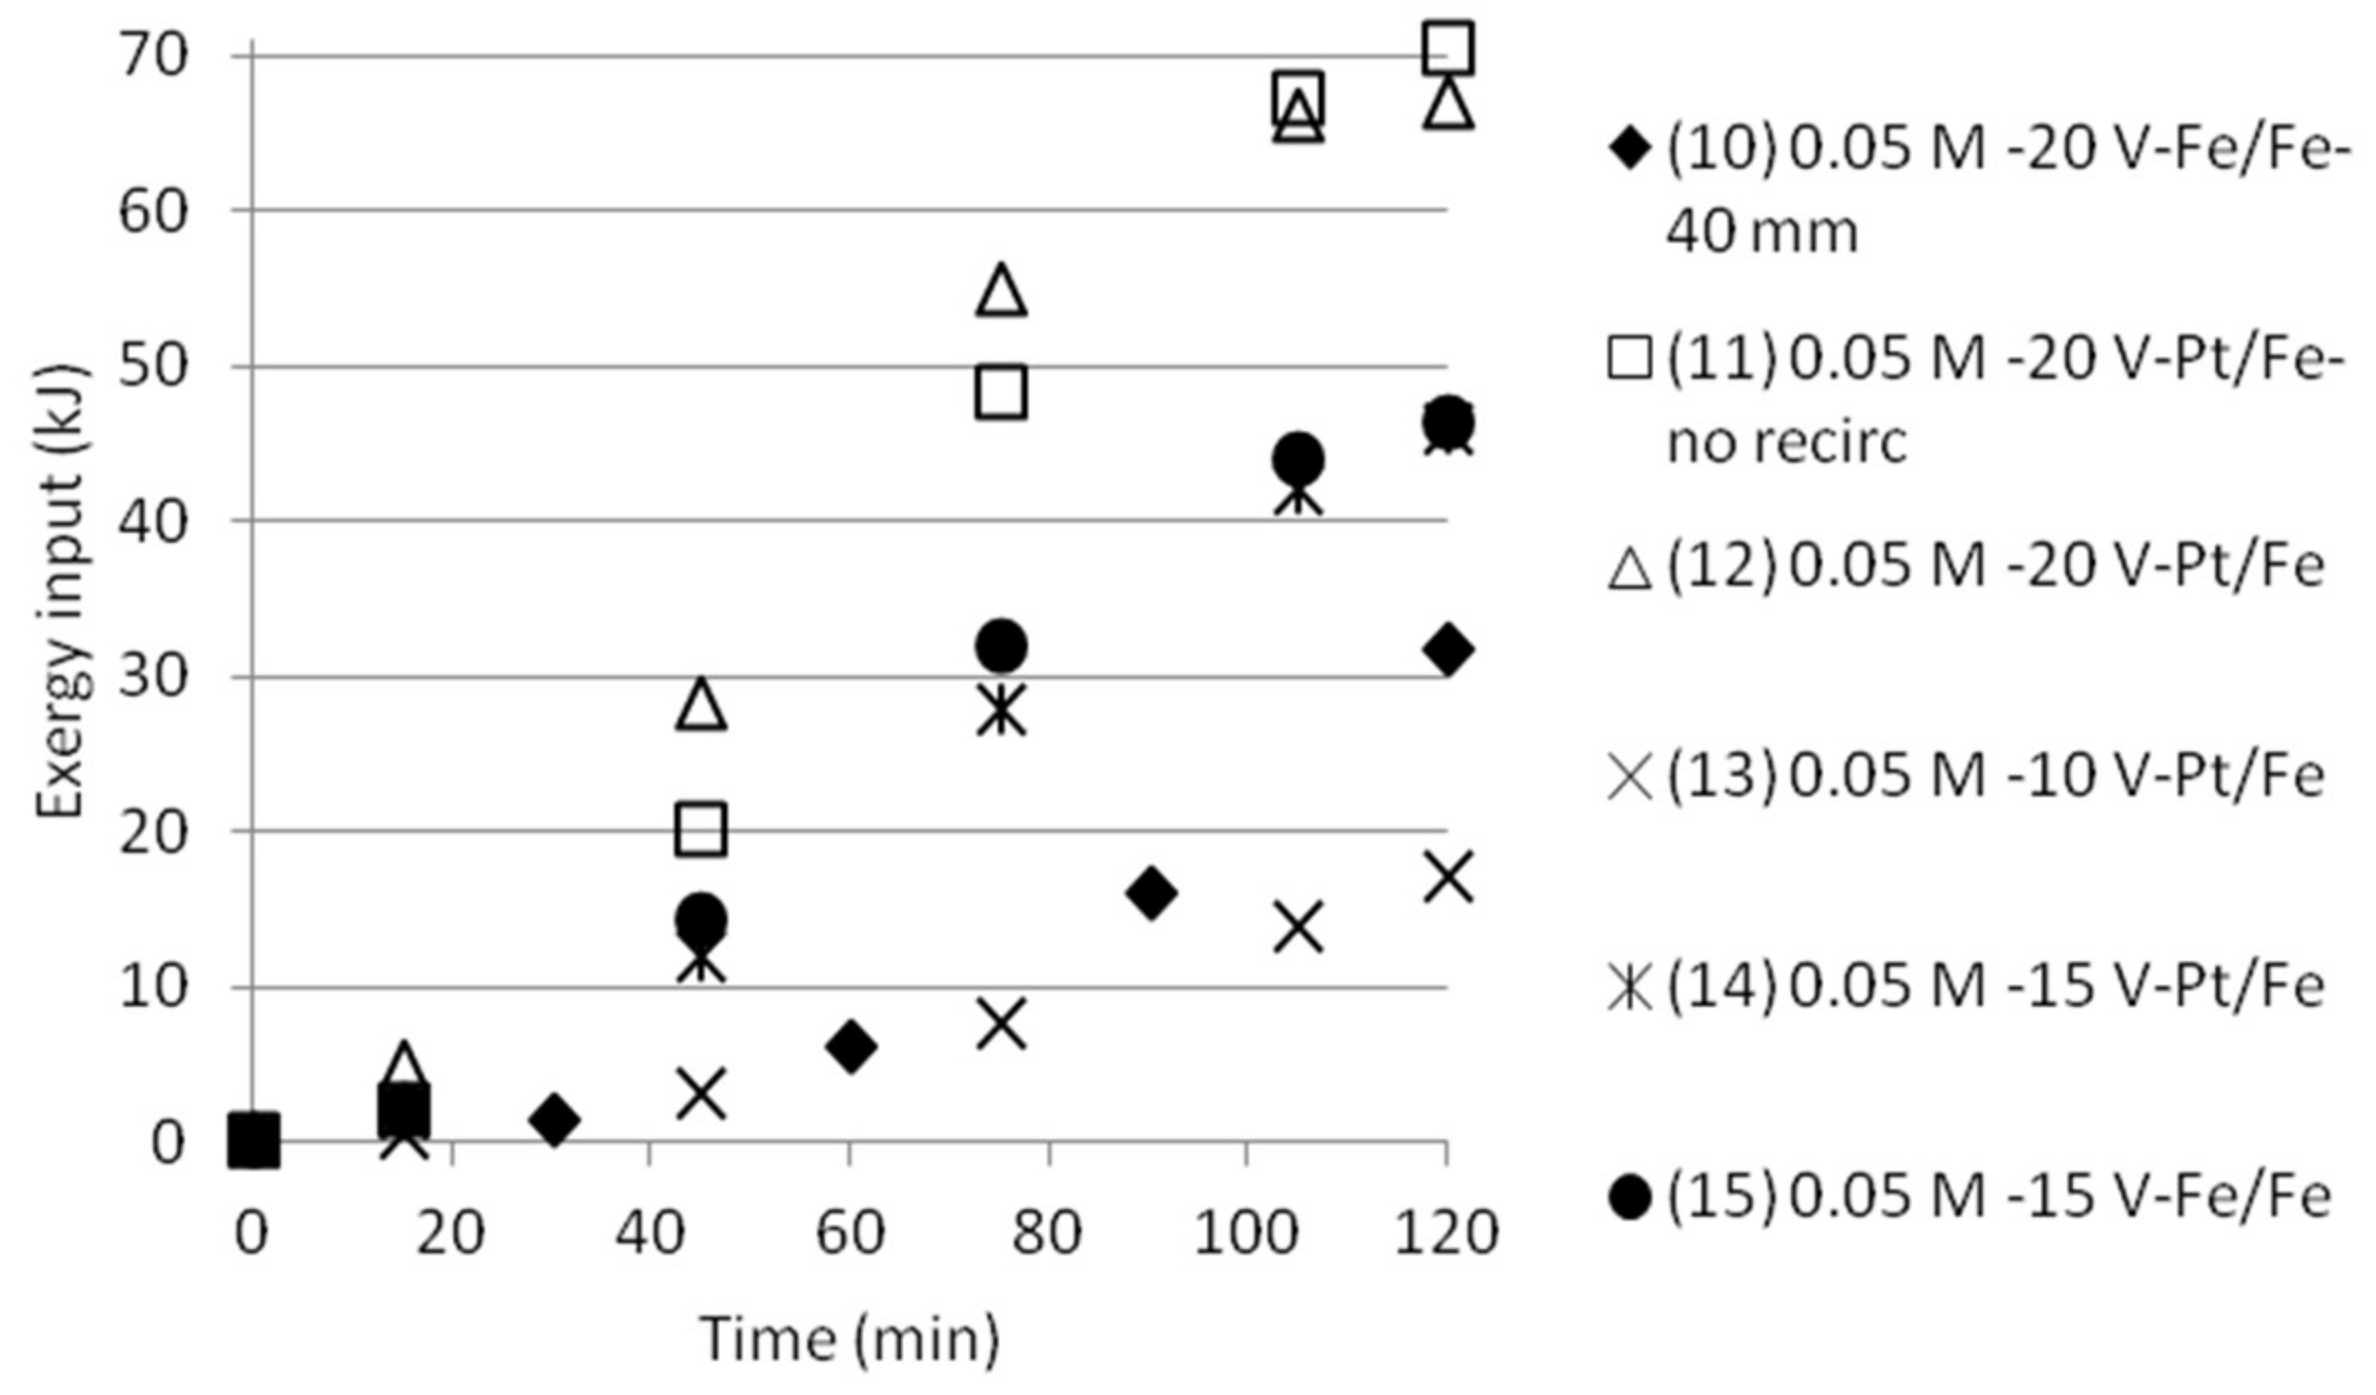
Three 40 mm cells were replaced with five 18 mm spacing cells in a stack with cationic and anionic membranes alternating between the compartments. The variation in experimental parameters is given in Table 5. Concentrations were kept at 0.05 M AS + ABS solutions since calibration of the NH4+ ISE electrodes was done up to 0.1 M. Again, the expected measured concentrations varied from the theoretic initial concentrations (total NH4+ being 0.15M), which is currently under investigation. The trends in NH4+ concentrations with time can, however, be appreciated.
The “removal” efficiency of NH4+ (sampling was done in the middle cell with starting solution being 0.05 M AS + 0.05 M ABS, which with time will become depleted of ammonium and bisulfate ions) was more effective than the separation efficiency measured for tests with three compartments. The depletion of ions in the middle cell by time was also indicated by the fact that the electric current decreased after some time. The experimental results from the tests are shown in Figure 10. The removal efficiency (a) became much lower in the case where five 40 mm cells were combined instead of the narrower 18 mm cells.
Keeping the common practice in mind with the narrow cell distance, this was an expected result. The chemical resistance in the solution will need as narrow cell distance as possible for optimised utilisation. pH (b) increased from below 2 to close to 4 in the best case, which also indicates that the cell will become depleted with monovalent ions that also give rise to changes in pH, like H+, OH− and HSO4−. The electric current (c) and the power (d) are reaching a plateau and then going down before the experiments are stopped. This could be explained by the reasoning that the middle cell at some moment starts to become depleted by ions which will make it harder for the electricity to pass through the stack.
3.5. Exergy Calculations
3.5.1. Three Compartments
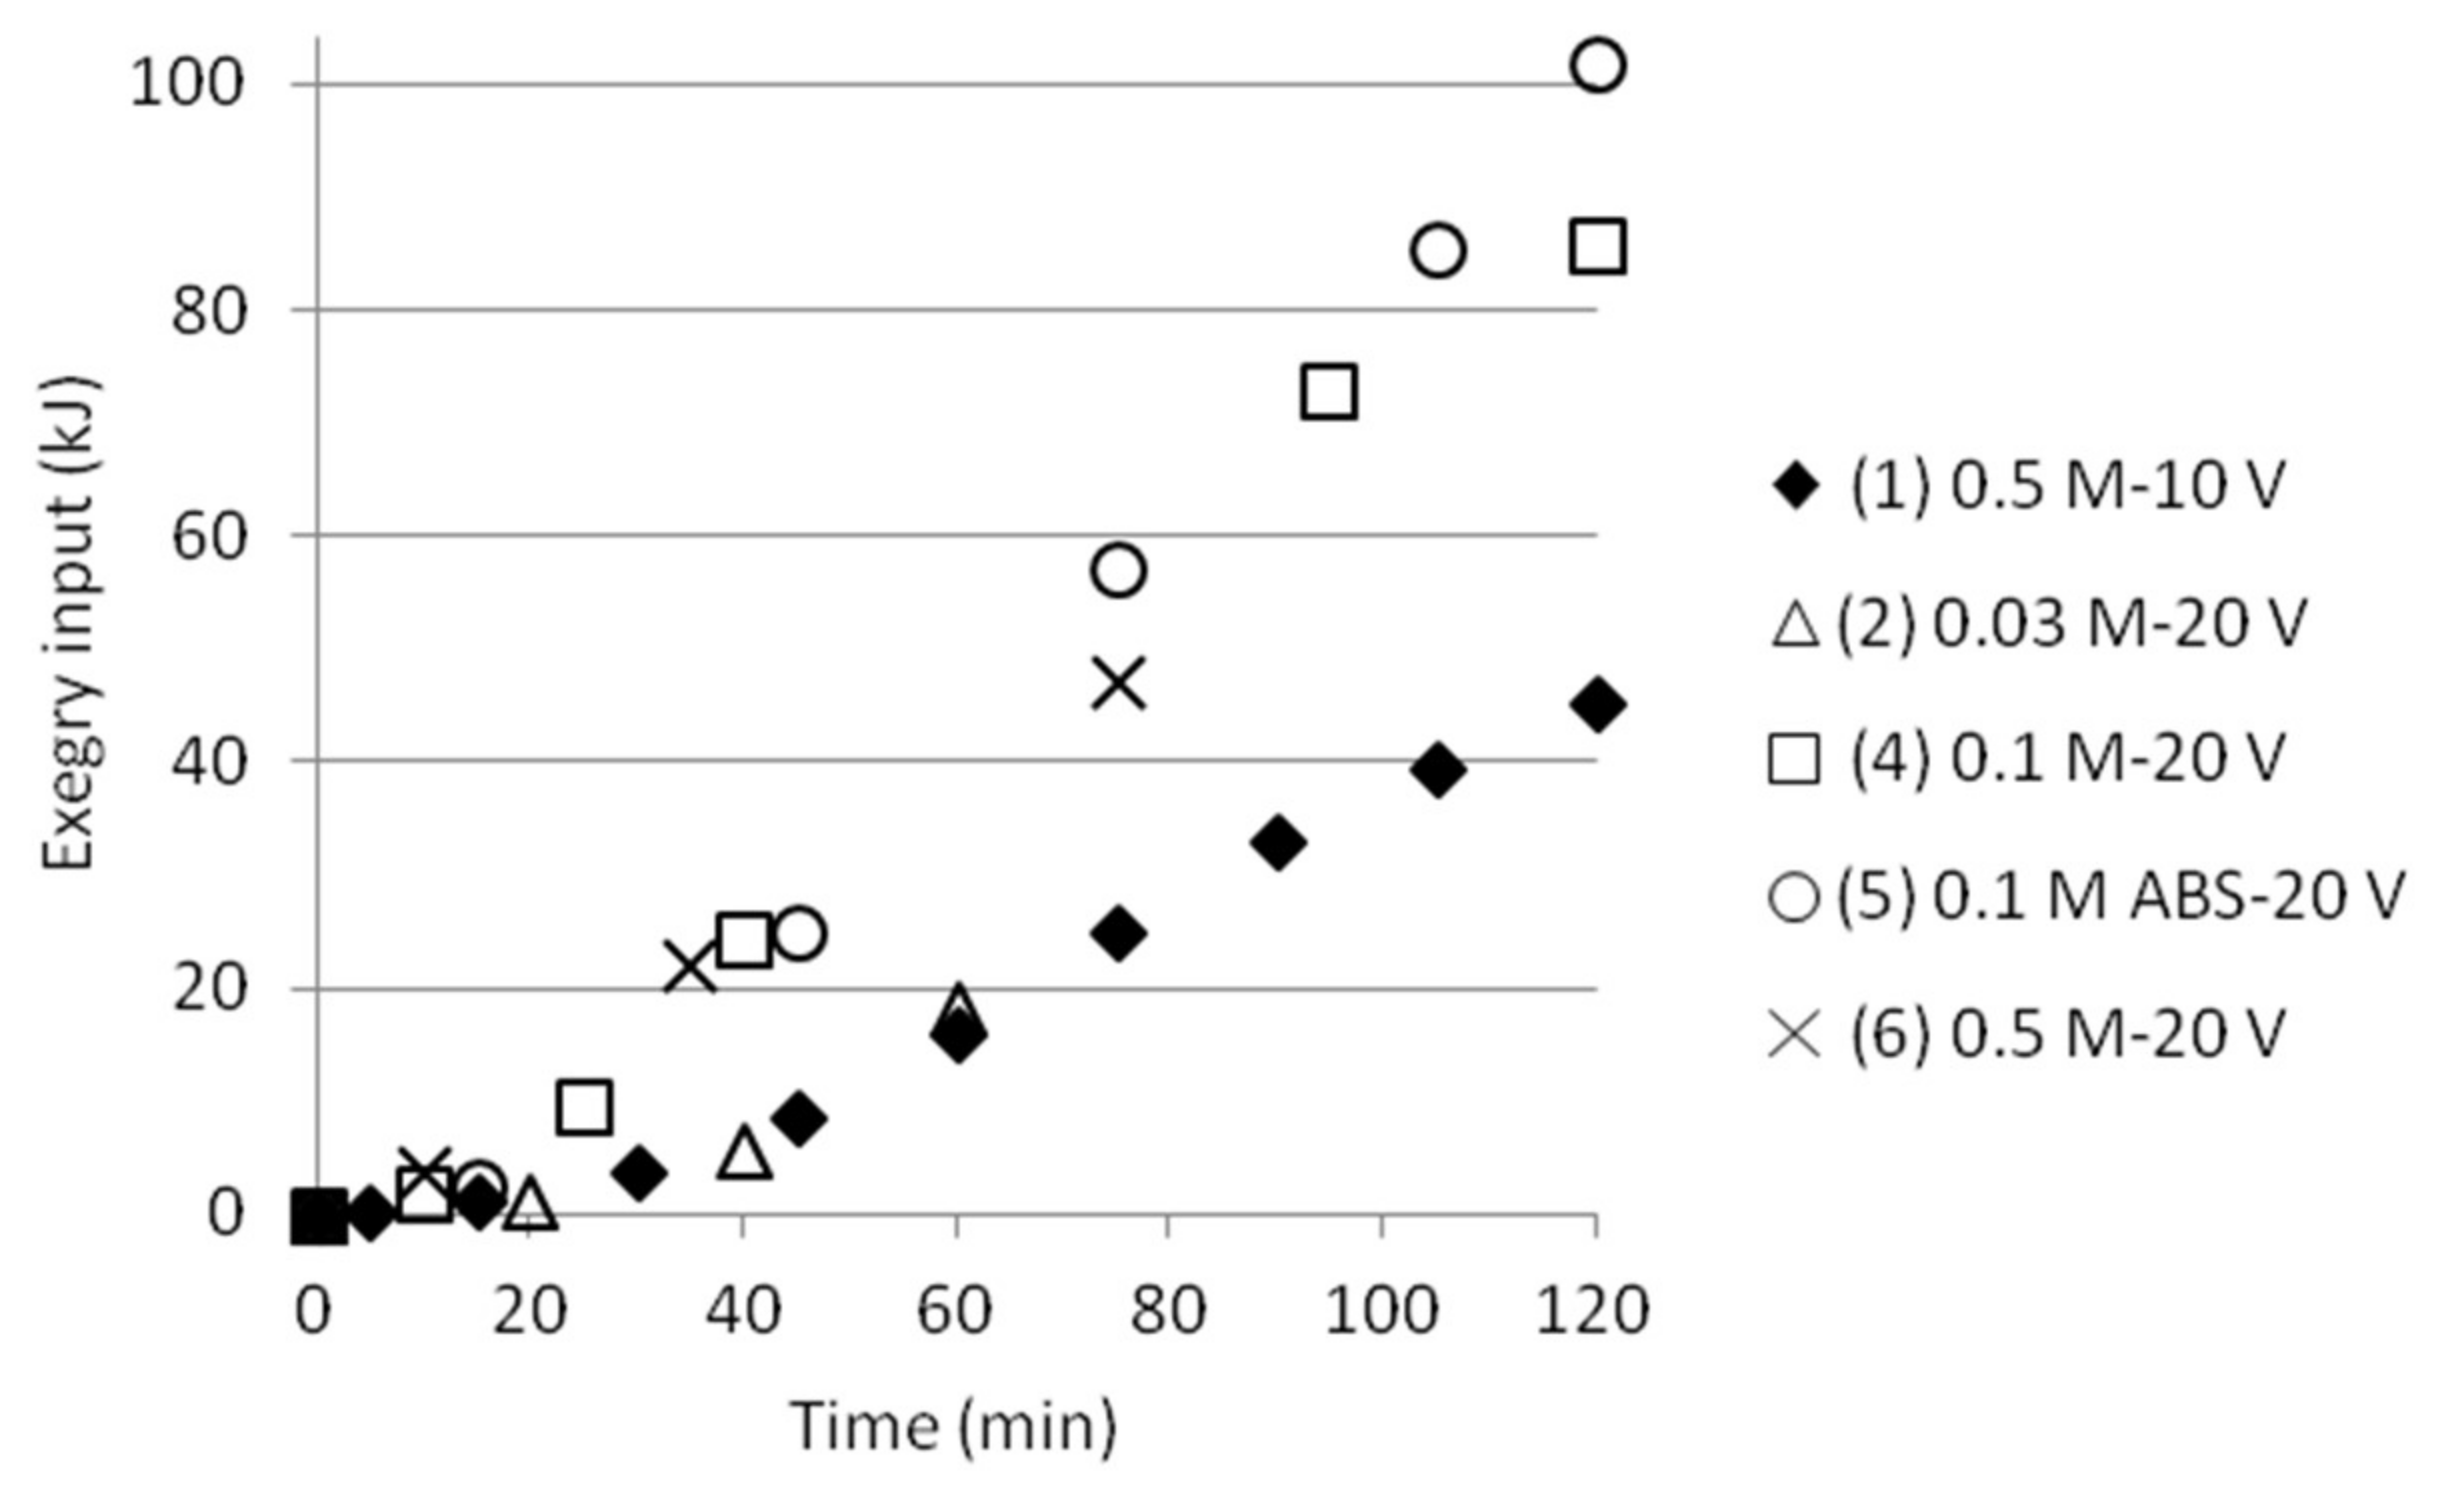
The exergy input (Exin) for a time interval (t1, t2) was calculated from the electric power input as average values for corrected voltages as;
where U is the voltage (V), I is the electric current (A) and t is time (s).
The length of the time intervals varied with experimental conditions from 10 to 30 min depending on change in performance. Equation (7) gives an estimation of the exergy input. Most of the time either voltage or electric current was constant. The calculated exergy for intervals in a test was summed up to a total exergy input at any time, as plotted in Figure 11, showing smooth upward trends. The single test performed at 10 V gave a lower exergy input than the tests run at 20 V, as a result of similar electric current but only ½ the voltage.
The input electrical power (i.e., exergy) can be compared with the (reversible) exergy needed for the separation, Table 6. The calculations are based on the expression for ∆Exmix presented in Section 1.2. (Equation (2)) and it is assumed that no SO2 or NH3 vapour losses occur at the electrodes. The calculations are also based on the pH measurements in both cells together with the ammonium analyses from cell 2. The results show that the calculated (reversible) ∆Exmix for the tests are a magnitude of about 1000 times lower than the experimental input exergy. The presence of iron is not taken into account in this study since mainly only analytical solutions of AS and ABS were used for almost all experiments. One test was done adding also analytical MgSO4 to the feed solution, but no proper ∆Exmix was calculated at this stage for the tests applying recirculation (i.e., pumping). Magnesium was therefore not either taken into account by calculating the mixing exergy.
Common practice for electrodialysis is to have a small gap (0.5 mm) between the membranes. The specific electrical resistance of the solutions is often high in electrodialysis applications, which gives rise to the need of having as small distances between the membranes as possible. One of the largest design issues in electrodialysis is also to ensure a proper flow distribution in the cells. This, together with the number of cells so far kept at a minimum, certainly explains why such a high electricity input was needed. Common practice is also to have hundreds of cell pairs in a stack, which also will increase the utilisation and specific energy need [17]. (Using more cells will be part of future work.) Recirculation and a shorter distance between the membranes are therefore process design parameters that still should be tested in order to see if the process might become more energy efficient. Some of the input exergy is also needed for the electrode redox reactions.
The results in Figure 11 and Table 6 can be compared to the findings in ([11], supplementary material) where an energy consumption of approximately 0.2 kWh/kg removed AS is needed in the separation of AS from sulfate solutions. This is equal to a value of approximately 0.95 kJ/mol AS removed and thus a magnitude of 100 times higher than the calculated (reversible) ∆Exmix in kJ/mol NH4+. It should be noted that these exergy values are based on the amount per ammonium ion, which means that the value 0.95 kJ/mol AS in practice would be half of this since AS gives two ammonium ions.
3.5.2. Double Cell Distance and Five Compartments
The cumulative exergy input for the tests done either with double cell distance, or five compartments was also calculated, see Figure 12 and Figure 13. The graphs show that the exergy input need is somewhat lower than the exergy input for the tests with three compartments.
The results make clear that there is a need to develop an improved process design in order to get better measurement data on how pumping of the solution will affect mixing (and thus the exergy of mixing) as well as on mixing and transport of the ions in the stack. This makes it uninteresting at this stage to calculate ΔExmix in the cells and compare it with the input exergy, Exin. However, no recirculation or pumping was applied in the first tests, which made it possible to give comparisons for these tests.
At full scale it is common practice, as mentioned, that many cells are placed as close together as possible. The exergy efficiency in a full-scale stack will probably look better than in this small scale setup, as a result of a different surface to volume ratio and less “end-losses” for a larger device. However, Xu et al. [14] reported (for mono- and di-valent cation electrodialysis separation) that scale effects were small. The full scale process has the aim to run as a continuous process, which also will be more efficient.
4. Conclusions
Monovalent ion selective membranes seem to have potential to solve some of the challenges of efficient usage of the flux salts (AS, ABS) used for CO2 mineral sequestration following the ÅA routes. This study investigated the possibility to use such membranes and electrodialysis for the separation so that the flux salts can be reused.
Different electrodes, voltages, and concentrations were used. Silver electrodes were concluded to be unsuitable for electrodialysis in solutions like the ones studied here. A reason for this could be that sulfate ions in acidic conditions start to meet a composition close to sulfuric acid, which in turn will be able to dissolve silver. Stainless steel as anode electrode was not perfectly suitable either since some iron was dissolved giving a coloured solution in the anode cell (cell 1). Platinum electrodes, however, seems to be resistant to the conditions held for the tests. A combination of Pt electrode (anode) and stainless steel (cathode) was therefore used in the later tests. For future work, a platinised titanium anode will be used. Tests with these electrodes shall also involve limiting current measurements and current efficiency assessment.
Higher concentrations of the initial solution will result in larger concentration of ions in cell 2 (initially containing distilled water with high resistance) when three compartments are used, which will decrease the resistance. The electrical power supply used for the tests done with three compartments limited the electric current to 1 A, which caused a voltage drop after some time in some of the experiments. The experimental setup was later modified to five compartments and the highest electric currents were measured to a maximum of <1 A with no voltage drop detected.
From the results presented in this paper it is too early to draw strong conclusions on optimal voltages and concentrations. The tests do show, however, that separation is possible and that it will vary with time, voltage and electric current. More recent tests with a platinum wire anode electrode and also shorter cell distance gave better results as expected. Tests with five cells in series with alternating ACS and CMS membranes were also accomplished, showing that the ammonium concentrations clearly decreased with time in the middle cell at both 15 V and 20 V. No voltage drop was detected during the tests with five cells, but the electric current reached a maximum and then decreased quite rapidly, with the result that the resistance increased as the middle cell became depleted with ions. Ongoing work investigates at what conditions the ISE electrodes are most suitable to use and to understand why the measured ammonium concentration was lower than the expected concentration of the initial solutions.
Exergy calculations are a convenient tool to use for energy efficiency calculations. They become quite simple, especially for the input exergy, which could directly be calculated as the electrical power input to the separation process. Exergy calculations for the tests presented here show that the input exergy (i.e., electrical power) is many times higher than the reversible mixing exergy, which could indicate that design modifications must be done but also that more accurate analysis methods should be developed. The effect of pumping should also be investigated further since the mixing exergy takes all present ions into consideration. However, this study has shown that there is potential in the application of monovalent membranes to the mineral carbonation process described.
Acknowledgments
Parts of the work presented in this paper have been presented at ECOS2017, San Diego, CA, USA, 2–6 July 2017. Alf Hermanson at the Thermal and Flow Engineering Laboratory at ÅA is acknowledged for the valuable help with the experimental setup and the Inorganic Chemistry laboratory is acknowledged for providing the authors with electrodes. The authors also acknowledge Ella & Georg Ehrnrooth Foundation, the Foundation of ÅA and Walter & Lisi Wahl Foundation for funding the work presented. Two anonymous reviewers are acknowledged for sharp and very useful scrutiny of our work.
Author Contributions
Evelina Koivisto and Ron Zevenhoven together developed the concept of ammonium salt recovery using membrane separation, as part of a CO2 mineral sequestration process, into an experimental assessment combined with energy efficiency calculations. Evelina Koivisto designed and built the experimental set-up, carried out the experimental work, together with Ron Zevenhoven made the calculations, and wrote the first draft of the paper.
Conflicts of Interest
The authors declare no conflict of interest. The funding sponsors had no role in the design of the study; in the collection, analyses, or interpretation of data; in the writing of the manuscript, and in the decision to publish the results.
Abbreviations
| ABS | ammonium bisulfate, NH4HSO4 | |
| ACS | monovalent anion exchange membrane | |
| AS | ammonium sulfate, (NH4)2SO4 | |
| CMS | monovalent cation exchange membrane | |
| DC | direct current | |
| ISE | ion selective electrode | |
| RO | reverse osmosis | |
| Symbols | ||
| Exin,mix | input exergy, exergy of mixing | J (kJ, kJ/NH4+) |
| I | electrical current | A (mA) |
| n ip,if | molar amount of I in product, feed stream | mole |
| Ka | equilibrium constant | - |
| pKa | logarithmic equilibrium constant | - |
| P | power | W |
| R | gas constant (8.31451) | J/(mol·K) |
| T | temperature | °C |
| t | time | s |
| U | voltage | V |
| xi | molar fraction of i | mole/mole |
| γi | activity coefficient for dissolved species i | - |
| Δ | difference | |
Appendix A
A more accurate result for ∆Exmix (using Equation (2) in this paper) can be obtained when taking into account activity coefficients, γi, for the species. A discussed in Section 3.2, no directly applicable data for this could be found in the open literature. In Equation (2), terms ln(xi) would more accurately be written as ln(xi∙γi) = ln (xi) + ln(γi). Typical values for xi as measured are of the order 10−2 mole/mole and lower, giving values for ln (xi) that are <−4.5. Values for an activity coefficient for pure aqueous AS at 25 °C for the concentrations found in our work are in the range 0.5–0.9 (Table 7 in [16]), giving values for ln(γi) in the range (−0.1–−0.7). Thus, for the concentrations found here the contribution of activity to ln(xi∙γi) will be an order of magnitude (but probably more) smaller than the contribution of concentrations. Although much higher salt concentrations would make a correction for activity necessary this was not considered critical for the work reported here.
Appendix B

Table A1.
Membrane specification of the membranes used.
| Membrane | CMS | ACS |
|---|---|---|
| Type | Strong Acid (Na type) | Strong Base (Cl type) |
| Characteristics | Monovalent cation permselectivity | Monovalent anion permselectivity |
| Electric resistance | 1.8 Ω·cm2 | 3.8 Ω·cm2 |
| Burst strength | >0.15 MPa | >0.15 MPa |
| Thickness | 0.15 mm | 0.13 mm |
| Temperature | <40 °C | <40 °C |
| pH | 0–10 | 0–8 |
Appendix C
The calibration curve was produced in two steps, first starting with a 0.03 M AS solution and stepwise addition of ABS up to 0.03 M (left part). The opposite was thereafter done, starting with a 0.03 M ABS solution and increasing the concentration of AS stepwise (right part). Figure A1 could be used to determine the ratio of AS/ABS in later experiments.
Figure A1.
Calibration curve for different concentrations up to a solution of 0.03 M of AS and ABS, respectively. pH, conductivity and ammonium concentration is plotted against the ratio of AS/ABS.
Figure A1.
Calibration curve for different concentrations up to a solution of 0.03 M of AS and ABS, respectively. pH, conductivity and ammonium concentration is plotted against the ratio of AS/ABS.
Appendix D
Figure A2.
(a) Stainless steel anode electrode and silver electrode; (b) solutions obtained approximately at the same time as voltage drop starts to occur.
Figure A2.
(a) Stainless steel anode electrode and silver electrode; (b) solutions obtained approximately at the same time as voltage drop starts to occur.
References
- Nduagu, E. Production of Mg(OH)2 from Mg-Silicate Rock for CO2 Sequestration. Ph.D. Thesis, Åbo Akademi University, Turku, Finland, 2012. Available online: http://urn.fi/URN:NBN:fi-fe201311117327. Available online: http://urn.fi/URN:NBN:fi-fe201311117327 (accessed on 24 February 2018).
- Romão, I.S. Production of Magnesium Carbonates from Serpentinites for CO2 Mineral Sequestration—Optimisation towards Industrial Application. Ph.D. Thesis, Åbo Akademi University/University of Coimbra, Turku/Coimbra, Finland/Portugal, 2015. [Google Scholar]
- Virtanen, M. Energy-efficient solutions for concentrating or separating dissolved ammonium sulphate. M.Sc. Thesis, Thermal and Flow Engineering Laboratory, Åbo Akademi University, Turku, Finland, 2015. [Google Scholar]
- Tanaka, Y. Ion Exchange Membrane Electrodialysis; Nova Science Publishers, Inc.: New York, NY, USA, 2010. [Google Scholar]
- Erlund, R.; Koivisto, E.; Fagerholm, M.; Zevenhoven, R. Extraction of magnesium from four Finnish magnesium silicate rocks for CO2 mineralisation—Part 2: Aqueous solution extraction. Hydrometallurgy 2016, 166, 229–236. [Google Scholar] [CrossRef]
- Koivisto, E.; Zevenhoven, R. Methods for recovery and re-use of additive chemicals during CO2 mineralisation. J. Water Proc. Eng. 2017, 20, 61–70. [Google Scholar] [CrossRef]
- Zevenhoven, R.; Slotte, M.; Åbacka, J.; Highfield, J. A comparison of CO2 mineral carbonation processes involving a dry or wet carbonation step. Energy 2016, 117, 604–611. [Google Scholar] [CrossRef]
- Campione, A.; Gurreri, L.; Ciofalo, M.; Micale, G.; Tamburini, A.; Cipollina, A. Electrodialysis for water desalination: A critical assessment of recent developments on process fundamentals, models and applications. Desalination 2018, 434, 121–160. [Google Scholar] [CrossRef]
- Yusuf, I.D.Y.; Ompusunggu, S.R.P.; Bagastyo, A.Y. Salt recovery from reverse osmosis concentrate using electrodialysis. In Proceedings of the 5th Environmental Technology and Management Conference, Bandung, Indonesia, 23–24 November 2015. [Google Scholar]
- Van der Bruggen, B.; Koninckx, A.; Vandecasteele, C. Separation of monovalent and divalent ions from aqueous solution by electrodialysis and nanofiltration. Water Res. 2004, 38, 1347–1353. [Google Scholar] [CrossRef] [PubMed]
- Koter, S.; Chojnowska, P.; Szynkiewicz, K.; Koter, I. Batch electrodialysis of ammonium nitrate and sulfate solutions. J. Membr. Sci. 2015, 496, 219–228. [Google Scholar] [CrossRef]
- Gao, L.; Liu, D.; Yang, J. Modeling of a three-compartment membrane electrodialysis in H2SO4–(NH4)2SO4–NH3·H2O system. J. Membr. Sci. 2009, 344, 252–257. [Google Scholar] [CrossRef]
- Galama, A.H.; Daubares, G.; Burheim, O.S.; Rijnaarts, H.H.M.; Post, J.W. Seawater electrodialysis with preferential removal of divalent ions. J. Membr. Sci. 2014, 452, 219–228. [Google Scholar] [CrossRef]
- Xu, X.; He, Q.; Ma, G.; Wang, H.; Nirmalakhandan, N.; Xu, P. Selective separation of mono- and di-valent cations in electrodialysis during brackish water desalination: Bench and pilot-scale studies. Desalination 2018, 428, 146–160. [Google Scholar] [CrossRef]
- Szargut, J.; Morris, D.; Steward, F.R. Exergy analysis of thermal, chemical and metallurgical processes; Hemisphere Publishing Co.: New York, NY, USA, 1989. [Google Scholar]
- Clegg, S.L.; Milioto, S.; Palmer, D.A. Osmotic and Activity Coefficients of Aqueous (NH4)2SO4 as a Function of Temperature, and Aqueous (NH4)2SO4-H2SO4 Mixtures at 298.15 K and 323.15 K. J. Chem. Eng. Data 1996, 41, 455–467. [Google Scholar] [CrossRef]
- Noble, R.D.; Stern, S.A. Membrane Separations Technology: Principles and Applications; Elsevier: Amsterdam, Netherlands, 1995; p. 249. [Google Scholar]
Figure 1.
Principle scheme for the application of electrodialysis and separation by monovalent membranes to a mineral carbonation process. Thermal solid/solid reaction refers to the reaction at approximately 440 °C of a mixture between Mg-silicate rock and ammonium sulfate (AS) and/or ammonium bisulfate (ABS) salt.

Figure 2.
Schematic sketch of the principle of the experimental setup. ABS (NH4+, HSO4−) will be transported to the middle section (a) or to the second and fourth cell (b) as a DC current is applied to the stack.
Figure 2.
Schematic sketch of the principle of the experimental setup. ABS (NH4+, HSO4−) will be transported to the middle section (a) or to the second and fourth cell (b) as a DC current is applied to the stack.
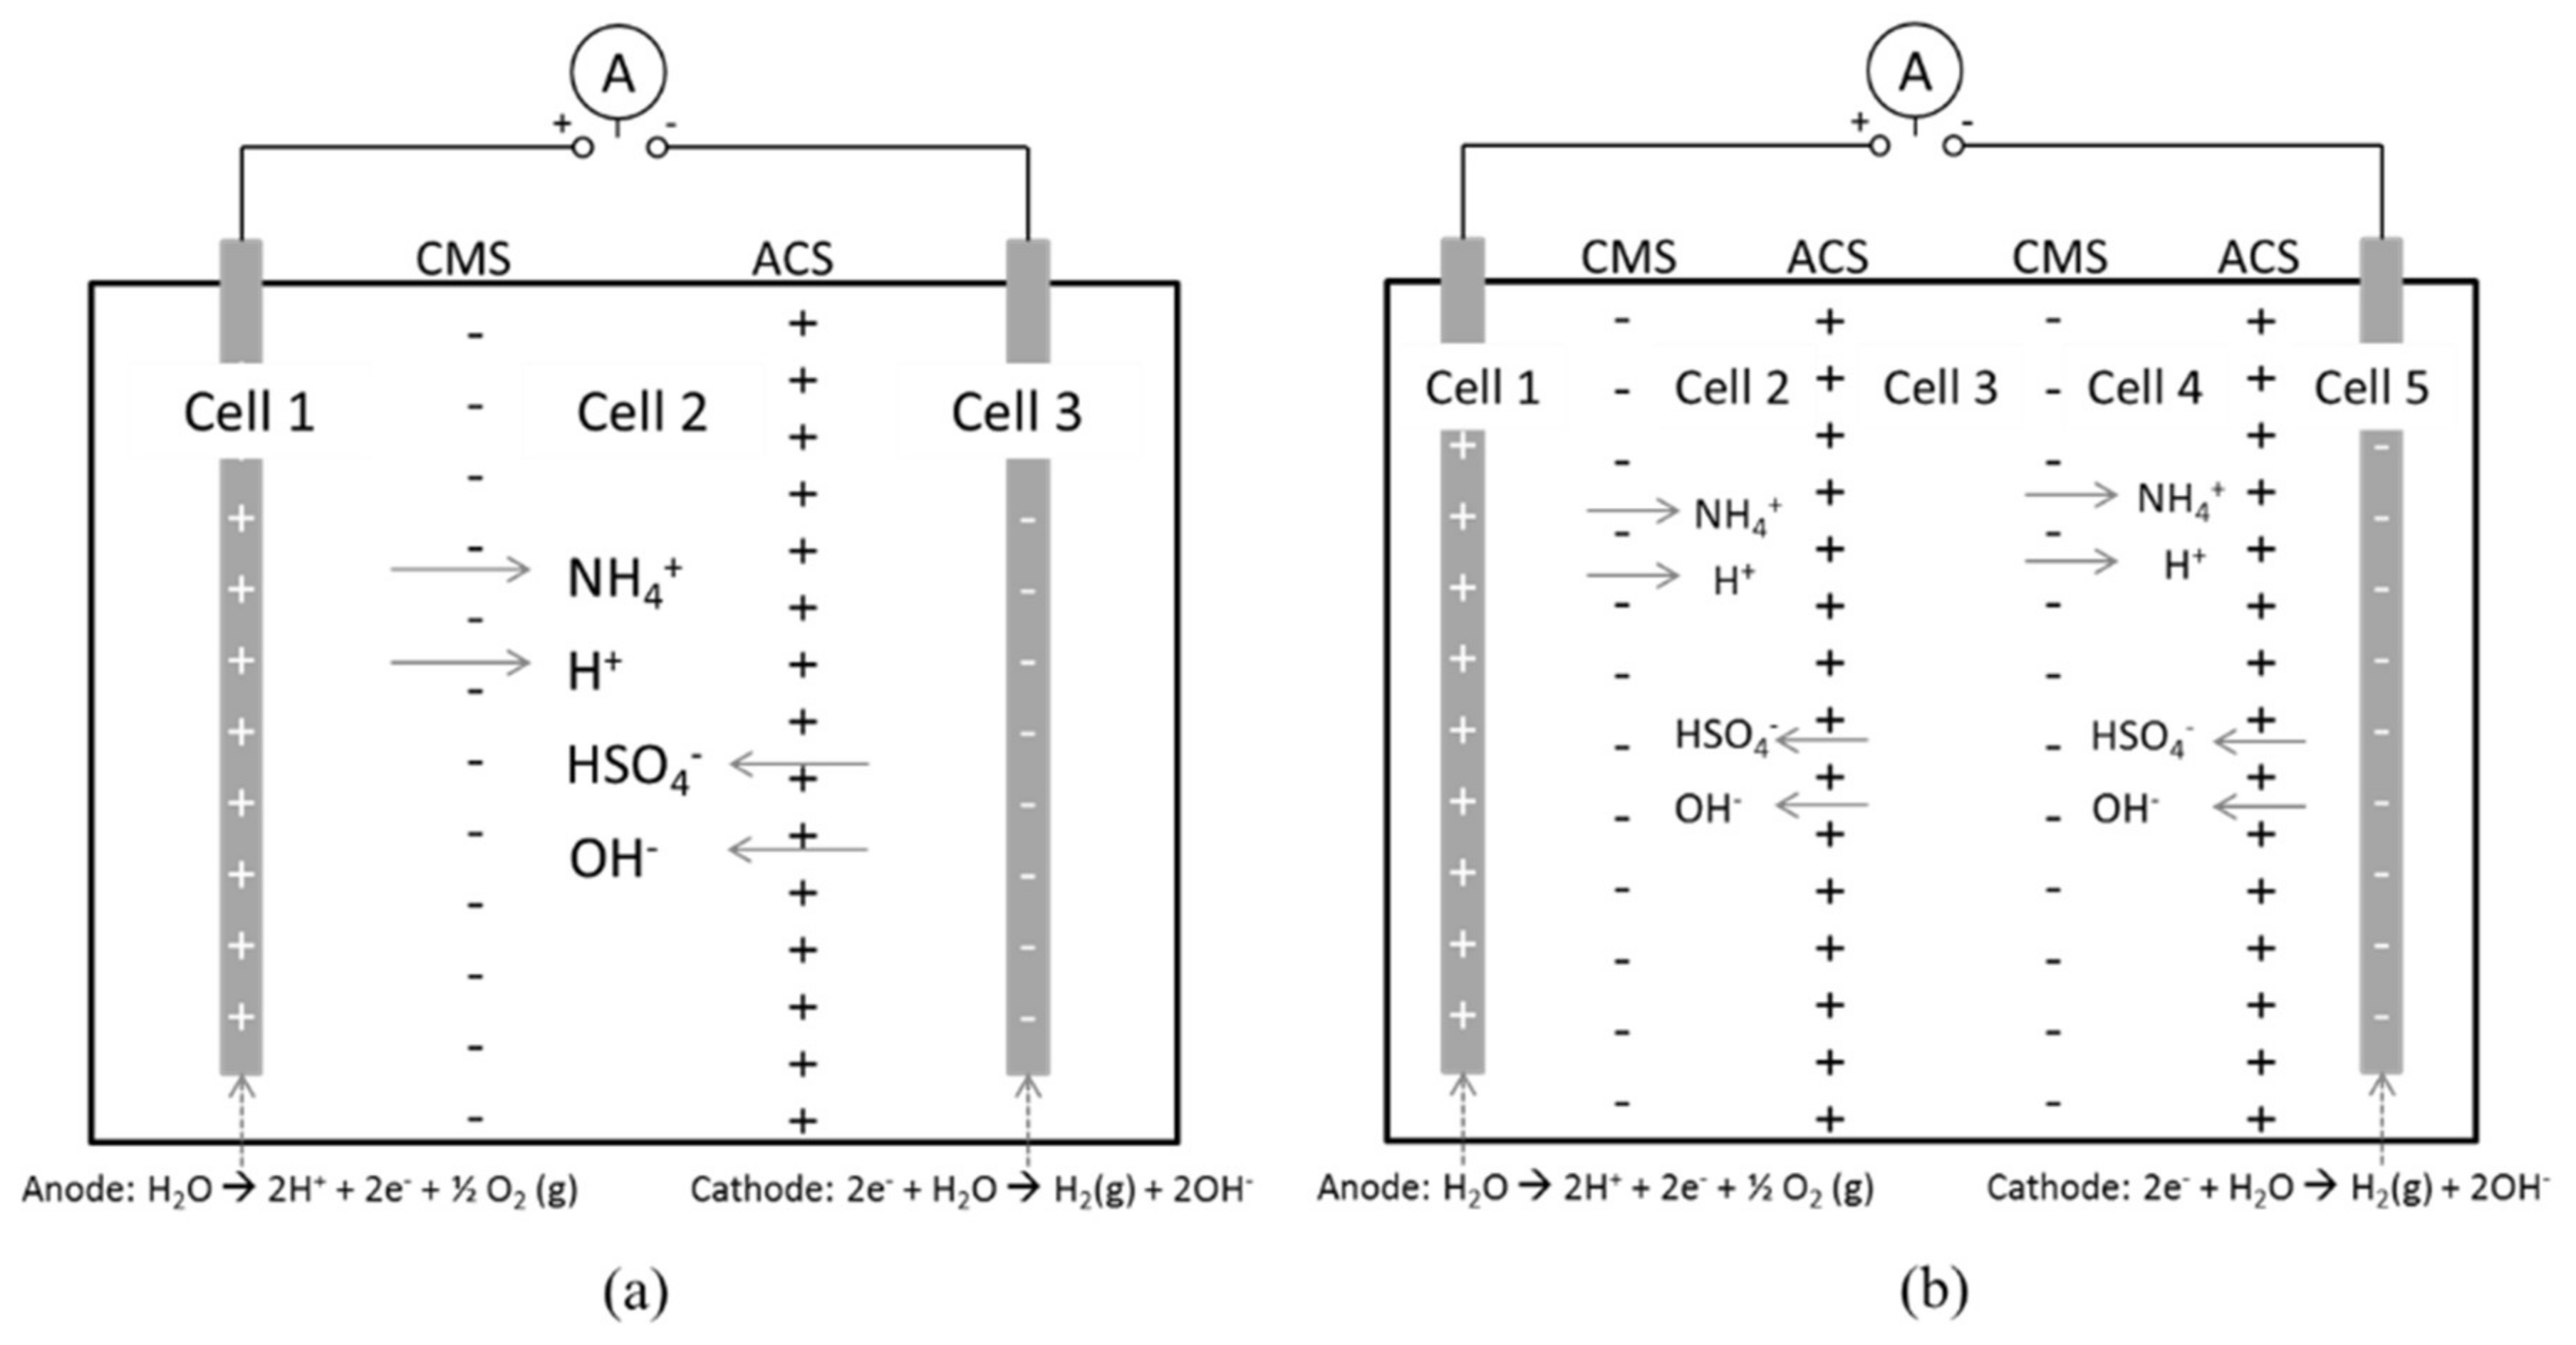
Figure 3.
Experimental setup for three compartments showing the power supply (right), electrodialysis stack (middle) and the multimeter for measuring the electric current through the stack (left).
Figure 3.
Experimental setup for three compartments showing the power supply (right), electrodialysis stack (middle) and the multimeter for measuring the electric current through the stack (left).
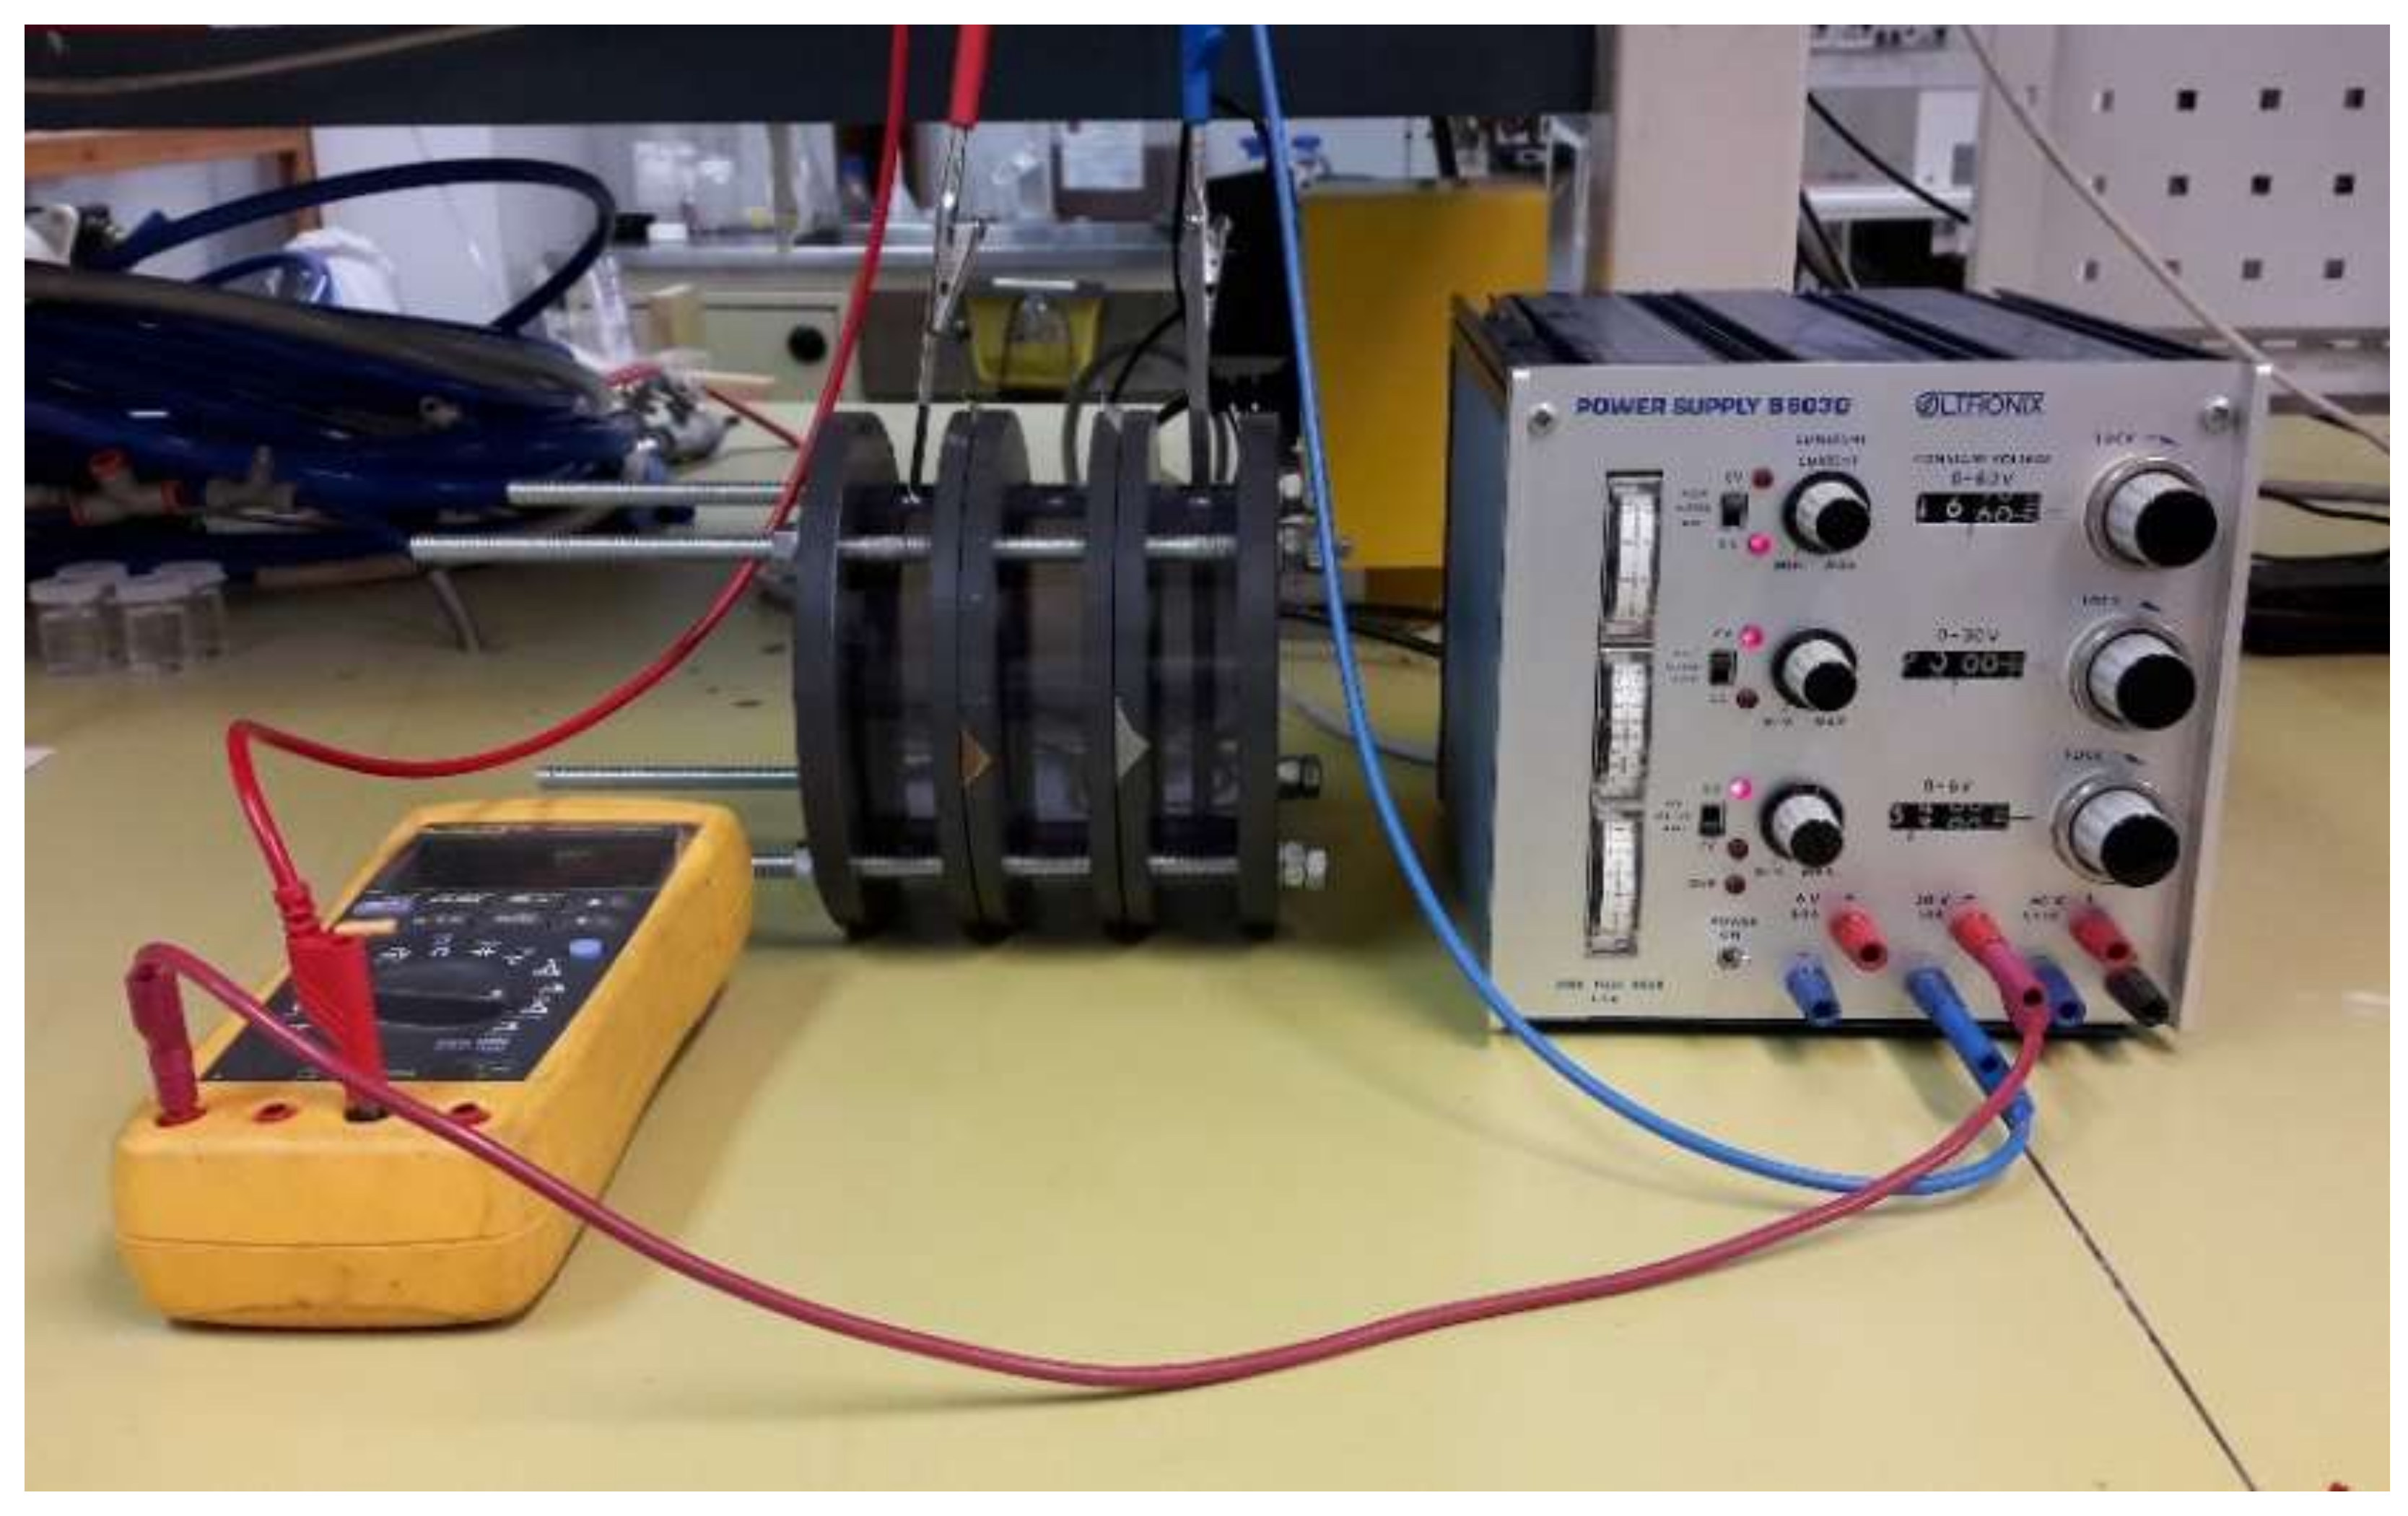
Figure 4.
Experimental setup for a five compartment stack with 18 mm cells showing the power supply (right), electrodialysis stack (middle) and the multimeter for measuring the electric current through the stack (left). Pumps for recirculation are also visible (above/behind the stack).
Figure 4.
Experimental setup for a five compartment stack with 18 mm cells showing the power supply (right), electrodialysis stack (middle) and the multimeter for measuring the electric current through the stack (left). Pumps for recirculation are also visible (above/behind the stack).
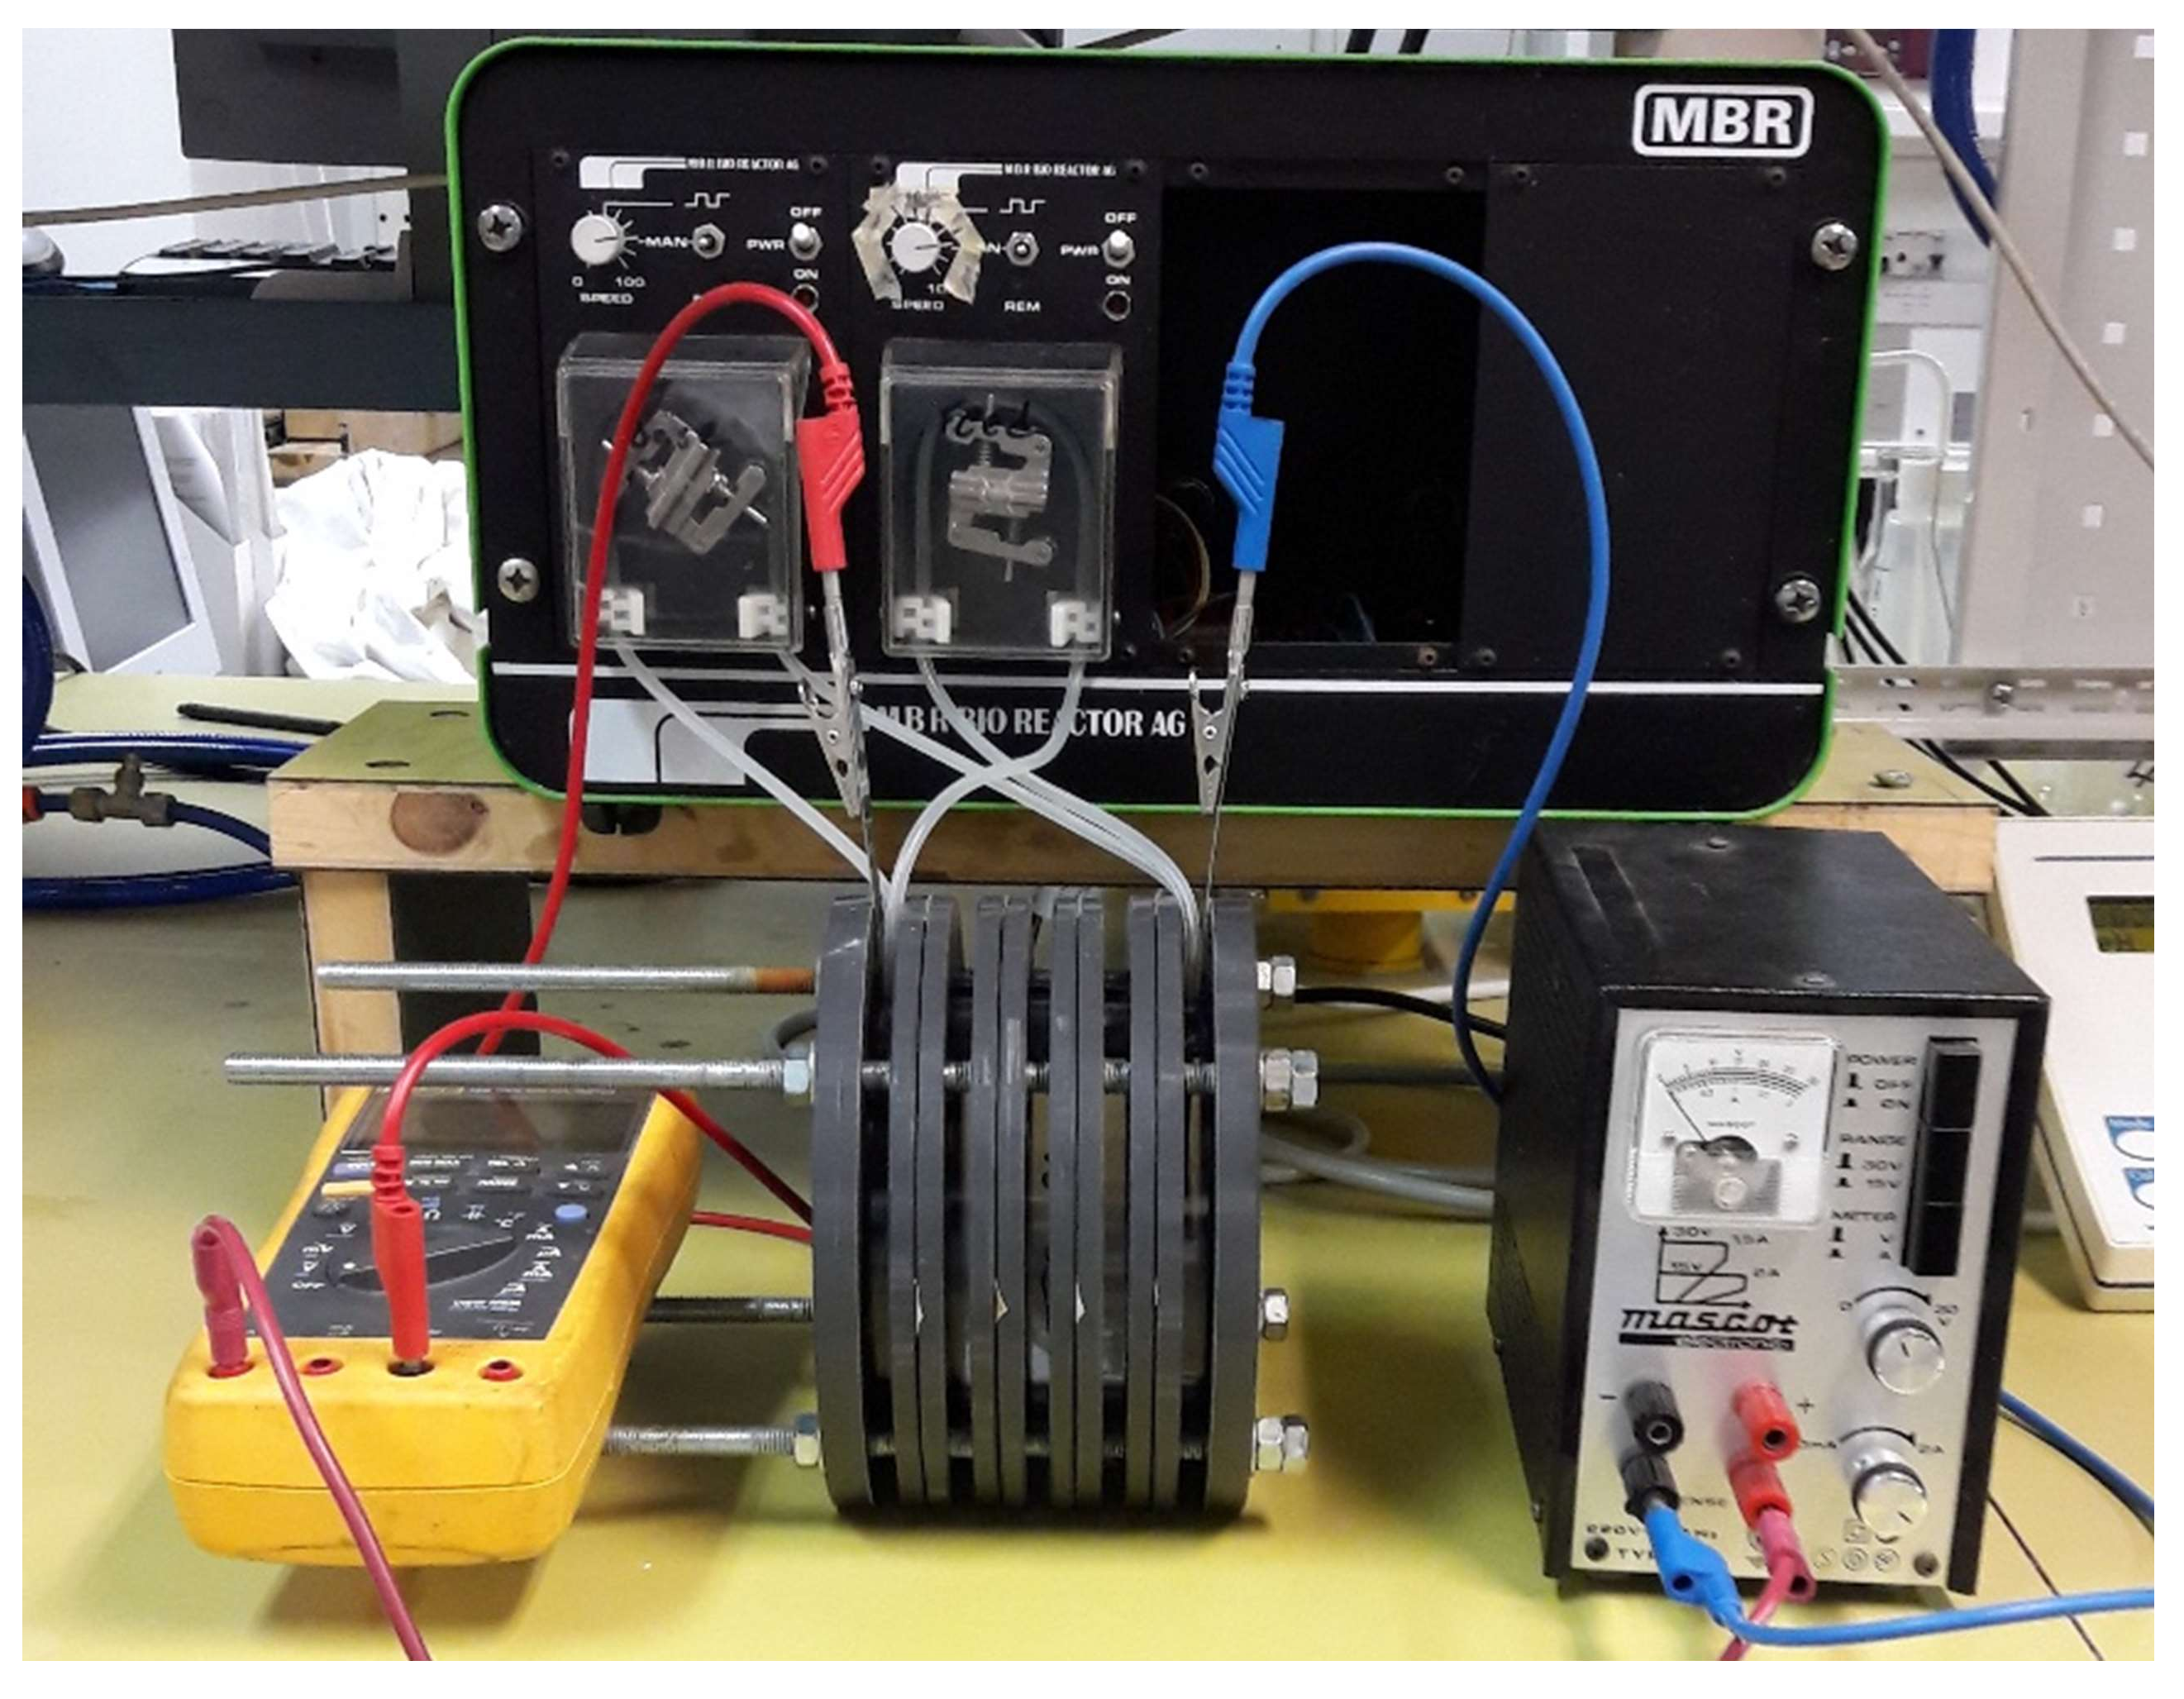
Figure 5.
NH4+ separation efficiency as function of time.
Figure 6.
pH as function of time in the middle cell for the experiments presented in Figure 5. The lines give information about the presence of HSO4− in % versus SO42−.
Figure 6.
pH as function of time in the middle cell for the experiments presented in Figure 5. The lines give information about the presence of HSO4− in % versus SO42−.

Figure 7.
(a) Electric current as function of time as a total over the stack, (cross section area 77 cm2); (b) Voltage drop as function of time.
Figure 7.
(a) Electric current as function of time as a total over the stack, (cross section area 77 cm2); (b) Voltage drop as function of time.
Figure 8.
Power input as function of time.

Figure 9.
(a) NH4+ separation efficiency; (b) pH; (c) electric current; (d) voltage drop and (e) power as function of time for tests done with double cell distance (80 mm).
Figure 9.
(a) NH4+ separation efficiency; (b) pH; (c) electric current; (d) voltage drop and (e) power as function of time for tests done with double cell distance (80 mm).
Figure 10.
(a) NH4+ removal efficiency; (b) pH; (c) electric current and (d) power as function of time for tests done with five cells.
Figure 10.
(a) NH4+ removal efficiency; (b) pH; (c) electric current and (d) power as function of time for tests done with five cells.

Figure 11.
Cumulative exergy input in kJ as function of time.

Figure 12.
Cumulative exergy input in kJ as function of time for tests with double anode and cathode cell distance.
Figure 12.
Cumulative exergy input in kJ as function of time for tests with double anode and cathode cell distance.
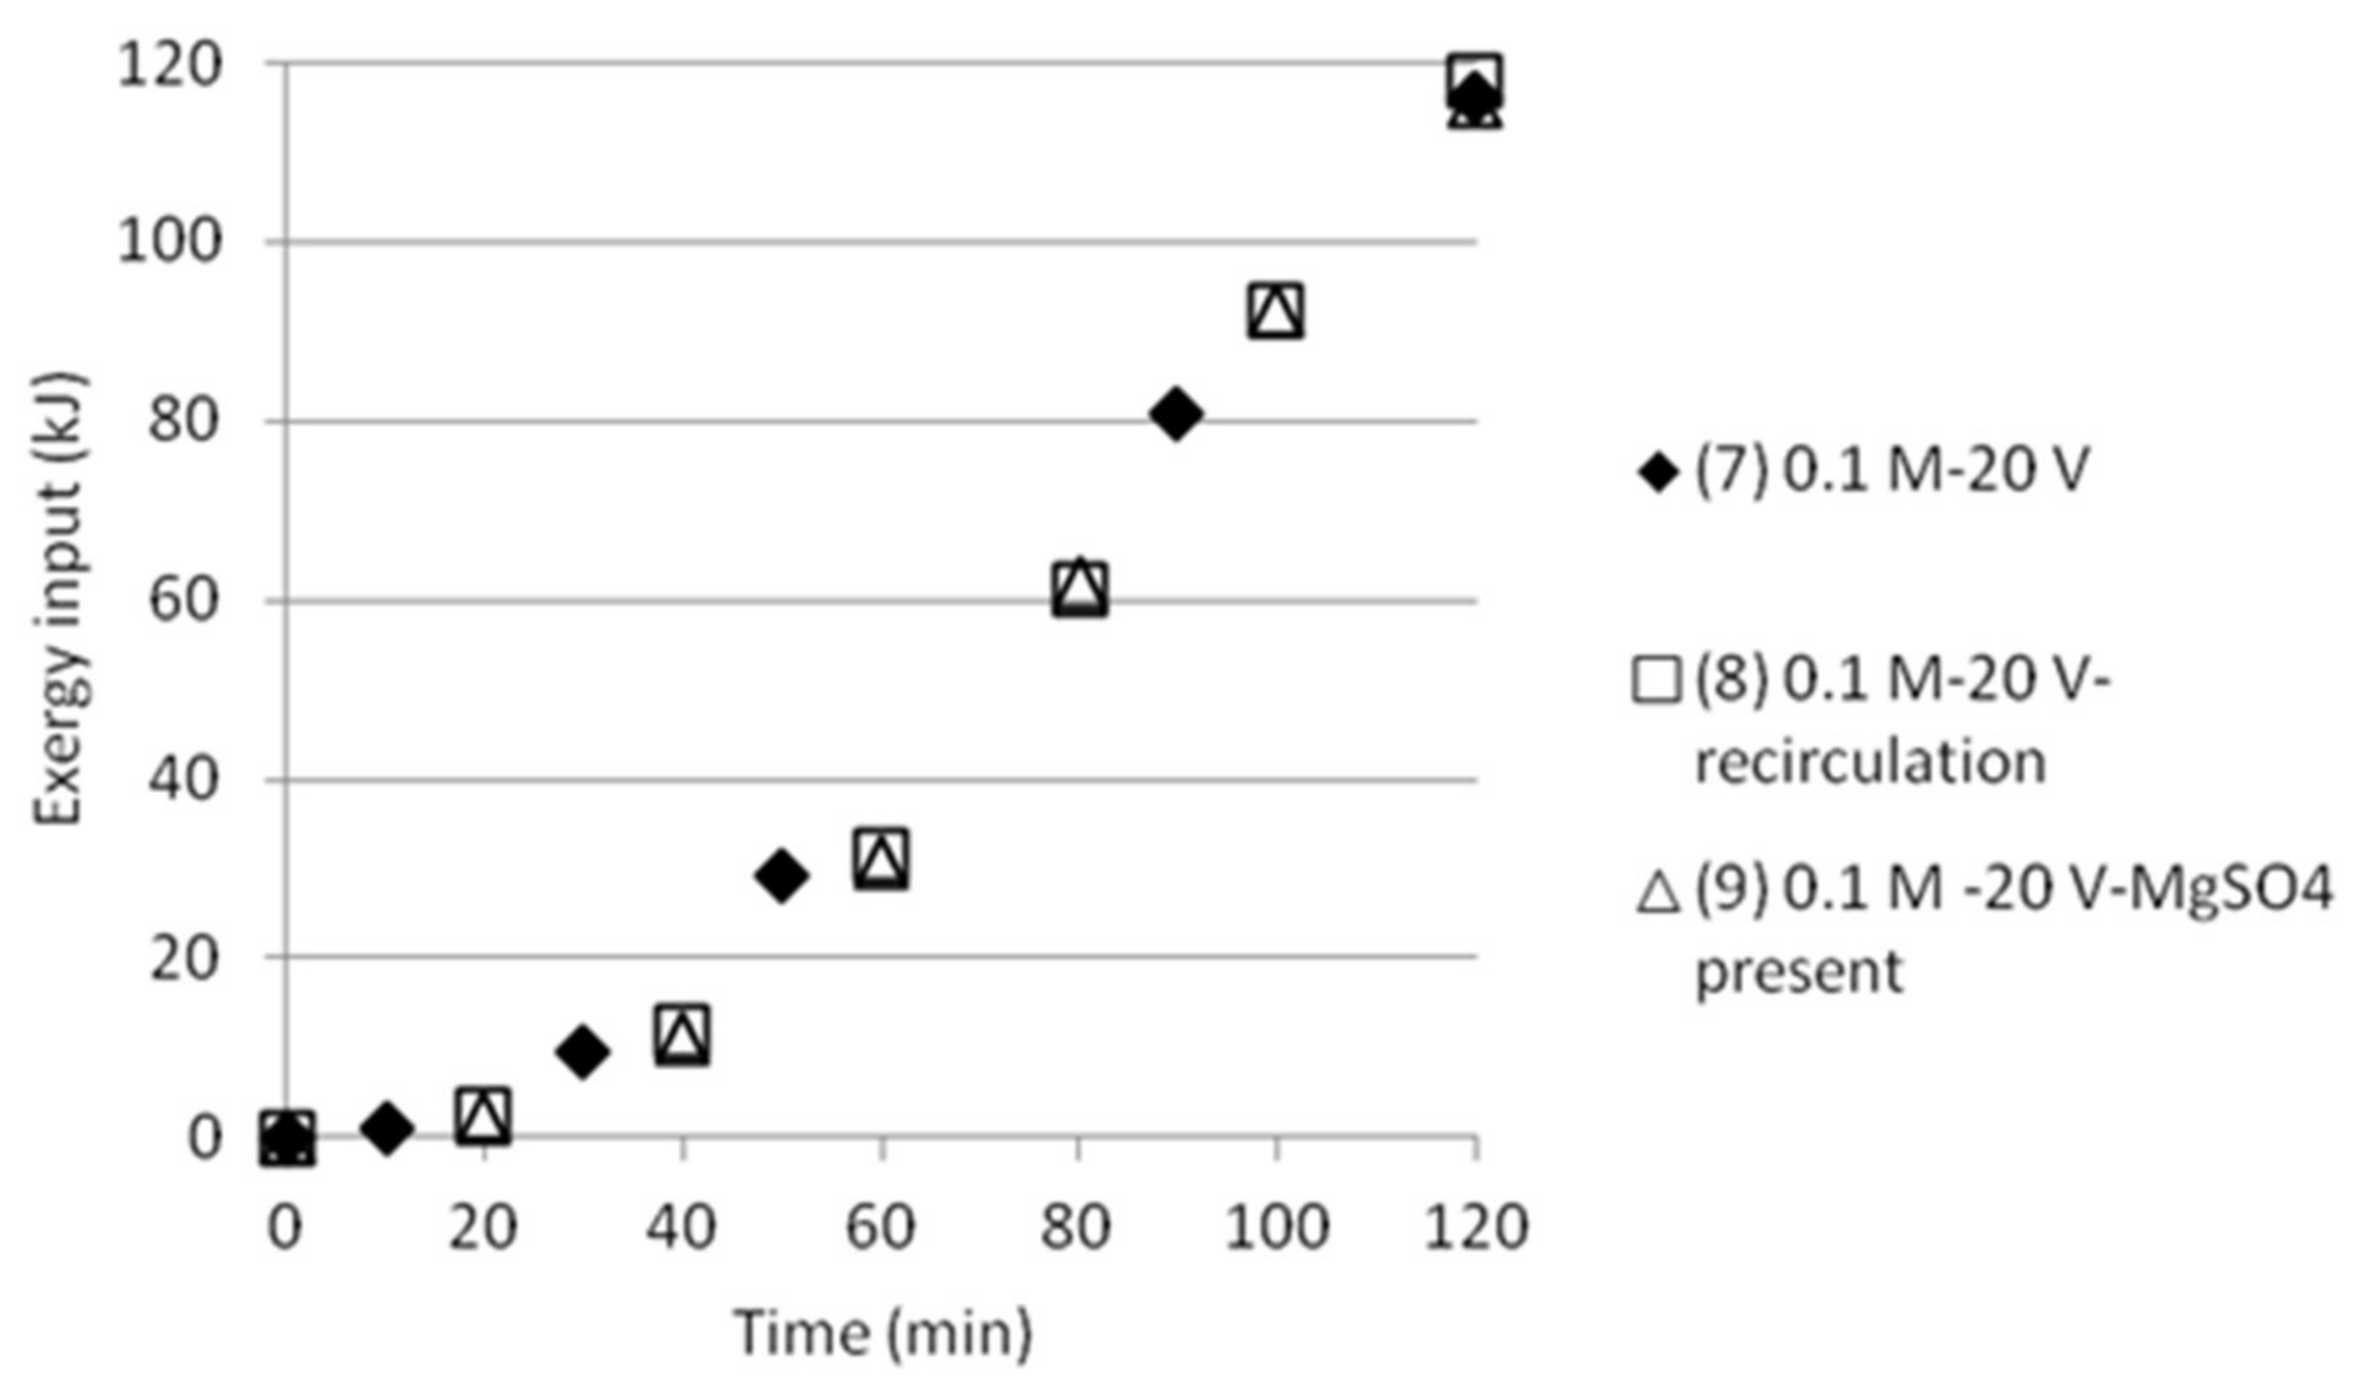
Figure 13.
Cumulative exergy input in kJ as function of time for tests with five compartments.
Table 1.
Measured pH, conductivity and ammonium concentration in the cells of an electrodialysis stack. A cationic monovalent membrane is placed between cells 1 and 2. An anionic monovalent membrane is placed between cells 2 and 3.
Table 1.
Measured pH, conductivity and ammonium concentration in the cells of an electrodialysis stack. A cationic monovalent membrane is placed between cells 1 and 2. An anionic monovalent membrane is placed between cells 2 and 3.
| Solution | Time (h) | AS/ABS (Cell 1) | Dest. H2O (Cell 2) | AS/ABS (Cell 3) |
|---|---|---|---|---|
| pH | 0 | 1.92 | 6.7 | 1.92 |
| pH | 24 | 1.83 | 2.45 | 2.75 |
| pH | 48 | 1.82 | 2.35 | 2.52 |
| Conductivity, μS/cm | 0 | 14450 | 10 | 14450 |
| Conductivity, μS/cm | 24 | 13100 | 2100 | 9800 |
| Conductivity, μS/cm | 48 | 14700 | 2500 | 10100 |
| [NH4+], mmol/dm3 | 0 | 49.7 | 0.05 | 49.7 |
| [NH4+], mmol/dm3 | 24 | No data | No data | No data |
| [NH4+], mmol/dm3 | 48 | 41 | 6 | 59 |
| [NH4+] balance, % | 48 | 8.7↓ | 5.95↑ | 9.3↑ |
Table 2.
Summary of the variation of experimental start parameters.
| Test | Time (min) | Anode/Cathode | Voltage (V) | AS (mol/dm3) | ABS (mol/dm3) |
|---|---|---|---|---|---|
| 1 | 120 | Stainless steel (×2) | 10 | 0.5 | 0.5 |
| 2 | 60 | Stainless steel (×2) | 20 | 0.03 | 0.03 |
| 3 | 25 | Silver/Stainless steel | 20 | 0.03 | 0.03 |
| 4 | 120 | Stainless steel (×2) | 20 | 0.1 | 0.1 |
| 5 | 120 | Stainless steel (×2) | 20 | - | 0.1 |
| 6 | 75 | Stainless steel (×2) | 20 | 0.5 | 0.5 |
Table 3.
ABS separation efficiency at the end of every test. Concentrations are in mol/dm3.
| Test | Test Name | Time (min) | pHfinal | [NH4+]start as ABS | [NH4+]final | SO42− /HSO4−final | [HSO4−]final | ABS sep. eff. (%) |
|---|---|---|---|---|---|---|---|---|
| 1 | 0.5 M-10 V | 120 | 1.75 | 0.268 | 0.072 | 0.575 | 0.0559 | 20.9 |
| 2 | 0.03 M-20 V | 60 | 1.99 | 0.017 | 0.013 | 1.000 | 0.0087 | 50.7 |
| 4 | 0.1 M-20 V | 120 | 1.48 | 0.057 | 0.058 | 0.309 | 0.0502 | 88.1 |
| 5 | 0.1 M ABS-20 V | 120 | 1.43 | 0.057 | 0.021 | 0.275 | 0.0180 | 31.6 |
| 6 | 0.5 M-20 V | 75 | 1.94 | 0.268 | 0.072 | 0.891 | 0.0498 | 18.6 |
Table 4.
Summary of the variation in experimental start parameters for tests with double anode and cathode cell distance.
Table 4.
Summary of the variation in experimental start parameters for tests with double anode and cathode cell distance.
| Test | Time (min) | Anode/Cathode | Voltage (V) | AS (mol/dm3) | ABS (mol/dm3) | MgSO4 (mol/dm3) | Recirculation (20 mL/min) |
|---|---|---|---|---|---|---|---|
| 7 | 120 | Stainless steel (×2) | 20 | 0.1 | 0.1 | - | No |
| 8 | 120 | Stainless steel (×2) | 20 | 0.1 | 0.1 | - | Yes |
| 9 | 120 | Stainless steel (×2) | 20 | 0.1 | 0.1 | 0.1 | Yes |
Table 5.
Summary of the variation of experimental start parameters.
| Test | Time (min) | Anode/Cathode | Voltage (V) | AS/ABS (mol/dm3) | Cell Width (mm) | Recirculation (20 mL/min) |
|---|---|---|---|---|---|---|
| 10 | 120 | Stainless steel (×2) | 20 | 0.05/0.05 | 40 | Yes |
| 11 | 120 | Platinum/Stainless steel | 20 | 0.05/0.05 | 18 | No |
| 12 | 120 | Platinum/Stainless steel | 20 | 0.05/0.05 | 18 | Yes |
| 13 | 120 | Platinum/Stainless steel | 10 | 0.05/0.05 | 18 | Yes |
| 14 | 120 | Platinum/Stainless steel | 15 | 0.05/0.05 | 18 | Yes |
| 15 | 120 | Stainless steel (×2) | 15 | 0.05/0.05 | 18 | Yes |
Table 6.
Exergy of mixing, ∆Exmix, in kJ at the end state of the test calculated in Cell 1 and 2, respectively. The mixing exergy is given as a total and as exergy per mol of NH4+. Some data from Cell 1 is missing for test 5 and 6.
Table 6.
Exergy of mixing, ∆Exmix, in kJ at the end state of the test calculated in Cell 1 and 2, respectively. The mixing exergy is given as a total and as exergy per mol of NH4+. Some data from Cell 1 is missing for test 5 and 6.
| Test | Test Name | Cell 1 ∆Exmix (kJ) | Cell 1 ∆Exmix (kJ/mol NH4+) | Cell 2 ∆Exmix (kJ) | Cell 2 ∆Exmix (kJ/mol NH4+) |
|---|---|---|---|---|---|
| 1 | 0.5 M-10 V | 0.0365 | 0.0093 | −0.0030 | −0.0212 |
| 2 | 0.03 M-20 V | 0.0008 | 0.0033 | −0.0002 | −.0048 |
| 4 | 0.1 M-20 V | 0.0009 | 0.0063 | −0.0024 | −0.0176 |
| 5 | 0.1 M ABS-20 V | - | - | −0.0007 | −0.0072 |
| 6 | 0.5 M-20 V | - | - | −0.0030 | −0.0212 |
© 2018 by the authors. Licensee MDPI, Basel, Switzerland. This article is an open access article distributed under the terms and conditions of the Creative Commons Attribution (CC BY) license (http://creativecommons.org/licenses/by/4.0/).
Share and Cite
MDPI and ACS Style
Koivisto, E.; Zevenhoven, R. Membrane Separation of Ammonium Bisulfate from Ammonium Sulfate in Aqueous Solutions for CO2 Mineralisation. Geosciences 2018, 8, 123. https://doi.org/10.3390/geosciences8040123
AMA Style
Koivisto E, Zevenhoven R. Membrane Separation of Ammonium Bisulfate from Ammonium Sulfate in Aqueous Solutions for CO2 Mineralisation. Geosciences. 2018; 8(4):123. https://doi.org/10.3390/geosciences8040123
Chicago/Turabian StyleKoivisto, Evelina, and Ron Zevenhoven. 2018. "Membrane Separation of Ammonium Bisulfate from Ammonium Sulfate in Aqueous Solutions for CO2 Mineralisation" Geosciences 8, no. 4: 123. https://doi.org/10.3390/geosciences8040123
Note that from the first issue of 2016, this journal uses article numbers instead of page numbers. See further details here.