Integrated Reservoir Characterization Study of the McKee Formation, Onshore Taranaki Basin, New Zealand

Department of Physical and Geological Sciences, Faculty of Science, Universiti Brunei Darussalam, Jalan Tungku Link, Gadong BE 1410, Brunei Darussalam
*
Author to whom correspondence should be addressed.
Geosciences 2018, 8(4), 105; https://doi.org/10.3390/geosciences8040105
Submission received: 10 January 2018
/
Revised: 26 February 2018
/
Accepted: 13 March 2018
/
Published: 21 March 2018
(This article belongs to the Special Issue Selected Papers from 1st International Congress on Earth Sciences in SE Asia)
Abstract
:The Late Eocene onshore McKee Formation is a producing reservoir rock in Taranaki Basin, New Zealand. An integrated petrophysical, sedimentological, and petrographical study was conducted to evaluate the reservoir characteristics of the McKee sandstone. A petrographic study of the McKee Formation classified the sandstone as arkose based on the Pettijohn classification. Porosity analysis showed predominantly intergranular porosity, as elucidated by the thin section photomicrographs. The good reservoir quality of McKee sandstone was suggested to be the result of the presence of secondary dissolution pores interconnected with the primary intergranular network. Mineral dissolution was found to be the main process that enhanced porosity in all the studied wells. On the other hand, the presence of clay minerals, cementation, and compaction were identified as the main porosity-reducing agents. These features, however, were observed to occur only locally, thus having no major impact on the overall reservoir quality of the McKee Formation. For a more detailed reservoir characterization, well log analysis was also applied in the evaluation of the McKee Formation. The result of the well log analysis showed that the average porosity ranged from 11.8% to 15.9%, with high hydrocarbon saturation ranging from 61.8% to 89.9% and clay volume content ranging from 14.9 to its highest value of 34.5%. Based on the well log analysis, the derived petrophysical and reservoir parameters exhibited good porosity, low clay content, and high hydrocarbon saturation, which indicates that the McKee Formation is a promising reservoir.
1. Introduction
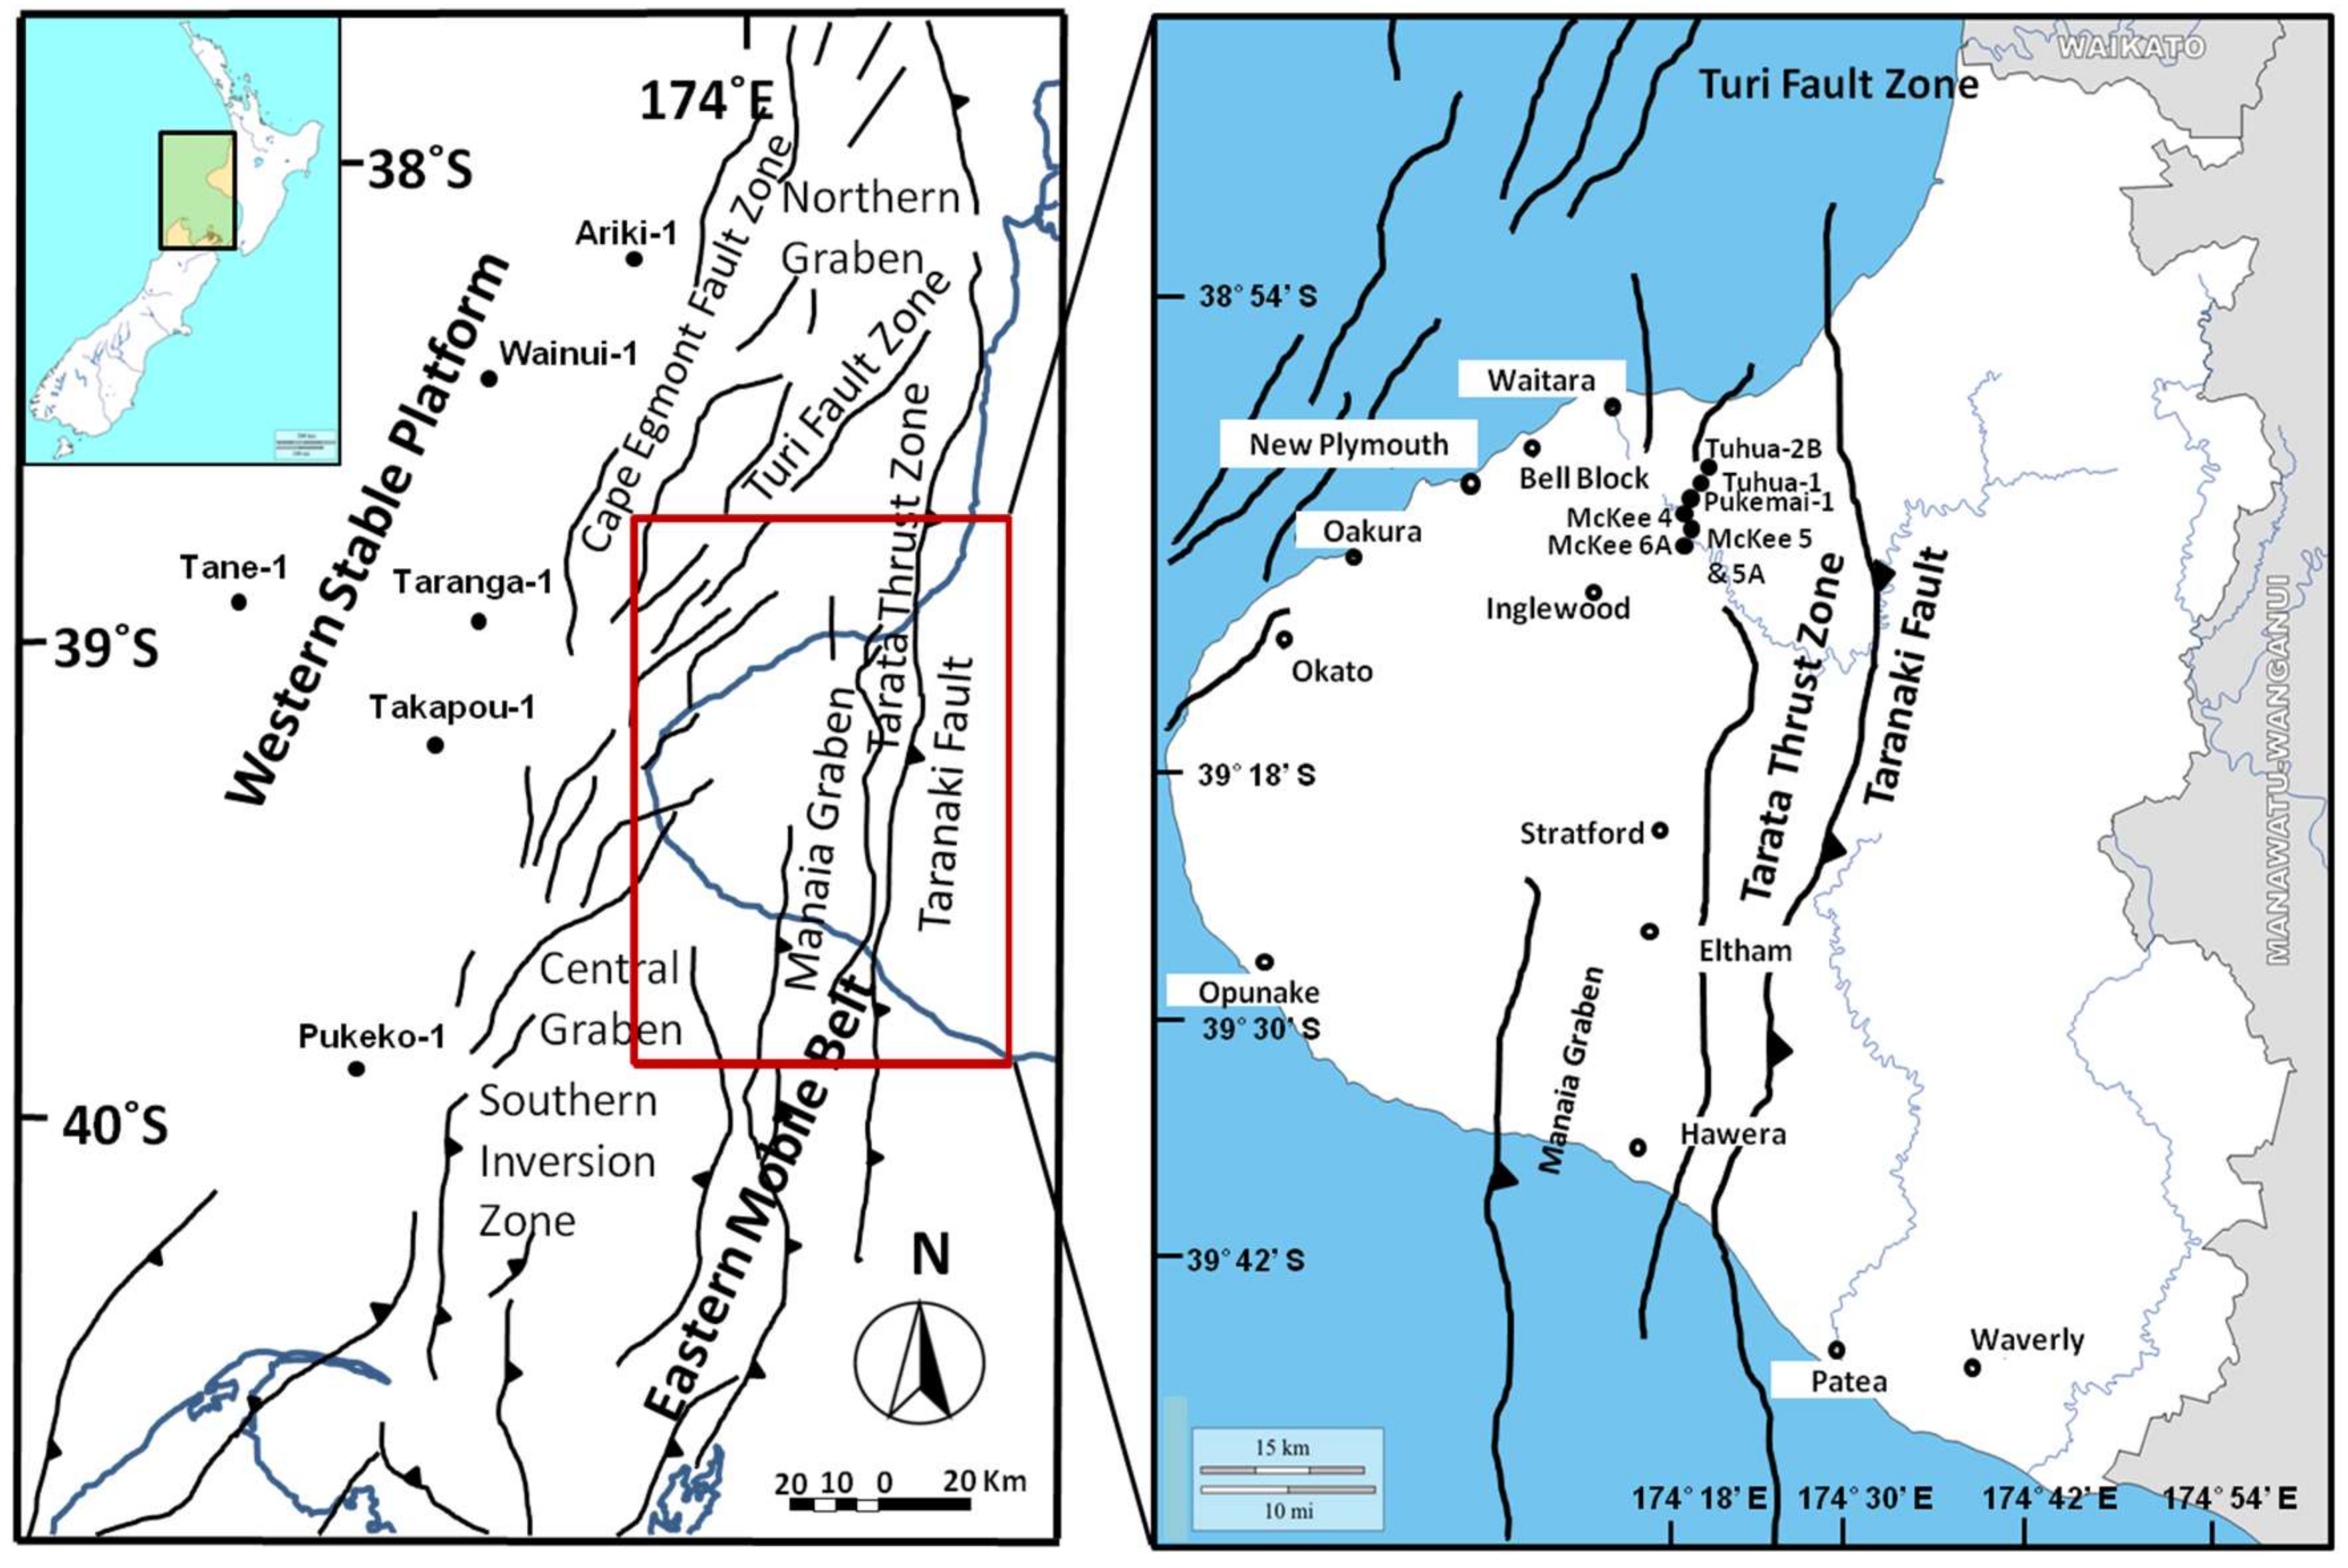
The Taranaki Basin is a Cretaceous to Tertiary sedimentary basin covering an area of 100,000 km2 that is situated on the western side of the North Island of New Zealand. The Taranaki Basin is the only commercial petroleum producing basin in the country. Most of the known petroleum reserves have been discovered along the Paleocene shoreline and the coastal plain sandstone deposited in a late-rift or post-rift passive margin setting [1]. The formation of interest in this study is the Late Eocene, trangressive shoreface sandstone McKee Formation, which is usually found with thicknesses of less than 100 m [1]. The McKee Formation belongs to the Kapuni Group (Paleocene to Eocene), where it is predominantly composed of sandstone beds encountered in wells located in the eastern and central Taranaki Graben [2]. The sandstone of the McKee Formation is described as generally massive, light in color, highly quartzose, fine to coarse in grain size, and with some mud clasts and carbonaceous materials interbedded in the reservoir rocks [1]. A total of seven onshore wells (McKee 4, McKee 5, McKee 5A, McKee 6A, Pukemai-1, Tuhua-1, and Tuhua-2B) (Figure 1) that had encountered the McKee Formation were selected for this study. Sedimentological and petrographical studies were undertaken on these wells to examine the effects of mineralogy and diagenetic characteristics on the reservoir quality evolution and the sandstone of the McKee Formation in the Taranaki Basin. Similar studies have been done [3,4,5,6] to investigate the diagenetic effects on the reservoir quality of the sandstone reservoir. In addition, qualitative and quantitative interpretation was applied on the results of the well log analysis in the evaluation of this formation. With qualitative analysis, the presented log plots were studied to identify the log responses that typically indicate the possible presence of hydrocarbons. With regard to the quantitative analysis, the values of the petrophysical properties (porosity, water saturation and hydrocarbon saturation) obtained from cut-offs were evaluated. The objective of this research was to assess the reservoir quality and hydrocarbon potentiality of the McKee Formation with the aforementioned studies.
2. Geological Setting and Lithostratigraphy
New Zealand started its formation as a micro-continent that had broken off from Gondwana. The micro-continent was rifted before seafloor spreading between Australia, New Zealand and Antarctica, and again before the opening of the Tasman Sea in the Late Cretaceous. The rifting of the Tasman Sea ceased during the Palaeocene. From that time until the end of the Oligocene, the New Zealand micro-continent subsided gradually [8]. Twenty-five million years ago, the present-day system of New Zealand was initiated [9].
The area of interest, the Taranaki Basin (Figure 1), which is well-known for its hydrocarbon play in New Zealand, is located laterally on the western side of the North Island [10]. The formation of the basin began during the late Cretaceous, when Australia and Zealandia were separated by the breakup of Gondwana, which resulted in the formation of the Tasman Sea and the extensional basins around the New Zealand subcontinents [11]. As the Taranaki Basin was initiated, it formed en échelon (in order) a series of extensional half grabens [12]. The basin is shaped by multiple episodes of deformation, which include the Late Cretaceous-Paleocene fault controlled rift transform, the Eocene-Early Oligocene passive contractional margin, and the Oligocene-Recent active margin [13,14].
The main structure of the Taranaki Basin can be divided into two parts (Figure 1): (I) The Western stable platform; and (II) The Eastern mobile belt [7]. The Western stable platform covers the area from the Cape Egmont fault zone in the west to almost the continental shelf edge. It is characterized by its wide, simple, and relatively undeformed structure and stratigraphy aged from the Late Cretaceous to present day sediments. The sedimentary sequence has largely been undisturbed since the late Eocene [15]. Between a relatively stable platform and the mobile belt lies the Cape Egmont fault zone, which separates both platforms, trending north to northeast. The Eastern mobile belt comprises the Southern Inversion Zone, Central Graben, Manaia Graben, and Northern Graben. The platform trends from north to south with its eastern side largely affected by the compressional forces that formed features such as the Tarata Thrust Zone [16].
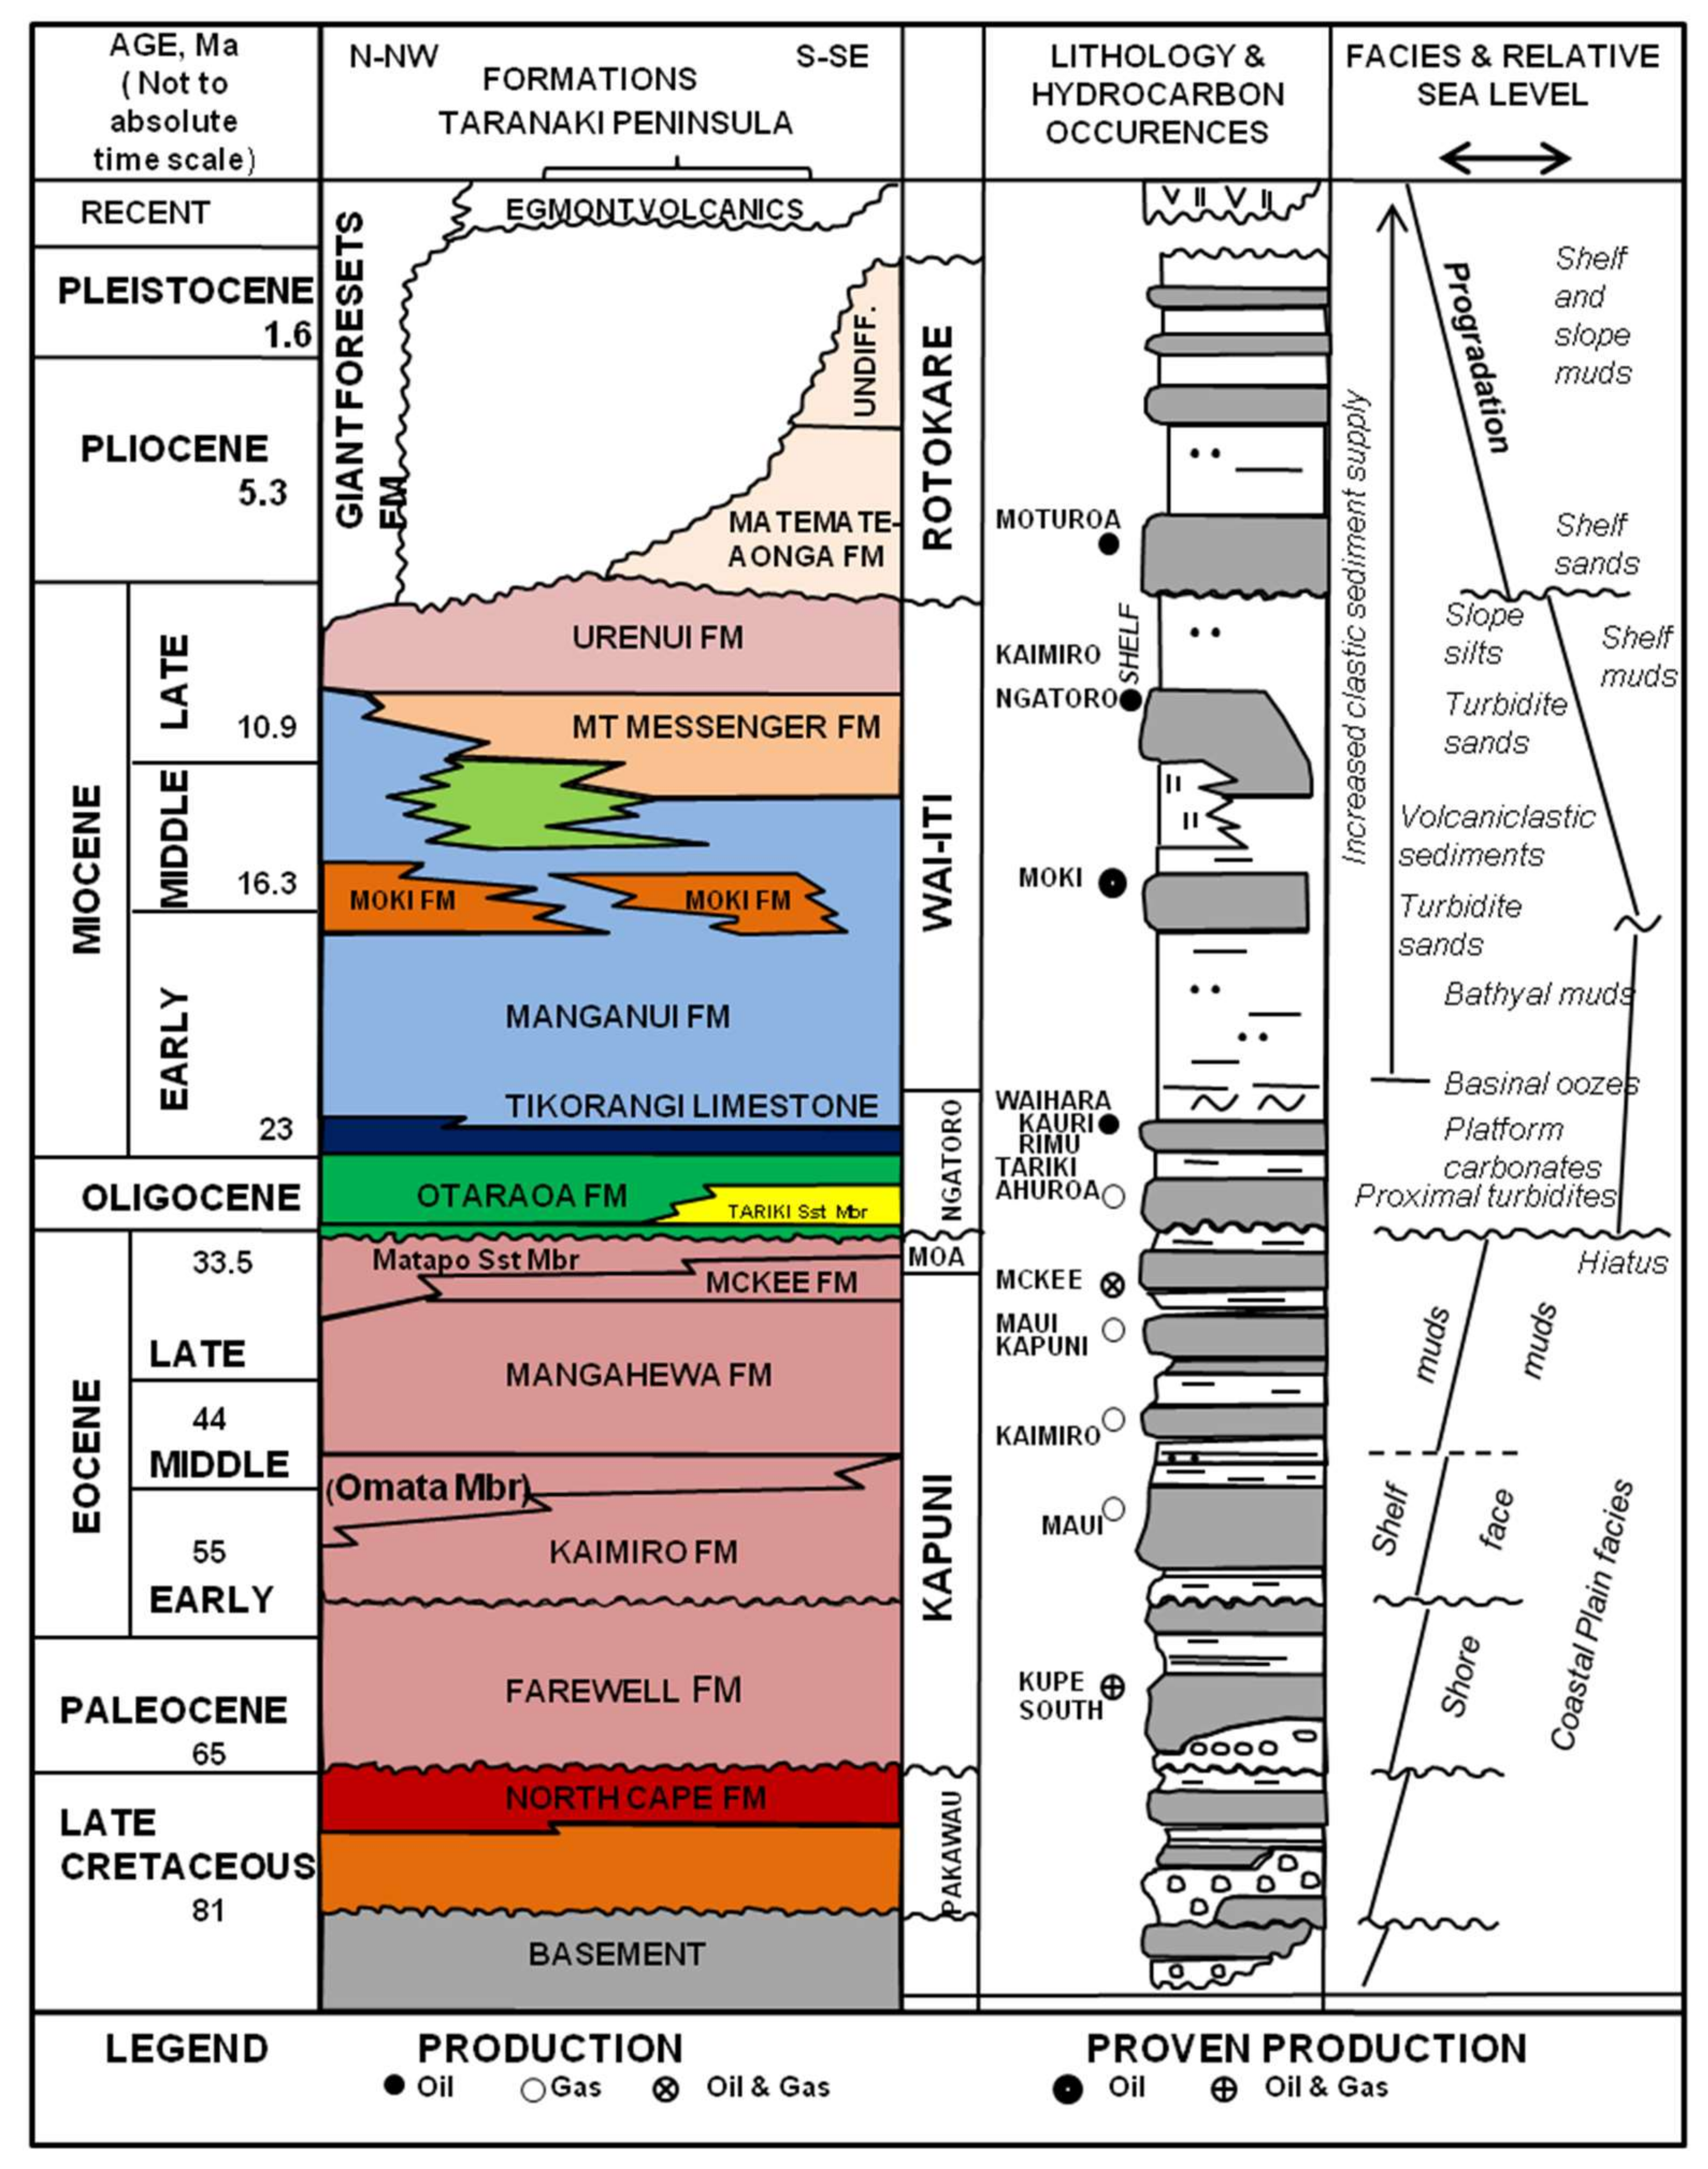
The generalized stratigraphy of the Taranaki Basin consists of several groups, and each group has several petroleum-bearing formations of different ages (Figure 2). These groups are the Pakawau Group, Kapuni Group, Moa Group, Ngatoro Group, Wai-iti Group, and Rotokare Group from the Late Cretaceous to the Pleistocene [1]. The formation of interest is called the McKee Formation, and belongs to the Kapuni Group. The formation (38–33 Ma) has been interpreted as Late Eocene, with thicknesses commonly less than 100 m (Figure 2 and Figure 3). A stratigraphic cross-section between the four selected wells (McKee 4, McKee 6A, Pukemai-1 and Tuhua-1) in the McKee field has been made to show the lateral extension of the McKee Formation and other formations (Figure 3). This field can be found developed within the Tarata Thrust Zone (Figure 1), located 14 km southeast of Waitara. The McKee Formation reservoir is a fairly uniform sand body that dips steeply at an angle of up to 60°, and hydrocarbons are structurally trapped in the NS-trending individual fault-bound blocks [17,18]. The depositional environment for the McKee Formation has been inferred to be transitional, from the shallow marine inner-shelf to the coastal deposits [1,19].
3. Materials and Methods
3.1. Sedimentological and Petrographical Analysis
A complete data set was provided by GNS Science (Lower Hutt, New Zealand) and the Ministry of Business, Innovation, and Employment of New Zealand. These data include the conventional well log data and petrophysical analysis results (porosity and permeability). Thin section photomicrographs were also provided for sedimentological and petrographical descriptions. Thin section petrography was carried out on several samples obtained from different wells in the study area, including McKee 4 at depths of 2355 m, 2368 m, 2401 m, and 2463 m; McKee 5A at a depth of 2328 m; McKee 6A at depths of 2173 m, 2184 m, 2217 m, and 2240 m; and Tuhua-1 at depths of 2251 and 2256 m were provided. However, only selected samples from these wells (Table 1) were used to investigate the diagenetic features that affect reservoir quality. All the data were given with full permission for analysis, interpretation, and publication.
3.2. Well Log Analysis
A total of seven wells from the McKee oil and gas field were selected for the evaluation of hydrocarbon potential for Late Eocene McKee sandstone (Figure 1). The types of data used for interpretation consisted of open-hole conventional logs such as total gamma ray (GR), shallow and deep resistivity logs (spherically focused resistivity log (SFLU), shallow resistivity (RESS), medium resistivity (RESM) and deep resistivity (RESD), sonic log (DTC), Neutron (NPHI), and Density (RHOB). The McKee Formation encountered these logs at the intervals of 2345.5–2464 m for McKee 4, 2369–2422 m for McKee 5, 2280.5–2359 m for McKee 5A, 2164–2243 m for McKee 6A, 2211–2243 m for Pukemai-1, 2228–2303.5 m for Tuhua-1, and 2258–2337 m for Tuhua-2B.
Well log analysis of the reservoir rocks was accomplished by Interactive Petrophysics (Schlumberger Limited, Houston, TX, USA) and Neuralog software (Neuralog Inc., Houston, TX, USA). By utilizing the software, three important petrophysical parameters (shale volume, porosity, and water saturation) of the reservoir rocks were interpreted. The shale volume was calculated from the single log (gamma ray and resistivity) and double log indicators (combination of neutron and density log) [20]. Additionally, zoning of the shale zone was conducted to delineate the reservoir sand zone from the non-reservoir zone to prevent the overestimation of porosity and water saturation [21]. The minimum results of the indicators were then chosen from the three shale indicators of gamma ray, neutron-density, and resistivity. By using the cross-plot of density porosity against neutron porosity, the type of shale habitat was computed, where it was later used in the parameter input of porosity and water saturation interpretation [22]. The porosity model was estimated by using the combination of neutron density logs, while water saturation was computed based on the type of shale distribution found within the sand zones [23]. Subsequently, cut-offs were applied to eliminate the non-reservoir sand zone with Φ < 0.1, Vcl > 0.5, and Sw > 0.5 to obtain the net pay values of the reservoir from the wells.
4. Results and Discussions
4.1. Sedimentological and Petrographical Study
4.1.1. Composition and Texture of McKee Sandstone
The Pettijohn classification [24] was used to classify the McKee sandstone of the studied wells. With the aid of the triangle crossplot, the result of the ternary diagram indicated that the reservoir was arkose, containing mostly quartz and feldspar (Figure 4). The studied sandstone was found to have mostly medium-sized grains and was moderate to well-sorted. These features could be seen from the thin section photomicrographs.
4.1.2. Depositional Control
The sedimentological and petrographical studies concluded that the reservoir quality of the McKee sandstone was controlled by depositional and diagenetic processes. Depositional control largely influenced the textural parameters such as grain size, compositional framework, sorting and the primary fabrics [25]. In general, the aforementioned parameters primarily affected both the porosity and permeability of the reservoir facies. Coarser grain sizes in reservoir rocks tend to have higher porosity and permeability, creating pathways for fluid flow [26]. There was a generally positive correlation between the grain sizes and the porosity and permeability of the McKee sandstone (Figure 5). The correlation showed that the grain size of the studied McKee sandstone was an important contributor to its porosity and permeability.
4.1.3. Diagenetic Control
Following the depositional process, diagenesis tends to alter the original pore system of the reservoir rocks. There are four main diagenetic mechanisms that affect the reservoir quality of McKee sandstone: dissolution, presence of clay minerals, cementation, and compaction.
Dissolution
The dissolution process is an important diagenetic factor for the characterization of reservoir rocks, and leads to the enhancement of porosity and permeability [5]. The process can be seen among the pores where grains are dissolved, leading to the development of secondary porosity [27,28]. Secondary porosity could be seen within the studied McKee sandstone where voids were created from the dissolution of quartz (Figure 6A–C) and unstable minerals such as feldspar (Figure 6A–C) and calcite cement (Figure 6D). Secondary pores by dissolution are capable of creating isolated voids as well as those well connected to the intergranular pore network. Isolated voids (Figure 6A–C) are created by the dissolution of the detrital feldspar where this can occur in sandstones from all localities [3]. The isolated voids provide little contribution to permeability, even if the voids are large, as permeability is controlled by the pore throats [29]. The connected dissolution pores, in contrast, have better communication with the intergranular pore network. The pores connected by dissolution were visible (Figure 6A–C), but is most evident in Figure 6A, where the dissolution of quartz grains enhanced the existing inter-granular porosity. The coexistence of primary and secondary porosity is referred to as hybrid porosity, where they are generally expected to promote the pore spaces for fluid flow [27].
Clay Minerals
The presence of clay in sandstone has a damaging effect on reservoir quality, as it often occupies the pore spaces. Within the McKee sandstone (Figure 7A), this part of the reservoir was found to be variably argillaceous, and clays could be seen filling the pores. There is a possibility that these clays are allogenic, where the origin of these clay minerals may be co-deposited alongside sand grains as sand-sized argillaceous intra-clasts [30,31]. With moderate magnification (Figure 7B), the observed clay was hypothesized to be authigenic in origin, where unstable feldspar can be seen partially altered with remnants of the host grain still present. This is formed by the acidization of the pore fluid solution at greater depths, which leads to rapid illite or kaolinite formation in feldspar [32].
Cementation
Cementation can be seen as another important porosity-reducing diagenetic process within the McKee Formation. The process is involved in the nucleation and crystal growth that occurs within pore spaces during diagenesis [33]. Two main types of cementation were recognized in the sandstone of the reservoir facies: quartz overgrowth and calcite cementation. In general, the occurrence of these types of cementation are not constrained to a specific depositional environment [4]. Quartz overgrowth (Figure 7C,D) was identified based on the shape of the original grain surrounded by a slight darker rim (dust rim) within the new growth. These are generally referred to as syntaxial overgrowths. In addition, quartz overgrowth was observed to be more common (Figure 6B,E,F) with no negative consequence on the reservoir quality, even if they were present adjacent to the large visible voids that resulted in the slight reduction in pore spaces. Another form of cementation was observed in the heavily cemented thin section (Figure 7E), where calcite cementation filled the pore spaces of a highly quartzose sample with no visible porosity.
Compaction
Lastly, compaction in sandstone can be identified by recognizing its effects, which include grain fracture, long contact, concavo-convex contact, tight grain packing, and microstylolite within the studied sandstone. Increased depth due to burial tends to accelerate grain fracturing and the bending of weaker or ductile grains (Figure 7F). Grain fracturing has been observed in McKee sandstone (Figure 7F), which can be credited to compaction through either overburden pressure due to burial phase or tectonic movement. The presence of features such as tight grain packing and major grain contacts such as concave-convex and long contact (Figure 7F) indicates that the sandstone experienced mechanical compaction at a moderate scale [28,34]. Despite the moderate compaction experienced by the sample, pore spaces were observed to persist especially among contacts between the quartz grains, suggesting its stable grain framework. Chemical compaction was also recognized by the presence of pressure solution in the studied sample. In the studied sample, compaction effects such as microstylolites (Figure 7E) were identified alongside cementation that resulted in a greater loss of pore spaces than mechanical compaction. The occurrence of microstylolites within highly quartzose samples is often associated with the possibility of a high degree of compaction due to deeper burial depths [4,35]. Furthermore, the solubility of quartz is believed to slightly increase in response to pressure [36]. In summary, the pore spaces of the McKee Formation were observed to reduce by mechanical compaction. Further reduction of pore spaces can only be credited to chemical compaction in the McKee sandstone [4].
4.2. Core Sample Analysis
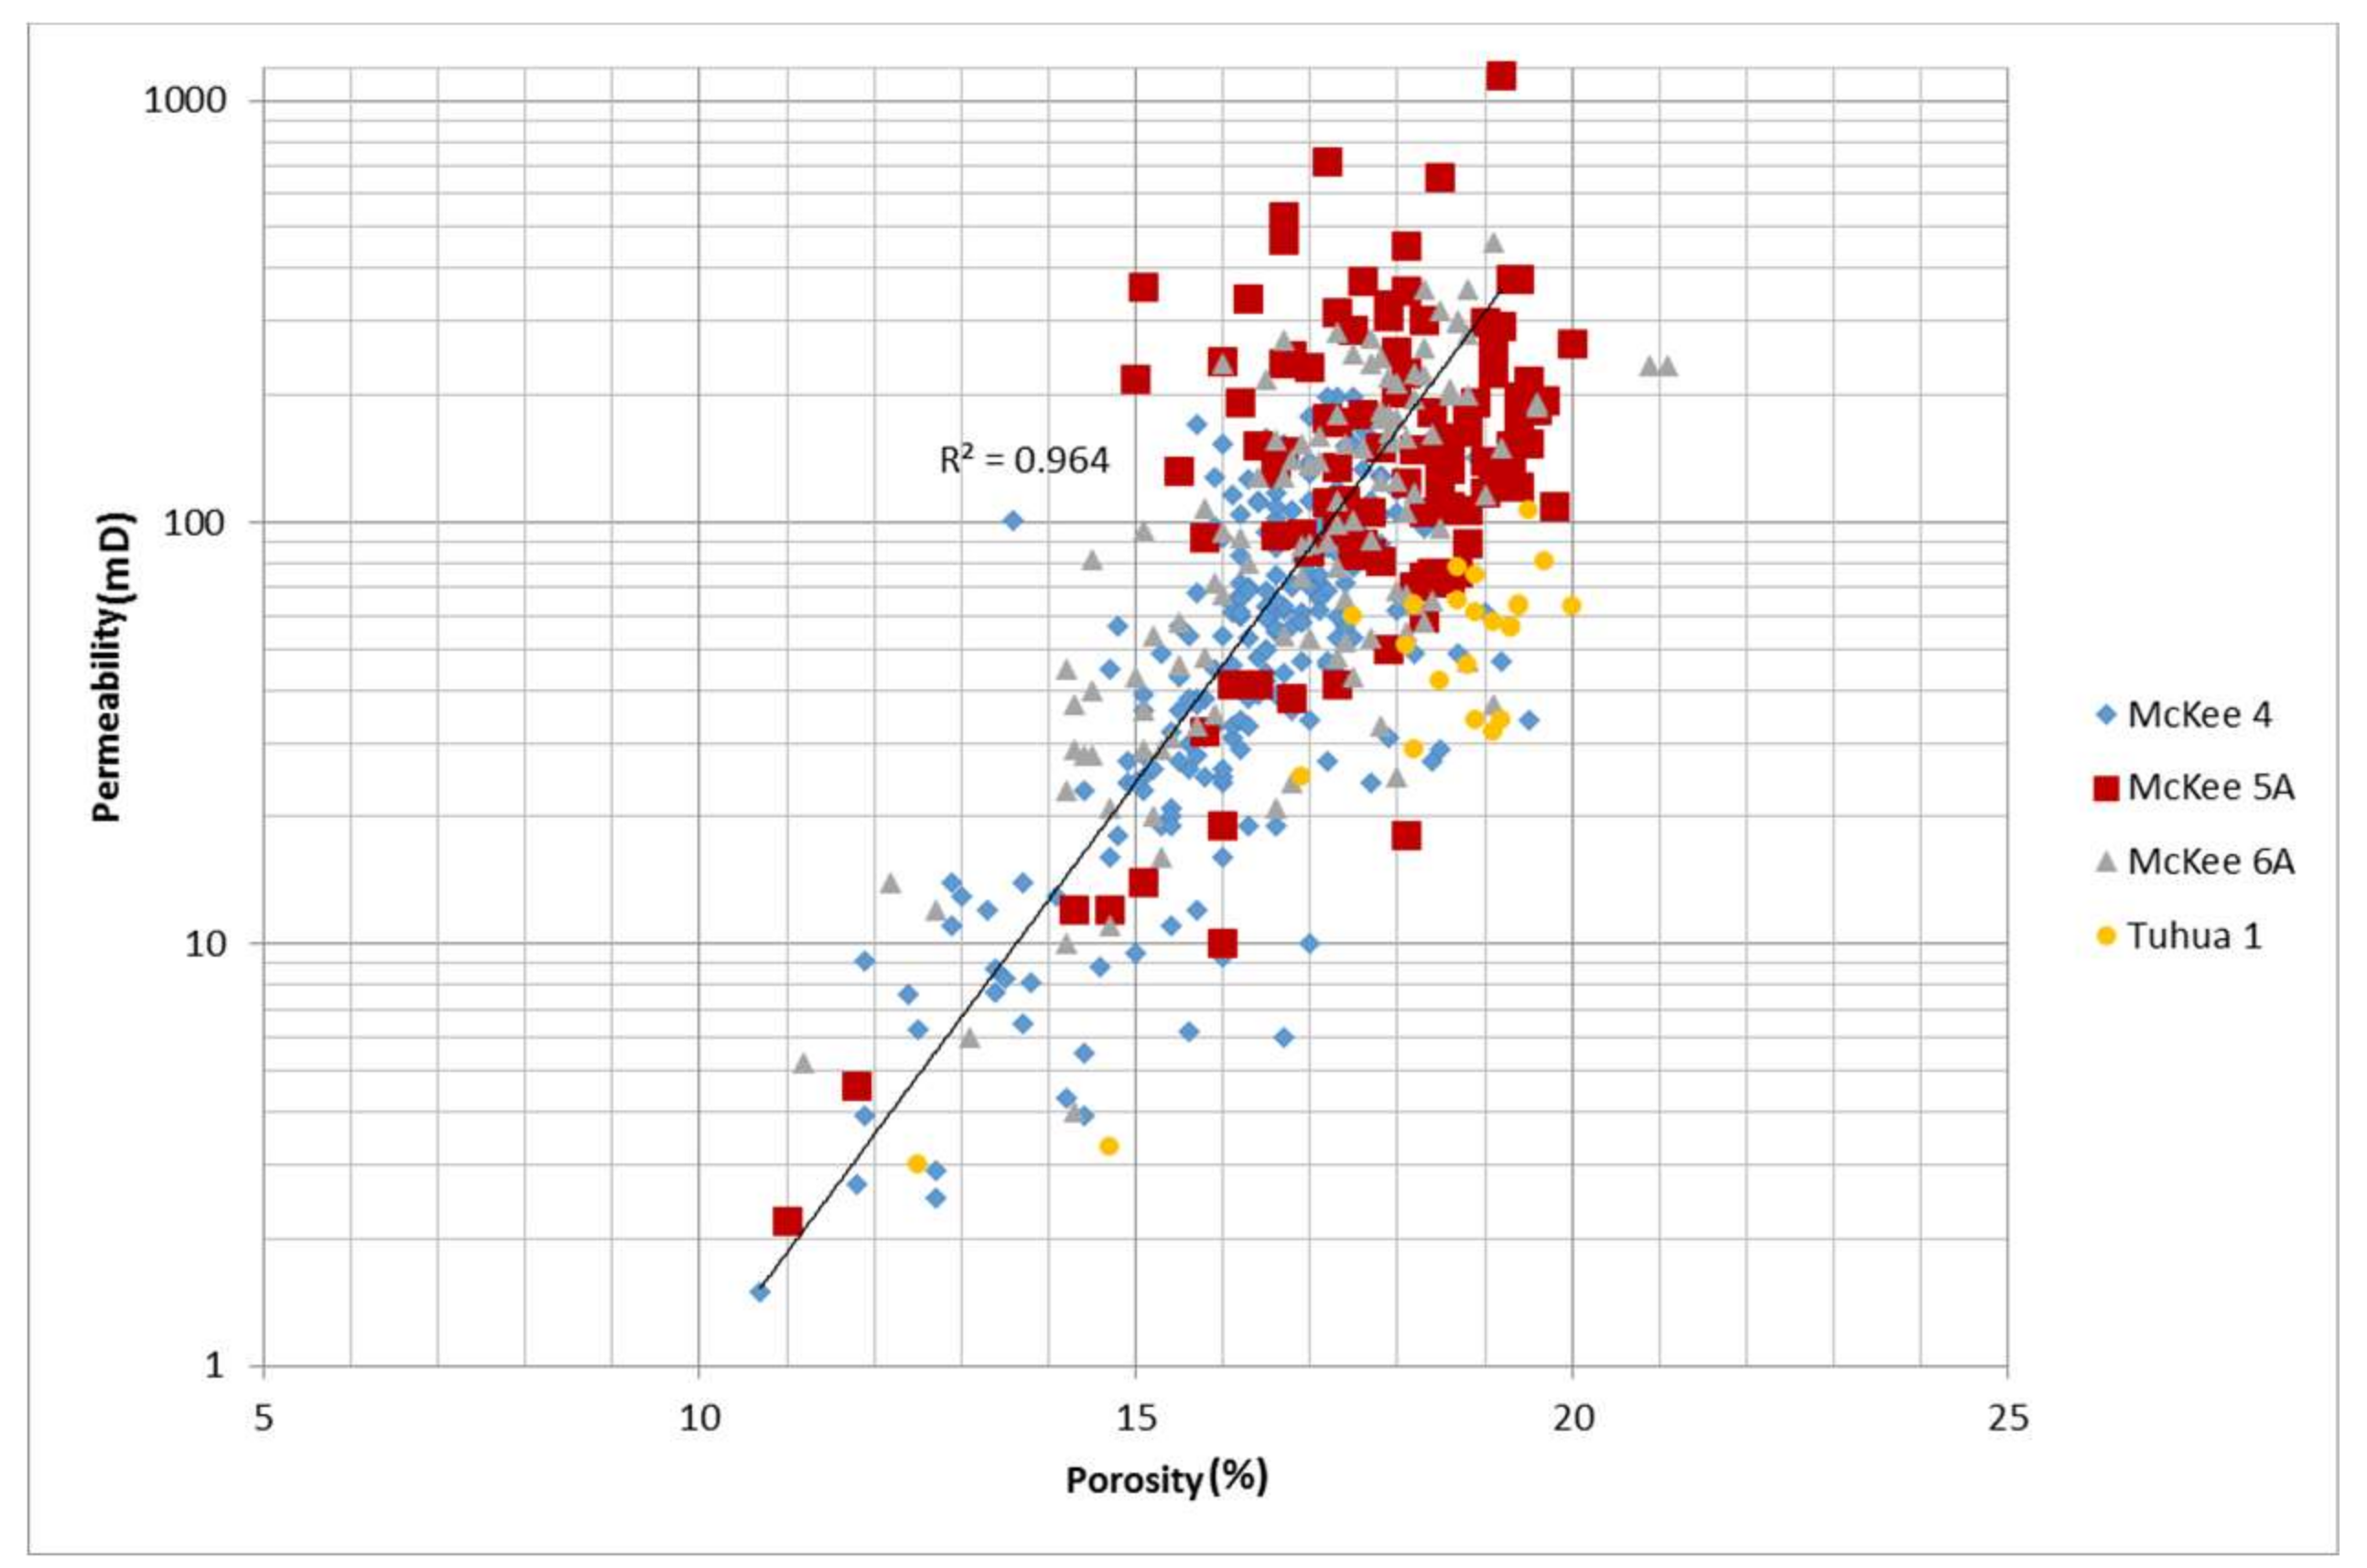
Petrophysical parameters (porosity and permeability) were used to describe the relationship between the two properties. The measured core porosity can be seen in Figure 8 where it ranged from 10.7% to 21.1% (averaging about 15.9%).
In terms of permeability, the studied sandstone of the McKee Formation is characterized by a wide range of permeability ranging from 1.5 to 1140 mD (Figure 8). The permeability of the sandstone is generally dependent on the interconnectivity of porosity (effective), which is largely influenced by grain size and shape, the degree of sorting, grain packing, and the diagenetic processes [37,38,39]. The permeability values were then plotted against porosity to show the correlation between these two variables. The porosity and permeability showed a good positive correlation (R2 = 0.964, Figure 8). The positive correlation of porosity against permeability normally indicates that with increasing porosity, permeability is also likely to increase. Given that there is a reduction of porosity, permeability will also decrease with depth due to compaction and cementation [26,36]. In this analysis, the core porosity was then compared with log porosity, indicating good correlation (Figure 9, Figure 10 and Figure 11).
4.3. Well Log Analysis
The results of the well log analysis were evaluated using two approaches: qualitative interpretation by quick-look analysis, and quantitative interpretation where the values were cut off and averaged to obtain a net pay to determine the potential of the reservoir sand zone.
4.3.1. Shale Distribution and Water Saturation Equation
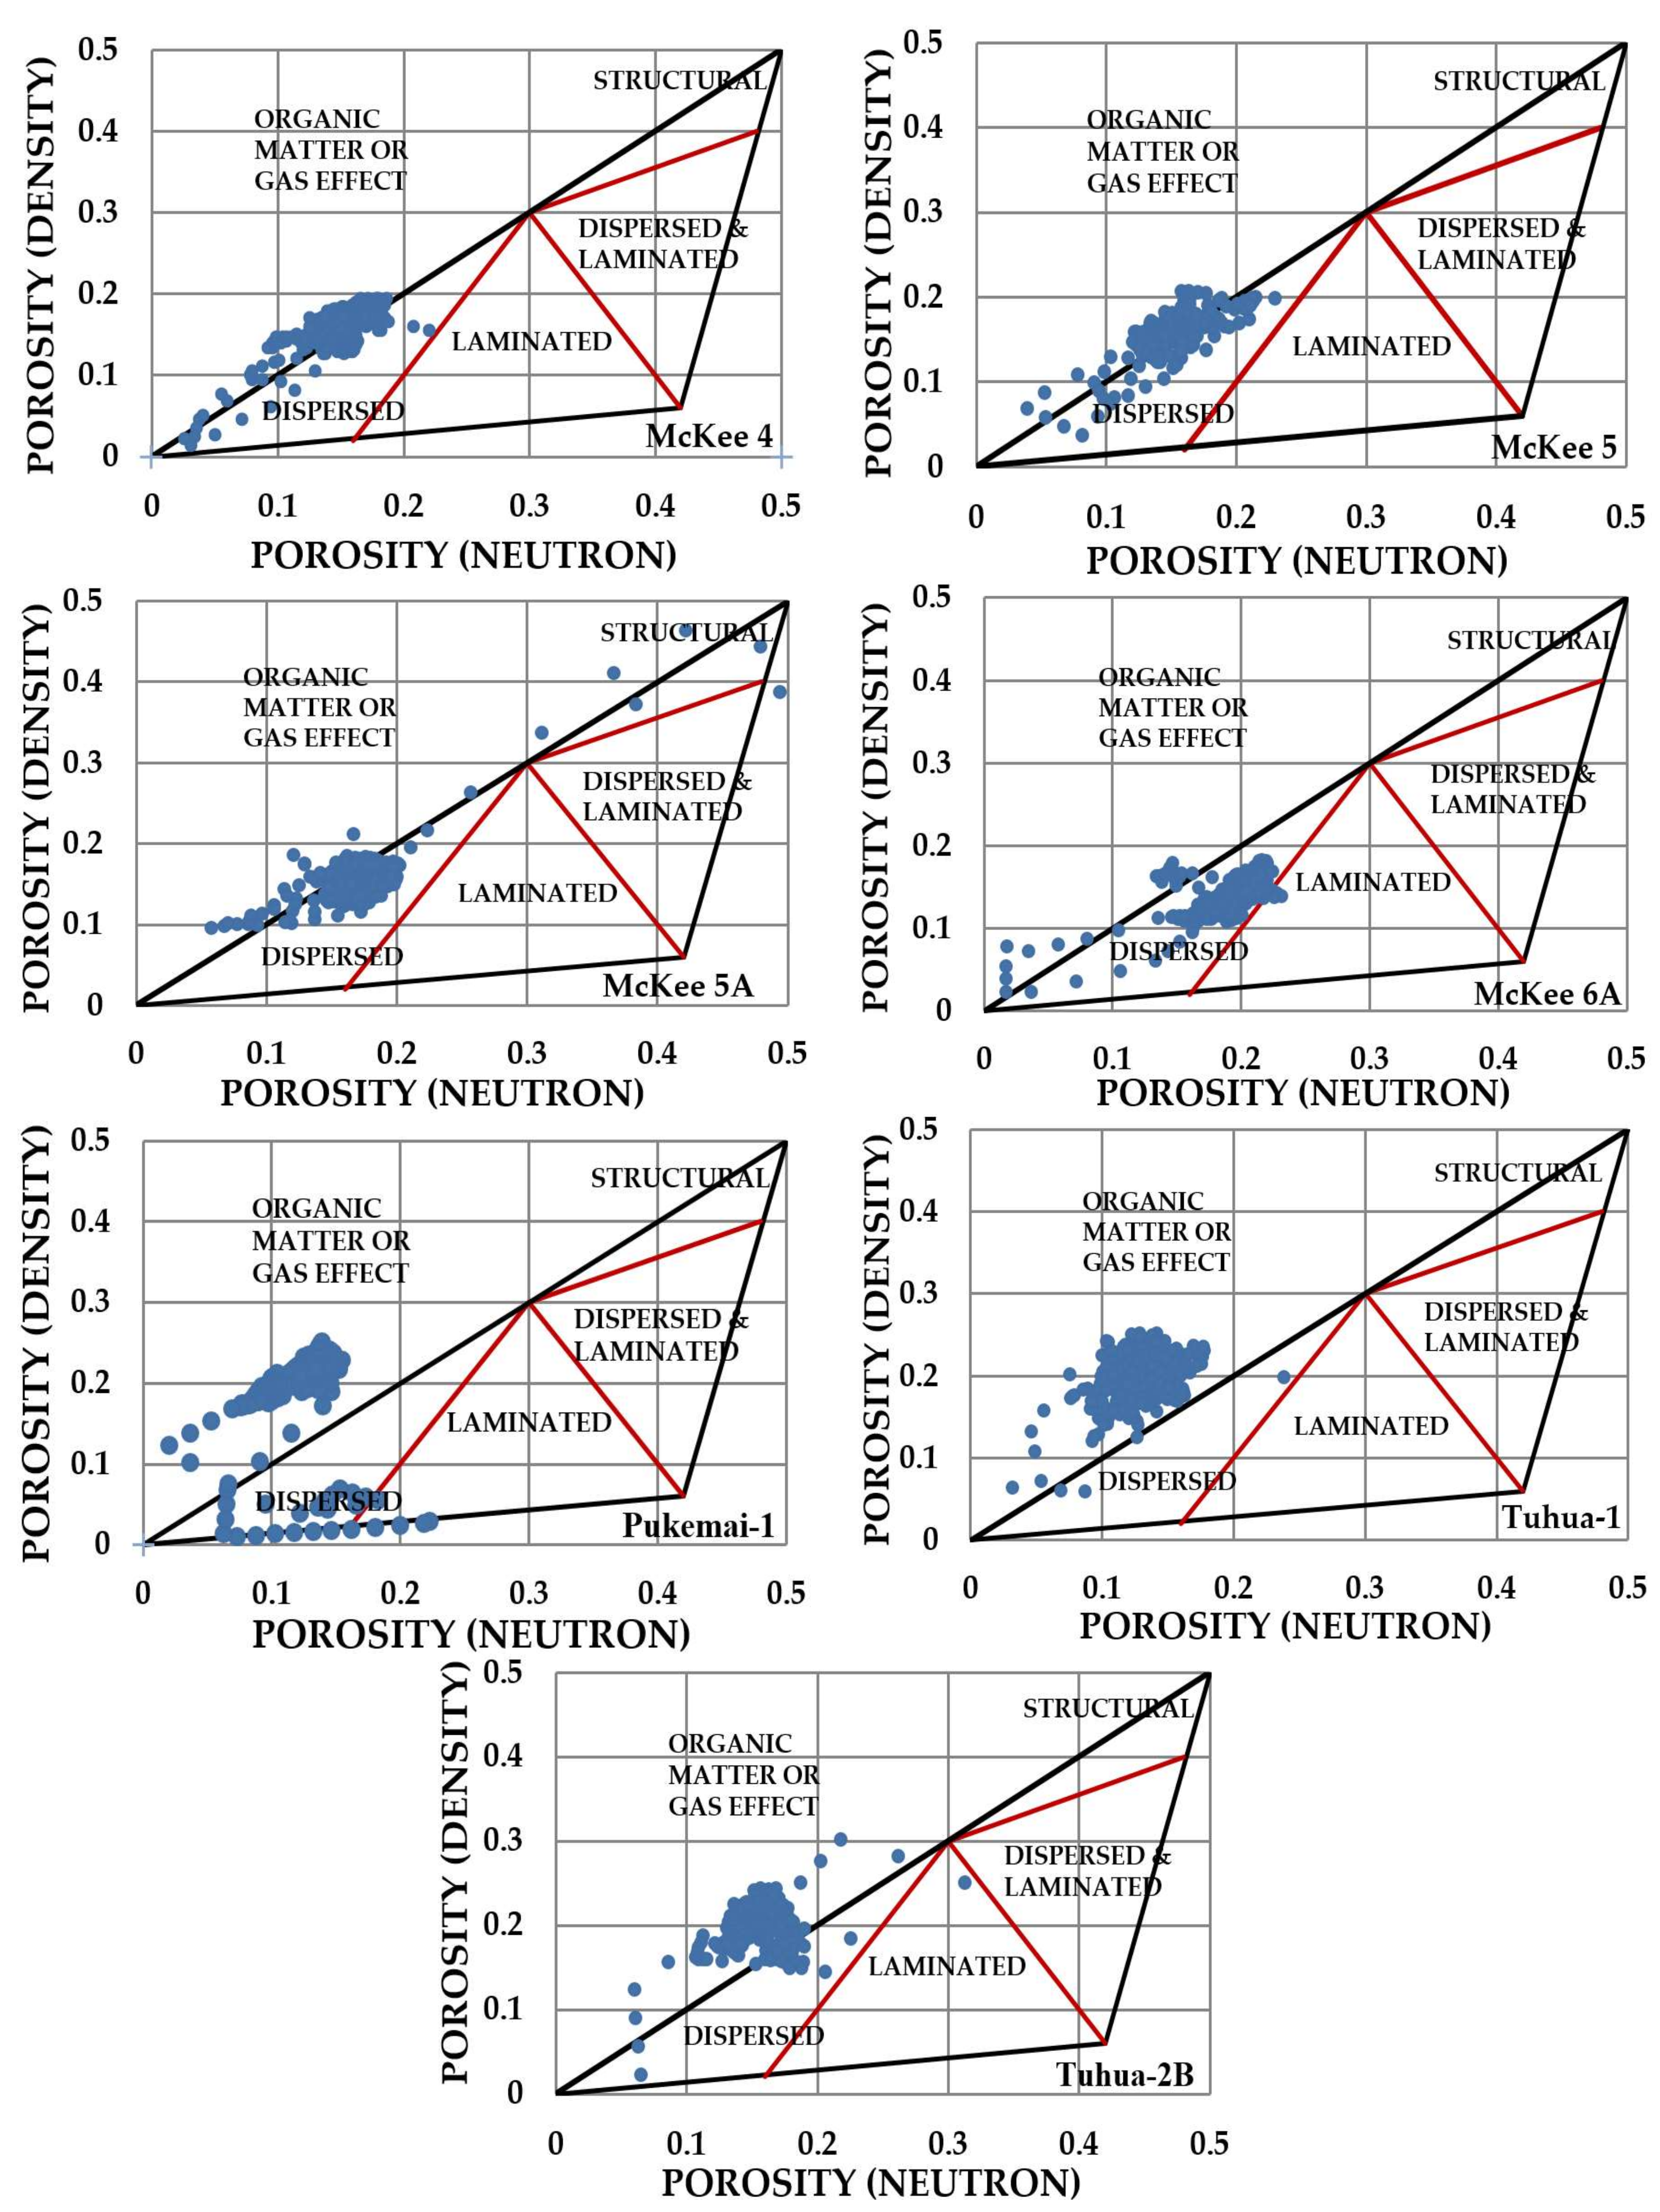
The determination of the shale distribution type was conducted by computing neutron porosity against the density porosity cross-plot for every well from the reservoir interval. From the dia-porosity cross-plot (Figure 12), it was revealed that all data points from the selected wells were concentrated in the dispersed shale habitat with slight signs of organic materials or gas effects. Thus, the water saturation equation used for all the studied wells was the dual water equation.
4.3.2. Qualitative Interpretation
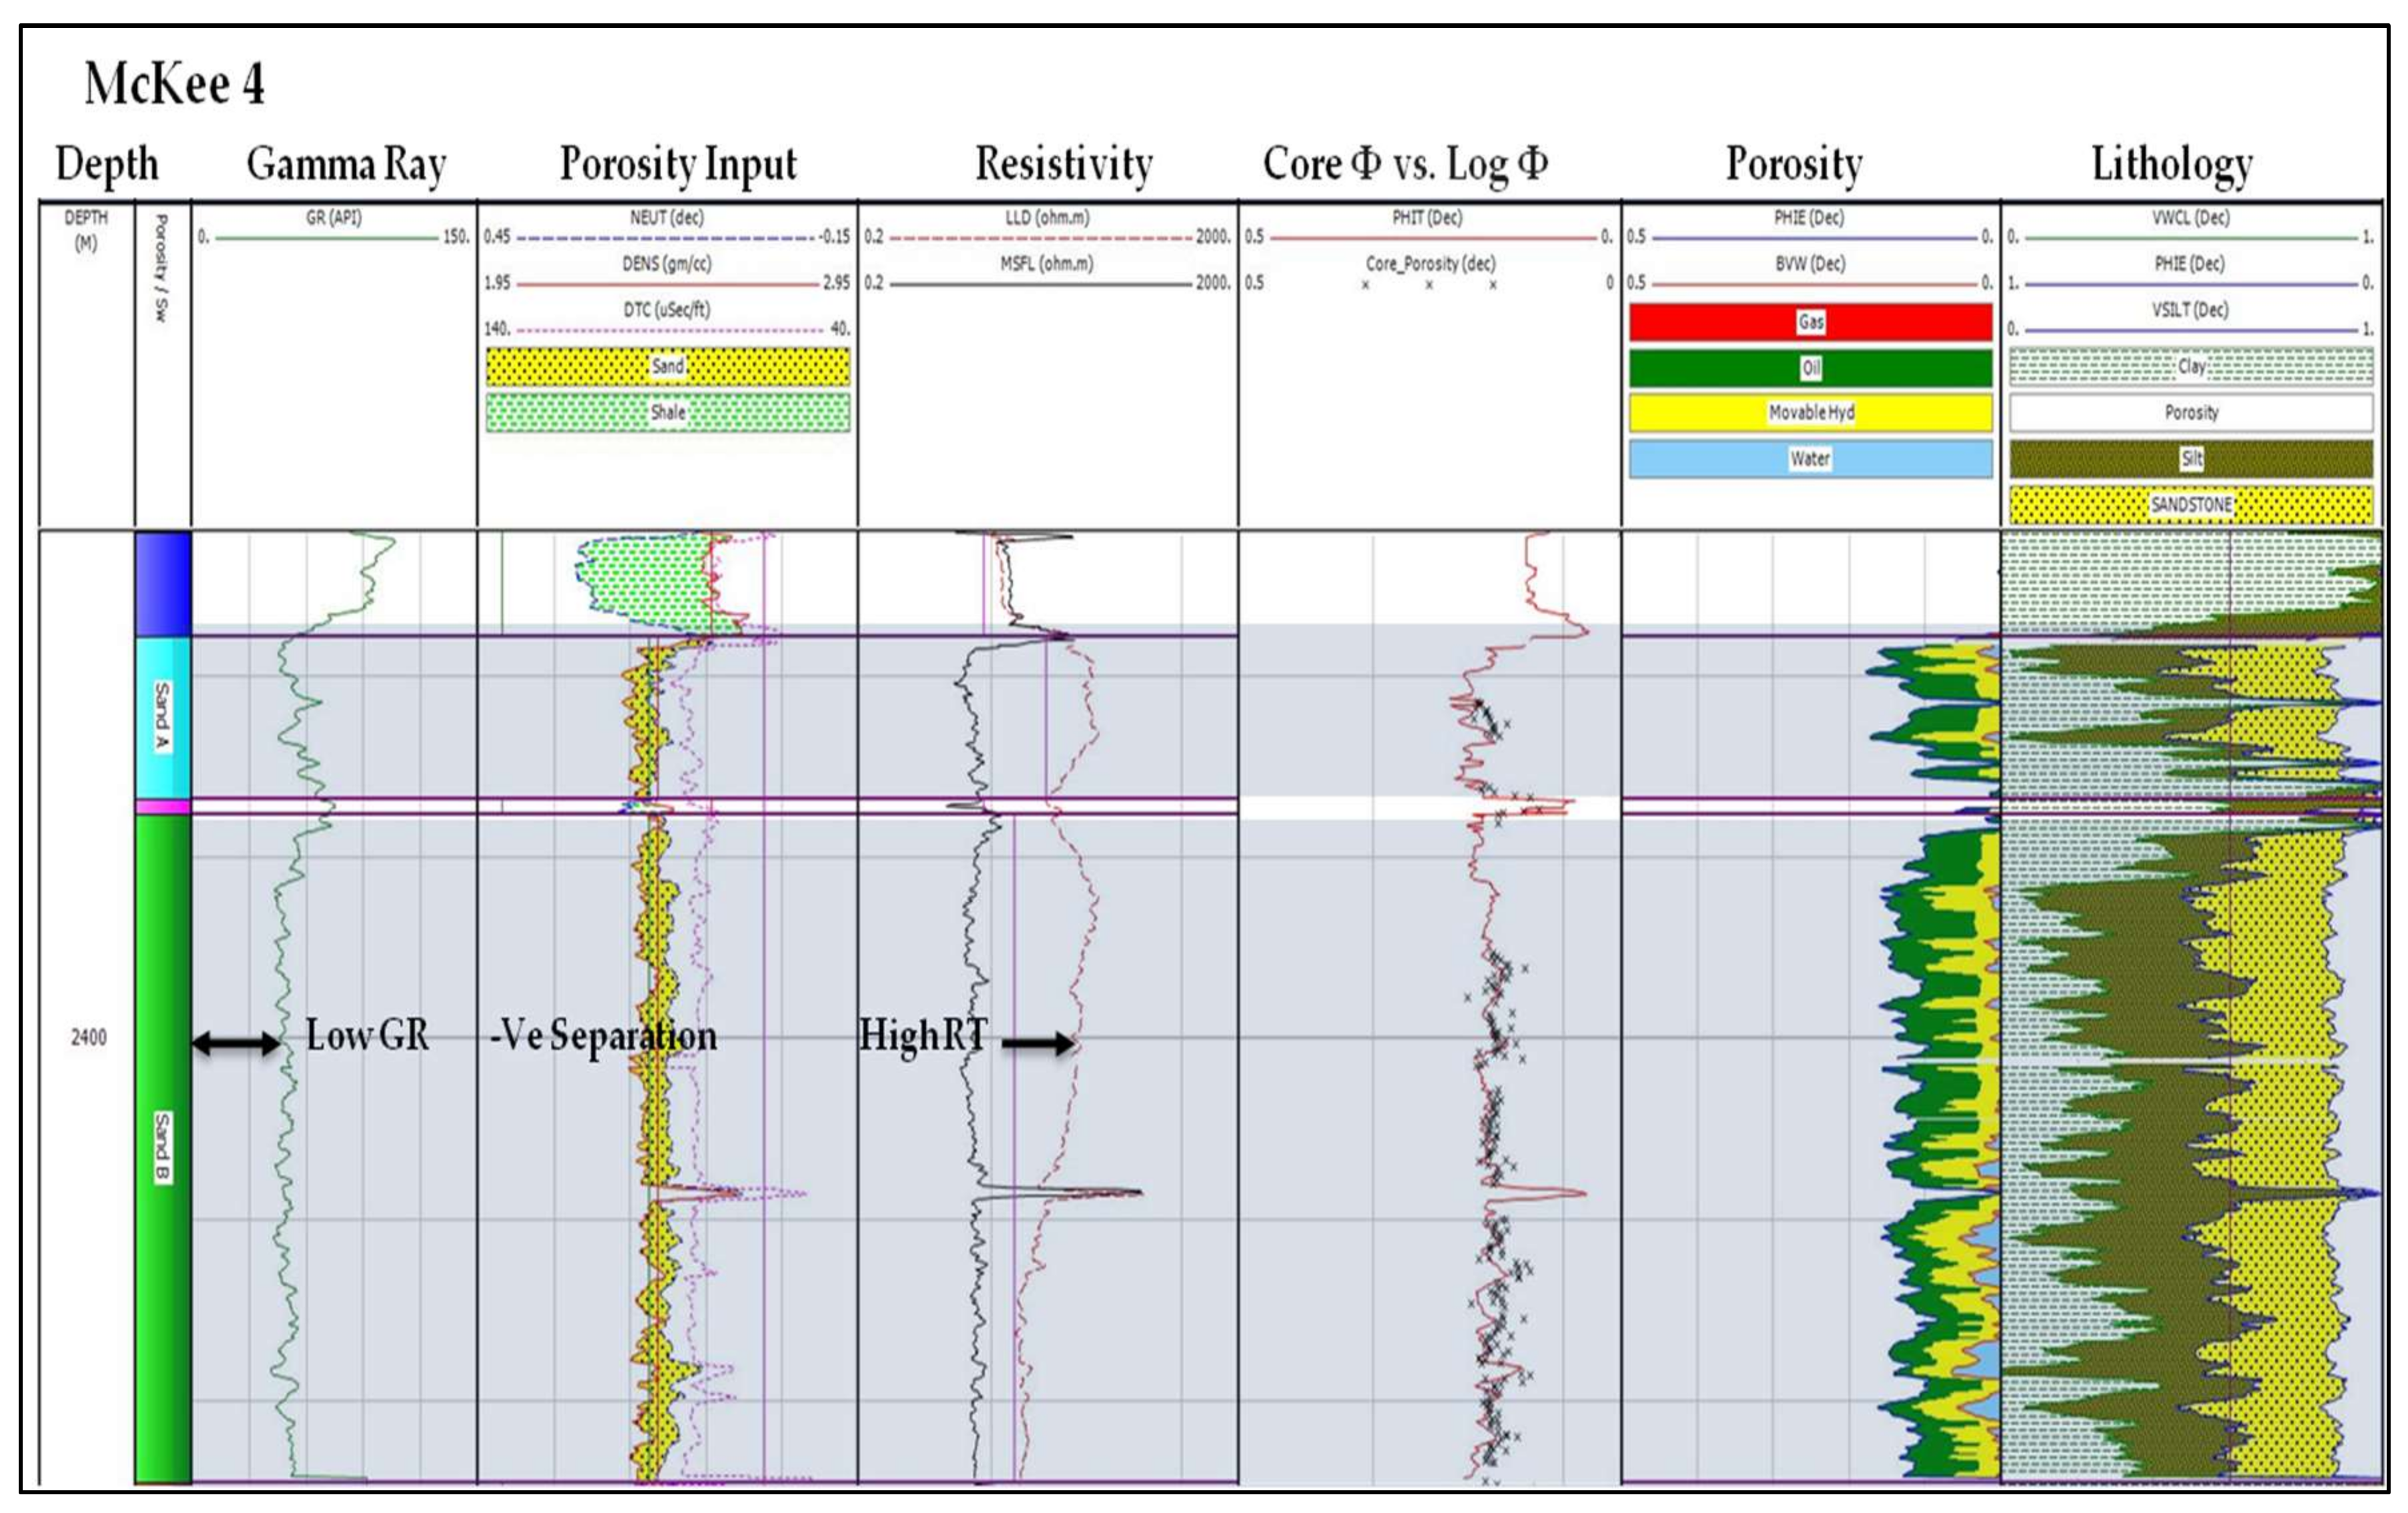
A total of 18 producible sand zones were identified from seven wells; however, the three representative wells with the best results were chosen (Figure 9, Figure 10 and Figure 11). With quick-look interpretation, the studied wells displayed promising results, with the zones of interest having low readings in the gamma ray and a negative separation in the density neutron overlay that normally reflects the clean zone (sandstone layer) of the reservoir. On the resistivity track, separation between the shallow and deep resistivity readings due to invasion effects was also an indication of permeability [37,40]. Higher readings for deep resistivity (RT) usually indicate the presence of hydrocarbon. In addition, the result of the interpreted fluid track of all wells showed good effective porosity with high hydrocarbon and low water saturation (Figure 9, Figure 10 and Figure 11).
4.3.3. Quantitative Interpretation
Validation of the favorable results from the qualitative approach can be done through a quantitative interpretation where the values are calculated and averaged after a cut-off is applied. The results of this cut-off (Table 2) showed important petrophysical and reservoir parameters, such as the gross thickness of the reservoir, net reservoir, net pay, average porosity, average volume of clay, average water saturation, and the average hydrocarbon saturation.
The quantitative approach was applied, and the wells were evaluated based on Table 2. Gross thickness of the McKee Formation from the selected wells ranged from 29.72 to 119.21 m. Average net reservoirs of the wells ranged from 18.52 to 101.54 m, where they represented the potential thickness of producing hydrocarbon. Meanwhile, the average net pay of these wells ranged from 8.62 to 73.2 m, which showed the thickness capable of producing hydrocarbons at a commercial rate. The average effective porosity of the studied wells showed values ranging from 11.8% to 15.9%, where this range of values normally represents fairly good to good porosity quality. From Table 2, the clay content interbedded within the reservoir zone showed positive results, with values found to be low. These can be seen in the lithology tracks (Figure 9, Figure 10 and Figure 11), where sandstone and siltstone comprised a large proportion of the reservoir interval. The lowest average shale content among the wells was found to be 14.9% in McKee 6A, while the highest only reached 34.5% in McKee 5 (Table 2). The average water saturations of the wells were also found to have low values, and this is generally regarded as favorable, as the rest of the reservoir content is predicted to be filled with hydrocarbons. The average water saturation of the reservoir interval ranged from 10.1% to 34.5%. As a result, the average hydrocarbon saturation of the studied wells was expected to be high, with the values (Table 2) ranging from 61.8% to 89.9%. The studied wells showed good reservoir characteristics overall, with good porosity value, high net pay, and—most importantly—high hydrocarbon saturation, which emphasizes the McKee Formation as a promising reservoir. Consequently, the positive correlation between the qualitative and quantitative interpretation verified the hydrocarbon potential of McKee Formation.
5. Conclusions
The reservoir characterization of the McKee Formation was undertaken to prove the formation as producing reservoir rocks in the onshore Taranaki Basin. Based on sedimentological and petrographical studies, the reservoir quality of the McKee sandstone was found to be the result of both depositional and diagenetic processes. Through depositional control, the correlation between the petrophysical parameters and the mean grain size showed positive results. This showed that the grain size of the McKee Formation had an impact on its reservoir quality. The mineralogical study of the McKee Formation showed that it consisted mainly of quartz, with subordinate feldspar and minimal lithic fragments, resulting in a stable grain framework. With regard to diagenetic control, the processes were found to affect the reservoir quality by either enhancing or reducing its petrophysical parameters. Secondary porosity by dissolution was found to enhance the reservoir quality within the studied samples. Porosity-reducing features such as clay minerals were also observed to locally reduce the reservoir quality. Clay minerals were predominant, especially in McKee 5A, where they could be seen filling the pore spaces. The presence of compaction and cementation were identified as another reducing agent of the reservoir quality. Quartz overgrowth was observed to be more common when it coexisted among samples that showed good diagenetic features. These diagenetic porosity-reducing features were observed to occur locally, and were less prominent than the prevalent primary porosity of the McKee Formation that contributed to its productivity. In addition to the previous study, it was possible to acquire a more detailed reservoir characterization of the McKee Formation through well log analysis. Based on quantitative interpretation, most of the studied wells showed a high net pay zone (except McKee 5), with low average shale volumes ranging from 14.9% and 34.5%, moderate to good average porosity varying from 11.8% to 15.9%, and high average hydrocarbon saturation between 61.8% and 89.9%. Among the studied wells, McKee 6A showed the best reservoir characteristics, with a net pay zone of 73.2 m, an average effective porosity of 15.9%, and an average hydrocarbon saturation of 86.6%. Well log analysis of the McKee Formation resulted in moderate to good qualities, based on these derived petrophysical and reservoir properties. Integrated reservoir characterization from these studies showed the hydrocarbon potential of the McKee Formation and its ability as a producing reservoir.
Acknowledgments
The authors would like to express their appreciation and gratitude to the Ministry of Economic Development New Zealand, the Petroleum Corporation of NZ Exploration, and GNS Science for providing the data for this research. Thanks and appreciation also go to the Universiti Brunei Darussalam for providing the resources and facilities that made the completion of this research possible.
Author Contributions
The completion of this research is made possible with the assistance from both Mohamed R. Shalaby and Md. Aminul Islam. The first author, Swee Poh Dong and the co-author Mohamed R. Shalaby conceived and designed the experiments for well log analysis. GNS Science performed the experiments and analysis on the thin sections. The first author, Swee Poh Dong analyzed the results of the thin section photomicrographs and the descriptions provided by GNS Science and designed the writings in sedimentological and petrograhical analysis. The co-authors, Md. Aminul Islam and Mohamed R. Shalaby contributed in providing the accessibility of the materials and the necessary tools for the first author to complete this research. Swee Poh Dong wrote this paper.
Conflicts of Interest
The authors declare no conflict of interest. The founding sponsors had no role in the design of the study; in the collection, analyses, or interpretation of data; in the writing of the manuscript, and in the decision to publish the results.
References
- King, P.; Thrasher, G. Description and Depositional History of Cretaceous and Cenozoic Sedimentary Rocks. In Cretaceous-Cenozoic Geology and Petroleum Systems of the Taranaki Basin, New Zealand; Sherwood, A., Ed.; Institute of Geological & Nuclear Sciences Limited: Lower Hutt, New Zealand, 1996; ISBN 0-478-09512-0. [Google Scholar]
- Palmer, J. Pre-Miocene lithostragraphy of Taranaki Basin, New Zealand. N. Z. J. Geol. Geophys. 1985, 28, 197–216. [Google Scholar] [CrossRef]
- Molenaar, N.; Felder, M.; Bär, K.; Götz, A.E. What classic greywacke (litharenite) can reveal about feldspar diagenesis: An example from Permian Rotliegend sandstones in Hessen, Germany. Sediment. Geol. 2015, 326, 79–93. [Google Scholar] [CrossRef]
- Aretz, A.; Bär, K.; Götz, A.E.; Sass, I. Outcrop analogue study of Permocarboniferous geothermal sandstone reservoir formations (northern Upper Rhine Graben): Impact of mineral content, depositional environment and diagenesis on petrophysical properties. Int. J. Earth Sci. 2015, 105, 1431–1452. [Google Scholar] [CrossRef]
- Shalaby, M.R.; Hakimi, M.H.; Abdullah, W.H. Diagenesis in the Middle Jurrasic Khatatba Formation sandstones in the Shoushan Basin, northern Western Desert, Egypt. Geol. J. 2014, 49, 239–255. [Google Scholar] [CrossRef]
- Bjørlykke, K.; Ramm, M.; Saigal, G.C. Sandstone diagenesis and porosity modification during basin evolution. Geol. Rundsch. 1989, 78, 243–268. [Google Scholar] [CrossRef]
- Webster, M.; O’Connor, S.; Pindar, B.; Swarbrick, R. Overpressures in the Taranaki Basin: Distribution, causes, and implications for exploration. AAPG Bull. 2011, 95, 339–370. [Google Scholar] [CrossRef]
- Pilaar, W.; Wakefield, L. Hydrocarbon Generation in the Taranaki Basin, New Zealand. In Petroleum Geochemistry and Basin Evaluation; Demaison, G., Murris, R.J., Eds.; AAPG Memoir: Tulsa, OK, USA, 1984; Volume 35, pp. 405–423. ISBN Electronic 9781629811574. [Google Scholar]
- Uruski, C.; Baillie, P. Petroleum Potential of New Zealand’s Deepwater Basins. In Proceedings of the PESA Eastern Australasian Basins Symposium, Melbourne, Australia, 25–28 November 2001; pp. 151–158. [Google Scholar]
- King, P.R.; Funnell, R.H. Petroleum systems of the Taranaki Basin, New Zealand: A Review. In Proceedings of the Petroleum Systems of SE Asia and Australasia Conference, Jakarta, Indonesia, 23–27 May 1997; pp. 155–170. [Google Scholar]
- Higgs, K.E.; King, P.R.; Raine, J.I.; Sykes, R.; Browne, G.H.; Crouch, E.M.; Baur, J.R. Sequence stratigraphy and controls on reservoir sandstone distribution in an Eocene marginal marine-coastal plain fairway, Taranaki Basin, New Zealand. Mar. Pet. Geol. 2012, 32, 110–137. [Google Scholar] [CrossRef]
- Bulte, G. Styles of Compressional Wrench Faulting Taranaki Basin, New Zealand. Proc. South East Asia Pet. Explor. Soc. 1988, 8, 80–91. [Google Scholar]
- Reilly, C.; Nicol, A.; Walsh, J.J.; Seebeck, H. Evolution of faulting and plate boundary deformation in the Southern Taranaki Basin, New Zealand. Tectonophysics 2015, 651, 1–18. [Google Scholar] [CrossRef]
- Haque, A.E.; Islam, M.A.; Shalaby, M.R. Structural Modeling of the Maui Gas Field, Taranaki Basin, New Zealand. Pet. Explor. Dev. 2016, 43, 965–975. [Google Scholar] [CrossRef]
- Knox, G.J. Taranaki Basin, structural style and tectonic setting. N. Z. J. Geol. Geophys. 1982, 25, 125–140. [Google Scholar] [CrossRef]
- Palmer, J.; Bulte, G. Taranaki Basin, New Zealand. In Active Margins Basins; Biddle, K.T., Ed.; AAPG Special Volumes; AAPG: Tulsa, OK, USA, 1988; Volume 52, pp. 261–282. ISBN 978-1-58861-433-9. [Google Scholar]
- Hills, K.C.; Hoffman, N.; Channon, G.; Courteney, S.; Kendrick, R.; Keetley, J.T. Structural styles and hydrocarbon traps in the onshore Taranaki Fold Belt, New Zealand. Pet. Explor. Soc. Aust. 2004, 2, 181–196. [Google Scholar]
- Smale, D.; Morton, A.C. Heavy mineral suites of core samples from the McKee Formation (Eocene-Lower Oligocene), Taranaki: Implications for provenance and diagenesis. N. Z. J. Geol. Geophys. 1987, 30, 299–306. [Google Scholar] [CrossRef]
- New Zealand Petroleum and Minerals. New Zealand Petroleum Basins; Ministry of Business, Innovation and Employment: Wellington, New Zealand, 2014. [Google Scholar]
- Mahmoud, M.; Ghorab, M.; Shazly, T.; Shibl, A.; Abuhagaza, A.A. Reservoir characterization utilizing the well logging analysis of Abu Madi Formation, Nile Delta, Egypt. Egypt. J. Pet. 2016, 26, 649–659. [Google Scholar] [CrossRef]
- Hussain, M.; Ahmed, N.; Chun, W.Y.; Khalid, P.; Mahmood, A.; Ahmad, S.R.; Rasool, U. Reservoir characterization of basal sand zone of lower Goru Formation by petrophysical studies of geophysical logs. J. Geol. Soc. India 2017, 89, 331–338. [Google Scholar] [CrossRef]
- Al-Areeq, N.M.; Alaug, A.S. Well log analysis and hydrocarbon potential of the Sa’ar–Nayfa reservoir, Hiswah Oilfield, eastern Yemen. Arabian J. Geosci. 2014, 7, 2941–2956. [Google Scholar] [CrossRef]
- Onovughe, E.; Sofolabo, A. Saturation Modelling: Using the Waxman-Smits model/equation in Saturation Determination in Dispersed Shaly sands. J. Multidiscip. Eng. Sci. Technol. 2016, 3, 4985–4992. [Google Scholar]
- Pettijohn, F.J.; Potter, P.E.; Siever, R. Introduction and Source Materials. In Sand and Sandstone, 2nd ed.; Springer: New York, NY, USA, 1987; pp. 1–21. ISBN 978-1-4612-1066-5. [Google Scholar]
- Jumat, N.; Shalaby, M.R.; Islam, M.A. Integrated reservoir characterization of the Paleocene Farewell, Taranaki Basin, New Zealand, using petrophysical and petrographical analyses. J. Pet. Explor. Prod. Technol. 2017, 1–17. [Google Scholar] [CrossRef]
- Nelson, P.H. Permeability-porosity relationships in sedimentary rocks. Log Anal. 1994, 35. Document ID: SPWLA-1994-v35n3a4. [Google Scholar]
- Schmidt, V.; McDonald, D.A. Texture and Recognition of Secondary Porosity in Sandstones. SEPM 1979, 26, 209–225. [Google Scholar]
- Al Areeq, N.M.; Soliman, M.A.; Essa, M.A.; Al-Azazi, N.A. Diagenesis and reservoir quality in the Lower Cretaceous Qishn sandstones from Masila oilfields in the Sayun-Masila Basin, eastern Yemen. Geol. J. 2016, 51, 405–420. [Google Scholar] [CrossRef]
- Loucks, R.G. Revisiting the importance of Secondary Dissolution Pores in Tertiary Sandstones Along the Texas Gulf Coast. Gulf Coast Assoc. Geol. Soc. Trans. 2005, 55, 447–455. [Google Scholar]
- Wilson, M.D.; Pittman, E.D. Authigenic clays in sandstones: Recognition and influence on reservoir properties and paleoenvironmental analysis. J. Sediment. Res. 1977, 47, 3–31. [Google Scholar]
- Worden, R.H.; Morad, S. The effect of oil emplacement on diagenetic clay mineralogy: The Upper Jurassic Magnus Sandstone Member, North Sea. In Clay Minerals in Sandstones: Controls on Formation, Distribution and Evolution; Worden, R.H., Morad, S., Eds.; Blackwell Publishing Ltd.: Hoboken, NJ, USA, 2003; Volume 34, pp. 453–469. ISBN 1-40510-587-9. [Google Scholar]
- Huang, W.L.; Bishop, A.M.; Brown, R.W. The effect of fluid/rock ratio on feldspar dissolution and illite formation under reservoir conditions. Clay Miner. 1986, 21, 585–601. [Google Scholar] [CrossRef]
- Nichols, G. Chapter 18: Post-depositional structures and diagenesis. In Sedimentology and Stratigraphy, 2nd ed.; WILEY-BLACKWELL: West Sussex, UK, 2009; pp. 274–296. ISBN 978-1-4051-3592-4. [Google Scholar]
- Hakimi, M.H.; Shalaby, M.R.; Abdullah, W.H. Diagenetic characteristics and reservoir quality of the Lower Cretaceous Biyadh sandstones at Kharir oilfield in the western central Masila Basin, Yemen. J. Asian Earth Sci. 2012, 51, 109–120. [Google Scholar] [CrossRef]
- Al-Ramadan, K.A.; Hussain, M.; Imam, B.; Saner, S. Lithologic characteristics and diagenesis of the Devonian Jauf sandstone at Ghawar Field, eastern Saudi Arabia. Mar. Pet. Geol. 2004, 2, 1221–1234. [Google Scholar] [CrossRef]
- Porter, E.W.; James, W.C. Influence of pressure, salinity, temperature and grain size on silica diagenesis in quartzose sandstones. Chem. Geol. 1986, 57, 359–369. [Google Scholar] [CrossRef]
- Schlumberger Wireline & Testing. Fundamentals of the Quantitative Log Interpretation. In Schlumberger-Log Interpretation Principles & Applications, 7th ed.; Schlumberger Wireline & Testing: Sugar Land, TX, USA, 1989; pp. 1–8. [Google Scholar]
- AL-Laboun, A.; AL-Quraishi, A.; Zaman, H.; Benaafi, M. Reservoir characterization of the Burqan Formation sandstone from Midyan Basin, northwestern Saudi Arabia. Turk. J. Earth Sci. 2014, 23, 204–214. [Google Scholar] [CrossRef]
- Hu, X.; Huang, S. Physical Properties of Reservoir rocks. In Physics of Petroleum Reservoirs; Hu, X., Hu, S., Jin, F., Huang, S., Eds.; Springer: Berlin/Heidelberg, Germany, 2017; pp. 7–164. ISBN 978-3-662-53284-3. [Google Scholar]
- Shalaby, M.R.; Islam, M.A. Fracture detection using conventional well logging in carbonate Matulla Formation, Geisum oil field, southern Gulf of Suez, Egypt. J. Pet. Explor. Prod. Technol. 2017, 7, 977–989. [Google Scholar] [CrossRef]
Figure 1.
Location of Taranaki Basin with its major structures and studied well locations onshore; Modified after [7], from AAPG© (2011) and reprinted by permission of the AAPG whose permission is required for further use.
Figure 1.
Location of Taranaki Basin with its major structures and studied well locations onshore; Modified after [7], from AAPG© (2011) and reprinted by permission of the AAPG whose permission is required for further use.

Figure 2.
The generalized stratigraphy of the Taranaki Basin; Modified after [17] with permission to reproduce it granted by the Petroleum Exploration Society of Australia.
Figure 2.
The generalized stratigraphy of the Taranaki Basin; Modified after [17] with permission to reproduce it granted by the Petroleum Exploration Society of Australia.

Figure 3.
Well correlation of four selected wells that encounter the McKee Formation in the McKee field. GR: Gamma Ray; RESD: Deep Resistivity; SSTVD: SubSea True Vertical Thickness.
Figure 3.
Well correlation of four selected wells that encounter the McKee Formation in the McKee field. GR: Gamma Ray; RESD: Deep Resistivity; SSTVD: SubSea True Vertical Thickness.
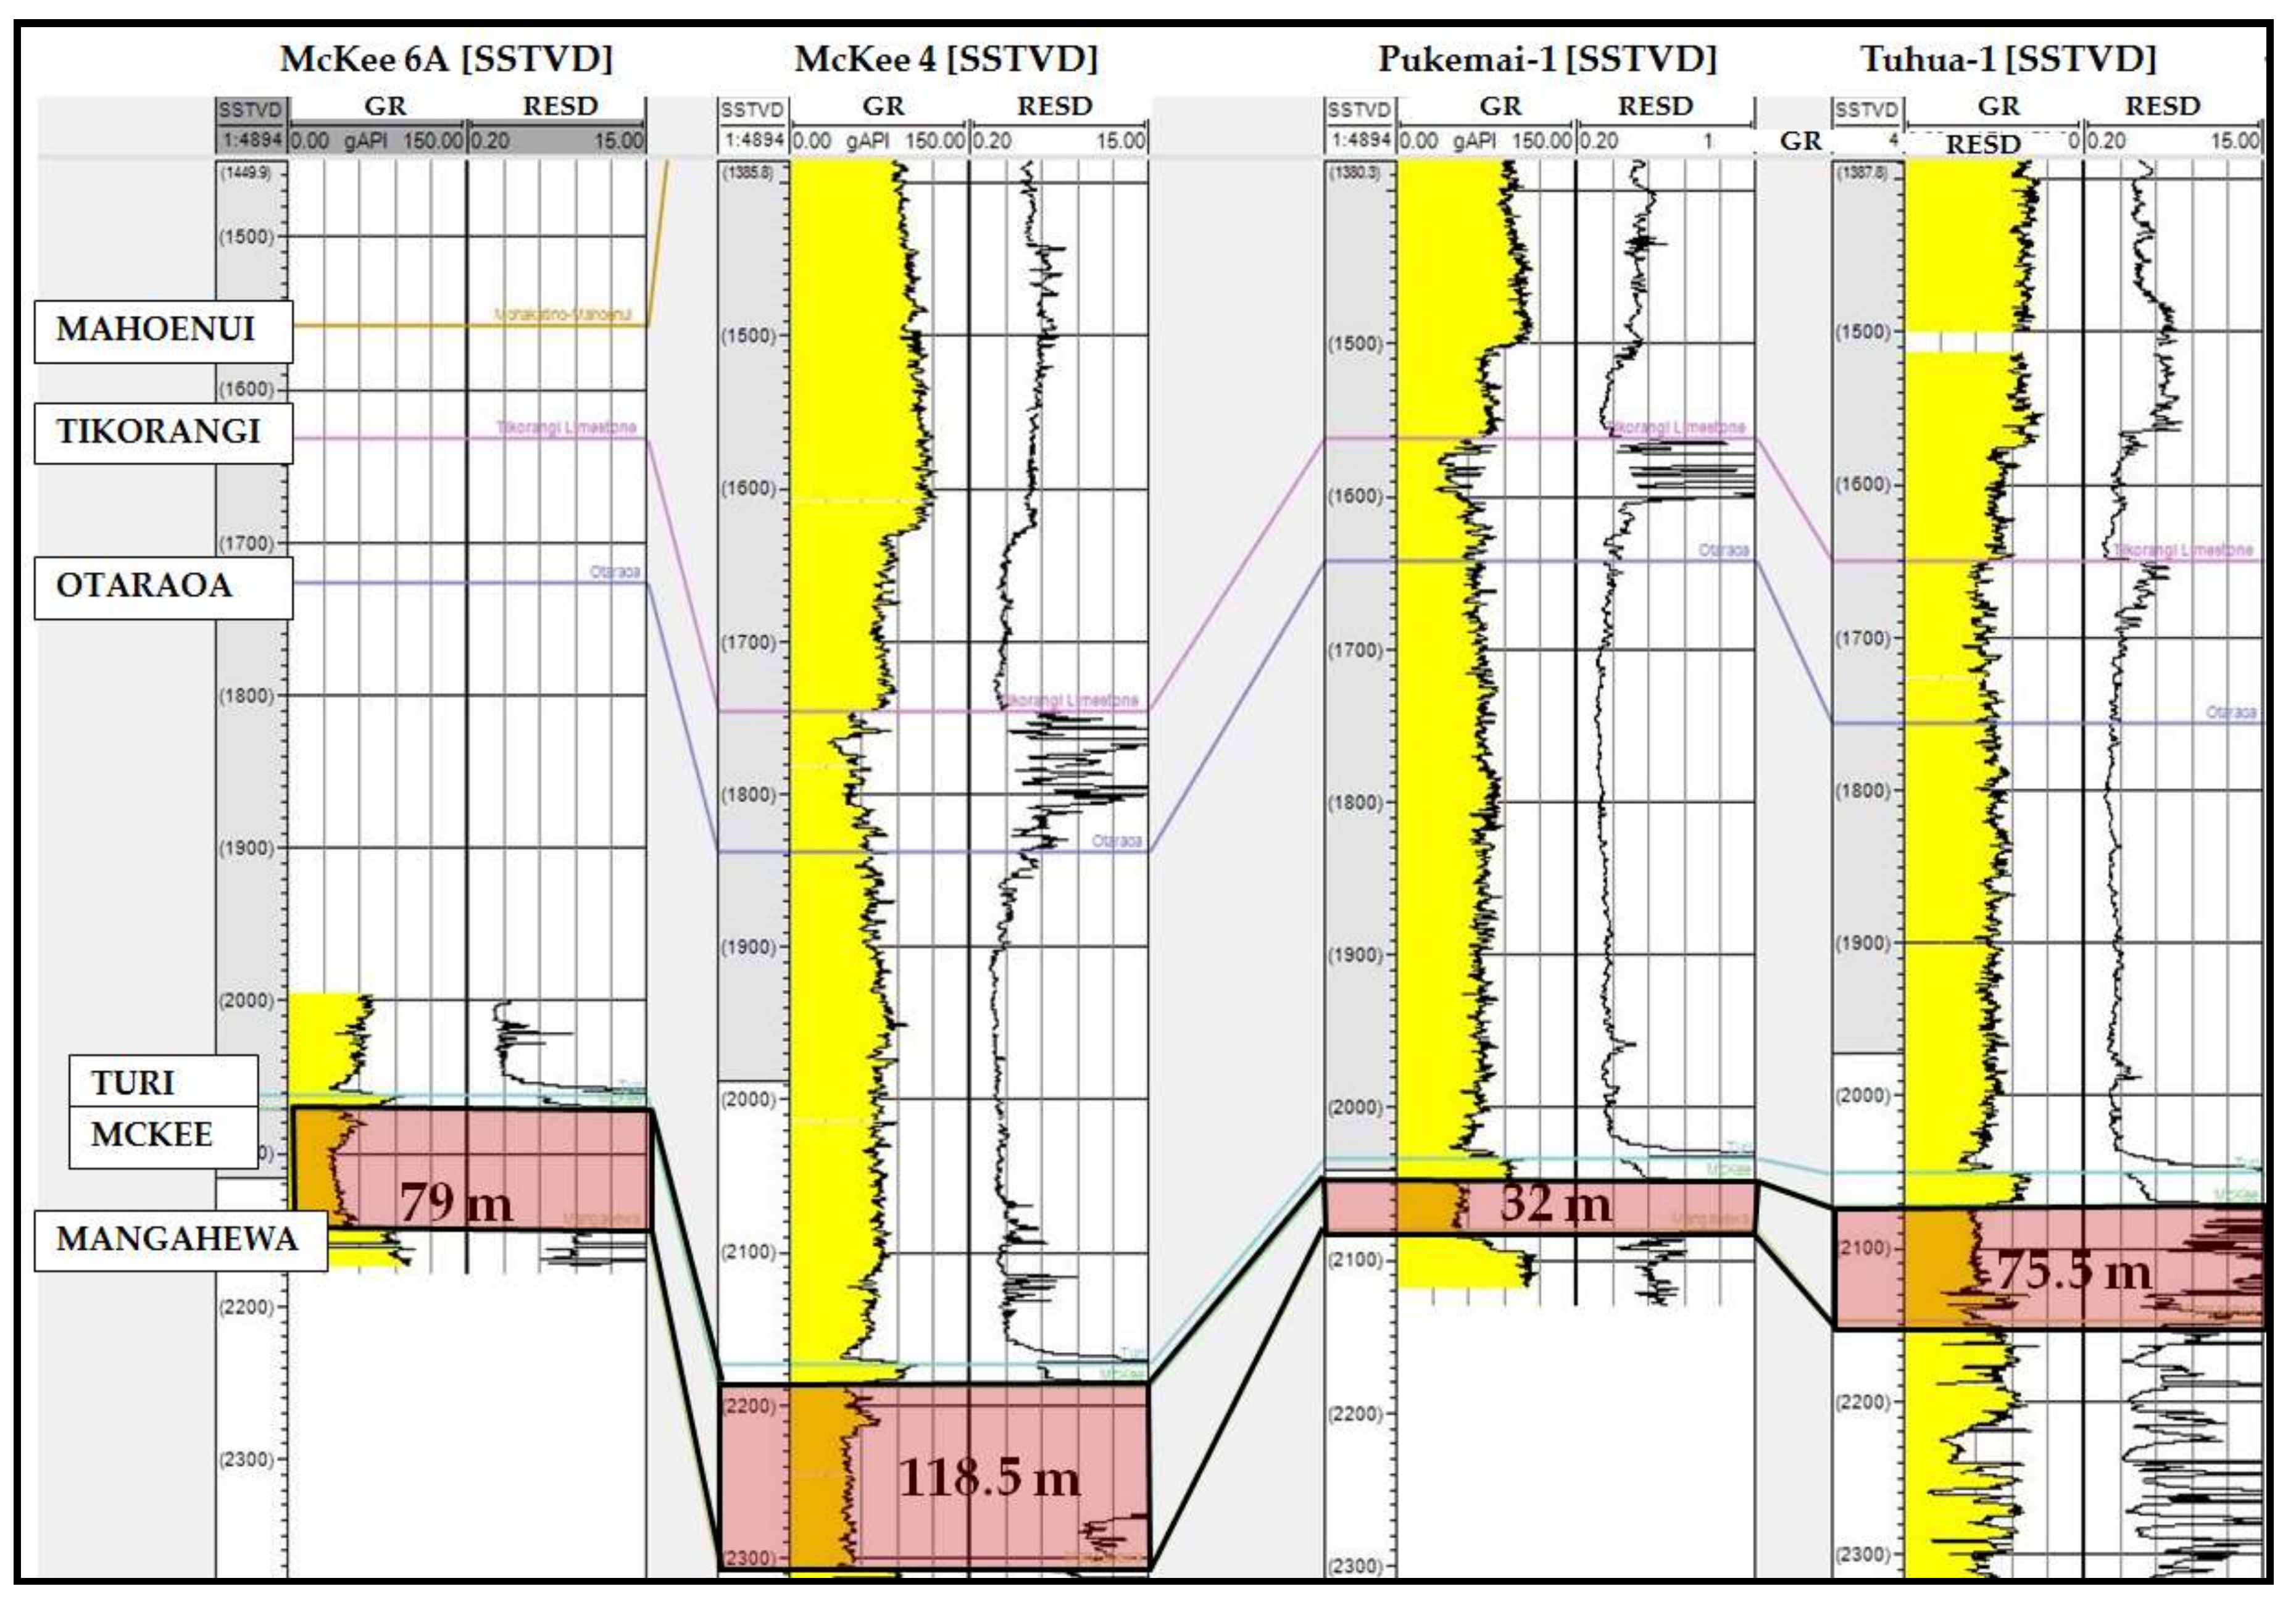
Figure 4.
QFL triangular diagram (Q—Quartz, F—Feldpar and L—Lithic Fragments) displaying the classification of the sandstone reservoir of the McKee Formation in the studied wells; Modified after [24], reprinted by permission from Springer.
Figure 4.
QFL triangular diagram (Q—Quartz, F—Feldpar and L—Lithic Fragments) displaying the classification of the sandstone reservoir of the McKee Formation in the studied wells; Modified after [24], reprinted by permission from Springer.
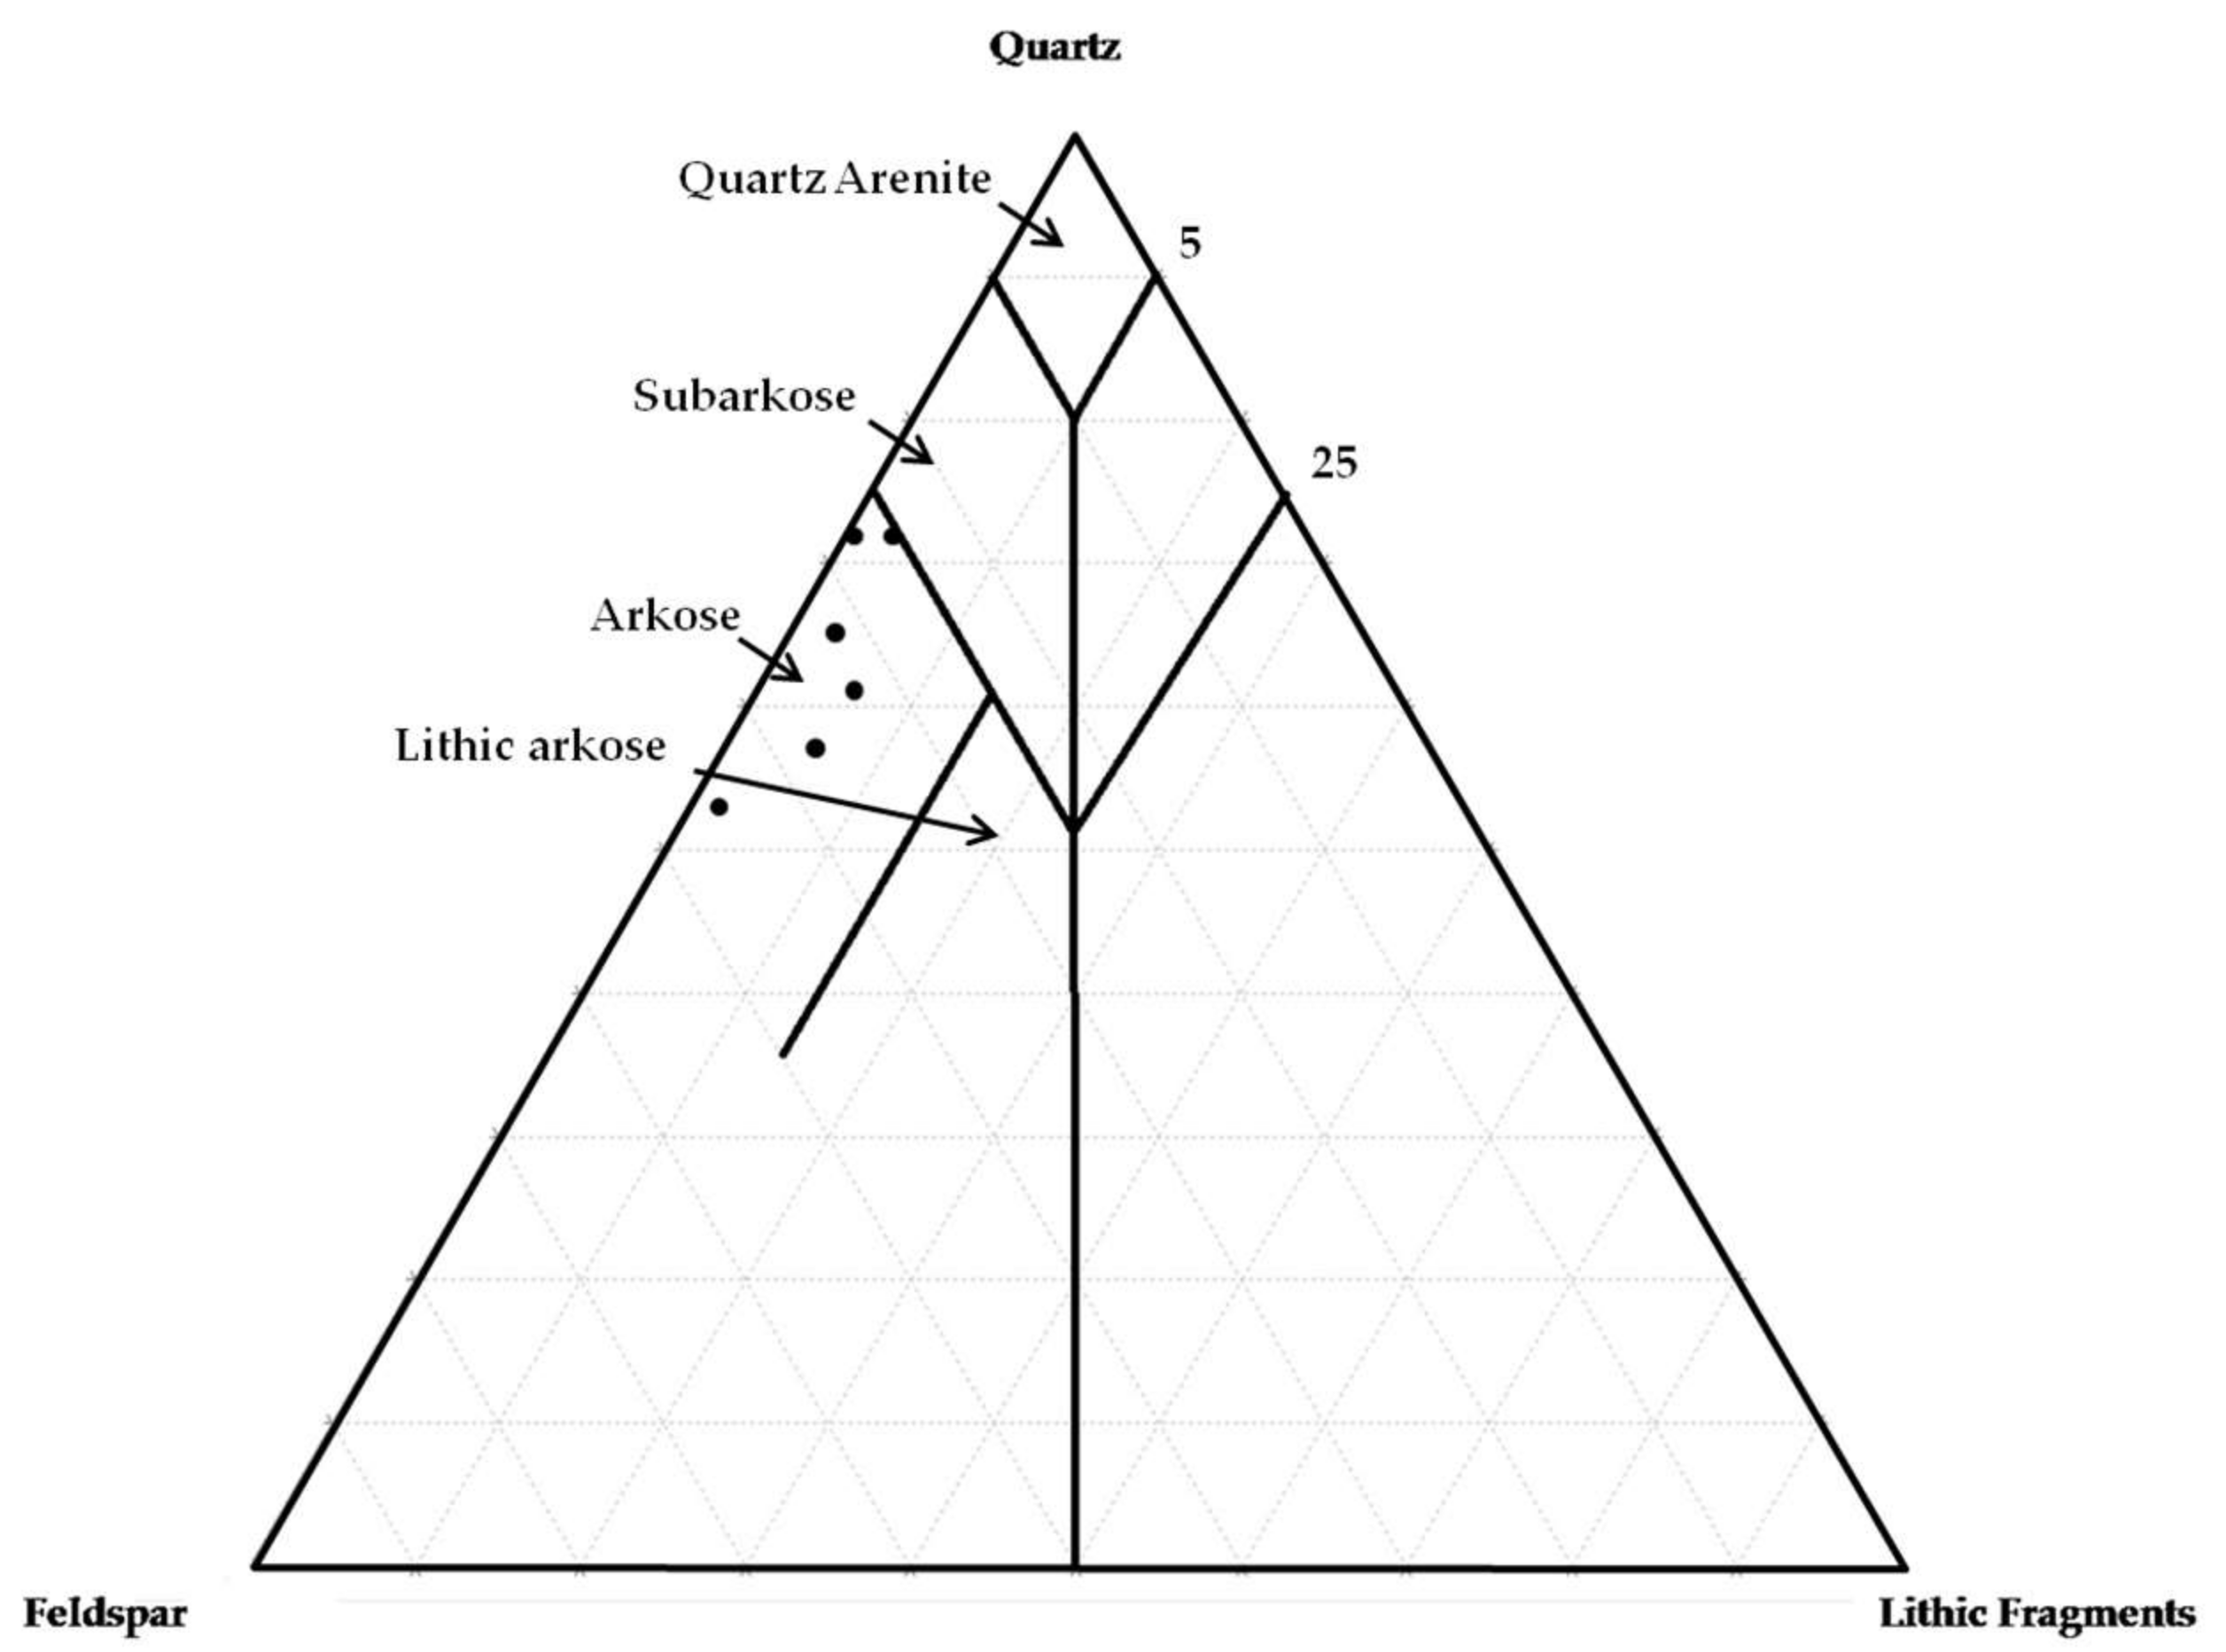
Figure 5.
Relationship between petrophysical parameters (porosity and permeability) and grain size of the samples from the McKee Formation.
Figure 5.
Relationship between petrophysical parameters (porosity and permeability) and grain size of the samples from the McKee Formation.

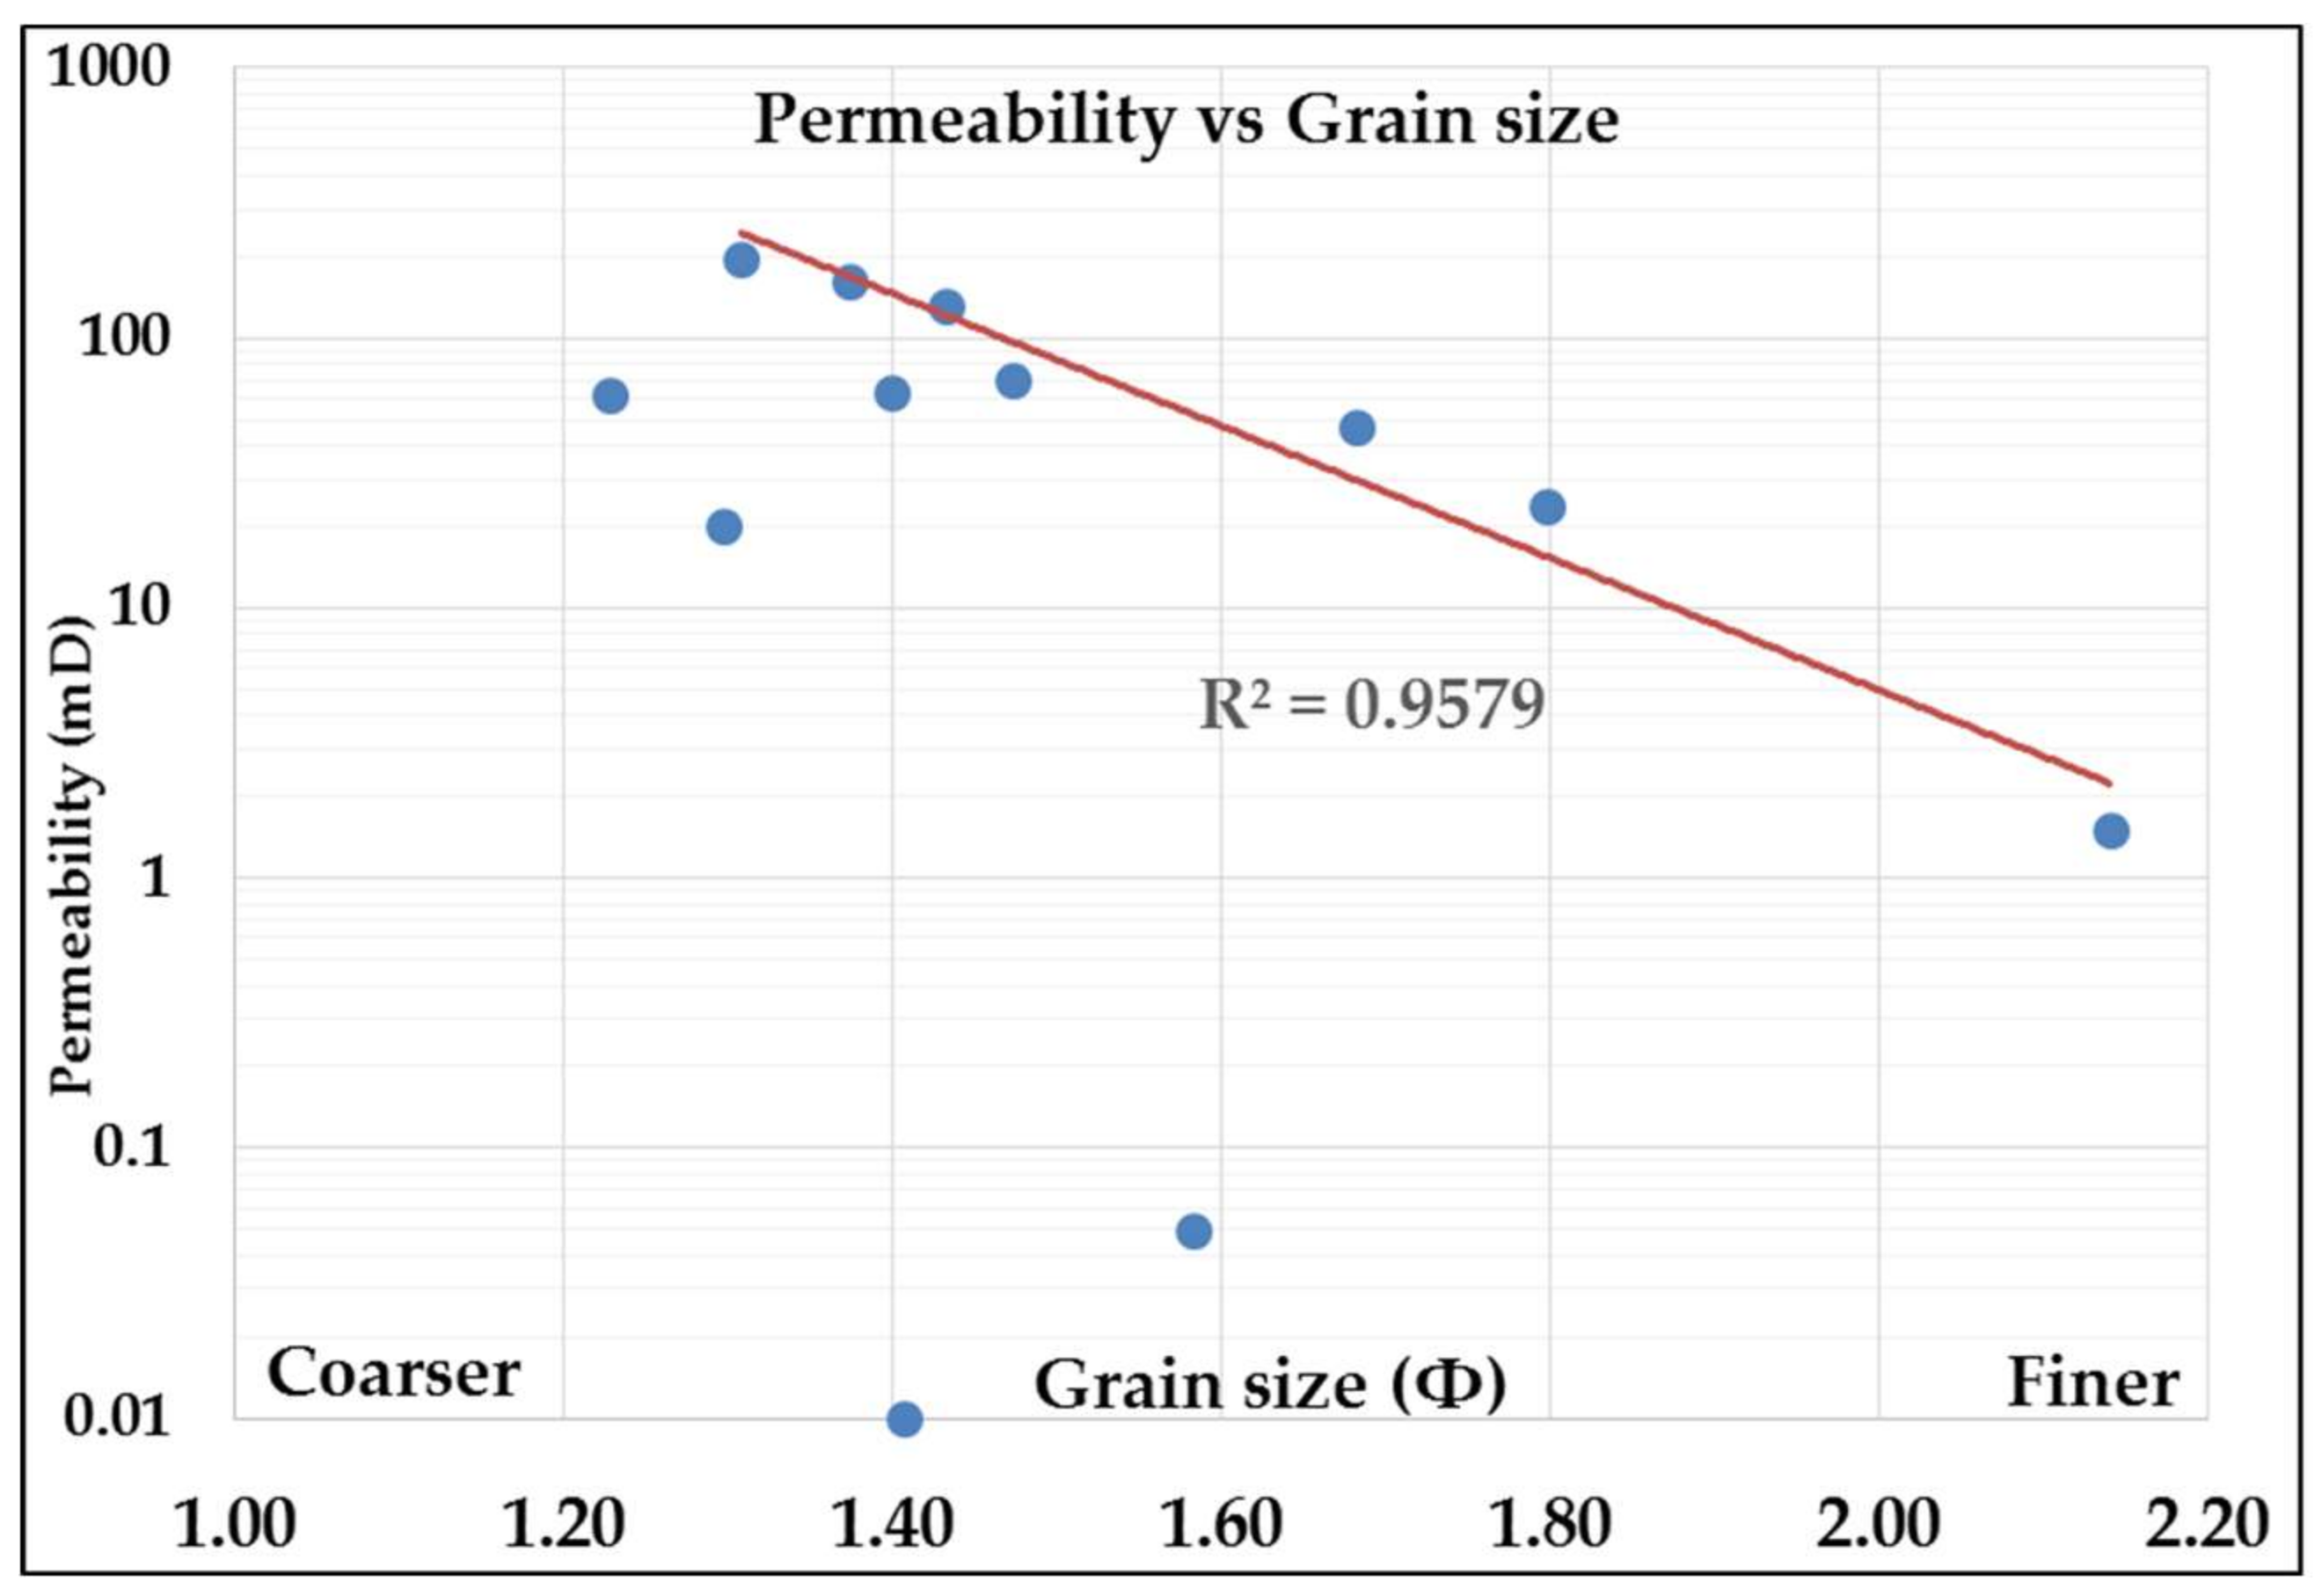
Figure 6.
Thin section photomicrographs of medium sized McKee sandstone with porosity-enhancing features under plane-polarized light. (A) Well-sorted sandstone with common intergranular porosity with the presence of dissolution creating hybrid porosity in McKee 4 at 2355 m. (B) Moderately sorted sandstone with fairly small common intergranular porosity (stained blue) with secondary porosity (isolated pores) in McKee 6A at 2173.25 m. (C) Well-sorted sandstone with mostly quartz and feldspar subordinates (stained yellow) with common pores (intergranular pores and grain dissolution pores) in Tuhua-1 at 2256.33 m. (D) Secondary porosity by partial dissolution of grains and cement in McKee 4 at 2355 m. (E) Intergranular pores (stained blue) with the presence of quartz overgrowth growing from a quartz grain surrounded by dust rim in McKee 6A at 2173.25 m. (F) Well-sorted sandstone showing good intergranular porosity with the presence of quartz overgrowth in Tuhua-1 at 2256.3 m.
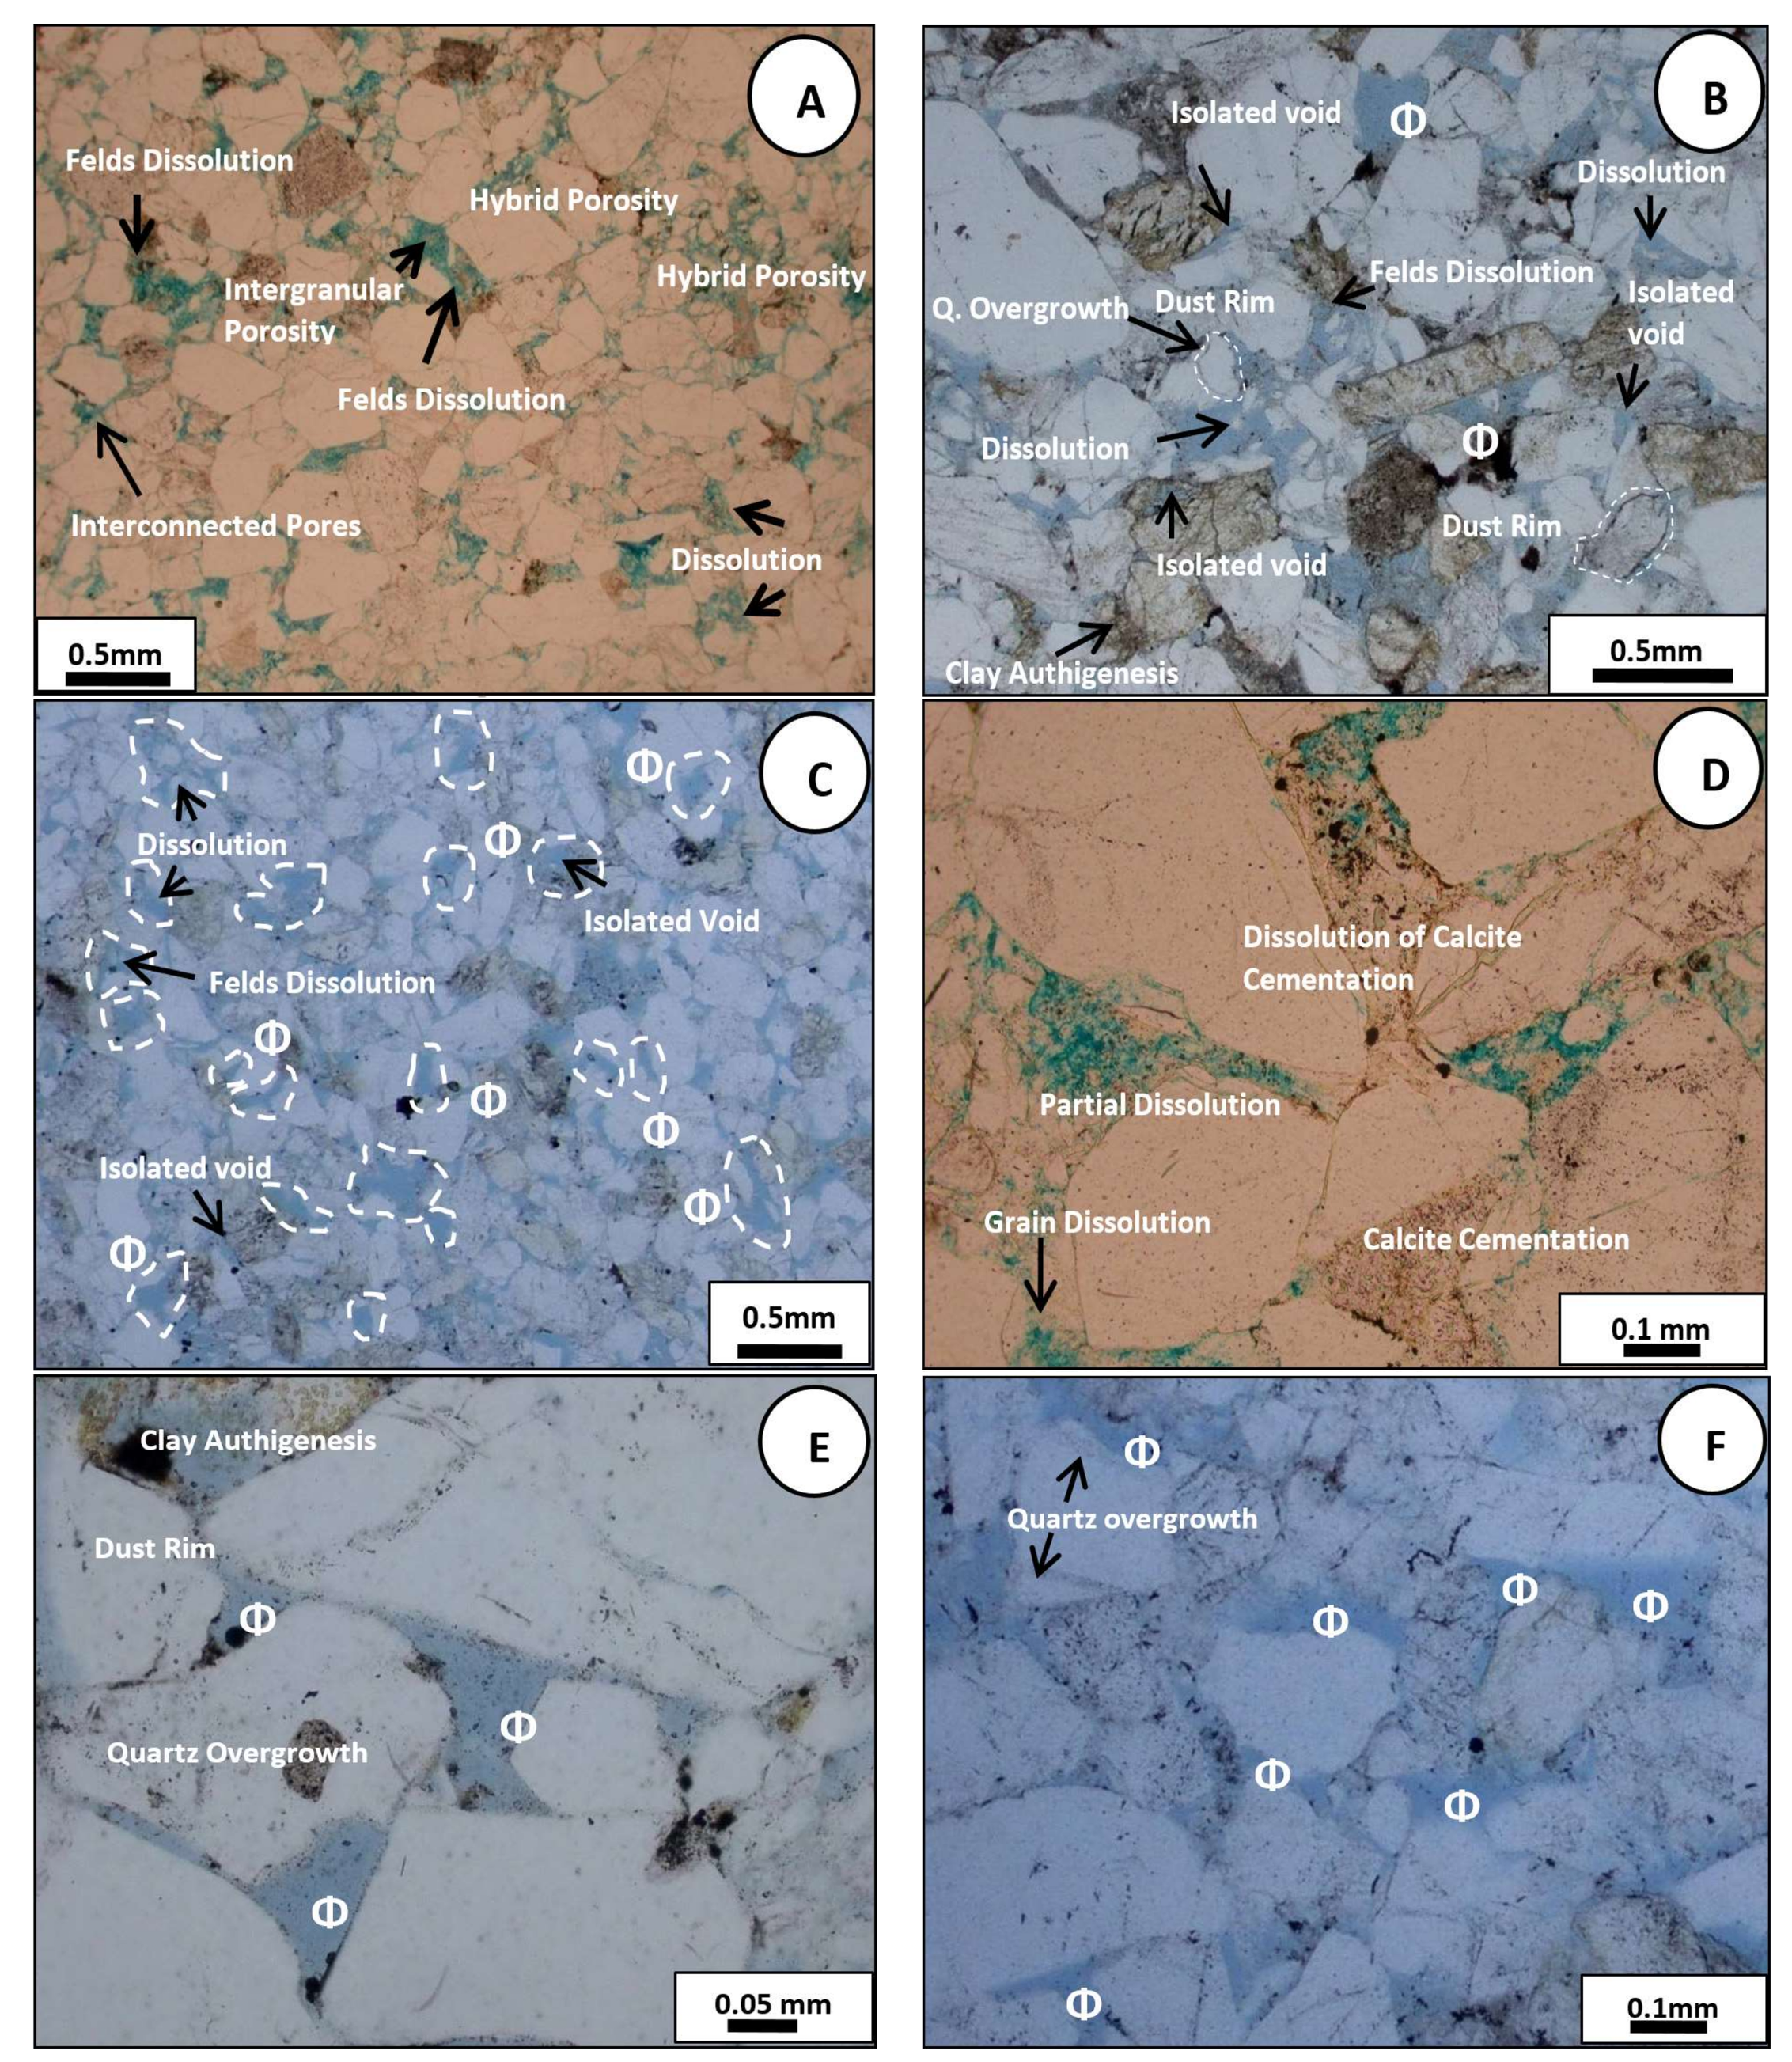
Figure 7.
Thin section of medium-grained McKee sandstone with porosity-reducing features under plane-polarized light. (A) Well-sorted sandstone that is variably argillaceous in McKee 5A at 2328 m. (B) Argillaceous sandstone with small and poorly connected pores. Clay of authigenic origin can also be seen where grains are partially altered in McKee 5A at 2328 m. (C) Well-sorted sandstone with pores slightly affected by quartz overgrowth in McKee 6A at 2217 m. (D) Moderately well-sorted sandstone showed pores affected by quartz overgrowth and labile grain partially altered to clay in McKee 6A at 2240.25 m. (E) Heavily cemented sandstone with the presence of microstylolites in McKee 4 at 2463 m. (F) Moderately well-sorted sandstone with compaction effects such as concave-convex, long grain contact, and slightly fractured grains suggesting a moderate degree of compaction in McKee 6A at 2184.8 m. Prevalent porosity despite compaction suggested a stable grain framework.

Figure 8.
Correlation cross-plot between porosity against permeability.

Figure 9.
Litho-saturation plot of McKee 4. GR: Gamma Ray; -Ve Separation: Negative Separation; RT: High Resistivity.
Figure 9.
Litho-saturation plot of McKee 4. GR: Gamma Ray; -Ve Separation: Negative Separation; RT: High Resistivity.

Figure 10.
Litho-saturation plot of McKee 6A. GR: Gamma Ray; -Ve Separation: Negative Separation; RT: High Resistivity.
Figure 10.
Litho-saturation plot of McKee 6A. GR: Gamma Ray; -Ve Separation: Negative Separation; RT: High Resistivity.
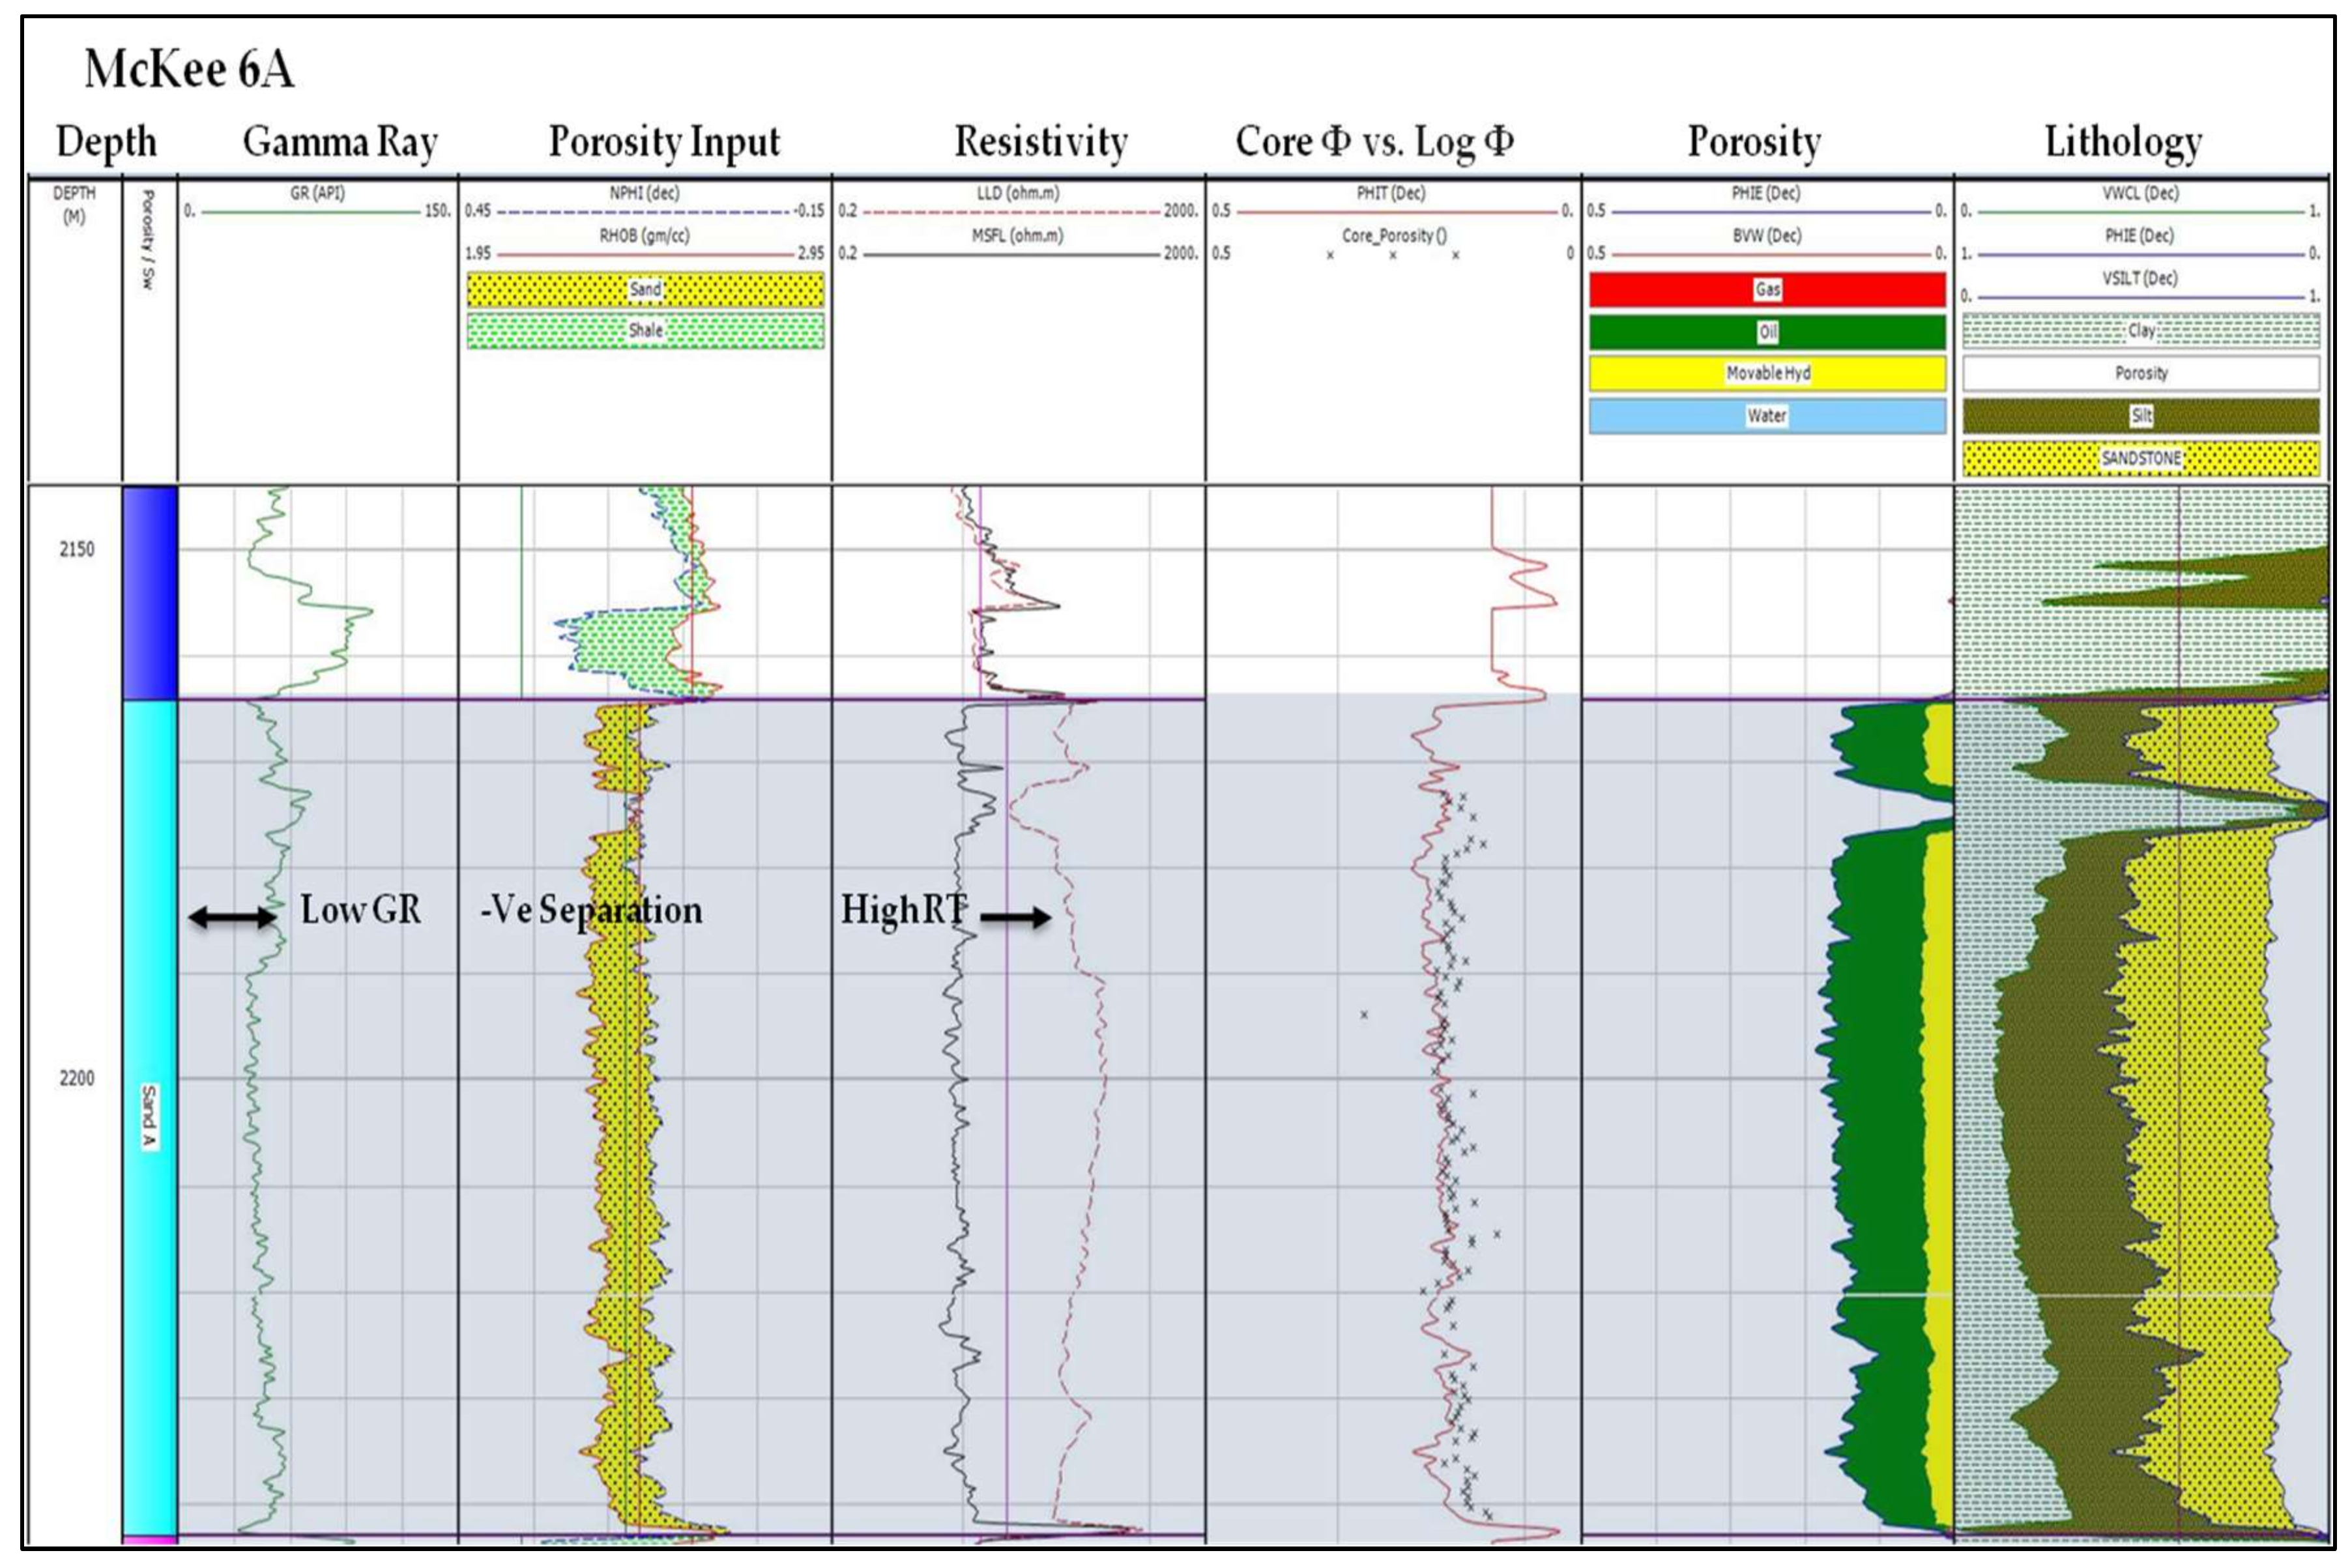
Figure 11.
Litho-saturation plot of Tuhua-1. GR: Gamma Ray; -Ve Separation: Negative Separation; RT: High Resistivity.
Figure 11.
Litho-saturation plot of Tuhua-1. GR: Gamma Ray; -Ve Separation: Negative Separation; RT: High Resistivity.
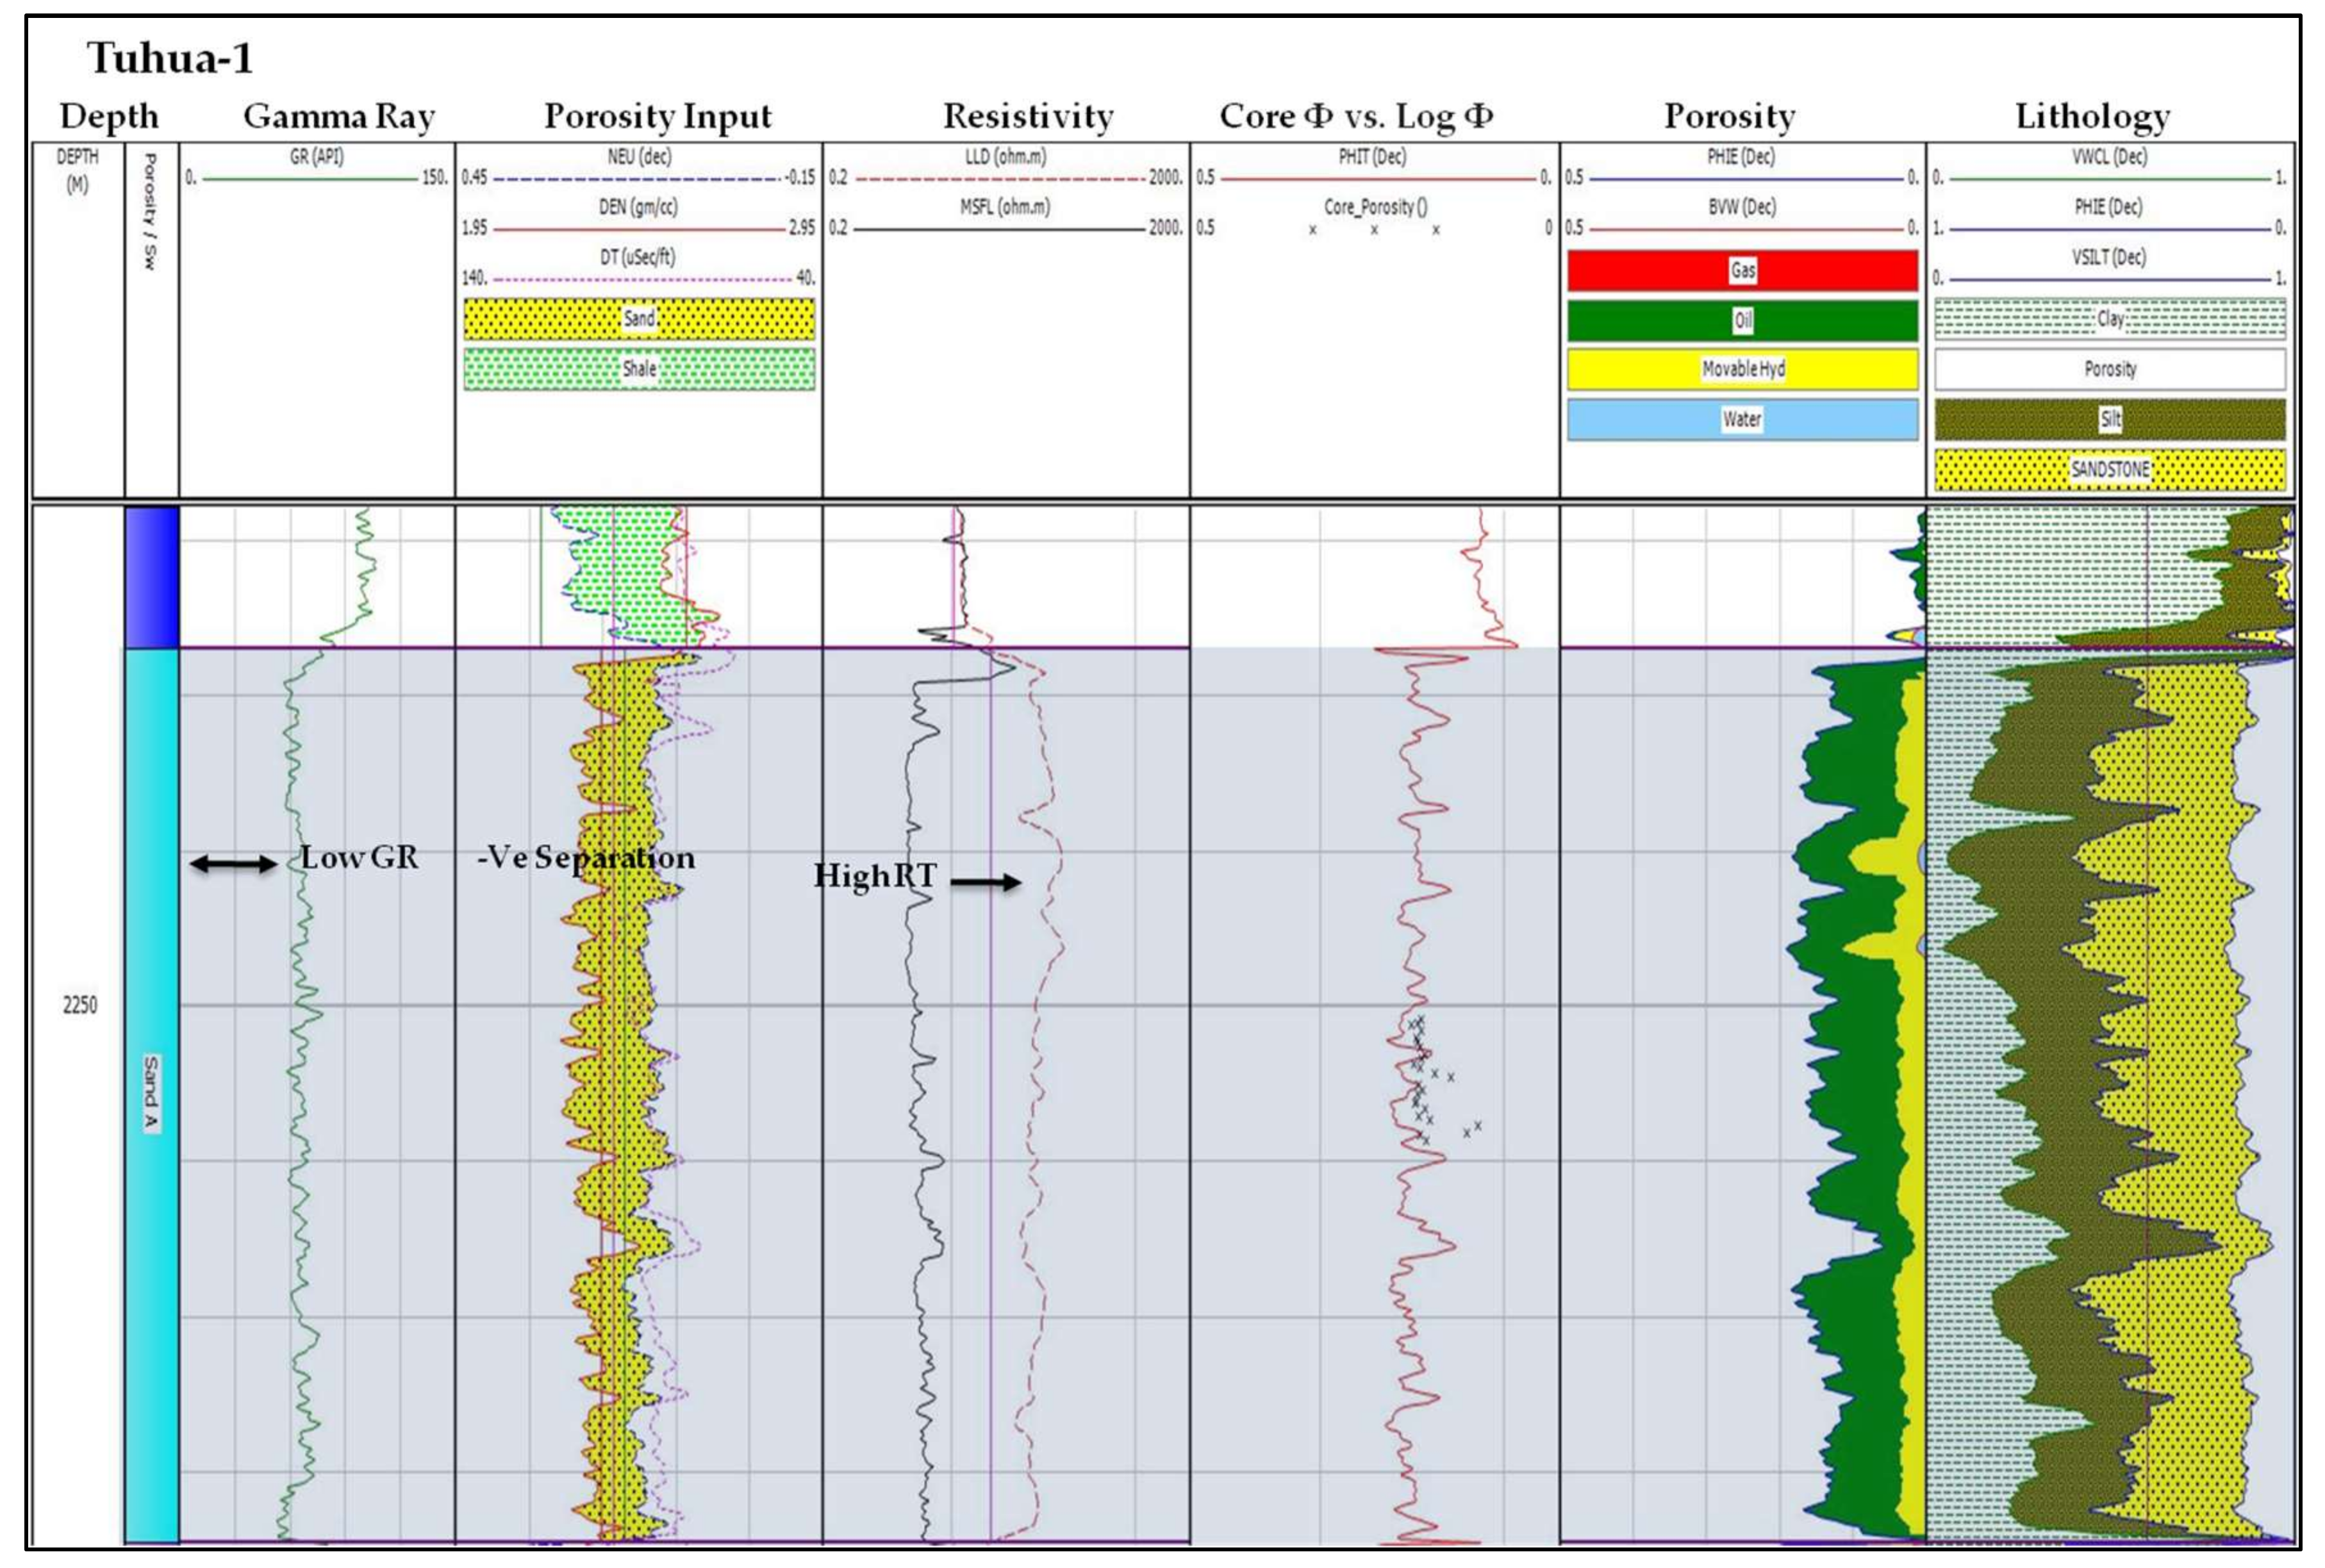
Figure 12.
Density porosity (In decimal fraction) versus neutron porosity (In decimal fraction) showing the clay habitat.
Figure 12.
Density porosity (In decimal fraction) versus neutron porosity (In decimal fraction) showing the clay habitat.

Table 1.
Petrographic descriptions of the thin section photomicrographs provided by GNS Science.
| Well | Depth (m) | Figure No. | Description |
|---|---|---|---|
| McKee 4 | 2355 | 6A | Lower magnification of clean, medium-grained, well-sorted sandstone. Presence of dissolution within the sample creating hybrid porosity. |
| McKee 4 | 2355 | 6D | Moderate magnification of clean, medium-grained sandstone with signs of dissolution and cementation. |
| McKee 4 | 2463 | 7E | Moderate magnification of heavily cemented medium-grained sandstone. |
| McKee 5A | 2328 | 7A | Low magnification of variably argillaceous, medium-grained well-sorted sandstone. Highly quartzose sample with visible pores present only where labiles/matrix are absent. |
| McKee 5A | 2328 | 7B | Moderate magnification of variably argillaceous, medium-grained sandstone showing poor interconnected pores. |
| McKee 6A | 2173.25 | 6B | Low magnification of medium-grained, moderately sorted sandstone. Sample is mostly quartz with subordinate feldspar. |
| McKee 6A | 2173.25 | 6E | High magnification of medium-grained, moderately well-sorted sandstone, showing intergranular pores. |
| McKee 6A | 2184.8 | 7F | Low magnification of medium-grained, moderately well sorted sandstone. Sample is mostly quartz with subordinate feldspar and rare lithics. |
| McKee 6A | 2217 | 7C | Low magnification of medium-grained, well sorted sandstone. Sample is mostly quartz with subordinate feldspar. Pores moderately common and fairly well interconnected. |
| McKee 6A | 2240.25 | 7D | High magnification of medium-grained moderately well-sorted sandstone. Sample shows quartz overgrowth and partial alteration of grain. |
| Tuhua-1 | 2256.33 | 6C | Low magnification of medium-grained, well-sorted sandstone. Sample is mostly quartz with feldspar. |
| Tuhua-1 | 2256.33 | 6F | Moderate magnification of clean, medium-grained, well-sorted sandstone with presence of quartz overgrowth. |
Table 2.
The cut-off values obtained and averaged showing the reservoir and petrophysical parameters of the McKee Formation in the studied wells.
Table 2.
The cut-off values obtained and averaged showing the reservoir and petrophysical parameters of the McKee Formation in the studied wells.
| Well Name | Gross Thickness | Net Reservoir (m) | Net Pay (m) | Avg. Ø (%) | Avg. Vcl (%) | Avg. Sw (%) | Avg. Shc (%) |
|---|---|---|---|---|---|---|---|
| McKee 4 | 114.61 | 101.54 (88.6%) | 60.2 (52.5%) | 13.7 | 20.6 | 29.3 | 70.7 |
| McKee 5 | 42.67 | 18.52 (43.4%) | 8.62 (20.2%) | 11.8 | 34.5 | 38.2 | 61.8 |
| McKee 5A | 62.18 | 40.98 (65.9%) | 40.98 (65.9%) | 14.2 | 25.4 | 18.4 | 81.6 |
| McKee 6A | 79.1 | 73.2 (92.5%) | 73.2 (92.5%) | 15.9 | 14.9 | 13.4 | 86.6 |
| Pukemai-1 | 29.72 | 24.01 (81.4%) | 24.01 (81.4%) | 14.4 | 19.8 | 10.1 | 89.9 |
| Tuhua-1 | 64.62 | 48.7 (75.4%) | 48.7 (75.4%) | 11.9 | 27.8 | 30.3 | 69.7 |
| Tuhua-2B | 70.86 | 66.1 (93.3%) | 66.1 (93.3%) | 15.4 | 20.4 | 16.7 | 83.3 |
Cut-off values applied in obtaining net pay: Vcl > 0.5; Sw > 0.5; Ø < 0.1. Avg: Average; Ø: Porosity; Vcl: Volume of Clay; Sw: Water Saturation; Shc: Hydrocarbon Saturation.
© 2018 by the authors. Licensee MDPI, Basel, Switzerland. This article is an open access article distributed under the terms and conditions of the Creative Commons Attribution (CC BY) license (http://creativecommons.org/licenses/by/4.0/).
Share and Cite
MDPI and ACS Style
Dong, S.P.; Shalaby, M.R.; Islam, M.A. Integrated Reservoir Characterization Study of the McKee Formation, Onshore Taranaki Basin, New Zealand. Geosciences 2018, 8, 105. https://doi.org/10.3390/geosciences8040105
AMA Style
Dong SP, Shalaby MR, Islam MA. Integrated Reservoir Characterization Study of the McKee Formation, Onshore Taranaki Basin, New Zealand. Geosciences. 2018; 8(4):105. https://doi.org/10.3390/geosciences8040105
Chicago/Turabian StyleDong, Swee Poh, Mohamed R. Shalaby, and Md. Aminul Islam. 2018. "Integrated Reservoir Characterization Study of the McKee Formation, Onshore Taranaki Basin, New Zealand" Geosciences 8, no. 4: 105. https://doi.org/10.3390/geosciences8040105
Note that from the first issue of 2016, this journal uses article numbers instead of page numbers. See further details here.