1. Introduction
The oceans cover 71% of the Earth’s surface [
1], are fundamental to sustaining life, controlling climate, facilitating commerce and they represent a vast source of resources and economic wealth. Our understanding of the ocean and natural processes occurring at the seafloor is quite limited due to the difficulties in operating in this environment, especially the fact that electromagnetic waves, (e.g., light and radar), are highly attenuated in ocean water. The suite of optical and electromagnetic sensors that are used to map, observe, and understand land topography cannot penetrate more than tens of meters at best in ocean waters. This has left the vast majority of our planet virtually unmapped, unobserved, and unexplored. Satellite measurements of ocean surface height have been used to provide a general view of the shape of the deep ocean floor through altimetry-derived predicted seafloor depths [
2]. However, the phenomena referred to as the “upward continuation” of gravity signals from bathymetric features at depth, limits the horizontal resolution of undersea features to those greater than approximately double the regional ocean depth [
3]. Considering that the recent estimate of the mean world ocean depth is ~3.9 km [
1], the average achievable resolution is on the order of 8 km. Thus, while satellite altimetry-derived bathymetry is excellent for a regional tectonic studies (e.g., [
4]), it does not provide enough spatial resolution or accuracy to perform the detailed geomorphometric analyses [
5] required to understand the origin and significance of, for example, bottom current features [
6], submarine glacial landforms [
7], benthic habitats [
8,
9,
10], geohazards such as shallow faults [
11,
12], pockmarks, or mass transport complexes [
13].
Knowing seabed depths, (bathymetry) is of vital importance for a growing variety of uses fundamental to understanding the workings of our planet. Early echo-sounding profiles across the Atlantic Ocean enabled Bruce Heezen and Marie Tharp to understand the relationship between mid-ocean ridges and earthquake seismicity and played an important part in the formulation of one of the most significant paradigm shifts in science—the development of the hypothesis of seafloor spreading and plate tectonics [
14]. Bathymetric data are also critical for establishing the limits of the extended continental shelf under the United Nations Convention on Law of the Sea [
15], play a key role in a host of military and defense applications [
16], and represent a fundamental dataset for addressing the growing challenges associated with climate change [
17,
18].
Recognizing the need for global bathymetric data, The General Bathymetric Chart of the Oceans (GEBCO), operating under the auspices of the International Hydrographic Organization (IHO) and the Intergovernmental Oceanographic Commission (IOC) of the United Nations Educational, Scientific and Cultural Organization (UNESCO), was initiated more than 100 years ago with the vision of providing authoritative, publicly-available bathymetry data for the world’s oceans [
19]. Since its initiation in 1903 through the efforts of Prince Albert I of Monaco and Professor Julien Thoulet of The University of Nancy, GEBCO, and its mostly volunteer community, has produced a series of bathymetric charts that represent the best knowledge of seafloor depths at the time of their production. While the earliest products were contour plots based on very sparse lead-line measurements [
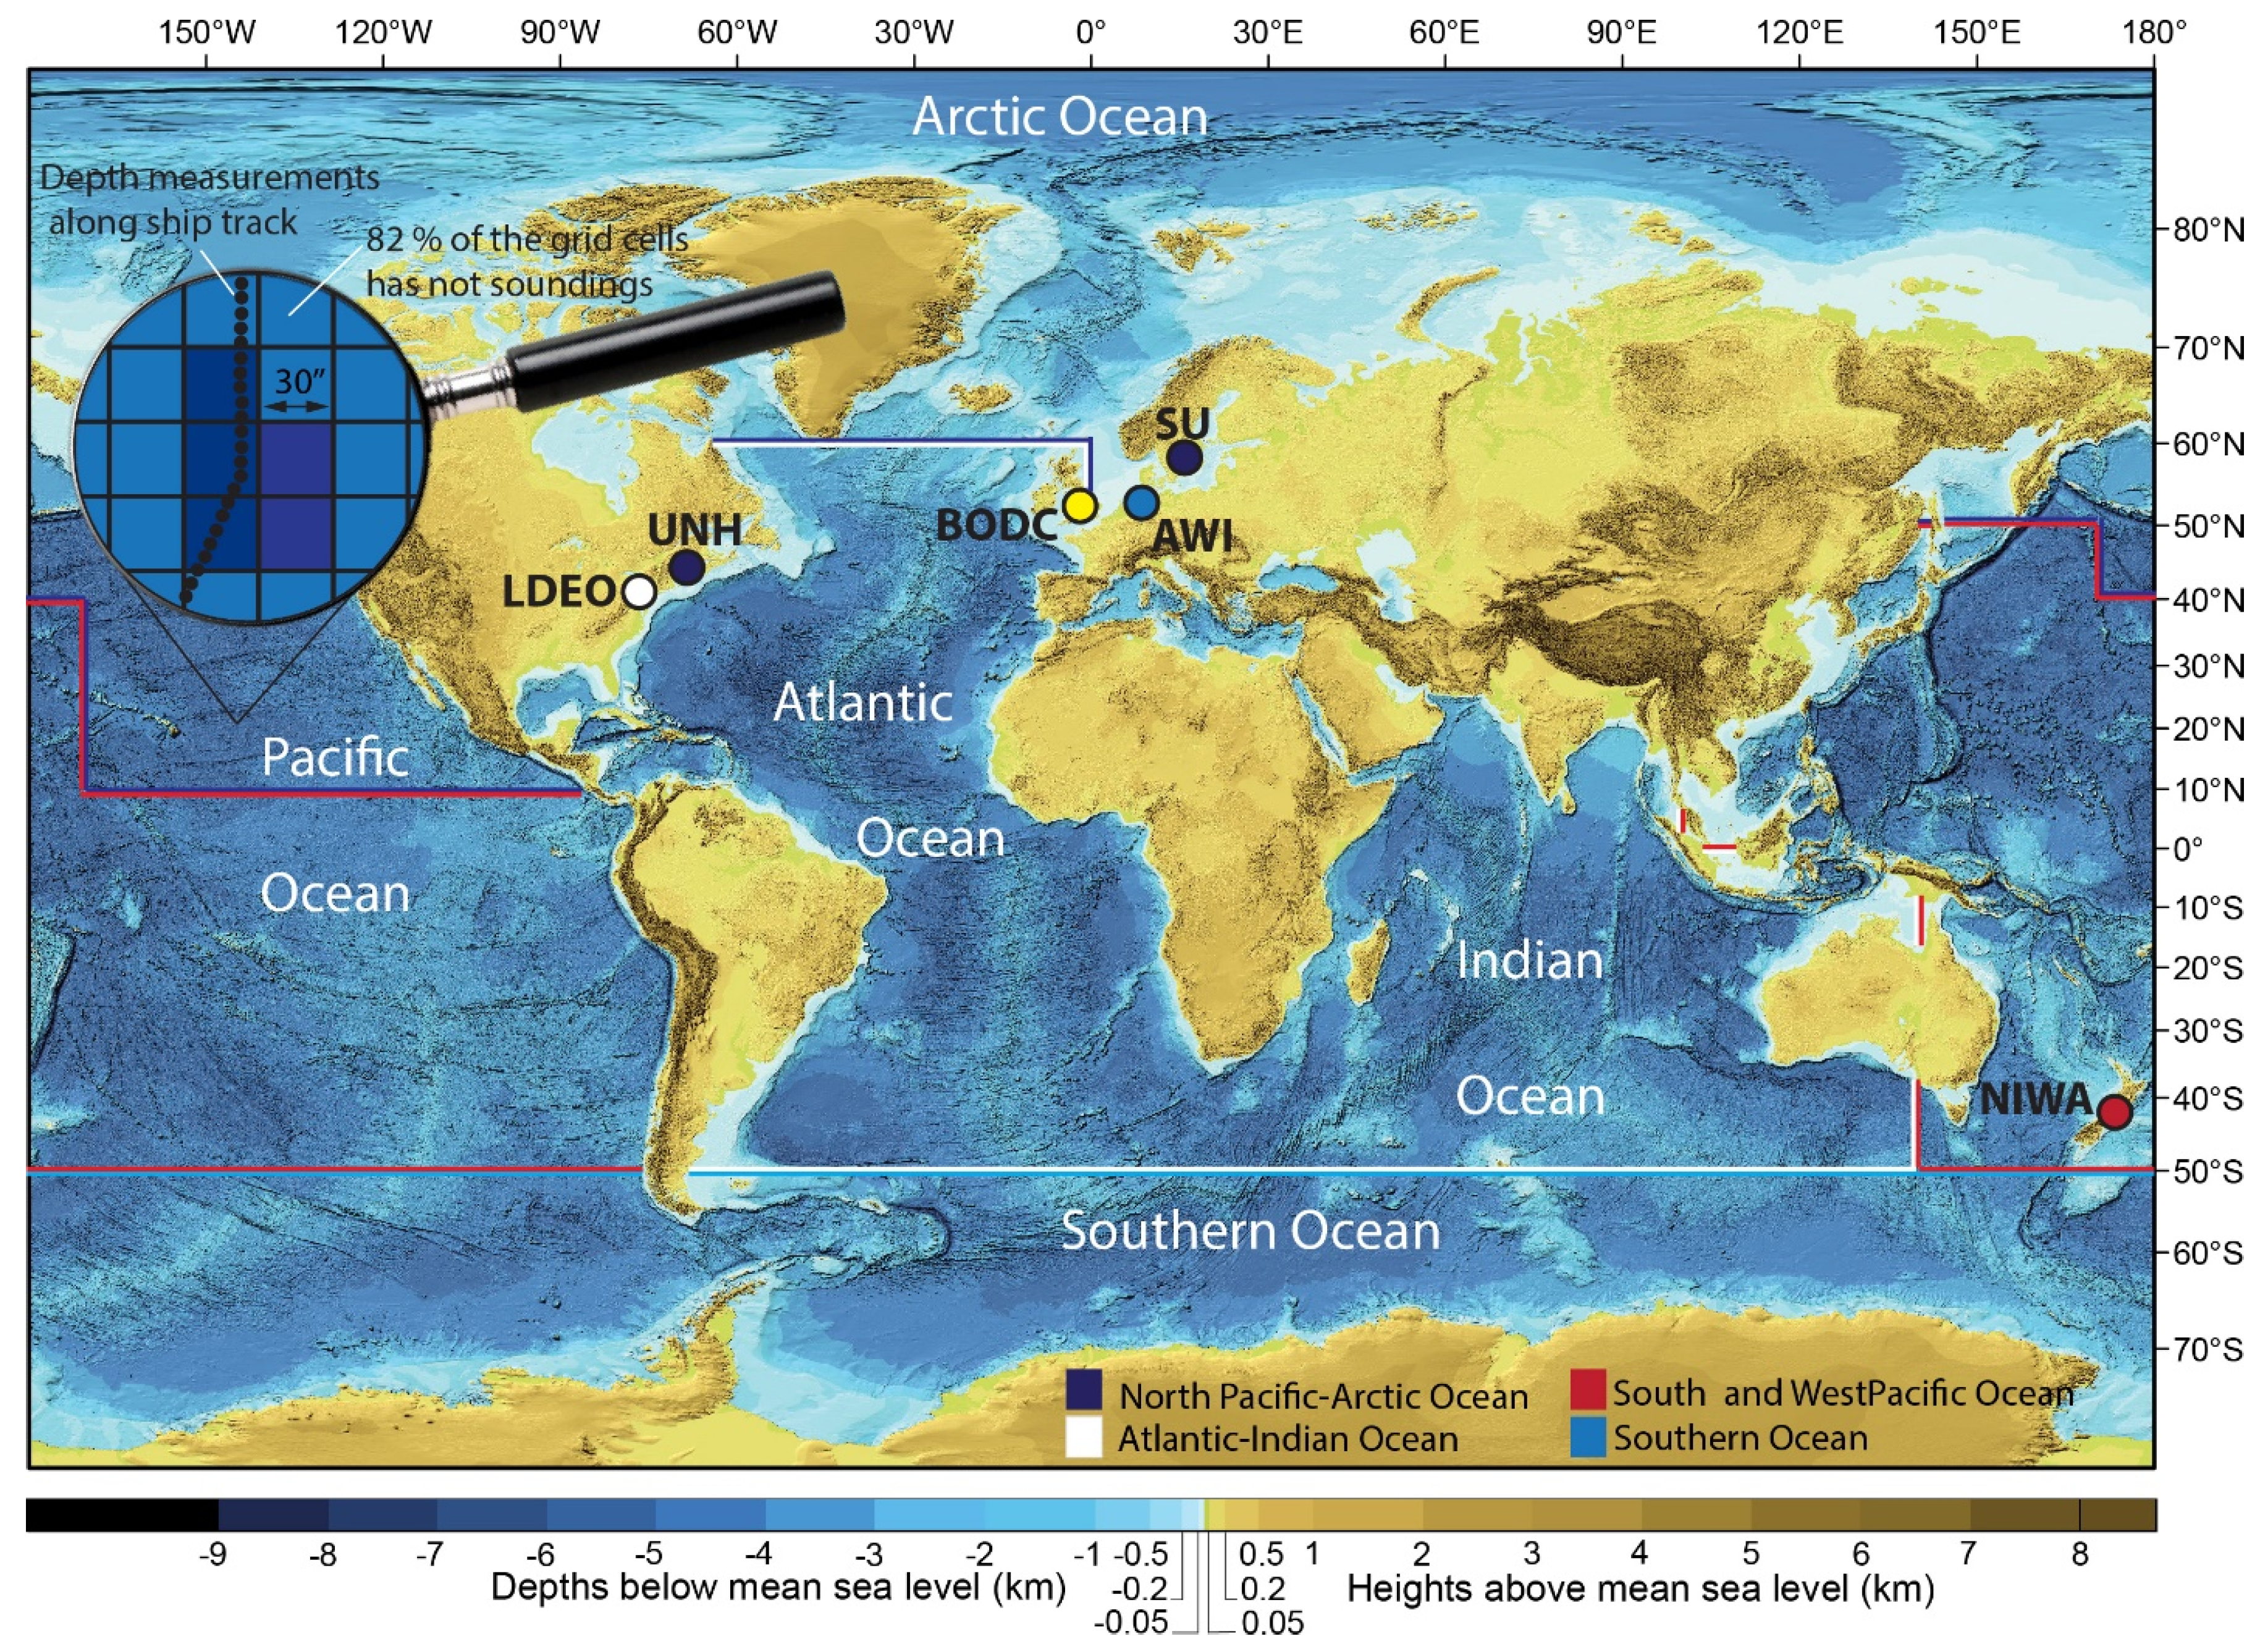
19], the most recent product of GEBCO (GEBCO_2014) is now a digital, gridded product with a cell-spacing of 30 arc sec that incorporates data derived from both single-beam and modern high-resolution multibeam echo sounders, superimposed on a base that is derived from satellite altimetry data [
1] (
Figure 1).
Despite the appearance of full global coverage of ocean depths, even the most recent GEBCO or other global compilations of ocean bathymetry (e.g., NOAA’s National Centers for Environmental Information (NCEI, which serves as the IHO Data Center for Digital Bathymetry), or the Global Multi-Resolution Topography (GMRT)) are deceptive, the product of the power of modern interpolation and visualization techniques that produce what appears to be a complete compilation of ocean depth from fundamentally sparse data. Upon close inspection, when divided into its resolution of 30 arc-second grid cells (926 m at the equator), approximately 82 percent of the grid cells in the GEBCO_2014 grid have no depth measurements in them [
1] (
Figure 1). While the details of current global bathymetric coverage will be discussed below, there is no question that even from even this cursory view, most of the earth’s surface that lies beneath the seas is vastly under-sampled, limiting our ability to perform the detailed quantitative analyses of the seafloor morphology, i.e., geomorphometry, needed to understand ocean and seafloor processes.
Recognizing the poor state of our knowledge of ocean depths and the critical role that such knowledge plays in understanding and maintaining our planet, the Nippon Foundation and GEBCO launched the Seabed 2030 Project at the “Forum for the Future of Ocean Floor Mapping” in Monaco in June of 2016. With planned funding from the Nippon Foundation of approximately
$18.5M US over ten years, The Nippon Foundation—GEBCO Seabed 2030 Project aims at establishing an infrastructure to facilitate the complete mapping of the world ocean floor by 2030, with the view of empowering the world to make policy decisions, use the ocean sustainably, and undertake scientific research based on detailed bathymetric information of the Earth’s seabed. To implement this ambitious goal, the Seabed 2030 Project Team was established and met for the first time in late October 2017 in Southampton U.K. In creating this strategy, Seabed 2030 builds on one hundred years of GEBCO’s legacy of ocean mapping as well as established regional connections in all corners of the world and a global community of alumni built over 12 years through the Nippon Foundation-GEBCO training program in ocean bathymetry at the University of New Hampshire (
http://www.gebco.net/training/training_programme/).
This paper, based upon “The Nippon-Foundation GEBCO—Seabed 2030 Roadmap for Future Ocean Floor Mapping” [
20] (which served as the proposal for the project to the Nippon Foundation), presents the rationale behind the Seabed 2030 Project, describes its structure, outlines its initial implementation strategy, and discusses the benefit of developing such a product. Of particular relevance with respect to geomorphometry, we present these issues in the context of geomorphometric analyses and address the critical question “at what resolution should Seabed 2030 aim to map the world’s ocean’s floors?”
2. Why Seabed 2030?
2.1. How Much of the Seafloor Is Actually Mapped?
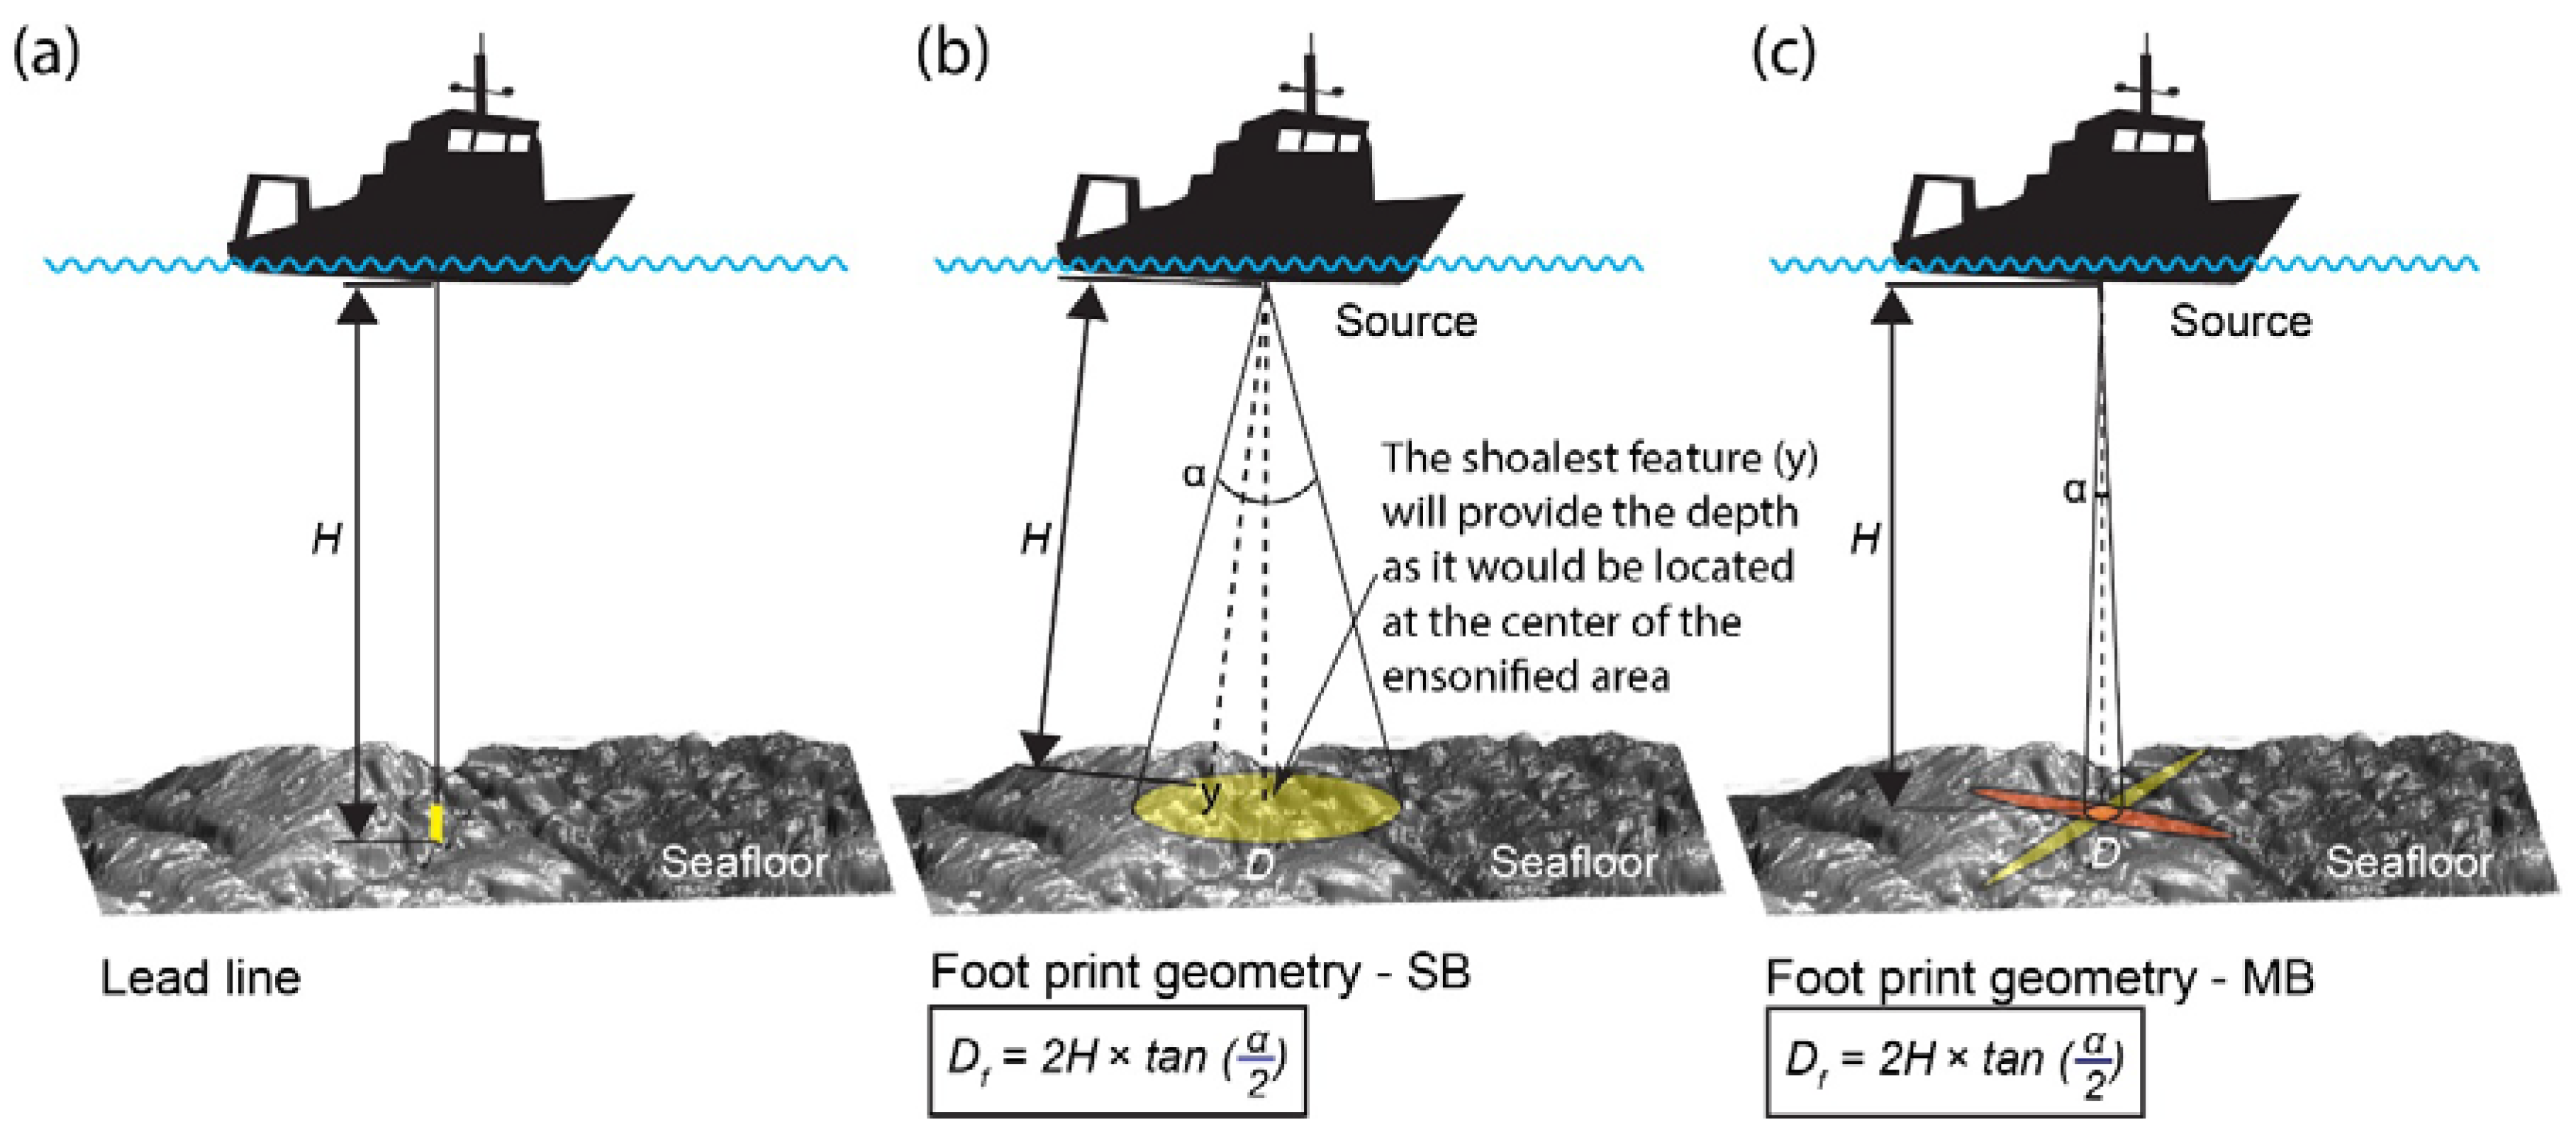
Answering the question of “how much of the seafloor is actually mapped” is far from simple. Aside from the issues of knowing how much data exists from hundreds of potential sources around the world (an issue that will be addressed later), there is the fundamental question of what does “mapped” mean. When a lead-line makes a measurement on the seafloor, the actual spot sampled is, in reality just a few tens of centimeters wide, as represented by the diameter of the weight (
Figure 2). When a single-beam echo-sounder makes a depth measurement, the shallowest point in the area ensonified (with a diameter on the order of one half the water depth for a sounder with a beam width of 30°;
Table 1) is reported, but with no angular information and thus the location of the sounding is reported as the downward projection of the position of the vessel on the seafloor no matter where the shallow feature really is within the ensonified area (
Figure 2). For example, in 4000 m of water depth, a single-beam sounder with a 30° beam width will ensonify a diameter of approximately 2100 m on the seafloor. The shoalest feature within that circle will be the reported depth at a position that is at the center of the ensonified diameter (
Figure 1). We can thus be confident that the depth of shoalest feature within the ensonified area has been measured, but we do not know where in that area the feature is and there is no other information about what else is in the 2100 m diameter ensonified area. Should we consider the entire ensonified area mapped for each single-beam sounding?
The question of what is mapped or not is somewhat simpler for modern multibeam sonars that use beam forming and orthogonal transmitter and receiver arrays (Mills Cross) to form many narrow beams across a wide (athwartship) swath. The fundamental lateral resolution on the seafloor is controlled by the length of the arrays and the intersection (cross-product) of the transmit and receive beams (
Figure 2). Most modern deep-water multibeam sonars form beams that are 1° × 1°, 1° × 2° or 2° × 2° producing ensonified areas on the seafloor (and thus fundamental feature resolutions) that vary with depth (
Table 1).
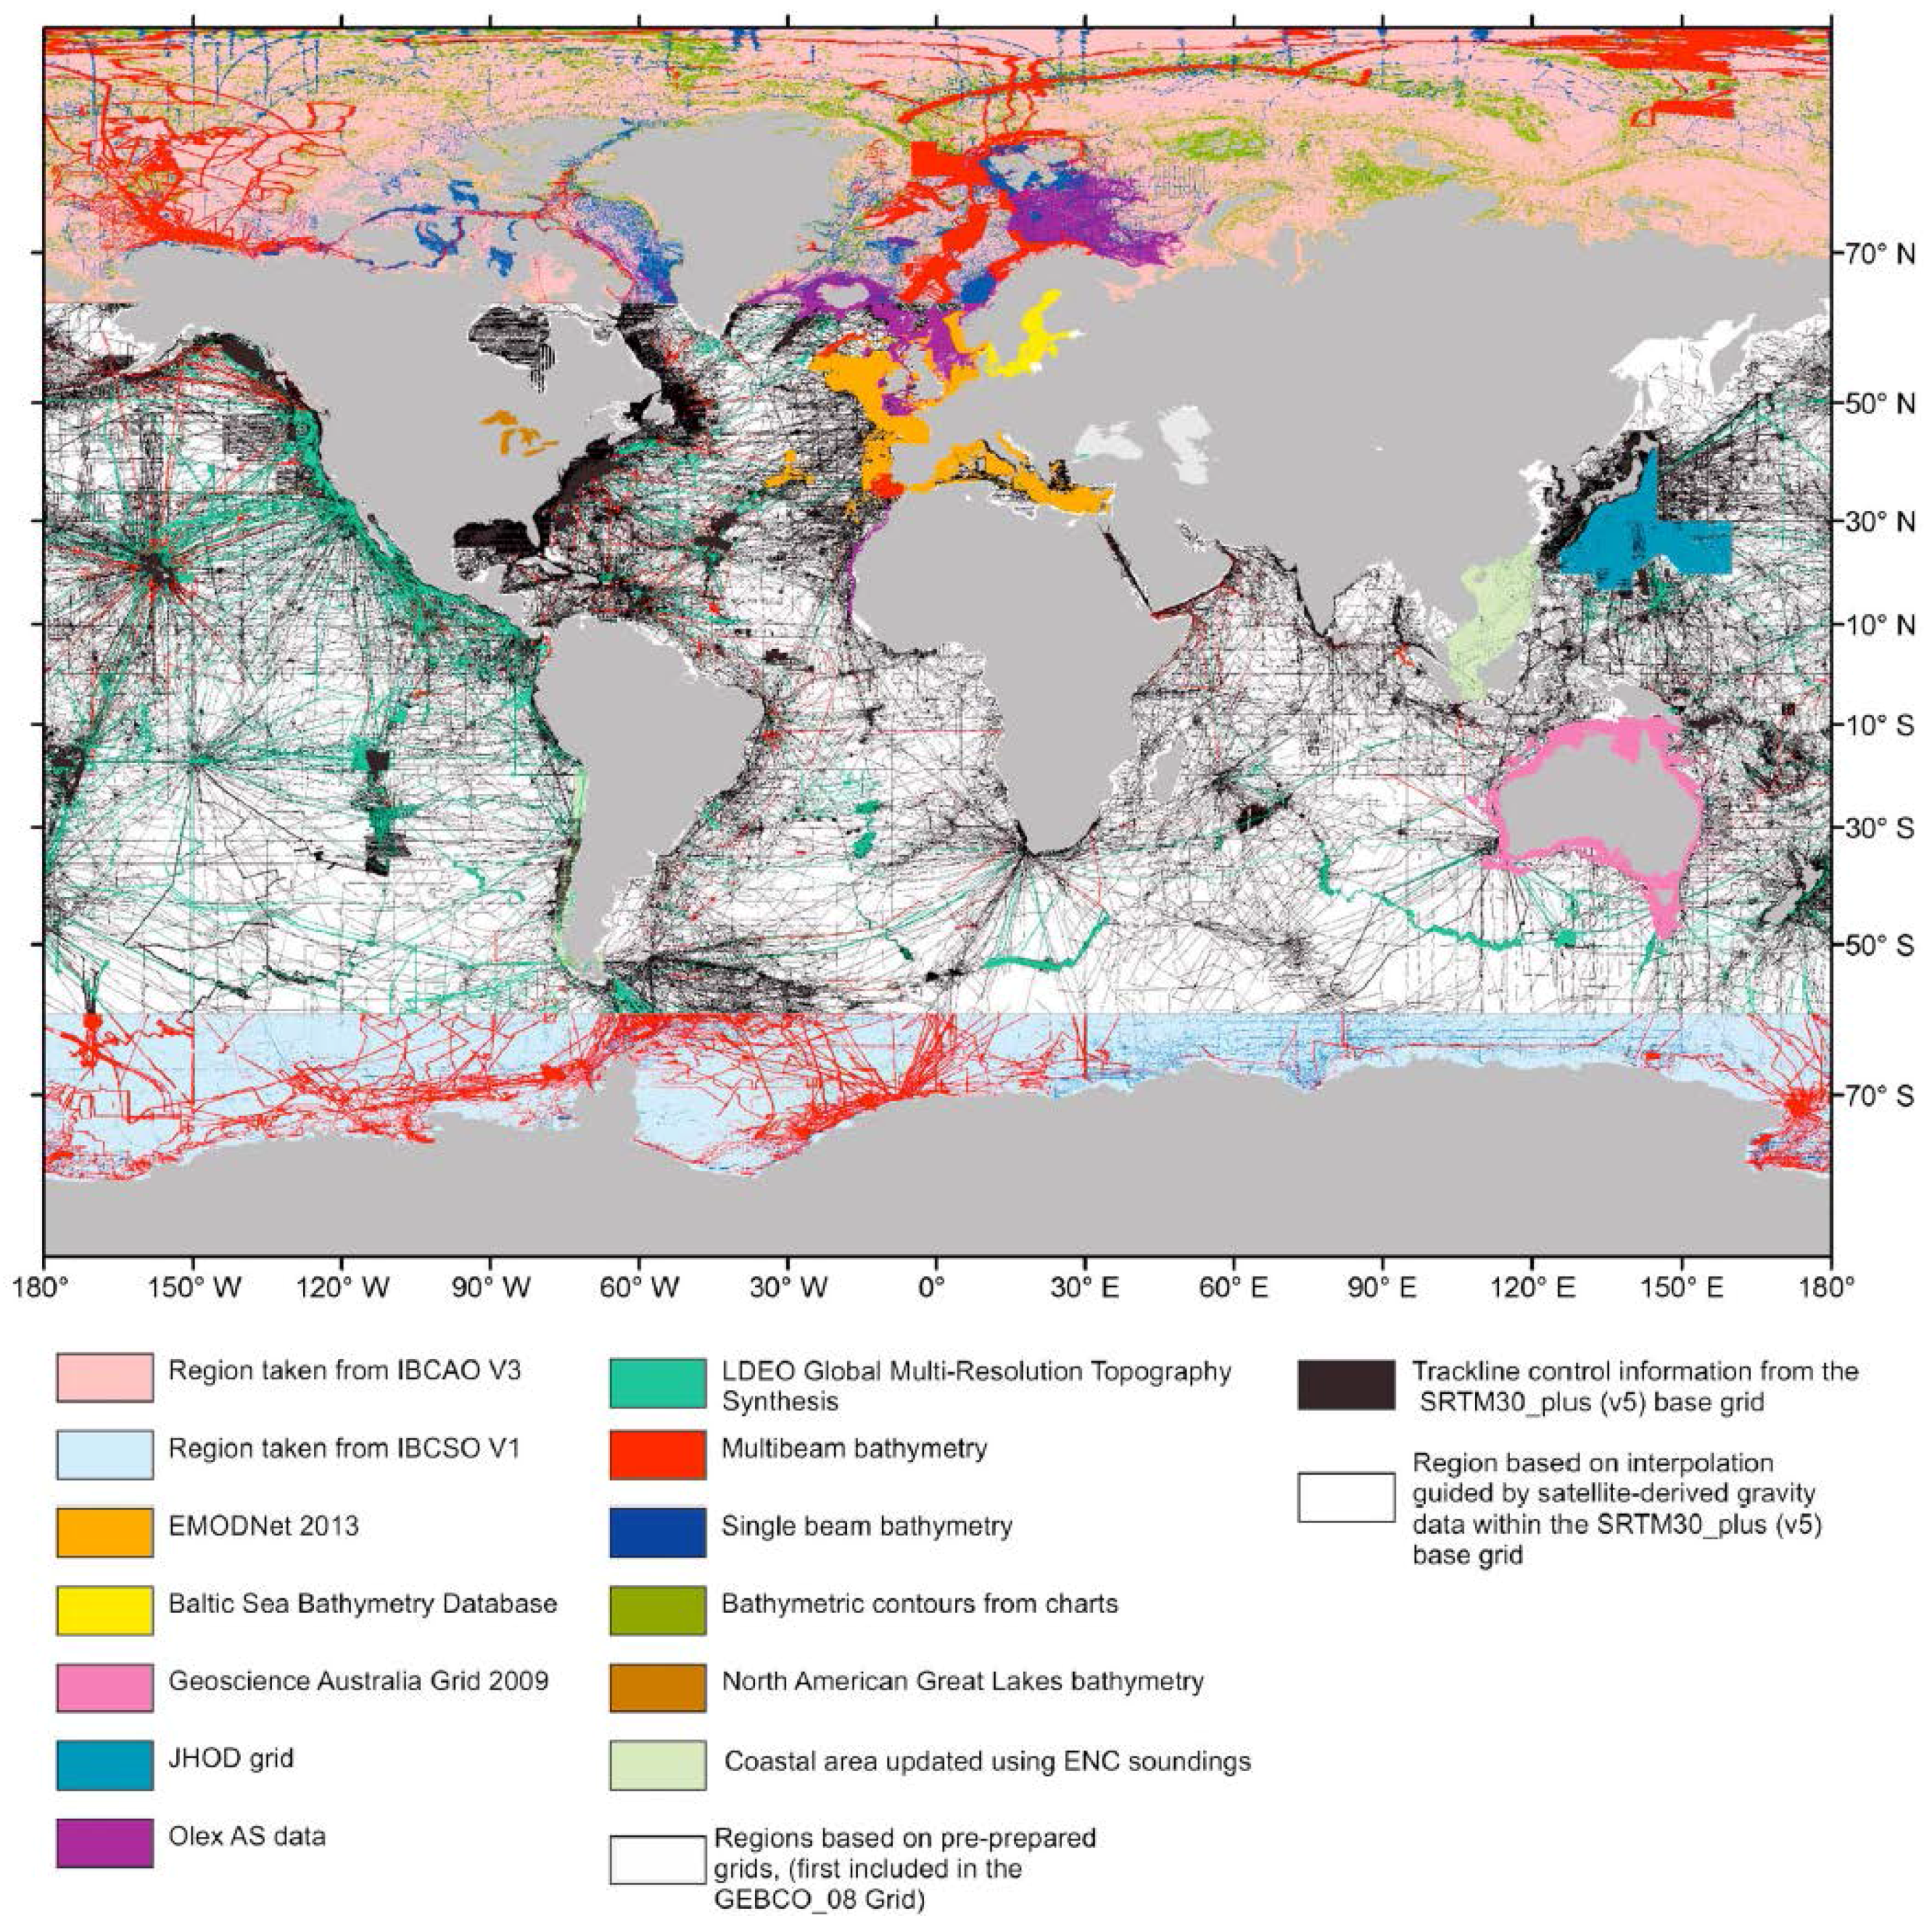
GEBCO’s latest product (GEBCO_2014 [
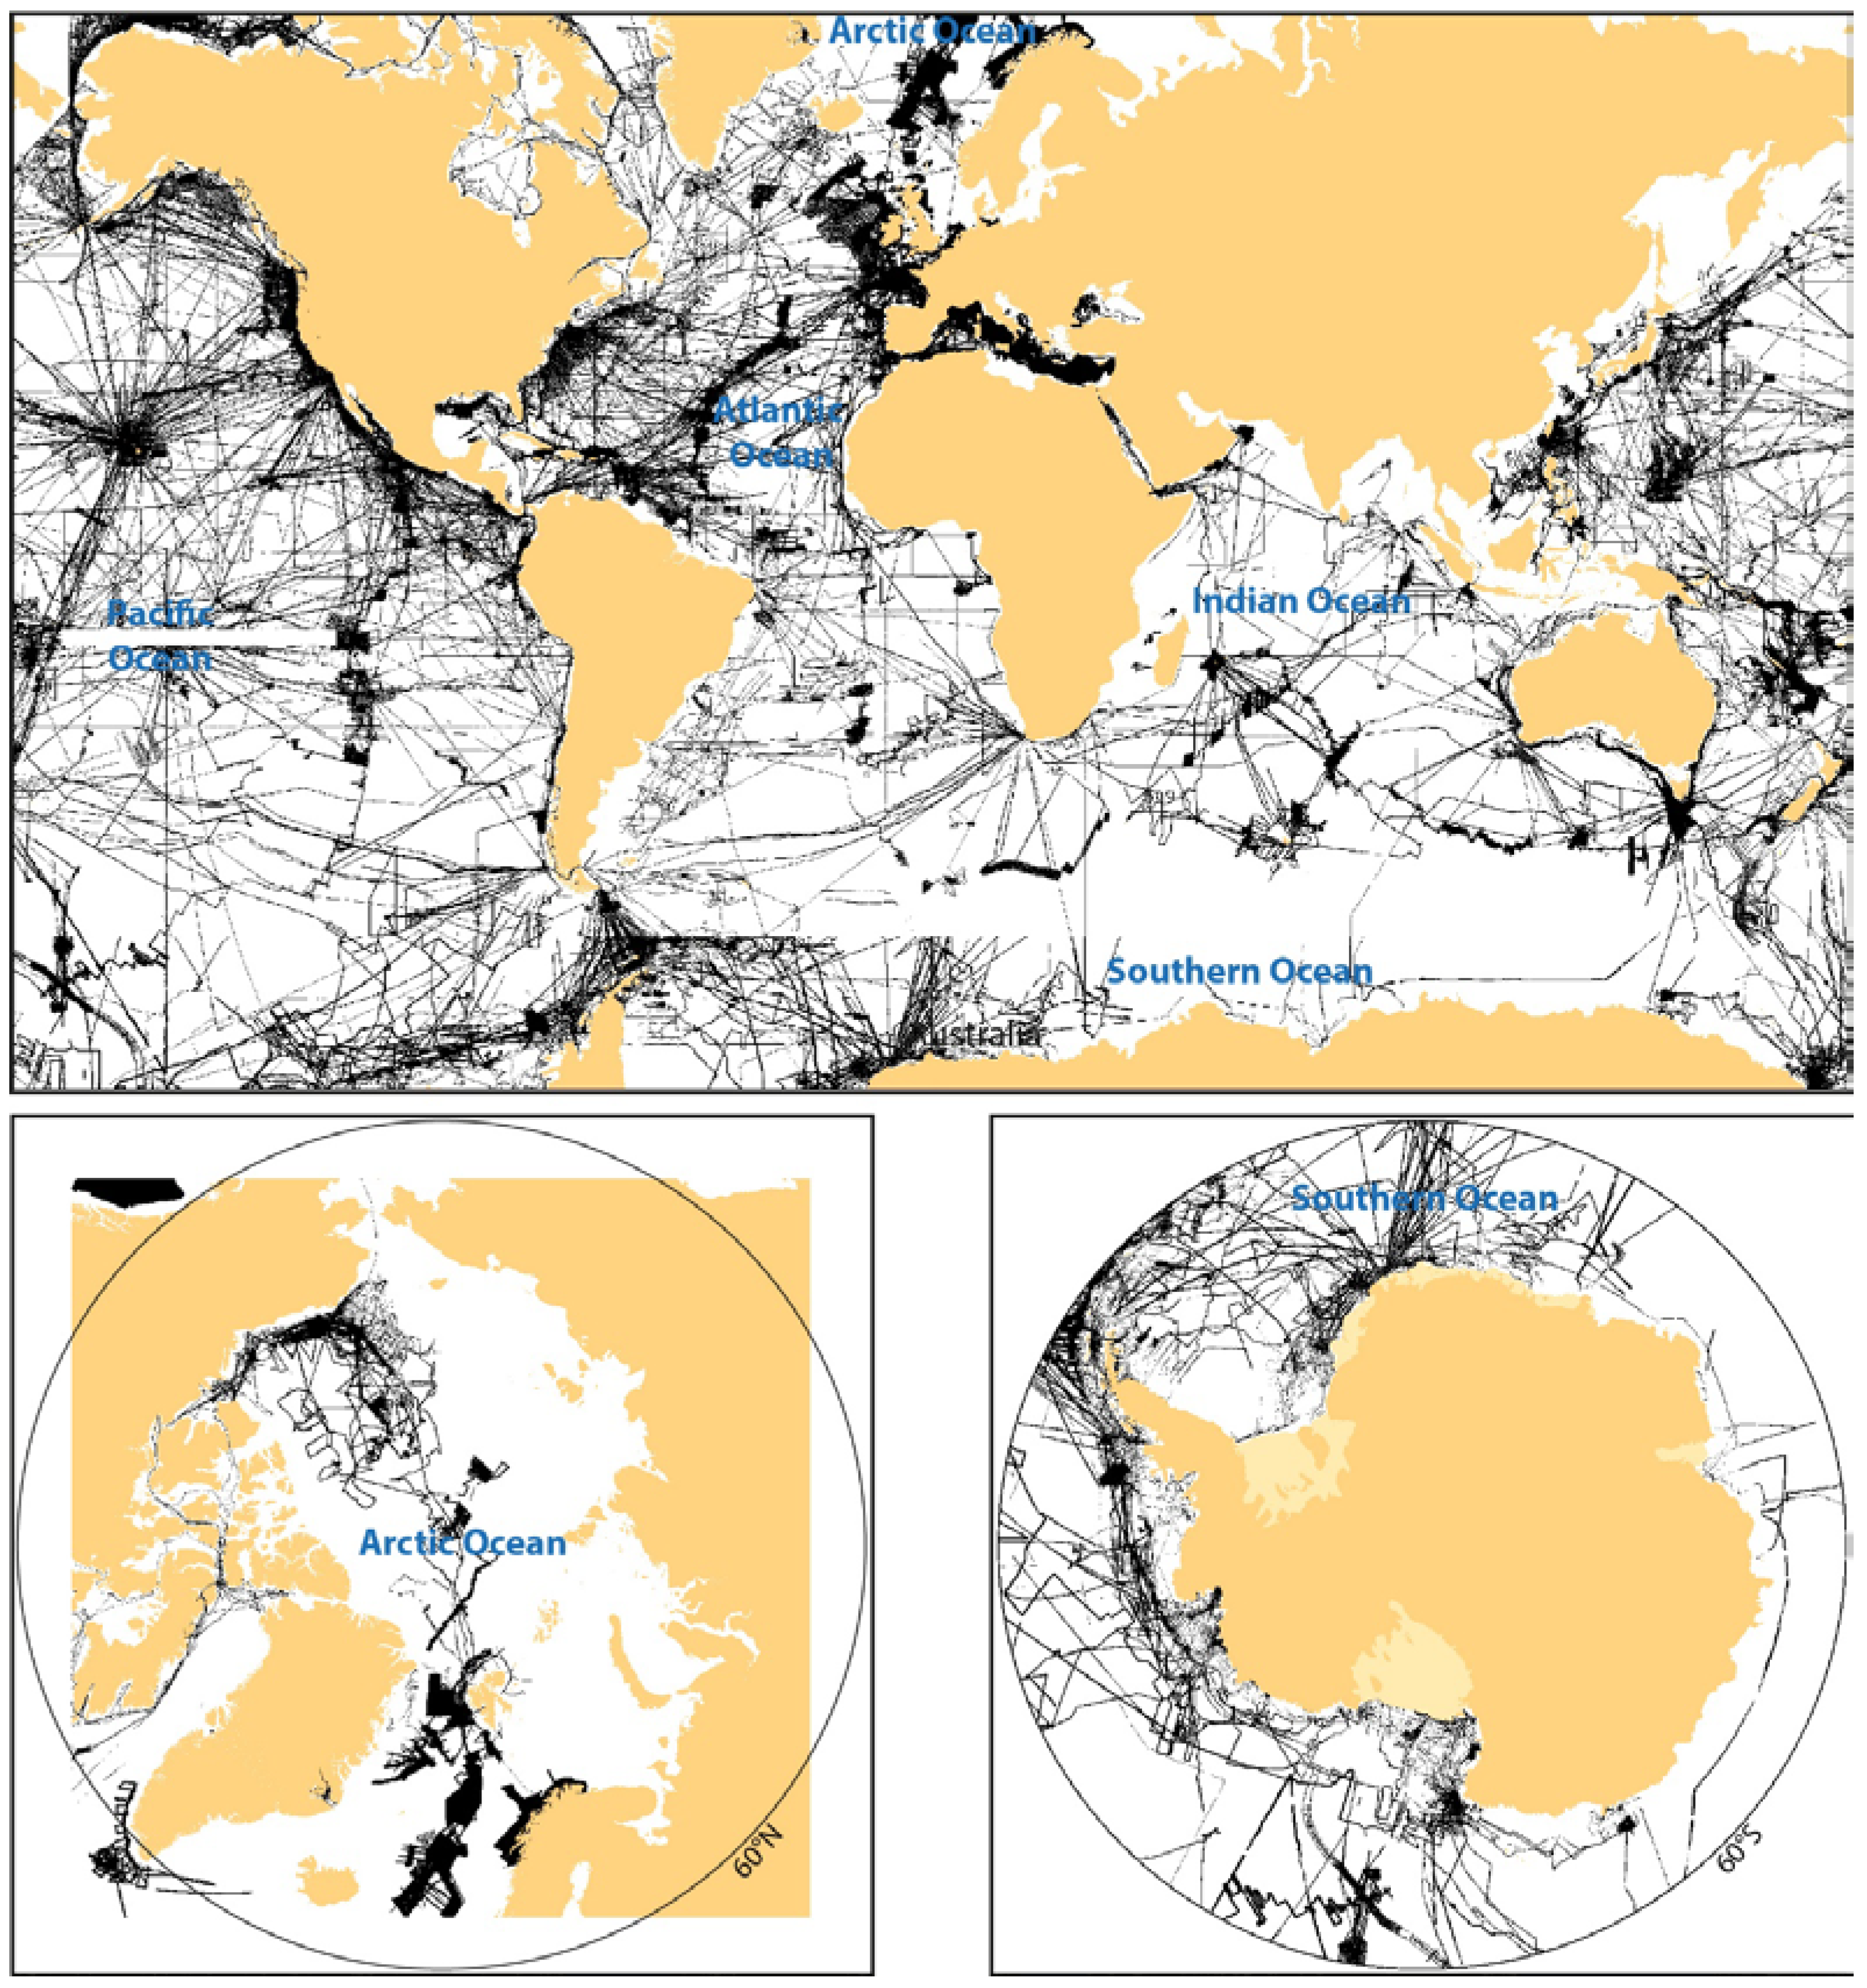
1]) is a mixture of both single-beam, multibeam, and satellite altimetry-derived bathymetry assembled into a model gridded at a regular interval of 30 arc-seconds (
Figure 3). The Arctic Ocean in GEBCO_2014 is comprised of a separate grid provided by the International Bathymetric Chart of the Arctic Ocean (IBCAO; [
21]) and the Southern Ocean consists of a similar grid created by the International Bathymetric Chart of the Southern Ocean (IBCSO; [
22]), two Regional Mapping Projects working within GEBCO. GEBCO_2014 also includes the GMRT compilation of multibeam bathymetry from research expeditions throughout the world (
http://gmrt.marine-geo.org; [
23]), which covers ~8% of the world ocean and is the largest source of multibeam-derived soundings contributing to the GEBCO_2014 grid. In addition, some regions are covered by other regional projects such as EMODnet, covering European waters (
www.emodnet-bathymetry.eu), and the Baltic Sea Bathymetry Database (
http://data.bshc.pro; [
24]). The GEBCO_2014 grid was based on all publically available bathymetric data at the time of compilation (
Figure 3). Track-line plots such as
Figure 3 are particularly deceptive in terms of depicting coverage. Given the scale of these figures, each of the track-lines shown covers a width of 100s of kilometers while in reality, a multibeam swath is typically on the order of four times the water depth (~16 km in 4000 m water depth) and a single beam would ensonify a diameter of approximately 2 km in 4000 m water depth. Lines this thin would be impossible to display on global (or even regional-scale) maps and thus one gets the impression of much greater coverage than actually exists.
As previously mentioned, the vast majority of the world ocean has not been sampled by echo sounders even at a resolution of about 30 arc seconds. Considering that many of the approximately 1 km grid cells only have a single sounding in them, the percentage of the seafloor that has actually been measured by echo-sounders is considerably less than 18%.
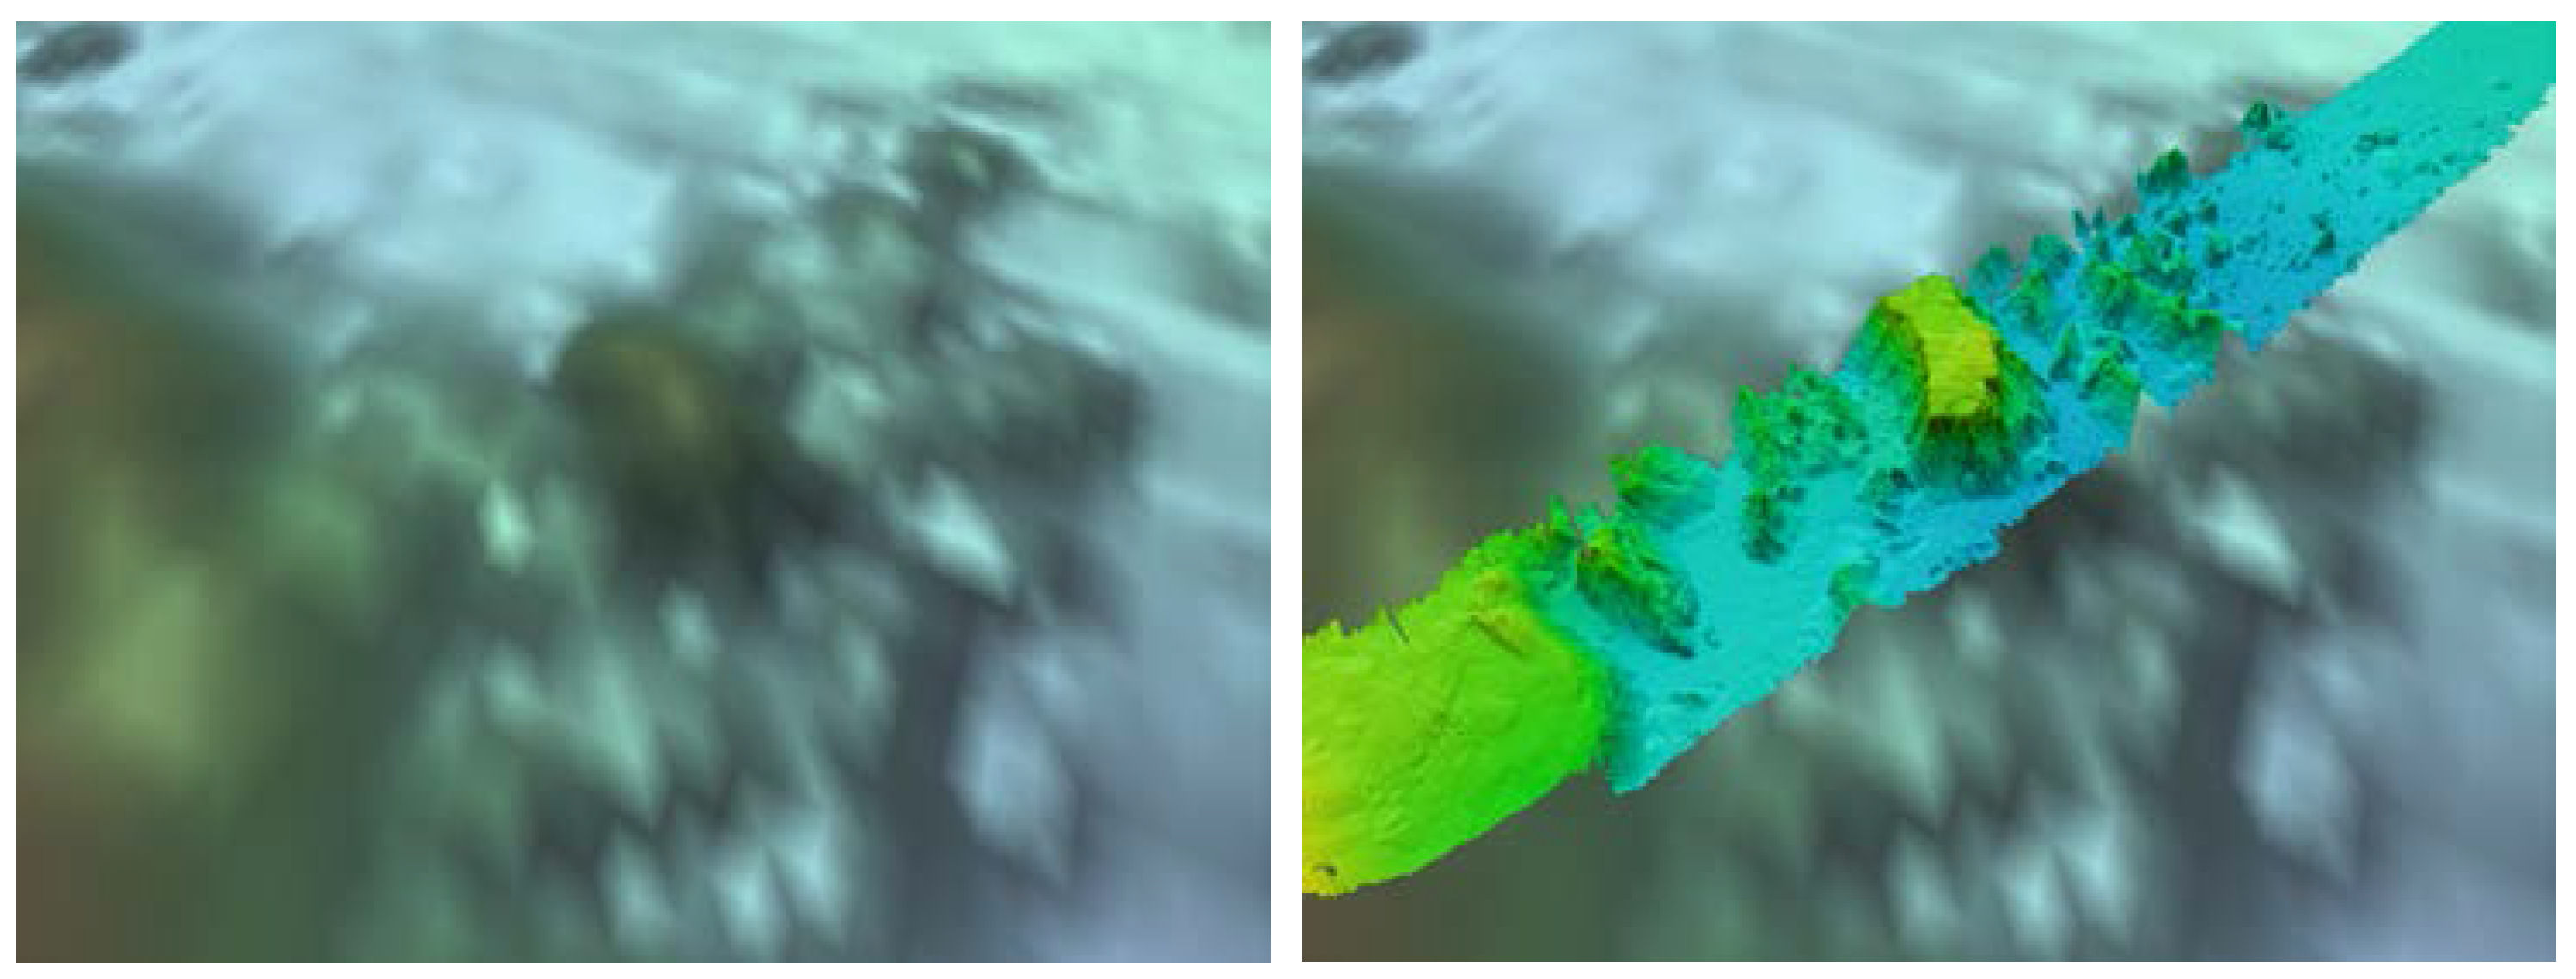
Between track-lines, large areas of the GEBCO_2014 grid are based on interpolation guided by satellite altimetry-derived bathymetry data except in most of the two polar regions where sea ice precludes the use of satellite altimetry-derived data. GEBCO_2014 started with the base grid from the previous GEBCO_08 version, which included the altimetry-derived bathymetry model SRTM30_PLUS [
25]. Satellite altimetry-derived bathymetry has represented a remarkable advancement in our mapping of oceans, providing global coverage of general estimates of depths and coarsely filling gaps between sparse ship soundings [
2]. Satellite altimetry-derived bathymetry is, however, far less precise than echo sounder-derived data and has far less resolution than modern multibeam sonars, but the method is objective and, in most areas without sea ice, superior to interpolation between sparse ship tracks by mathematical algorithms or hand-contouring. Altimetry-derived data are particularly good for mapping tectonic-scale features such as spreading ridge segments and the fracture zones that offset them, but much finer-scale features and accurate depths are often difficult to derive (
Figure 4).
The achievable resolution of a bathymetric model (grid) is a function of the underlying data density—in the case of the GEBCO_2014 grid, the coverage of satellite tracks for depth estimates and ship soundings. Ship-borne multibeam surveys collect depth measurements at very high density and may be designed with overlapping swaths to provide full map coverage. When multibeam data are incorporated into a bathymetry model, their very high-lateral resolution (70 m × 140 m for a 1° × 2° multibeam system in 4000 m water depth) and high data density (up to 800 soundings across a 20 km wide swath in 4000 m water depth) improves the resolution of seafloor details (
Figure 4). If one only displays the multibeam bathymetry data included in the GEBCO_2014 grid, the global coverage is greatly reduced as compared to the plot of all bathymetric data (
Figure 3 and
Figure 5). Approximately 9% of the seafloor is covered by high-resolution multibeam sonar data, but for this 9%, the seafloor is truly covered. This implies that even if an analysis of the existing bathymetric coverage incorporated into the GEBCO-2014_grid reveals that 18% of the approximately 1 km
2 grid cells have at least one sounding in them, only about 9% are covered with high-resolution multibeam sonar data. This does not mean that all of the 1 km
2 grid cells in the 9% are filled with multibeam sonar data just that some multibeam data are present in the 1 km
2 grid cell. Thus, the actual global coverage of multibeam sonar data is even less than 9% of the seafloor. The harsh reality is that there is desperately little knowledge of the depths of the oceans and thus the motivation for the Nippon Foundation—GEBCO Seabed 2030 Project.
2.2. At What Resolution Should We Map the Seafloor?
As we plan for the Nippon Foundation—GEBCO Seabed 2030 Project, we must address the question “at what resolution should we be mapping the seafloor?” Ideally, one would want a resolution commensurate with that at which our land surfaces are mapped (sub-meter resolution). While this would be ideal, the limited propagation of electromagnetic waves in the ocean must be considered, and thus achieving sub-meter resolution with either acoustic or optical systems requires that the mapping system be within tens of meters of the seafloor. This is technologically achievable with surface vessels operating in shallow water environments. However, more than 90% of the ocean is deeper than 200 m water depth, and this would require the delivery of the measurement system close to the seafloor by either remotely operated vehicles (ROV) or autonomous underwater vehicles (AUV). Such systems are available and are capable of collecting very high-resolution acoustic or optical data near the bottom; however, at present, given their expense and slow speed of operation, both ROVs and AUVs are not realistic options for global mapping. This may change in the future (see new technology section below); however, if we truly aspire to global coverage, we will continue to rely largely on surface vessels, which will dictate achievable spatial resolution.
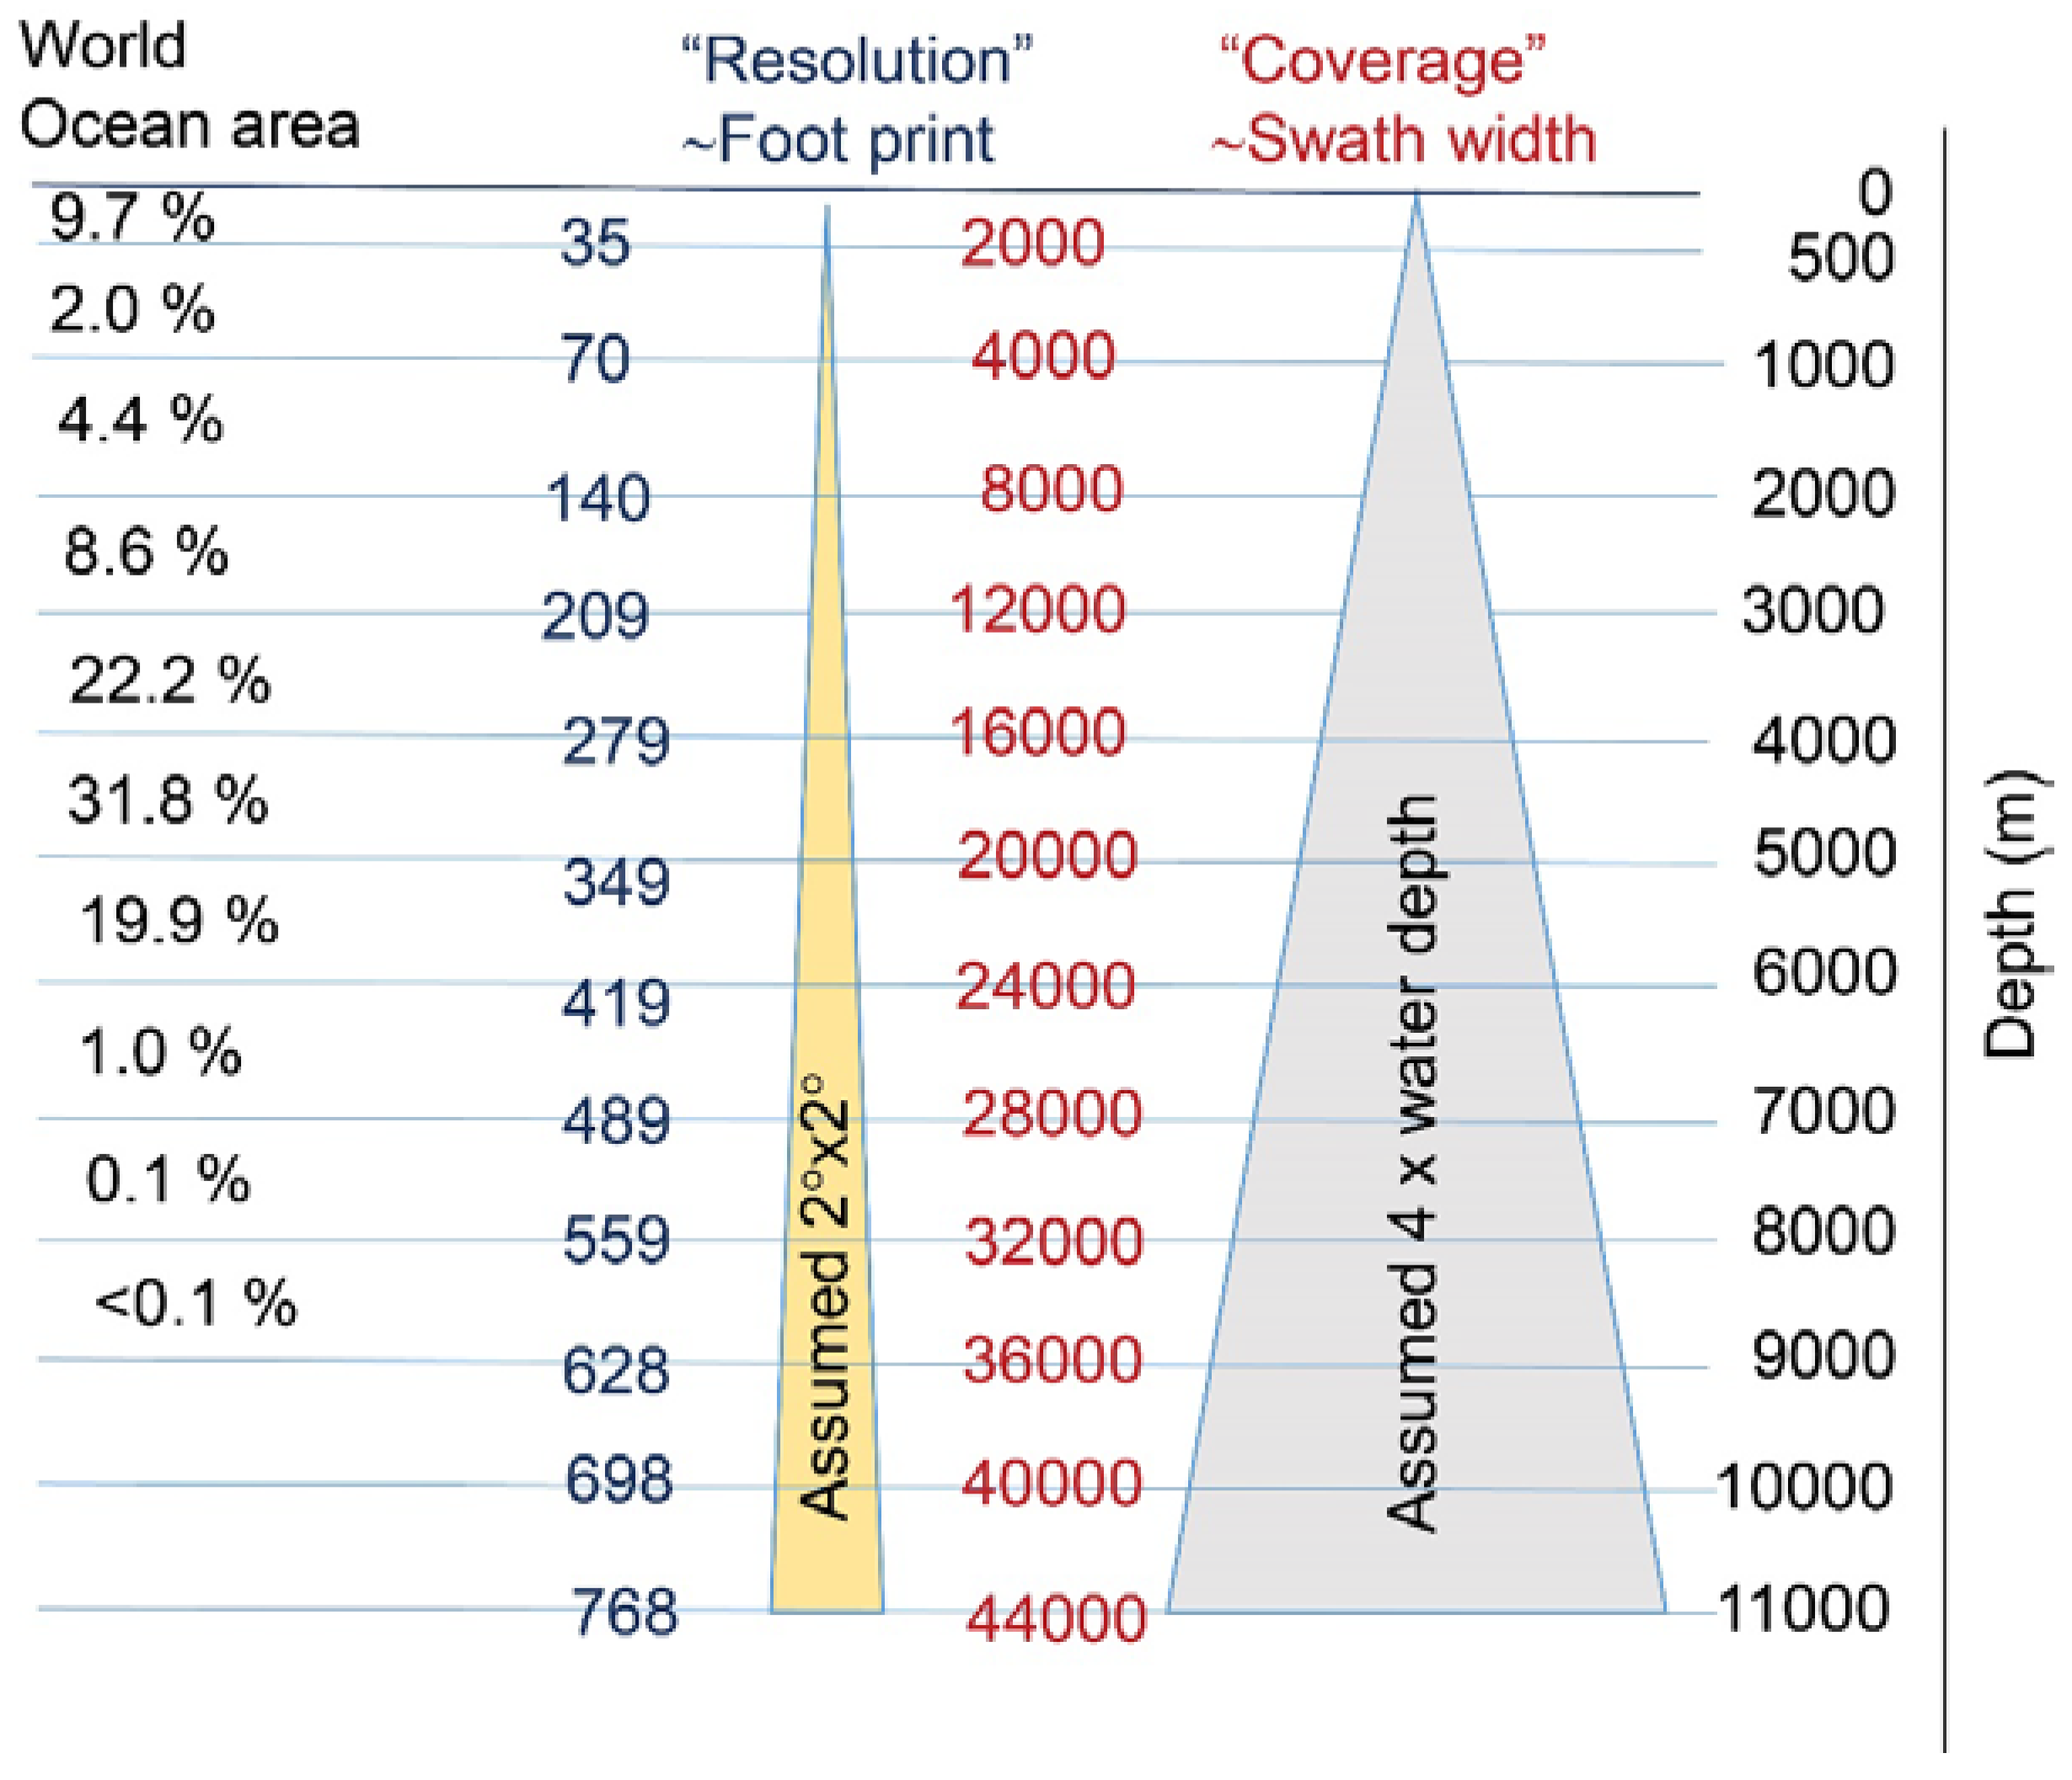
Any discussion of seafloor mapping resolution must be presented in the context of changing depths, and as the effort to map the world’s oceans is global, the resolution specified for a given sonar system must vary as a function of depth (
Table 1). With the hope that much of the new data collected in support of the Nippon Foundation—GEBCO Seabed 2030 Project will be multibeam sonar data, we look at the achievable beam footprints for a range of water depths along with the percentage of seafloor area in each depth bin. Since few multibeam systems are 1° × 1° configuration, we have adopted a conservative approach and base the achievable mapping resolution on a 2° × 2° system deep water system (
Table 1). Furthermore, as the beams are steered away from nadir, their footprints expand, decreasing the lateral resolution on the seafloor across the swath; at 60° from nadir (approximately 1.7 times the water depth) on each side, the beam footprint is double that found at nadir (
Figure 6).
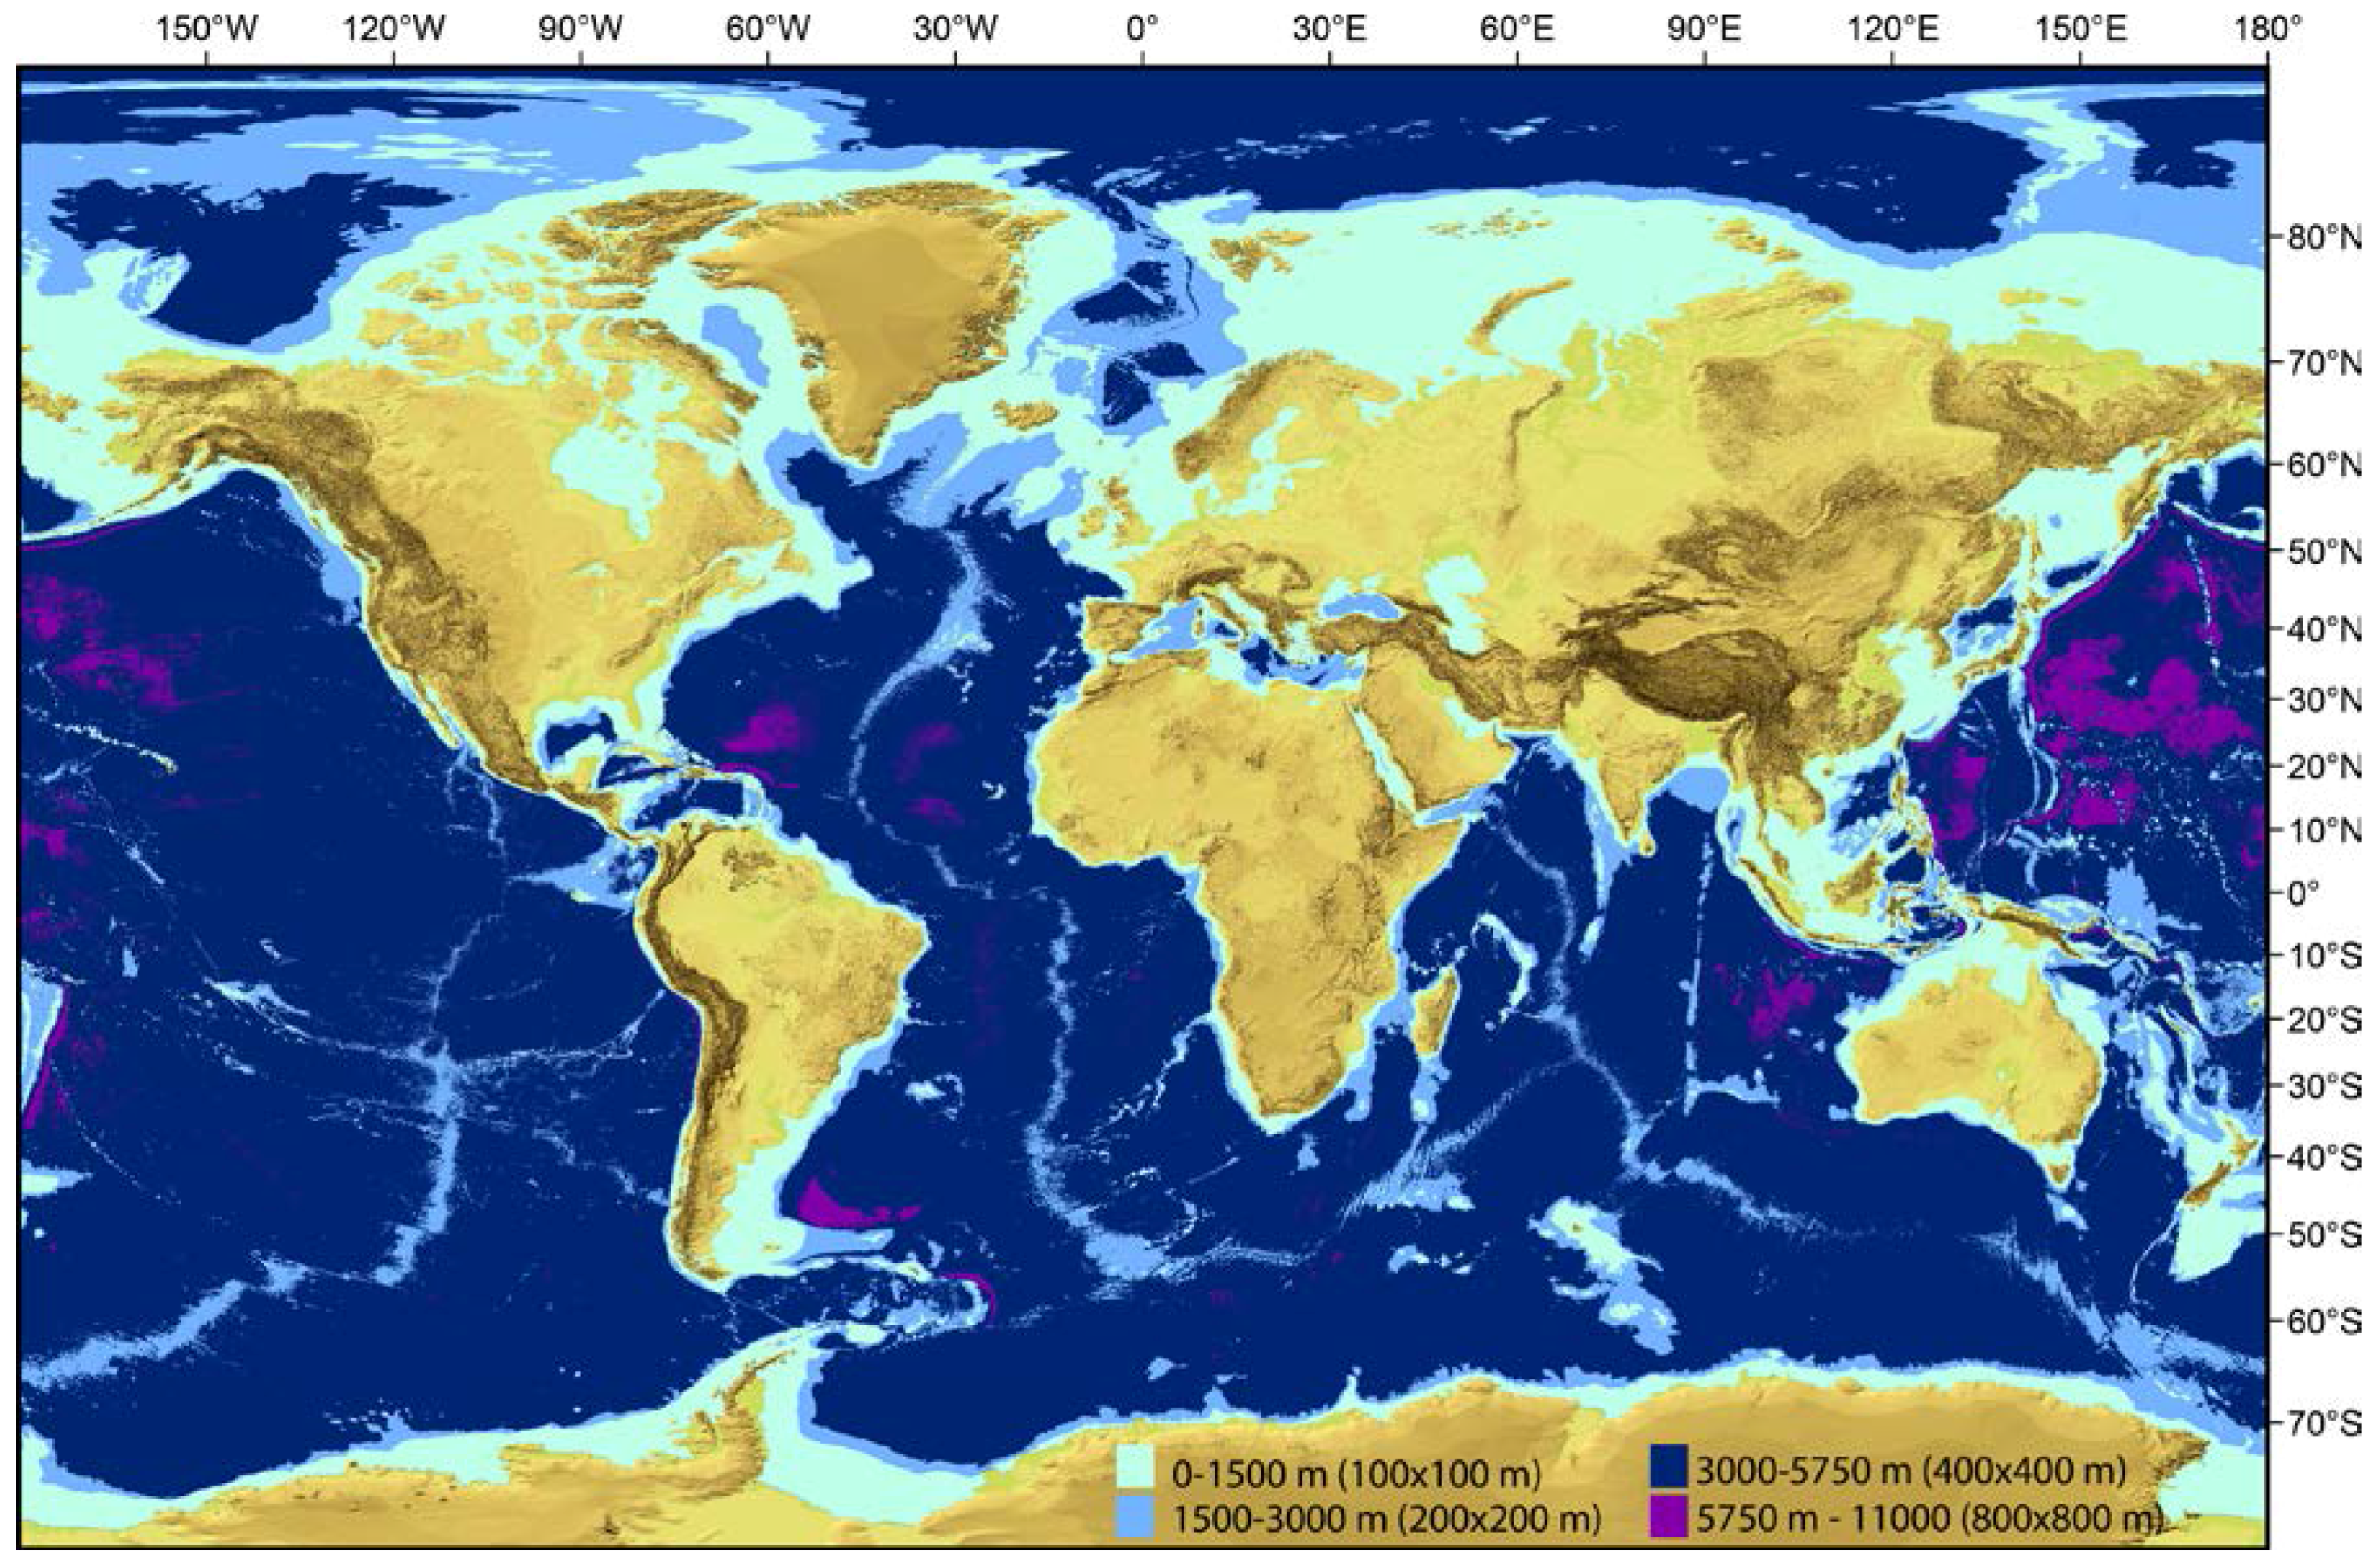
Considering that high-quality multibeam sonar data typically can be retrieved to a maximum swath width of about four times the water depth we will adopt a feasible resolution that is constrained by the worst-case solution of the near outermost beams (at about 60° to either side of nadir). Thus, for the Nippon Foundation GEBCO Seabed 2030 Project, we will establish a depth-variable resolution goal and consider the seafloor “mapped” if at least one sounding falls in a grid cell of the size described in
Table 2. The depth regions corresponding to the calculated feasible grid resolutions are shown in
Figure 7.
The needs of the broad community of stakeholders who use deep ocean bathymetry vary with respect to required resolution. Mapping at the resolutions described above may not serve all needs; however, baseline bathymetry from the Nippon Foundation GEBCO Seabed 2030 Project will help identify those regions where higher-resolution data may be required. It will also serve as a baseline against which additional surveys can be compared to better understand processes that can change the seafloor in some regions.
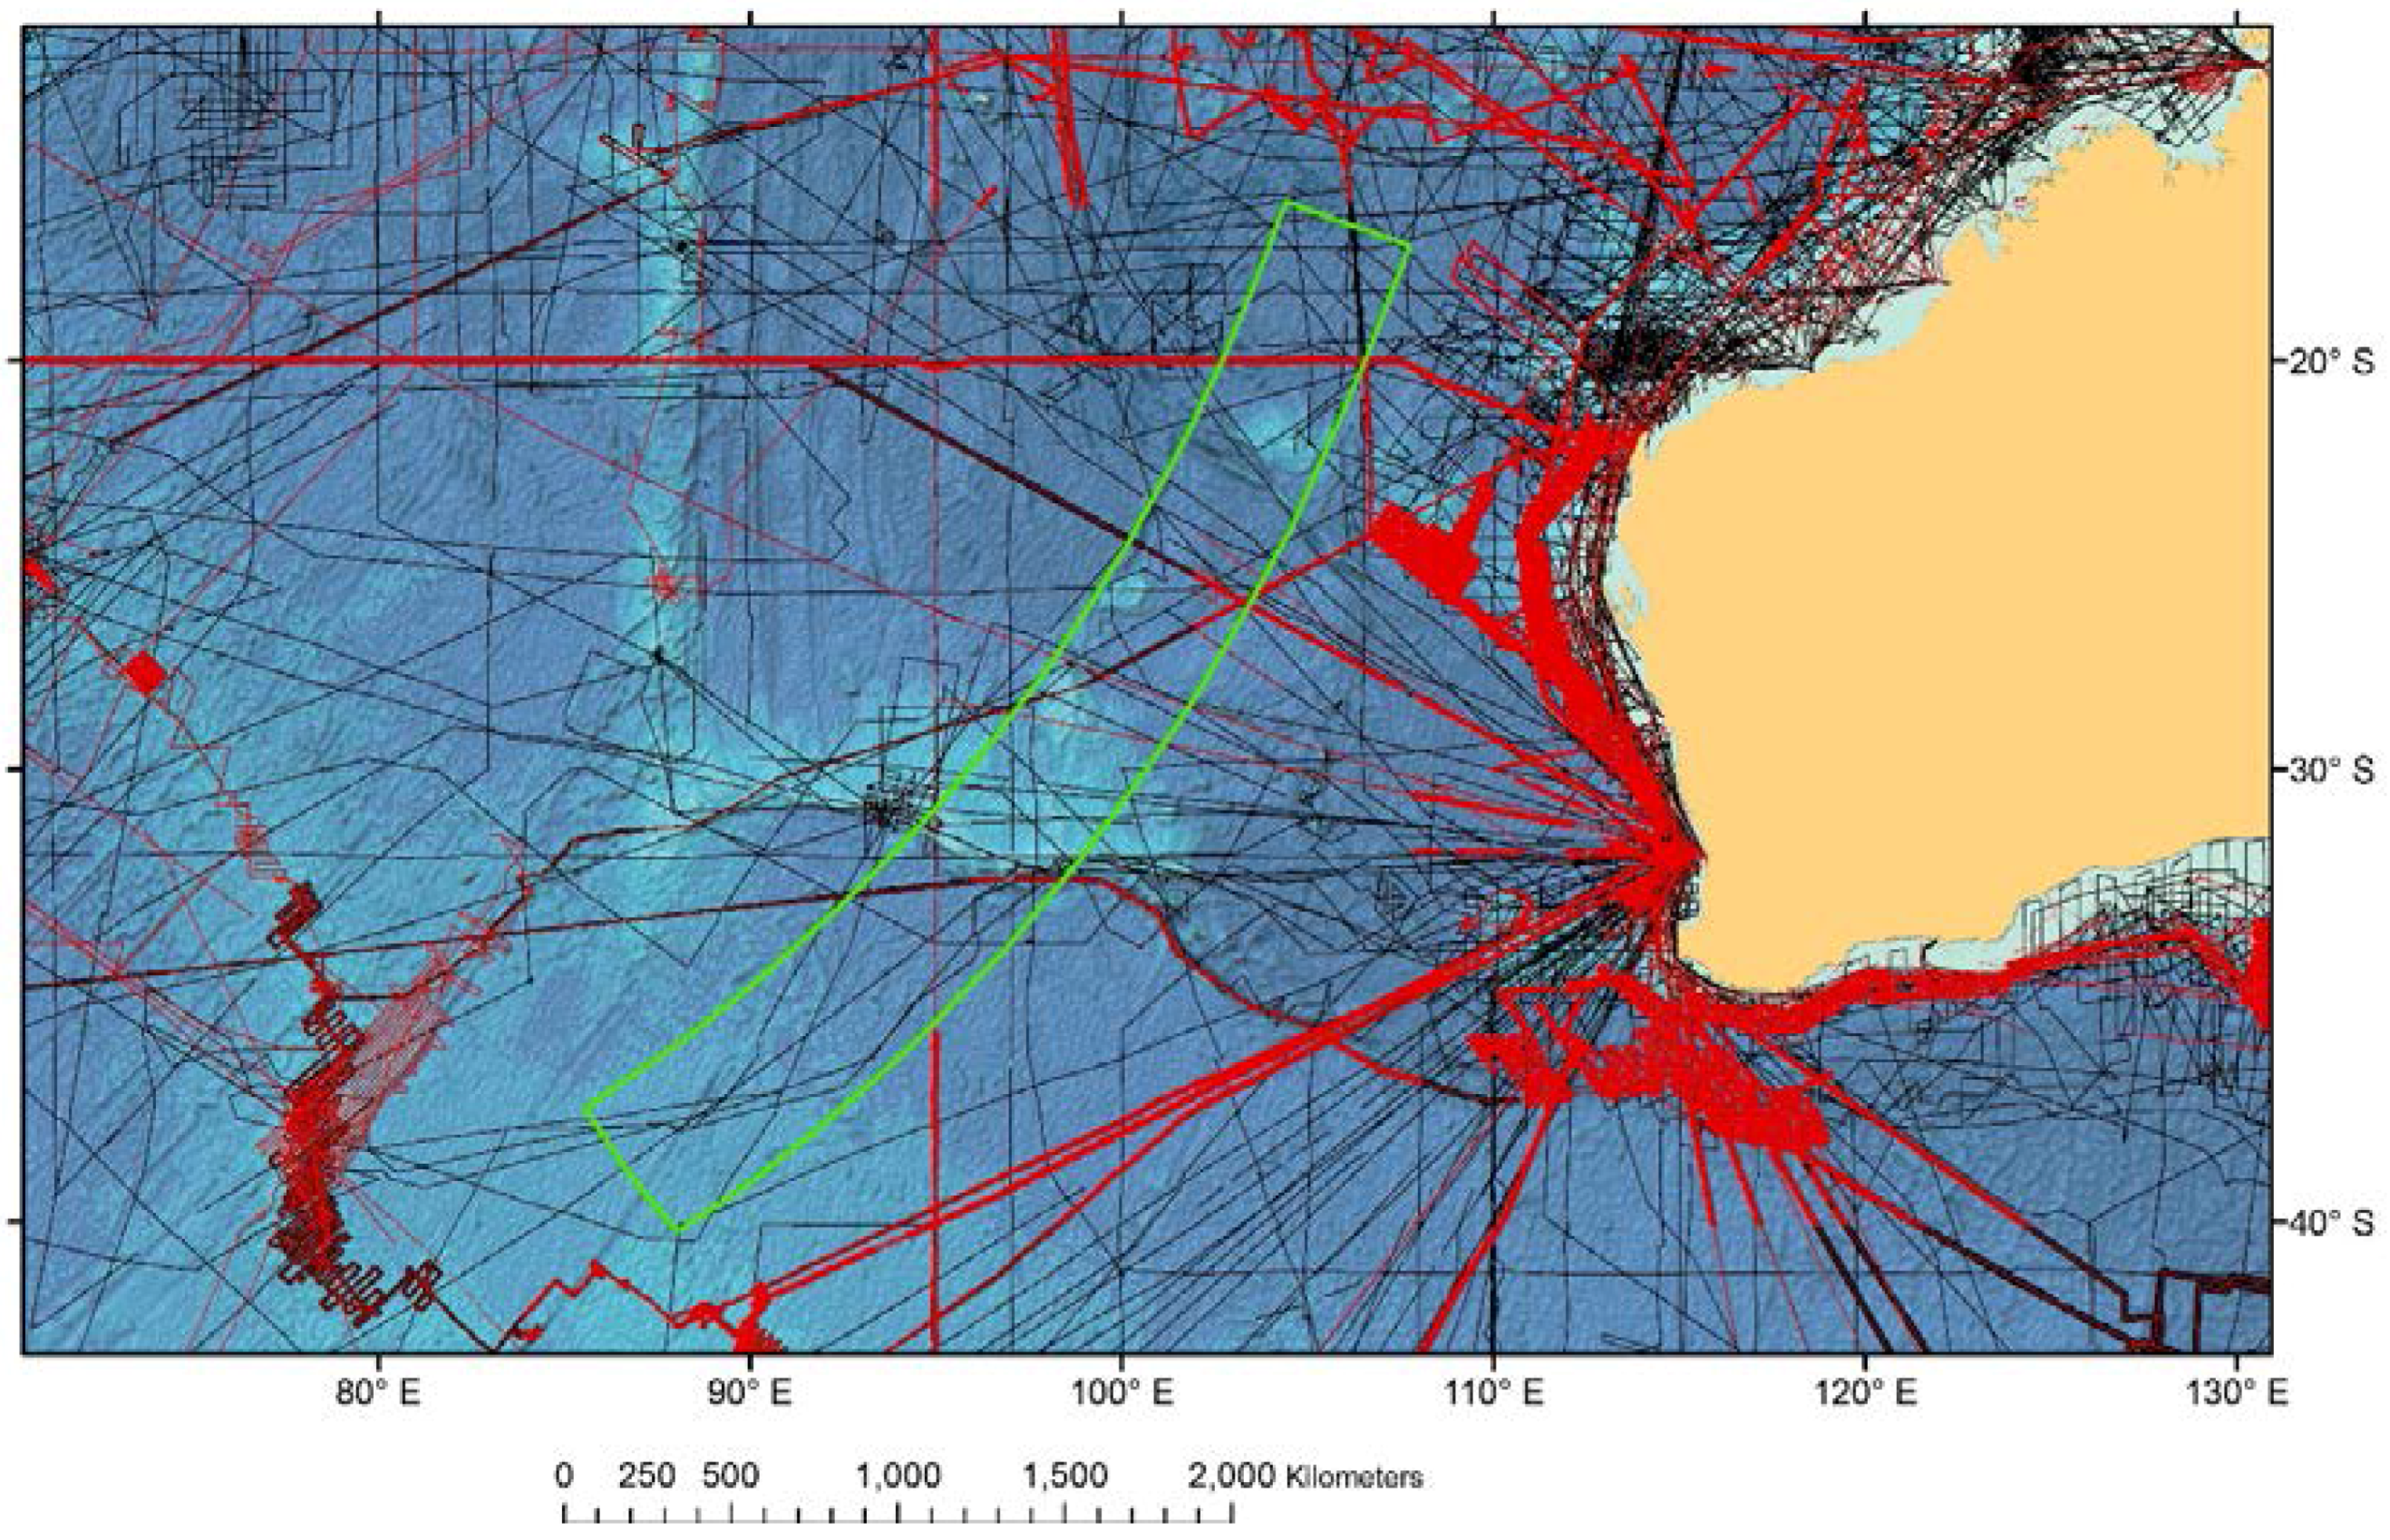
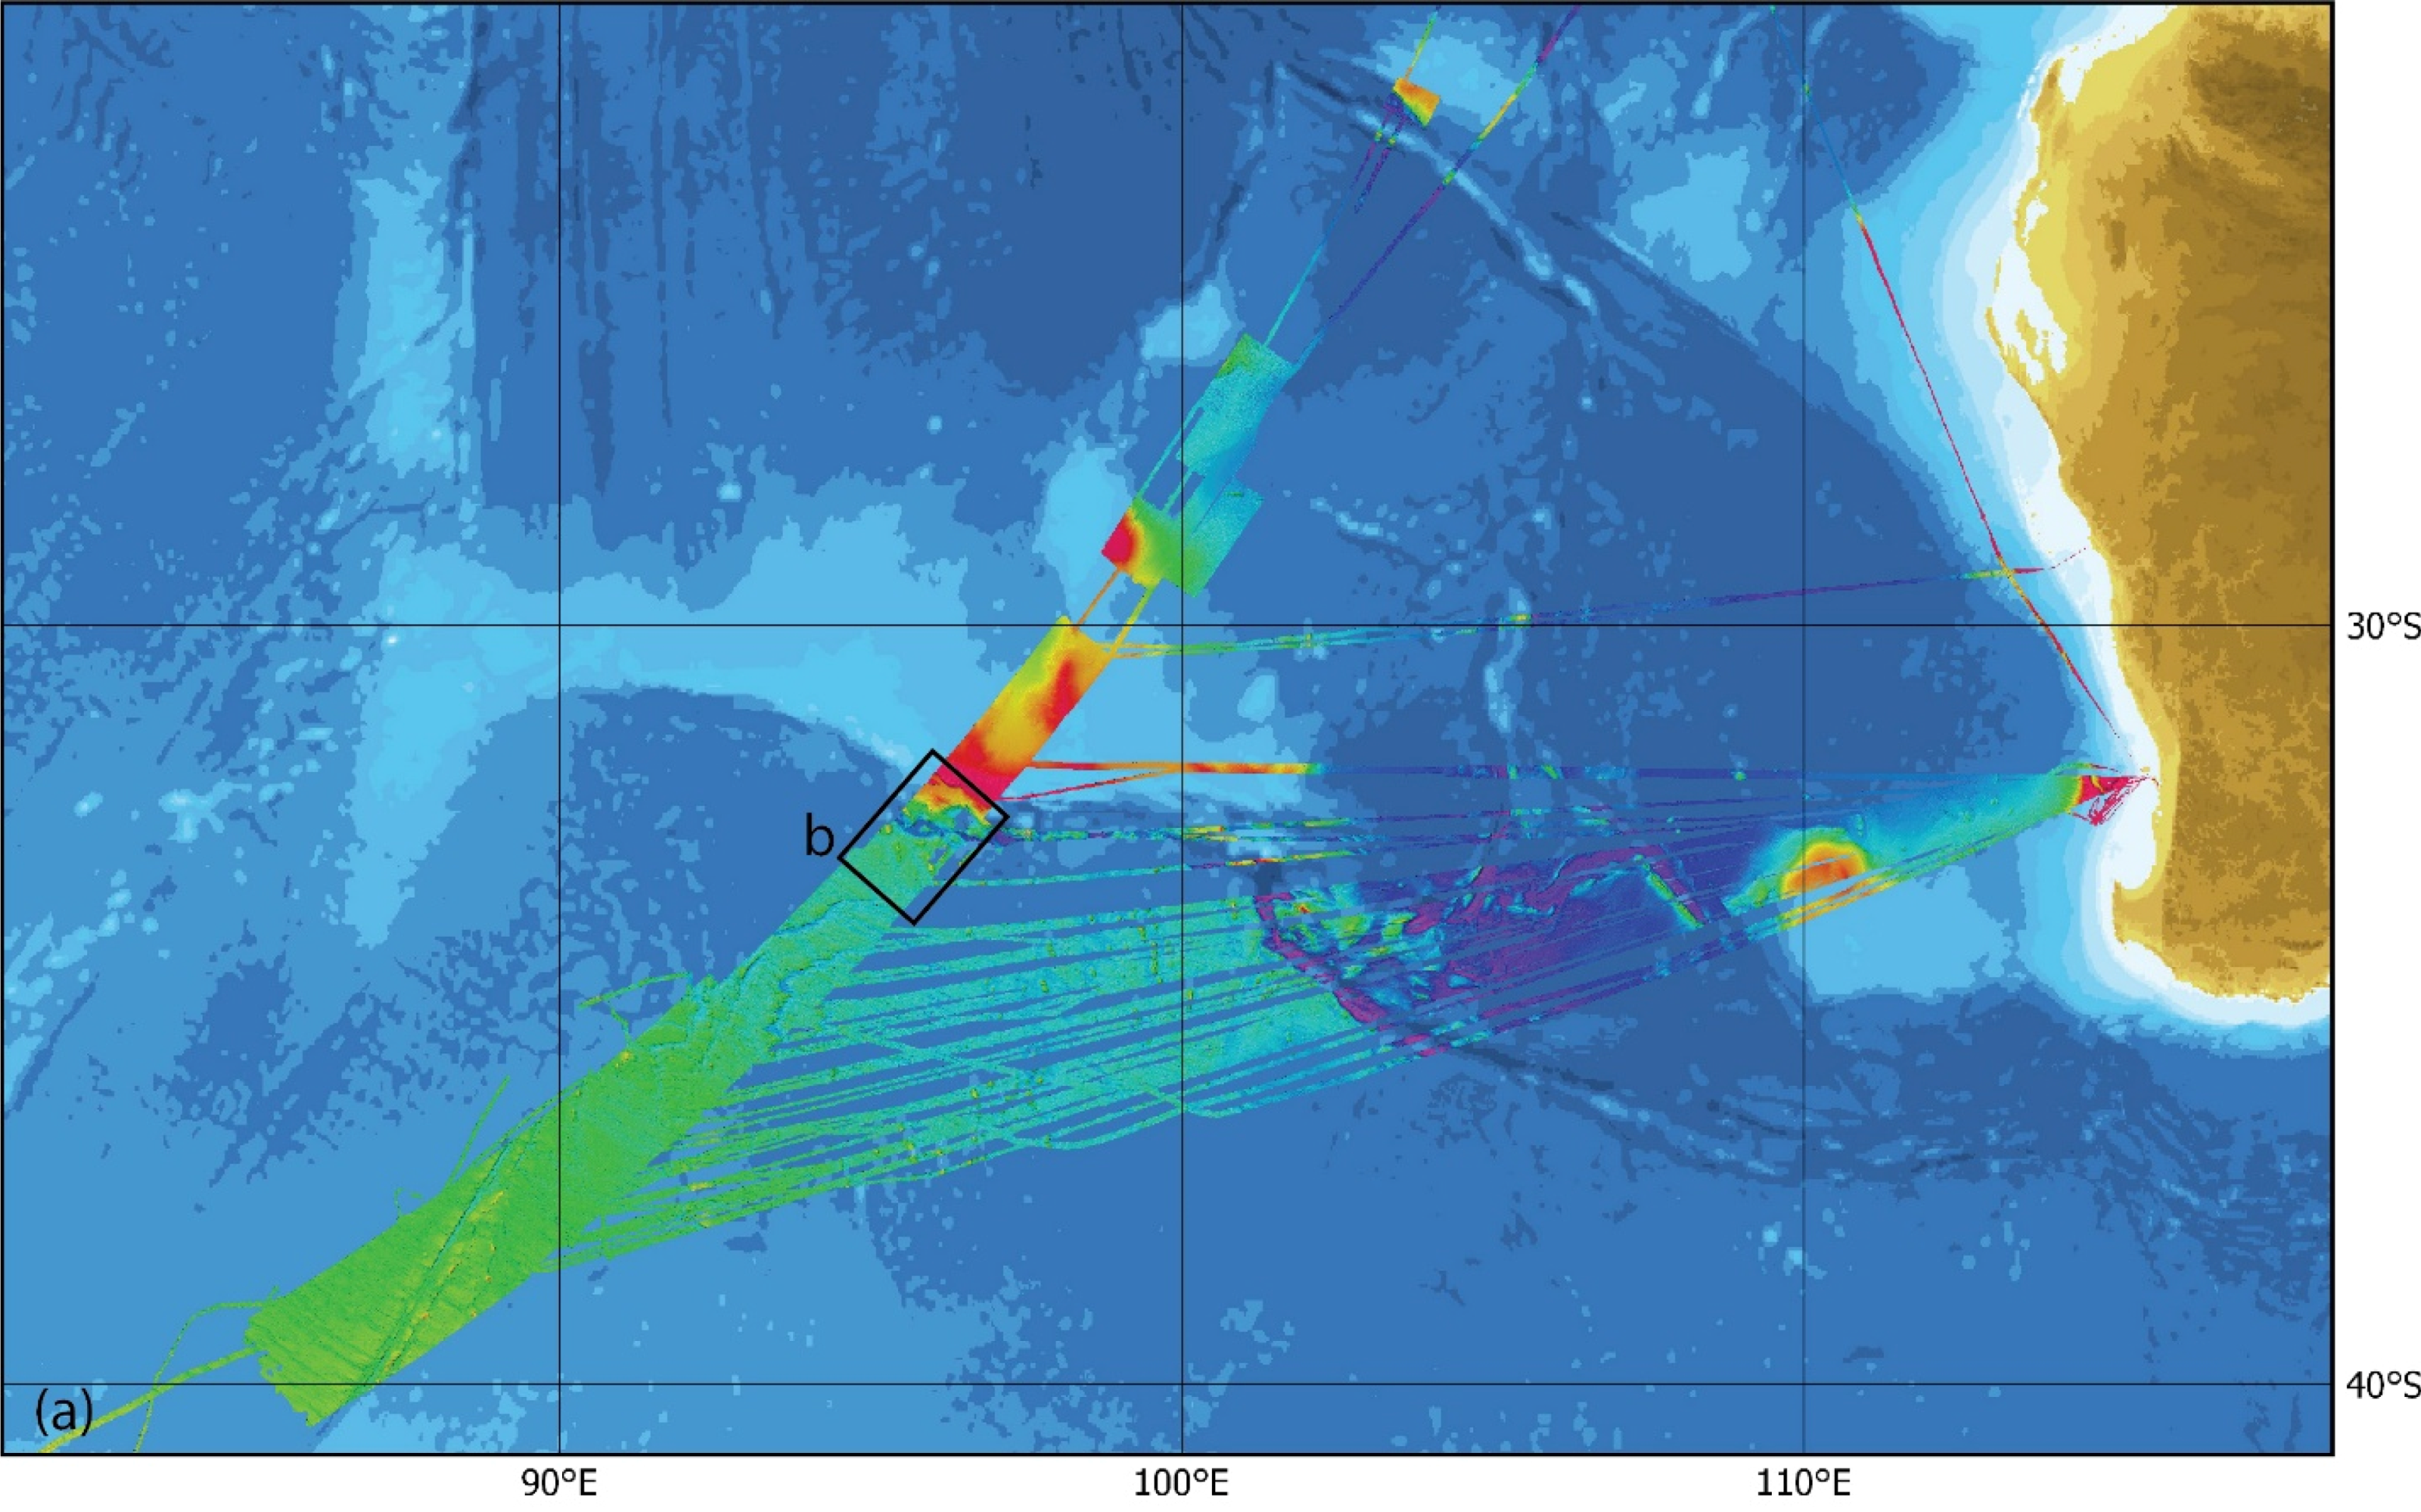
The inadequacy of our current baseline knowledge of seafloor bathymetry became particularly evident in the search for the Malaysia Airlines flight MH370, which disappeared 8 March 2014 (
Figure 8). The satellite altimetry predicted bathymetry and database of available soundings in the southeastern Indian Ocean at the time of the crash proved so sparse that it was impossible to deploy the AUVs needed to find the wreckage without first conducting new surface ship deployed multibeam sonar bathymetric surveys [
26,
27]. The search for MH370 facilitated the collection of ~710,000 km
2 of new surface ship-derived multibeam sonar data representing a remarkable improvement and addition to Indian Ocean bathymetry (
Figure 9) as well as many new insights into the geology of the southeastern Indian Ocean [
27].
2.3. What Is the Magnitude of the Task?
Mapping the world ocean from surface vessels is a costly and time-consuming endeavor of global extent that is best achieved through international coordination. Through analyses of the present GEBCO bathymetric database [
1], we can make a first-hand approximation of the mapping effort needed to obtain a continuous grid of bathymetric information at any given resolution. To assess feasible scales of resolution, GEBCO_2014 grid nodes originating from altimetry were selected using the Source Identification (SID) grid produced during the compilation of GEBCO_2014. The grid nodes were converted to surfaces and classified into water depth intervals that represent the broad geomorphological features of the continental shelf, continental slope, and deep sea area, in recognition that modern multibeam techniques and coverage are highly dependent on the water depth (
Table 3). Using this depth distribution, the effort required to completely map the seafloor was calculated.
In order to compute an estimate of surveying effort given in
Table 3, the following assumptions were made: (1) for each water depth interval, the average value was used to represent the distribution; (2) this average water depth is multiplied by a factor representing the projection of the swath width of a multibeam system on the seafloor using the conservative estimate of 3.5 times the water depth, and; (3) the speed of the survey vessel is considered to be 7.5 knots (~10 km/h). This speed value is also very conservative. However, it is used to compensate for the time needed for maneuvering, adverse weather conditions, deployment of auxiliary sensors (e.g., tide gauges principally in shallow waters, sound velocity profiling), and transiting, which in the high seas will be significant. The analyses have been carried out using the GEBCO_2014 grid with a resolution of 30 arc seconds as a base, and the grid cells with depth values from single-beam echo soundings have also been considered mapped. For this reason, the result may be underestimating the required survey time rather than overestimating it.
Using the assumptions stated above implies that ~970 years would be required to survey the area of the GEBCO_2014 grid today unconstrained by any sounding with a single survey ship. Of this, however, ~620 years represent the time required to survey the shallow areas between 0 and 200 m depth, indicative of the ever lessening swath coverage as water depths decrease. Thus, 64% of the projected survey time is required to cover only 7% of the world’s seafloor that is less than 200 m deep. Recognizing this, and the fact that these shallow seas lie mostly in the territorial waters of coastal states and thus much of the responsibility for mapping these shallow waters will rest with local hydrographic agencies, most of the effort of the Nippon Foundation GEBCO Seabed 2030 Project will be focused on the 93% of the world’s oceans that is deeper than 200 m and often beyond the jurisdiction of local hydrographic agencies. Thus, the prime target for the Nippon Foundation GEBCO Seabed 2030 Project will be the approximately 350 ship years of effort required to map the 93% of the world ocean floor deeper than 200 m. Considering that there are currently more than 700 multibeam systems on survey vessels operated by national hydrographic offices, research institutions or private entities in the world (as estimated in 2003 by the IHO) the remaining surveying effort appears to be a reachable goal. For the other seven percent, The Nippon Foundation GEBCO Seabed 2030 Project, will take advantage of its connections with GEBCO and the IHO to work closely with local hydrographic agencies to obtain shallow water data wherever possible.
Coastal states are generally responsible for mapping the regimes over which they have sovereign rights or obligations. Legal regimes cover areas that include the Territorial Seas up to 12 NM, the Exclusive Economic Zone (EEZ) to 200 NM from the coastline, and the limits of the juridical continental shelf (often referred to as the Extended Continental Shelf (ECS)), a legal definition of the continental shelf that can extend the sovereign rights of a coastal state well beyond 200 NM in some cases as per the United Nations Convention on Law of the Sea (UNCLOS). The establishment of the limits of the juridical continental shelf is based on the presentation of detailed mapping data to the Commission on the Limits of the Continental Shelf. This has led many coastal states to undertake ambitions seafloor mapping programs. These programs, as is the case, e.g., New Zealand, have often morphed into national mapping programs and can be a potential source of new mapping data into a global compilation. The total areas of ocean that are not under state jurisdiction, however, (The Area) still represents ~50% (188,000,888 km
2) of the total Earth surface covered by seas and oceans [
28]. For those states who do not have well-developed mapping programs, the products of the Nippon Foundation—GEBCO Seabed 2030 Project may help them meet their Law of the Sea requirements.
It is important also to consider, that our estimation is based on GEBCO’s bathymetric database at the time of the compilation of the GEBCO_2014 grid. While we believe that this is the most complete bathymetric database available, we are fully aware that it is far from including all bathymetric data that has been collected (e.g., most ECS data collected by coastal states has not yet been made available to international data repositories). Identifying and retrieving data that has already been collected but that is not yet available for global compilations is thus another critical component of the Nippon Foundation GEBCO Seabed 2030 Project, highlighting the need for increased national and international collaboration and the coordination of regional and global bathymetric mapping initiatives.
3. Structure of the Nippon Foundation—GEBCO Seabed 2030 Project
To achieve its goal, the Seabed 2030 team will need to compile all available bathymetric data into a high-quality, high-resolution digital model. Inasmuch as bathymetric data and survey activities are dispersed across many countries and organizations, including governmental agencies, industry, academia and research organizations, the Nippon Foundation—GEBCO—Seabed 2030 Project will act as a coordinating body for aggregating existing data and prioritizing survey operations through the development of tools and products that highlight gaps in data coverage and facilitate new mapping expeditions, specifically targeting the poorest mapped areas.
The project sits within the existing and well-functioning IHO-IOC GEBCO framework making full use of existing bodies such as the GEBCO Sub-Committee on Regional Undersea Mapping (SCRUM), the Technical Sub-Committee on Ocean Mapping (TSCOM), the Sub-Committee for Regional Undersea Feature Names (SCUFN) and the newly founded Sub-Committee on External Relations and Communications. This structure will support Seabed 2030, by contributing to the governance structure and allowing it to benefit from the large networks already provided by the IHO and IOC. This is particularly important since all hydrographic offices of IHO’s member states, with their mandate to map within their countries’ territories, become de facto partners in the effort. Without the collaboration of the world’s hydrographic offices, there is little chance of reaching the goal of portraying the world ocean bathymetry. IOC, on the other hand, is a self-standing body within UNESCO with a mandate to organize marine science within the UN system. This provides Seabed 2030 with a strong global network that reaches beyond the hydrographic agencies and includes the broader marine scientific community that also collects and utilizes ocean bathymetry.
The project structure is based on GEBCO’s experience working with Regional Mapping Projects (e.g., IBCAO and IBCSO) that have contributed substantially to GEBCO by delivering regional bathymetric gridded compilations. Seabed 2030 is divided into four regions (
Figure 1) for which data assembly, processing, and compilation fall under the responsibility of a dedicated team of experts based at globally distributed institutions that we call Regional Data Assembly and Coordination Centers (RDACC) each working in coordination with a Regional Mapping Committee:
The North Pacific and Arctic Oceans Center, based at the University of Stockholm, Sweden and University of New Hampshire, USA
The South and West Pacific Oceans Center based at the National Institute of Water and Atmospheric Research (NIWA), Wellington, New Zealand
The Atlantic and Indian Oceans Center (Lamont Doherty Earth Observatory, Palisades, NY, USA)
The Southern Ocean Center (Alfred Wegner Institute, Bremerhaven, Germany)
The RDACCs will be responsible for assembling a regional database of cleaned bathymetric data and the production of a regional bathymetric grid for incorporation into the ultimate product of the project, the Nippon Foundation GEBCO Seabed 2030 global grid. A Global Data Assembly and Coordination Center (GDACC), located at the British Oceanographic Data Center at the National Oceanographic Center in Southampton, U.K., will ultimately be responsible for assembling the regional grids and producing and delivering the Seabed 2030-GEBCO gridded product through the Internet. The GDACC will host and maintain the Seabed 2030-GEBCO website (
https://seabed2030.gebco.net/) including sub-pages for the RDACCs as well as be responsible for handling user inquiries regarding the Seabed 2030 website and products.
Beyond the identification, assembly and processing of existing data sets, the RDACCs will also be responsible for identifying data gaps and opportunities for new data collection, including the facilitation of new mapping endeavors through coordination of ongoing activities among stakeholders in the region. Importantly the RDACC will not be a permanent archive, repository or distributor of the data they are assembling. As such, the RDACC will not be duplicating the responsibilities of existing data centers or data compilation efforts such as NCEI, GMRT or EMODNET, but rather will work with them as both a contributor and recipient of data.
Each RDACC will also establish a Regional Mapping Committee, a group of regional experts who will work with the RDACC in identifying sources and facilitating the collection of bathymetric data in the region. As the RDACCs build connections in their regions, they will have the benefit of more than 78 graduates of the Nippon Foundation-GEBCO training program in ocean bathymetry at the University of New Hampshire’s Center for Coastal and Ocean Mapping. Over the past thirteen years this program has trained students from more than 34 countries, many of whom now occupy senior positions at hydrographic agencies, navies, and mapping centers around the world. Another potential source of data to the RDACCs is the private sector, which may be able to provide data collected during transit between commercial surveys (already being done by Fugro) or data sets whose commercial value has depreciated.
4. New Technologies
While the initial efforts of the Nippon Foundation GEBCO Seabed 2030 Project will focus on the identification and assembly of existing data sets, identifying key data gaps, and facilitating new data collection, it will also promote the development of new technologies that may increase the efficiency, accuracy, and resolution of seafloor mapping data. Seafloor mapping technology has been advancing at a rapid pace since the invention of the echosounder in the late 1920s. Over the past few years, multibeam sonars have steadily increased the number of beams that ensonify the seafloor and the density of their measurements (both along- and across-track), improved their ability to compensate for ship motion and invoked enhanced bottom detection techniques that have greatly improved the quality of the data being collected. In shallow water, when water clarity permits, bathymetric LIDAR (LIght Detection and Ranging) and satellite-derived bathymetry (bathymetry from satellite imagery as opposed to satellite altimetry-derived bathymetry which comes from the gravity field) have provided efficient ways to produce estimates of bathymetry in regions where multibeam sonar mapping is much less efficient.
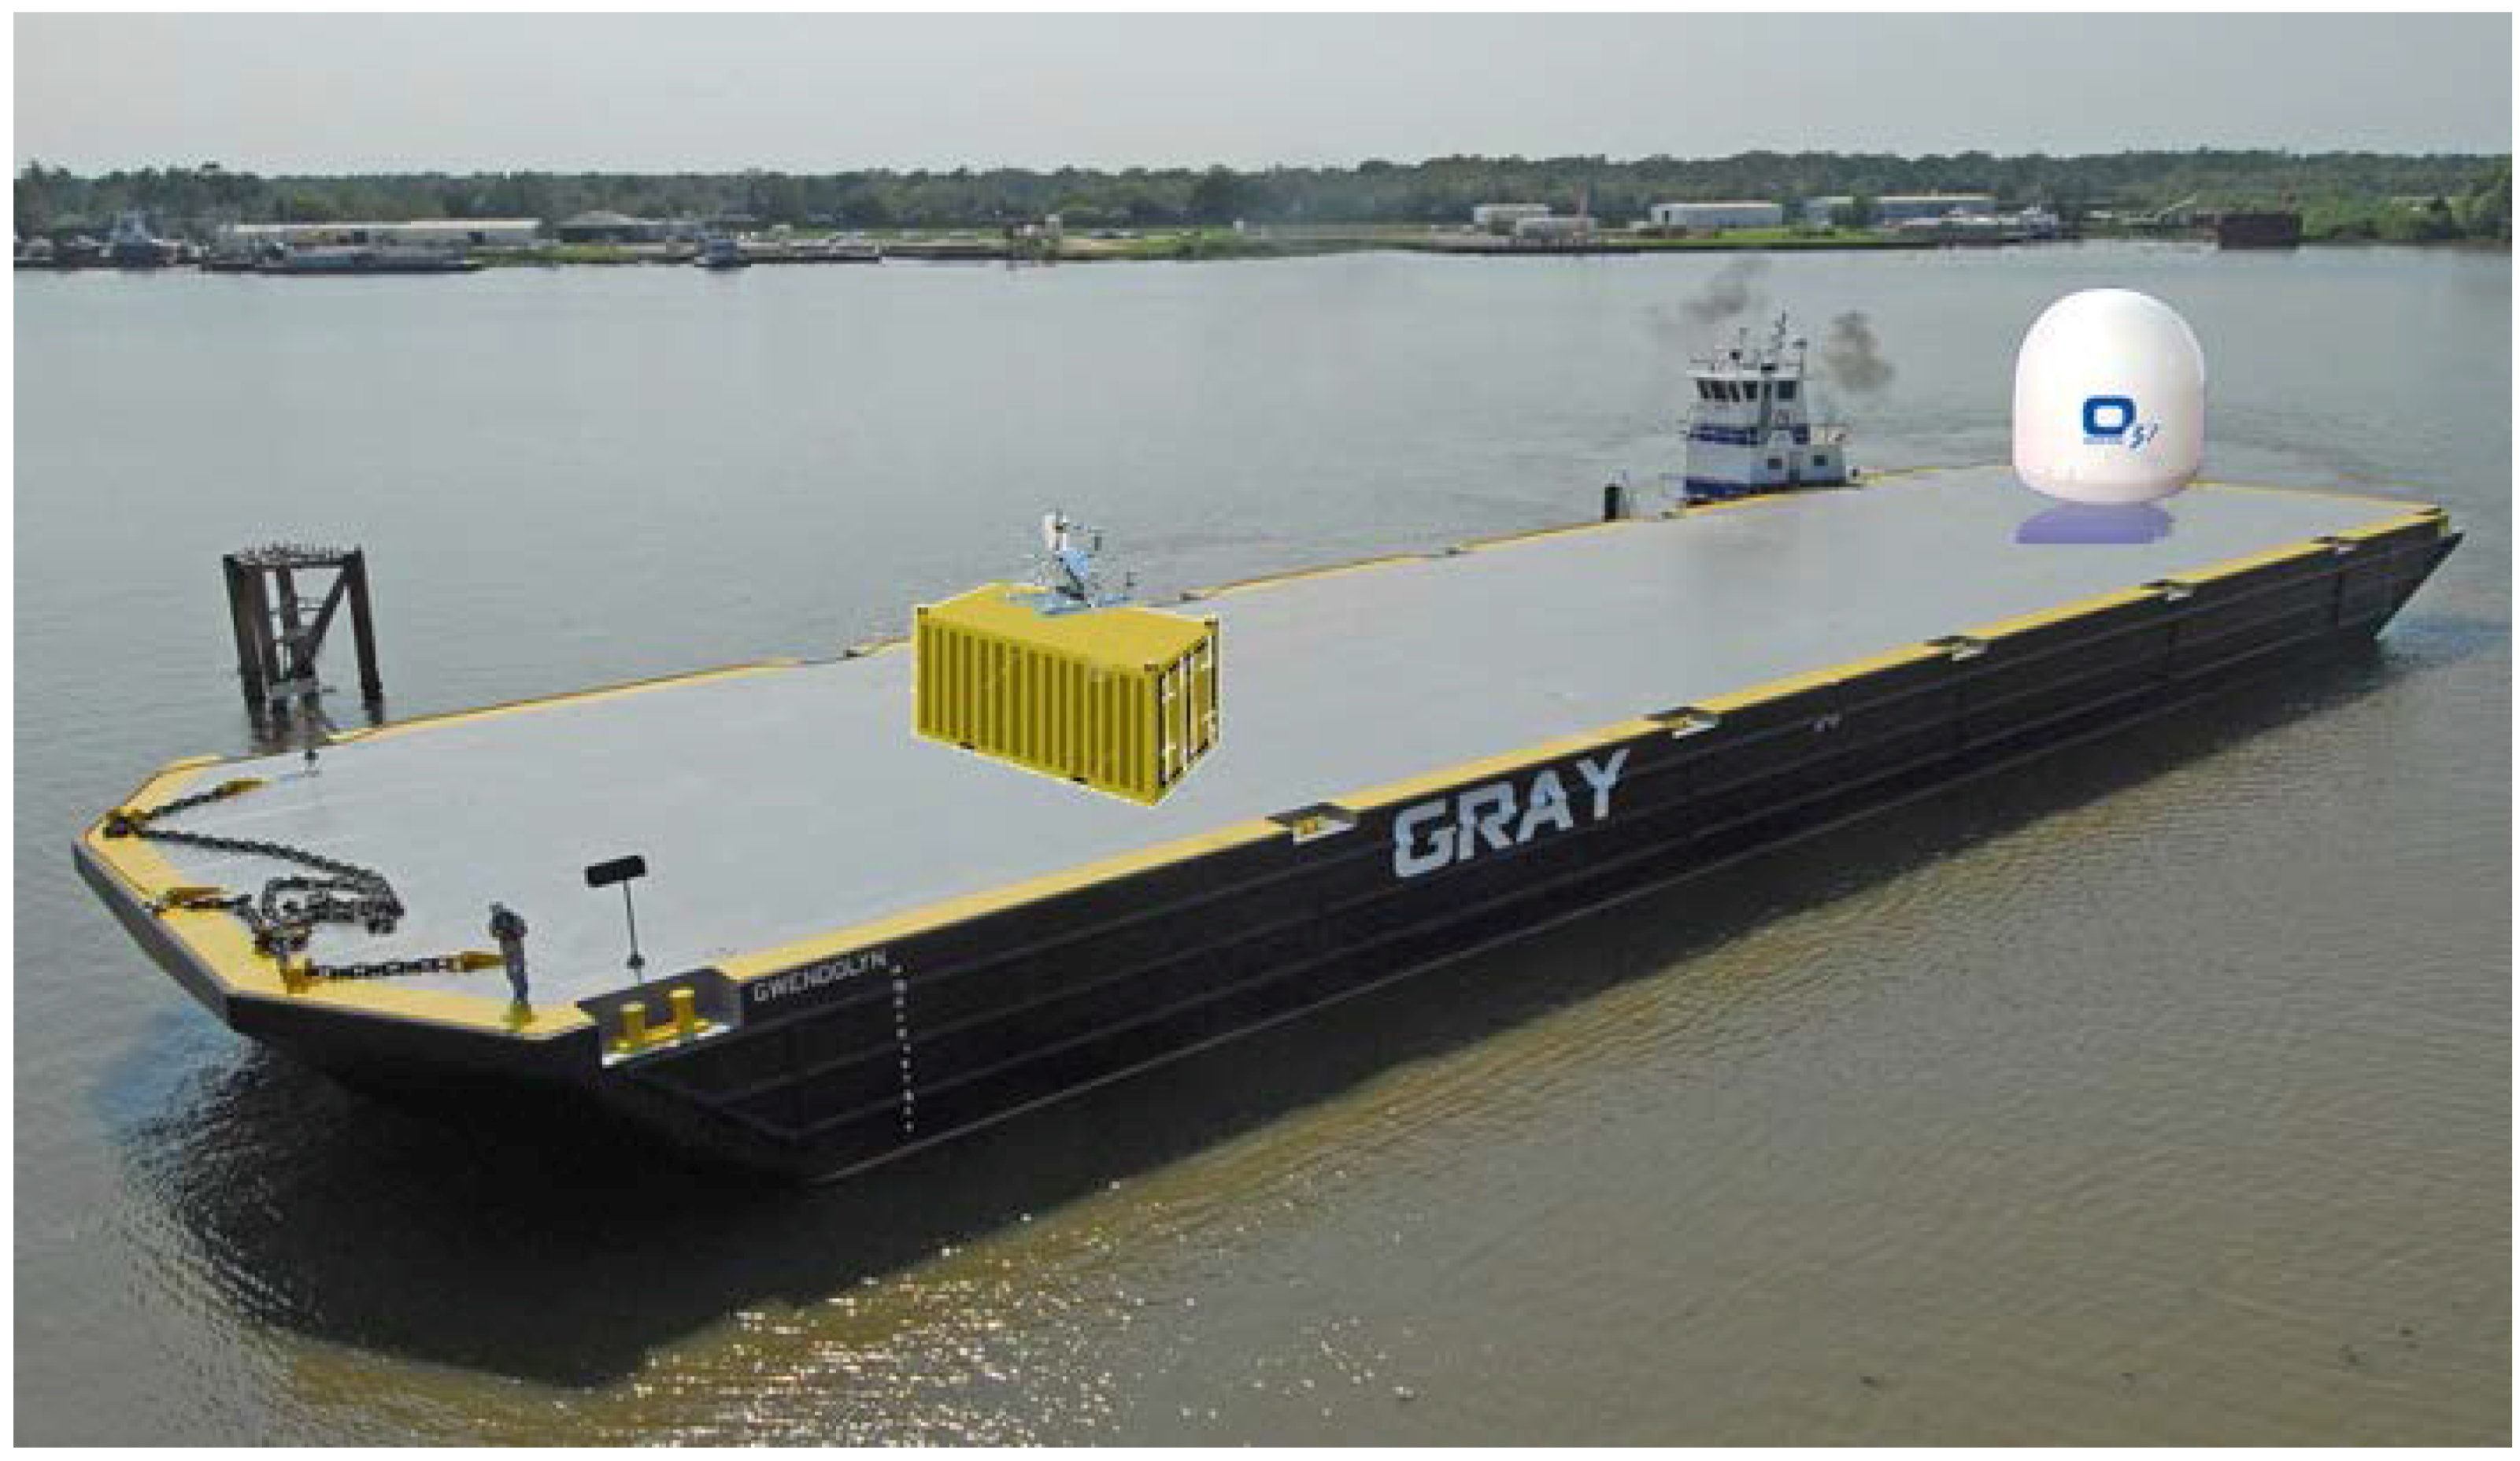
While incremental improvements are ongoing, the challenge of mapping the world ocean will benefit greatly from new technological breakthroughs, and thus the Seabed 2030 Project will explore, initially through workshops and collaboration with industry, new approaches to seafloor mapping that would particularly enhance efficiency and coverage. Among the new technologies to be examined will be the possibility of low-powered echo sounders deployed on gliders or ARGO floats, the possibility of fleets of long-range AUVs equipped with interferometric swath sonars, and autonomous surface barges or sailing vessels capable of long-duration, ocean-wide transits (
Figure 10). These autonomous platforms would be controlled from shore and transmit data back to shore via satellite communication links allowing 24/7 global operation with minimal human supervision. This concept becomes particularly important as we envision thousands of hours of data collection in remote areas of the world oceans where crewed vessels would be particularly inefficient given the need for long transits to accommodate crew changes and the potential monotony of long data collection campaigns.
In the more trafficked regions of the world ocean, crowd-sourced bathymetry offers tremendous potential. Using crowd-sourced bathymetry is not new to GEBCO. Bathymetry provided by the Norwegian company Olex comprised a significant source for the compilation of the International Bathymetric Chart of the Arctic Ocean (IBCAO) Version 3.0 grid released 2012, as well as in the latest GEBCO_2014 grid. The Olex depth measurements originate from their automatic charting system installed primarily on fishing vessels. Other companies using a crowd source approach have now also entered the market. Small and easy to install NMEA-loggers storing depths from any ship echo sounder already exist and are being further developed. Such methods could be used on a global scale, through adoption by shipping companies, cruise ship companies, and recreational boaters for example. IHO has a crowd-sourced working group with substantial GEBCO engagement. This working group is tasked to draft recommendations for the minimum metadata to be provided along with depth measurements, and discuss available technologies, post-processing, as well as online upload technologies and storage.
The gap between the coastline and where depth measurements exist on the continental shelf is large in remote areas on Earth. Surveying of these areas using conventional methods from ships, and even with AUVs, may be enormously challenging and expensive. LIDAR is highly effective and relatively inexpensive for large-scale regional mapping but is limited to areas of relatively clear water. In such remote areas, where other means of seafloor mapping are not easily feasible, bathymetry derived from satellite imagery is very promising. Freely available imagery, such as Landsat 8, as well as commercial higher-resolution satellite images, comprise vast sources of data with global coverage. Conventional “water penetrating” satellite-derived bathymetry also requires relatively clear water, but the development of satellite-derived bathymetry methods that are not solely based on the optical spectrum may overcome turbid water issues, though their accuracy and resolution are considerably lower and the method will still be depth limited.
Whether from the identification of existing data sets or the collection of new data, the Nippon Foundation GEBCO Seabed 2030 Project will be responsible for bringing disparate depth measurements together into the compilation of a coherent bathymetric portrayal of the world ocean floor. Therefore, advances in bathymetric post-processing and analysis software, database technology, computing infrastructure, and gridding techniques are also important technological considerations. The present GEBCO central bathymetric data compilation, as well as compilations of the existing Regional Mapping Projects under GEBCO, reside on distributed servers at their respective host organizations. Moving towards establishing the RDACCs suggests that there may be potential benefits from establishing a shared cloud-based infrastructure for data storage as well as for gridding and processing routines (Virtual Research Environments and Infrastructures) that can also become part of new e-learning processes. The overall coordination of efforts to make use of emerging technologies will be the responsibility of the GDACC in coordination with the RDACCs.
5. Conclusions
For thousands of years, we have been probing the seas to measure its depths—originally with a stone or lead at the end of a line and now using modern multibeam echo-sounders capable of ensonifying wide swaths of the seafloor and producing hundreds of highly accurate depth measurements across this swath. Despite these thousands of years of effort, only a fraction of the world ocean’s seafloor has been sampled for depth (far less than 15%), greatly limiting our ability to explore and understand critical ocean and seafloor processes. Remarkably, several planets in our solar system are mapped with far better coverage and at a higher resolution than our own planet. While it may be argued that mapping these distant planets is easier than mapping the seafloor because electromagnetic sensors can penetrate their atmospheres and thus high-resolution mapping is much simpler than trying to map the deep sea, the reality is that the overall cost of an extra-terrestrial mapping mission (a Mars mission typically costs on the order of $3B U.S.) is commensurate with the estimated cost of using existing sonar technology to completely map the 93% of the world’s ocean deeper than 200 m. Unfortunately, we appear to be willing to spend these amounts to map other planets but not our own.
Recognizing this poor state of our knowledge of ocean depths and the critical role such knowledge plays in understanding and maintaining our planet, GEBCO and the Nippon Foundation have joined forces to begin to address this issue. Through the establishment of the Nippon Foundation GEBCO Seabed 2030 Project, an international effort has begun with the objective of facilitating the complete mapping of the world ocean by 2030. Achieving this goal will be far from simple. The Seabed 2030 Project will initially establish globally-distributed regional data assembly and coordination centers (RDACCs) that will focus on identifying existing data from their assigned regions that are not currently in publicly available databases and seek to make these data available. To do this, they will work with a Regional Mapping Committees made of regional experts from local hydrographic agencies and institutes as well as a network for alumni of the Nippon Foundation/GEBCO postgraduate training program, many of whom hold senior positions with hydrographic and other mapping agencies around the world.
The four RDACCs—North Pacific and Arctic; South and West Pacific; Atlantic and Indian; and Southern centers—will also be developing common software and other tools to assemble and attribute appropriate metadata to the data sets they have acquired and then to assimilate these into regional grids using standardized techniques. Along with the data assembly and gridding tools, the RDACCs will be developing tools to continuously update data coverage and to identify and prioritize critical data gaps. The RDACCs will work with regional and global mapping agencies to facilitate and coordinate efforts aimed at collecting new data to fill these gaps. The regional grids will be transmitted to a Global Data Assembly and Coordination Center (GDACC) whose primary task will be to integrate the regional grids into a global grid and distribute this new grid to users worldwide. The GDACC will also act as the central focal point for the coordination of common data standards and processing tools as well as the outreach coordinator for Seabed 2030 efforts. Finally, the Nippon Foundation GEBCO Seabed 2030 Project will track and encourage the development of new and innovative technologies that can increase the efficiency of seafloor mapping and thus make the ambitious goals of Seabed 2030 more likely to be achieved.
There can be no question that the goal of seeing the world ocean completely mapped by 2030 is a difficult one. So little of the ocean is currently mapped that an effort to achieve complete coverage by 2030 will require several hundred ship-years of new mapping effort using current technology. New technological advances may help to reduce this number (or the cost of achieving it) however, the magnitude of the task is such that it will only be done through international cooperation and collaboration. It is our sincere hope that through the initial efforts of the Nippon Foundation GEBCO Seabed 2030 Project, the world will come to recognize the great value of such collaboration and the goal of seeing the world ocean completely mapped by 2030 will be achieved.

 ,
, 


