1. Introduction
In Morocco, agriculture is an important sector for economic and social development. The agricultural sector contributes approximately 15% of the national Gross Domestic Product (GDP), representing nearly 1.5 million farms and supporting almost 40% of the country’s employment. Agriculture is the most vulnerable sector within the Moroccan economy because over 90% the country’s agriculture is rain-dependent, located in the arid and semi-arid areas of the country and characterized by limited soil and water resources.
Agricultural drought is a recurrent phenomenon in many parts of Morocco, primarily in the non-irrigated areas. It happens when rainfall and soil moisture conditions are inadequate to support healthy crop growth to maturity during the growing season. This situation causes extreme crop stress and physiognomic changes within vegetation, which can be detected by satellite sensors through the use of vegetation indices. These indices are sensitive to vegetation changes affected by moisture stress [
1]. Agriculture faces several constraints in Morocco with one of the most important being the dependence of agriculture on weather conditions. In recent years, Morocco has faced recurrent rainfall deficits jeopardizing agricultural production and causing farmers to face shortages in water and fodder. These drought conditions led to the deterioration of living conditions of local populations and the environment. According to the statistics of the Moroccan Ministry of Agriculture, the last two decades were characterized by the presence of at least five periods of drought.
Table 1 lists some of the most significant drought events with numbers of specific losses (rain, cereal production, socio-economic).
Morocco is characterized by a highly contrasting climate with a rainfall regime dominated by high irregularity in the spatial distribution and timing of precipitation across the country. For example, the amount of precipitation is very different between the north-western plains (300 mm) and the southern regions of Morocco (100 mm). In addition to this spatial variability, rainfall is seasonally irregular with considerable inter-annual variations in the onset and end of the rainy season, as well as the timing of the most humid month for a given region. Annual total rainfall can be double or triple the amount of a normal year in wet years or not exceed 40–50% of this value in dry years.
This situation is likely to deteriorate as a result of climate change. In recent decades, the Mediterranean region has suffered from climatic variations with an increase in extreme drought events resulting in significant reductions in rainfall and surface water runoff, which are critical to support agricultural production in the predominately rainfed systems of the region [
3]. A major challenge facing Morocco is the impact of climate change and the increased frequency of drought. Climate observations during the last four decades have shown that Morocco is experiencing major impacts from climate change through increased temperatures and decreased precipitations [
4].
Historically, Morocco has experienced several years of drought with greater frequency and with high intensity [
2]. The impacts of these droughts on the national economy are of great importance. For example, in 2000, which was a drought year, the contribution to the country’s overall gross domestic product from agricultural GDP was only 11.4% with total cereal production less than 20 million quintals at national level. By comparison, the contribution of agricultural GDP was 30.4% of the GDP in 2009, which was a very wet year, with national cereal production exceeding 100 million quintals.
The main objective of this study is to use several satellite-derived data sets that characterize relevant components of the hydrologic cycle related to drought into a new, gridded Moroccan Composite Drought Indicator (MCDI) that will be used to support various drought-related decision-making activities within the different concerned departments (Ministry of Agriculture, Department of Water).
2. Background: LDAS-Morocco Project
The Moroccan Land Data Assimilation System (LDAS-Morocco) project was designed within the framework of a regional project, financed by the Global Environment Facility (GEF), and managed by the World Bank with the support of the United States Agency for International Development (USAID) and the American National Aeronautics and Space Agency (NASA). The objective of the regional project is to improve water resource management and capacity building at the Middle East and North Africa (MENA) region scale. In Morocco, the project was coordinated by the Royal Centre for Remote Sensing (CRTS) closely with NASA, this project aims to improve the management of water resources through satellite-based earth observations, in-situ information and modelling.
Among the components of LDAS project, the drought monitoring component aims to produce a regular monthly bulletin on the status of drought at national scale by combining different remote sensing data sources that describe current relevant environmental conditions linked to drought that include precipitation, soil moisture, and vegetation health. The overall objective of this project is to contribute to improving the detection and potentially provide early warning in order to reduce its impact on the agricultural and socioeconomic sectors in Morocco.
This paper describes the methodological steps for these various remote sensing data sets to calculate a Composite Drought Indicator (CDI) that monitors agricultural-related drought conditions across Morocco. The first section summarizes the methodology used to select the rainfall data source used to calculate the Standardized Precipitation Index (SPI) that represents the precipitation input into the CDI. Second, the other remote sensing indices used in the CDI are described. The methodology of combining the various remote sensing data sets into the CDI and validation of results are then presented along with some examples of the products generated.
3. Drought Monitoring and Conceptualization of the CDI
Because of the difficulty of objectively quantifying the characteristics of drought (duration, intensity and spatial extent), much effort has gone into the development of techniques for monitoring and analysis of drought through the calculation of various indices and indicators. Specific indicators have been developed for different sectors (e.g., water resources and agriculture) based on both in situ and remote sensing-based information related to precipitation, soil moisture, evapotranspiration (ET), and vegetation health. Each indicator/index has its own inherent strengths and weaknesses and its utility is often tailored for a specific application or decision-making activity. As a result, this study attempted to integrate several indicators/indices that represent different components of the hydrologic cycle into a single CDI. The composite approach taken in this project is intended to leverage the relevant strengths of each indicator and provide a single index that is representative of various parts of the water cycle that influence agricultural-related drought conditions. It also addresses the fact that no single index can cover all aspects of drought. Using a “convergence of evidence” approach determined by agreement and consensus amongst a variety of indicators integrated into the CDI can lead to more confidence in the drought conditions being depicted more accurately during both onset and decay of the drought.
The CDI approach developed in this project represents a remote sensing-based drought monitoring tool that incorporates information related to precipitation, ET, soil moisture, and vegetation health. The specific data inputs for these parameters in the CDI include the Standardized Precipitation Index (SPI), thermal-based ET, a thermal-based proxy of soil moisture, and the Normalized Difference Vegetation Index (NDVI) anomaly. Descriptions of each of these data sets is provided in the following section.
4. Materials and Methods
4.1. Data Sources
The recently published “Handbook of Drought Indicators and Indices” [
5] provides a good description of the most commonly used drought indicators/indices that are being applied for drought monitoring, early warning and information delivery systems. This guide describes the different drought monitoring approaches based on the use of a single indicator/index, a multiple indicators/indices or composite indicators. A detailed list of indices and indicators is given in this handbook to help users to decide which of these indicators are more appropriate for each type of drought. The indicators and indices are categorized and grouped into different classes: meteorology, soil moisture, hydrology, remote sensing and composite indicators.
The CDI developed in this project is based on a combination of four different parameters derived from various satellite-based earth observation products that are generated on a monthly basis to produce a monthly time series of CDI over Morocco for agricultural drought monitoring. The input indices used in this study are described below. This set of remote sensing-derived data inputs was chosen based on the state of the art and best practices of many agricultural drought monitoring systems throughout the world [
5]. Criteria used to determine the most suitable inputs for analyses was based on: data access, data reliability and long-term availability, the best operational resolution possible, and commonly accepted and operationally used variables by other agricultural focused drought early warning systems around the world. Several sources of information on the different indices and indicators being used nowadays around the world for drought monitoring and early warning exist and are supported by institutions of high reputation in the field, like the National Drought Mitigation Centre, the World Meteorological Organization and the European Drought Observatory [
5].
4.1.1. NDVI Anomalies
The United States Geological Survey Earth Resources Observation and Science (USGS EROS) Center generates and distributes a set of satellite-derived vegetation products generated from MODIS. These products (called eMODIS) are used for operational land monitoring applications requiring near-real time NDVI data for comparison against historical records. An eMODIS 10-day maximum-value composite of NDVI images at 250m spatial resolution are used to monitor the general state of vegetation conditions [
6]. The data and products produced are available for download from the Famine Early Warning Systems Network (FEWSNET) data portal.
The CDI incorporates the eMODIS-derived NDVI anomaly that represents how anomalous the current vegetation conditions are the historical conditions for that time period across the MODIS observational record. The NDVI anomaly is calculated by subtracting the mean NDVI values (2001 to present) for a 10-day, decade period from the current-year NDVI value for the same time period during the year. Temporally smoothed, 250 m MODIS NDVI data are used to generate the gridded anomaly NDVI data set where negative values represent less vigorous vegetation than average, and positive values represent areas that are more vigorous in the current year.
Figure 1 below shows the NDVI anomalies map for February 2016.
4.1.2. Evapotranspiration Anomalies
Evapotranspiration is the combination of soil evaporation and transpiration from vegetation. Actual ET is produced using the Operational Simplified Surface Energy Balance (SSEBop) model [
7] for the period of 2003 to present. The model SSEBop is based on the simplified surface energy balance (SSEB) approach based on estimates of daytime land surface temperature [
8,
9] with parameterization for operational applications within FEWSNET. The unique feature of the SSEBop parameterization is that it uses pre-defined, seasonally dynamic, boundary conditions that are unique to each pixel for the “hot/dry” and “cold/wet” reference points. The ET anomaly gridded data products are open-access and acquired from FEWSNET.
ET anomaly data used in the CDI is calculated using the SSEBop method and represents the ratio of actual ET and the corresponding median ETa, expressed as a percentage value.
Figure 2 below presents an example of ET anomaly for February 2016.
4.1.3. Land Surface Temperature-Based Soil Moisture Proxy Anomalies
Vegetation growth is impacted by surface and subsurface soil moisture and the availability of soil moisture for soil evaporation and canopy transpiration plays an integral role in the emergence and impact of drought. Remote sensing techniques for soil moisture monitoring and quantitative retrieval are mainly based on active and passive microwave observations [
10]. However, relative soil moisture can also be estimated using land surface temperature (LST) observations in the thermal infrared region [
11,
12]. Diurnal changes in LST can contain important information about soil moisture. It has been shown that the evolution of LST in the morning hours is strongly dependent on current soil moisture conditions, as wet soil or well-watered vegetation will heat up more slowly, and dry soil or stressed vegetation will heat up more rapidly [
11,
12,
13].
Observations of LST from sensors such as MODIS provide long-term data continuity for deriving anomalies in the difference between day and night LST that can be used as a proxy of soil moisture conditions. Here, twice-daily observations of LST are taken from the MODIS Terra sensor, where LST is retrieved using a generalized split-window technique [
14,
15,
16]. The daily L3 global 0.05 Climate Modelling Grid LST product (MOD11C1) and corresponding QC flags are applied and re-sampled to the study domain. These MODIS day-night LST anomalies are used as indicator of soil moisture in the current combined drought index.
Figure 3 presents an example of LST day_night difference for February 2016.
4.1.4. SPI Calculation from CHIRPS Data
The SPI, which is the most commonly used indicator to characterize drought globally according to the Lincoln Declaration on Drought Indices [
17], was incorporated into the CDI to represent the precipitation component. The SPI [
18], is an indicator based on a long history of rainfall (at least 30 years) and quantifies the difference in rainfall from one-time period relative to historical average rainfall in the same period. The SPI has the flexibility to be calculated over a range of time periods spanning from one month (seasonal droughts) to 2 years (prolonged droughts). Given that the SPI is a normalized index, it allows drought conditions to be compared directly over time and between different climatic and geographic zones. Using the SPI, drought begins when the index begins to be systematically negative (reaches a value of −1.0 or less) and ends with the positive value of SPI [
19].
To calculate the SPI for the CDI, rainfall data from CHIRPSv2 (Climate Hazards Group InfraRed Precipitation with Stations) was used. CHIRPS rainfall data represents satellite estimates corrected by the integration of rainfall data from weather stations on the ground. These data are available from 1981 to present [
20]. Main satellite data used for creation of CHIRPS are: (1) Climate Hazards Precipitation Climatology (CHPClim) that are in the form of monthly average precipitation with high spatial resolution (0.05°) derived from the combination of satellite observations data, average rainfall weather stations and parameters for rain prediction such as elevation, latitude and longitude [
20]; (2) thermal infrared satellite data from two NOAA sources, the National Climatic Data Center (NCDC) and the Climate Prediction Center (CPC), that extract the thermal infrared data from different geostationary satellites (Meteosat-5, Meteosat-7, GOES-8, GOES-10, GMS-5), as well as passive microwave observations (from NOAA-15, NOAA-16 and NOAA-17); (3) NASA Tropical Rainfall Measuring Mission (TRMM) 3B42 precipitation data; (4) atmospheric model rainfall fields from the NOAA Climate Forecast system (CFSv2 version); and (5) in-situ precipitation observations obtained from different weather stations. All the data sources are compiled as 5-day rainfall accumulations and CHIRPS data are produced globally at a 0.05° gridded resolution.
As mentioned above, the SPI was designed to quantify the precipitation deficit for multiple time scales. These timescales reflect the impacts of drought on different water resources. For example, meteorological and soil moisture conditions (agriculture) respond to precipitation anomalies on relatively short timescales (1 to 6 months) whereas longer time periods (12–36 months) may better reflect surface reservoir or groundwater levels associated with hydrological drought. In the present study, a 2-month SPI was calculated for the CDI that provides a comparison of the precipitation over a specific 2-month period with the historical precipitation totals from the same 2-month period dating back to 1981. The CHIRPS rainfall data set was used to generate the 2-month SPI calculations. The long-term CHIRPS rainfall record was fit to a probability distribution, which was then transformed into a normal distribution so that the mean SPI for the pixel and desired period is zero [
21].
Figure 4 below shows an example of the 2-month SPI calculated at national scale for Morocco for February 2016.
4.2. Composite Drought Indicator Methodology and Generation
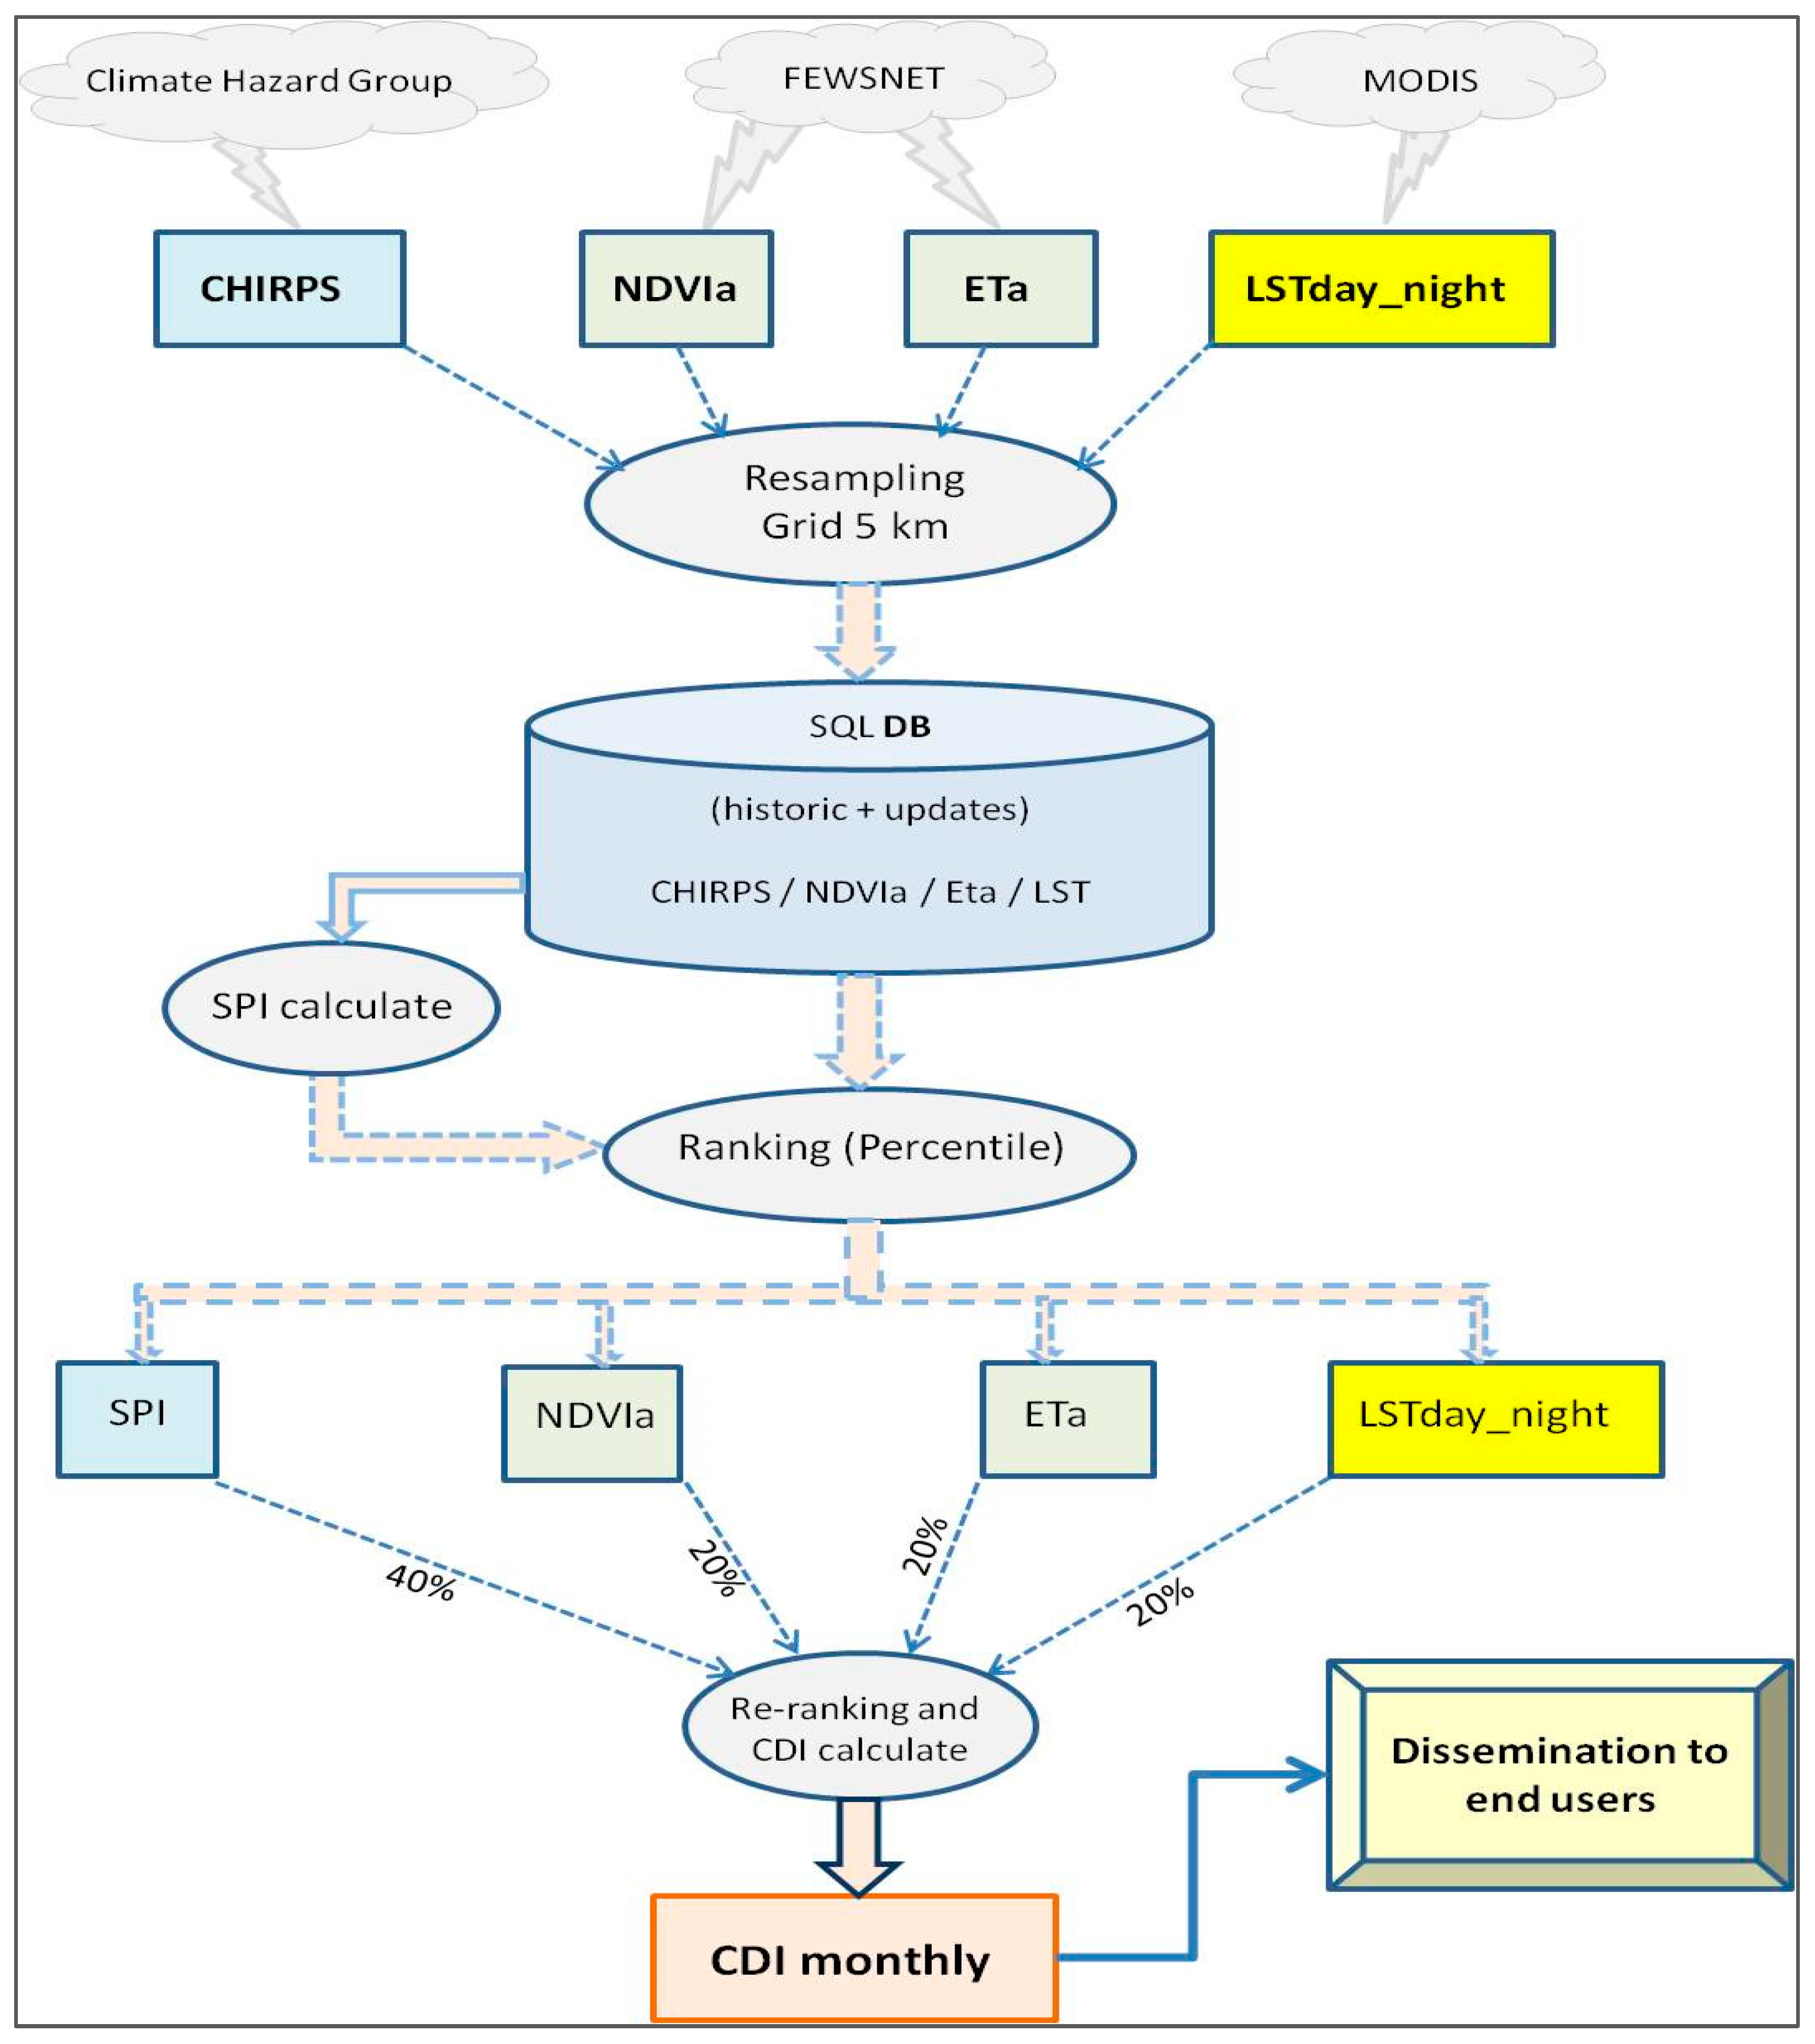
The four input data sets described above cover the study area with different spatial resolutions (5 km for SPI from CHIRPS, 250 m for NDVI, 1 km for ET and LST from MODIS). In order to have a uniform spatial resolution for the CDI, all four indices were sampled to a 5-km spatial resolution consisting of 25,589 grid cells in total over Morocco. The CDI calculation methodology combines the four input data sets as given by the Equation (1):
where a, b, c and d are the respective weights assigned to each input data.
For each input parameter (SPI, NDVI, ET and LST), the historical data for each grid was analyzed to rank the current condition within a historical context using a ranking percentile approach. The percentile value for each input is then weighted and combine using the previous equation. All the grid cell calculations are stored in a SQL Server database and Python is used to help automate and script the monthly updates and CDI calculations.
Figure 5 shows the flowchart of the proposed CDI methodology.
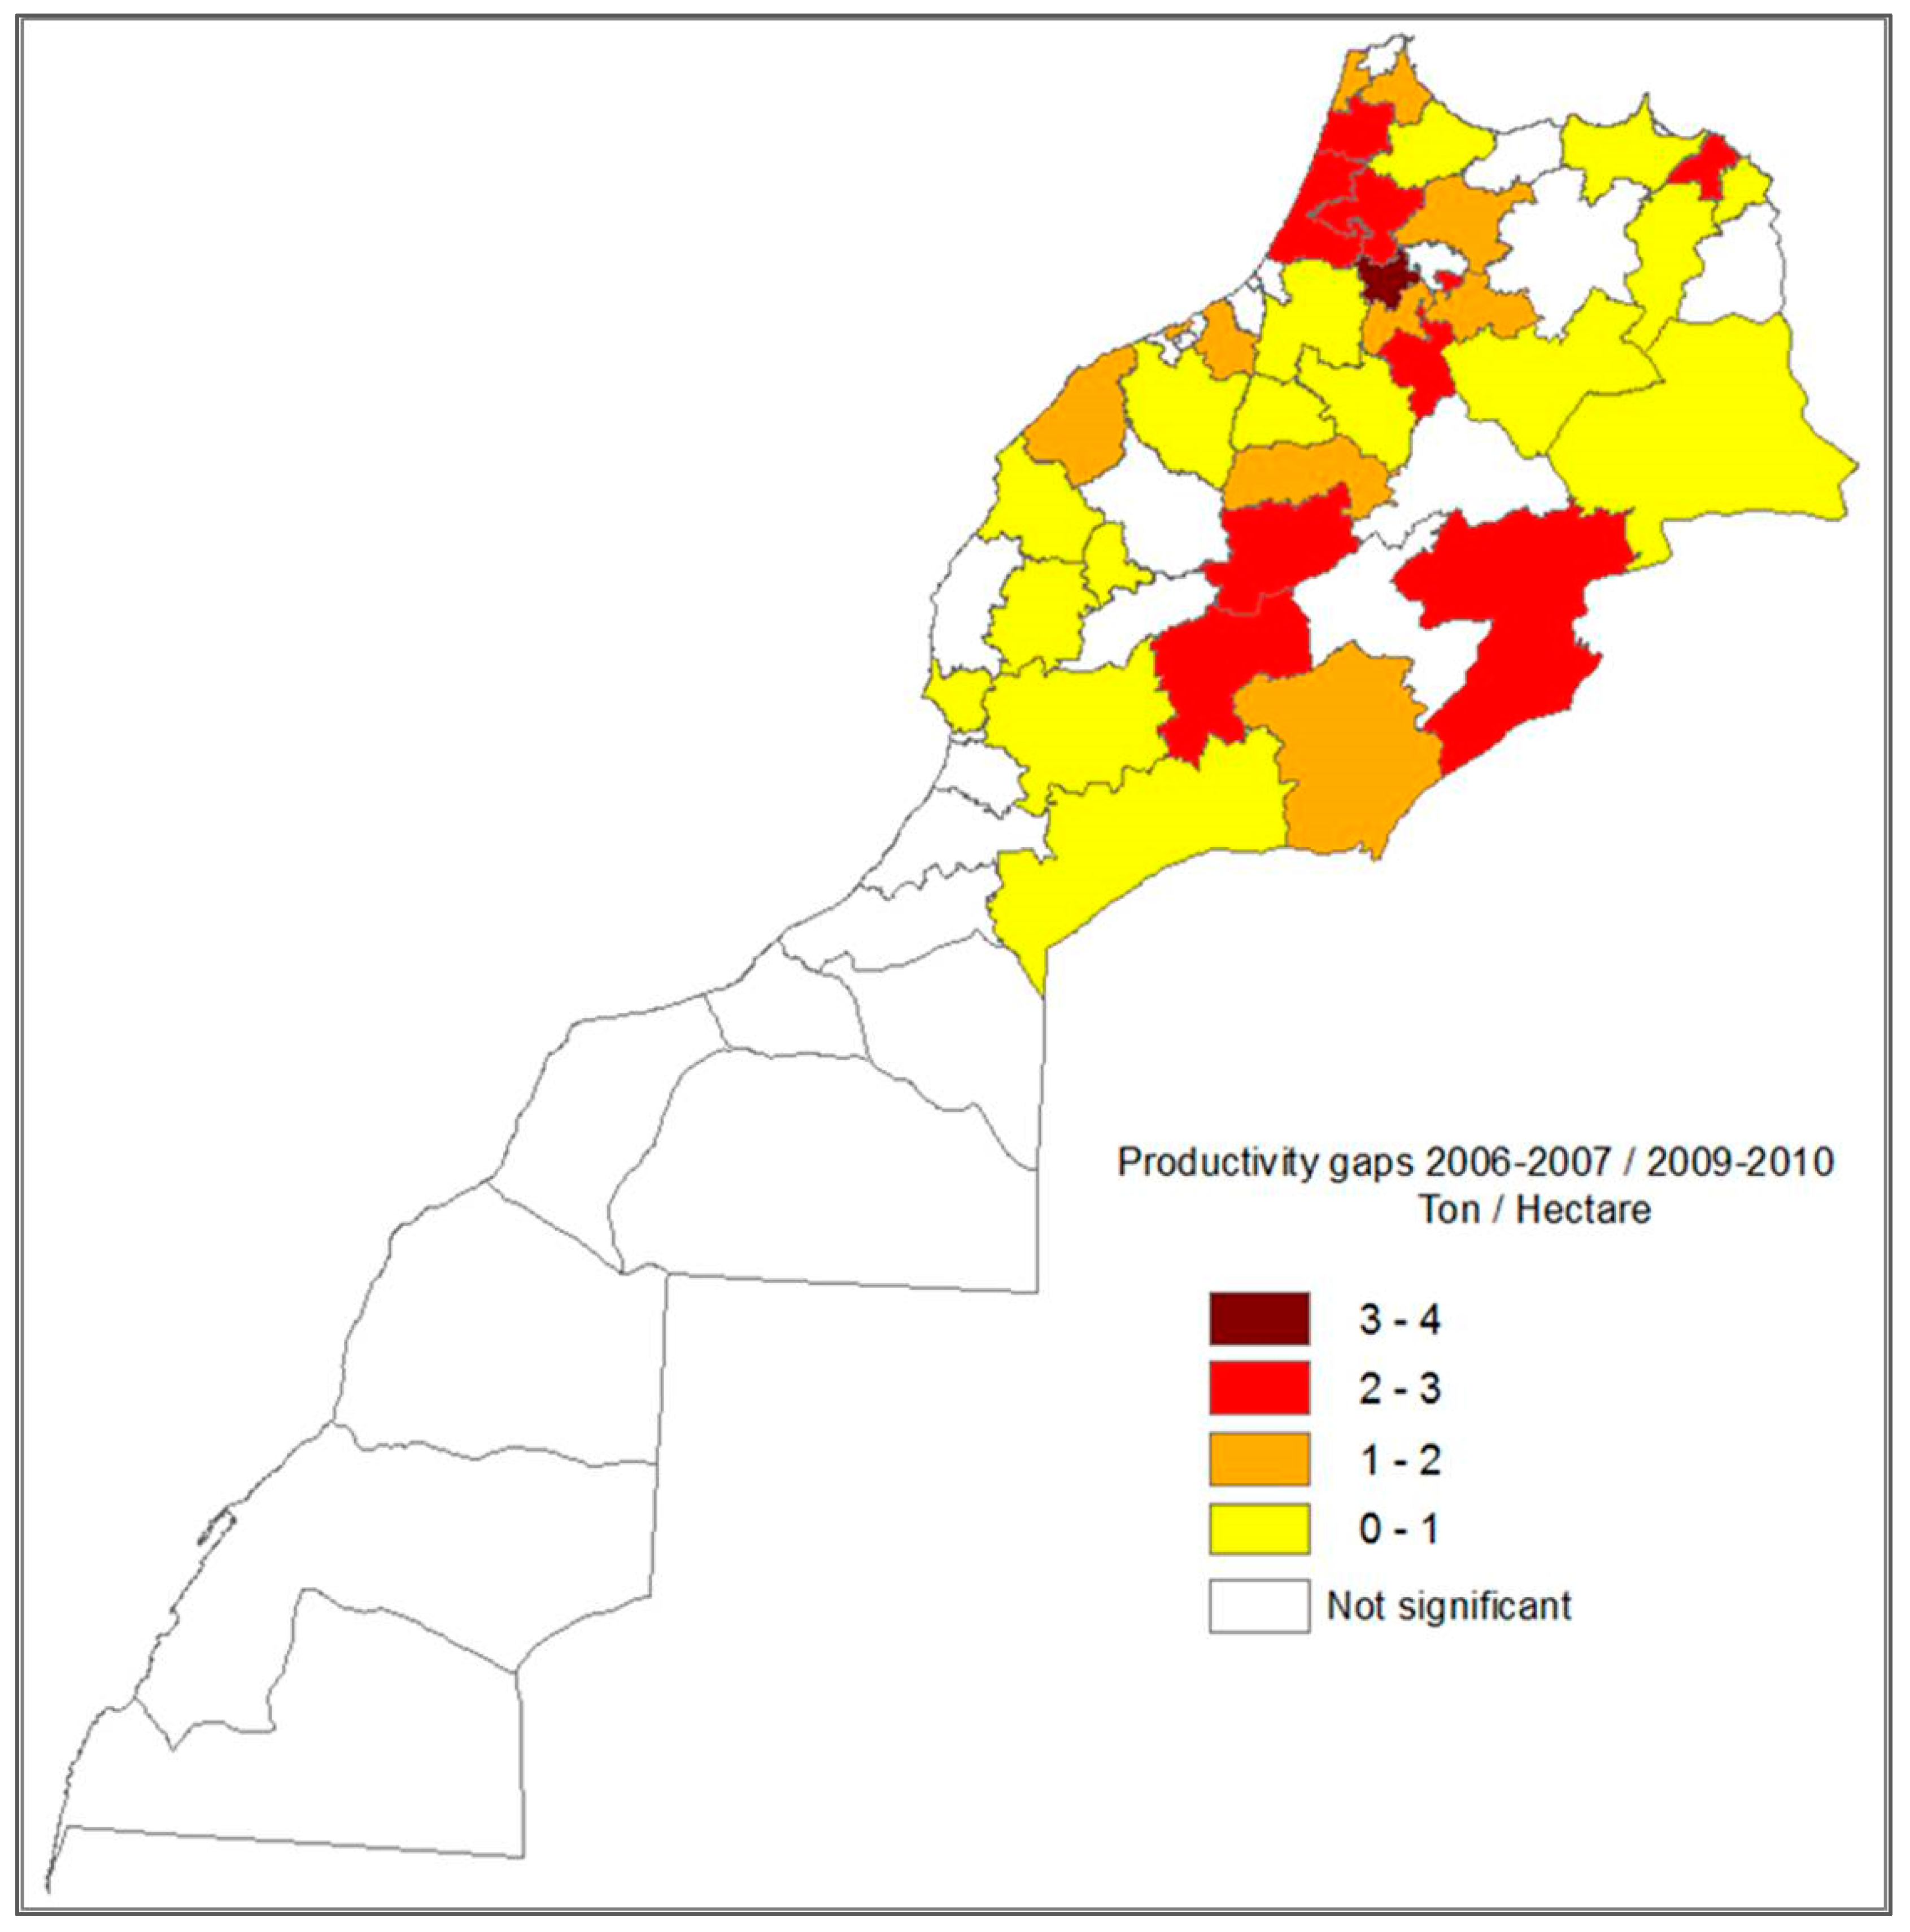
Considering the fact that the weight of each input parameter represents the degree of its approximation to reality observed in a period of real drought, a scientific approach was adopted to assign weights to each parameter of the CDI. This method is based on the confrontation of productivity gaps between a year of severe drought (2006–2007) as compared to a reference year. Thus, locating areas with high impacts of previous drought was the first step. This information was provided by data on the evolution of grain production in different regions and provinces of Morocco for the main crops (wheat) obtained from the Ministry of Agriculture. Then, for each province, the rate of change (increase or decline) during a drought year compared to a normal or higher situation (2009–2010) in term of productivity was defined.
The deviation of the productivity between the two years (severe drought and favorable year) shows the distribution of areas that have been most affected (impacted), whose productivity has dropped in a significant way. The result was presented in a map of deviations from normal (
Figure 6). This map is then overlaid to each of the CDI input parameters in order to determine their relative weights. The approach is based on a statistical calculate of the incidence proportions of each parameter with the most affected areas during a severe drought.
This procedure will allow assigning weights to the different factors. The highest weight is attributed to the factor that, from a statistical point of view, reflects more the reality during a period of drought. The methodology is based on the comparison between each CDI input parameter maps and real drought episodes from the past. The main step consists on the combination of the map of cereal productivity gaps between the two extreme seasons (2006–2007 and 2009–2010) and those of each input data (SPI, NDVI, ET and LST) at national scale. For example, the yearly cumulative NDVI maps overlaid to the map of cereal productivity gaps highlight the areas corresponding at the same time to high cereal productivity deficit and low NDVI values. Hence, the incidence proportion of low NDVI classes with areas of severe drought (high productivity gaps) corresponds to the relative weight of NDVI. The same method was applied to the other parameters.
The second step is to apply the same comparison at regional scale by choosing three specific zones (Chaouia, Fes-Saiss and the Oriental) which are very fragile and sensitive to drought. The two first zones are dominated by rainfed cereals and the third one is characterized by the presence of rangelands. For each zone, several control points were selected in the middle of high density rainfed crops and a statistical analysis was conducted using historical data available for these zones.
The next step was to compare the monthly CDI values generated over the last 10 years with monthly ground station precipitation measurements acquired from the Moroccan Meteorological Service. Based on these analyses, it was concluded that the rainfall-based parameter (SPI) has the strongest relationship with drought and its onset, duration and the intensity over the retrospective period. The amount and temporal distribution of precipitation during the growing season was determined to be a key factor influencing agricultural productivity. For this reason, the SPI was given a higher weighting in the CDI formula. The other three indices (NDVIa, ETa and LSTday_night) are considered factors resulting from the impact of rainfall deficit and were equally weighted. The relative weights of each CDI input data are: SPI: 43.16%, NDVI: 19.03%, LST: 18.87% and ET: 18.94%. Finally, the rounded values of these weights are respectively: SPI: 40%/NDVIa: 20%/LST: 20%/ETa: 20%. The CDI values calculated after the weighting were then re-ranked against the history to produce the final CDI maps.
The CDI was then recalculated using the new weights and the monthly-generated CDI map results compared to in situ data (ground station precipitation data and cereal yields). The final CDI map contains four classes corresponding to the drought intensity categories that are associated with historical occurrence determined using the percentile approach (
Table 2) as adapted from the U.S. Drought Monitor scheme [
22]:
5. Results and Validation
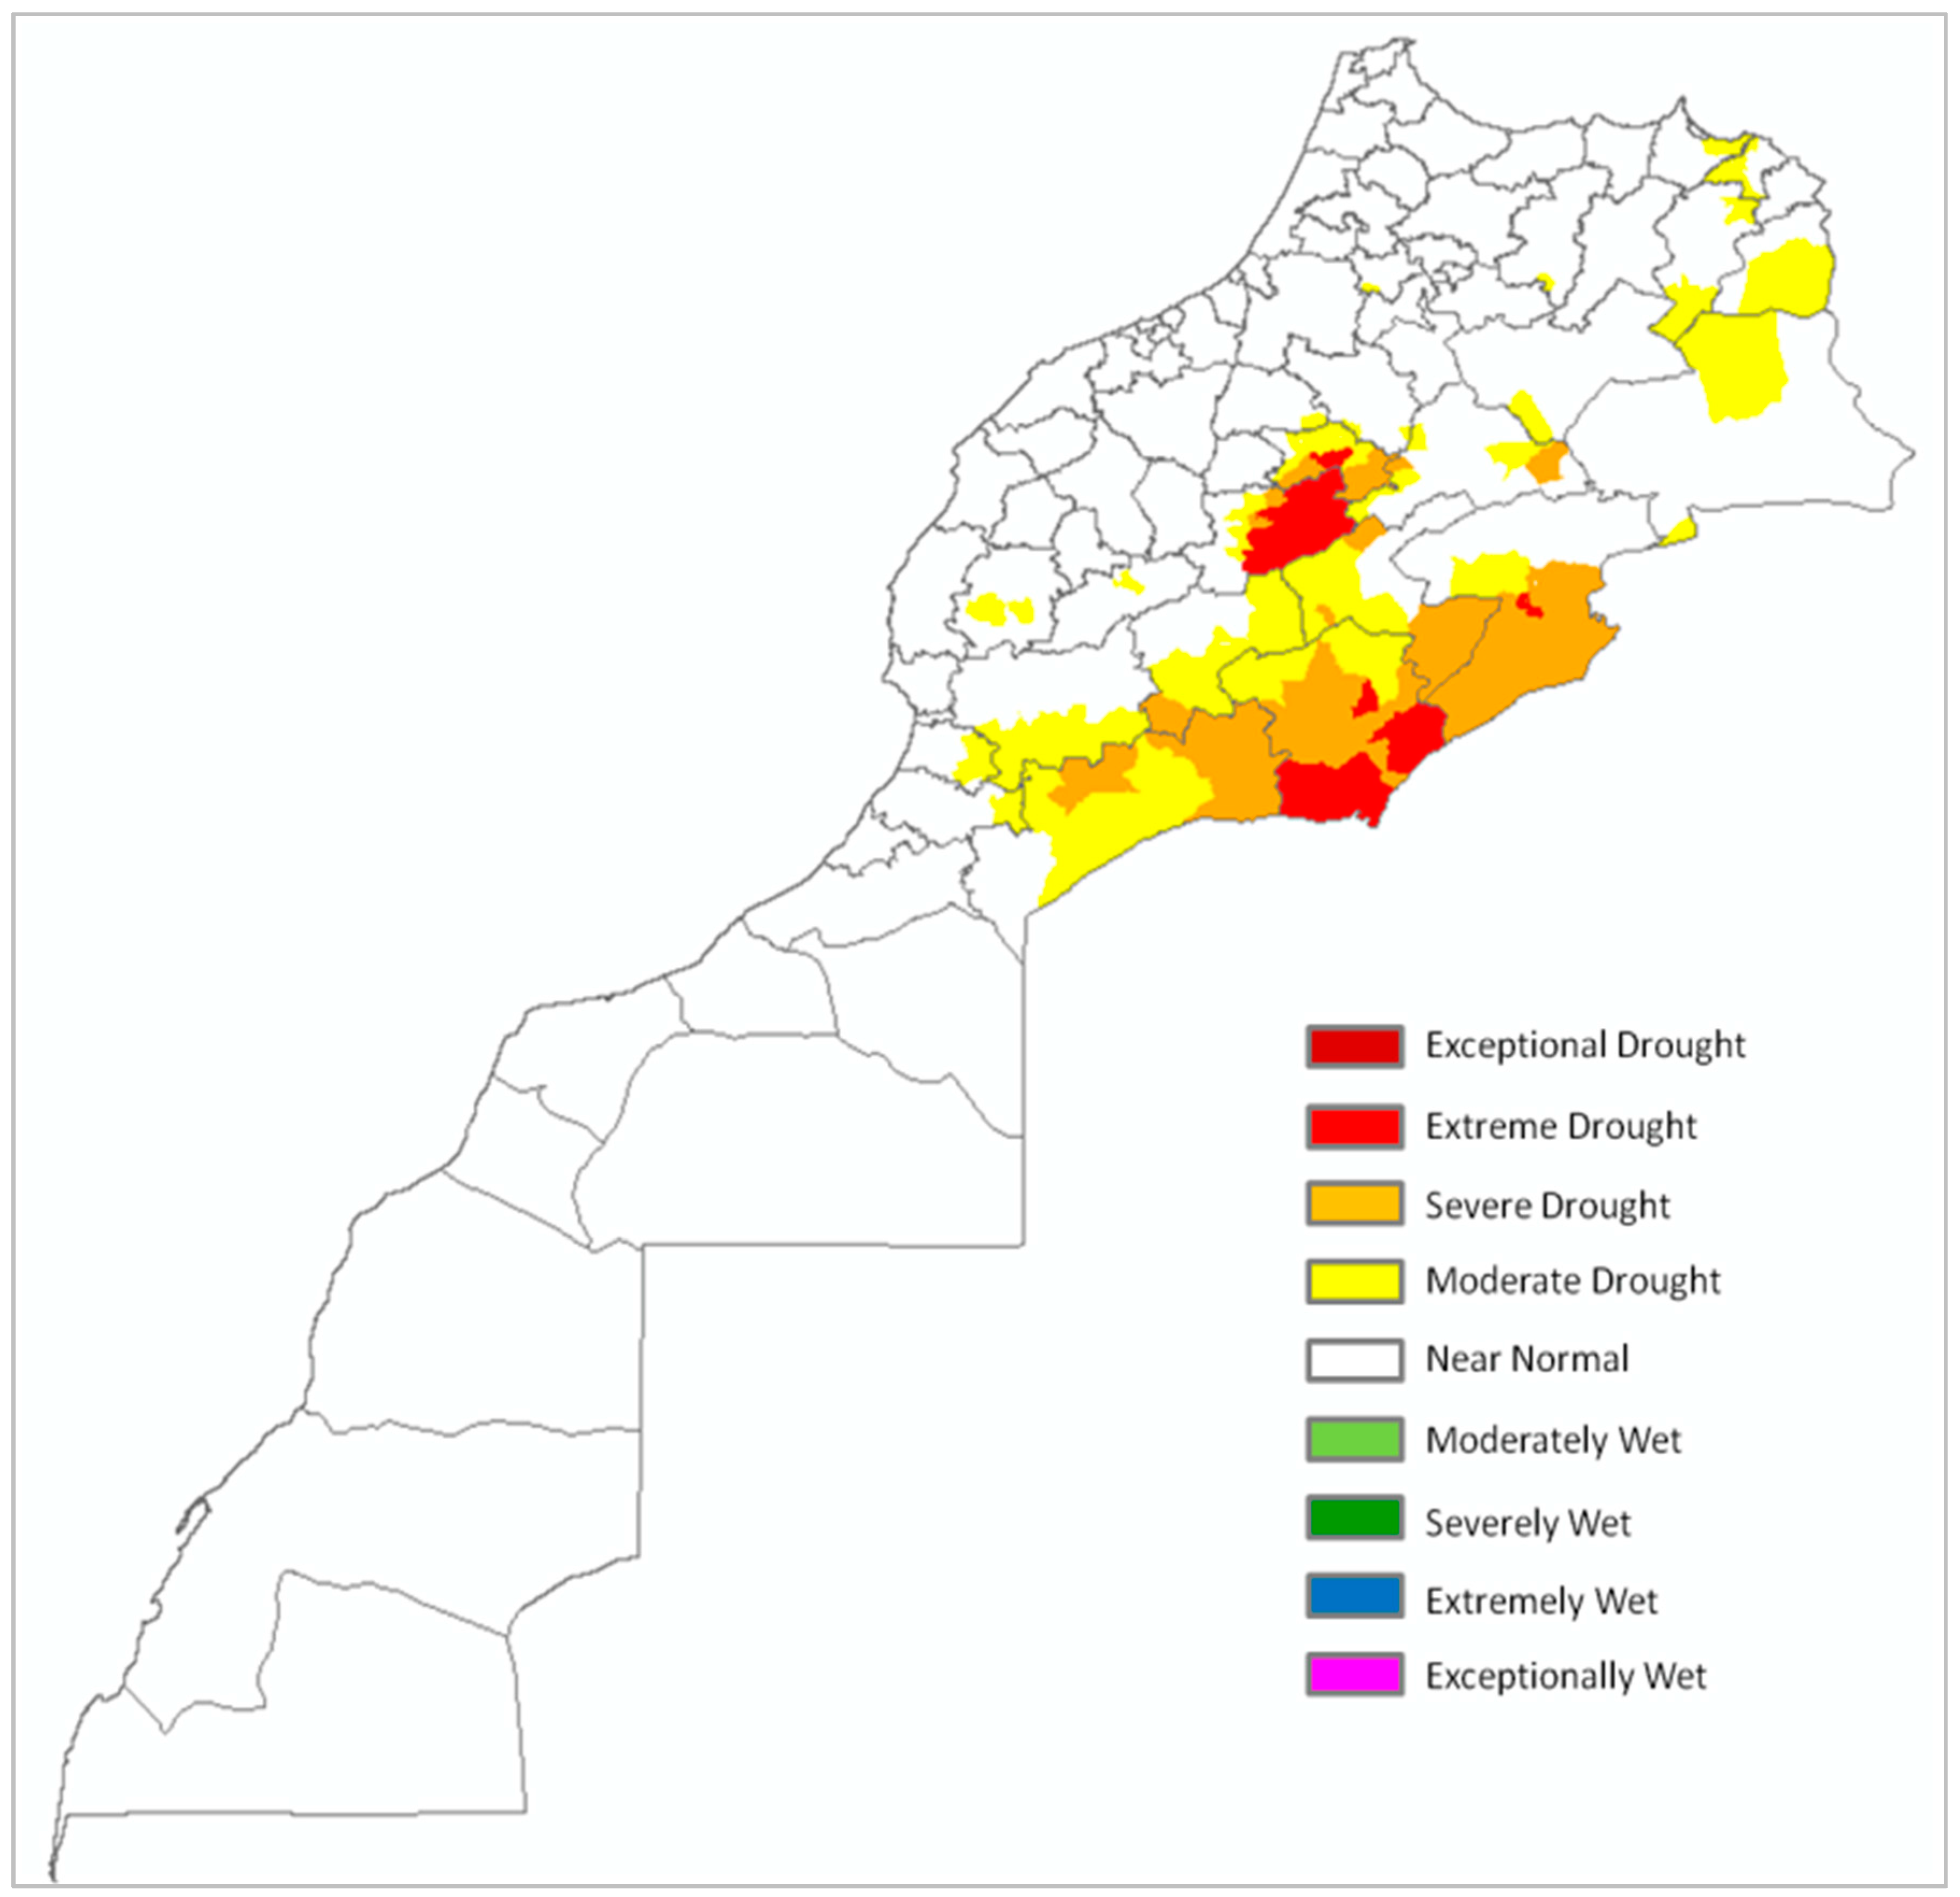
Since the CDI is calculated for each grid cell, the final map presents a mosaic of pixels corresponding to a specific drought category. In order to facilitate the analysis of the generated maps, we combined the raw raster CDI maps with a spatial data layer containing administrative boundaries (provinces and districts). Then, a statistical zoning calculation was applied to spatially aggregate the drought severity classes of the zone’s grid cells to a majority severity class that is assigned to in the corresponding administrative unit.
The objective of this statistical zoning step is to simplify the CDI maps for end users by assigning to each province or district a drought severity class. Decision makers can then evaluate the impact of drought at each province or district level.
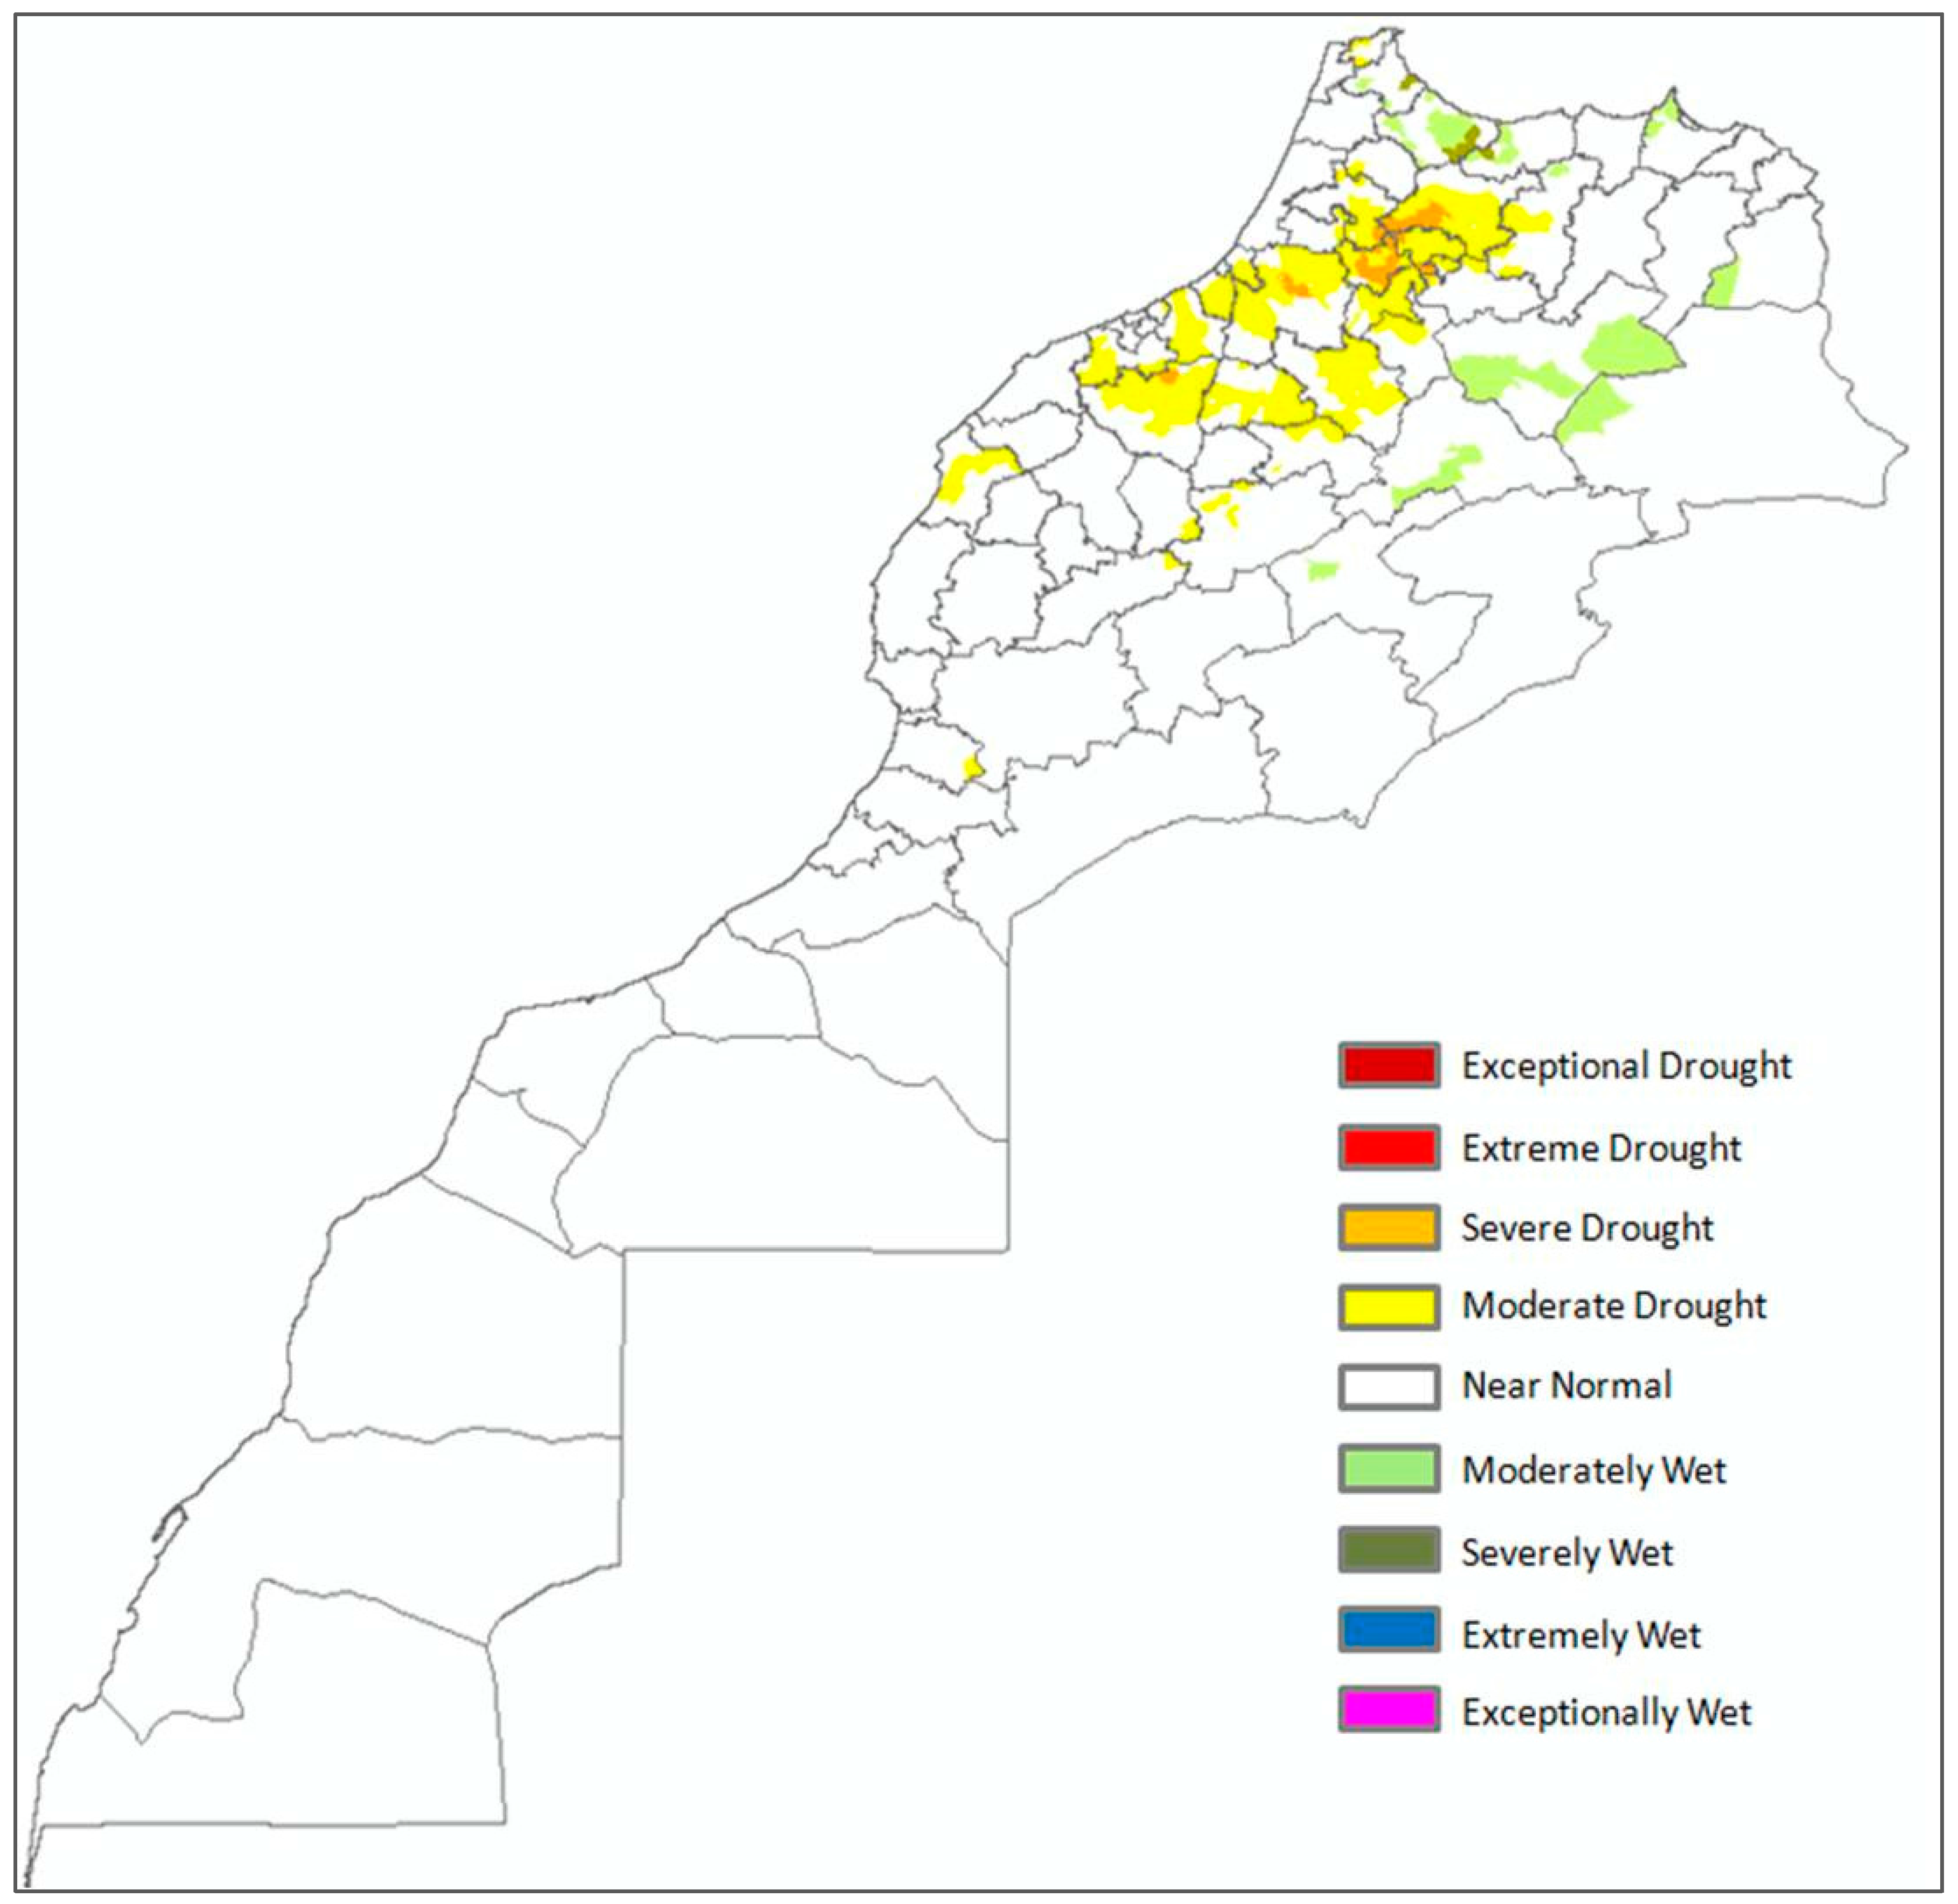
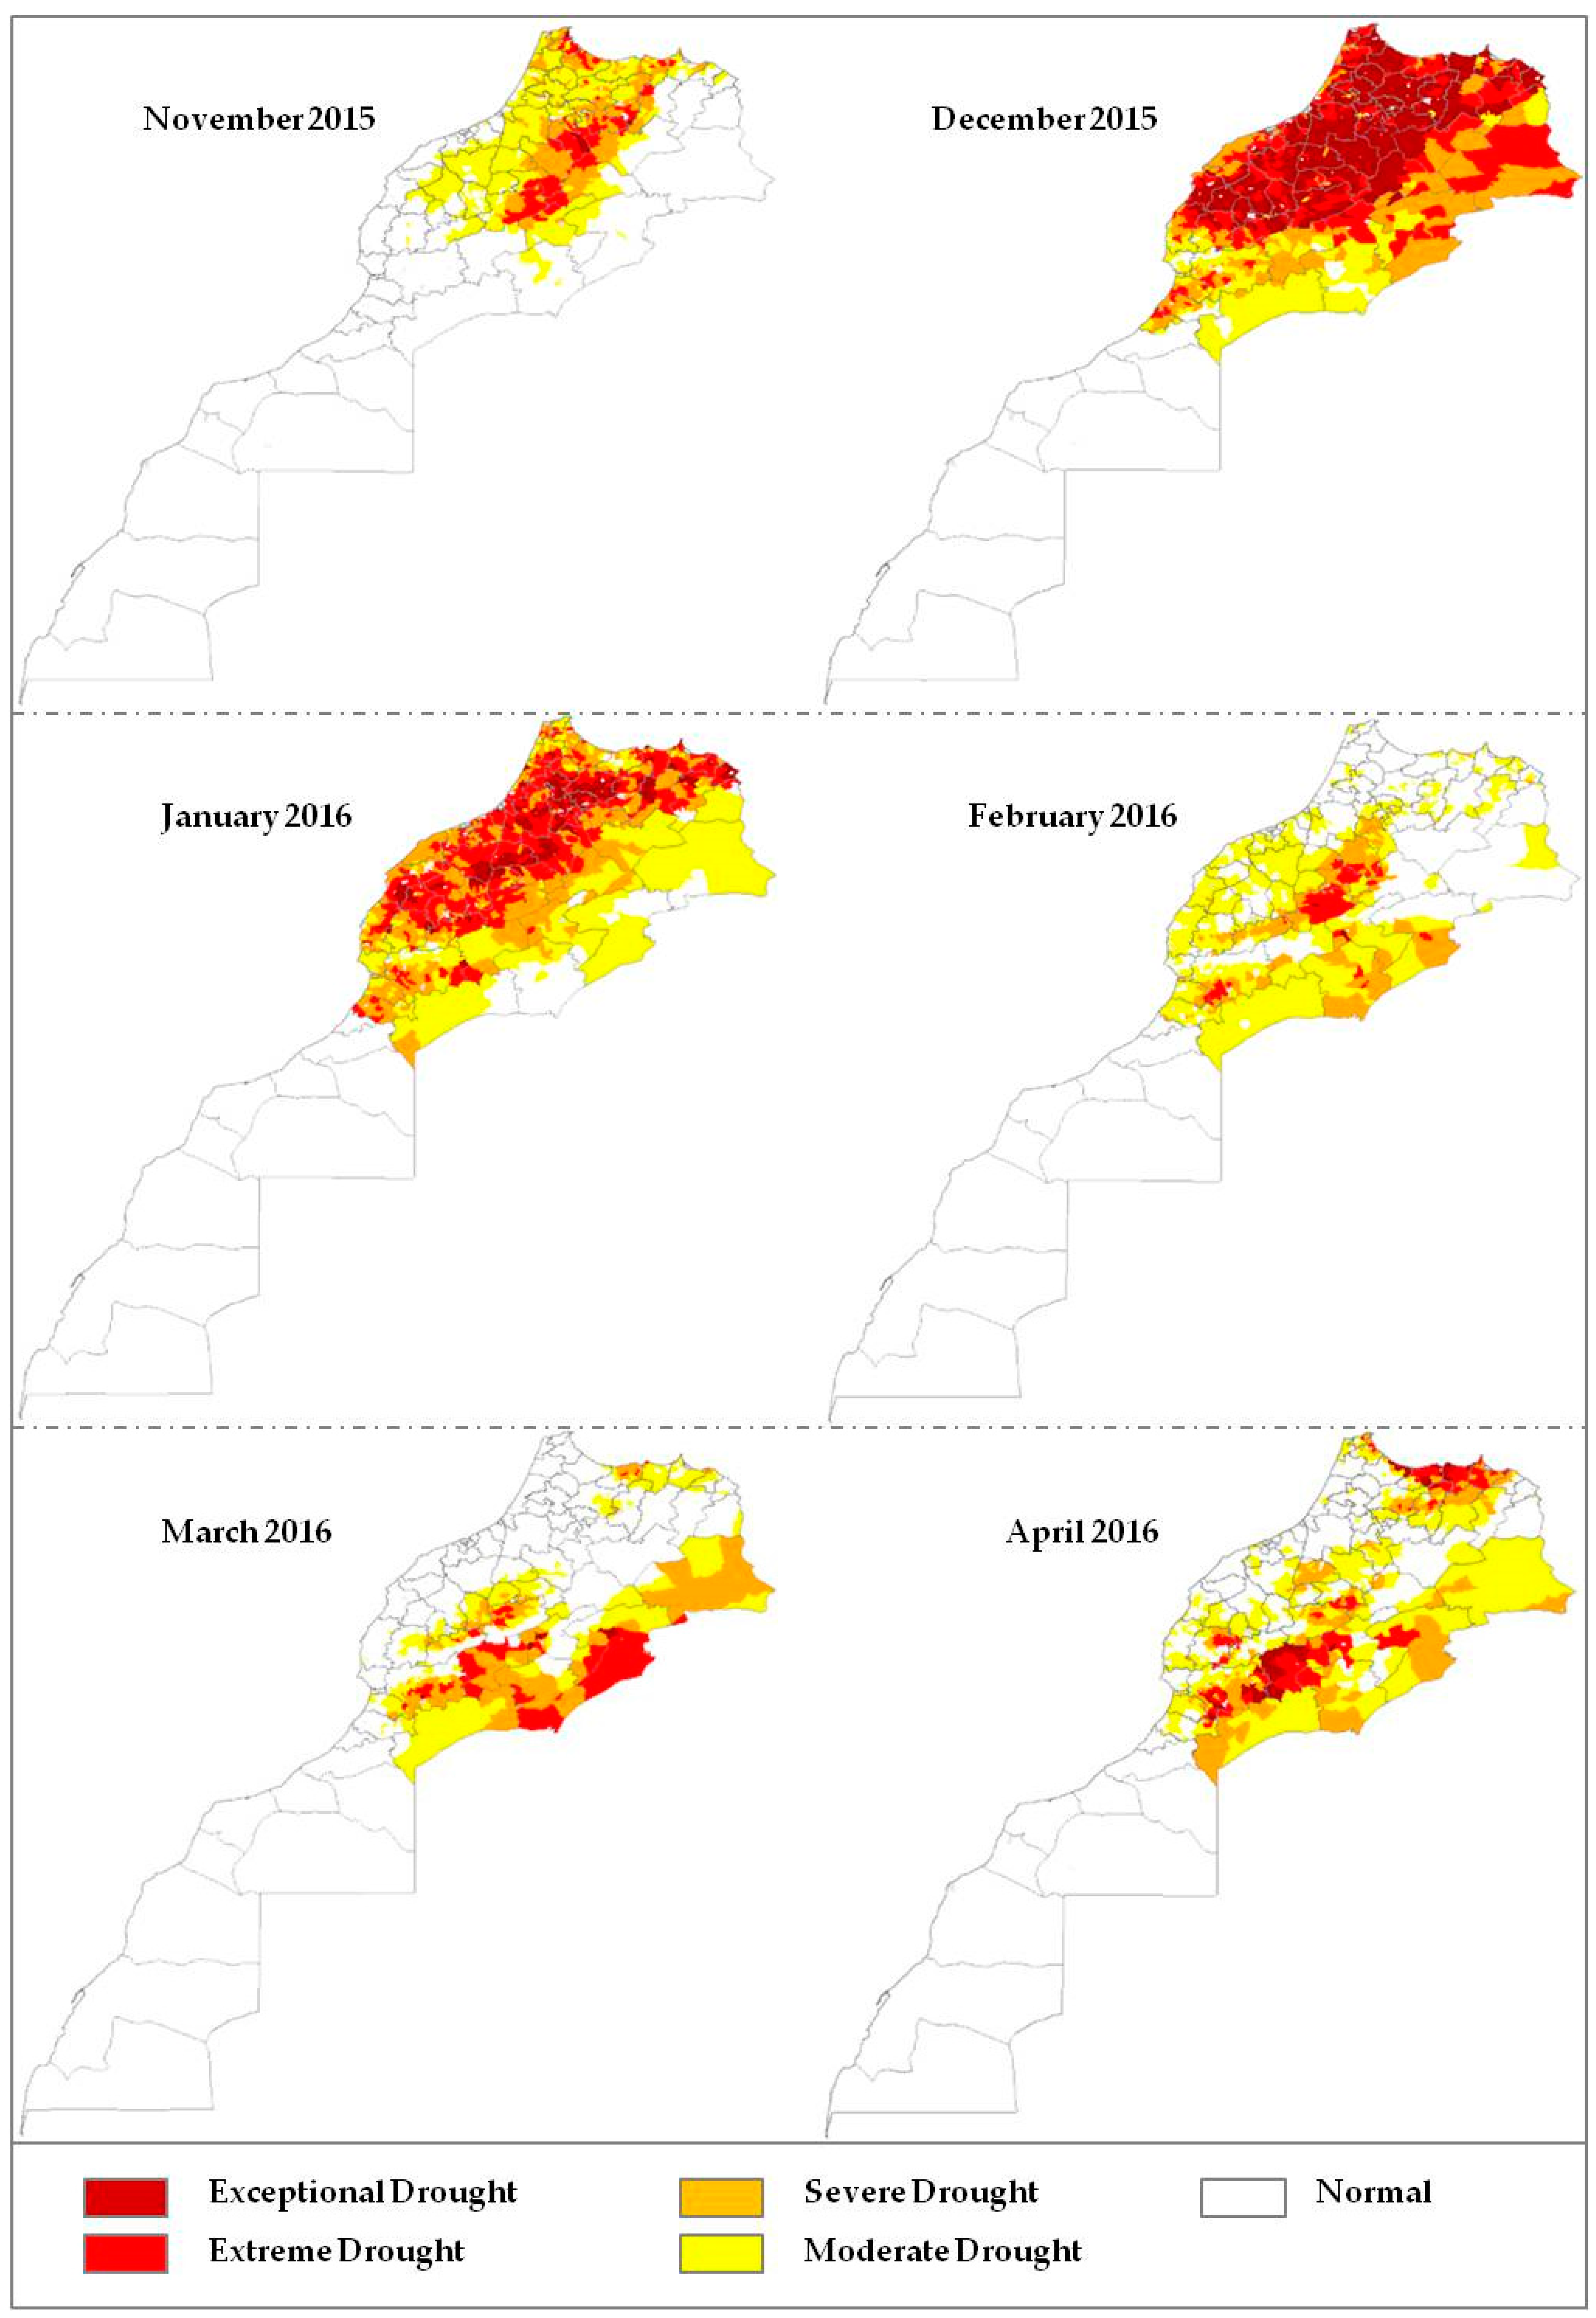
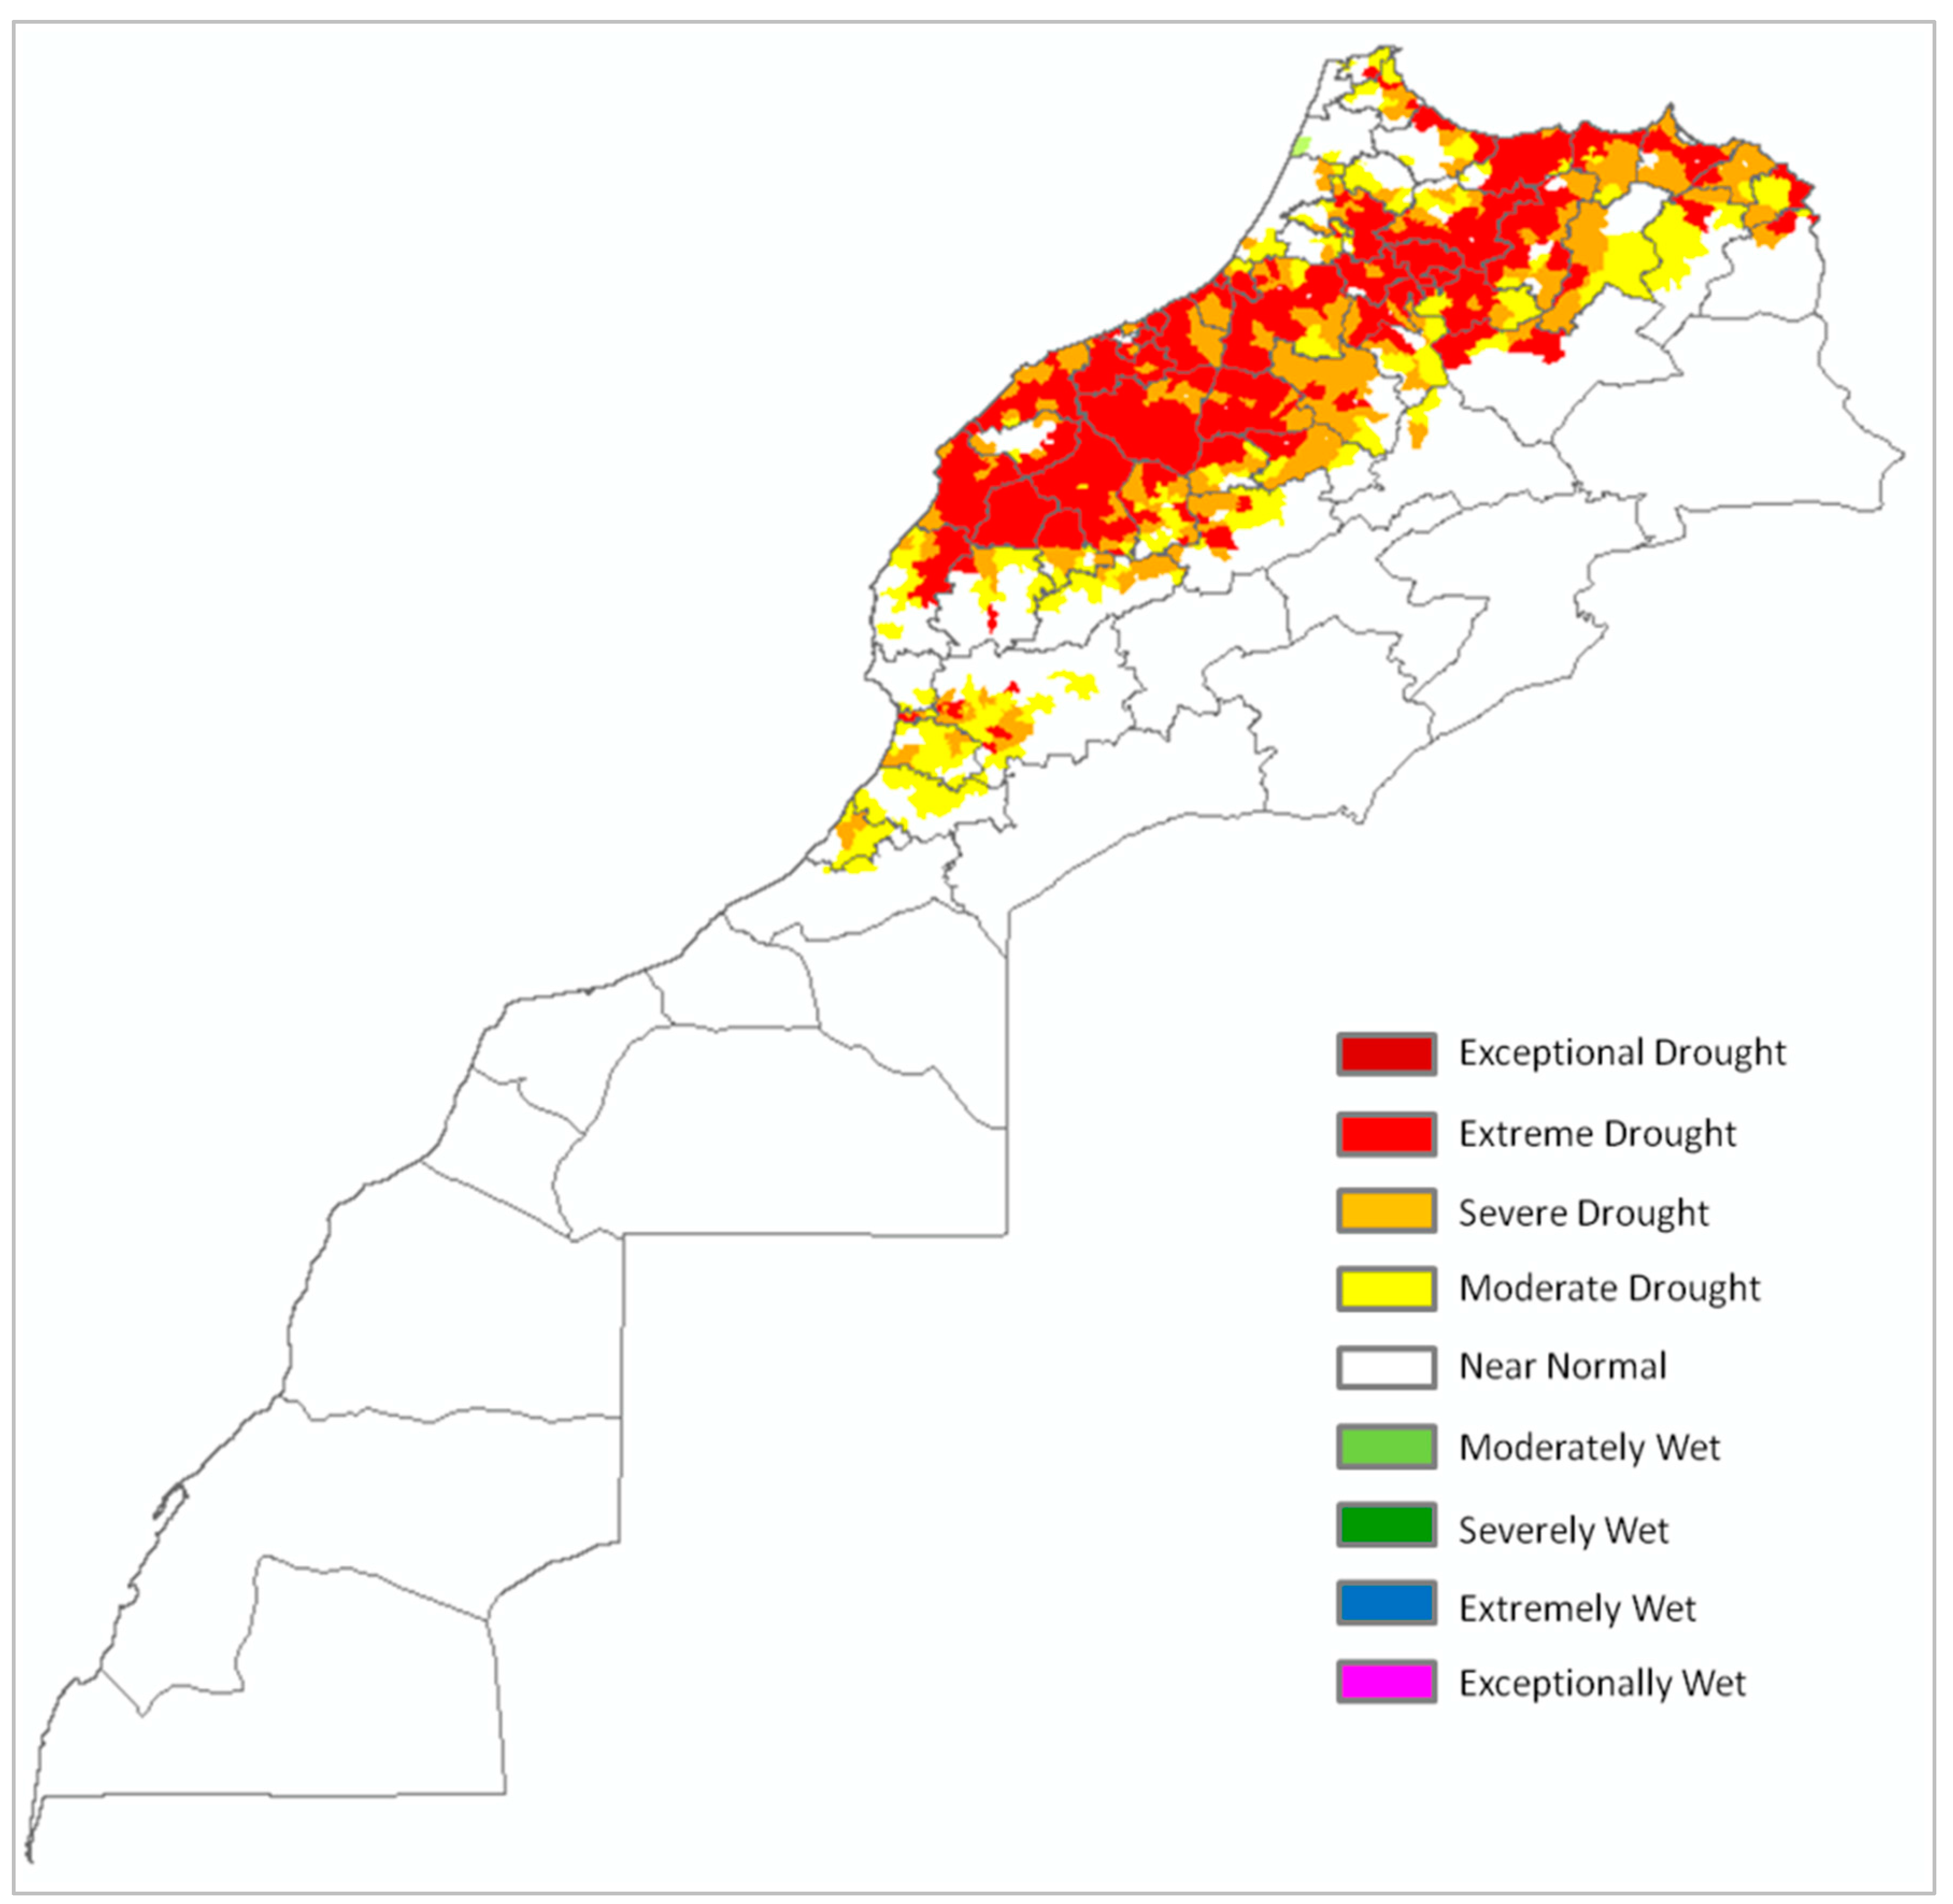
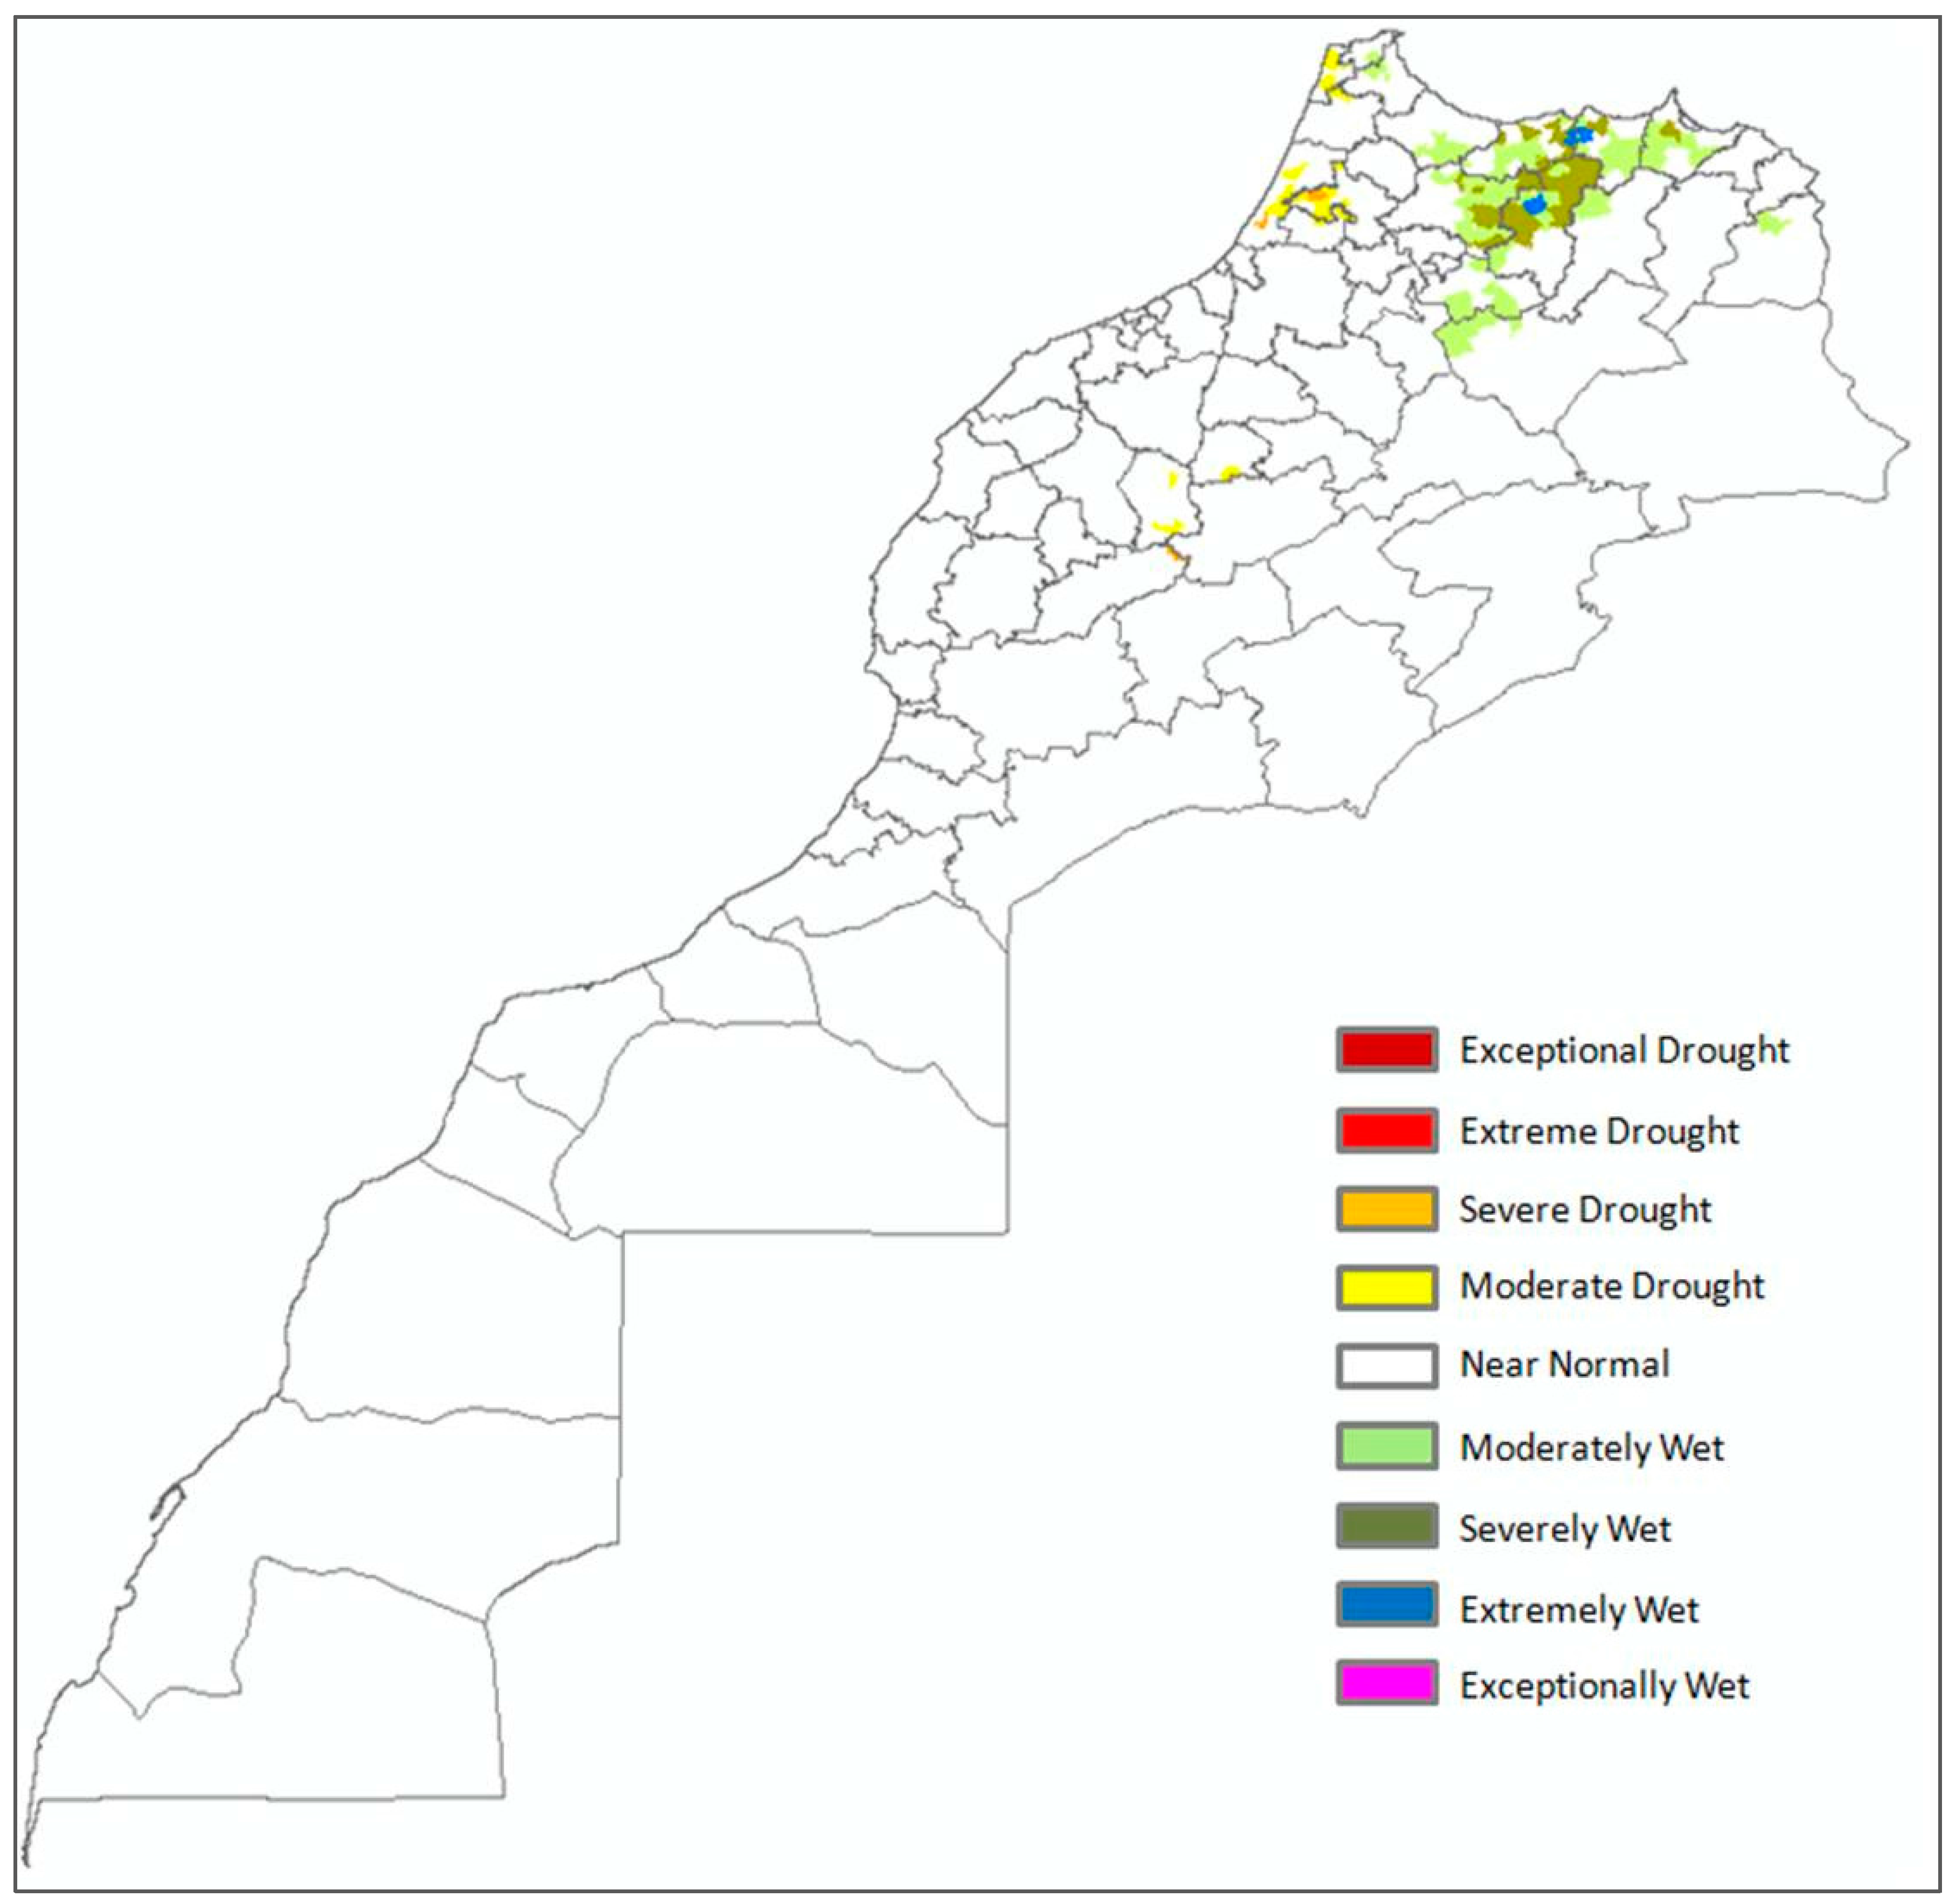
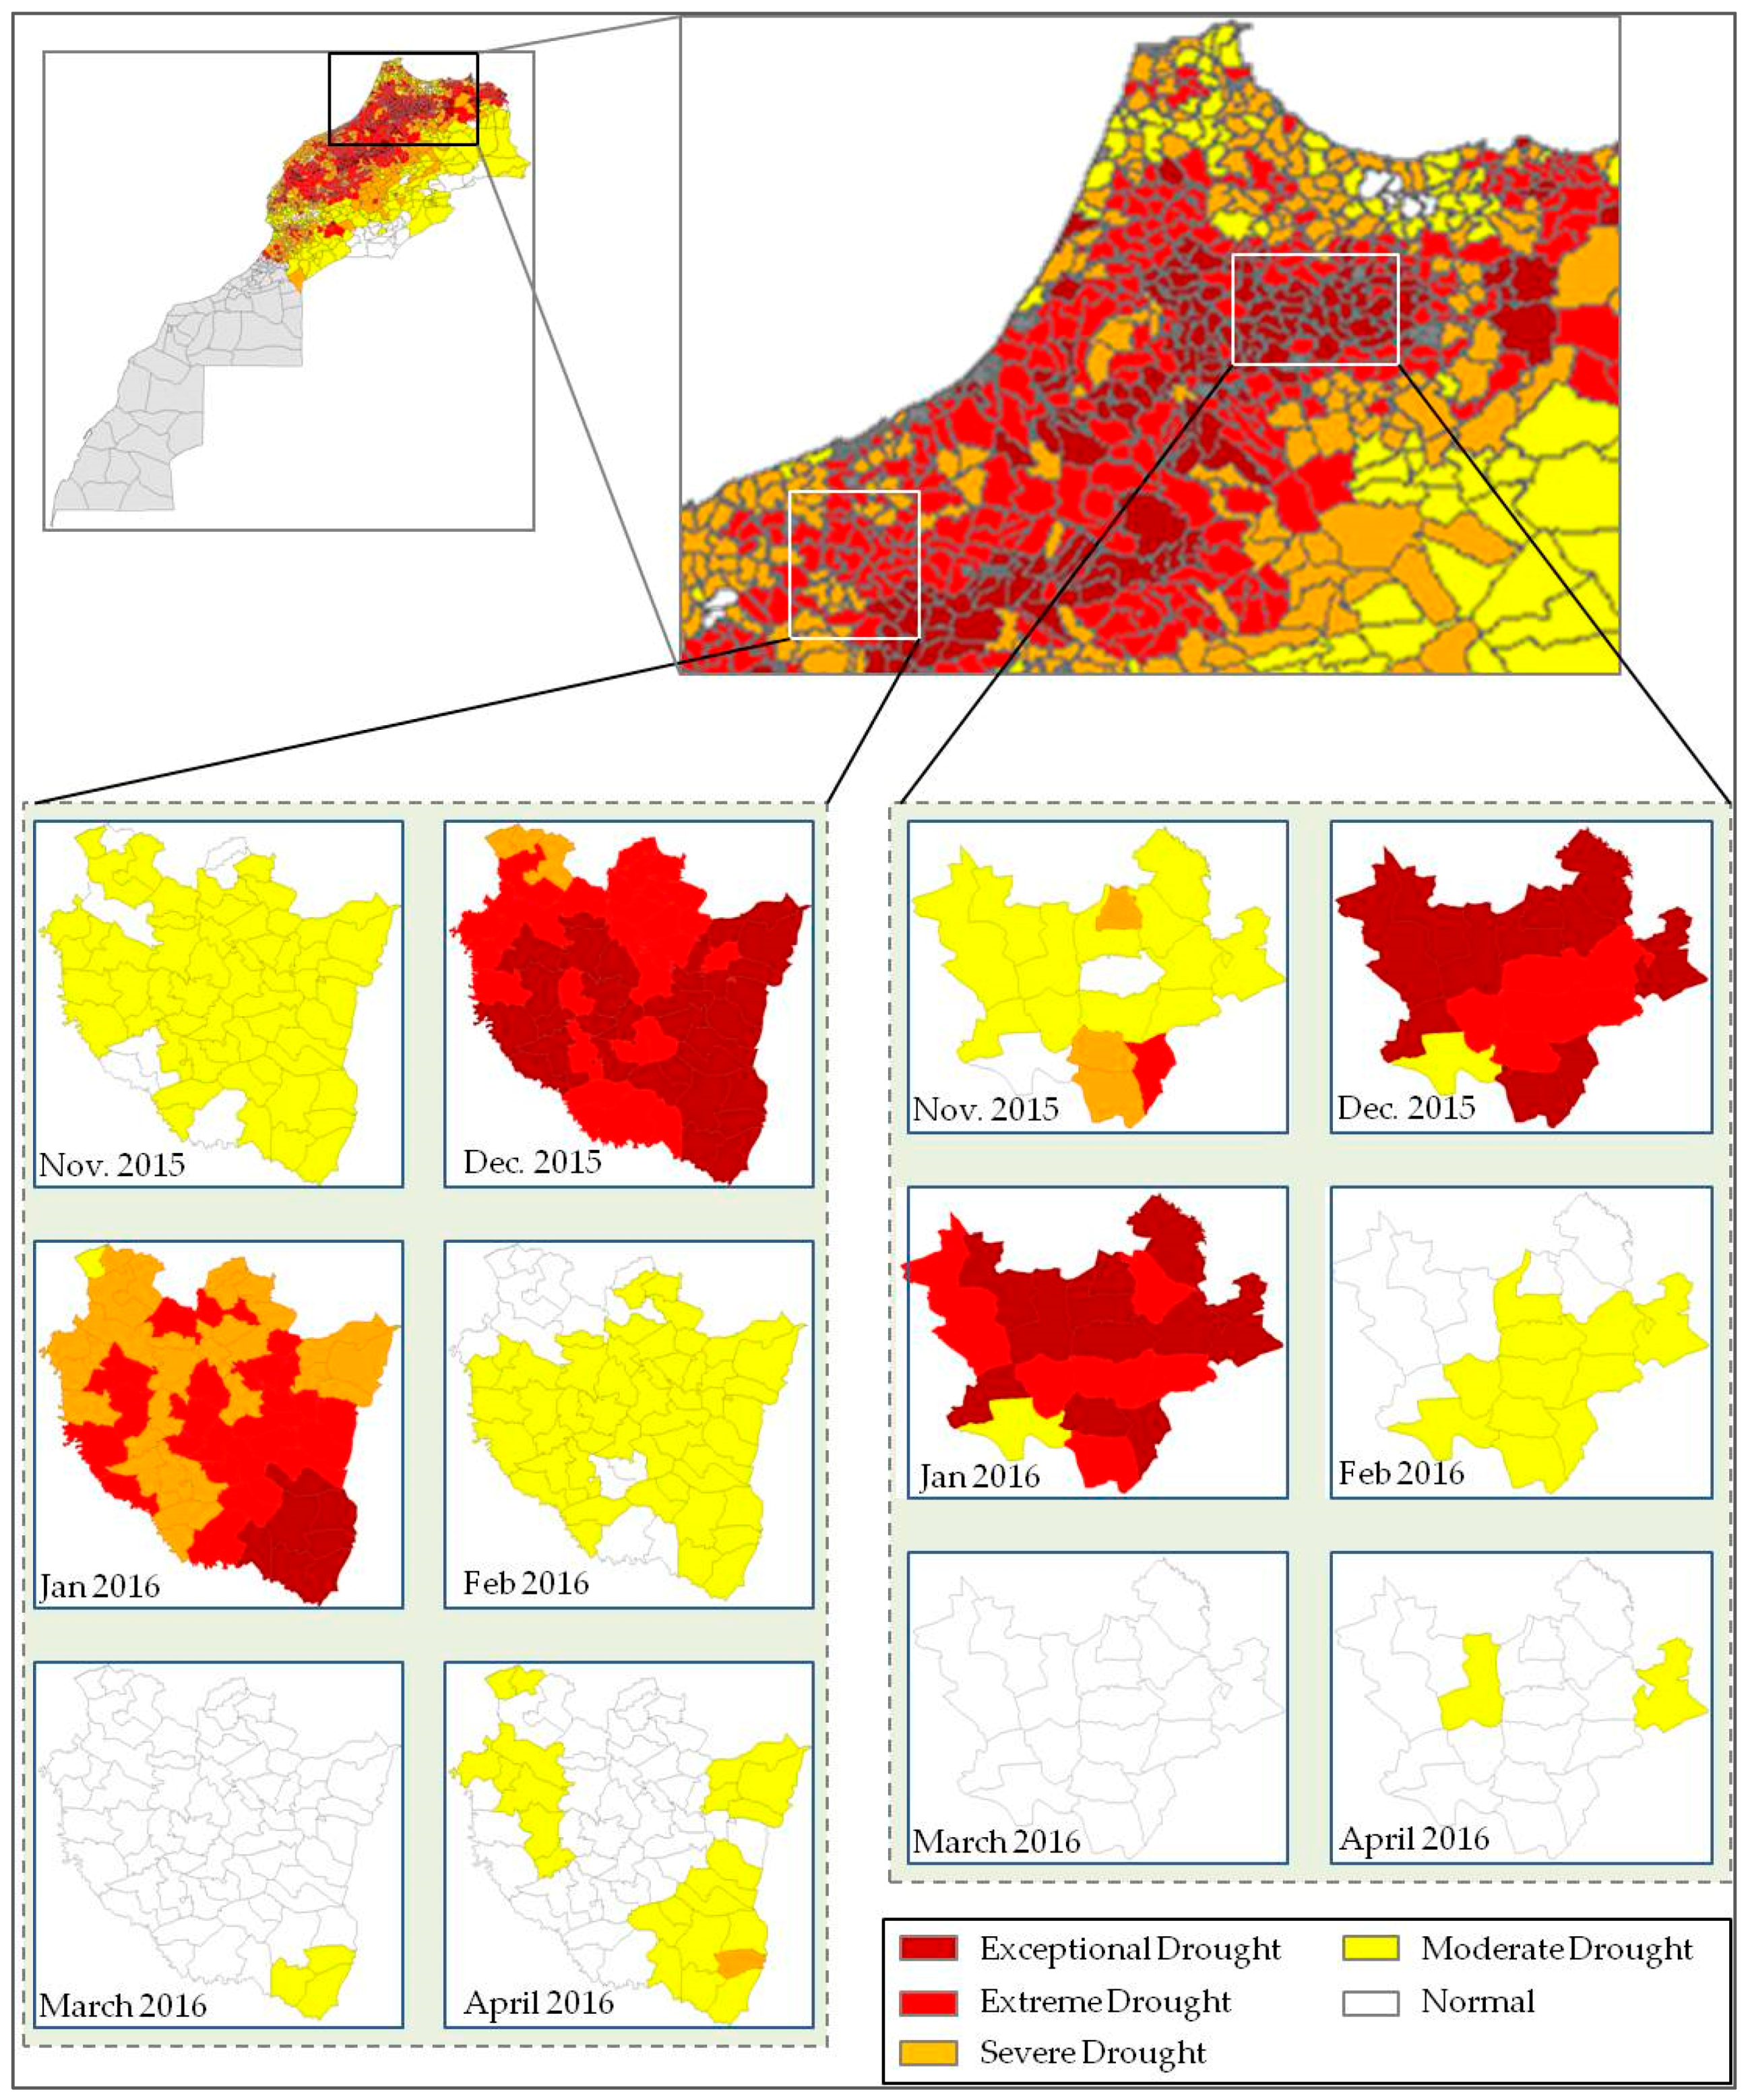
Figure 7 shows a time series of CDI maps generated during the 2015–2016 agricultural season.
From the above, it can be observed that the 2015–2016 growing season was strongly affected by drought. The persistence of exceptional, extreme and severe drought classes during the most sensitive period of the agricultural cycle (December–January), had a negative impact on non-irrigated cereal zones. These zones (about 5 million hectares) are located in the center, the eastern and the northern parts of Morocco and are very sensitive to drought.
The growing season (2015–2016) recorded a lack and a delay of rain as of November. Since the beginning of December, a rainfall deficit has started to increase compared to a normal year to exceed 63% at the end of January. The effects worsened during the following months with a rainfall deficit continuing to increase until the end of the season with about 50% [
23].
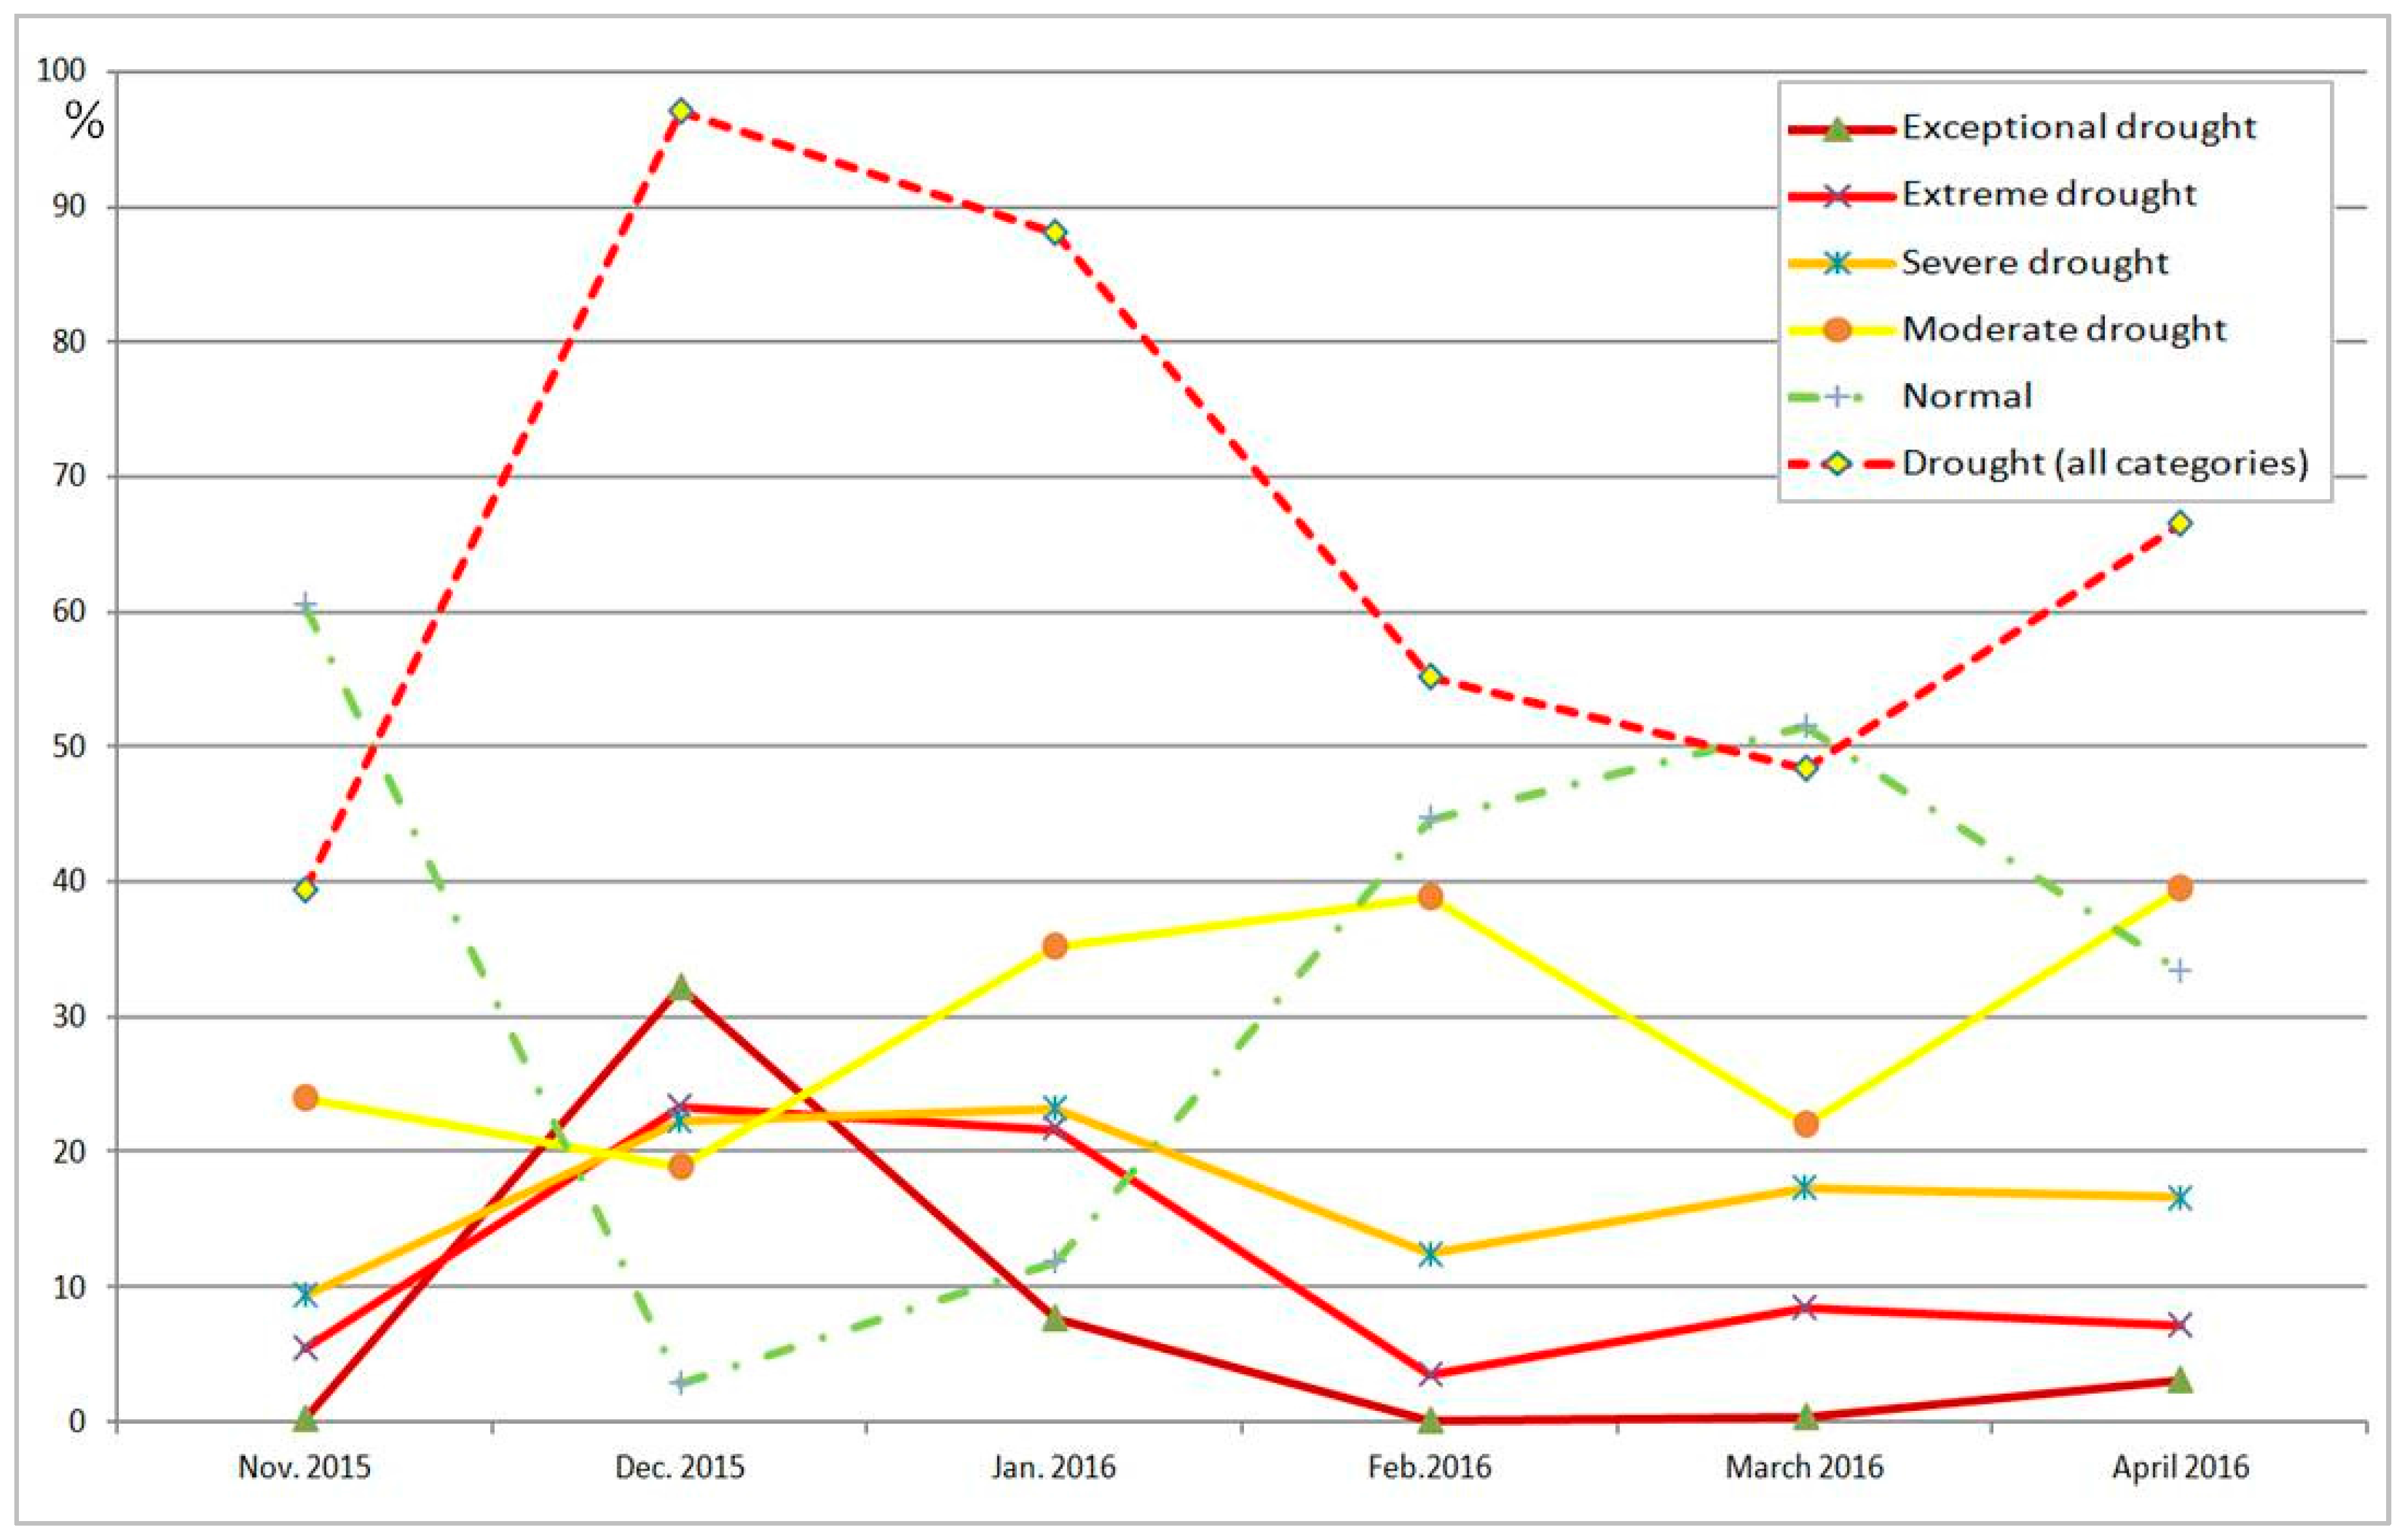
At the national scale,
Figure 8 shows that more than 90% of the national territory of Morocco (except the southern provinces) experienced drought during December 2015 and January 2016. This graph also shows that drought persisted on more than 50% of the national territory during the 2015–2016 season.
These first results at a national scale present a global characterization of drought during the 2015–2016 growing season. For a more in-depth evaluation of the CDI, two pilot areas were selected for further analysis: Settat and Meknes. The Settat province is located in the Chaouia region (less than 100 km in the south of Casablanca), which is relatively flat with a mean elevation of 400 m above mean sea level. Soil classes of the area are relatively homogeneous and generally characterized by loamy clays that are deep and highly productive. The climate of the region is semi-arid with hot and dry summers. Agriculture is dominated by non-irrigated cereals.
The Meknes site is part of the Saiss region (about 250 km north east of Casablanca), which is a very wide range of plains and plateaus of central northern Morocco. The soils in this site are characterized by the dominance of clays with low concentrations of organic matter. The mean elevation is about 600 m above mean sea level. The region is characterized by a Mediterranean climate and is dominated by cereals and olive trees.
Agriculture activities in these two areas are strongly rainfall dependent.
Figure 9 below presents the expansion of drought characterized by the evolution of CDI during 2015–2016 growing season in these two pilot areas.
This figure shows that both Settat and Meknes zones were under drought during most of the 2015–2016 growing season. Extreme and exceptional drought classes dominated the studied areas during the most sensitive period in the season (December–January), which has a negative impact on the winter cereals yields.
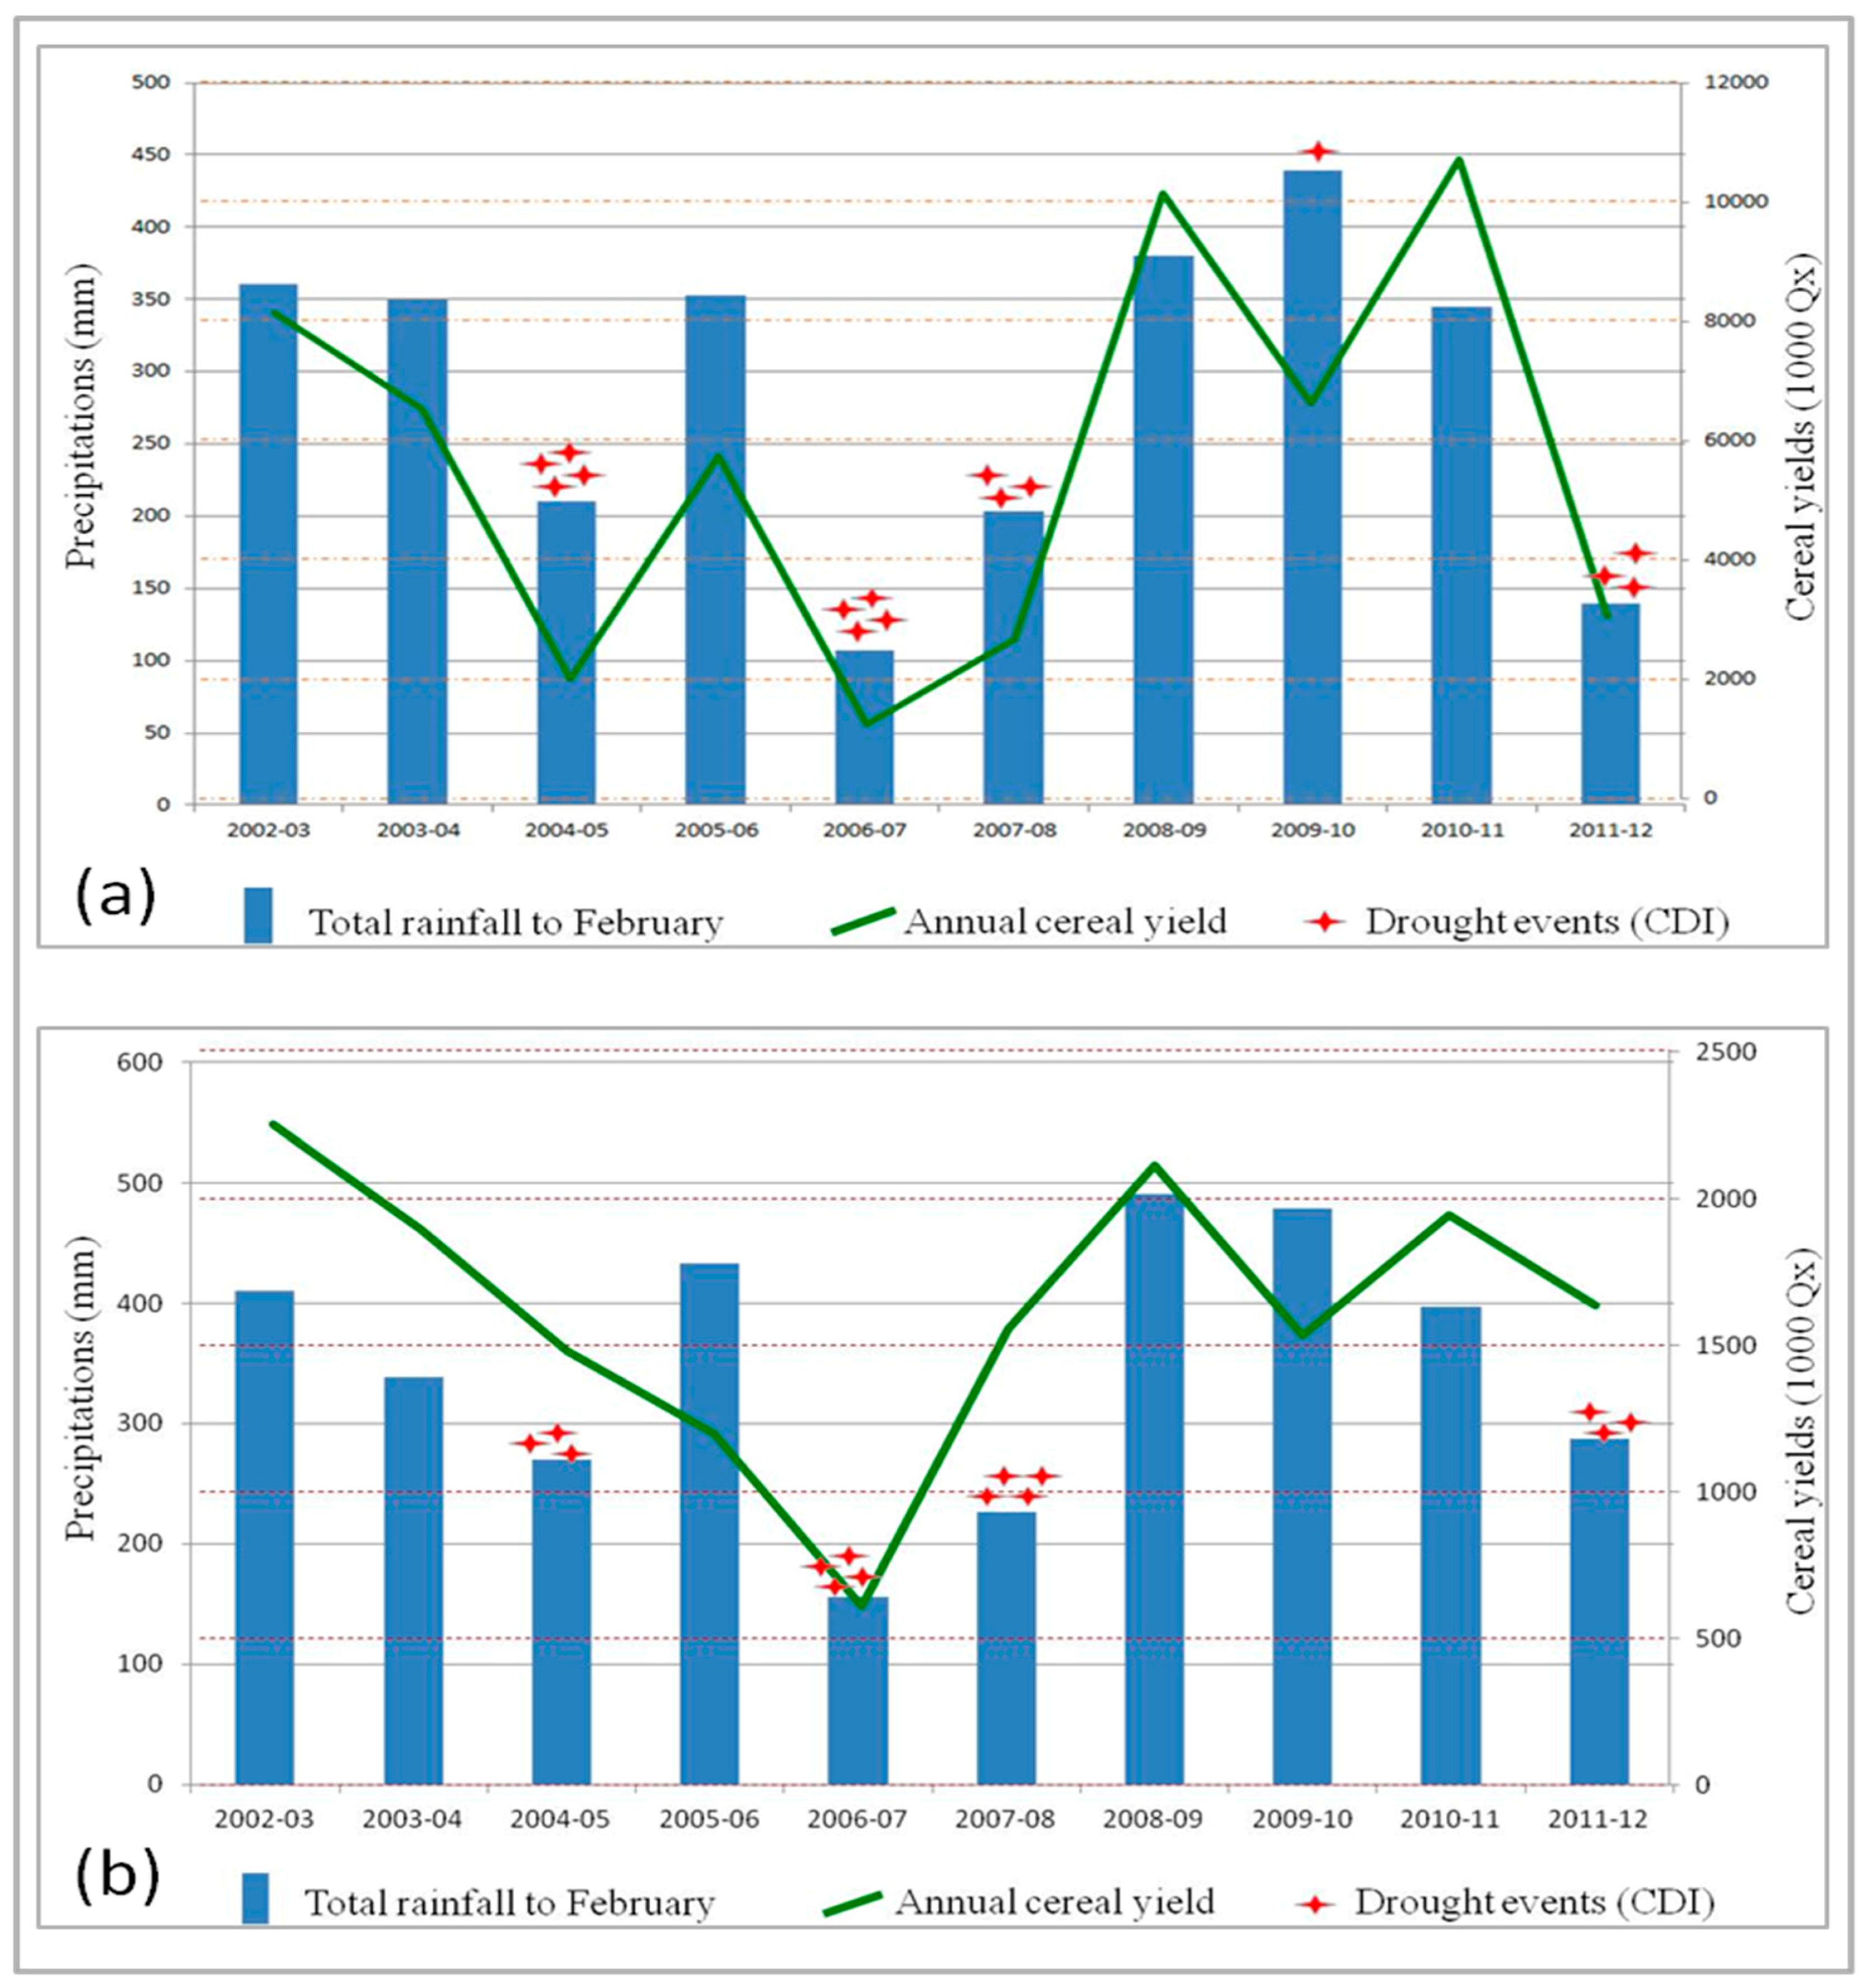
In terms of validation, it is important to understand how the individual data inputs (SPI, NDVI, ET and LST) represent drought conditions and reflect the geography extent, severity and duration of drought. The objective is to establish the accuracy and performance of the composite drought index across varying drought severity conditions. The methodology adopted consists on the comparison between the CDI generated maps (2003–2012) and the historical on the ground precipitation data at national scale on one hand and between CDI maps and historical yields across different provinces available between 2000 and 2012 on the other hand. The graphs in
Figure 10 illustrate the result of this combined comparison made between the two pilot areas: Settat and Meknes.
The analysis of the historical on the ground precipitation data at the national scale allows for the identification of two extreme situations: a dry year (2006–2007) and a wet year (2009–2010). These situations differ from one agricultural zone to another. For example, in the Saiss zone (Meknes), the wet year was 2008–2009 with a cumulative rainfall (from October to February) of about 490 mm.
The graphs show that the response of the CDI, which is solely based on remote sensing observations, matched up with the reported drought information that was measured (rainfall and yields) during 10 years over these two benchmark areas. In the Settat zone for example, the growing seasons with more than three dry months (CDI < 20) are: 2004–2005, 2006–2007, 2007–2008 and 2011–2012. These years were characterized by a cumulative rainfall of less than 200 mm and total cereal production less than 3000 Tons. The other growing seasons are considered normal with a total rainfall (through the end of February) greater than 350 mm and the annual cereal production exceeding 6000 Tons. Note that for the 2009–2010 growing season that despite the high level of precipitation measured in the Settat region, the remote sensing drought index depicted a moderate drought in this area during December 2009. Indeed, the total rain measured in the Settat region during this month was more than 160 mm, and vegetation wasn’t yet well developed at that point in time. Hence, some CDI input parameters (anomalies of NDVI, LST day-night difference and ET) indicated moderate drought situation in this zone.
Concerning the Meknes zone, the same growing seasons like in Settat zone (2004–2005, 2006–2007, 2007–2008 and 2011–2012) were identified as dry years according to the available measured data (total rainfall to February less than 300 mm and annual cereal production around 1000 Tons). Each of these growing seasons included at least 3 dry months detected by the CDI. This composite indicator CDI allows detecting two main components: the meteorological drought due to rainfall anomalies and precipitation deficit calculated from satellite data (CHIRPS) and compared to the ground precipitation data; and the agricultural drought highlighted by remote sensing based observations of the vegetation cover (NDVI anomalies, evapotranspiration anomalies and day-night difference land surface temperature).
6. Findings and Recommendations
Climate observations during the last 40 years have shown that Morocco is experiencing major impacts from climate change; e.g., warming of temperatures and rainfall deficiency. A significant consequence is the increase in frequency and intensity of droughts. The risk of drought in Morocco becomes a structural factor of the climate due to its recurrence and the sustainability of its impacts at different levels (e.g., socially, economically, ecologically). The apprehension and monitoring of this phenomenon require new technologies and more effective instruments to produce and disseminate information about drought: earlier, reliable, gridded and cost-effective.
The objective of this study is to develop an operational methodology for drought monitoring based on the use of remote sensing techniques combined to meteorological data and modelling. The combined drought index highlighted in this paper constitutes a new methodology of drought monitoring in Morocco. The added value is that we can monitor vegetation state at each 5 km grid cell every month by combining different input parameters: standardized precipitation index by using precipitation data from CHIRPS, anomalies in the day night difference of land surface temperature as a proxy for soil moisture, vegetation index anomalies and evapotranspiration anomalies from modelling.
The weighted combination of these input parameters into one composite indicator generated during the growing season (October to April) takes into account the importance of the rainfall-based parameter (SPI). The drought index maps are disseminated to the main users in Morocco (Ministry of Agriculture, Department of Water). These maps can be used also by other stakeholders: insurance companies, institutes of research and private farmers.
Finally, as recommendations for CDI near real time validation, it is necessary to identify potential expert evaluators representing the different regional services of the Ministry of Agriculture and other departments and sectors (e.g., climate experts, agricultural experts, agricultural producers, natural resource managers, and private sector) to assess and validate the CDI maps and input variables information during every growing season. This network of evaluators across different regions and agricultural provinces in Morocco can help to collect quantitative and qualitative information regarding drought and vegetation conditions for the local area. The mechanism to collect information from evaluators could be a standard survey to be completed via email, phone app, or website. The feedback can be used to evaluate the accuracy of the CDI maps across the growing season.
The system implemented in the framework of this project can be applied in other regions with different context, only the inputs and the weights have to be adapted to the specific characteristics of these regions.

 ,
, 


