Article

Spatially Distributed Evaluation of ESA CCI Soil Moisture Products in a Northern Boreal Forest Environment

Finnish Meteorological Institute, Space and Earth Observation Centre; Erik Palménin aukio 1, FI-00560 Helsinki, Finland
*
Author to whom correspondence should be addressed.
Geosciences 2018, 8(2), 51; https://doi.org/10.3390/geosciences8020051
Submission received: 25 December 2017 / Revised: 26 January 2018 / Accepted: 1 February 2018 / Published: 3 February 2018
(This article belongs to the Special Issue Soil Hydrology and Erosion)

Abstract

:
Several previous studies have discussed the challenges in remotely sensed soil moisture retrievals over northern boreal environments. However, very few studies have focused solely on an evaluation of these products specifically over these areas. This study provides an in-depth evaluation of the European Space Agency’s (ESA) Climate Change Initiative (CCI) Soil Moisture (SM) product and its components; ACTIVE and PASSIVE soil moisture retrievals. The performance of a spatially distributed soil moisture model (SAC-SMA) is first validated with in situ observations collected from the Finnish Meteorological Institute’s (FMI) multidisciplinary research center near the town of Sodankylä, in Northern Finland. SAC-SMA model top soil layer moisture estimates are then used for spatially distributed ESA CCI SM product evaluation. The study domain covers an area of 155 km by 140 km. Evaluation is performed for thawed/snow-free periods between 2003 and 2015. The ACTIVE product exhibits high correlations with SAC-SMA soil moisture estimates during most analyzed years. The presence of high inter-pixel soil moisture time series cross-correlation, even between pixels with very different soil/vegetation type distributions, as well as the inconsistent performance between analyzed years, is problematic. The PASSIVE product is able to more consistently capture the trend in soil moisture variation; although the trend is seemingly captured, the rapid response to precipitation events is less accurate. Our results indicate that, in contrast to other previous studies, despite the challenges, the ESA CCI SM products do exhibit reasonably good performance, and that further improvements, even with current Earth Observation methods, may be possible.

1. Introduction

Remotely sensed data, such as the European Space Agency’s (ESA) Climate Change Initiative (CCI) Soil Moisture (SM) data product (ESA CCI SM), require evaluation in different climatic regions by means of in situ observations and/or through validated soil moisture models. Several previous studies, e.g., [1,2,3,4,5], have shown poor performances for remotely sensed soil moisture datasets over northern boreal environments and at high latitudes (>60° N). For example, [3] reported a very low average correlation value of −0.24 between in situ observations made in Sodankylä, Finland and the ESA CCI SM product between the years 2007 and 2009. Similarly, [2] reported average correlation values of less than 0.2 for ASCAT soil moisture retrievals with in situ observations in Sodankylä between the years 2007 and 2009. Typically, studies that include evaluation sites in boreal environments (including the aforementioned) do not go be beyond a relatively simple, single pixel/point scale evaluation, or beyond an evaluation against readily available global scale land surface model data, e.g., [1,6], which in themselves may contain large uncertainties and assumptions [7]. In most cases, when satellite-based soil moisture retrievals in boreal environments are evaluated, the study sites (such as those located in, e.g., Finland) only form part of a much larger global scale or multi-site assessment. Therefore, the importance of focusing on the underlying causes for discrepancies in any specific site is limited, and the differences between satellite-based retrievals and in situ observations/model estimates are typically considered as unavoidable and addressed through theoretical reasoning, without further investigation, rather than through empirical experiments. With the onset of climate change, and the continued increasing economic and social importance of the northern boreal zone, more emphasis on providing tangible error characterizations and applicability assessments for satellite-based soil moisture retrievals is becoming more important. This study provides an in-depth spatially distributed evaluation of the ESA CCI SM product over a typical Northern boreal forest/taiga environment. Evaluation is performed for thawed/snow-free periods between 2003 and 2015; between 1st June and 30th September of each year.

2. Study Area and Materials

The Sodankylä region is located in Northern Finland (see Figure 1) and represents a typical Northern boreal forest/taiga environment; 71% of the surrounding landscape, within an approximate 80 km radius, is forested. Open and forested bogs cover 18% of the area. The landscape is relatively flat with moderately sloping rocky hills. Soils within the Sodankylä region are mainly comprised of weakly podzolized Haplic Podzols, with varying grain sizes. The general distribution of organic soils (Histosols) follows a North-West to South-East diagonal. The northern portion of the area contains larger and more extensive areas of organic and semi-organic (Umbric Gleysol) soils. Fine sandy-loam soils (Haplic Arenosols) are found predominantly within the immediate proximity of large rivers. Terminal moraines at the edges of the greatest extent of past glaciers have formed deposits of silty parent material; forming Eutric Regosols. The remainders of soil types within the Sodankylä region consist predominantly of exposed bedrock and Leptosols (6%), formed through both glacial erosion and weathering. They are found mainly on hill tops and on slopes, and have a low capacity for holding water, i.e., they can become thoroughly saturated during rainfall events, while drying rapidly through drainage and evaporation thereafter. A more detailed description of the Sodankylä area’s soil types, distributions, and landscapes is provided in [4].

2.1. ESA CCI SM Products

The ESA CCI SM dataset represent a harmonized, satellite observation-based product of surface soil moisture with global coverage. The product version used in this study (v03.2) covers the years 1978 to 2015 with daily time steps at a spatial resolution of 0.25°. The product combines several single-sensor active and passive microwave soil moisture products into three products: a merged ACTIVE, a merged PASSIVE, and a COMBINED active + passive microwave product [8].
The ACTIVE product is produced by merging scatterometer data, derived from Active Microwave Instrument Wind Scatterometer (AMI-WS) (prior to 2007) and Advanced Scatterometer (ASCAT) instruments [9]. The PASSIVE product is based on merging soil moisture data from the Scanning Multichannel Microwave Radiometer (SMMR), Special Sensor Microwave Imager (SSM/I), Tropical Rainfall Measuring Mission’s (TRMM) Microwave Imager (TMI), Advanced Microwave Scanning Radiometer—Earth Observing System (AMSR-E), Soil Moisture and Ocean Salinity (SMOS), and Advanced Microwave Scanning Radiometer 2 (AMSR2) instruments [10]. Prior to merging, all input datasets are resampled to a common reference time stamp and grid. Further, since all input datasets have different dynamic ranges, they are rescaled into a common climatology through CDF-matching. The PASSIVE product is provided with the AMSR-E product’s dynamic range, while the ACTIVE product utilizes the dynamic range of MetOp-A ASCAT data. GLDAS-Noah v1 (The Global Land Data Assimilation System) [11] land surface model soil moisture estimates serve as the reference soil moisture dataset for scaling the COMBINED and PASSIVE products into a common climatology. The error properties of the ACTIVE and PASSIVE products are used to derive the weights of each observation to allow for a dynamic weighted average. These error properties are determined through triple collocation analysis. This so-called SNR (Signal to noise Ratio) blending scheme enables the blending of more than two retrievals available at the same time [8,12].
A major shortcoming of all of the ESA CCI SM products is the large amount of missing data (see Table 1). The percentage of missing data for the analysed period (1 June to 30 September) on a year-by-year basis, between 2003 and 2015 for the ACTIVE product, ranges from 10 to 87% with an average of 32%. The corresponding missing data percentage for the PASSIVE product is also large, ranging from 10 to 55% with an average of 24%. There is a clear trend in the triple collocation procedure in favouring PASSIVE soil moisture retrievals for the latter years of the analysis period, although there is a clearly observable increasing missing data trend for PASSIVE soil moisture retrievals for the same period. Subsequently, ACTIVE soil moisture retrievals are favoured during the first years of the analysis period although these years exhibit the largest amount of missing data. As a consequence, the COMBINED product sustains a high average yearly percentage of missing data through-out the analysis period, ranging from 37 to 88%, with an average of 59%.

2.2. In Situ Soil Moisture Observations

The soil moisture stations within the Sodankylä Calibration-Validation (CAL-VAL) site are equipped with Campbell Scientific Ltd. CR850 and CR1000 data loggers, as well as Decagon 5TE and GS3 electromagnetic and Campbell Scientific Ltd. CS655 digital soil moisture sensors. Each station has one vertical measuring profile and two additional horizontal measuring points. The vertical profiles have five sensors placed close to the station at the following depths: −80, −40, −20, −10, and −5 cm in mineral and semi-organic soils; and at −40, −30, −20, −10, and −5 cm in organic soils. The two additional horizontal measuring points, at depths of −10 cm and −5 cm, have been installed approximately ten meters from the station in opposing directions in order to catch small-scale variations in top soil moisture. Currently, ten soil moisture stations have been installed around the Sodankylä CAL-VAL site. The first stations were installed in August 2011. In this study, data from only six stations are used since the first new station was installed in 2015 and the other three have been installed during the autumn of 2016. Data from these are therefore beyond the temporal scope of this study. See Table 2 for a list of the stations and their soil/land cover representativeness, in addition to the sensor types used in this study. A more detailed description of the Sodankylä CAL-VAL soil moisture observation network and its instrumentation is provided in [4]. Figure 1 depicts the locations of the CAL-VAL sites used in this study and the location of the Sodankylä region/study domain.

2.3. The SAC-SMA Model

A spatially distributed (gridded) version of the “Sacramento Soil Moisture Accounting Model” (SAC-SMA) [13] coupled with a potential evapotranspiration model based on Hamon's approach in [14] form the modelling components used in this study. Each SAC-SMA model grid cell contains separate soil/vegetation type tiles used to compute sub-grid cell soil moisture fluctuations. The spatial coverage (size) of each individual tile varies from grid cell to grid cell based on the distribution of soil types within each grid cell.
With the SAC-SMA model, we calculate mineral soil and shallow rocky soil tile soil moisture through two conceptual vertical soil zones; an upper zone representing short-term surface soil and interception storage, and a lower zone representing deeper root zone soil moisture storages. The zones have free water and tension water elements, where the free water (fast flow component) is predominantly driven by gravitation forces, but may also be depleted by evapotranspiration, percolation, and horizontal flow, while the tension water (slow flow component) is driven by evapotranspiration and diffusion. Organic and semi-organic soil tile soil moisture is calculated with a single conceptual soil moisture storage (represented by an impervious area fraction parameter “ADIMP” in the model) that can only be depleted by evapotranspiration and horizontal flow. A conceptualization of the SAC-SMA model and our implementation is provided in Figure 2.

SAC-SMA Model Parametrization

The parameters for the SAC-SMA model were derived from a semi-physical a-priori parametrization scheme originally developed by [15]. The a-priori parametrization scheme requires as the input soil water characteristics; wilting point (WP), field capacity (FC), saturation point (SP), water holding capacity between the wilting point and field capacity (TENS-CAP), water holding capacity between field capacity and saturation (GRAV-CAP), specific yield (SY), saturated hydraulic conductivity (SAT-COND), and a descriptive hydrological soil/land cover parameter CN (curve number). The curve number (often simply referred to as CN) is an empirical parameter used in hydrology for predicting direct runoff or infiltration from rainfall excess (see e.g., [16]).
The calculation of soil water characteristics is based on soil texture, as well as organic matter and gravel content. The required soil water characteristics were calculated using the formulas described in [17]. The data for soil water characteristics calculation and CN estimation were derived from soil texture properties data and land cover information provided in the national GTK Quaternary deposits dataset, northern Finland MTT (Agrifood Research Finland) pedogenic soil dataset, Corine 2006 land cover dataset, and from in situ field campaigns in and around the Sodankylä region. Table 3 provides the input parameter values for soil water characteristics calculations and Table 4 the input parameter values for the parametrization scheme. The spatial distribution and creation of the combined soil/land cover dataset is described in detail in [4].

3. Methods

The ESA CCI SM product(s) evaluation domain covers an area of 155 km by 140 km and encloses 70 ESA CCI soil moisture product pixels/SAC-SMA model grid cells. Each SAC-SMA model grid cell is divided into a maximum of 14 soil/vegetation density type tiles representing cross combinations of the four main mineral soil types (Fine Haplic Podzol, Coarse Haplic Podzol, Haplic Arenosol, and Eutric Regosol) and three primary vegetation density types (dense, sparse, and open), as well as separate tiles for semi-organic and organic soil and shallow rocky soils. A spatially distributed evaluation is performed against both the ESA CCI COMBINED product and against its components; ACTIVE and PASSIVE soil moisture retrievals. The results of the evaluation and the ESA CCI SM products are further analyzed for spatial patterns using multiple linear regression and spatial auto-correlation analysis.
The generation of the ESA CCI SM COMBINED product involves blending the ACTIVE and PASSIVE components into one final data set together with GLDAS-Noah v1 model estimates with a cumulative distribution function (CDF) matching approach. This imposes GLDAS-Noah v1 model-based absolute value ranges on the original EO observations [9]. It is stated that the use of GLDAS-Noah v1 model data to impose absolute soil moisture values to the ESA CCI data product renders statistical comparison metrics, such as root mean square difference and bias, somewhat scientifically meaningless. The ESA CCI soil moisture product should in fact be used and considered as a reference product for computing correlation statistics, not as an absolute soil moisture content estimate [18]. With the ESA CCI SM product version v03.2 (used in this study), the final merged ACTIVE product is provided separately as a percent of saturation time series, i.e., values ranging from 0 to 100. The PASSIVE and COMBINED products are provided as volumetric soil moisture. Due to these issues and the stated purpose of the ESA CCI SM product, this study focuses on an evaluation of the ESA CCI SM products through correlation metrics.
The relative areas of each SAC-SMA model tile within the ESA CCI SM pixel are used to calculate a single spatially weighted average top soil moisture value. We assume that moisture in the SAC-SMA model’s upper zone free and tension water storage soil layers represent top soil moisture for mineral soil tiles. Since we calculate organic and semi-organic soil moisture with a single soil moisture storage, we assume that the relative soil moisture content in those storages corresponds to in situ top soil layer measurements. We define the size of the upper zone mineral storage, as well as organic and semi-organic soil moisture storages, as part of the a-priori parametrization scheme. We conduct the SAC-SMA model runs without any calibration or deviation from a-priori parametrization to maintain consistency between model grid cells and to avoid biases caused by calibration to the observations. The model runs are driven by FMI interpolated daily 10 km resolution precipitation and 2 m temperature observations [19] and 12-hourly ECMWF ERA Interim sunshine hours data [20].

SAC-SMA Model Evaluation

Evaluation of the SAC-SMA model is fundamental for correctly interpreting the outcomes of the spatially distributed ESA CCI SM evaluation results. We use SAC-SMA model soil moisture estimates from one ESA CCI SM pixel, covering an area of 26 km (north–south) by 10 km (west–east), encapsulating the Sodankylä CAL-VAL site, to evaluate the accuracy of simulated soil moisture. This pixel is hereafter referred to as the “SOD-reference pixel”. The performance of the SAC-SMA model is evaluated by comparing in situ observations with SAC-SMA model estimates for six out of 14 SAC-SMA model tiles; those corresponding to in situ observations sites, present in the SOD-reference pixel. Evaluation is conducted on a year-by-year basis for snow-free, thawed periods (1 June –30 September), between 2012 and 2015, using correlation coefficients as the statistical metric of interest. In situ soil moisture observations are taken from sensors at a depth of 5 cm except for stations on semi-organic soils (UG stations). For these, sensors at a depth of 5 cm are in the soil profiles O-horizon and mainly measure water content in the organic layer, which itself is very porous, and measurements at this depth do not reflect the moisture content of soil. For UG stations, we therefore take top soil moisture measurements at a depth of 10 cm.
In addition to SAC-SMA model evaluation based on individual in situ observations, in situ observations and those SAC-SMA tiles representing them have been combined using a weighting scheme based on spatial representativeness to form a single soil moisture field representing an average soil moisture value for the SOD-reference pixel. We defined in situ soil moisture weights based on percentages of composite classes of prevailing soil and vegetation type information within the pixel. We provide the weights used with this method in Table 1. We redistribute the applied weights when new stations are added to the network. In practice, in reference to this study, only one new station was added; UG Forest 2. Since the six in situ station observations (including the UG Forest 2 station) do not conceptually provide 100% coverage, many assumptions have been made and we have added missing soil/vegetation type composite class weights to available stations based on similarities with other missing soil/vegetation types. A similar approach was also taken by [4]. This approach is, however, only adopted for in situ observation-based SAC-SMA model evaluation, whereas all SAC-SMA model tiles are used in spatially distributed evaluations of the ESA CCI SM products.

4. Results

A spatially distributed version of the SAC-SMA model is used to assess the variability in ESA CCI SM product performance across the study domain. The performance of the SAC-SMA model is evaluated through comparison against in situ observations in a single ESA CCI SM product pixel. The results of distributed evaluation and the ESA CCI SM products are further analysed for spatial patterns using multiple linear regression and spatial auto-correlation analysis.

4.1. SAC-SMA Model Performance

We evaluate SAC-SMA model performance with individual in situ site observations, as well as spatially weighted in situ soil moisture fields using soil/vegetation composite SAC-SMA tiles. In Table 5, we provide yearly (2012–2015) SAC-SMA model tile correlations with individual in situ observations and weighted SAC-SMA model top layer soil moisture correlation with weighted in situ observations. SAC-SMA model tile correlations with individual in situ observation site measurements are high, ranging from 0.70 to 0.90 for mineral soils and from 0.77 to 0.94 for semi-organic (UG station) soils. For organic (bog) sites, the correlations with in situ observations are generally lower with a wider distribution; ranging from 0.32 to 0.97. In particular, it is noteworthy that the correlation of SAC-SMA soil moisture estimates with both bog sites during 2015 are poor at only 0.51 for the open bog site and 0.32 for the forested bog site. The average correlation between SAC-SMA soil moisture estimates and in situ observations for all but the bog sites is high at over 0.8, while the lower average correlation with bog sites is largely due to observations made during 2015. It should, however, be noted that measuring/estimating soil moisture in organic soils (bogs) is challenging with in situ observations and models alike. The top layer (5–10 cm) soil moisture in bogs tends to differ significantly, depending on which part of a bog is being measured. In particular, providing an average soil moisture estimate for bogs with the type of generalized conceptual model used in this study is challenging since the model is unable to differentiate between different parts of a bog. Therefore, comparisons against individual bog (organic soils) in situ sites is somewhat meaningless, but necessary in order to understand the range of differences between in situ measurements and modelled estimates. The average weighted correlation with in situ observations is, however, very high, at over 0.9 for all analysed years. A time series of weighted top layer soil moisture in situ observations and corresponding weighted SAC-SMA tiles is provided in Figure 3. A time series of weighted average top layer SAC-SMA soil moisture using all 14 tiles present in the SOD-reference pixel is also provided in Figure 3 as an illustration of the effect of using all available simulated data. In view of the evaluation results, although there is a clear tendency for simulated soil moisture to exhibit more fluctuation (particularly when all 14 SAC-SMA tiles are used), we argue that using SAC-SMA model simulated soil moisture estimates in place of actual in situ measurements is warranted and that extrapolation of ESA CCI SM product evaluation beyond the SOD-reference pixel and evaluation time period (2012–2015) can be considered as at least as reliable as performing evaluations with in situ measurements alone.

4.2. Evaluation of ESA CCI SM Products

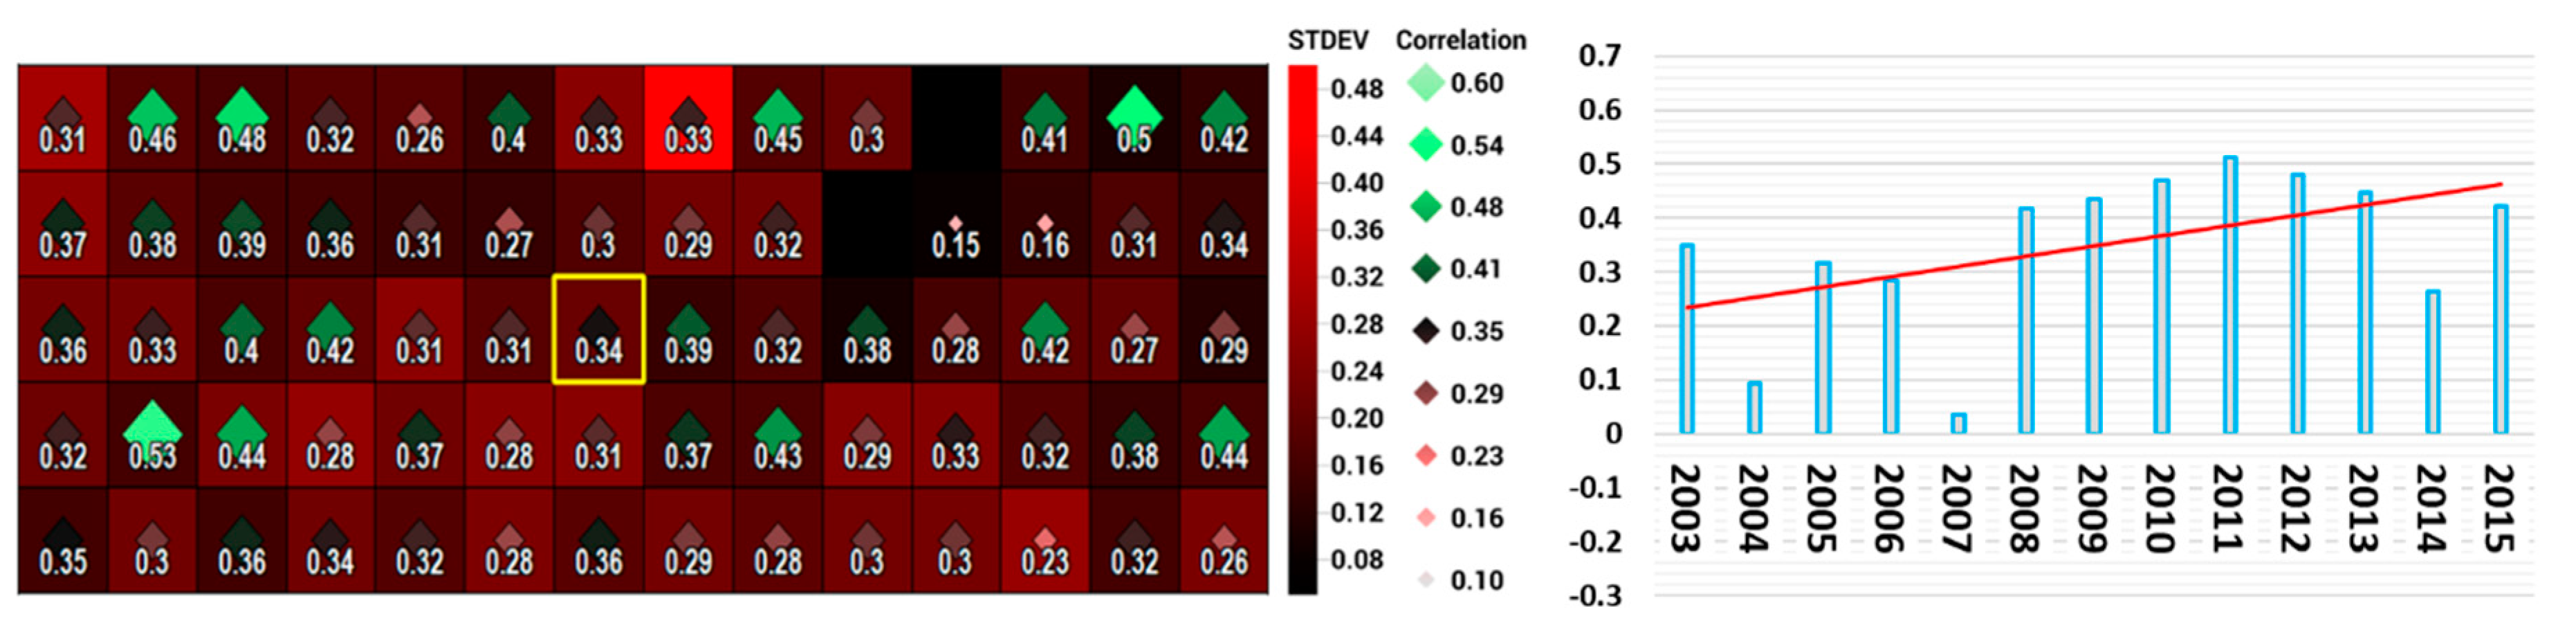
We conduct a spatially distributed evaluation of the ESA CCI SM COMBINED product and its components; ACTIVE and PASSIVE soil moisture retrievals for thawed/snow-free periods between 2003 and 2015 using SAC-SMA model top-layer soil moisture as the reference dataset. The 70-pixel aggregate yearly average correlation between the ESA CCI SM COMBINED product and SAC-SMA model top layer soil moisture estimates varies significantly; from 0.035 to 0.512. The highest 70-pixel aggregate yearly correlation is reached during 2011 and the lowest correlation is observed for 2007 (see 
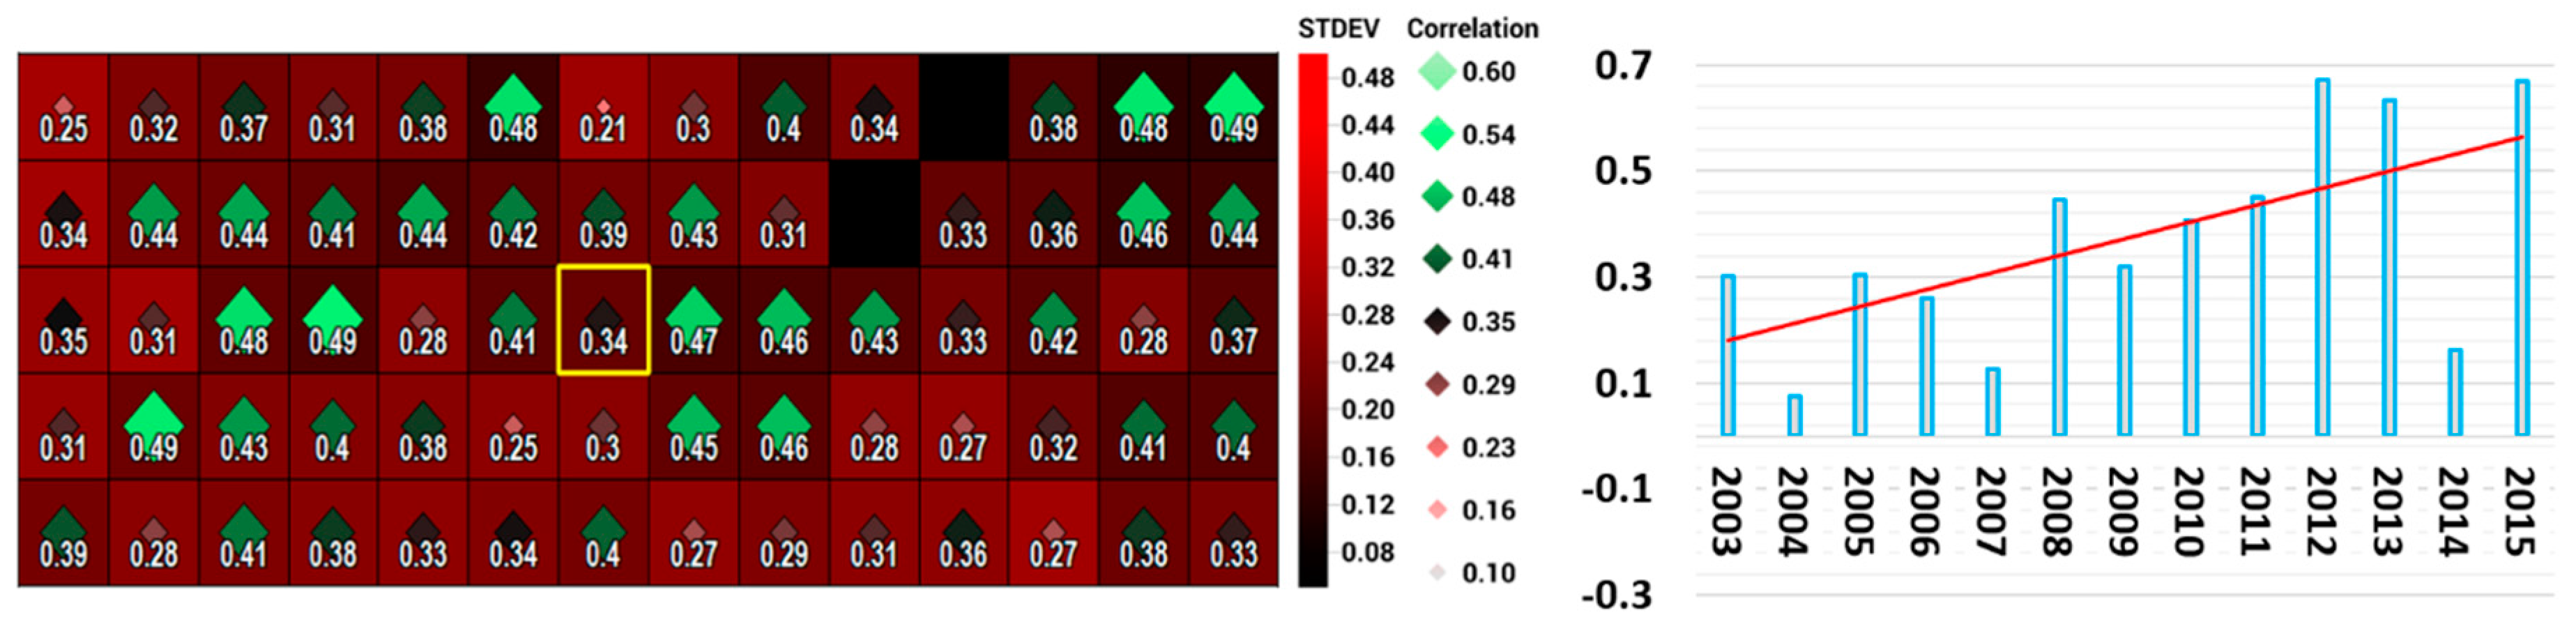
Figure 4). The average 15 year 70-pixel aggregate correlation with SAC-SMA model soil moisture estimates for the ESA CCI SM COMBINED product is relatively low at 0.34. The 70-pixel aggregate correlation of the ACTIVE product ranges from 0.07 to 0.67, with an average of 0.37. The highest correlation is achieved in 2012, while the lowest correlation is reached in 2004 (see 
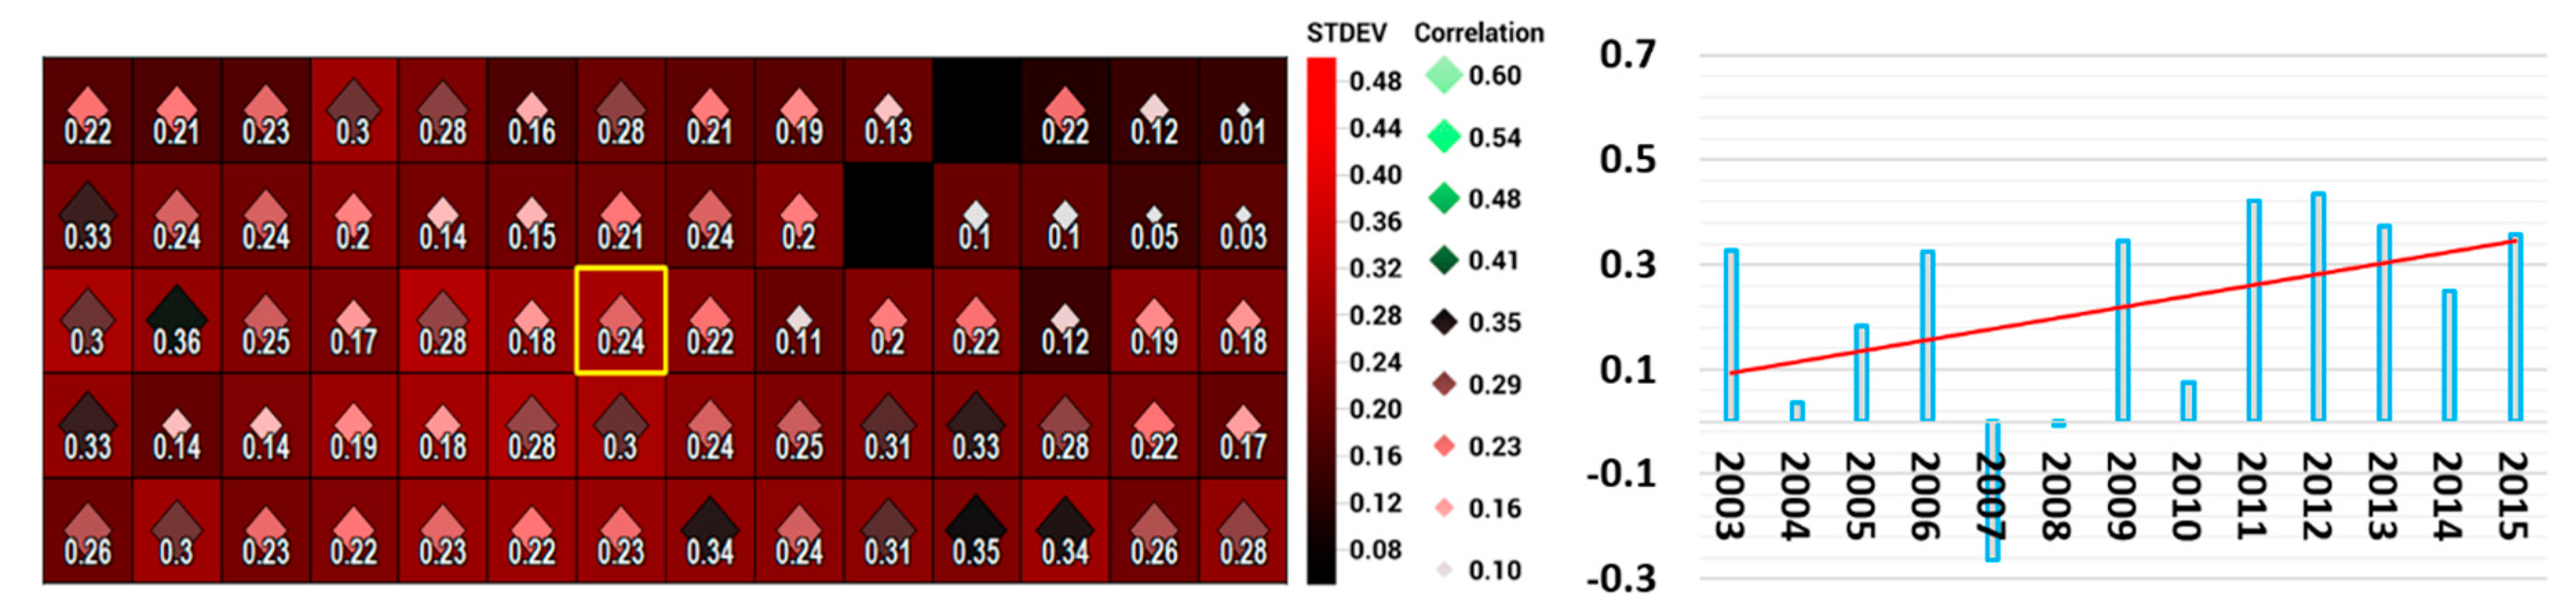
Figure 5). The PASSIVE product soil moisture correlation with SAC-SMA model top layer soil moisture estimates ranges from −0.27 to 0.43, with an average of only 0.22 (see Figure 6). As with the ESA CCI SM COMBINED product, the lowest 70-pixel aggregate correlation for the PASSIVE products is reached in 2007. The highest aggregate yearly correlation, as with the ACTIVE product, is achieved in 2012.
There exists a considerable amount of variation in terms of the correlation between the pixels and high 15-year average standard deviation in some pixels for all ESA CCI SM products. With the ESA CCI SM COMBINED product, the average standard deviation is 0.34, while for the ACTIVE product it is 0.37 and for the PASSIVE product it is 0.22. Particularly noteworthy is the fact that pixels with a low average annual correlation with SAC-SMA model top soil layer estimates, often have a higher standard deviation of correlation between the analysis years. A noticeable positive trend towards improved performance for latter years for all of the ESA CCI SM products can be observed. However, with the ACTIVE product, this trend is far clearer (see Figure 4, Figure 5 and Figure 6). Although the highest and lowest correlation years for the ACTIVE and PASSIVE products do not match, both the ACTIVE and PASSIVE products exhibit poor performance during 2004, 2007, and 2014. There exists no distinguishable common meteorological factors or anomalies between the years that can explain this finding, rendering it challenging to assess the reasons for poor performance, at least in terms of a single explanatory factor affecting both soil moisture retrieval methods. From Figure 4, Figure 5 and Figure 6, it can also be observed that there is no clearly discernible geographical trend in correlation with SAC-SMA model top layer soil moisture estimates for any of the ESA CCI SM products.

Spatio-Statistical Pattern Analysis

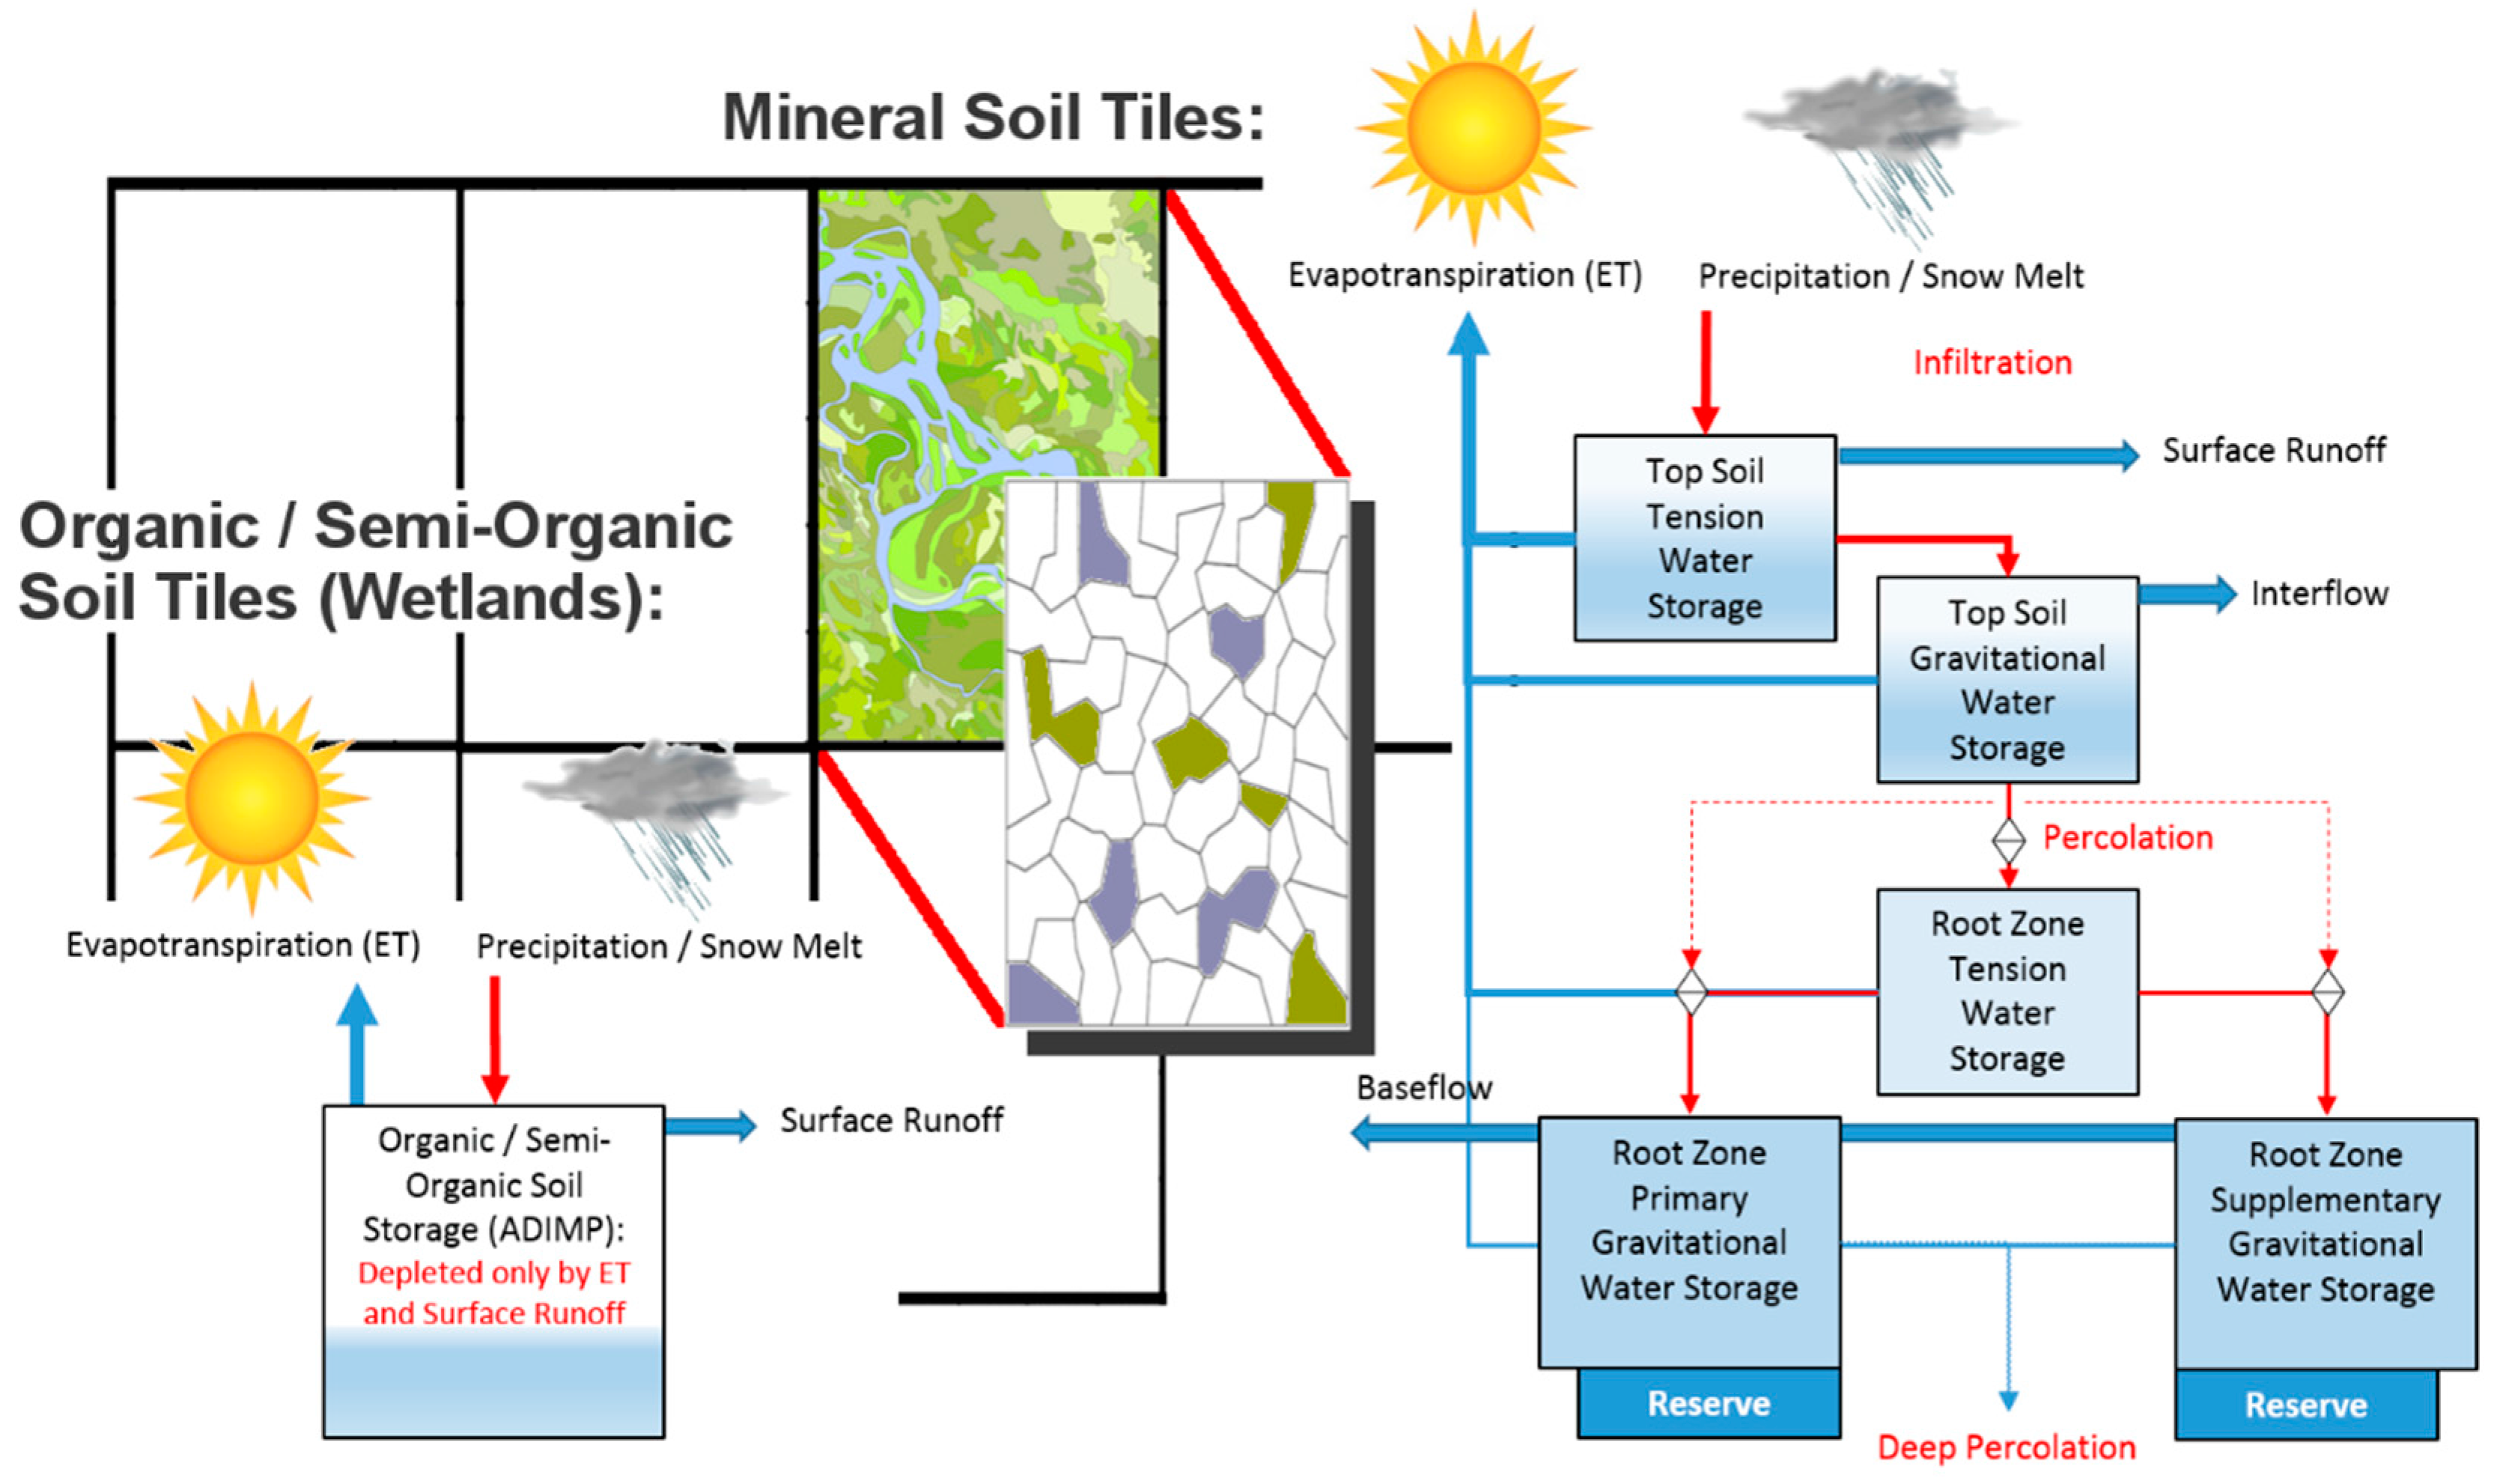
We explore the dependency of PASSIVE and ACTIVE soil moisture retrieval performance to differences in soil/vegetation type tile coverage within each SAC-SMA model grid cell (i.e., ESA CCI SM product pixel). This is explored in order to determine if any specific soil/vegetation combination(s) are a factor in determining ESA CCI SM product correlation with SAC-SMA model soil moisture, i.e., does the domination of some soil/vegetation type combination within a pixel increase or decrease ESA CCI SM data product performance. With this assessment, for simplicity and since mineral soil/vegetation tile soil moisture correlate strongly with each other, all mineral soil/vegetation tiles (excluding shallow soils) are merged into a single “mineral soils” tile. In 
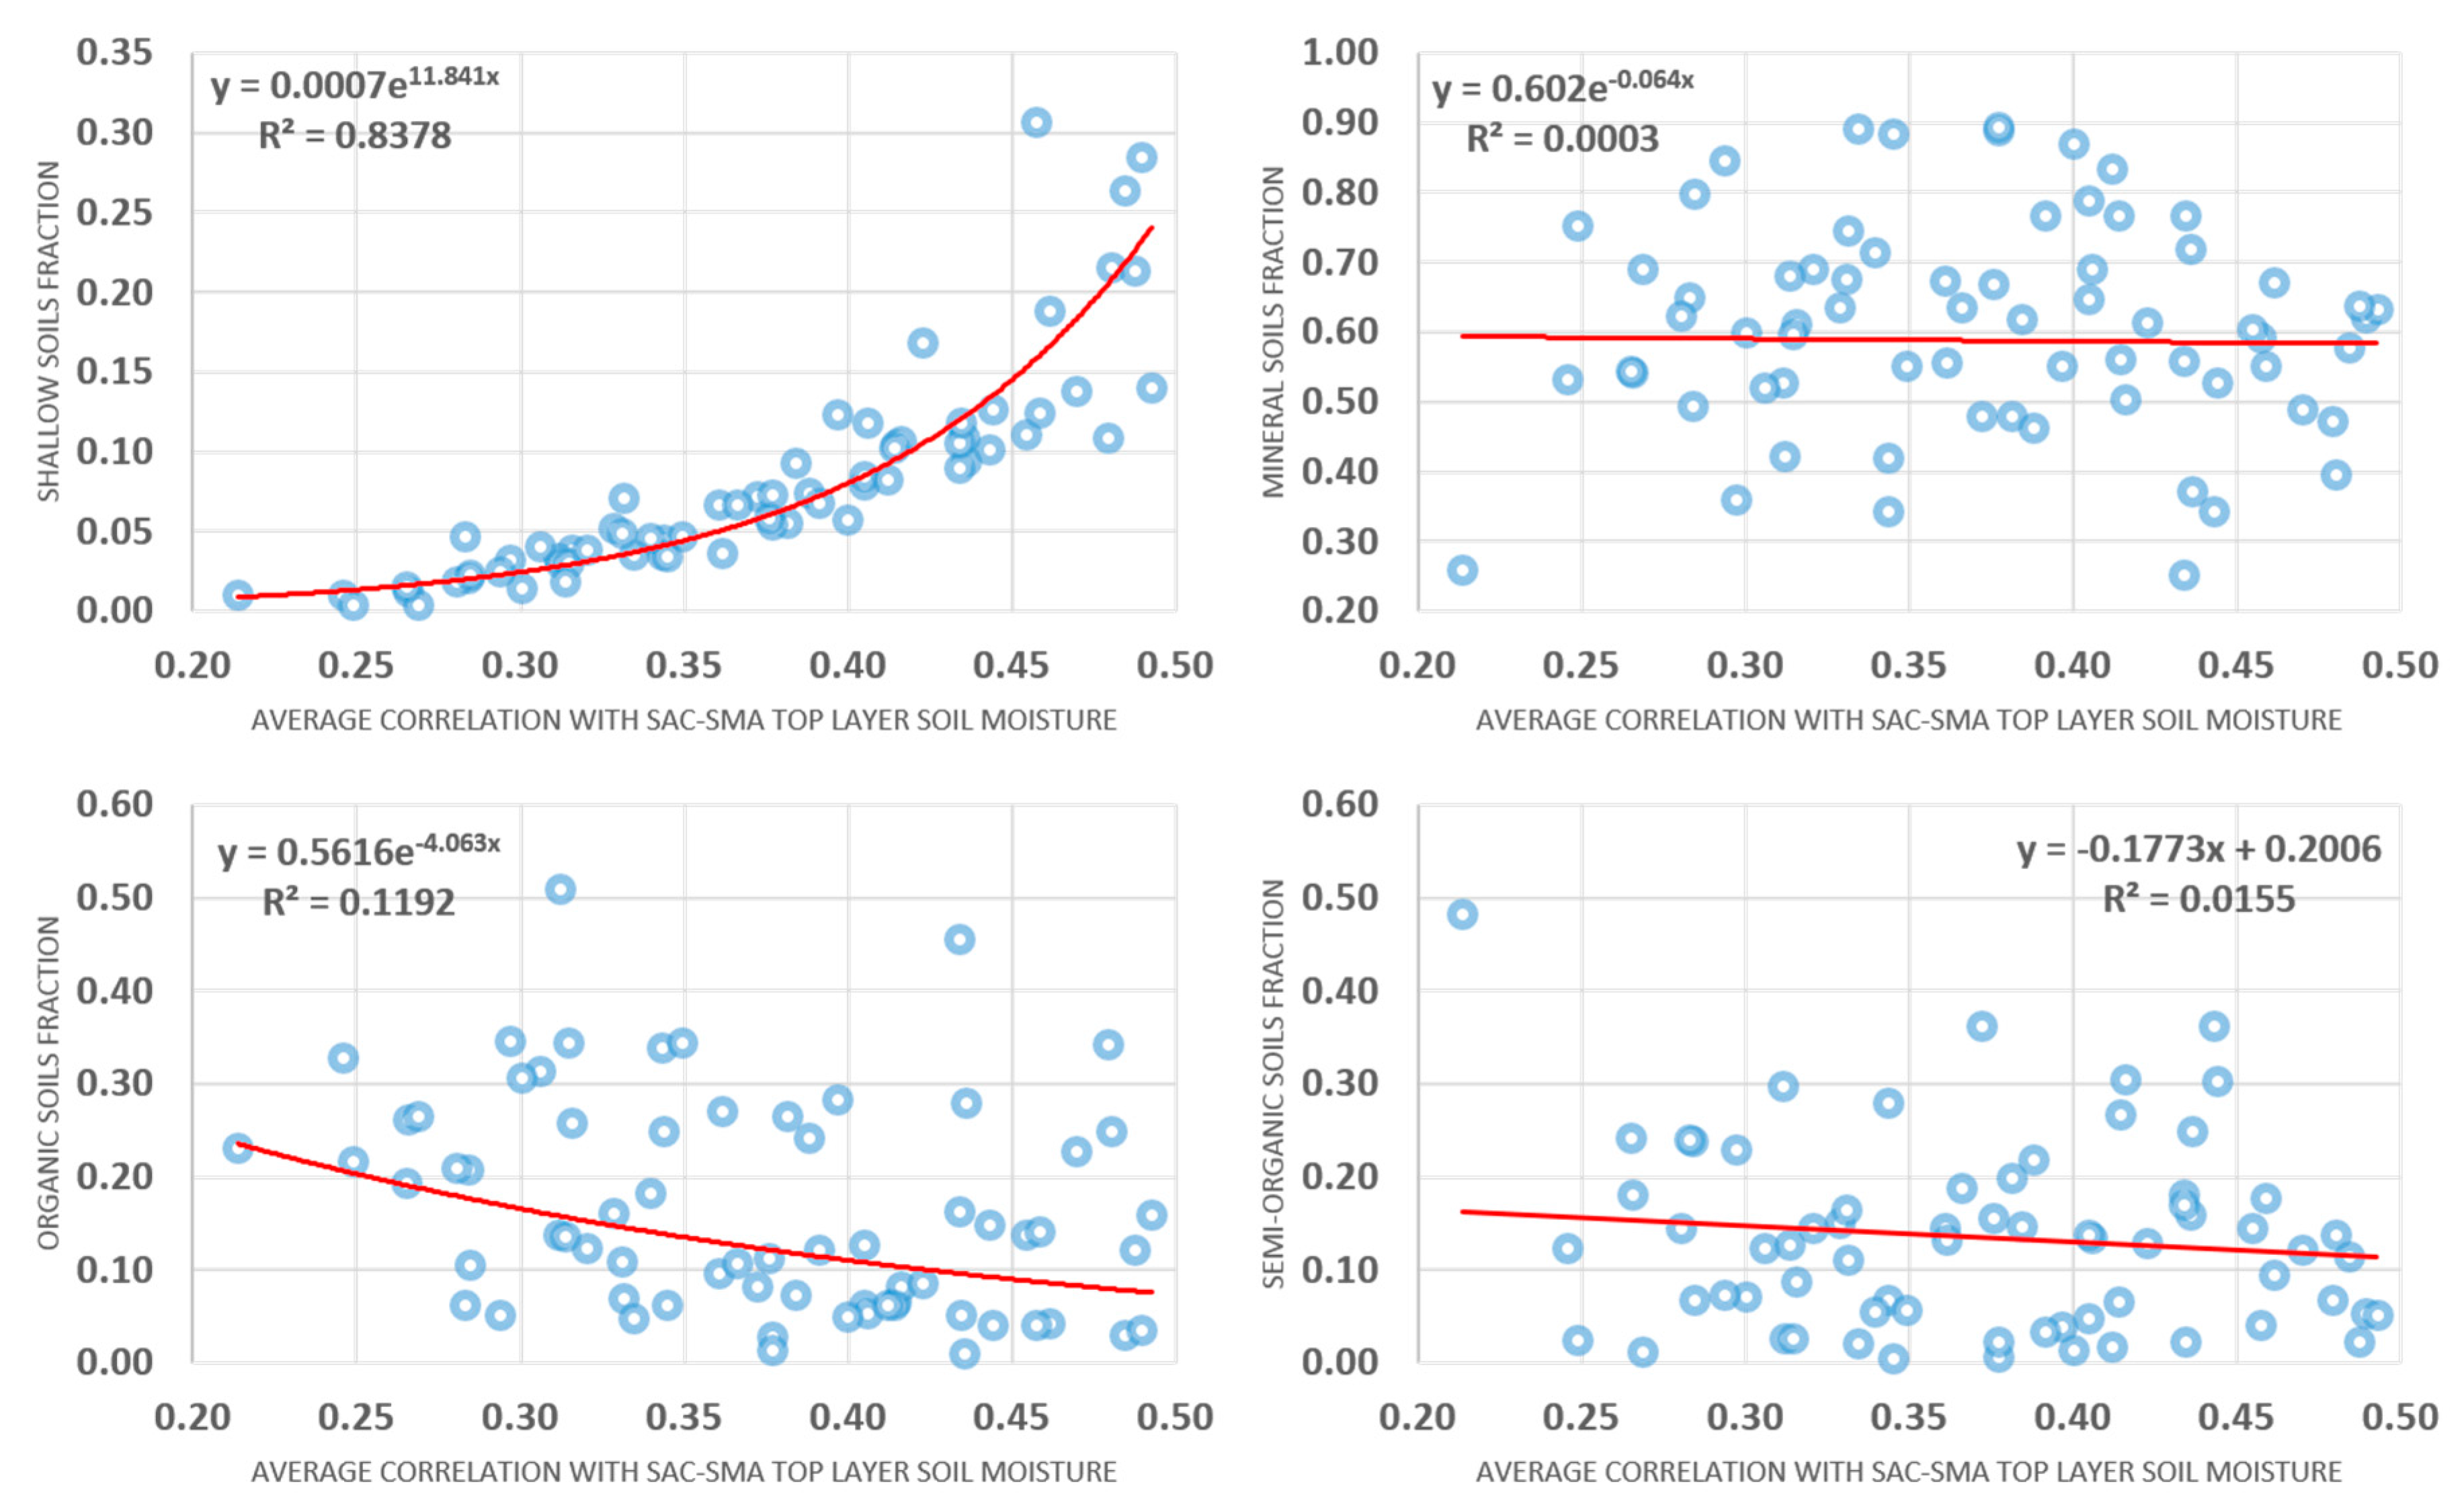
Figure 7, we provide diagrams of major soil/vegetation type fraction sizes against ACTIVE soil moisture retrieval correlation with SAC-SMA model top layer soil moisture estimates. A best fit trend line along with the equation describing the relationship and the R-squared value is also provided. From Figure 7, we can deduce that there exists a significant exponential relationship (R-squared value of 0.8378) between ACTIVE soil moisture retrieval correlations with SAC-SMA model top layer soil moisture estimates and the size of the shallow soils fraction in a pixel. The relationship is given as:
y = 0.0007e11.841x,
where, y is the correlation of ACTIVE soil moisture retrieval with SAC-SMA model top layer soil moisture and x is the size of shallow soils fraction within a pixel. The other major soil/vegetation type fractions do not exhibit significant relationships with ACTIVE soil moisture retrieval and SAC-SMA model top layer soil moisture estimate correlations. Further, it is not possible to define a statistically significant multiple linear regression model describing the dependency of major soil type fractions and ACTIVE soil moisture retrieval correlation with SAC-SMA model top layer soil moisture estimates. As such, the exponential relationship between shallow soil fraction size and correlation with SAC-SMA model estimates is the single best predictor.
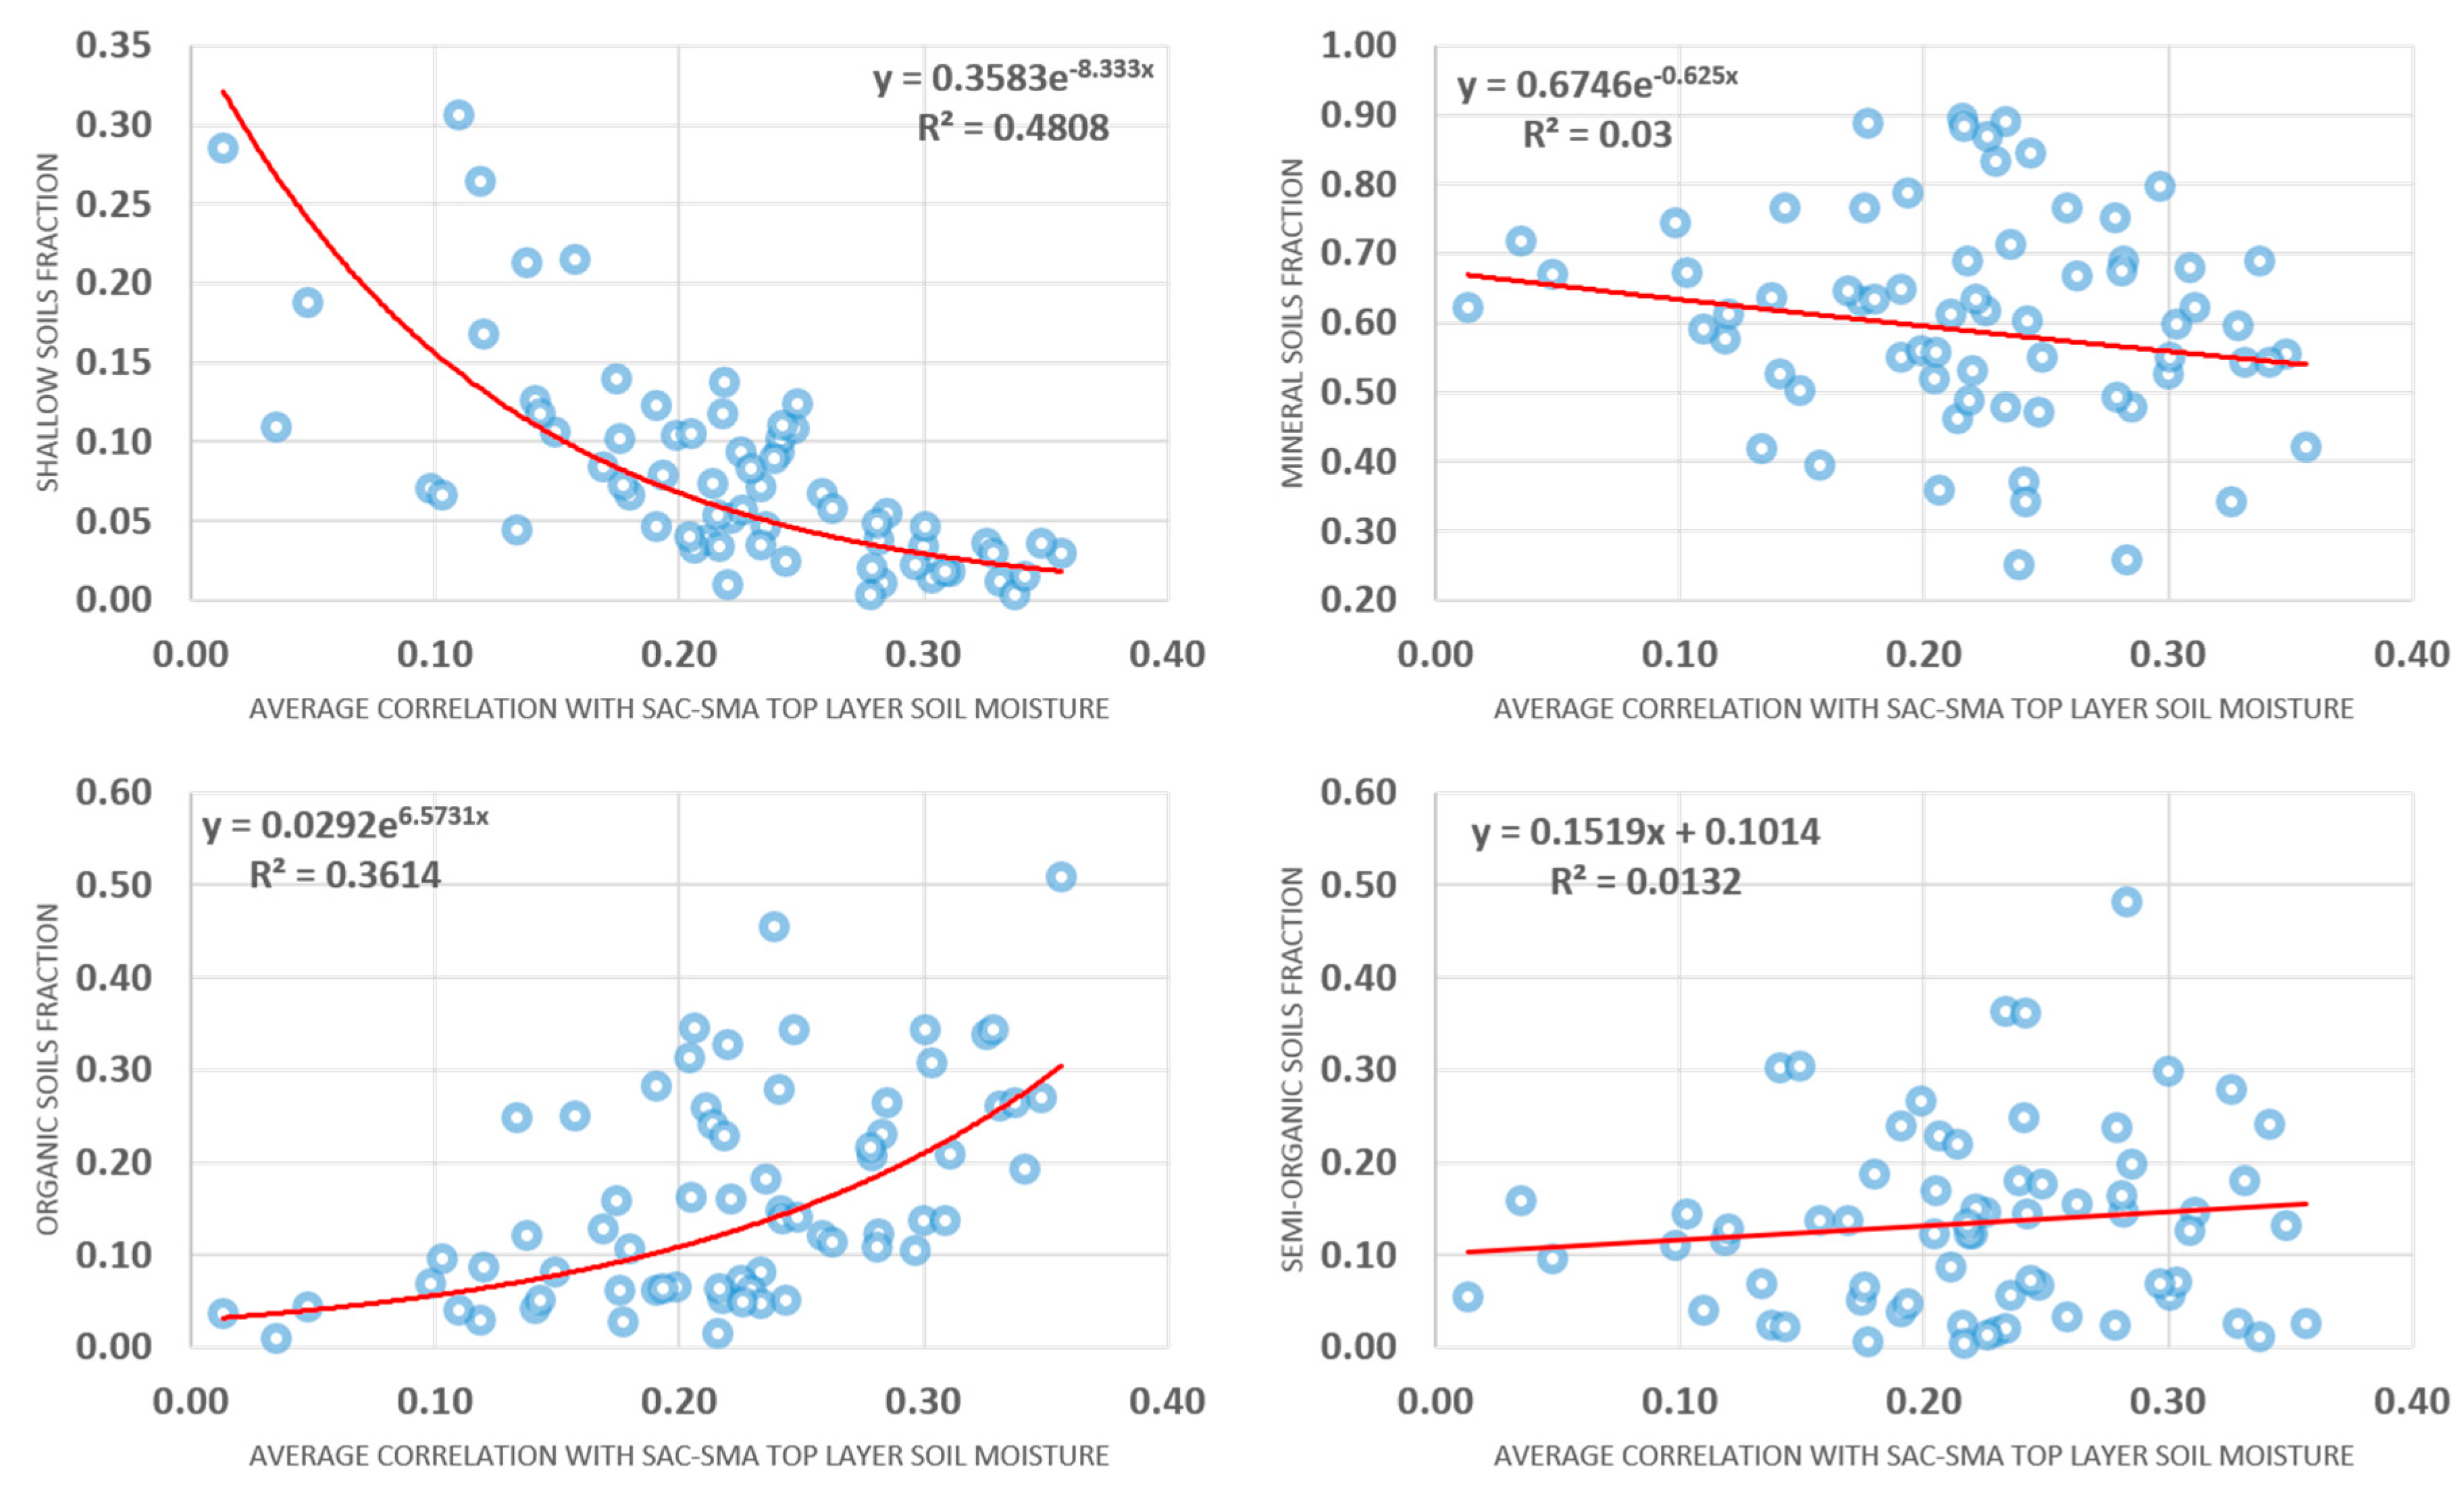
In Figure 8, we provide corresponding diagrams of major soil/vegetation type fraction sizes against PASSIVE soil moisture retrieval correlation with SAC-SMA model top layer soil moisture estimates. As with ACTIVE soil moisture retrieval analysis, a best fit trend line along with the equation describing the relationship and with the R-squared value is also provided. For PASSIVE soil moisture retrievals, multiple relationships exist between major soil type fraction size and correlation with SAC-SMA model top layer soil moisture. In contrast to the ACTIVE soil moisture retrieval relationship with shallow soil fraction size, PASSIVE soil moisture retrievals exhibit a negative exponential trend (with an R-squared value of 0.4808) in correlation. The relationship is given as:
y = 0.3583e−8.333x,
where, y is the correlation of PASSIVE soil moisture retrieval with SAC-SMA model top layer soil moisture and x is the size of shallow soils fraction within a pixel. The size of organic soil fraction size also exhibits a somewhat significant relationship with PASSIVE soil moisture retrieval correlation with SAC-SMA model top layer soil moisture. In contrast to shallow soil fraction size, this relationship can be expressed with a positive exponential trend (with an R-squared value of 0.3614). The relationship is given as:
y = 0.0292e6.5731x,
where, y is the correlation of PASSIVE soil moisture retrieval with SAC-SMA model top layer soil moisture and x is the size of organic soils fraction within a pixel. Dependencies also exist between the other (mineral soil and semi-organic soil) major soil/vegetation type fractions size and PASSIVE soil moisture retrieval correlation with SAC-SMA top layer soil moisture, but these relationships alone are rather weak (see Figure 8).
Since multiple soil/vegetation type fraction size relationships exist between PASSIVE soil moisture retrieval correlation with SAC-SMA model top layer soil moisture, we perform exploratory statistical analysis to combine the individual relationships together with two multiple linear regression models that predict PASSIVE soil moisture correlation with the SAC-SMA model estimates. The two multiple linear regression models are described in Table 6, Table 7 and Table 8. The first model, in practice, describes the same relationship as is evident with individual soil/vegetation fraction size and PASSIVE soil moisture retrieval correlation with SAC-SMA model estimates, except with a higher R-squared value (0.5878). With PASSIVE soil moisture retrievals, the higher the organic soil fraction size and the lower the shallow soil fraction size, the higher the correlation with SAC-SMA model top layer soil moisture estimates are. The model is given as:
y = 0.239 + X1 −0.680 + X2 0.220
where, y is the correlation of PASSIVE soil moisture retrieval with SAC-SMA model top layer soil moisture, X1 is the size of shallow soils fraction within a pixel, and X2 is the size of organic soils fraction within a pixel. The second multiple linear regression model excludes the shallow soils fraction and predicts PASSIVE soil moisture retrieval with SAC-SMA model top layer soil moisture as a function of mineral, semi-organic, and organic soil tile fraction sizes. Although the model provides a slightly higher R-squared value (0.6114), the negative intercept value renders the model somewhat less meaningful, since a positive correlation is only achieved when approximately half of a pixel’s total area consists of some other major soil type other than shallow soils. In practice, however, pixels with more than half the total area covered by shallow soils alone are rare and in-fact non-existent in the Sodankylä study domain, therefore rendering the model valid, albeit conceptually slightly less significant. The model is given as:
y = −0.41 + X1 0.65 + X2 0.654 + X3 0.889
where, y is the correlation of PASSIVE soil moisture retrieval with SAC-SMA model top layer soil moisture, X1 is the size of mineral soils fraction within a pixel, X2 is the size of semi-organic soils fraction within a pixel, and X3 is the size of organic soils fraction within a pixel.
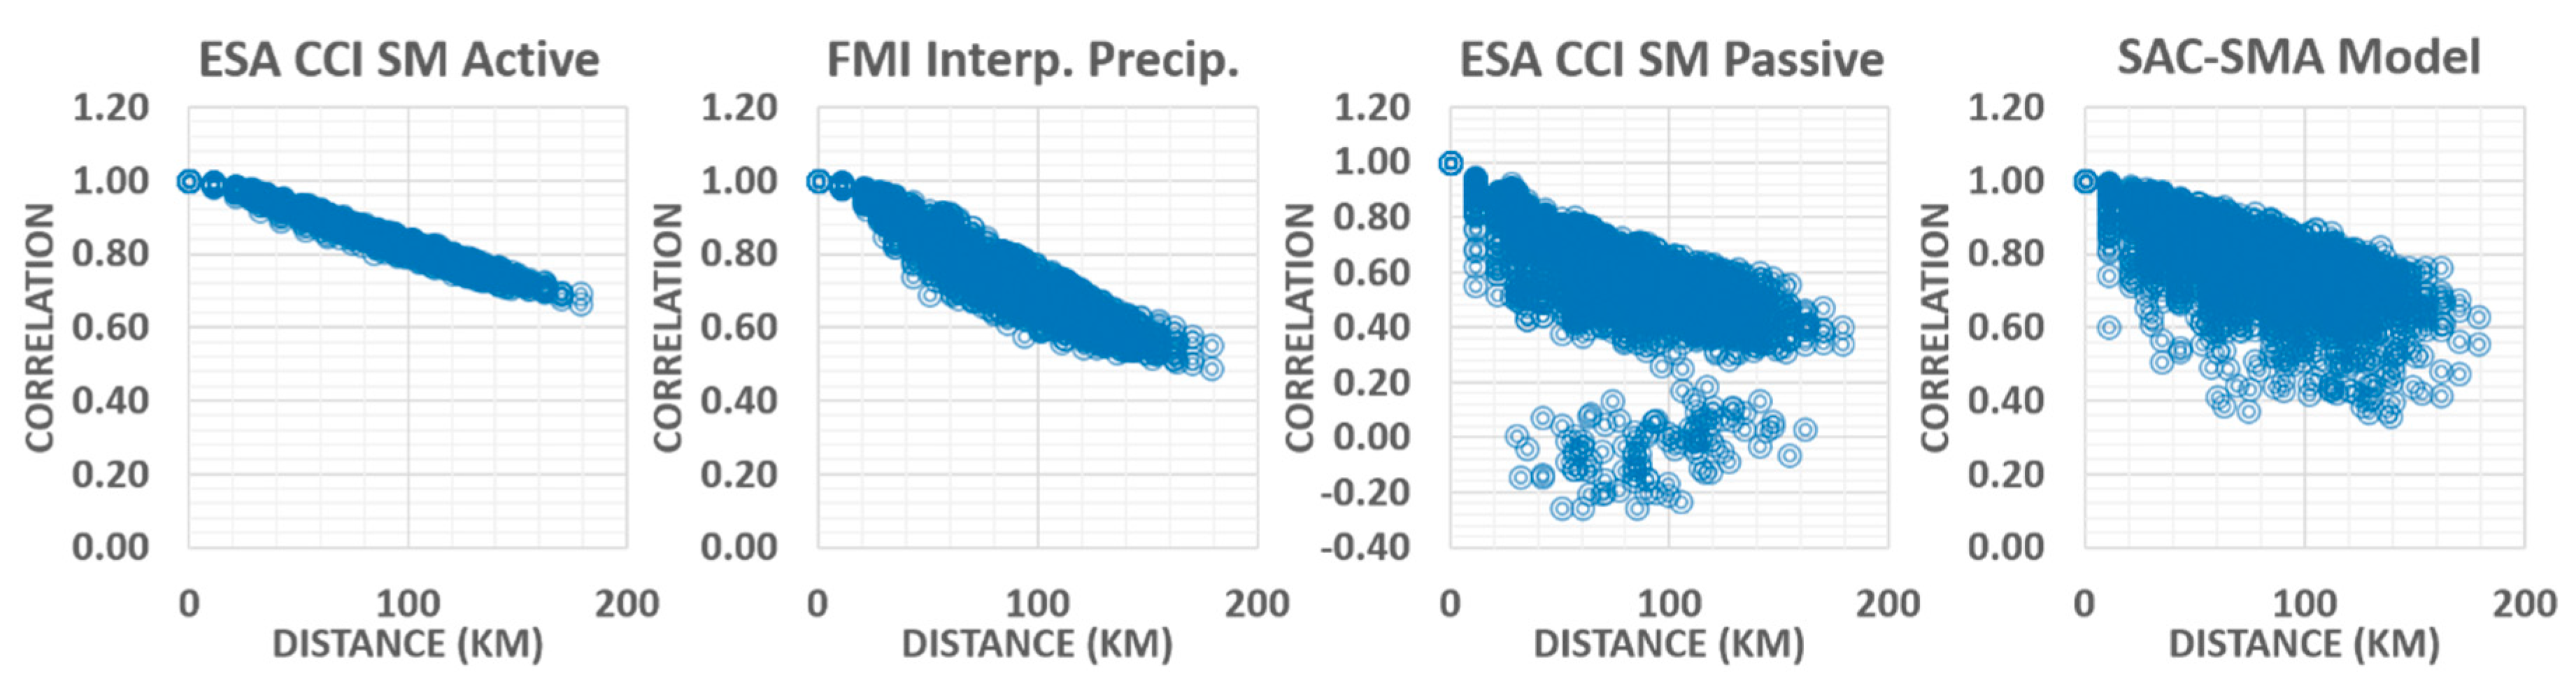
In addition to PASSIVE and ACTIVE soil moisture retrieval performance dependency on major soil/vegetation type tile fraction sizes, we also examine soil moisture inter-pixel cross-correlation for both products. We examine the degree to which soil moisture time series correlate between all pixels in the study domain, and whether there is any distance-based decay in such associations. Inter-pixel soil moisture cross-correlation is assessed by correlating each pixel’s soil moisture time series with all other pixels in the study domain on a yearly basis (between the years 2003 and 2015). This results in a “pixel-pair” vector with 2485 cross-correlated members for each year and for both products. The distance between each pixel pairs’ centre point is used to create a distance vector which is correlated with the pixel-pair cross-correlation vector as a measure of distance dependent correlation decay. By definition, the relationship (correlation) between the pixel-pair and distance vectors is negative, since pixel-pairs further away from one another tend to exhibit lower correlation-coefficients than pixel-pairs that are closer to one another.
As part of the spatial association assessment, we also calculate the study domain wide average inter-pixel cross-correlation for each year as a measure of general soil moisture time series similarity between the pixels. The higher the domain wide average inter-pixel cross-correlation, and the higher the negative correlation between pixel-pair and distance vectors, the less variability there is between the pixels’ soil moisture time series and the more of this variation can be explained solely by the distances between pixels. Conversely, the lower the domain wide average pixel-pair correlation, the more soil moisture time series variability there is between the pixels. Further, the lower the negative correlation between the pixel-pair and distance vectors, the more other factors in conjunction with distance determine inter-pixel cross-correlations. The yearly average inter-pixel soil moisture cross-correlation, as well as distance dependent correlation decay values, are provided in Table 9. The relationship between individual pixel-pair vector member correlations and corresponding distance vector members is illustrated in Figure 9. As a reference, we also compute the same spatial association metrics for FMI interpolated daily 10 km resolution precipitation observations, as well as SAC-SMA model top layer soil moisture estimates.
Both the ACTIVE soil moisture product and FMI interpolated daily 10 km resolution precipitation observations exhibit high yearly average inter-pixel cross-correlations and high negative yearly inter-pixel cross-correlation with distance. This appears to indicate that nearby pixels’ soil moistures tend to correlate with each other irrespective of the physiographic differences between them. Low spatial variability for precipitation in northern latitudes, such as in the Sodankylä region, is expected since the majority of precipitation events are known to be caused by precipitation fronts rather than by convective storm cells. However, this should not necessarily be the case for soil moisture, which is affected by not only meteorological conditions, but also by physiographic characteristics as well, which in the Sodankylä region exhibit considerable variation from ESA CCI SM pixel to pixel. This, and the very high dependency of these correlations to shallow soils fractions, as well as the known rapid response of these soil types to both precipitation and evaporation, raises the question that the relatively good performance of the ACTIVE product with SAC-SMA model top soil estimates may be good “for the wrong reasons”. We therefore argue that it is possible that ACTIVE soil moisture retrievals likely respond mainly to direct changes in precipitation and possibly to moisture on vegetation surfaces rather than to actual moisture in the top soil layer. Although the correlation between PASSIVE soil moisture retrievals and SAC-SMA model top layer soil moisture is rather low, they both exhibit a similar, low negative correlation between pixel-pairs and distance. This, and the fact that the PASSIVE product appears to be responding to differences in soil type distributions between pixels, points to the greater ability of the PASSIVE product to represent changes in soil moisture over the ACTIVE product in the Sodankylä region.

5. Discussion

Our study shows that the SAC-SMA model exhibits a high correlation with in situ observations and can be considered as a reliable reference for ESA CCI SM evaluation in the Sodankylä region. Replacing in situ observations with SAC-SMA estimates using the same weighting scheme results in almost identical evaluation results with ESA CCI SM, although there is a clear tendency for simulated soil moisture to exhibit more fluctuation, particularly when all available SAC-SMA tiles are used. These fluctuations are particularly noticeable during “dry down” periods. However, since ESA CCI SM product evaluation is performed solely through correlation coefficients, we only assess the performance of the SAC-SMA model through correlation with in situ observations. The “dry down” period differences between in situ observations and the SAC-SMA model do not have a meaningful effect on the correlation between the two, since both detect “dry down” periods occurring at the same time, at least in most cases. In addition to “dry down” period differences, some challenges and issues relating to organic soil representation with the SAC-SMA model also exist. These issues are, however, not clear-cut, since there may also be issues in measuring organic soil (bog) soil moisture with Decagon ECH2O 5TE probes; this has been studied and discussed at length in [21]. Although the model used in this study exhibits a good correlation with in situ site soil moisture observations in general, further studies concentrating solely on modelling and measuring soil moisture fluctuations over organic soils are required. Therefore, the results and exploratory statistical analyses presented in this study need to be considered as somewhat preliminary, and should serve as a basis for future studies.
The overall results provided in this study show a far better ESA CCI SM product correlation to the used reference soil moisture dataset than previous studies have shown for boreal environment sites. This is likely due to two key factors; 1) previous studies have used either individual in situ observation sites with a limited consideration of the local representativeness of these sites, and little to no attention has been placed on the spatial scale issues involved in comparing point observations to a product representing a much larger footprint; and 2) other evaluation studies utilize global scale Land Surface Model top layer soil moisture estimates as the reference dataset, which in themselves may contain large uncertainties and are not necessarily capable of accurately reproducing soil moisture conditions that reflect local small-scale variations.
The ESA CCI SM COMBINED product consists of an increasing amount of PASSIVE retrievals towards the latter years of our analysis period, although ACTIVE retrievals would clearly offer a higher average aggregate correlation to at least SAC-SMA top layer soil moisture estimates. As other studies have found (e.g., [1]), there exists a clear positive trend in improved soil moisture retrieval accuracy towards the later part of the analysis period for both ACTIVE and PASSIVE products. The COMNIED product clearly offers the most stable performance when compared to both PASSIVE and ACTIVE retrievals, although it contains the least amount of observations. This may, however, also be a key factor in achieving the more stable performance.
One of the most intriguing findings uncovered in the study is the high negative correlation between pixel-pair soil moisture time series and distance (i.e. high inter-pixel cross-correlation dependency on distance) of the ACTIVE soil moisture product. Further, the ACTIVE product exhibits a high average study domain wide inter-pixel soil moisture time series cross-correlation, which in itself is suspicious when considering that neighbouring pixels even with very different soil/vegetation type distributions correlate to a high degree with each other. Some correlation is of course expected since top soil moisture, in particular, is heavily influenced by precipitation, but for this to occur with neighbouring cells with very different soil/vegetation type distributions is suspicious. In fact, the ACTIVE product’s inter-pixel soil moisture cross-correlation dependency on distance resembles that of precipitation. Therefore, it is possible, and even reasonable, to suspect that the ESA CCI ACTIVE soil moisture product actually represents moisture changes in vegetation, tree canopies, and so on. Many other previous studies (e.g., [22,23]) have also come to similar conclusions. The exclusion of the ACTIVE product, for most pixels during the latter years of the analysis period, in producing the COMBINED product is therefore reasonable. However, there might be other additional reasons for the exclusion of the ACTIVE product in the COMBINED product, which are not investigated as part of this study. In contrast, the PASSIVE and SAC-SMA models exhibit a fairly low negative inter-pixel soil moisture cross-correlation dependency on distance. The ESA CCI PASSIVE soil moisture product correlates well with pixels containing large organic soil fractions. Organic soils (bogs) tend to react slowly to precipitation and represent soil moisture change as a smooth trend. Since organic soils represent a trend, correlation to this is as a positive thing. The PASSIVE product also exhibits poor correlation with pixels containing large fractions of shallow soils, i.e., rapidly responding type soils. This suggests that the ESA CCI PASIIVE product is able to, in most cases, capture the temporal trend in soil moisture variation. However, although the trend is seemingly captured, the rapid response to precipitation events is less accurate. With the ACTIVE product, although there is a very significant dependency on shallow soils fraction size to SAC-SMA model correlation, there is no other statistically significant soil/vegetation type predictor that explains ESA CCI ACTIVE SM product performance. This and the high degree of inter-pixel, distance-based spatial association are strong indicators that the ACTIVE product’s soil moisture fluctuations are largely unresponsive to changes in soil types between the pixels. It should, however, be noted that the relatively large measurement footprints, with magnitudes of tens of kilometres, of both the ACTIVE and PASSIVE soil moisture retrieval sensors used to derive the ESA CCI SM products, may be partly to blame for the high inter-pixel distance-based spatial associations found in our study. In particular, this is relevant when considering that the ESA CCI SM product pixels are in comparison relatively small at only 26 by 10 km. Further studies focusing on inter-pixel distance-based spatial association should be conducted with the original EO-datasets used to derive the ESA CCI SM products and with a much larger study domain.
Since part of our main findings show, albeit not conclusively, a clear reverse shallow soils–organic soils type dependency between ACTIVE and PASSIVE soil moisture retrieval correlation with SAC-SMA model top layer soil moisture, we suggest that further studies by conducted to determine if future versions of the ESA CCI SM COMBINED product could possibly benefit from sub-pixel information on the distribution of these two soil types. As with any exploratory statistical analysis, hidden underlying or unexplored factors affecting the outcome of the statistical analysis presented here may exist, and before these results can be considered as “proof-positive”, further studies are required. If other studies are able to corroborate our findings, information on sub-pixel soil types could be used to improve the ESA CCI SM COMBINED product’s performance over boreal environments. Instead of relying purely on triple collocation analysis with GLDAS-Noah v1 land surface model soil moisture estimates to determine the distribution of weights between ACTIVE and PASSIVE soil moisture retrievals in producing the COMBINED product, certain a-priori weight ranges could be assigned to each pixel individually based on the sub-pixel fraction of organic and shallow soils distributions. Our multiple regression model results could be used as a basis for further studies into this possibility. In future evaluation studies, it may also be beneficial to include GLDAS-Noah v1 model soil moisture estimates as a part of the evaluation process. Further, the causes for the rather dramatic fluctuations in both ACTIVE and PASSIVE soil moisture retrievals performance against SAC-SMA model top layer soil moisture between the analysis years should be investigated.

Supplementary Materials

Data from the in situ observation stations are freely available from the web server of the Finnish Meteorological Institute http://litdb.fmi.fi. The ESA CCI soil moisture data used in this study are freely available to the public and can be accessed through http://www.esa-soilmoisture-cci.org/node/145. Corine land cover data are freely available through The European Environment Agency (EEA) at http://www.eea.europa.eu/data-and-maps/. Finnish Quaternary deposits map data are available through the Geological Survey of Finland (GTK); http://www.gtk.fi/tietopalvelut/rajapintapalvelut/. Agrifood Research Finland (MTT) soil database data (1:250 000) are available through a WFS-service provided by the Natural Resources Institute Finland; http://maps.luke.fi/geoserver/.

Acknowledgments

This research was supported by the framework of the ESA-funded Climate Change Initiative programme (CCI phase 1: European Space Research Institute (ESRIN) contract no. 4000104814/11/I-NB; CCI phase 2: European Space Agency (ESA) contract no. 4000112226/14/I-NB) and by the Finnish Academy Centre of Excellence in Atmospheric Science (FCoE-ATM). The ESA CCI soil moisture data set v03.2 has been made available by the Vienna University of Technology (TUW). The authors would also like to thank the European Environment Agency (EEA) for making Corine land cover data freely available. We would also like to acknowledge the Geological Survey of Finland (GTK) for making Quaternary deposits map data available through their data delivery portal, as well as Agrifood Research Finland (MTT) for producing and, Natural Resources Institute Finland for providing a Web Feature Service (WFS) to the Finnish Soil Database 1:250 000 data. We would also like to thank Metsähallitus (the Finnish State Forest Association) for granting permission to install the soil moisture network in situ sites on state owned land. Finally, we would like to thank the Finnish Meteorological Institute for providing the meteorological datasets used in this study.

Author Contributions

Jaakko Ikonen is the corresponding author with overall responsibility of the manuscript, modelling, and the analyses. Kimmo Rautiainen and Tuomo Smolander were responsible for ESA CCI SM data analysis and discussion sections. Juho Vehviläinen wrote part of the station network set-up sections and has been developing the network of soil moisture stations. Juha Lemmetyinen, Juval Cohen, Miia Salminen, and Jouni Pulliainen did extensive reviews and corrections to the manuscript.

Conflicts of Interest

The authors declare no conflict of interest. The founding sponsors had no role in the design of the study; in the collection, analyses, or interpretation of data; in the writing of the manuscript, and in the decision to publish the results.

References

  1. Dorigo, W.; Wagner, W.; Albergel, C.; Albrecht, F.; Balsamo, G.; Brocca, L.; Chung, D.; Ertl, M.; Forkel, M.; Gruber, A.; Haas, E.; et al. ESA CCI Soil Moisture for improved Earth system understanding: State-of-the art and future directions. Remote Sens. Environ. 2017, 203, 185–215. [Google Scholar] [CrossRef]
  2. Dorigo, W.; Gruber, A.; de Jeu, R.; Wagner, W.; Stacke, T.; Loew, A.; Albergel, C.; Brocca, L.; Chung, D.; Parinussa, R.; Kidd, R. Evaluation of the ESA CCI soil moisture product using ground-based observations. Remote Sens. Environ. 2015, 162, 380–395. [Google Scholar] [CrossRef]
  3. Pratola, C.; Barrett, B.; Gruber, A.; Dwyer, E. Quality Assessment of the CCI ECV Soil Moisture Product Using ENVISAT ASAR Wide Swath Data over Spain, Ireland and Finland. Remote Sens. 2015, 7, 15388–15423. [Google Scholar] [CrossRef]
  4. Ikonen, J.; Vehviläinen, J.; Rautiainen, K.; Smolander, T.; Lemmetyinen, J.; Bircher, S.; Pulliainen, J. The Sodankylä in situ soil moisture observation network: an example application of ESA CCI soil moisture product evaluation. Geosci. Instrum. Methods Data Syst. 2016, 5, 95–108. [Google Scholar] [CrossRef]
  5. Vreugdenhil, M.; Dorigo, W.; Wagner, W.; de Jeu, R.; Hahn, S.; van Marle, M. Analyzing the Vegetation Parameterization in the TU-Wien ASCAT Soil Moisture Retrieval. IEEE Trans. Geosci. Electron. 2016, 54, 3513–3531. [Google Scholar] [CrossRef]
  6. Kolassa, J.; Gentine, P.; Prigent, C.; Aires, F.; Alemohammad, S.H. Soil moisture retrieval from AMSR-E and ASCAT microwave observation. Remote Sens. Environ. 2017, 195, 202–217. [Google Scholar] [CrossRef]
  7. Nicolai-Shaw, N.; Hirschi, M.; Mittelbach, H.; Seneviratne, S.I. Spatial representativeness of soilmoisture using in situ. J. Geophys. Res.: Atmos. 2015, 120, 9955–9964. [Google Scholar]
  8. Chung, D.; Dorigo, W.; Hahn, S.; Melzer, R.; Paulik, C.; Reimer, C.; Vreugdenhil, M.; Wagner, W.; Kidd, R. Algorithm Theoretical Baseline Document (ATBD), Version 3.2, Active Soil Moisture Retrievals. ESA, 2016. Available online: http://www.esa-soilmoisture-cci.org/sites/default/files/documents/ATDB/CCI2_Soil_Moisture_DL2.1_ATBD_v3.2_02_active.pdf (accessed on 2 February 2018).
  9. Chung, D.; Dorigo, W.; Hahn, S.; Melzer, R.; Paulik, C.; Reimer, C.; Vreugdenhil, M.; Wagner, W.; Kidd, R. Algorithm Theoretical Baseline Document (ATBD), Version 3.2, Merging Active and Passive Soil Moisture Retrievals. ESA, 2017. Available online: http://www.esa-soilmoisture-cci.org/sites/default/files/documents/ATDB/CCI2_Soil_Moisture_DL2.1_ATBD_v3.2_04_merging.pdf (accessed on 2 February 2018).
  10. De Jeu, R.; Dorigo, W.; van der Schalie, E.; Chung, D.; Wagner, W.; Kidd, R. Algorithm Theoretical Baseline Document (ATBD), Version 3.2, Soil Moisture Retrieval from Passive Microwave Observations; ESA: Paris, France, 2016. [Google Scholar]
  11. Rodell, M.; Houser, P.R.; Jambor, U.; Gottschalck, J.; Mitchell, K.; Meng, C.J.; Arsenault, K.; Cosgrove, B.; Radakovich, J.; Bosilovich, M.; Entin, J.K.; Walker, J.P.; Lohmann, D.; Toll, D. The Global Land Data Assimilation System. Bull. Am. Meteorol. Soc. 2004, 85, 381–394. [Google Scholar] [CrossRef]
  12. Gruber, A.; Dorigo, W.A.; Crow, W.; Wagner, W. Triple Collocation-Based Merging of Satellite Soil Moisture Retrievals. IEEE Trans. Geosci. Remote Sens. 2017, 55, 6780–6792. [Google Scholar] [CrossRef]
  13. Burnash, R.J.; Ferral, R.L.; McGuire, R.A.; McGuire, R.A. A generalized streamflow simulation system: conceptual modelling for digital computers; U.S. Department of Commerce, National Weather Service, and State of California, Department of Water Resources: Washington, DC, USA, 1973.
  14. Oudin, L.; Hervieu, F.; Michel, C.; Perrin, C.; Andréassian, V.; Anctil, F.; Loumagne, C. Which potential evapotranspiration input for a lumped rainfall–runoff model? Part 2 Towards a simple and efficient potential evapotranspiration model for rainfall–runoff modelling. J. Hydrol. 2014, 303, 290–306. [Google Scholar] [CrossRef]
  15. Koren, V.I.; Smith, M.; Wang, D.; Zhang, Z. Use of Soil Property Data in the Derivation of Conceptual Rainfall-Runoff Model Parameters. In Proceedings of the 15th Conference on Hydrology, AMS, Long Beach, CA, USA, 9–14 January 2000. [Google Scholar]
  16. USDA. Urban Hydrology for Small Watersheds. United States Department of Agriculture, Natural Resources Conservation Service, Conservation Engineering Division, 1986. Available online: ftp://ftp.odot.state.or.us/techserv/Geo-Environmental/Hydraulics/Hydraulics%20Manual/Chapter_07/Chapter_07_appendix_G/Urban_Hydrology_for_Small_Watersheds.pdf (accessed on 2 February 2018).
  17. Saxton, K.E.; Rawls, W.J. Soil Water Characteristic Estimates by Texture and Organic Matter for Hydrologic Solutions. Soil Sci. Soc. Am. J. 2006, 70, 1569–1578. [Google Scholar] [CrossRef]
  18. Wagner, W.; Dorigo, W.; de Jeu, R.; Fernandez, D.; Benveniste, J.; Haas, E.; Ertl, M. Fusion of active and passive microwave observations to create an essential climate variable data record on soil moisture. ISPRS Ann. Photogramm. Remote Sens. Spati. Inf. Sci 2012, I-7, 315–321. [Google Scholar]
  19. Aalto, J.; Pirinen, P.; Jylhä, K. New gridded daily climatology of Finland: Permutation-based uncertainty estimates and temporal trends in climate. J. Geophys. Res. Atmos. 2016, 121, 3807–3823. [Google Scholar] [CrossRef]
  20. Dee, D.P.; Uppala, S.M.; Simmons, A.J.; Berrisford, P.; Poli, P.; Kobayashi, S.; Andrae, U.; Balmaseda, M.A.; Balsamo, G.; Bauer, P.; et al. The ERA-Interim reanalysis: configuration and performance of the data assimilation system. Q. J. R. Meteorol. Soc. 2011, 137, 553–597. [Google Scholar] [CrossRef]
  21. Bircher, S.; Andreasen, M.; Vuollet, J.; Vehvilainen, J.; Rautiainen, K.; Jonard, F.; Weihermueller, L.; Zakharova, E.; Wigneron, J.-P.; Kerr, Y.H. Soil moisture sensor calibration for organic soil surface layers. Geosci. Instrum., Methods Data Syst. 2016, 5, 109–125. [Google Scholar] [CrossRef]
  22. Pulliainen, J.; Mikkela, P.; Hallikainen, M.; Ikonen, J.-P. Seasonal Dynamics of C-Band Backscatter of Boreal Forests with Applications to Biomass and Soil Moisture Estimation. IEEE Trans. Geosci. Remote Sens. 1996, 34, 758–770. [Google Scholar] [CrossRef]
  23. Barrett, B.; Dwyer, E.; Whelan, P. Soil Moisture Retrieval from Active Spaceborne Microwave Observations: An Evaluation of Current Techniques. Remote Sens. 2009, 1, 210–242. [Google Scholar] [CrossRef]
Figure 1. Location of the Sodankylä study domain and distribution of FMI’s soil moisture CAL-VAL sites.
Geosciences 08 00051 g001
Figure 2. A conceptualization of the SAC-SMA model. Each SAC-SMA model grid cell is divided into a maximum of 14 soil/vegetation density type tiles representing cross combinations of the four main mineral soil types. Semi-organic and organic soils are modelled with a separate scheme.
Geosciences 08 00051 g002
Figure 3. Time series of weighted in situ observations and weighted SAC-SMA top layer soil moisture (using both the same weighting as with the in situ observations as well as with all available SAC-SMA model tiles) in the SOD-reference pixel.
Geosciences 08 00051 g003
Figure 4. SAC-SMA model top layer soil moisture correlation with the ESA CCI SM COMBINED product (2003–2015). Left; pixel-wise average correlation (rhombus and associated value) and standard deviation of correlation (graduated colour code) between 2003 and 2015. The pixel highlighted with a yellow outline depicts the location of the SOD reference pixel. Right; yearly average aggregate correlation and trend between 2003 and 2015.
Geosciences 08 00051 g004
Figure 5. Same as Figure 4, but using SAC-SMA model top layer soil moisture correlation with the ESA CCI SM ACTIVE product (2003–2015).
Geosciences 08 00051 g005
Figure 6. Same as Figure 4 and Figure 5, but using SAC-SMA model top layer soil moisture correlation with the ESA CCI SM PASSIVE product (2003–2015).
Geosciences 08 00051 g006
Figure 7. ESA CCI SM ACTIVE product correlation with SAC-SMA model top layer soil moisture dependency on pixel-wise major soil/vegetation type fraction size.
Geosciences 08 00051 g007
Figure 8. ESA CCI SM PASSIVE product correlation with SAC-SMA model top layer soil moisture dependency on pixel-wise major soil/vegetation type fraction size.
Geosciences 08 00051 g008
Figure 9. Distance-based decay of inter-pixel soil moisture cross-correlation for ESA CCI ACTIVE and PASSIVE soil moisture data and SAC-SMA top layer model soil moisture data, as well as spatial autocorrelation for FMI interpolated precipitation observations.
Geosciences 08 00051 g009
Table 1. Yearly percentage of ACTIVE and PASSIVE retrievals forming the ESA CCI SM COMBINED product and percentage of missing observations for each.
YEARCOMBINED (%) ACTIVECOMBINED (%) PASSIVECOMBINED (%) MissingACTIVE (%) MissingPASSIVE (%) Missing
20031000888712
20041000696511
20051000706613
20061000737010
20075248391116
20085347651318
20095446641117
20105248381118
20115248371014
20121981591055
20131189502042
20141189552147
20151189532045
Table 2. Stations names, representative soil and vegetation cover types, and start of observations (month/year). The sensor types are given as: Decagon Devices Inc. 5TE (5TE), Campbell Scientific Ltd. CS655 (CS655), and Decagon Devices Inc. GS3 (GS3).
StationSoil TypeLand Cover TypeStartSensor TypeSpatial Weight
HA Open 1Haplic ArenosolPine Forest Opening11 August5TE0.193
Bog Open 1HistosolOpen Bog11 August5TE/CS6550.109
HA Forest 1Haplic ArenosolPine Forest11 August5TE0.467
Bog Forest 1HistosolForested Bog11 August5TE0.109
UG Forest 1Umbric GleysolMixed Forest11 August5TE0.122/0.061 1
UG Forest 2Umbric GleysolMixed Forest12 October5TE-/0.061 2
1, 2 Weights changed due to the addition of UG Forest 2 station for 2012 onwards.
Table 3. Input parameter values for soil water characteristics calculations
Soil TypeSand (%)Clay (%)Silt (%)Gravel (%)Organic (%)Depth (cm)
Leptosol (Shallow Soil)7052540025
Eutric Regosol (ER)15206500200
Histosol (Bog)------
Umbric Gleysol (UG)55045520200
Fine Haplic Podzol (HPF)65530155200
Coarse Haplic Podzol (HPC)75520403100
Haplic Arenosol (HA)80515150200
Table 4. Input parameter values for SAC-SMA a-priori parametrization scheme.
SAC-SMA TileCNWPFCSPTENS CAPGRAV CAPSYSAT COND
Shallow Soil950.030.110.390.050.170.4334.73
Forest ER530.120.310.410.180.100.083.31
Forest HA190.020.080.400.050.270.5169.14
Forest HPC190.030.100.390.040.180.4739.14
Forest HPF190.030.120.390.080.230.3948.51
Open HA290.020.080.400.050.270.5169.14
Open HPC290.030.100.390.040.180.4739.14
Open HPF290.030.120.390.080.230.3948.51
Sparse ER640.120.310.410.180.100.083.31
Sparse HA340.020.080.400.050.270.5169.14
Sparse HPC340.030.100.390.040.180.4739.14
Sparse HPF340.030.120.390.080.230.3948.51
Umbric (UG)530.290.430.520.130.080.061.56
Organic (Bog)950.290.430.520.130.080.061.56
Table 5. Individual SAC-SMA tile soil moisture correlation against corresponding individual in situ sites, as well as correlation of weighted SAC-SMA model soil moisture with spatially weighted average in situ observations.
YEARHA Open 1HA Forest 1UG Forest 1UG Forest 2Bog Open 1Bog Forest 1Weighted
20120.830.820.86-0.840.760.93
20130.700.740.890.940.690.970.91
20140.870.860.800.820.830.680.96
20150.870.830.900.770.510.320.92
Avg.0.810.810.860.850.720.680.93
Table 6. Fitting accuracy of regression models for describing ESA CCI SM PASSIVE product correlation with SAC-SMA model top layer soil moisture using major soil/vegetation type fraction sizes as the descriptive variables.
Model 1Model 2
Multiple R0.76670.7819
R Square0.58780.6114
Adjusted R Square0.57510.5932
Standard Error0.04990.0488
Table 7. ANOVA results for the suggested models describing ESA CCI SM PASSIVE product correlation with SAC-SMA model top layer soil moisture using major soil/vegetation type fraction sizes as the descriptive variables.
Model Number dfSSMSFSignificance F
1Regression20.2400.08033.5633.73 × 10−13
Residual650.1530.002--
Total670.393 --
2Regression30.2310.11546.3383.11 × 10−13
Residual640.1620.002--
Total670.393---
Table 8. Regression results for the suggested models describing ESA CCI SM PASSIVE product correlation with SAC-SMA model top layer soil moisture using major soil/vegetation type fraction sizes as the descriptive variables.
Model Number CoefficientsStandard Errort Statp-Value
1Intercept0.2390.01615.2403.87627 × 10−23
Shallow Soil Fract.−0.6800.100−6.8213.59076 × 10−9
Organic Fract.0.2200.0573.8512.71507 × 10−4
2Intercept−0.4100.080−5.1602.59729 × 10−6
Mineral Fract.0.6500.0907.1888.70401 × 10−10
Semi-Organic Fract.0.6540.1026.3852.20339 × 10−8
Organic Fract.0.8890.0909.8332.03804 × 10−14
Table 9. Yearly, study domain wide average inter-pixel soil moisture cross-correlation and inter-pixel soil moisture cross-correlation dependency on (correlation with) distance between pixel-pairs for ESA CCI ACTIVE and PASSIVE soil moisture data and SAC-SMA top layer model soil moisture data, as well as spatial autocorrelation for FMI interpolated precipitation observations.
YEAR Domain Wide Average Inter-Pixel Soil Moisture Cross-CorrelationInter-Pixel Soil Moisture Cross-Correlation Dependency on (Correlation with) Distance
ACTIVEPRECIP.PASSIVESAC-SMAACTIVEPRECIP.PASSIVESAC-SMA
20030.820.770.600.77−0.77−0.84−0.62−0.49
20040.920.750.770.78−0.89−0.92−0.59−0.67
20050.790.780.710.82−0.94−0.82−0.59−0.42
20060.830.760.560.83−0.91−0.78−0.67−0.42
20070.900.760.750.80−0.93−0.79−0.46−0.61
20080.900.740.760.70−0.92−0.87−0.69−0.85
20090.880.790.640.82−0.94−0.88−0.68−0.52
20100.920.770.650.72−0.91−0.78−0.74−0.71
20110.840.790.580.74−0.95−0.86−0.77−0.77
20120.870.790.590.84−0.92−0.94−0.41−0.63
20130.910.750.470.79−0.90−0.82−0.57−0.54
20140.910.800.500.80−0.90−0.88−0.63−0.61
20150.860.850.550.84−0.95−0.92−0.62−0.65
Average0.870.780.630.79−0.91−0.85−0.62−0.61

