Ontology-Based Photogrammetry Survey for Medieval Archaeology: Toward a 3D Geographic Information System (GIS)
by
 , and
, and
Pierre Drap
1,*,† ,
,
Odile Papini
1,†,
Elisa Pruno
2,†,
Micchele Nucciotti
2,† and
Guido Vannini
2,† 1
Aix-Marseille Université, CNRS, ENSAM, Université De Toulon, LSIS UMR 7296, Domaine Universitaire de Saint-Jérôme, Bâtiment Polytech, Avenue Escadrille Normandie-Niemen, 13397 Marseille, France
2
SAGAS Department, University of Florence, 50121 Florence, Italy
*
Author to whom correspondence should be addressed.
†
These authors contributed equally to this work.
Geosciences 2017, 7(4), 93; https://doi.org/10.3390/geosciences7040093
Submission received: 3 September 2017
/
Revised: 17 September 2017
/
Accepted: 17 September 2017
/
Published: 26 September 2017
(This article belongs to the Special Issue Remote Sensing and Geosciences for Archaeology)
Abstract
:This paper presents certain reflections concerning an interdisciplinary project between medieval archaeologists from the University of Florence (Italy) and computer science researchers from CNRS, National Center for Scientific Research, (France), aiming towards a connection between 3D spatial representation and archaeological knowledge. We try to develop an integrated system for archaeological 3D survey and all other types of archaeological data and knowledge by incorporating observable (material) and non-graphic (interpretive) data. Survey plays a central role, since it is both a metric representation of the archaeological site and, to a wider extent, an interpretation of it (being also a common basis for communication between the two teams). More specifically, 3D survey is crucial, allowing archaeologists to connect actual spatial assets to the stratigraphic formation processes (i.e., to the archaeological time) and to translate spatial observations into historical interpretation of the site. It is well known that laser scanner, photogrammetry and computer vision are very useful tools for archaeologists, although the integration of the representation of space, as well as archaeological time has not yet found a methodological standard of reference. We propose a common formalism for describing photogrammetric survey and archaeological knowledge stemming from ontologies: indeed, ontologies are fully used to model and store 3D data and archaeological knowledge. We equip this formalism with a qualitative representation of time, starting from archaeological stratigraphy. Stratigraphic analyses (both of excavated deposits and of upstanding structures) are closely related to Edward Cecil Harris’s theory of the “Unit of Stratigraphication” (referred to as “US”, while a stratigraphic unit of an upstanding structure Unita Stratigrafica Murale, in Italian, will be referred to as “USM”). Every US is connected to the others by geometric, topological and, eventually, temporal links, and these are recorded by the 3D photogrammetric survey. However, the limitations of the Harris matrix approach led us to use another formalism for representing stratigraphic relationships, namely Qualitative Constraints Networks (QCN), which was successfully used in the domain of knowledge representation and reasoning in artificial intelligence for representing temporal relations.
1. Introduction
This paper presents a set of reflections based on sixteen years of interdisciplinary cooperation between medieval archaeologists from the University of Florence (Italy) and computer science researchers from CNRS of Marseille (France), aiming towards a connection between 3D spatial representation and archaeological knowledge for interpreting the Mediterranean Middle Ages [1]. In the last decade, we witnessed significant improvements in photogrammetric techniques, starting with the SIFT descriptor in 2004 [2], used to automatically match thousands of homologous points. This opened the way to increased automatization of the photogrammetric process, auto-calibration and automatic 3D dense point cloud generation. These new photogrammetric tools now can easily replace the terrestrial laser scanner still used at the turn of this century in archeology, but offer no improvements and remain unable to link semantic data with this plethora of accurate geometric data. At the same time, the stratigraphic analysis applied to upstanding buildings in the framework of medieval archeology is, on the one hand, absolutely mandatory and, on the other hand seems, to have reached a crucial point in its evolution. Italian Medieval Archeology, in parallel with a close relationship with historical research, contributed to the development of archaeological methodologies at European and world levels. A specific and particularly outstanding contribution was provided in the field of non-destructive urban and territorial analysis. Such was indeed the (successful) attempt to embed stratigraphic theory in the study of historical buildings, extending the principles of the site-formation process to the architectural-formation process [3]. The translation of the Harris paradigm [4] in upstanding structures [3,5], i.e., in full 3D context, brings some inconsistencies, which become more and more visible with the development of new 3D surveying tools. Many scholars argue the possibility to increase the Harris matrix with specific fields suitable for better defining and analyzing upstanding building stratigraphy. In Italy, where the use of upstanding building stratigraphy is commonly used, especially among medieval archaeologists, see the status quaestionis in Gallina [6]. At the same time, recent advances in knowledge representation, as the development of ontologies also in cultural heritage, change the way to manage knowledge and extend the possibilities to connect with other research fields. The presented work aims at merging photogrammetric survey and temporal relations in order to propose a new representation of temporal relations stemming from temporal qualitative networks thanks to the Allen approach. This is done by developing a common framework describing knowledge used in photogrammetry, as well as in stratigraphy fully based on ontologies. An ontology describing the photogrammetric process and the measured artifact (ashlar block, observed relevant surface and then the Unit of Stratigraphication (US) and connected concepts) is aligned with the well-known ontology used now since a long time in cultural heritage: International Committee for Documentation, Conceptual Reference Model (CIDOC CRM) [7]. The use of ontologies to manage cultural heritage is increasing every year, opening the door for many interesting perspectives [8,9,10,11]. Significant advances developed in CIDOC CRM [12,13,14] (and now with CIDOC-CRMba, an ontology to encode metadata about the documentation of archaeological buildings [15]) are also very useful for exploring certain theoretical concepts underlying the construction of the Harris matrix. CIDOC CRM is now well adopted by cultural heritage actors from a theoretical point of view [16,17,18,19], as well as applicative works [16] and a very interesting direction toward Geographic Information Systems (GIS) applications [20].
We have developed an ontology to represent both the photogrammetric process and the measured objects, ashlar blocks and US. The objects are modeled according to the point of view of the measurement process but indeed, these artifacts or concepts as US can also be seen from a cultural heritage or conservation point of view. This is the reason why we have aligned our ontology with CIDOC CRM. This modeling work is based on a previous study that started from the premise that collections of measured items are marred by a lack of precision concerning their measurement, assumptions about their reconstruction, their age and origin. It was therefore important to ensure the coherence of the measured items and potentially propose a possible revision. This previous work was done in the context of underwater archeology with similar problems. For more information, see [21,22,23,24]. The case study of this work is the Montreal Castle in Showbak, Jordan. Where the University of Florence has been working since the 1980s and LSIS since 2001 [25]. We are thus working on a huge quantity of data acquired over time according to the evolution of the technology and the team evaluation. We present in this paper both photogrammetric surveys and their link with archaeological data through a common formalism based both on pure XML and on ontology.
2. Managing Time in Archeology
One of the first interesting computing applications in archeology concerning the temporal domain was probably due to David George Kendall [26,27], a statistician at the University of Cambridge. He worked on seriation (“The purpose of seriation is to order the individuals of a population in order that exhibits in the most coherent way the evolutionary structure of their descriptive traits. The principles according to which order—which reflects temporal evolution—is obtained may be diverse, even if they explicitly express the notion of evolution” [27], cited by Guenoche and Tchernia in [28]) in archeology by treating the data of Flinders Petrie. Petrie, a pioneer of modern and scientific archeology, proposed a method for determining a relative chronology of artifacts according to their characteristics and to the context in which they were discovered. The analysis of the relationships between all the significant details of the objects found during the excavation also makes it possible to group the objects into families and to highlight evolutionary trends in a group of objects. Seriation is still relevant [29,30], although the management of time in archeology has been recast with the work of Harris and the stratigraphic approach [31] where the relations between stratigraphic units are both temporal and topological.
Edward Cecil Harris, a British archaeologist, developed in 1979 a matrix method for the management and verification of spatial-temporal relations between stratigraphic units. The three temporal relations (anteriority, posteriority and synchronism) associated with topological relations describing the physical relations (resting on, superimposing, overlapping, etc.) serve to organize the stratigraphic units in relative time. The stratigraphic unit, referred to as the US, is defined as the smallest unit of land that can be located before and after neighboring units by examining its physical boundaries.
The essential difference between Harris’s approach and seriation lies in the fact that the establishment of the relative chronology of the stratigraphy (Harris method) does not take into account the artifacts present in the stratigraphic units [32], but only the physical position of each US and their relationship. The main objective in the field is to recognize the elementary stratigraphic units and to understand their topological relationships (and, of course, how they were formed). From these relations, the archaeologist deduces the stratigraphic relations that make it possible to propose a chronological order according to their physical position. For example, with regard to the stratigraphic analysis of a building, the different stages of its construction can be observed and decomposed into stratigraphic units.
During archaeological excavations, hundreds or even thousands of stratigraphic units can be identified and listed. The development of a graph and its translation into a Harris diagram or matrix has enabled the detection of inconsistencies in the data, mainly by detecting cycles in the graphs.
Harris’s approach therefore proposes a relative scheduling as a function of time. However, the use of the typology of artifacts (the typology that is the basis of all seriation) present in the stratigraphic units may be useful to determine the time that can be quantified using absolute benchmarks. The two approaches, the relatively ordered time by Harris and the absolute time given by the typology, but also by the correlation with texts of the time or by scientific methods such as carbon 14 (Radiocarbon dating is a method developed by Willard Frank Libby used to calculate the age of objects containing organic material. The measurement of the 14C decay is a standard way to roughly calculate the date of death or fixation of an object containing organic material) dating or dendrochronology (The dendrochronology dating method, first developed by Andrew Ellicott Douglas, is based on the growth of tree rings. This method can only be used if one knows the growth curve of the region where the object that we want to date was found), are both linear approaches.
Djindjian and Desachy resituated Harris’s work from the perspective of graphs resulting from operational research [33,34,35,36]. The PERT (Program Evaluation and Review Technique) method and the MPM (Potential Metrics and Methods) method consist of breaking down the production process into a series of precise operations, or tasks, separated by stages, each of which constitutes the end of one task and the beginning of another [33].
2.1. Harris’s Methods for the Temporal Representation of Stratigraphic Units
Figure 1 shows the PERT diagram (a) and the MPM diagram (b) in the corresponding Harris matrix (c) and Harris diagram (d). It illustrates the relationship between the Harris method and the pre-existing PERT and MPM methods. In both cases, the graph accounts for the scheduling of the tasks required to execute a program. In the PERT method, the steps for executing the program are represented by the vertices, while the arcs represent the task. In the case of the MPM method, it is the opposite.
The analogy with the archaeological process is strong: the stratigraphic units are represented as temporally-related tasks, and the very close relationship between the Harris diagram (d) and the MPM diagram (b) is shown in Figure 1.
The relative position of the five stratigraphic units can be seen in the example in Figure 2. On the left, the perspective view allows us to propose a chronology; a cross-section of the same US is in the center; and on the right, the Harris diagram is shown.
It is important to note US 12, which is a cut in the layer labeled as US 15. US 12 is a negative US because it is only a trace of an action of cut. US 12 now separates US 13 and 14, but the archaeological investigation must be able to understand if these two US before the cut of US 12 are the same US or not. If this is the case, we will add in the diagram the synchronous relation between US 13 and 14. This is followed by US 11, which fills US 12 visible at that time.
The Harris formalism which allows one to manage and visualize these US, is well distributed throughout the community by software, mostly open source, which helps to visualize and store these graphs.
Earlier software such as ABC FlowCharter 4.0 (originally from Micrografx, in 1995 and then by iGraphx) was mainly presented as flowchart software with an adaptation for the Harris formalism. Also in 1985, the old Strata software program from the Computing Laboratory, University of Kent at Canterbury, used a set of recorded observations of stratigraphic relationships as input and was the foundation stone of jnet software [38] based on semi-structured formalism (XML). In the same way, we can mention the Bonn Archaeological Software Package (BASP) [39] developed since 1973 included in many software packages dedicated to archeology (orthophoto, level curve, etc.). None of these software packages are available any longer.
Still used by the community, we can cite ArchEd from the University of Vienna, Austria [40], which allowed one to build stratigraphic graphs, but they were completely disconnected from the survey. More recently, Intrasis, a Swedish GIS software package dedicated to archeology, is able to manage 3D files coming from terrestrial laser scanners and linked using ArchEd [41]. In the same direction, based on the GIS platform, the Harris matrix Composer from Christoph Traxler and Wolfgang Neubauer [42] tries to fill the gap between survey and the Harris matrix. The most recent one, developed by Jerzy Sikora and his team [43], plans to use mobile devices in the field that are able to merge visualization, data and analysis.
The main works on US formalization and visualization have been done as part of archaeological digs. The latest works include ADS (Archeology Data Service, U.K.) and ISTI-CNR, Italy, where archaeological dig reports, 3D surveying, 3D visualization on the web and the Harris formalism can be found in the same tool [44]. Indeed, the Harris formalism has been developed for archaeological excavation and a transposition on an upstanding structure, in a real 3D context, with stratigraphic units still functional at the time they were studied, which implies the development of many new issues to be considered, as well as an accurate formalism.
However, Harris’s representation of time is also limited. Indeed, taking into account only points on the temporal scale, it cannot express the notion of duration. This restriction due to the linear representation of time was already perceived in the Nineteenth Century by Flinders Petrie: “The main value of dates is to show the sequence of events; and it would matter very little if the time from Augustus to Constantine had occupied six centuries instead of three, or if Alexander had lived only two centuries before Augustus. The order of events and the relation of one country to another is the main essential in history. Indeed, the tacit common-sense of historians agrees in treating the periods of great activity and production more fully than the arid ages of barbarism, and so substituting practically a scale of activity as the standard rather than a scale of years.”, Petrie in 1899, as quoted by Lucas ([45], p. 8).
Thus, the formalism proposed by Harris responds well to the need for formatting and control of the data, but does not allow representing the complexity of the temporal data used in archeology. Since the 1980s, the concept of palimpsest seems to be necessary to describe the complexity of temporal superposition already directly observable. “The house where I am writing this paper was built towards the beginning of this century, in the courtyard of an ancient farm whose structure is still visible. From my open window, I see an interweaving of houses and constructions, most of them dating back to the 19th century, sometimes including parts of earlier constructions from the 18th or 17th century. The 20th century here looks so localized, so secondary: it is reduced to details, such as windows, doors or, within houses and flats, furniture.... Right now, the present here is made up of a series of past durations that makes the present multi-temporal.” Laurent Olivier cited by Lucas ([45], p. 37).
Since the 1990s, a new trend has been developing and proposes to use other temporal models in archeology to take this complexity into account. Ann Ramenofsky, an archaeologist at the University of New Mexico, USA, suggests using intervals to take into account measurement uncertainties in absolute chronology assessments ([46], p. 79). Other teams propose to extend the temporal relations proposed by Harris to the time management formalism proposed by Allen [46]. This results in the number of temporal relations increasing from 3–13 (see Figure 3), as well as the ability to reason in terms of duration over intervals and no longer on a succession of ordered instants [47,48]. However, even if this formalism is much richer (13 relations are proposed to manage time intervals), this approach has not yet spread in the world of archeology [49].
As we have seen, the topic of time in archeology is most important and very complex, though it has been too often neglected. The work conducted by G. Lucas [45,50] has been, until now, the most exhaustive presentation and reflection about it. Following Lucas, time is a theoretical concept used in different ways in contemporary archeology, but its meanings are not always the topic of discussion.
2.2. Chronology
Therefore, by analyzing and breaking up an archaeological deposit into basic, discrete stratigraphic units, archaeologists are able to create (relative) chronologies of all activities performed (by man or by nature) at a site over time, in order to describe and interpret it. The physical relationships between deposits and interfaces help archaeologists deduce stratigraphic relationships, i.e., the relative chronology of each US. To allow archaeologists to organize all the stratigraphic relationships between the different US, Harris also designed a diagram, the matrix. “The Matrix changed the paradigm of the archeology from the one-dimensional concept embodied in the Wheelerian section drawing to a four-dimensional model that combines the three physical dimensions with that of time, the forth dimension. In this sense, it is like the clock face of twelve hours and the Gregorian calendar of a twelve-month year, which are diagrammatic ways in which time, which does not exist in any material form, can be seen. More than any other science, archeology is a time-related discipline and the Harris Matrix has given that emphasis a revolutionary force in its ability to translate the physical evidence of stratification into calendar of relative time, unique to each site, but universally comparable through the Matrix diagrams.“ ([51], p. 10).
As previously stated in this paper, the Harris matrix is an important and not yet out-dated tool, but which suffers from its inability to express the concept of duration, as well as upstanding building stratigraphy.
In agreement with certain scholars [52], especially in Italian Medieval Archeology, who wonder how it applies to the study of upstanding building archeology, we try to work on:
- Maximum readability and immediacy of the drawings and schedules, avoiding, as much as possible, obscure symbolism and hypertrophy of the documentation
- Simultaneous presence in the same media of all kinds of information (text, drawing, pictures), in order to really simplify the information sharing. It is clear that the Harris matrix itself is not very easy to understand and lacks meaning, and without photographs and drawings, the US are equally unclear. This rigid separation of the information must be properly addressed
- The formalism used to store and represent this complex and heterogeneous knowledge cannot be rigid and too structured because archaeological data and the knowledge itself change over time [53].
Despite its lack of the concept of duration, the Harris matrix has been a useful tool for analyzing archaeological stratigraphy up to now.
Since in archeology the representation of space is the same as the representation of time, our team started to work on the modeling of archaeological time after 2009 [25,54] in order to embed this aspect within the system and to eliminate the separation of duration from the temporal sequence of a site. We were also trying to develop a tool able to automatically generate Harris matrices, as well as integrate nonlinear time models [45,52,55,56] into the chronological structure of the Harris matrix itself.
3. Photogrammetric Analysis of the Shawbak Castle
Archaeological excavations are always irreversibly destructive, so it is important to accompany them with detailed documentation reflecting the accumulated knowledge of the excavation site. However, not only the excavation needs an accurate documentation, also the upstanding structures research [3], especially before any restoration work, which often deletes the previous historical information. This documentation is usually iconographic and textual. Graphical representations of archaeological upstanding structures such as drawings, sketches, watercolors, photographs, topography and photogrammetry are indispensable for such documentation and are an intrinsic part of an archaeological survey. However, as pointed out by Olivier Buchsenschutz in the introduction to the symposium Images and archaeological surveys, in Arles, France, in 2007 [57], even a very precise drawing only retains certain observations that support a demonstration, just as a speech retains only some arguments, but this choice is not usually explicit. This somewhat lays the foundation of this work: a survey is both a metrics document and an archaeologist’s interpretation.
The Castle of Shawbak (Ma’an region, Jordan), also known as the “Krac de Montréal” (Figure 4), is one of the best preserved rural settlements in the entire Middle East [58]. As the core site of the Florence archaeologists’ research in Jordan, it has been chosen to develop a new documentation system. This extensive site (230 m × 80 m) is stratigraphically complex both in depth and in upstanding structures. According to Brogliolo’s rules of upstanding structures stratigraphy [3], it is subdivided into 23 CF (Corpo di Fabbrica, which means the same parts of structure, which form a single part of the building). In order to determine the site’s chrono-stratigraphic sequences, the Florentine archaeologists started by analyzing the stratigraphy of all CF, which of course, is the first step of the study.
All the examples presented here are only from CF5, a very important archaeological feature of the castle, which summarizes its different temporal phases (starting with the Crusader and Ayyubid periods). It has also been used to produce a full-scale 3D model showcased during the exhibition From Petra to Shawbak. Archeology of a frontier (see Figure 5) [59].
3.1. How Photogrammetry Helps Archaeological Research
The photogrammetric approach is used to solve two kinds of problems: the first one is to build a 3D or 2D representation, or part of the site, in order to have a representation of the site that can be used as an interface for the large amount of textual and iconographic data collected and computed by archaeologists. The second one is the necessity to collect metric data on identified artifacts in order to be able to perform a dimensional analysis, clustering and other statistical computations.
Indeed, two families of objects must be surveyed:
- The area that we need to study, which can be represented by an orthophoto, a digital terrain model (DTM) or, more generally when the studied site is complex and a full 3D approach is required, by a 3D surface, mainly meshes.
- The artifact that we seek to position in space and for which we have good a priori knowledge (in our case, the atomic element is the ashlar block, the smallest measurable element of each USM)
Throughout this work, we deal with these two aspects, artifacts and unstructured surface, by addressing two different approaches; one using a priori knowledge through measurements and the second based solely on geometry. The first approach, based on the a priori knowledge that we have about the measured artifact, uses our knowledge of the object to compute its size and position in space. This method can also reduce the time required for measurements. The second approach, used to survey land for example, but also the main structure of the castle, uses automatic tools coming from photogrammetry to compute a dense cloud of 3D points.
Finally, a very important point is the link between geometry and knowledge; a model, 3D or 2D, representing a site is a relevant interface to access the data known about the site. 3D site representations provide important added value to archaeologists who are then able to study a three-dimensional overall picture. Moreover, it should be noted that, by the nature of archaeological research, archaeological data are incomplete, heterogeneous, discontinuous and subject to possible updates and revisions to each field season campaign. The documentation system, linked to archaeological data, must be able to manage these constraints. The archaeological knowledge in this work is represented by ontologies and we have developed some 3D viewer software able to manage links with ontologies, as well as display graphical requests on these ontologies. This will be discussed in the next section.
3.2. Dense Cloud of 3D Points and Meshes
Since 2002, with one three-month campaign per year, more than 90,000 photographs have been taken of the Shawbak site, following the continuous progress of digital camera technology, as well as photogrammetry software.
These campaigns have produced photographic sets acquired with calibrated digital cameras both in convergent and parallel coverage with the survey of control points using a total station and DGPS. These control points are used to reference the photogrammetric models in a common geodetic system. We are still processing these photographs, using the set of control points, in order to obtain a complete 3D model with dense point clouds of the entire site.
This first 3D elaboration produces a huge quantity of 3D points and meshes with the help of several photogrammetric software programs mainly Photomodeler from EOS and Photoscan from Agisoft. The full collection of images is split into several sets of 3000–9000 photographs, which are oriented independently and then computed in the global reference system with the help of control points.
In 2012, a helium balloon was used to survey the site, which resulted in a small-scale model. Oriented with DGPS control points, this model of course is not suitable for measuring artifacts, but allows us to position all the studied buildings in a common 3D model. Figure 6 shows the whole model and some large-scale images of the buildings surveyed.
3.3. Measuring Artifacts and Querying the Model: Spatial Considerations
Specific photogrammetry tools dedicated to measuring stones individually have been under development since 2002 to help archaeologists to easily produce photogrammetric surveys. These tools are now integrated in a more complex system, which allows automatic production of 2D or 3D representations from archaeological database queries. The graphic 2D documents produced through this process look like the handmade drawings done by archaeologists using ortho-rectified photos.
Once all the photographs are oriented, the I-MAGE process (Image processing and Measure Assisted by GEometrical primitive), developed in 2001, is used to support the user during the measuring process in photogrammetric surveys. Users can make a 3D measurement using one single photograph, without altering the precision of the result. Previously published at a CIPA Heritage Documentation symposium [60], (CIPA was founded in 1968 as the Comité International de la Photogrammétrie Architecturale, in English: “International Committee of Architectural Photogrammetry”), this method allows the user to concentrate on the archaeological aspects of the survey and pay less attention to the photogrammetric ones.
We use this approach also to produce 3D models of building blocks (i.e., ashlars) based only on the visible sides. The morphology of each ashlar block is expressed as a polyhedron with two parallel sides, or faces. In most of the cases, only one side is visible, sometimes two, rarely three. The survey process can inform about the dimensions of one face, then the entire polyhedron is computed according to the architectural entity’s morphology (extrude vector) and the data (depth, shape, etc.) provided by the archaeologist.
Computing an extrusion vector can be easy when the architectural entity’s morphology is obvious. During a wall survey, for example, an extrusion vector can be computed by a least squares adjustment. This is the plane used by I-MAGE. In this case where the entity’s geometrical properties are simple, the extrusion vector is calculated before the survey phase, and the block is extruded directly from the measured points (see Figure 7 and Figure 8).
In the case of the survey of an arch, the extrusion should be radial, needs the geometrical features of the entity (intrados, radius, axis) and is therefore processed afterwards.
This approach for measuring blocks was already published in an ISPRS (International Society for Photogrammetry and Remote Sensing) congress [61] and has been combined with the I-MAGE process in order to obtain an integrated tool.
The main problem is determining whether a block is an edge block when observing photogrammetric data. To do this, archaeologists need a document of the highest quality.
We have tried developing an automatic edge detection system for ashlar blocks, but indeed, the problem is more related to expert knowledge. Since 2016, we have developed a new version of the I-MAGE tool using both an oriented image and the dense point clouds. The user can describe the block geometry observing a good quality photograph, and the 3D block geometry is computed using the dense cloud of 3D points. The extrude value is still given as an hypothesis by the archaeologist.
Since 2014, we stopped using a database to store ashlar block measurements and are currently only using an ontology describing both the photogrammetric process and the archaeological knowledge related to the blocks and stratigraphy. These aspects are detailed in the next section.
The survey process produces a set of measured ashlar blocks linked with both the 3D model and the archaeological knowledge (stratigraphy, lithotype, stone tool analysis, etc.).
3.4. The Use of Stratigraphic Units in Archeology
Starting from the most important concept of the stratigraphic archeology, the US, we try to document directly in the survey the main characteristics of each one. Following the publication of the first edition of E. Harris’s book Principles of archaeological stratigraphy (1979) [4], many archaeologists follow the idea that all archaeological sites, to a greater or lesser degree, are stratified, and for this reason, it is necessary to know the main principles of the archaeological stratigraphy to obtain all the possible information, as we could see before.
As we can see, the forms of US are the result of either natural (deposition or erosion) or human (construction or destruction) actions. Their position on the entire wall, as well as the physical and stratigraphical relationships with the other US are necessary to detect the relative chronological sequence of the entire building (and, when comparing all structures, the relative chronological sequence of the entire site). The characteristics that distinguish each US of the upstanding building are mainly the stones’ lithology, the ashlar blocks’ dimension and shape and the kind and the quantity (or also the absence) of the mortar. Of course, it is extremely relevant to note the physical relationships between the different US (see Figure 9). Therefore, we need to survey all the dimensional and technological data and also, of course, to survey the position of all the US.
4. Photogrammetry, Knowledge and Time
The 3D GIS, merging photogrammetry and ontologies, is the last step of this chain and aims at the automatic production of 3D (or 2D) models through ontological queries: these 3D models are in fact at the same time a graphic image of the archaeological knowledge and the current interface through which the user can edit the dataset.
This approach enables automatic 3D thematic representation and new archaeological analysis, through bidirectional links between 3D representation and archaeological data. In this section, we will see in Section 4.1 the ontology development, merging photogrammetry and archeology knowledge, then in Section 4.2, we present briefly certain tools used to easily manage these ontologies. Section 4.3 will show the link with stratigraphy and the use of time relations, and Section 4.4 proposes a research direction to represent duration in stratigraphy and to solve time constraints in an archaeological context.
4.1. Ontology for Photogrammetry Process
The ontology developed in the framework of our research takes into account the manufactured items surveyed, as well as the method used to measure them, in this case, photogrammetry. The surveyed item is therefore represented from the measurement point of view and has access to all the photogrammetric data that contributed to its measurement in space. Two ontologies are aligned in this context; one dedicated to photogrammetric measurement and the geo-localization of the measured items, whereas the other is dedicated to the measured items, principally the archaeological artifacts, describing their dimensional properties, ratios between the main dimensions and default values. These ontologies are developed closely linked to the Java class data structure that manages the photogrammetric process, as well as the measured items. Each concept or relationship in the ontology has a counterpart in Java (the opposite is not necessarily true). Moreover, surveyed items are also archaeological items studied and possibly managed by archaeologists or conservators in a museum. It is therefore important to be able to connect the knowledge acquired when measuring the item with the ontology designed to manage the associated archaeological knowledge. CIDOC CRM is a generic ontology that does not support the items that it represents from a photogrammetric point of view; a simple mapping would not be sufficient, and an extension with new concepts and new relationships would be necessary. This modeling work is based on a previous study that started from the premise that collections of measured items are marred by a lack of precision concerning their measurement, assumptions about their reconstruction, their age and origin. It was therefore important to ensure the coherence of the measured items and potentially propose a possible revision. This previous work was done in the context of underwater archeology with similar problems. For more information, see [21,22,23,24].
The extension of the CIDOC-CRM ontology is structured around the concept of Man-Made Object. The root of ItemMesurable developed in this project extends this concept (see Figure 10). The mapping operation is done in Java by interpreting a set of data held by the Java classes as a current identification of the object: 3D bounding box, specific dimension. These attributes are then computed in order to express the correct CRM properties.
Several methodologies can be chosen regarding mapping two ontologies. For example, Nicola Amico and his team [13] chose to model the survey location with the concept of Activity in CRM. They also developed a formalism for the digital survey tool mapping the digital camera definition with Digital Machine Event. We see here that the mapping problem is close to an alignment problem, which is really problematic in this case. Aligning two ontologies dealing with digital camera definition is not obvious; a simple observation of the lack of interoperability between photogrammetric software shows the wildness of the problem. We are currently working on an alignment/extension process with Sensor ML which is an ontology dedicated to sensors. Although some work has already been achieved [62], it is not enough to clearly hold the close range photogrammetry process, from image measurement to artifact representation.
In addition, we use the concepts of time representation present in CIDOC CRM in order to represent the Harris relations and then Allen’s formalism about the time intervals.
4.2. Tools for Managing Ontologies
The use of ontologies in archeology and cultural heritage, as we have already stated, is becoming increasingly widespread. Indeed, this formalism is particularly suitable for heterogeneous data and offers concepts and tools to manage incompleteness, updates and revisions of the involved knowledge. Therefore, the way ontologies are structured is far from a traditional relational database, and managing them can be difficult for a person without a solid background in computer science. In addition, even if many research papers are published in the field of ontology for cultural heritage, the use of ontologies is not yet a common or widespread tool for managing archaeological excavations. Much research shows that the ontologies are very suitable for archeology, but only a very few archaeological missions use ontologies to manage data coming from excavations.
This is normal: even if we can demonstrate that a new approach is very interesting, changing technology is always a high cost decision, and ensuring the continuity of the data, analysis and student training is a real challenge.
We decided to develop some tools in order to display data stored in ontologies as a virtual relational database in order to have a simplified view of the stored data. These tools can provide a static point of view on these ontologies and allow simple manipulations similar to those possible on a relational database.
The first one is an editor that displays classes, instances and properties present in an ABox (a set of assertional axioms in an ontology) as if the data were structured by a table in a relational database (see Figure 11). By reading the ABox, the editor is able to display the classes present in the ontology, all their instances and offers a simple and dynamic way to display data properties as normal fields of these instances and the possibility to modify them (also, as we are in the ontology context, to add or remove fields). This of course gives us many other possibilities as the archaeological work is always in progress, and a modification of the data structure is always possible and easy to implement through this interface.
In addition, the editor is able to display graphs showing the relations between instances classes and properties. A full bidirectional access is provided and allows one to modify the value of the properties accessed by clicking on the graph.
The same approach allows us to build an editor dedicated to physical and stratigraphic relations between US.
This tool is dedicated to stratigraphic relations between US, reading an ABox and displaying an exhaustive list of the US present in the ABox with all the physical and stratigraphic relations between them. This tool allows one to add, cancel, modify the relations between US and visualize them through a graph. We are still working on a consistency check tool to control on the fly the digit (see Figure 12).
Finally, we developed a tool for 3D visualization of the artifacts stored in the ABox. Indeed, currently, ontologies are used also as a serialization tool to store all the data relative to the survey: oriented photographs, 2D and 3D points, relevant points for stone-by-stone surveys, computed ashlar blocks and archaeological concepts often non-measured directly as stratigraphic units, Corpo di Fabbrica, etc. The tool is able to read the ABox and, thanks to the procedural attachment (as detailed in the next section), can instantiate the corresponding Java instance and produce a 3D representation of the instances stored in the ABox. This tool was used to produce the two images shown in Figure 13 according to the specific request.
4.3. ARPENTEUR Ontology: A Link between Photogrammetry and Stratigraphy
We propose now to work on the link between 3D measurement and temporal relations. Indeed, archaeologists use a set of rules to determine temporal relationships by observing physical relationships. Table 1 describes the physical conditions necessary for establishing the temporal relationships. The temporal relations are deduced from the physical relations, and often, these physical relations can be deduced from the relative position of the US between them using the photogrammetric measurement of their components. As the US are built on measured objects, it will be possible to compute the veracity of the physical relations in order to deduce the temporal relations if they have not been specified by the archaeologist or to ensure a coherence of time relations.
4.3.1. Ontology and Graphical Representation
This work is based on a close link between, on the one hand, the software engineering aspects and the operative modeling of the photogrammetry process, the needed computation and artifacts measurable by photogrammetry in the context of this project and, on the other hand, the ontological representation of the same photogrammetry process and surveyed artifacts. The present implementation is based on a double formalism: the Java programming language, used for computation, photogrammetric algorithms, 3D visualization of photogrammetric models and cultural heritage objects, then OWL (Web Ontology Language) for the definition of ontologies describing the concepts involved in this photogrammetric process, as well as the surveyed artifacts.
For several years, OWL has been used as a standard for the implementation of ontologies (W3C, 2004). In its simplest form, it allows for representing concepts (class), instances (individual), attributes (data properties) and relations (object properties). The ontology construction in OWL, symmetric to the Java taxonomy, cannot be produced automatically. Each concept of the ontology has been constructed with a concern for the representation of accurate knowledge from a particular point of view: measurement. The same point of view presides over the elaboration of the Java taxonomy, but software engineering constraints involve differences in the two hierarchies of concepts. For each ontology concept, a procedural attachment method has been developed with OWLAPI. As each concept present in the ontology has a homologous class in the Java tree, each individual of the ontology can produce a Java instance and can benefit from its computational capabilities. In the same way, each Java class has a counterpart in the ontology and can produce an individual of that ontology.
We have abandoned automatic mapping using Java annotation and Java beans for a manual extraction even if this is commonly done in the literature [63,64,65].
Thus, reading an XML file used to serialize a Java instance set representing a statement can immediately (upon reading) populate the ontology; similarly, reading an OWL file can generate a set of Java instance counterparts of the individuals present in the ontology. The link between individuals and instances persists and it can be used dynamically. The huge advantage of this approach is that it is possible to perform logical queries on both the ontology and the Java representation. We can thus read the ontology, visualize in 3D the artifacts present in the ontology and graphically visualize the result of SQWRL queries in the Java viewer.
The approach we have chosen so far, using OWLAPI and the Pellet reasoner, allows for handling SQWRL queries using an extension of SWRL built-in [66] packages. SWRL provides a very powerful extension mechanism that allows for implementing user-defined methods in the rules [67]. The photogrammetric survey is expressed as an ABox. An ontology describing the photogrammetric process, as well as the measured objects was populated by the measurements of each block and a set of corresponding data (USM owner, etc.). It is therefore this ontology that contains the metric information such as the geo-positioning of each block and all the physical and stratigraphic relationships provided by archaeologists.
The reading and the geometrical interpretation of this ontology can lead us to validate or invalidate the physical relations by a topological analysis of the relations between the various components of the USM, but also to check the consistency of temporal relations by extracting a graph of constraints and then using a logical solver.
For example, the 3D visualization shown in Figure 13 is done using the ABox and on-the-fly instantiation of corresponding Java instances. The colorization is the result of an SQWRL request done on the ontology.
Moreover, a first possible interpretation of these data should be the generation of a graph of temporal relations where the nodes, instead of having a coded position as in the Harris graphs, should have as the coordinate of the USM center of mass projected in the USM main plane.
4.3.2. Positive and Negative US
As we said before, the US can be positive (i.e., layers), negative (i.e., cuts) or neutral (i.e., interfaces). In this regards, until now, we have been working mostly on the survey and representation of positive USM, although since 2009–2010, the research for modeling negative and interface units was also started (see Figure 16).
The latter ones are in fact 3D surfaces (not volumes) possessing stratigraphic relationships with other units. They are not formed by ashlars and mortar, since they are only signs of, say, a destruction, like with the traces left by an earthquake or by human (partial to total) destruction of a material feature. Figure 16 shows a negative USM represented by a cloud of 3D points extracted using the perimeters drawn on the photographs by an archaeologist.
4.4. Toward Duration for Representing the Stratigraphic Unit
Once the problem of surveying and representing stratigraphic units is solved through ontology and then graphically, we have to face some limits of the Harris paradigm. As we saw before, one of the main improvements we are working on is considering US as intervals of time and no longer as instants.
Indeed, inferring all the Allen’s relations directly from the physical relations between US is not trivial, and currently, the only way to do that is by using the expertise of archaeologists.
Nevertheless, we start with a few deduced relationships from Harris’s formalism to that of Allen. Considering Stratigraphic Unit A, it should have a start point named A and an end point named A.
For example, the Harris relation A is Contemporaneo to B can be translated by A starts B in Allen’s relations and the Harris relation A Anteriorita B can be translated by A precedes B or A meets B using the bound of intervals as expressed in Table 2 (For a typological simplification, here, A and B designate USM and not instants or intervals as should be done to respect the various formalisms of Harris and Allen. The determination of the time interval associated with a USM is a difficult choice, and this aspect is discussed later in this paper.).
In order to represent the stratigraphic unit duration using time intervals, we use Qualitative Constraints Networks (QCN), which have been successfully used in the domain of knowledge representation and reasoning in artificial intelligence for representing temporal relations.
Allen’s interval algebra has been used for representing and reasoning with archaeological information in the context of archaeological documentation [68] and the dating process [69]; however, as far as we know, this formalism has not been used yet for stratigraphy in archeology.
Definition 1.
Let B be a set of basic relations; a QCN N is a tuple where is a set of n variables representing temporal entities; C is a mapping that assigns to each tuple of variables of V a relation .
The stratigraphic relations between are temporal binary relations, and several QCN could be proposed according the choice of the temporal entities and the set of basic relations.
4.4.1. Time Points Algebra
Considering temporal entities as time points, archaeologists can provide temporal relations between the centers of mass of the US, deduced from stratigraphic relations between US. More formally, the domain D is defined by the set of rational numbers (line points) equipped with the linear order <, and the time points algebra stems from three atomic relations (see Figure 17). These relations are defined as follows:
- ,
- ,
- .
The set of time points algebra relations is denoted by , where each relation is a disjunction of atomic relations. The set is equipped with the operations: union (∪), intersection (∩), composition (∘) and inverse (). The following example illustrates the notion of QCN when the temporal entities are time points.
Example 1.
Let A, B, C, D, E, F be US; the stratigraphic relations between these six US according to the Harris matrix approach are illustrated in Figure 18.
Let a, b, c, d, e, f be the centers of mass of these six US; considering temporal entities as time points, the QCN denoted by is such that the variables are time points, which are the centers of mass of the US, and the constraints are the temporal relations between US. More formally, the set of variables is , where , , , , , , and the set of constraints is (for the sake of readability, the inverse relations and the transitive relations are omitted), where:
- The constraint states that precedes ;
- The constraint states that is the same as ;
- The constraint states that precedes ;
- The constraint states that precedes ;
- The constraint states that precedes .
The QCN is represented in Figure 19.
4.4.2. Intervals Algebra
However, the stratigraphic relations between often involve the notion of duration, which cannot be represented using the Harris matrix approach.
In this case, intervals are more suitable temporal entities. From stratigraphic relations between US, the archaeologists can assign intervals to US, and we can consider relations between intervals using Allen’s interval algebra [56]. This algebra stems from 13 atomic temporal relations, . More formally, the domain D is defined by the set of intervals of the rationals line . Each atomic relation is defined by constraints on the bounds of intervals. For example, the atomic relation s (for starts) is defined by ; the atomic relation m (for meets) is defined by .
The set of Allen’s intervals algebra relations is denoted by , where each relation is a disjunction of basic relations. The set is equipped with the operations: union (∪), intersection (∩), composition (∘) and inverse (−). The following example illustrates the notion of QCN when the temporal entities are intervals.
Example 2.
We come back to Example 1; however, we now consider temporal entities as intervals. The new QCN denoted by is such that the variables are intervals consisting of the lower and upper bounds of duration of the US, and the constraints are the temporal relations between these intervals. More formally, the set of variables is , where , , , , , . The set of constraints is (for the sake of readability, the inverse relations and the transitive relations are omitted) where:
The QCN is represented in Figure 20.
Note that information on the bounds of the intervals may be incomplete, as illustrated in Example 2, the constraint only follows from the lower bounds of the intervals and assigned to US. Table 2 does not provide any relations between upper bounds, and we need more information than what is provided by Figure 18. Archaeologists should be equipped with suitable tools allowing them to complete information on the bounds in the best possible way.
Moreover, an important issue is the QCN consistency checking problem. Indeed, a QCN may be inconsistent for several reasons. Errors can be made on the interpretation of stratigraphic relations; discontinuities involved with the 3D complexity of studied structures may exist; the survey may be incomplete (for instance, lack of photographs, etc.). Efficient tools have to be developed in order to check the consistency and to pinpoint the inconsistencies in each step of the process from the formal temporal representation to the photogrammetric 3D survey.
Concerning the QCN, three main approaches have been proposed for consistency checking in the artificial intelligence community, stemming from discrete CSP (Constraint Satisfaction Problem) [70], from SAT (Boolean Satisfiability Problem) [71] and, more recently, from Answer Set Programming (ASP) [72].
4.5. From Harris to Allen
The choice we made is to express duration in a US model trying to use an Allen interval to model the current knowledge expressed with Harris relations. Passing from three time-relations to thirteen interval relations is not trivial and of course not bijective. More than one solution is possible.
According to the current stratigraphic problem in upstanding building structures, we can propose the two sets of solutions in Table 3 for passing from Harris to Allen and in Table 4 for the reciprocal relations. Of course, these proposals reflect the archaeological problem studied, and as we can see, there are some temporal relationship that we were not able to better refine than using subsequent and anteriority (without any other specification proposed by Allen temporal relationships) (see Table 4, Rows 2, 3 and 4).
To study temporal relations between US belonging to a building that we can observe, measure and survey, we need to define a temporal range in which this analysis will be relevant. The first point of view we can have, the most trivial, is to consider that all the observed US are still ‘alive’ because we are able to observe and measure them. In this case, most of the Harris relations jump into a unique Allen interval: “X finishes y” (see Figure 3); and the end of the temporal interval is the current time of observation. This point of view was developed by Lucas as stressed in the Introduction of this paper ([45], p. 48).
This solution, even if it sounds correct, does not fit in with the current state of our work (we need more time to study and discuss these theoretical models); at this point of our research, we prefer to limit the duration life of each US to the end of its formation.
This point of view is the one used by Harris considering the US relations; we simply added the concept of duration preserving the main goal of Harris’s model: to study the constructive relations between US in order to understand the evolution of the building over time.
We propose two tables of correspondence (Table 3 and Table 4), which is the starting point of a possible translation of the temporal relations by Harris in intervals expressing the duration proposed by Allen.
The “translation” of the temporal relations proposed by Harris in the thirteen interval relations proposed by Allen is too ambiguous to be formalized by a function passing from three states to 13 states. In fact, to obtain these three temporal relationships proposed by Harris, archaeologists rely on the physical relationship between the US (defined in Table 5).
We therefore propose a conversion using the physical relations to Allen relations rather than a direct conversion of Harris relations to Allen relations.
Such a conversion table is shown in Table 3. Thus, according to the physical relations that were conditioned the choice of the Harris relation, different Allen relations can be proposed.
Of course, the elaboration of this translation between Harris’s proposition and Allen’s formalism is based on a clear and univocal definition of these relations (see Figure 21).
These concepts have been used for years by the archaeologists of the Florence team, and their application to the particular case of standing buildings has made it possible to define them in detail. In order not to deviate from the sense in which they are used in this work and in future work, we have left their Italian name in the text (in Table 3, Column 2 and 3; in Table 4, Column 2).
The definition of these concepts given in Table 5 is based on a previous work of the Florentine team when defining the database named PetraData [73].
This is the point of view chosen for the future work that we plan to develop on the use of duration for US.
Even if only considered an ‘intellectual challenge’, we are studying the possibility to control from the beginning the periodization of the archaeological stratigraphy. In fact, after creating the matrix, the archaeologists’ second step is to build a coherent periodization that considers all the known elements. We are currently testing this system to ensure better control of the entire pipeline.
5. Conclusions and Future Work
This paper focuses on the main goals obtained by the collaboration between medieval archaeologists from the University of Florence (Italy) and ICT researchers from CNRS LIS laboratory of Marseille (France). From the beginning, this fifteenth collaboration is built on a mutual exchange of knowledge. Our first common field of interest is survey, and our main purpose is to add knowledge to it. The future of this collaboration can be expressed in this way: first of all, the changing paradigm and producing new tools mean deep changes in the way we work. We change both how photogrammetry is used and how the observed data are managed; as new photogrammetric tools are developed and traditional relational databases are replaced by ontologies, new tools become available to manage and infer data.
Beyond the scientific problems, an important obstacle addressed by this work is that a major paradigm shift will significantly impact the on-going work. The changing paradigm means also changing vocabulary, managing new concepts, changing well-known tools for unknown and not completely debugged tools.
The main problem in fact of such an interdisciplinary project is to both develop new concepts and new tools while continuing to produce clear, relevant and verified data. On the one hand, the previous and already existing management system is still used to complete existing data coming from previous campaigns; and on the other hand, we need to be able to feed the new system with enough data in order to test it. Of course when, as is the case here, the two systems are very different, the data from the actual system currently in use will have to be ‘ported’ to the new one. Finally, the decision has to be made to change systems, which always has a heavy cost at the beginning.
In the framework of this collaboration, archaeologists have learned to create 3D models using photogrammetry since 2001 when this method was not yet very widespread [2,74].
We have developed a tool for digitizing ashlar blocks in 3D using only one single image so that archaeologists can remain concentrated on their main task: adding semantics to the 3D model.
Due to the fact that today, photogrammetry can easily produce a dense cloud of 3D points, we are currently adapting this tool to use both a set of oriented photographs and a dense cloud of 3D points to digitize ashlar blocks and USM. The underlying ontological model is used here to immediately produce ABox instances and feed the ontological survey with all relevant data (stone tool used, lithotype, material and other archaeological and non-graphic observations).
The first step was to obtain a 3D GIS, and we worked very hard to make it possible [25]. Now, our group is starting to work on the field of ontologies, especially to manage the US and to add knowledge to the survey [74]. Even if there are some theoretical works on the ontologies, until now, not many archaeologists have studied and tested ontologies to manage heterogeneous data. To do this, it will be possible to replace the database, which is a very important tool, but often too rigid. The intensive use of ontologies to manage both photogrammetric geometry and archaeological data will allow us to first check the consistency of digitized data and then infer new relationships between US using an inference engine, such as Pellet, directly from the ontology. For example, we are currently working on producing Harris relations using known physical relationships between US, and then, we will be able to check and produce new temporal relationships between US according to Allen’s formalism. We are now working on developing a complete pipeline based on ontologies to manage both the photogrammetric process and archaeological knowledge. This pipeline will allow a common formalism for all the heterogeneous data involved in the archaeological analysis and will allow specific queries on these data with several kinds of output (textual, 3D, 2D, Harris-like matrix). In doing this, we continue to follow our method of collaboration, which is truly interdisciplinary, building together our new knowledge base, useful both for archaeologists and ICT researchers.
The second approach, developed in parallel, is to build a Qualitative Constraints Networks (QCN) based on the physical relationships between US. This will allow us to check the consistency between relations. The QCN will be developed in ASP using the solver ASPERIX [75,76]. We plan to investigate the ASP approach for several reasons. ASP is a unified formalism for both representing and implementing the consistency checking problem expressed by a logic program that is very close to natural language. We already used this formalism when dealing with the revision of geographical information within the framework of the European project REVIGIS (Uncertain knowledge, maintenance and revision in geographic information systems, ID: 27781, 1998–1999) [77]. More precisely, we compared the CSP, SAT and ASP approaches. CSP focuses on the direct resolution of inconsistencies by means of propagation mechanisms, while SAT and ASP concentrate on the identification of inconsistencies. However, an experimental study on a real-world application benchmark showed that ASP gave better results than SAT [78]. Moreover, ASP can easily interface with ontologies and Java.
As all the data collected using photogrammetry are in 3D, we will propose to express all the relations between US and other concepts by 3D graphs to be aware of and overcome several well-known ambiguities due to the 2D expression.
Finally, this work tries to analyze the temporal problems connected to the Harris matrix, which, as Lucas and Gallina pointed out, can be divided into two different fields. The first one concerns the different kinds of time relationships between USM, starting from the physical-temporal relationships used in the Harris matrix.
The proposed charts (Table 3 and Table 4) aim to create an interconnection table between temporal intervals (Allen) and temporal relationships (Harris). As we can see, there are some temporal relationships that we are unable to better refine than using subsequent and anteriority (without any other specification proposed by Allen’s interval relations). On the other hand, the most important criticality concerning the Harris matrix’s temporality is the lack of expression of duration.
When we analyze a matrix, we are convinced that we will see many instants linked to each other. When we analyze a matrix, we are convinced to see many instants linked to each other. We propose in this paper a first step to fill this gap and a way to use Allen’s interval formalism that will enable archaeologists, as well as researchers to further advance science in regards to knowledge representation and reasoning in artificial intelligence for temporal relationships.
Acknowledgments
The University of Florence (UniFI) and the French National Center for Scientific Research (CNRS) have worked together for more than 15 years in the framework of the ARPENTEUR project (an Architectural PhotogrammEtry Network Tool for Education and Research http://www.arpenteur.org), which has been developed since 1997 in Marseille, France, by the CNRS. The ontology aspect of this work is developed in the context of the GROPLAN project (http://www.groplan.eu), partially funded by the French National Agency for Research (ANR). The authors wish to thank Yaaqoub Semlali for the development of the ontological editor during his internship at the CNRS.
Author Contributions
Guido Vannini is the Director of the Medieval Petra archaeological mission at the Crusader Ayyubid settlement in Transjordan, which is the core of the archaeological data of this paper. Michele Nucciotti, Vice-Director and Elisa Pruno, responsible for the field research, processed all the archaeological data used in this paper. Odile Papini, Computer Science professor at Aix-Marseille University, initiated the idea of using the Allen formalism, as well as the Qualitative Constraints Networks (QCN) for the representation of temporal relations in this context. Pierre Drap, researcher at the CNRS, Marseille, has worked for more than 15 years with the Italian team and has developed and supervised the photogrammetric and ontological aspects. All the authors contributed equally in writing the manuscript.
Conflicts of Interest
The authors declare no conflict of interest.
References
- Drap, P.; Merad, D.; Gaoua, L.; Pruno, E.; Marcotulli, C.; Vannini, G. Underwater Photogrammetry in a Terrestrial Excavation: San Domenico (Prato-Italy). Int. Arch. Photogramm. Remote Sens. Spat. Inf. Sci. 2015, 40, 171–176. [Google Scholar]
- Drap, P.; Durand, A.; Seinturier, J.; Vannini, G.; Nucciotti, M. Full XML Documentation from Photogrammetric Survey to 3D Visualization. The Case Study of Shawbak Castle in Jodan. In Proceedings of the CIPA 2005 XX International Symposium, Torino, Italy, 26 September–1 October 2005; Volume 2, pp. 771–776. [Google Scholar]
- Brogiolo, G.P. Archeologia dell’Edilizia Storica; Aedes Muratoriana: Modena, Italy, 1988; p. 120. [Google Scholar]
- Harris, E.C. Principles of Archaeological Stratigraphy, 2nd ed.; Academic Press: Waltham, MA, USA, 1979; p. 170. [Google Scholar]
- Francovich, R.; Parenti, R. Archeologia e Restauro dei Monumenti. I Ciclo di Lezioni Sulla Ricerca Applicata in Archeologia; All’Insegna del Giglio: Siena, Italy, 1987. [Google Scholar]
- Gallina, D. Sillogismo deduttivo o abduzione? Alcune proposte per l’abbandono/superamento del matrix di Harris nell’analisi dell’architettura. In Proceedings of the VI Cngresso Nazionale di Archeologia Medievale, L’Aquila, Italy, 12–15 September 2012; Giglio, A.D., Ed.; All’Insegna del Giglio: Firenze, Italy, 2012. [Google Scholar]
- Doerr, M. The CIDOC CRM An ontological approach to semantic interoperability of metadata. AI Mag. 2001, 24, 75–92. [Google Scholar]
- Lodi, G.; Asprino, L.; Nuzzolese, A.G.; Presutti, V.; Gangemi, A.; Recupero, D.R.; Veninata, C.; Orsini, A. Semantic Web for cultural heritage Valorisation. In Data Analytics in Digital Humanities; Hai-Jew, S., Ed.; Springer International Publishing: Cham, Switzerland, 2017; pp. 3–37. [Google Scholar]
- Noardo, F. A Spatial Ontology for Architectural Heritage Information. Revised Selected Papers. In Proceedings of the Geographical Information Systems Theory, Applications and Management: Second International Conference (GISTAM 2016), Rome, Italy, 26–27 April 2016; Grueau, C., Laurini, R., Rocha, J.G., Eds.; Springer International Publishing: Cham, Switzerland, 2017; pp. 143–163. [Google Scholar]
- Niang, C.; Marinica, C.; Markhoff, B.; Leboucher, E.; Malavergne, O.; Bouiller, L.; Darrieumerlou, C.; Laissus, F. Supporting Semantic Interoperability in Conservation-Restoration Domain: The PARCOURS Project. J. Comput. Cult. Herit. 2017, 10, 1–20. [Google Scholar] [CrossRef]
- Bing, L.; Chan, K.C.C.; Carr, L. Using Aligned Ontology Model to Convert cultural heritage Resources into Semantic Web. In Proceedings of the 2014 IEEE International Conference on Semantic Computing, Newport Beach, CA, USA, 16–18 June 2014; pp. 120–123. [Google Scholar]
- Niccolucci, F.; D’Andrea, A. An Ontology for 3D Cultural Objects. In Proceedings of the 7th International Symposium on Virtual Reality, Archaeology and cultural heritage VAST, Nicosia, Cyprus, 30 October–4 November 2006. [Google Scholar]
- Amico, N.; Ronzino, P.; Felicetti, A.; Niccolucci, F. Quality Management of 3D Cultural Heritage Replicas with CIDOC-CRM. Available online: http://ceur-ws.org/Vol-1117/paper6_slides.pdf (accessed on 3 September 2017).
- Niccolucci, F.; Hermon, S.; Doerr, M. The Formal Logical Foundations of Archaeological Ontologies. In Mathematics and Archaeology; Barcelo, J.A., Bogdanovic, I., Eds.; CRC Press: Abingdon, UK, 2015; pp. 86–99. [Google Scholar]
- Ronzino, P.; Niccolucci, F.; Felicetti, A.; Doerr, M. CRMba a CRM extension for the documentation of standing buildings. Int. J. Digit. Libr. 2016, 17, 71–78. [Google Scholar] [CrossRef]
- Araújo, C.; Martini, R.G.; Henriques, P.R.; Almeida, J.J. Annotated Documents and Expanded CIDOC-CRM Ontology in the Automatic Construction of a Virtual Museum. In Developments and Advances in Intelligent Systems and Applications; Rocha, A., Reis, L.P., Eds.; Springer International Publishing: Cham, Switzerland, 2018; pp. 91–110. [Google Scholar]
- Niccolucci, F. Documenting archaeological science with CIDOC CRM. Int. J. Digit. Libr. 2016, 18, 223–231. [Google Scholar] [CrossRef]
- Gaitanou, P.; Gergatsoulis, M.; Spanoudakis, D.; Bountouri, L.; Papatheodorou, C. Mapping the Hierarchy of CIDOC CRM. In Proceedings of the Metadata and Semantics Research: 10th International Conference (MTSR 2016), Gottingen, Germany, 22–25 November 2016; Garoufallou, E., Subirats Coll, I., Stellato, A., Greenberg, J., Eds.; Springer International Publishing: Cham, Switzerland, 2016; pp. 193–204. [Google Scholar]
- Niccolucci, F.; Hermon, S. Expressing reliability with CIDOC CRM. Int. J. Digit. Libr. 2016. [Google Scholar] [CrossRef]
- Hiebel, G.; Doerr, M.; Eide, O. CRMgeo: A spatiotemporal extension of CIDOC-CRM. Int. J. Digit. Libr. 2016. [Google Scholar] [CrossRef]
- Curé, O.; Sérayet, M.; Papini, O.; Drap, P. Toward a novel application of CIDOC CRM to underwater archaeological surveys. In Proceedings of the 4th IEEE International Conference on Semantic Computing (ICSC 2010), Pittsburgh, PA, USA, 22–24 September 2010; pp. 519–524. [Google Scholar]
- Papini, O.; Drap, P. The Revision of Partially Preordered Information in Answer Set Programming. Proceedings of ECSQARU. In Lecture Notes in Computer Science; Springer: Berlin, Germany, 2011; pp. 421–433. [Google Scholar]
- Seinturier, J. Fusion de Connaissances: Applications aux Relevés PhotogramméTriques de Fouilles ArchéOlogiques Sous-Marines. Ph.D. Thesis, University of Toulon, Toulon, France, 2007. [Google Scholar]
- Serayet, M. Raisonnement à Partir d’Information Structurées et Hiérarchisées: Application à l’Information Archéologique. P.h.D. Thesis, Aix Marseille, Marseille, France, 2010. [Google Scholar]
- Drap, P.; Seinturier, J.; Chambelland, J.C.; Gaillard, G.; Pires, H.; Vannini, G.; Nucciotti, M.; Pruno, E. Going To Shawbak (Jordan) And Getting The Data Back: toward a 3D GIS dedicated to medieval archeology. INCT Bull. Sci. Géogr. 2009, 24, 40–50. [Google Scholar]
- Kendall, D.G. A statistical approach to Flinders Petries’ sequence-dating. Bull. Int. Stat. Inst. 1963, 34, 657–680. [Google Scholar]
- Kendall, D.G. Abundance matrices and seriation in archeology. Probab. Theory Relat. Fields 1971, 17, 104–112. [Google Scholar]
- Guénoche, A.; Tchernia, A. L’analyse descriptive dans la construction d’un modèle typologique des amphores Dressel 20. In Archéologie et Calcul; book Section 2; Borillo, M., Ed.; Union Generale D’editions: Paris, France, 1978; pp. 167–181. [Google Scholar]
- Regnier, S. Sériation des Niveaux de Plusieurs Tranches de Fouille Dans Une Zone ArchéOlogique HomogèNe. In Raisonement et MéThodes MathéMatiques en Archéologie; American Anthropological Association: Arlington, VA, USA, 1977. [Google Scholar]
- Halekoh, U.; Vach, W. A Bayesian approach to seriation problems in archeology. Comput. Stat. Data Anal. 2004, 45, 651–673. [Google Scholar] [CrossRef]
- Harris, E.C. The laws of archaeological stratigraphy. World Archaeol. 1979, 11, 111–117. [Google Scholar] [CrossRef]
- Djindjian, F. Méthodes Pour l’Archéologie; Armand Colin: Paris, France, 1991; p. 401. [Google Scholar]
- Djindjian, F.; Desachy, B. Sur l’aide au traitement des données stratigraphiques des sites archéologiques. Hist. Mes. 1990, 11, 51–88. [Google Scholar] [CrossRef]
- Desachy, B. Traitement multidimensionnel (analyse factorielle des correspondances) des poids groupes de céramique du site des Hallettes à Compiègne (Oise). Rev. ArchéOl. Picardie 1997, 13, 169–170. [Google Scholar] [CrossRef]
- Desachy, B. Du terrain au temps archeologique, vers un systeme d’information stratigraphique. In Temps et Espaces de l’Homme en Société: Analyses et Modèles Spatiaux en Archéologie; Association pour la Promotion et la Diffusion des Connaissances archéologiques: Valbonne, France, 2012; pp. 269–272. [Google Scholar]
- Desachy, B. De la Formalisation du Traitement des DonnéEs Stratigraphiques en Archéologie de Terrain. Ph.D. Thesis, Pantheon-Sorbonne University, Paris, France, 2008. [Google Scholar]
- Carandini, A. Storie Dalla Terra. Manuale di Scavo Archeologico; Einaudi, Ed.; Piccola biblioteca Einaudi: Torino, Italy, 1991. [Google Scholar]
- Ryan, N. Jnet, a Successor to Gnet. Archaologie und Computer; Workshop 6; Borner, W., Ed.; Forschungsgesellschaft Wiener Stadtarchaologie: Wien, Austria, 2001; pp. 182–196. [Google Scholar]
- Scollar, I. Bonn Archaeological Software Package (BASP). 2017. Available online: http://www.uni-koeln.de/~al001/ (accessed on 22 August 2017).
- Hundack, C.; Mutzel, P.; Pouchkarev, I.; Reitgruber, B.; Schuhmacher, B.; Thome, S. Arched|Technical University of Vienna, Austria. 2017. Available online: http://www.ads.tuwien.ac.at/arched (accessed on 22 August 2017).
- Museums, F.N.H. Intrasis Is a GIS Designed to Handle and Structure Geographical Data. 2017. Available online: http://www.intrasis.com/index.htm (accessed on 22 August 2017).
- Traxler, C.; Neubauer, W. The Harris matrix Composer—A New Tool to Manage Archaeological Stratigraphy. In Kulturelles Erbe und Neue Technologien Workshop, Archaeologie und Computer; Wolfgang Borner, S.U., Ed.; Museen der Stadt Wien, Phoibos Verlag: Vienna, Austria, 2008; Available online: http://www.stadtarchaeologie.at/ (accessed on 3 September 2017).
- Sikora, J.; Tyszkiewicz, J. Strati5—Open Mobile Software for Harris matrix. In Proceedings of the 43rd Annual Conference on Computer Applications and Quantitative Methods in Archaeology (CAA 2015), Siena, Italy, 30 March–3 April 2015; Campana, S., Scopigno, R., Eds.; Archeopress: Oxford, UK, 2015; Volume 2, pp. 182–196. [Google Scholar]
- Galeazzi, F.; Callieri, M.; Dellepiane, M.; Charno, M.; Richards, J.D.; Scopigno, R. Web-based visualization for 3D data in archeology: The ADS 3D viewer. J. Archaeol. Sci. 2016, 9, 1–24. [Google Scholar]
- Lucas, G. The Archaeology of Time; Routledge: Abingdon, UK, 2005. [Google Scholar]
- Ramenofsky, A. The Illusion of Time. In Unit Issues in Archaeology: Measuring Time, Space and Materia; Ramensofsky, A.F., Steffen, A., Eds.; University of Utah Press: Salt Lake City, UT, USA, 1998; pp. 74–86. [Google Scholar]
- Accary, T.; Bénel, A.; Calabretto, S. Modélisation de connaissances temporelles en archéologie. Rev. Sci. Technol. l’Inf. RSTI Journ. Francoph. d’Extr. Gest. Connaiss. ECG 2003, 17, 503–508. [Google Scholar]
- Desachy, B. Du temps ordonne au temps quantifié : Application d’outils mathématiques au modèle d’analyse stratigraphique d’Edward Harris. Bull. Soc. Préhist. Française 2005, 102, 729–740. [Google Scholar] [CrossRef]
- Rodier, X.; Saligny, L. Modélisation des objets urbains pour l’étude des dynamiques urbaines dans la longue durée. In Proceedings of the SAGEO 2007 Colloque International de Géomatique et d’Analyse Spatiale, Clermont-Ferrand, France, 18–22 June 2007. [Google Scholar]
- Lucas, G. Time and the archaeological archive. Rethink. Hist. 2010, 14, 343–359. [Google Scholar] [CrossRef]
- Harris, E.C. The stratigraphy of standing structures con alcune considerazioni in nota di R. Parenti. In Archeologia dellArchitettura; All’Insegna del Giglio: Sesto, Italy, 2003; pp. 9–16. [Google Scholar]
- Althusser, L. For Marx; Verso: Stockholm, Sweden, 1969. [Google Scholar]
- Drap, P.; Durand, A.; Nedir, M.; Seinturier, J.; Papini, O.; Gabrielli, R.; Peloso, D.; Kadobayashi, R.; Gaillard, G.; Chapman, P.; et al. Photogrammetry and archaeological knowledge: Toward a 3dinformation system dedicated to medieval archeology: A case Study of Shawbak castle in Jordan. In Proceedings of the 3D Virtual Reconstruction and Visualization of Complex Architectures (3D-ARCH 2007), Zurich, Switzerland, 12–13 July 2007. [Google Scholar]
- Pruno, E.; Drap, P. Dalla stratigrafia all’archeologia teorica: il matrix di Harris e l’archeologia del tempo. In Proceedings of the VI Congresso Nazionale di Archeologia Medievale, L’Aquila, Italy, 12–15 September 2012; Giglio, A.D., Ed.; All’Insegna del Giglio: Firenze, Italy, 2012. [Google Scholar]
- Nicolis, G.; Prigogine, I. Self-Organization in Nonequilibrium Systems. From Dissipative Structures to Order through Fluctuations; Wiley: Hoboken, NJ, USA, 1977; p. 491. [Google Scholar]
- Allen, J.F. Maintaining knowledge about temporal intervals. Commun. ACM 1983, 26, 832–843. [Google Scholar] [CrossRef]
- Buchsenschutz, O. Images et RelevéS ArchéOlogiques, de la Preuve à la Démonstration. Available online: http://cths.fr/ed/edition.php?id=4703 (accessed on 3 September 2017).
- Vannini, G. Archeologia dell’Insediamento Crociato-Ayyubide in Transgiordania: Il Progetto Shawbak; All’insegna del Giglio: Firenze, Italy, 2007. [Google Scholar]
- Vannini, G.; Nucciotti, M. Da Petra a Shawbak, Archeologia di una frontiera. Archeologia Viva 2009, 135, 18–31. [Google Scholar]
- Drap, P.; Gaillard, G.; Grussenmeyer, P. Simple photogrammetric methods with arpenteur. 3-d plotting and orthoimage generation : The I-MAGE process. In Proceedings of the CIPA 2001 International Symposium, Potsdam, Germany, 18–21 September 2001. [Google Scholar]
- Drap, P.; Gaillard, G.; Grussenmeyer, P.; Hartmann-Virnich, A. A stone-by-stone photogrammetric survey using architectural knowledge formalised on the ARPENTEUR Photogrammetric workstation. In Proceedings of the XIXth Congress of the International Society for Photogrammetry and Remote Sensing (ISPRS), Amsterdam, The Netherlands, 16–23 July 2001. [Google Scholar]
- Xueming, P.; Beckman, P.; Havemann, S.; Tzompanaki, K.; Doerr, M.; Fellner, D.W. A Distributed Object Repository for cultural heritage. In Proceedings of the 11th International Conference on Virtual Reality, Archaeology and Cultural Heritage (VAST 2010), Paris, France, 21–24 September 2010. [Google Scholar]
- Kalyanpur, A.; Pastor, D.J.; Battle, S.; Padget, J.A. Automatic Mapping of OWL Ontologies into Java. SEKE 2004, 4, 98–103. [Google Scholar]
- Stevenson, G.; Dobson, S. Sapphire: Generating Java Runtime Artefacts from OWL Ontologies. In Advanced Information Systems Engineering Workshops, Proceedings of the CAiSE 2011 International Workshops, London, UK, 20–24 June 2011; Salinesi, C., Pastor, O., Eds.; Springer: Berlin/Heidelberg, Germany, 2011; pp. 425–436. [Google Scholar]
- Horridge, M.; Knublauch, H.; Rector, A.; Stevens, R.; Wroe, C. A Practical Guide To Building OWL Ontologies Using The Protege-OWL Plugin and CO-ODE Tools Edition 1.0. Available online: http://mowl-power.cs.man.ac.uk/protegeowltutorial/resources/ProtegeOWLTutorialP4_v1_3.pdf (accessed on 3 September 2017).
- O’Connor, M.J.; Das, A. A Mechanism to Define and Execute SWRL Built Ins in Protege OWL. Available online: https://protege.stanford.edu/conference/2006/submissions/abstracts/7.3_Martin_oConnor_BuiltInBridge.pdf (accessed on 3 September 2017).
- Keßler, C.; Raubal, M.; Wosniok, C. Semantic Rules for Context-Aware Geographical Information Retrieval. In Smart Sensing and Context, Proceedings of the 4th European Conference (EuroSSC 2009), Guildford, UK, 16–18 September 2009; Barnaghi, P., Moessner, K., Presser, M., Meissner, S., Eds.; Springer: Berlin/Heidelberg, Germany, 2009; pp. 77–92. [Google Scholar]
- Accary-Barbier, T.; Calabretto, S. Building and using temporal knowledge in archaeological documentation. J. Intell. Inf. Syst. 2008, 31, 147–159. [Google Scholar] [CrossRef]
- Belussi, A.; Migliorini, S. Modeling Time in Archaeological Data: The Verona Case Study; University of Verona: Verona, Italy, 2014. [Google Scholar]
- Dechter, R.; Meiri, I.; Pearl, J. Temporal Constraint Networks. Artif. Intell. 1991, 49, 61–95. [Google Scholar] [CrossRef]
- Condotta, J.; Nouaouri, I.; Sioutis, M. A SAT Approach for Maximizing Satisfiability in Qualitative Spatial and Temporal Constraint Networks. In Principles of Knowledge Representation and Reasoning, Proceedings of the Fifteenth International Conference (KR 2016), Cape Town, South Africa, 25–29 April 2016; AAAI Press: San Jose, CA, USA, 2016; pp. 432–442. [Google Scholar]
- Brenton, C.; Faber, W.; Batsakis, S. Answer Set Programming for Qualitative Spatio-Temporal Reasoning: Methods and Experiments. In Proceedings of the Technical Communications of the 32nd International Conference on Logic Programming (ICLP 2016), New York, NY, USA, 16–21 October 2016; USAVos, M.C., King, A., Saeedloei, N., De, M., Eds.; Schloss Dagstuhl–Leibniz-Zentrum fuer Informatik: Dagstuhl, Germany, 2016; Volume 52, pp. 1–15. [Google Scholar]
- Niccolucci, F.; Tonghini, C.; Vannini, G.; Crescioli, M. PETRA: Un sistema integrato per la gestione dei dati archeologici. Archeol. Calcolatori 2000, XI, 49–67. [Google Scholar]
- Drap, P.; Papini, O.; Pruno, E.; Nucciotti, M.; Vannini, G. Surveying medieval archeology: A new form for harris paradigm merging photogrammetry and temporal relations. In Proceedings of the 3D Arch, 3D Virtual Reconstruction and Visualization of Complex Architectures and Scenarios, Argolida, Greece, 1–3 March 2017. [Google Scholar]
- Lefèvre, C.; Nicolas, P. The First Version of a New ASP Solver: ASPeRiX. In Logic Programming and Nonmonotonic Reasoning, Proceedings of the 10th International Conference (LPNMR 2009), Potsdam, Germany, 14–18 September 2009; Erdem, E., Lin, F., Schaub, T., Eds.; Springer: Berlin/Heidelberg, Germany, 2009; pp. 522–527. [Google Scholar]
- Lefèvre, C.; Béatrix, C.; Stéphan, I.; Garcia, L. ASPeRiX, a First Order Forward Chaining Approach for Answer Set Computing; CoRR: Ithaca, NY, USA, 2015. [Google Scholar]
- Benferhat, S.; Ben-Naim, J.; Papini, O.; Wurbel, E. Answer Set Programming encoding of Prioritized Removed Sets Revision: Application to GIS. Appl. Intell. 2010, 32, 60–87. [Google Scholar] [CrossRef]
- Benferhat, S.; Ben-Naim, J.; Jeansoulin, R.; Kelfallah, M.; Lagrue, S.; Papini, O.; Wilson, N.; Wurbel, E. Revising geoinformation: The results of REV!GIS. In Lecture Note in Artificial Intelligence, Proceedings of the Eighth European Conference on Symbolic and Quantitative Approaches to Reasoning with Uncertainty, Barcelona, Spain, 6–8 July 2005; Springer: Berlin, Germany, 2005. [Google Scholar]
Figure 1.
Relative temporal representations: (a) PERT diagram; (b) MPM diagram; (c) Harris matrix; (d) Harris graph.
Figure 1.
Relative temporal representations: (a) PERT diagram; (b) MPM diagram; (c) Harris matrix; (d) Harris graph.
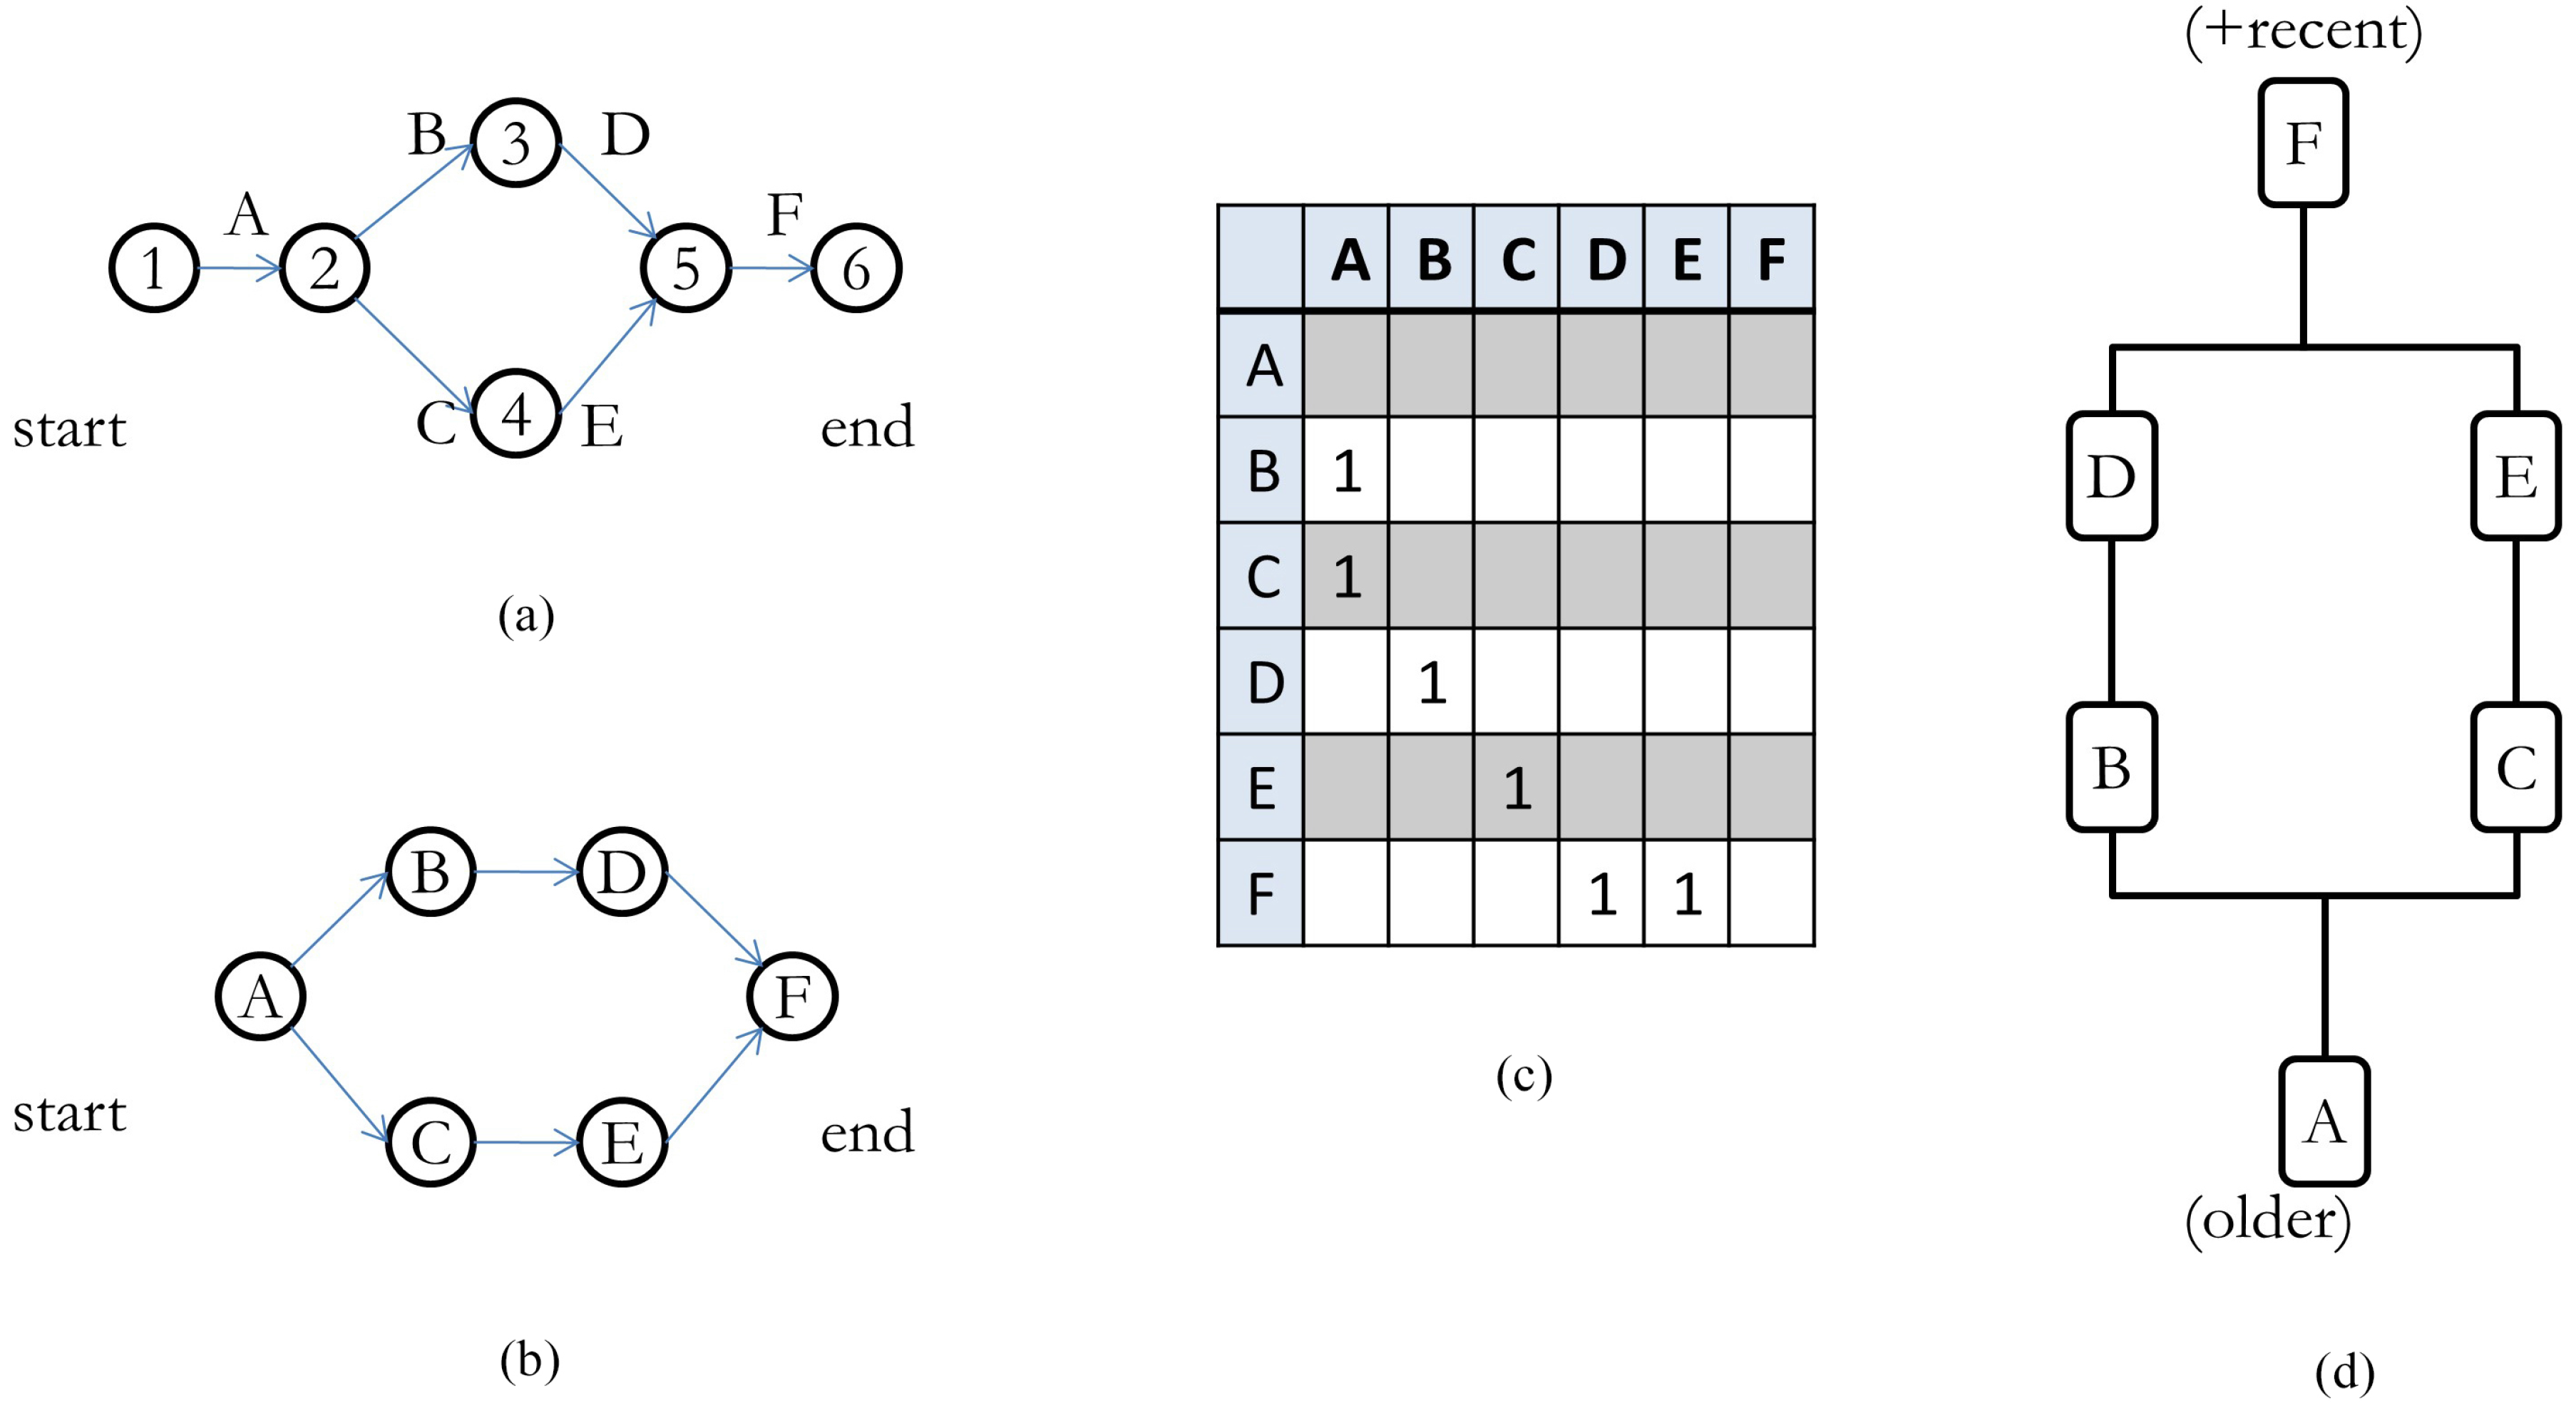
Figure 2.
Different representations of Unit of Stratigraphication (US) relations, cited from ([37], p. 83).
Figure 2.
Different representations of Unit of Stratigraphication (US) relations, cited from ([37], p. 83).

Figure 3.
Allen’s intervals algebra atomic relations.

Figure 4.
The castle of Shawbak (Ma’an region, Jordan).

Figure 5.
The full-scale 3D model of Corpo di Fabbrica 5 (CF5) built for the exhibition From Petra to Shawbak. Archeology of a frontier.
Figure 5.
The full-scale 3D model of Corpo di Fabbrica 5 (CF5) built for the exhibition From Petra to Shawbak. Archeology of a frontier.

Figure 6.
3D models of the entire castle.

Figure 7.
Ashlar blocks using a plane as an approximation of the exterior face of the wall [53].
Figure 7.
Ashlar blocks using a plane as an approximation of the exterior face of the wall [53].

Figure 8.
An example of the stone-by-stone survey using an extrusion vector from CF34 (the Ayyubid Palace in Shawbak).
Figure 8.
An example of the stone-by-stone survey using an extrusion vector from CF34 (the Ayyubid Palace in Shawbak).

Figure 9.
Several orthophoto/map generation images based on several queries: (a) the design of USM perimeters; (b) same as (a) with a reprojection of one of the oriented images; (c) Image (a) with a reprojection of the texture inside the block perimeter; (d) texture reprojection inside of the US perimeter (computed with blocks); (e) Image (a) query with a uniform color inside each block according to their US and an automatic extraction of the cement (computed as the Boolean difference between the global perimeter of all US and all the individual blocks); (f) the same as (e), but with texture mapping for each block.

Figure 10.
Partial ontology visualization with CIDOC CRM alignment.

Figure 11.
The ontology editor: classes, instances and properties edition from the OWL file.
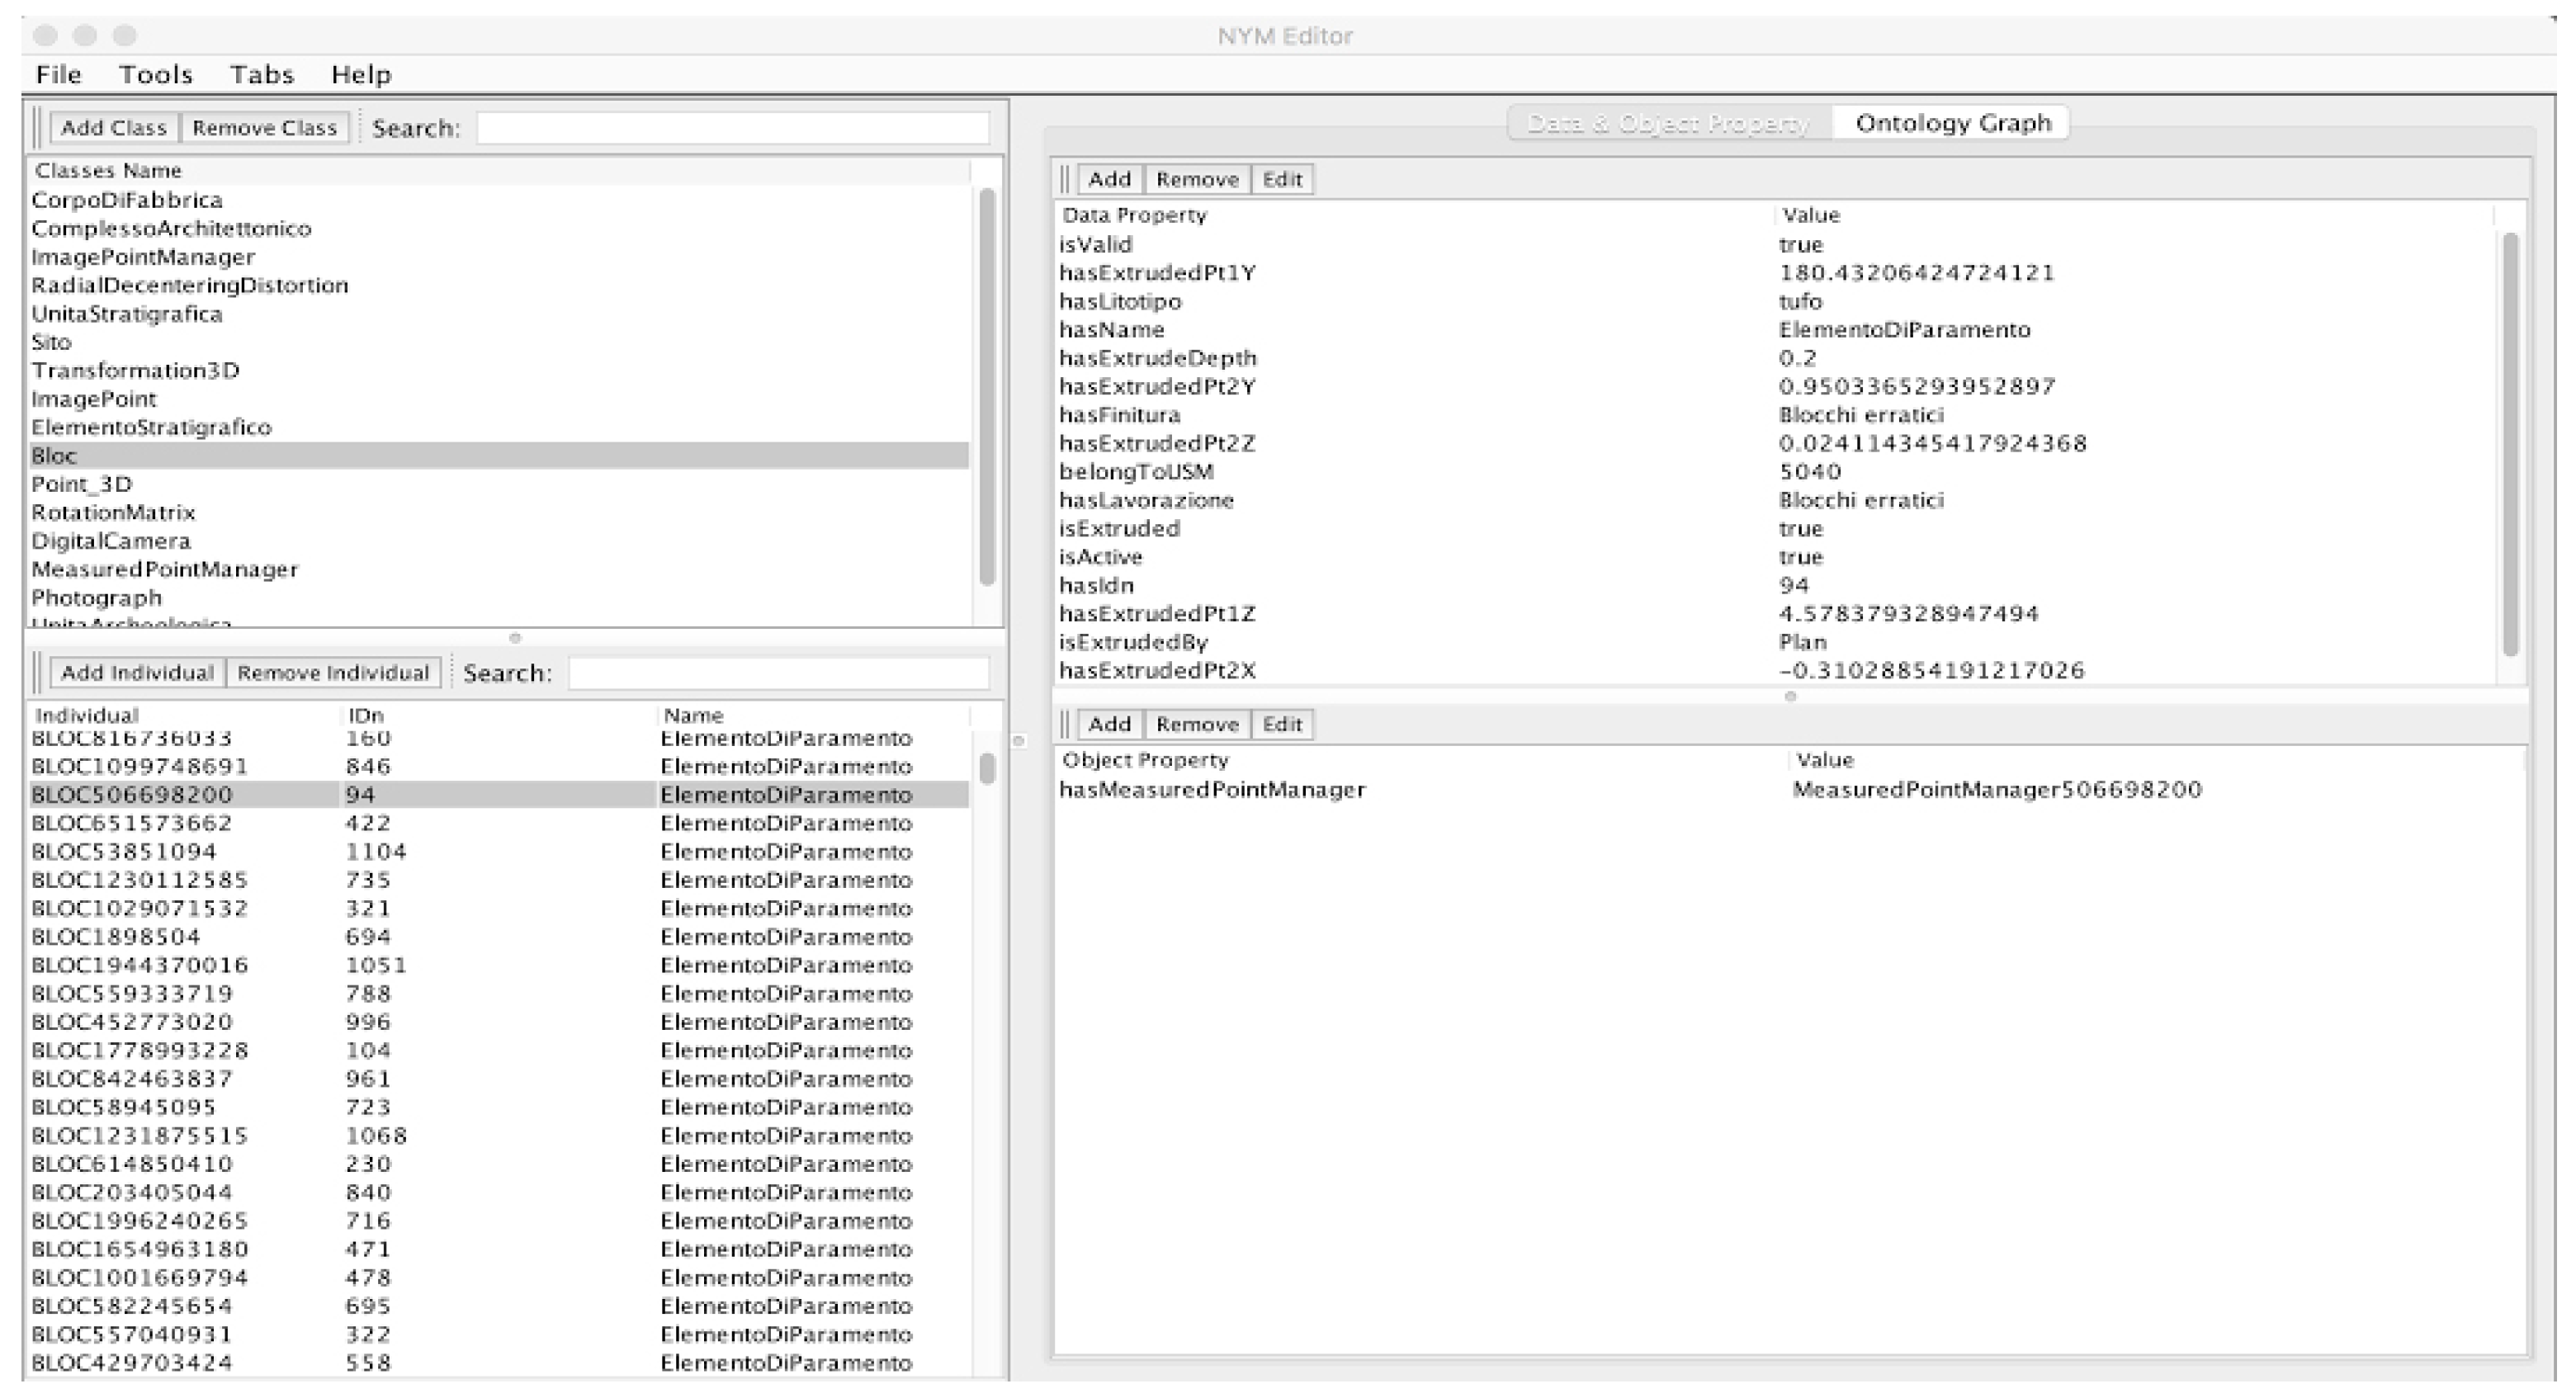
Figure 12.
Physical and stratigraphic relations editor with graph visualization of all the relations in which the current USM is involved. A color code is used to separate physical relations from stratigraphic relations.
Figure 12.
Physical and stratigraphic relations editor with graph visualization of all the relations in which the current USM is involved. A color code is used to separate physical relations from stratigraphic relations.

Figure 13.
Ashlar block visualization, on the left; the colors show the clusterization result based on the block’s height. Right: the colors show the clusterization result based on USM.
Figure 13.
Ashlar block visualization, on the left; the colors show the clusterization result based on the block’s height. Right: the colors show the clusterization result based on USM.
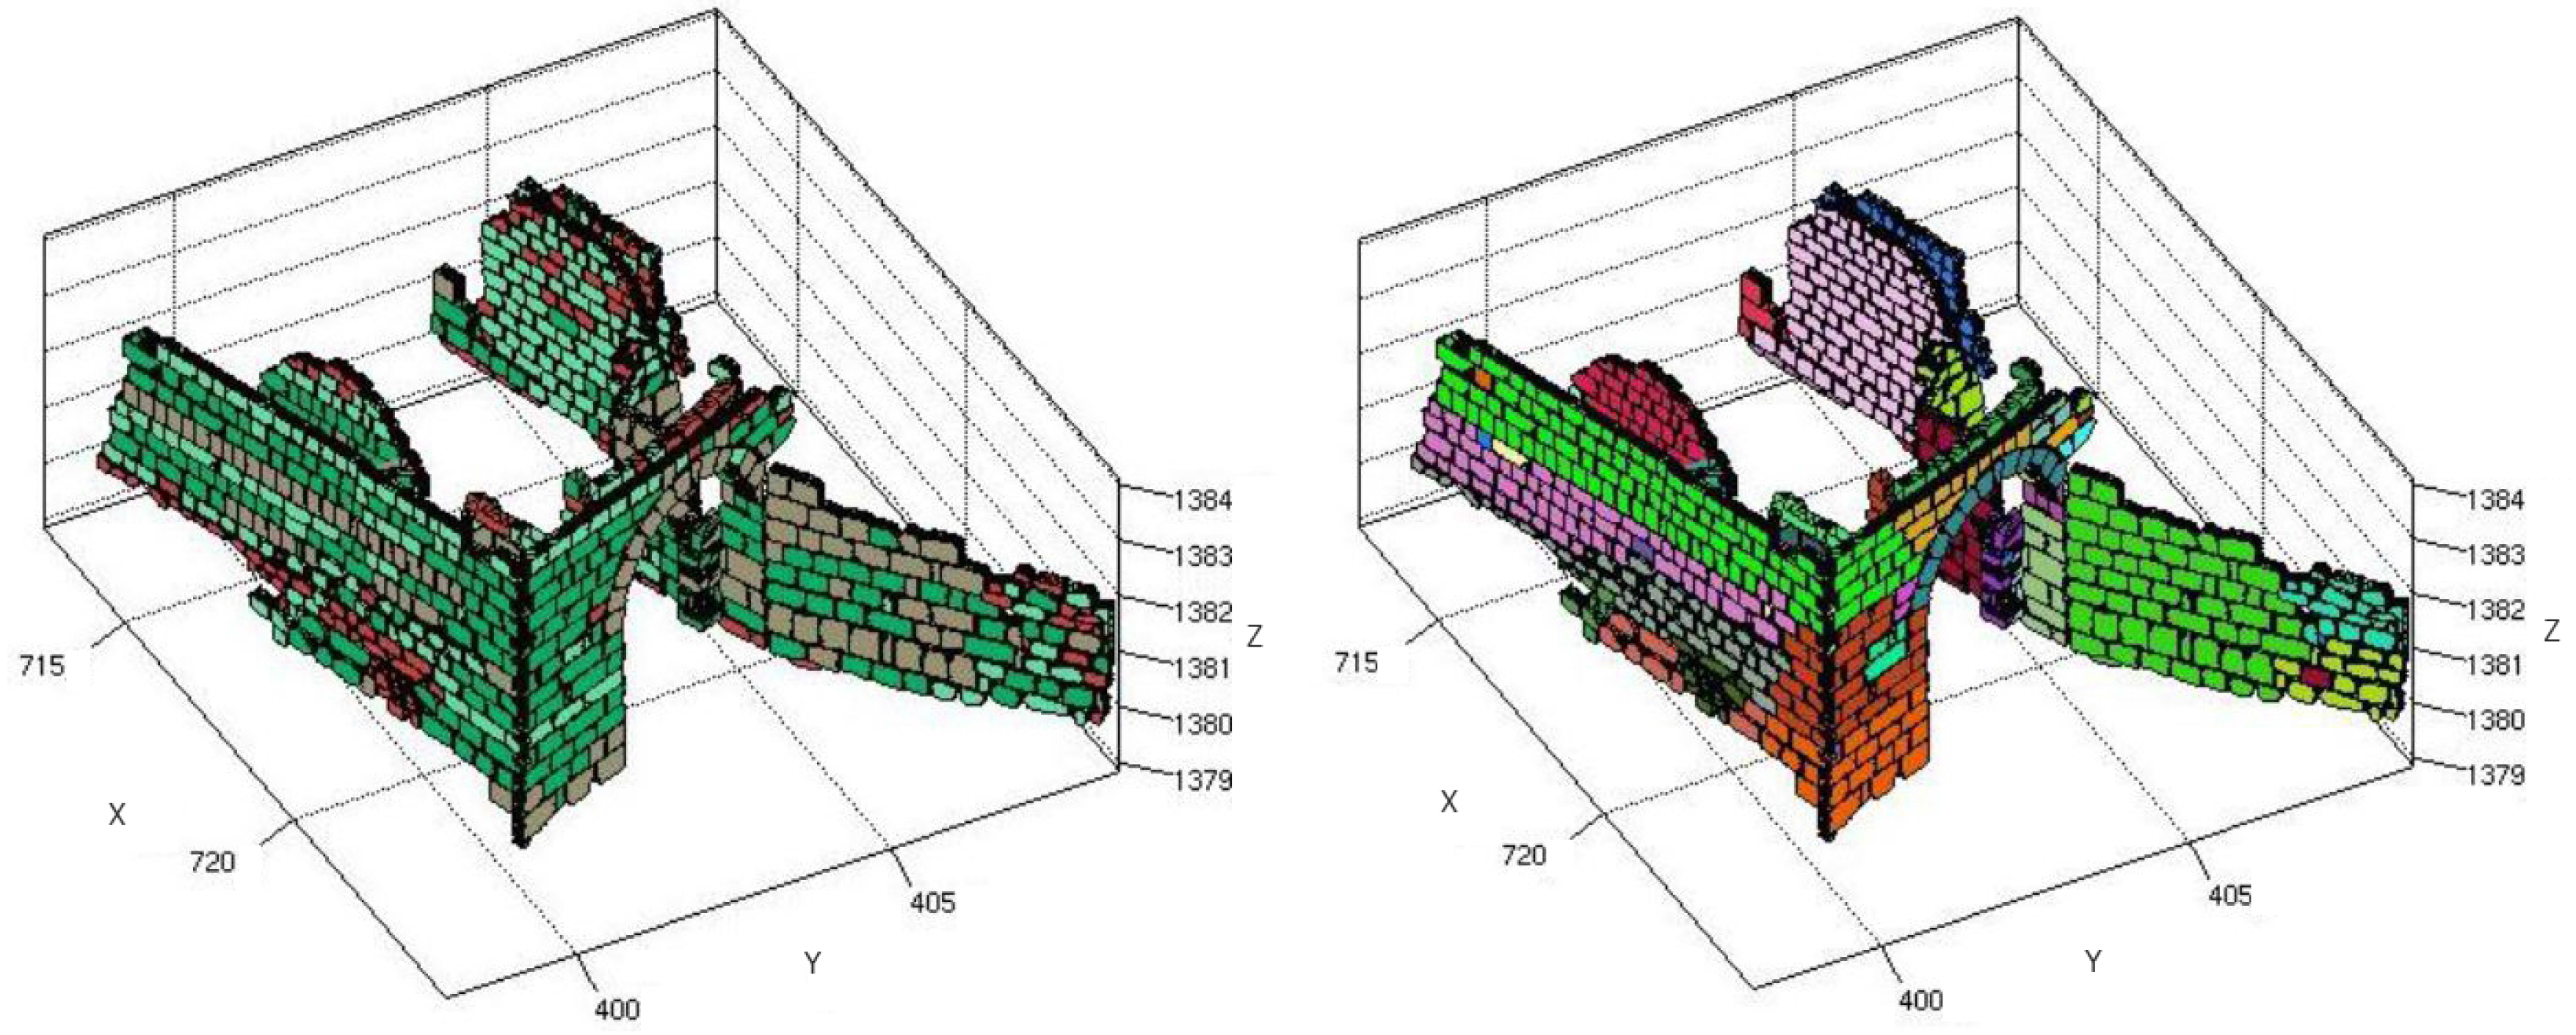
Figure 14.
Positive stratigraphic relations with the USM node coordinate coming from photogrammetric measurement.
Figure 14.
Positive stratigraphic relations with the USM node coordinate coming from photogrammetric measurement.

Figure 15.
2D bloc representation with the stratigraphic graph and bloc position. The nodes of the graphs are computed as centroids of US or block.
Figure 15.
2D bloc representation with the stratigraphic graph and bloc position. The nodes of the graphs are computed as centroids of US or block.
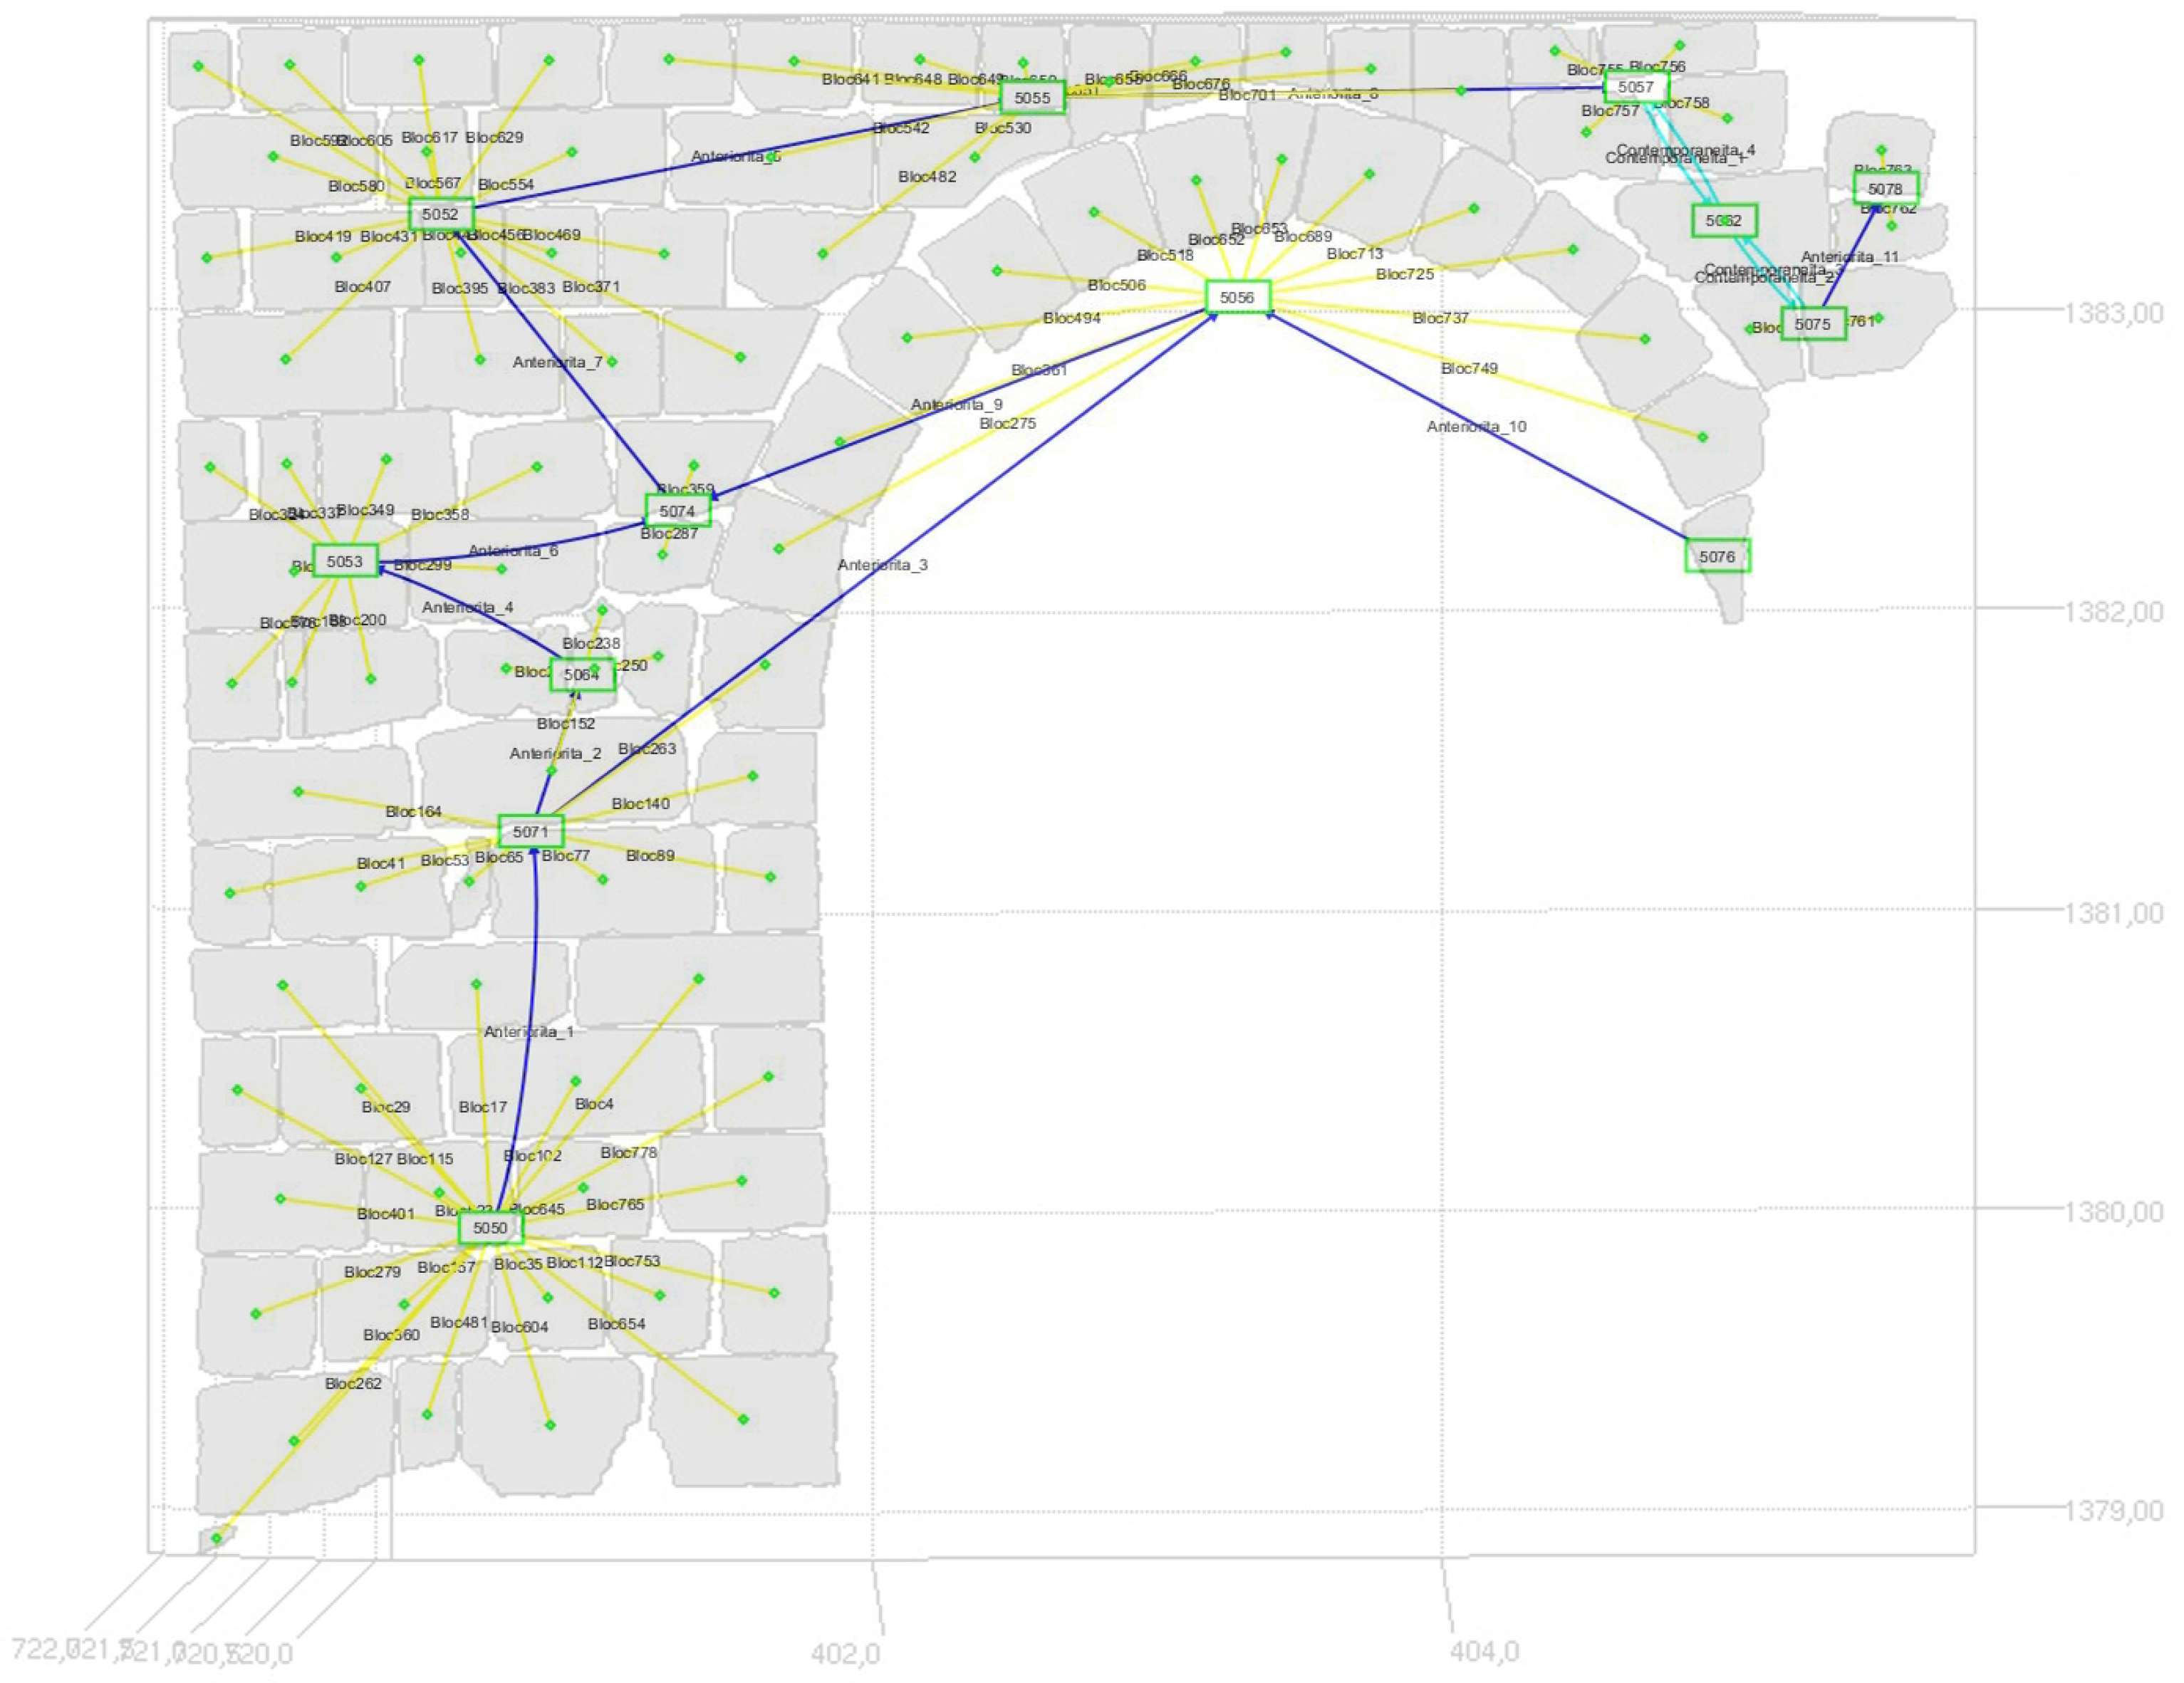
Figure 16.
Negative USM represented by the set of 3D points extracted using the perimeters designed on the photographs by an archaeologist.
Figure 16.
Negative USM represented by the set of 3D points extracted using the perimeters designed on the photographs by an archaeologist.

Figure 17.
Time points algebra atomic relations.

Figure 18.
Example of relations between US.

Figure 19.
Qualitative Constraints Networks (QCN) when temporal entities are time points.

Figure 20.
QCN when temporal entities are intervals.

Figure 21.
Harris to Allen proposal schema.
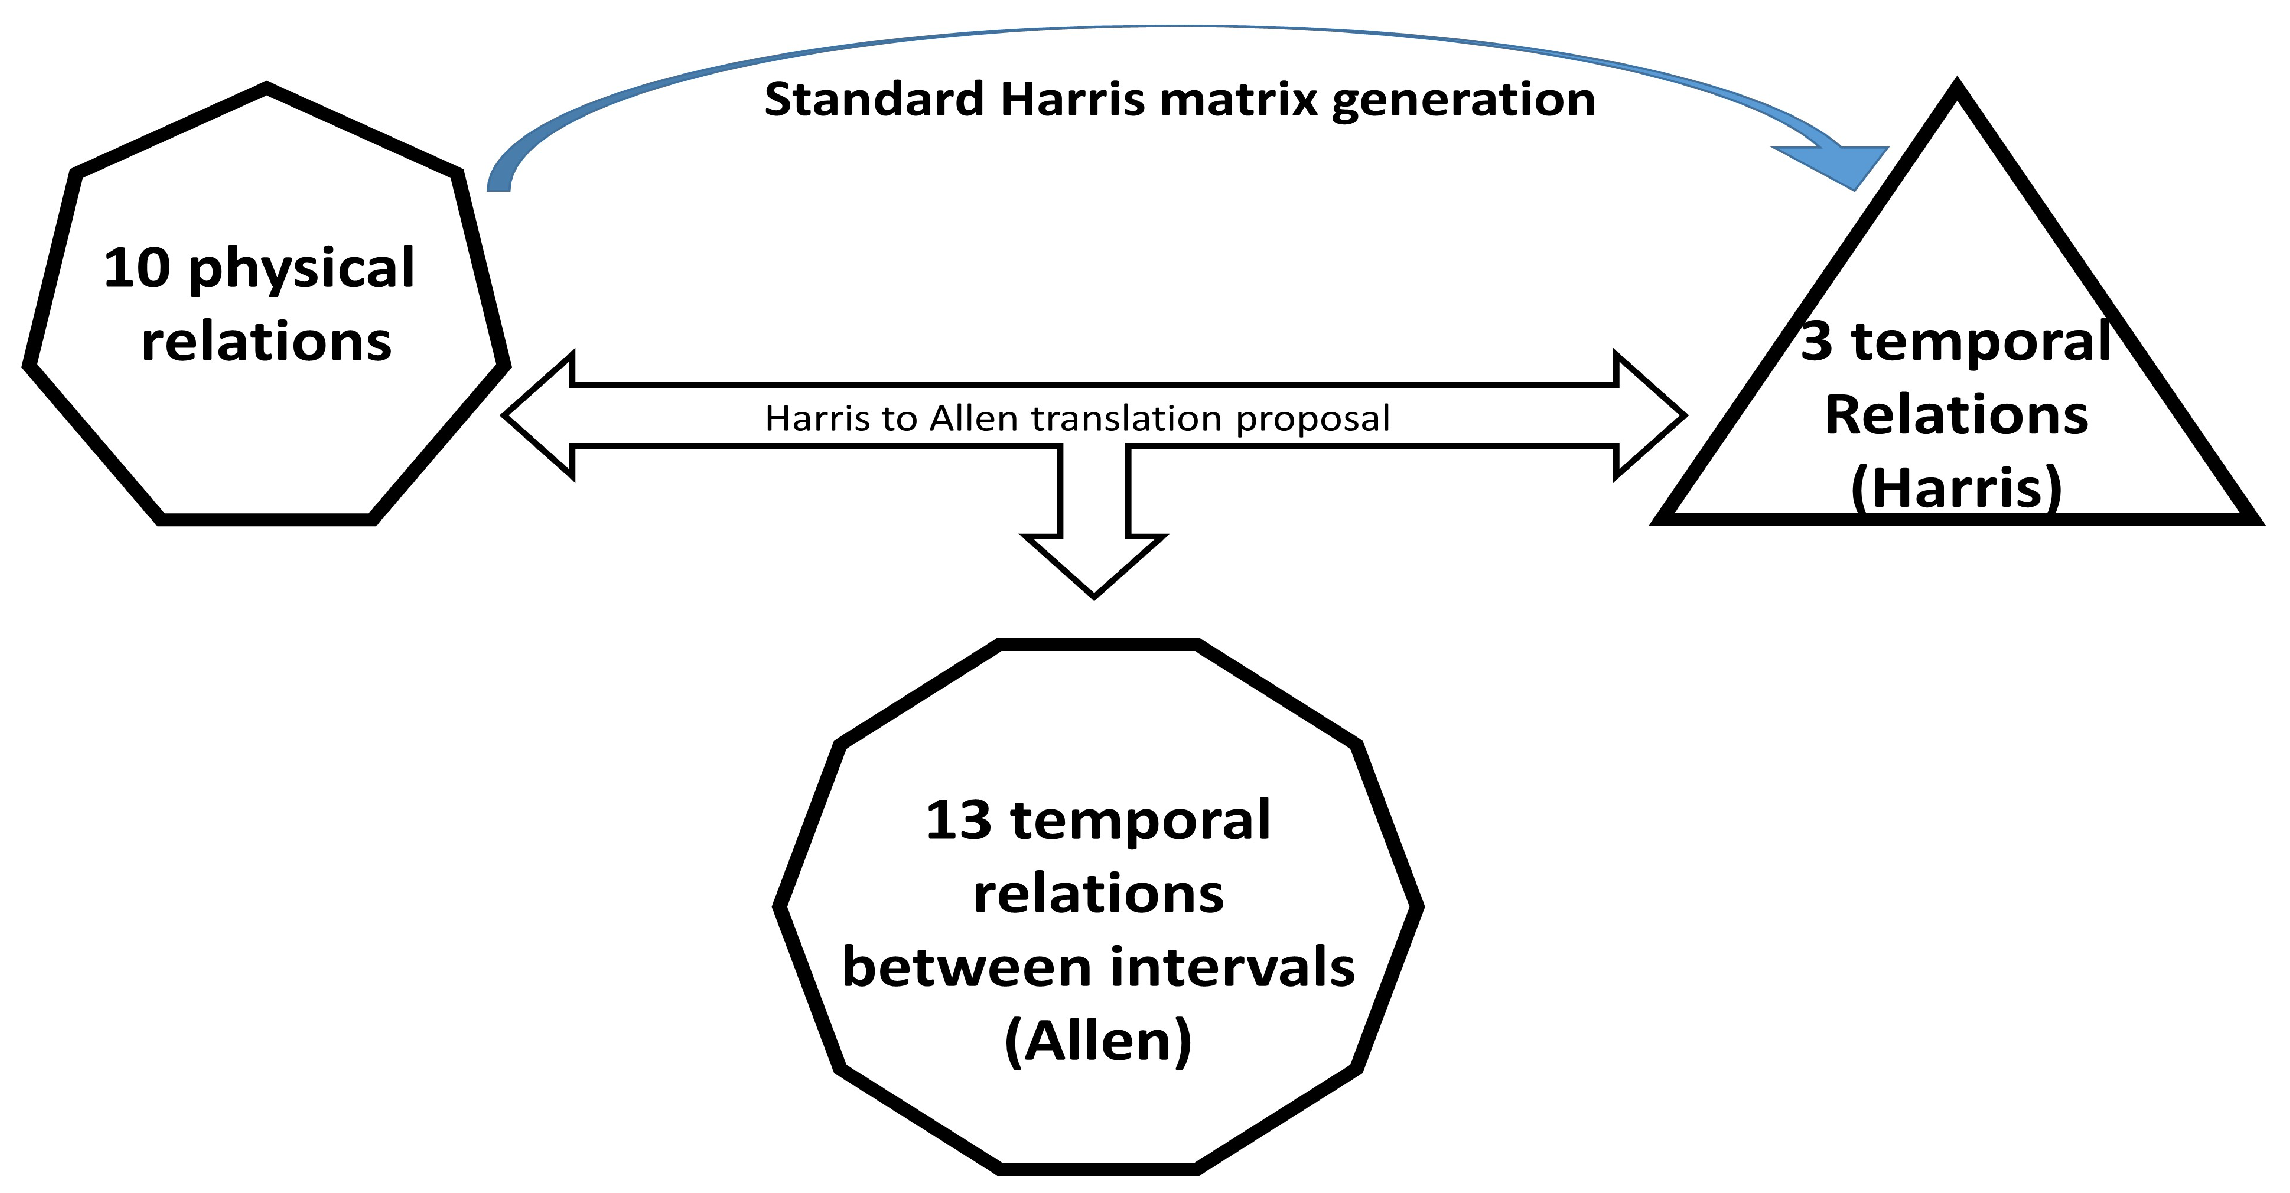

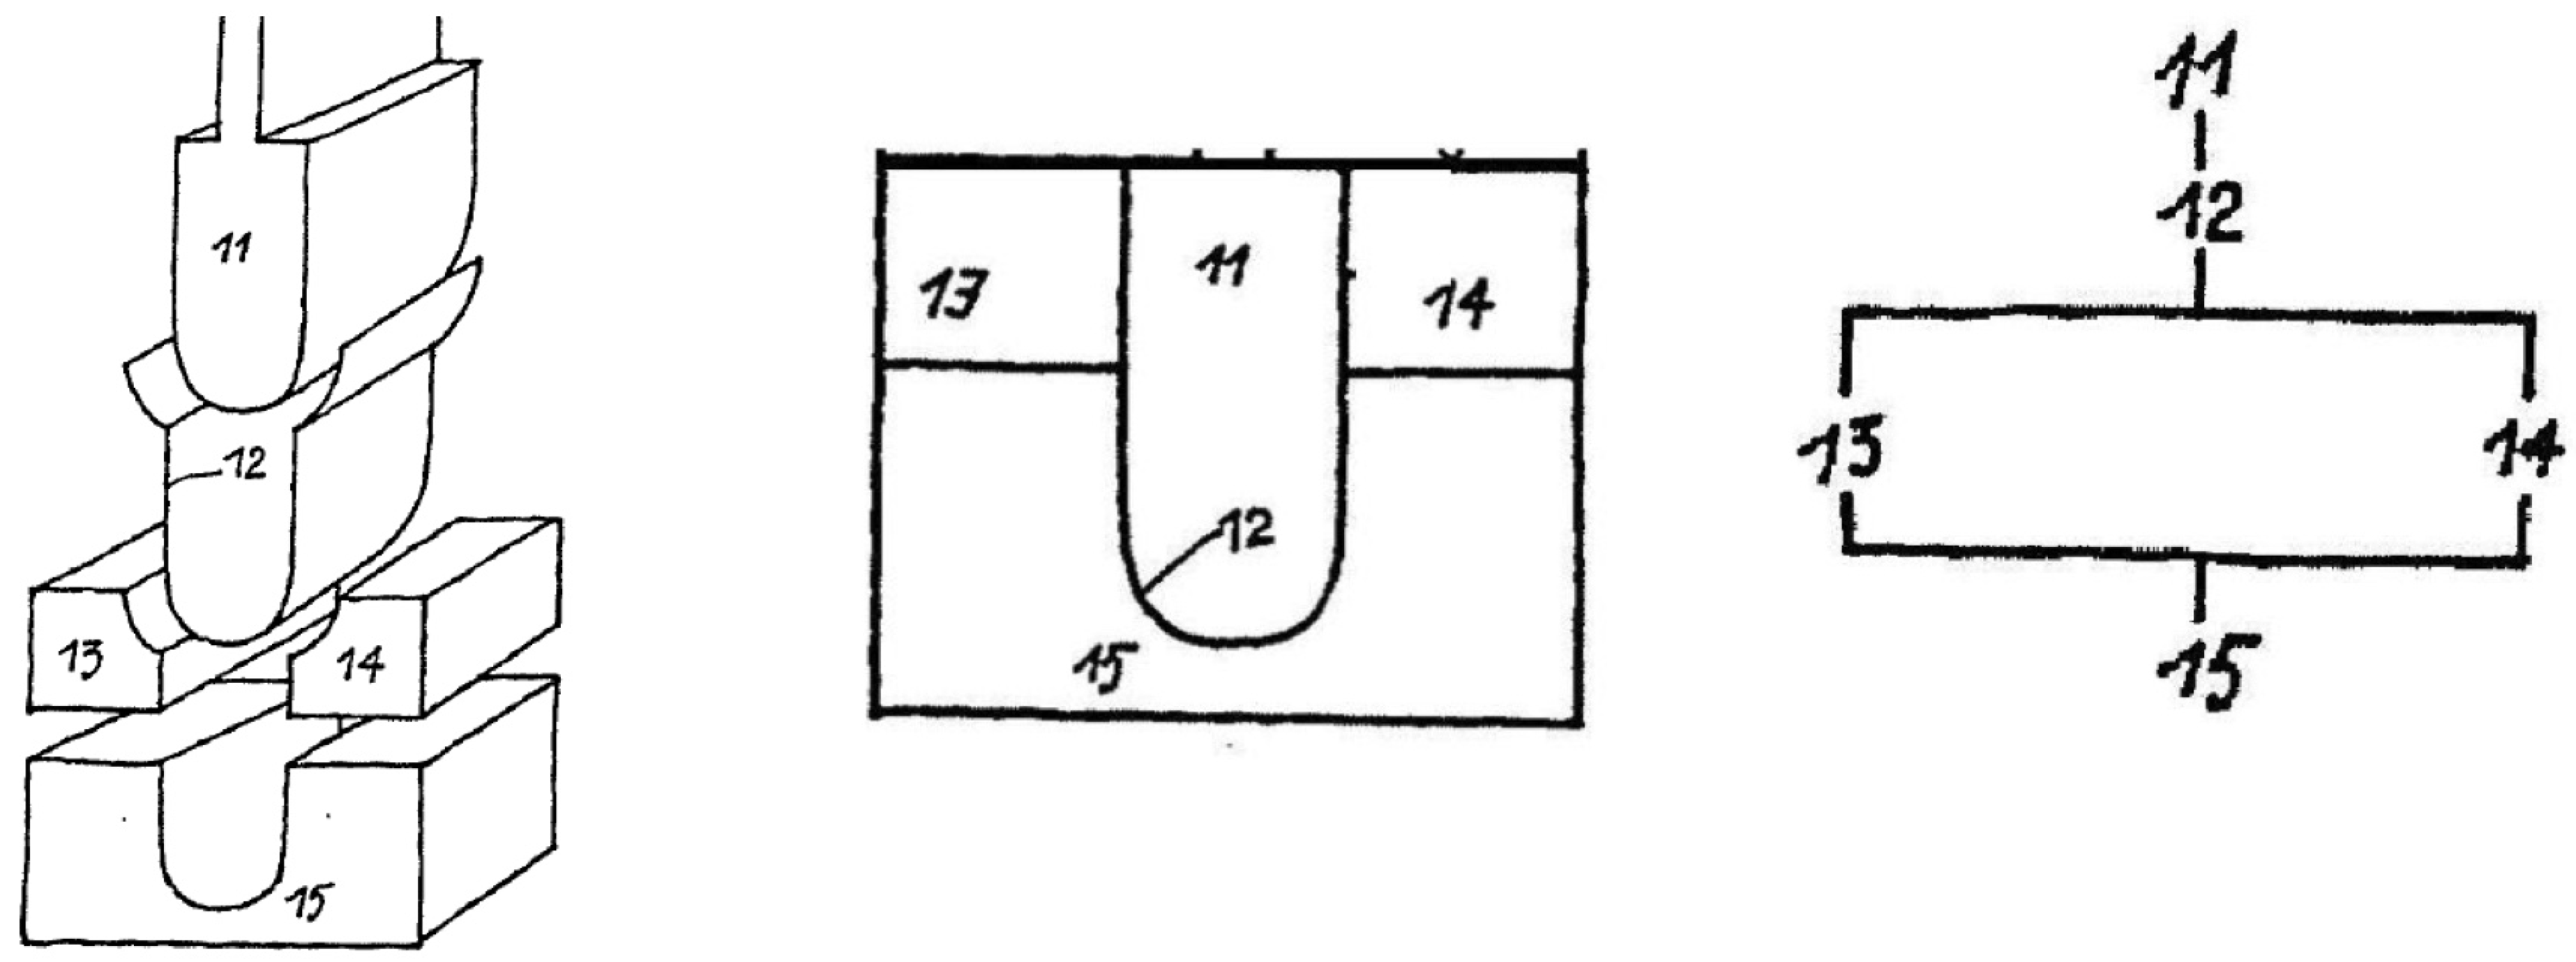
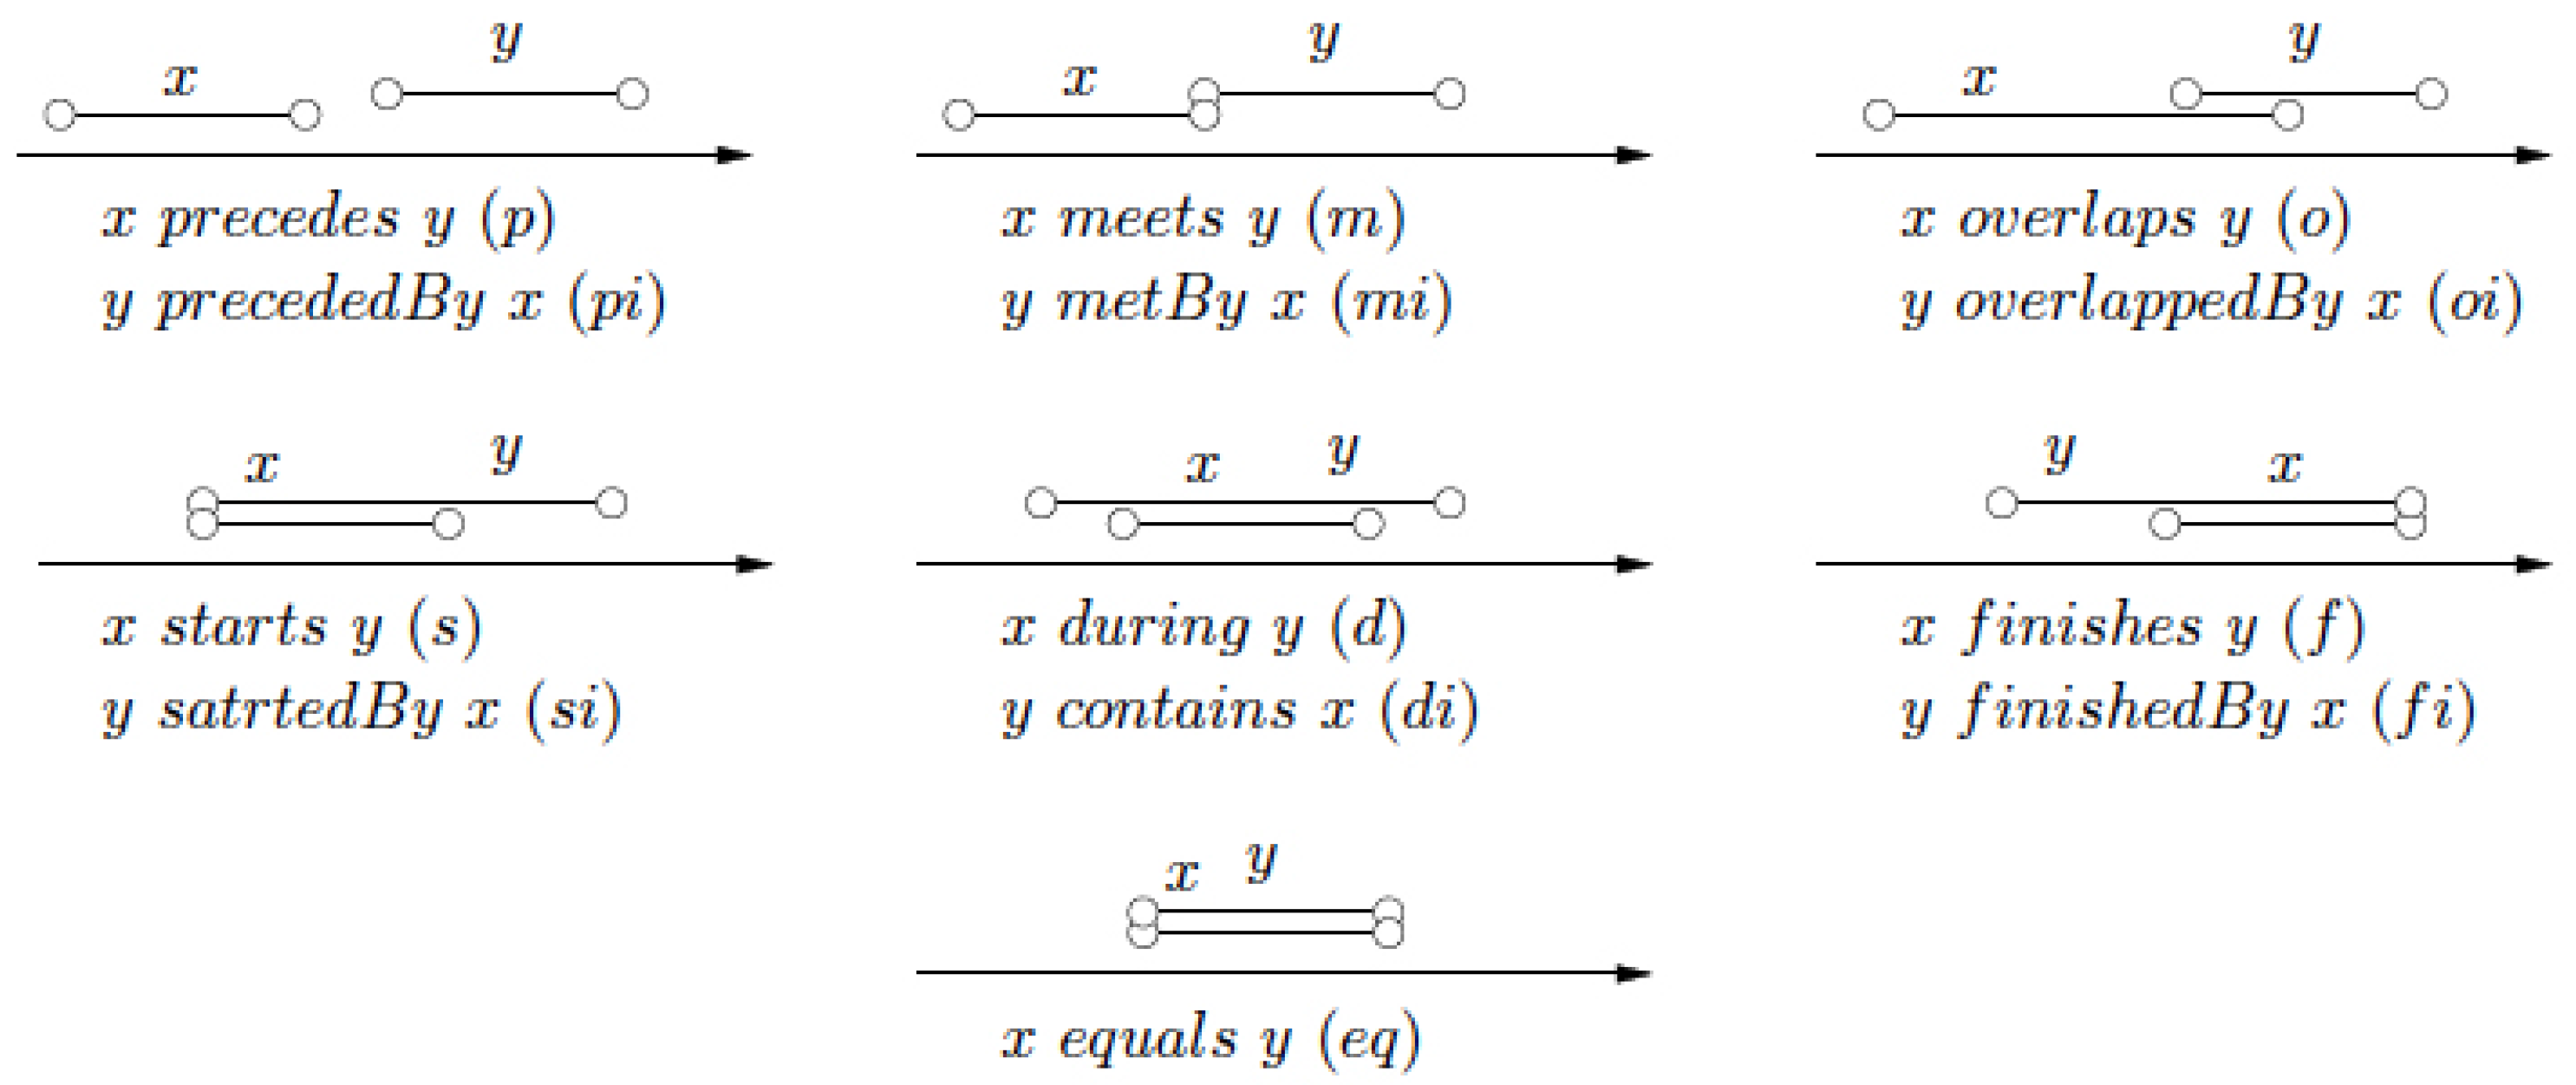
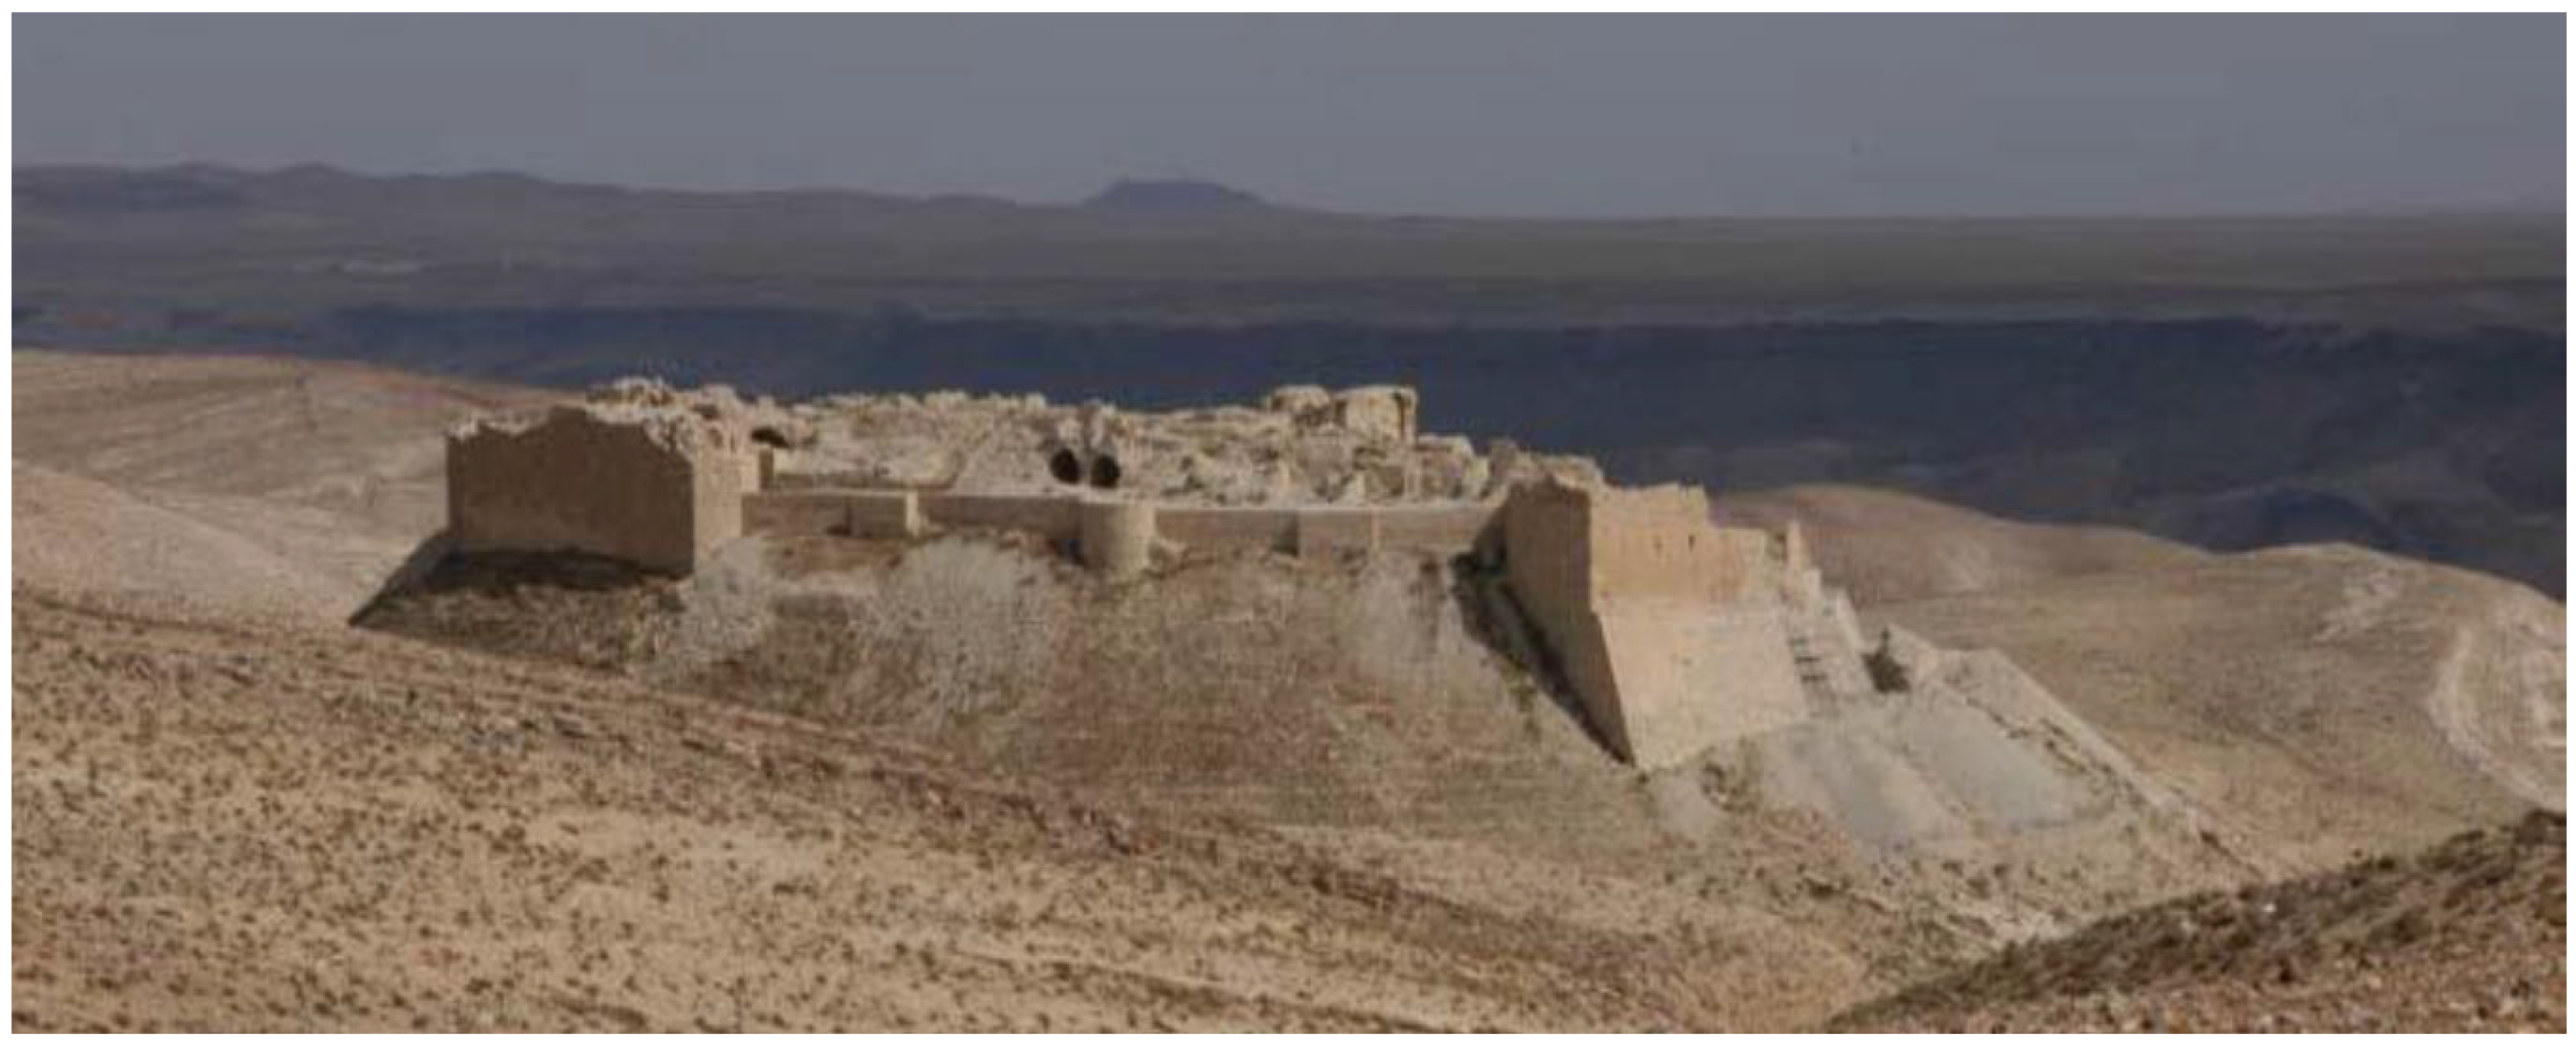
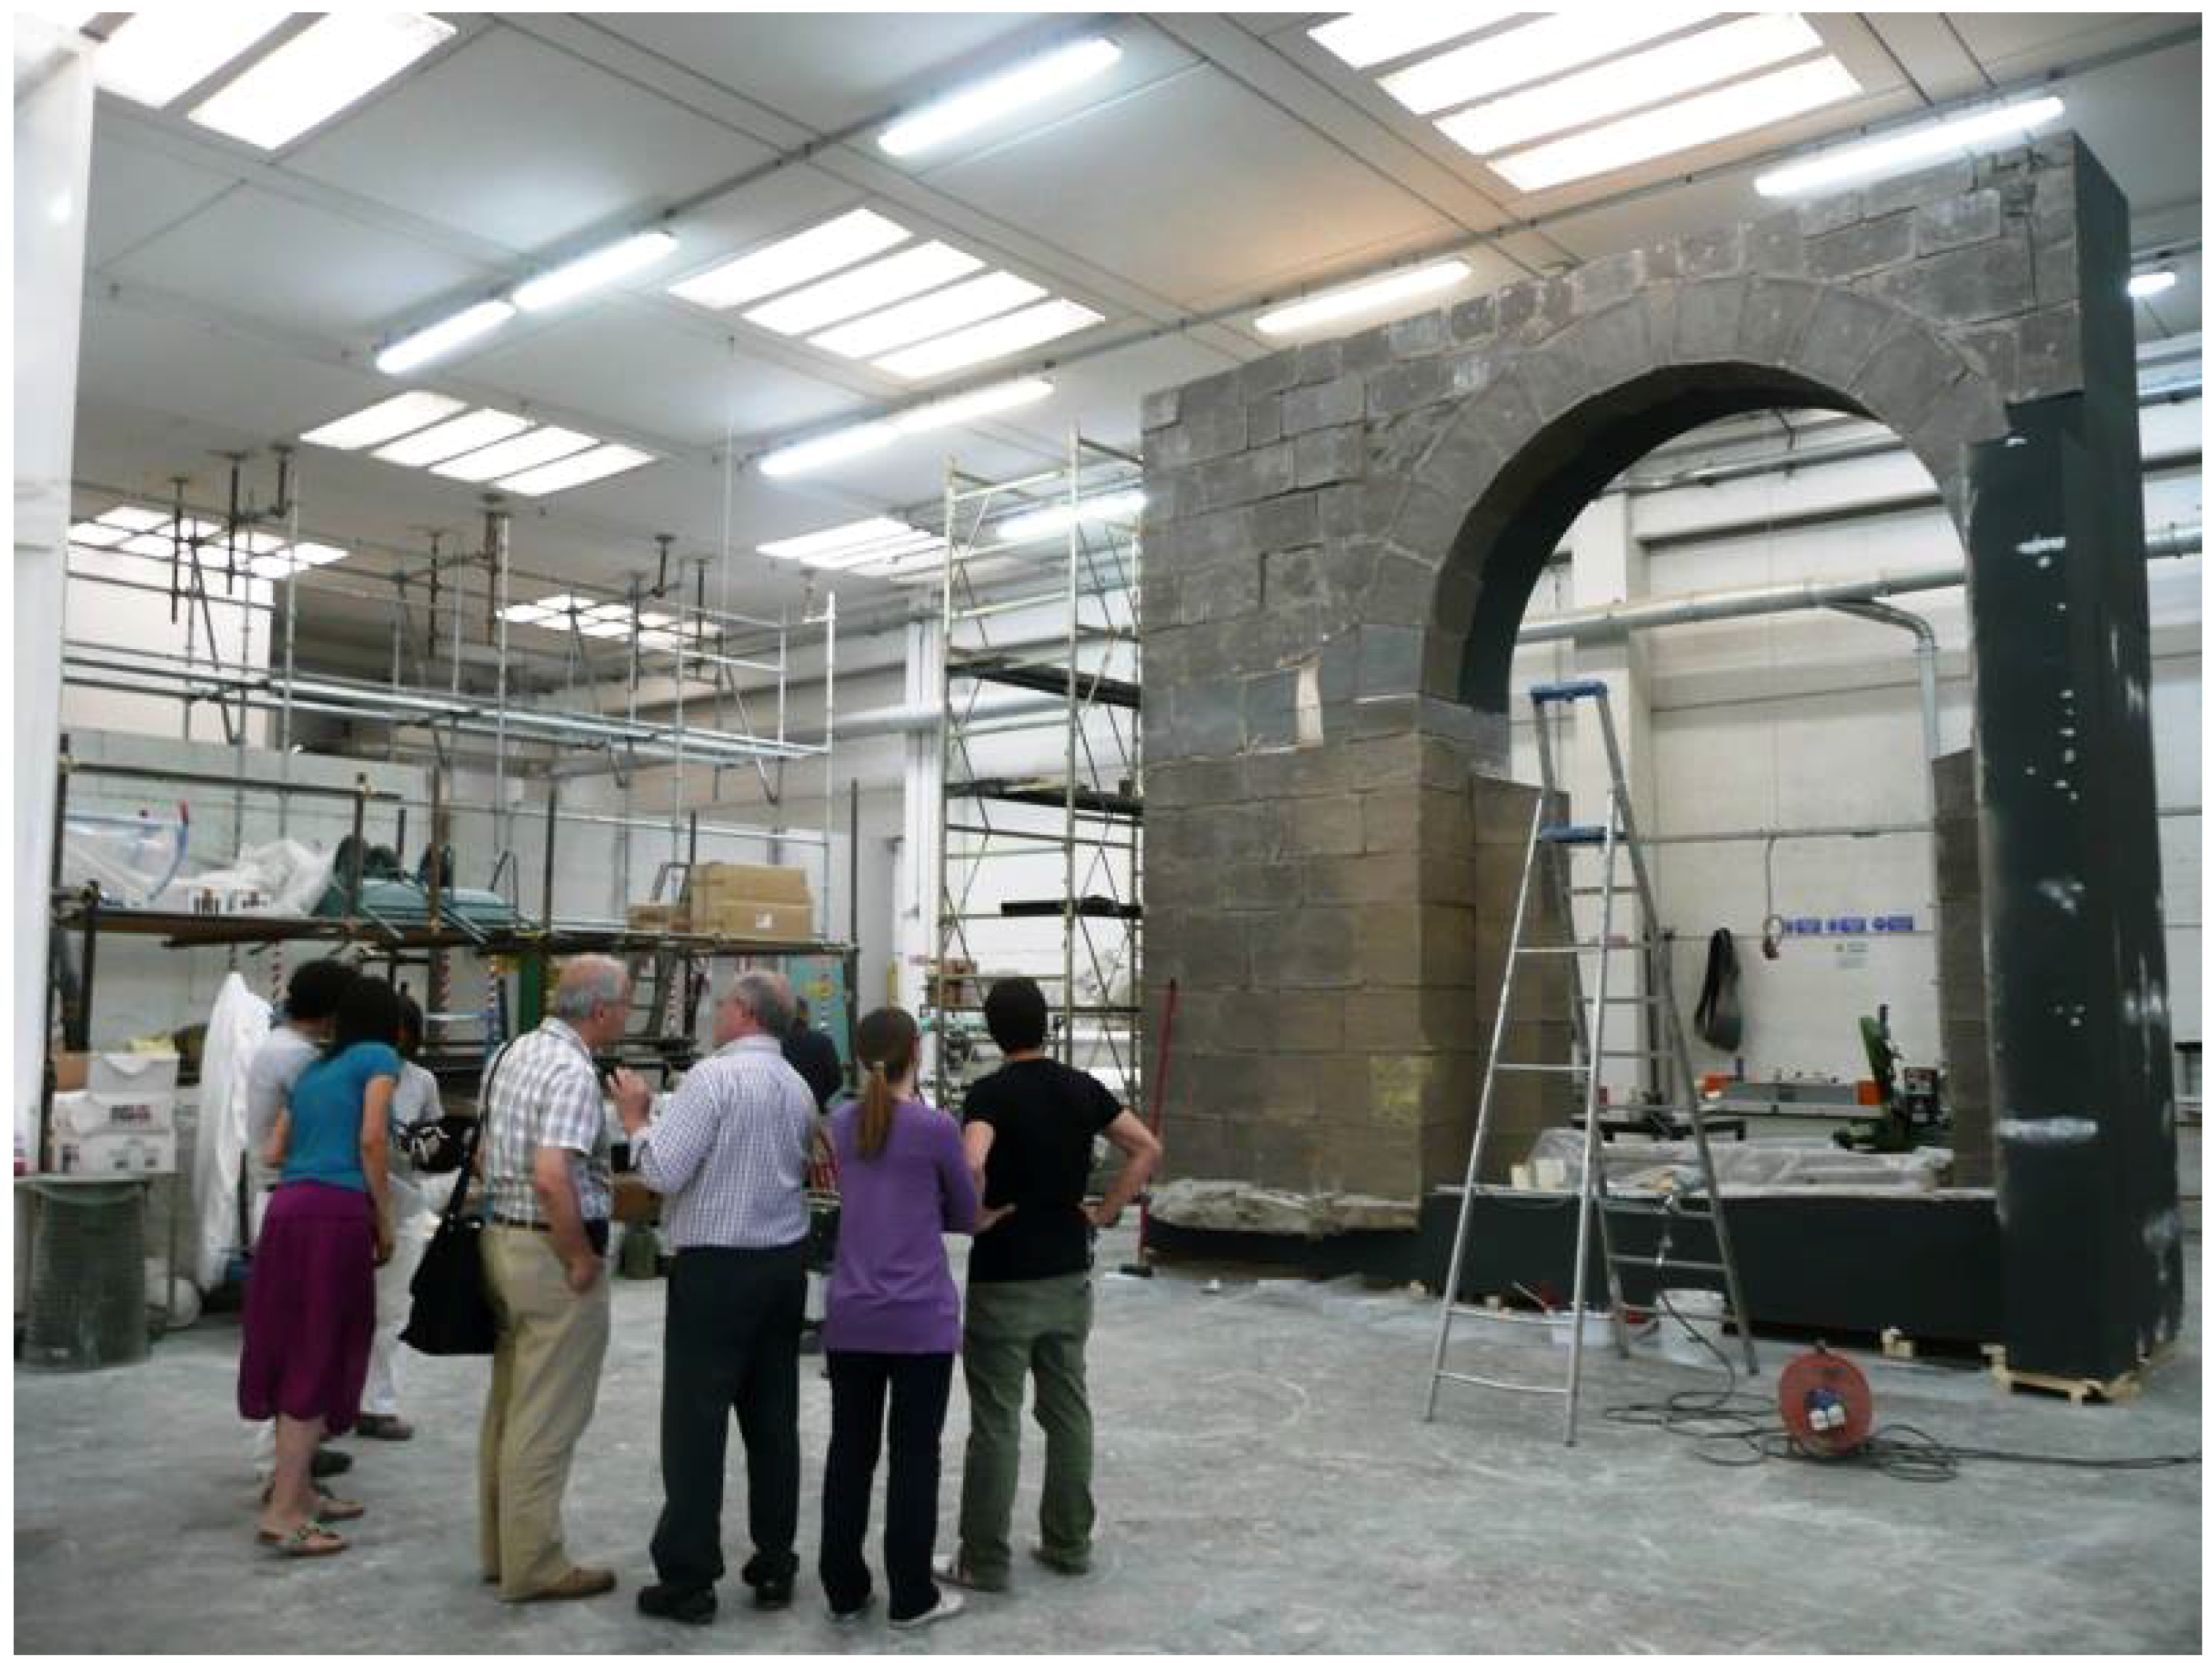
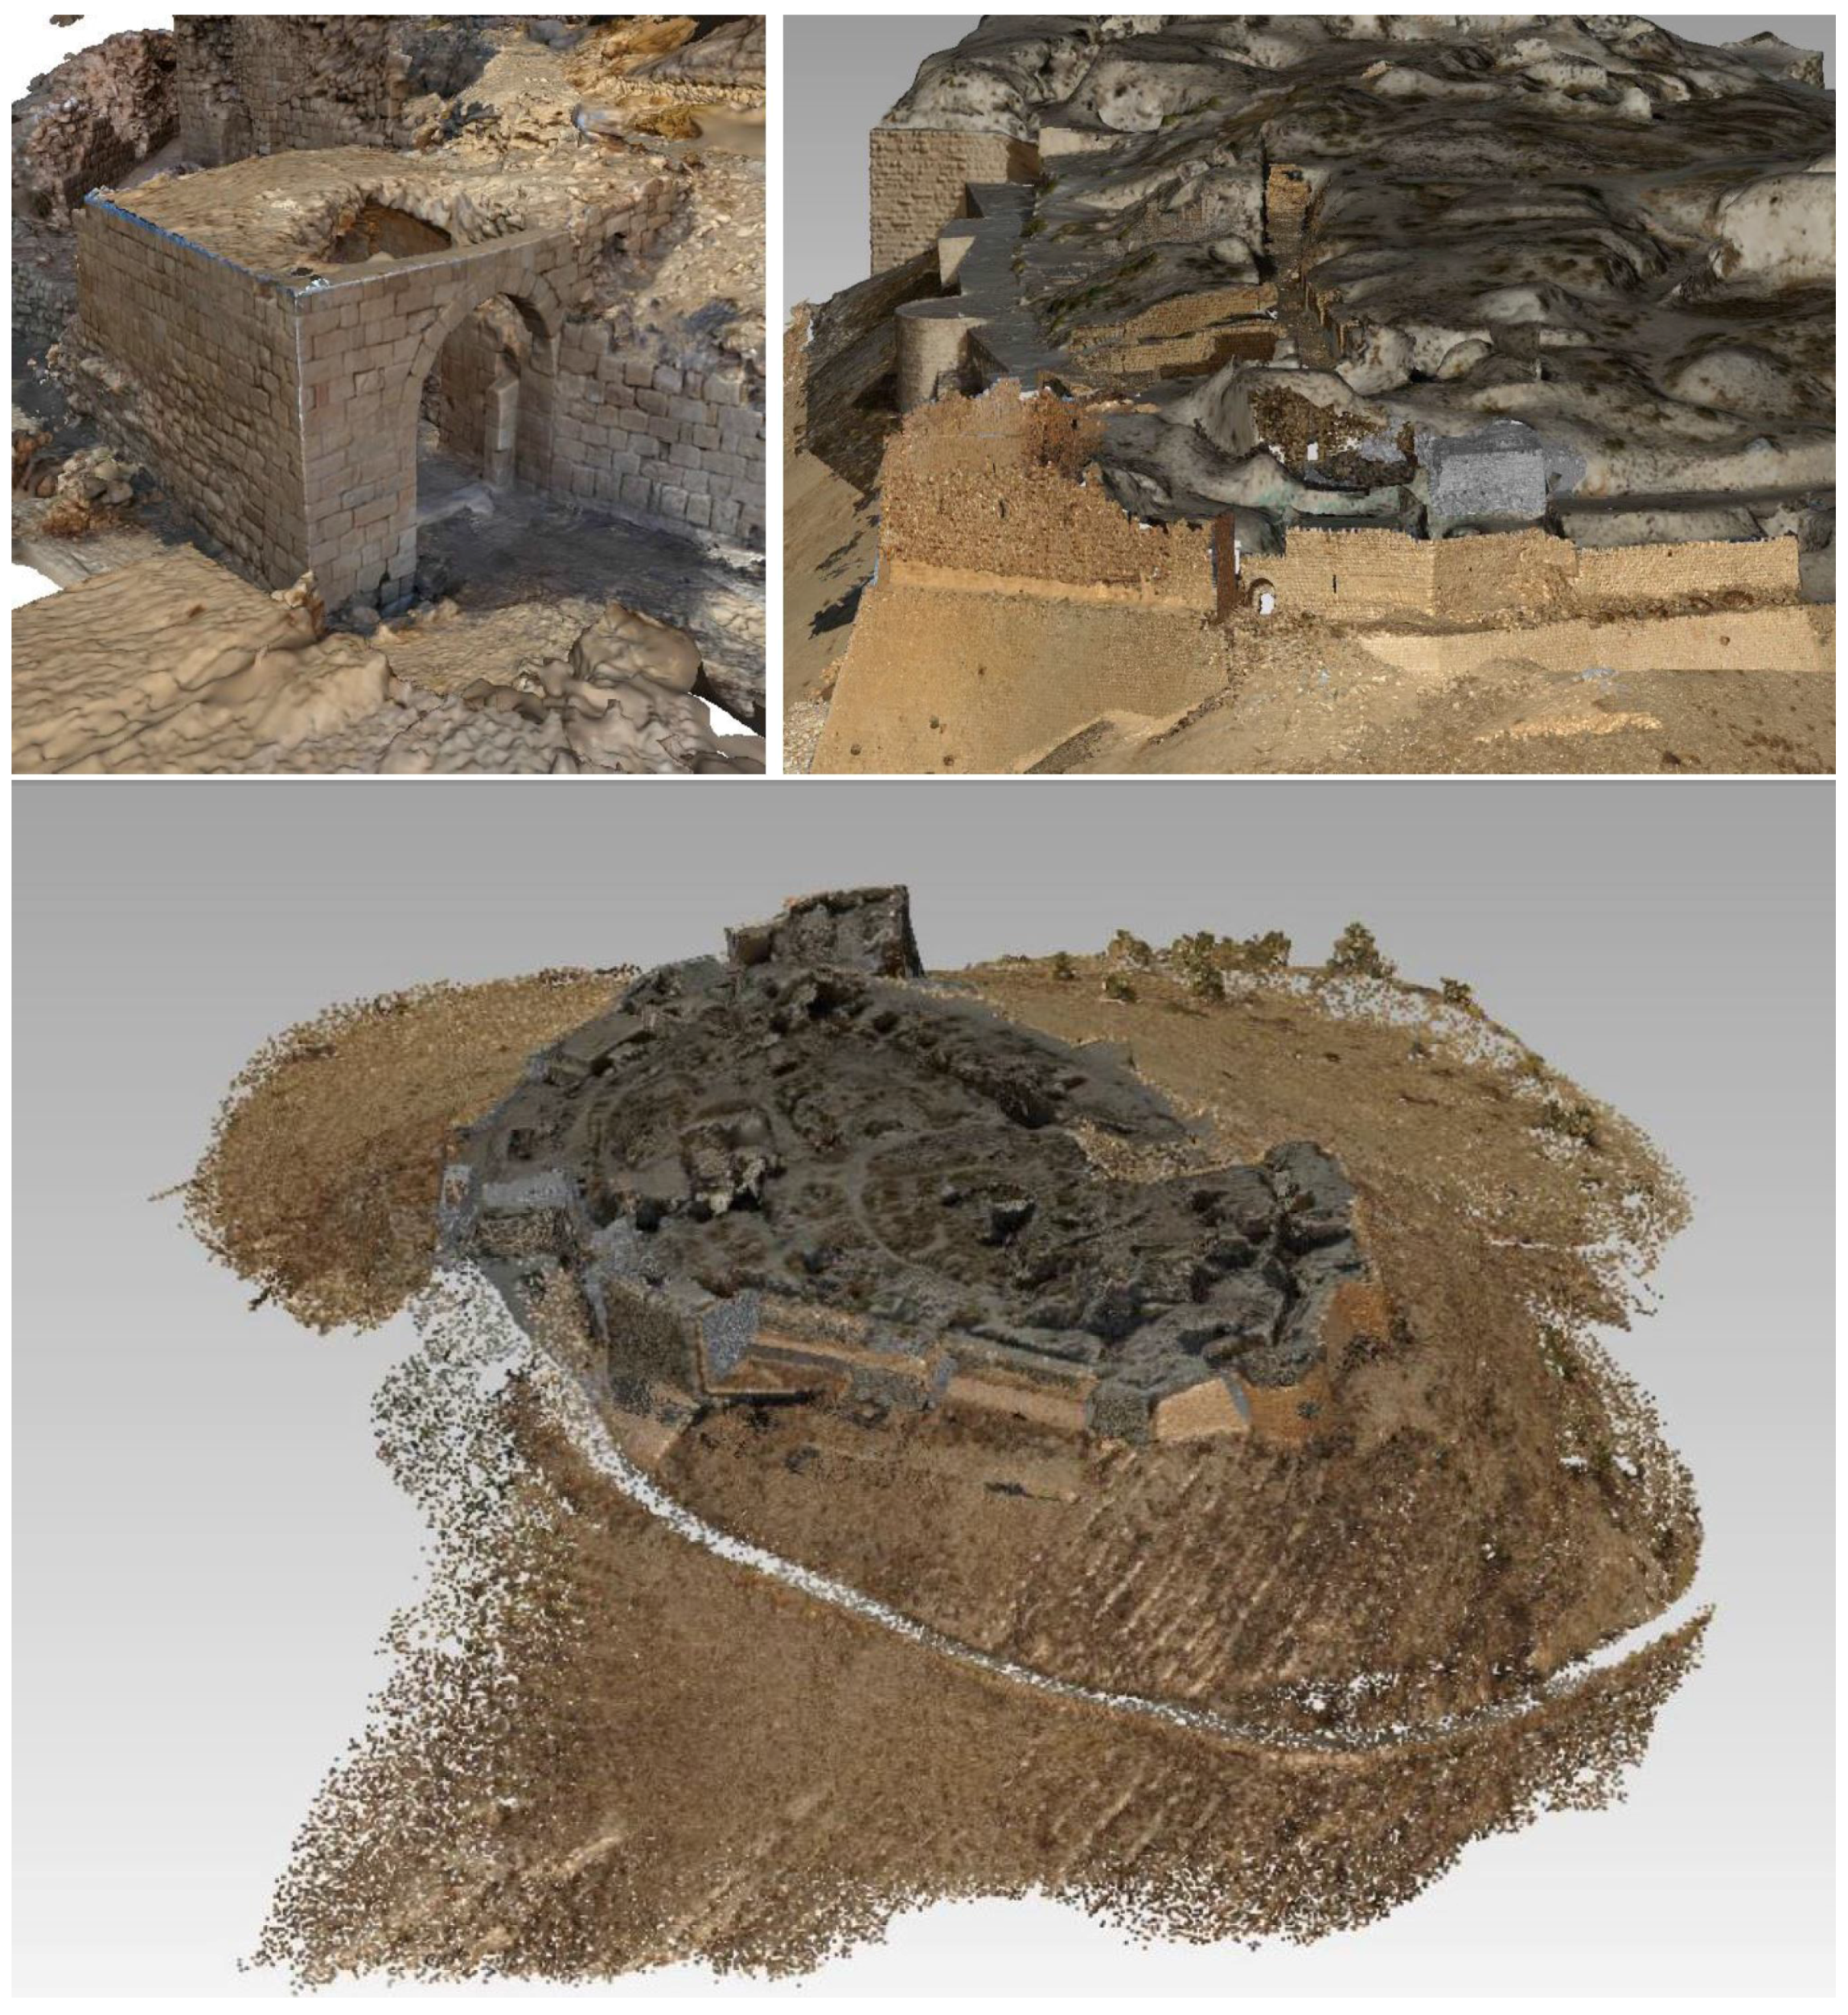
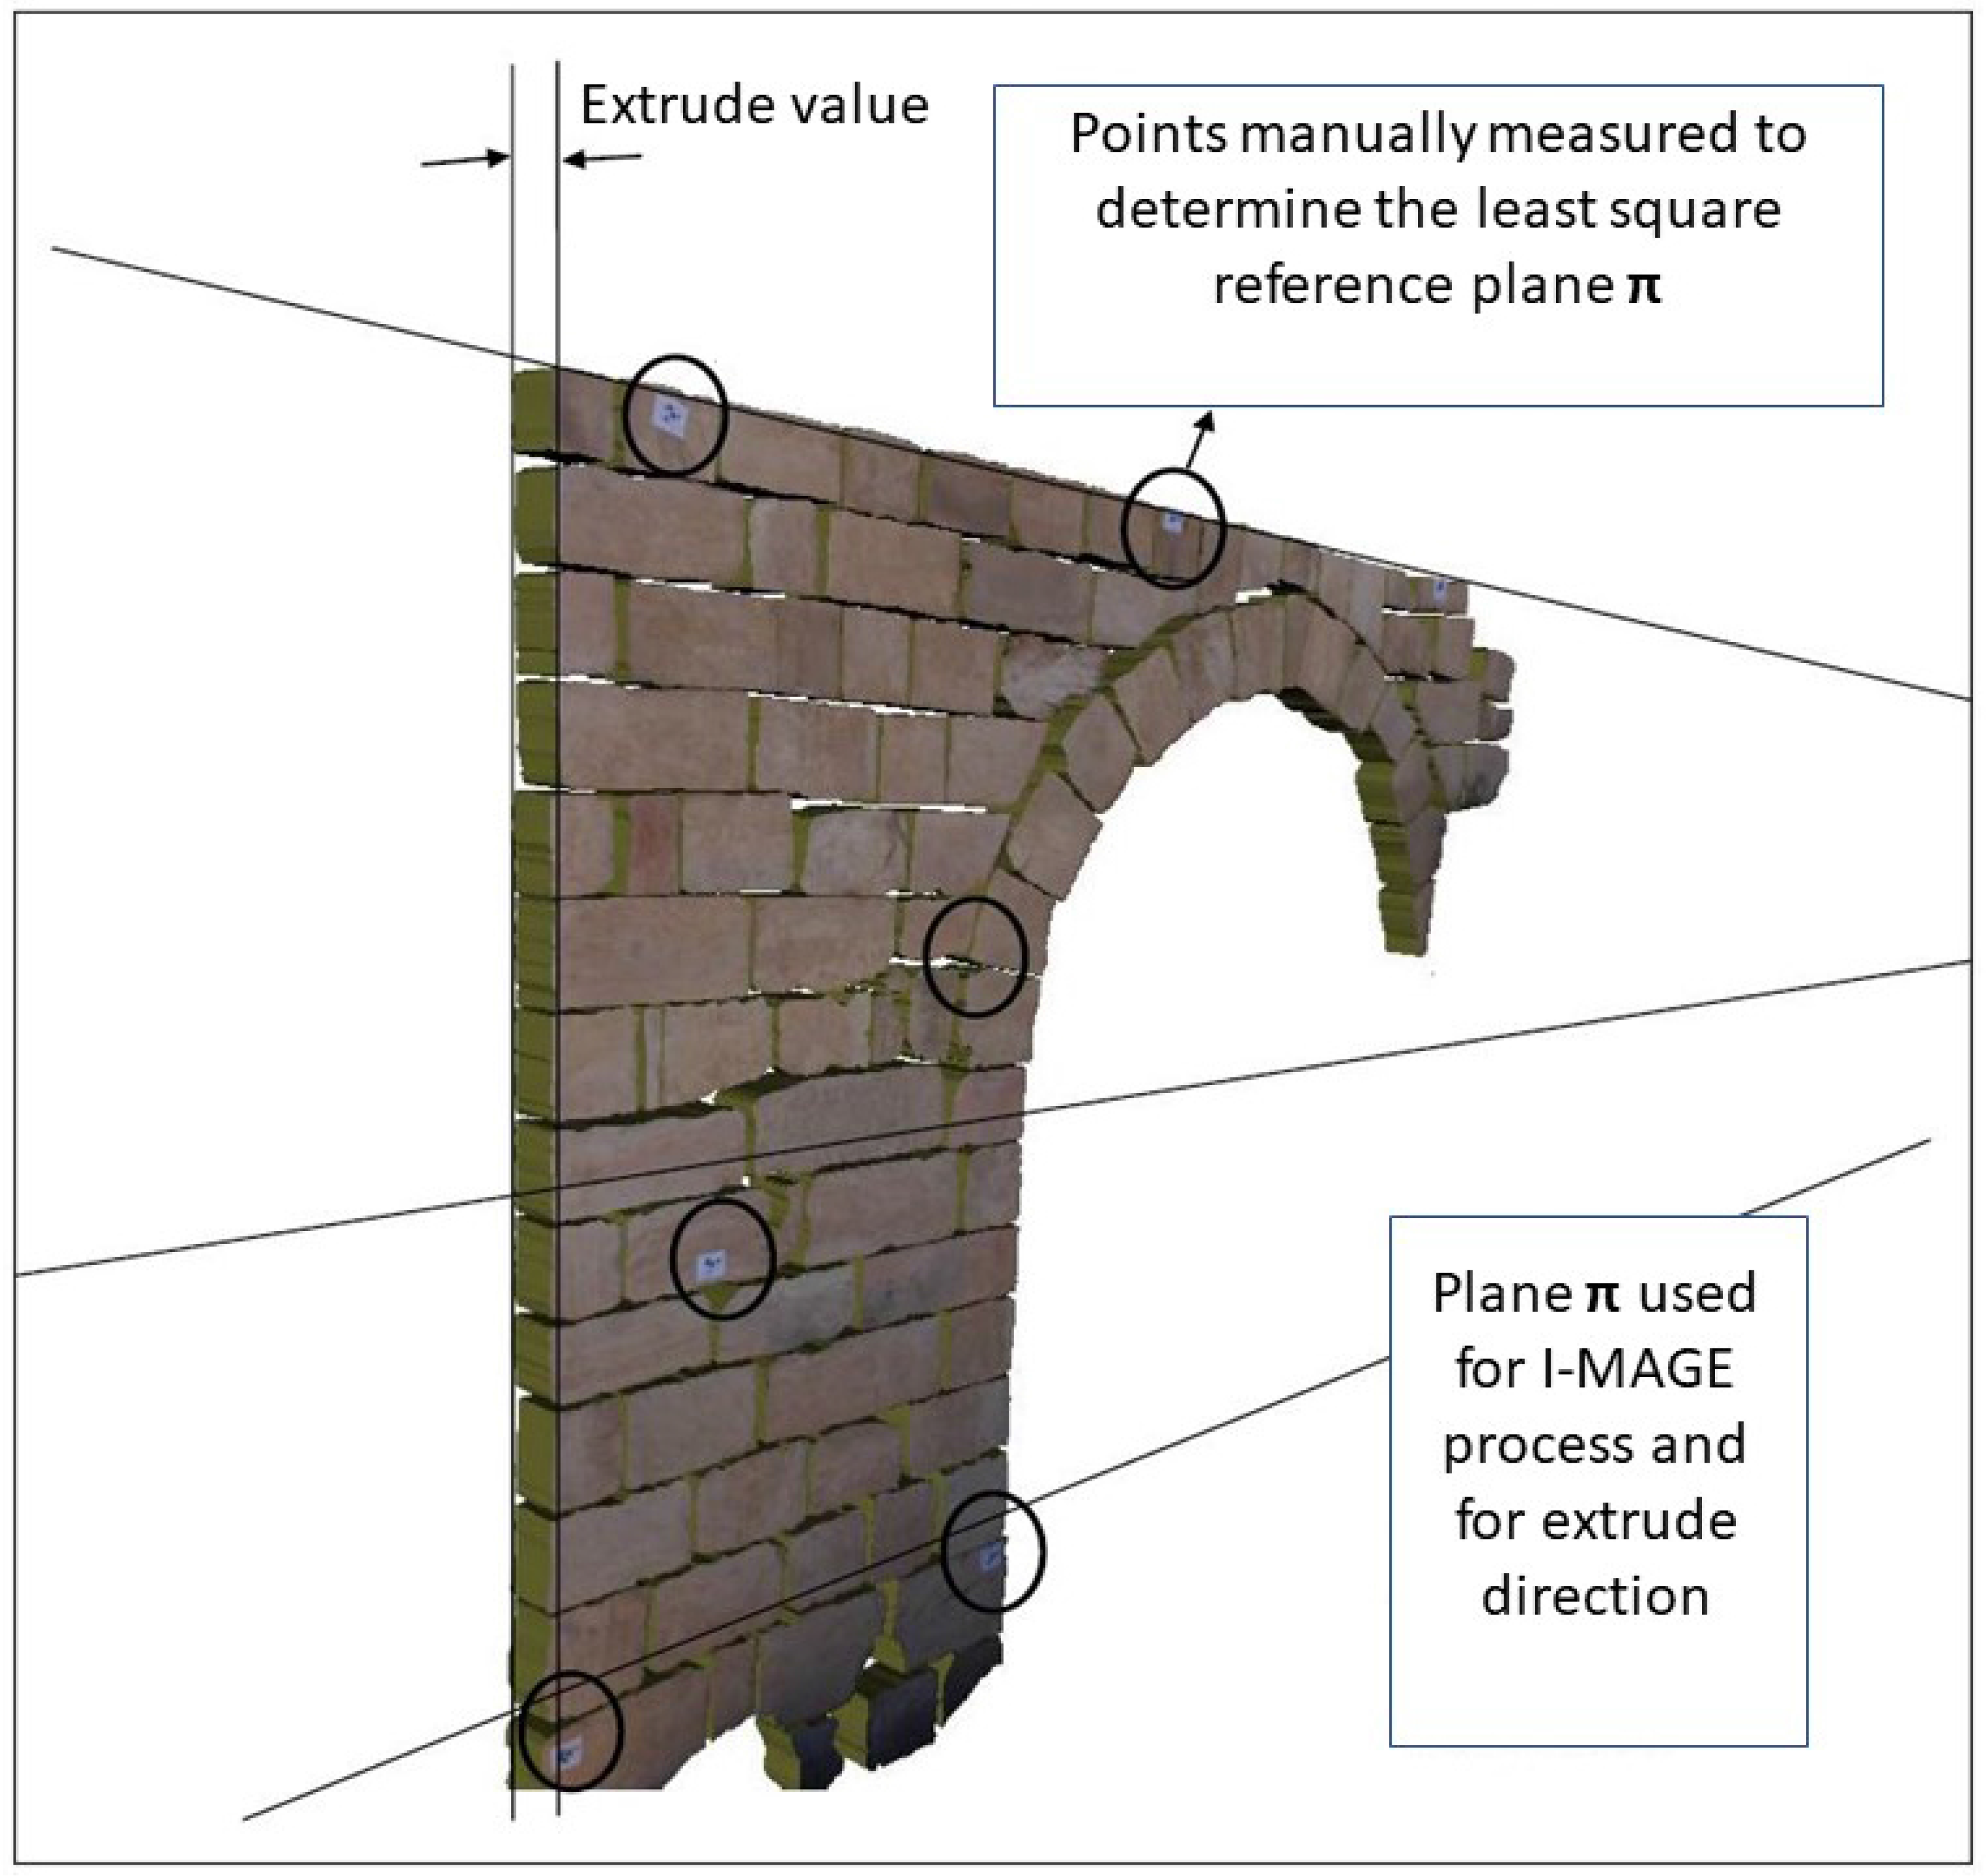
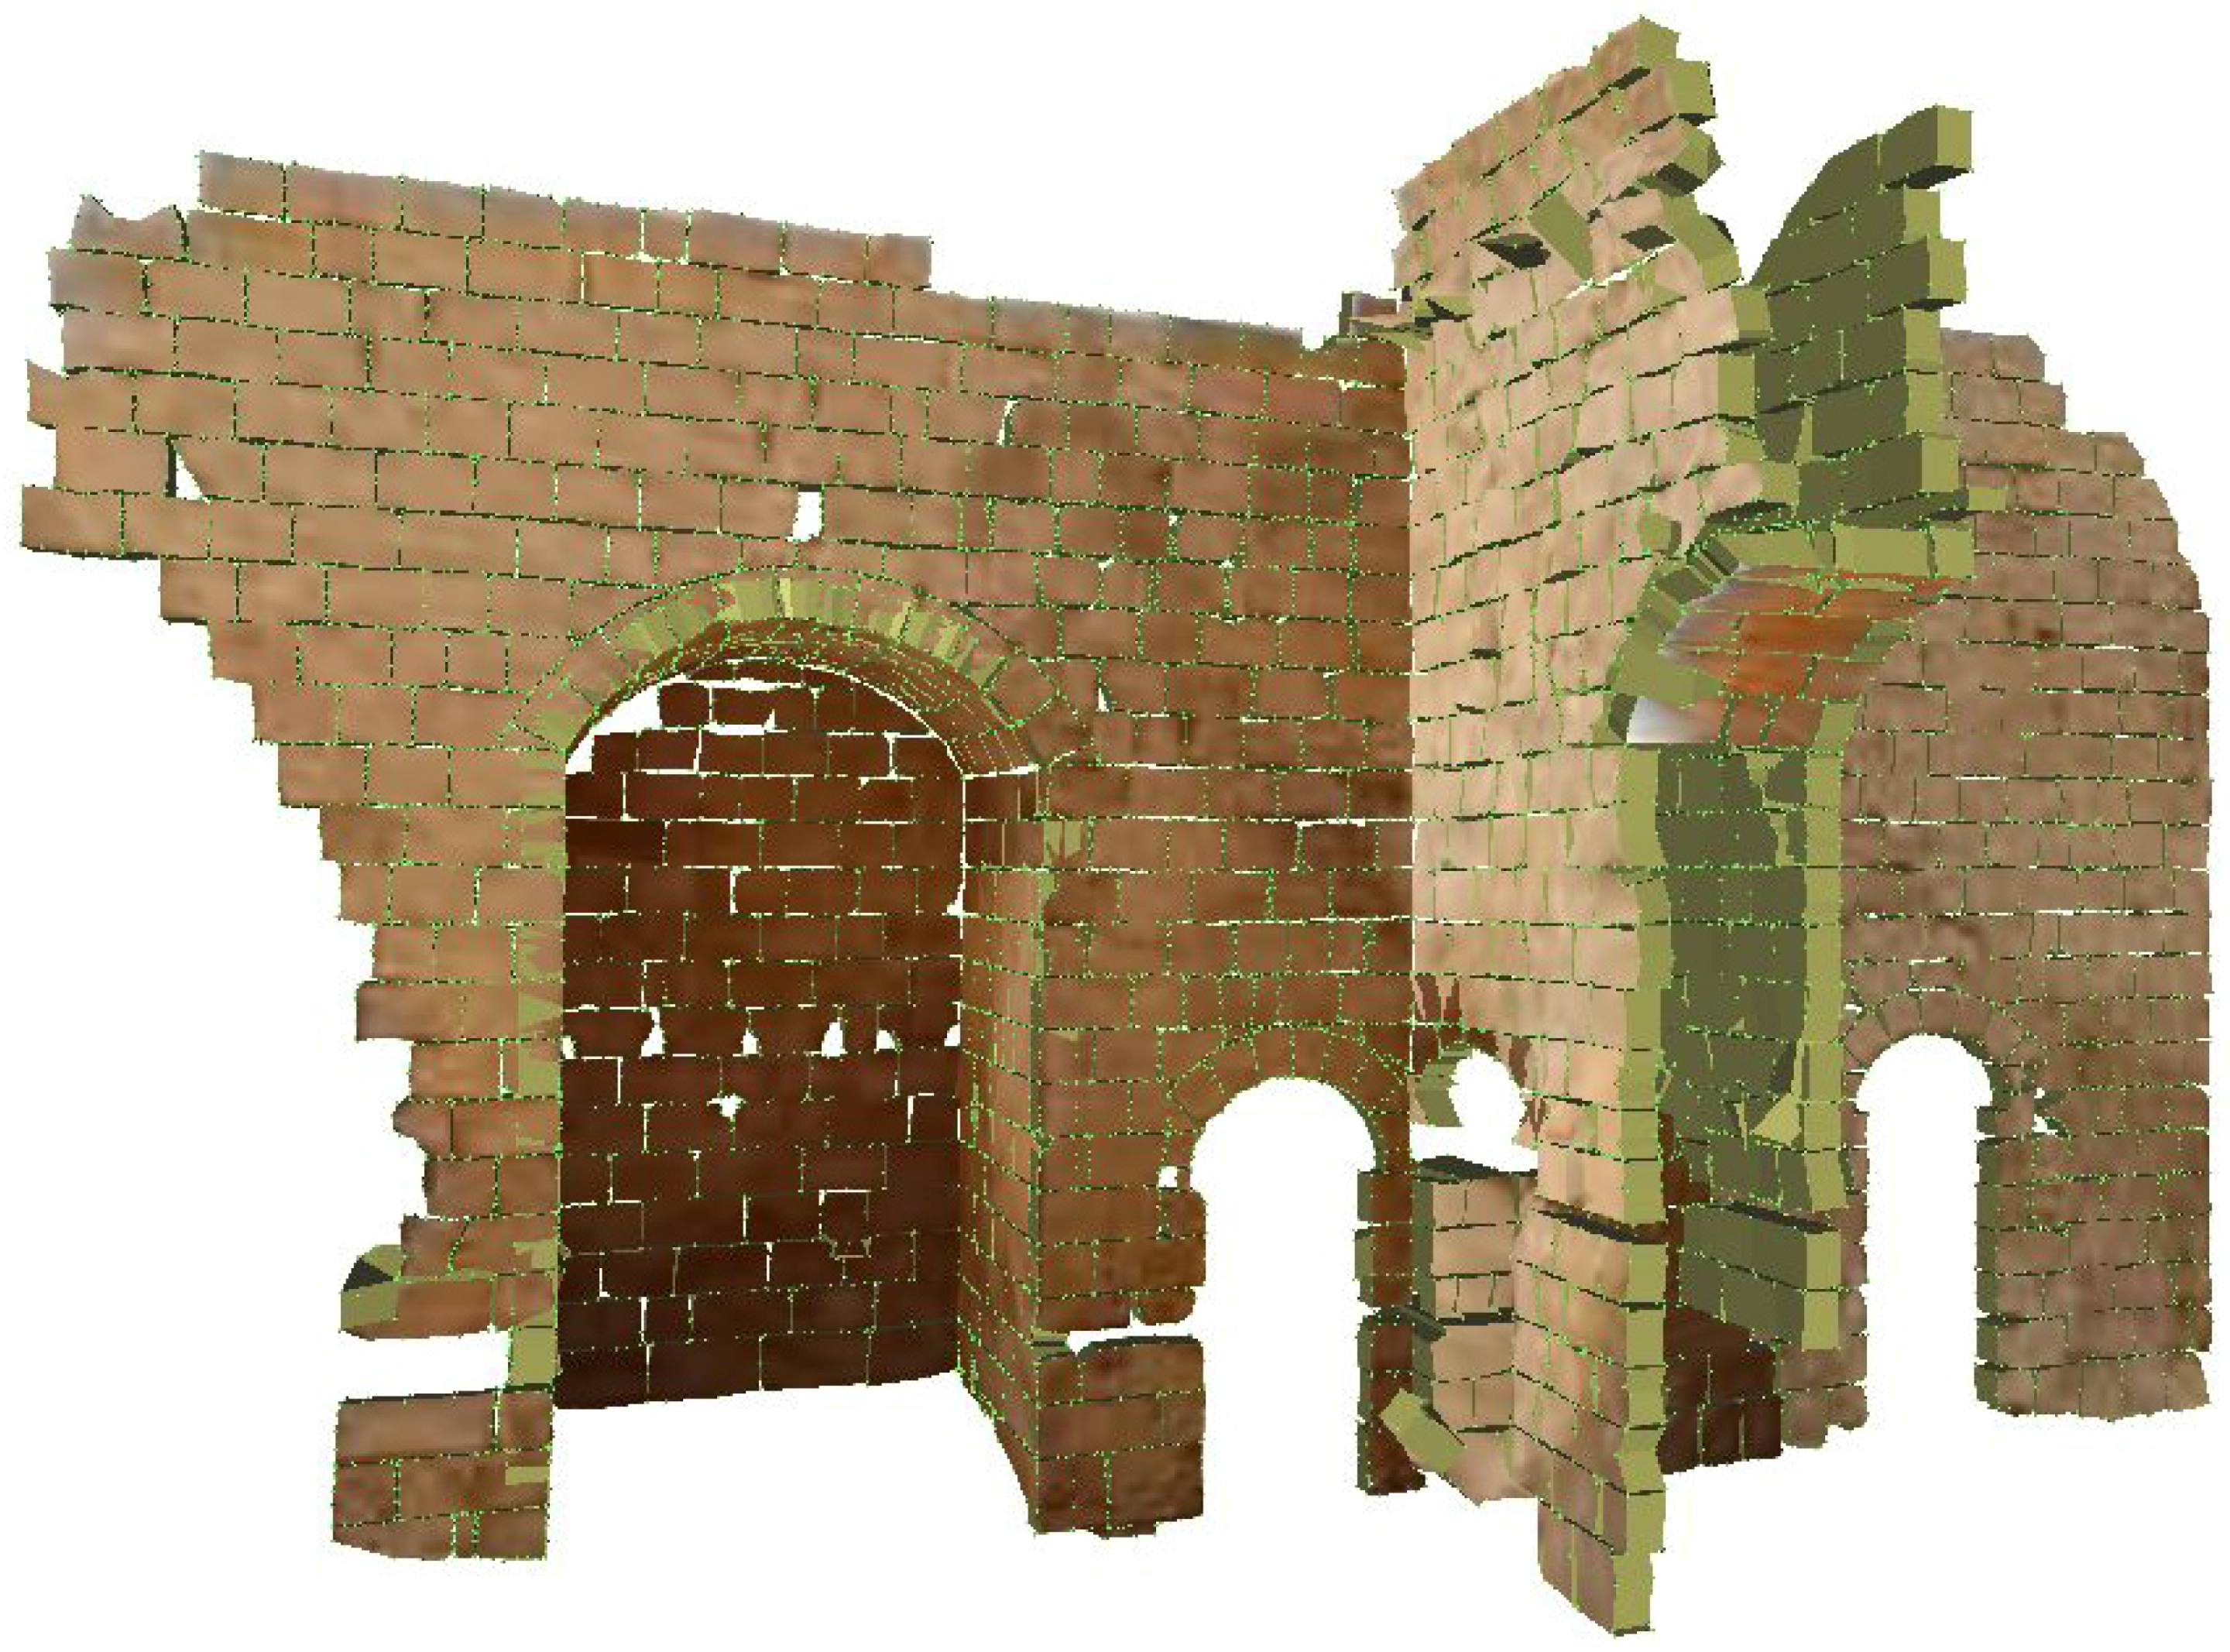
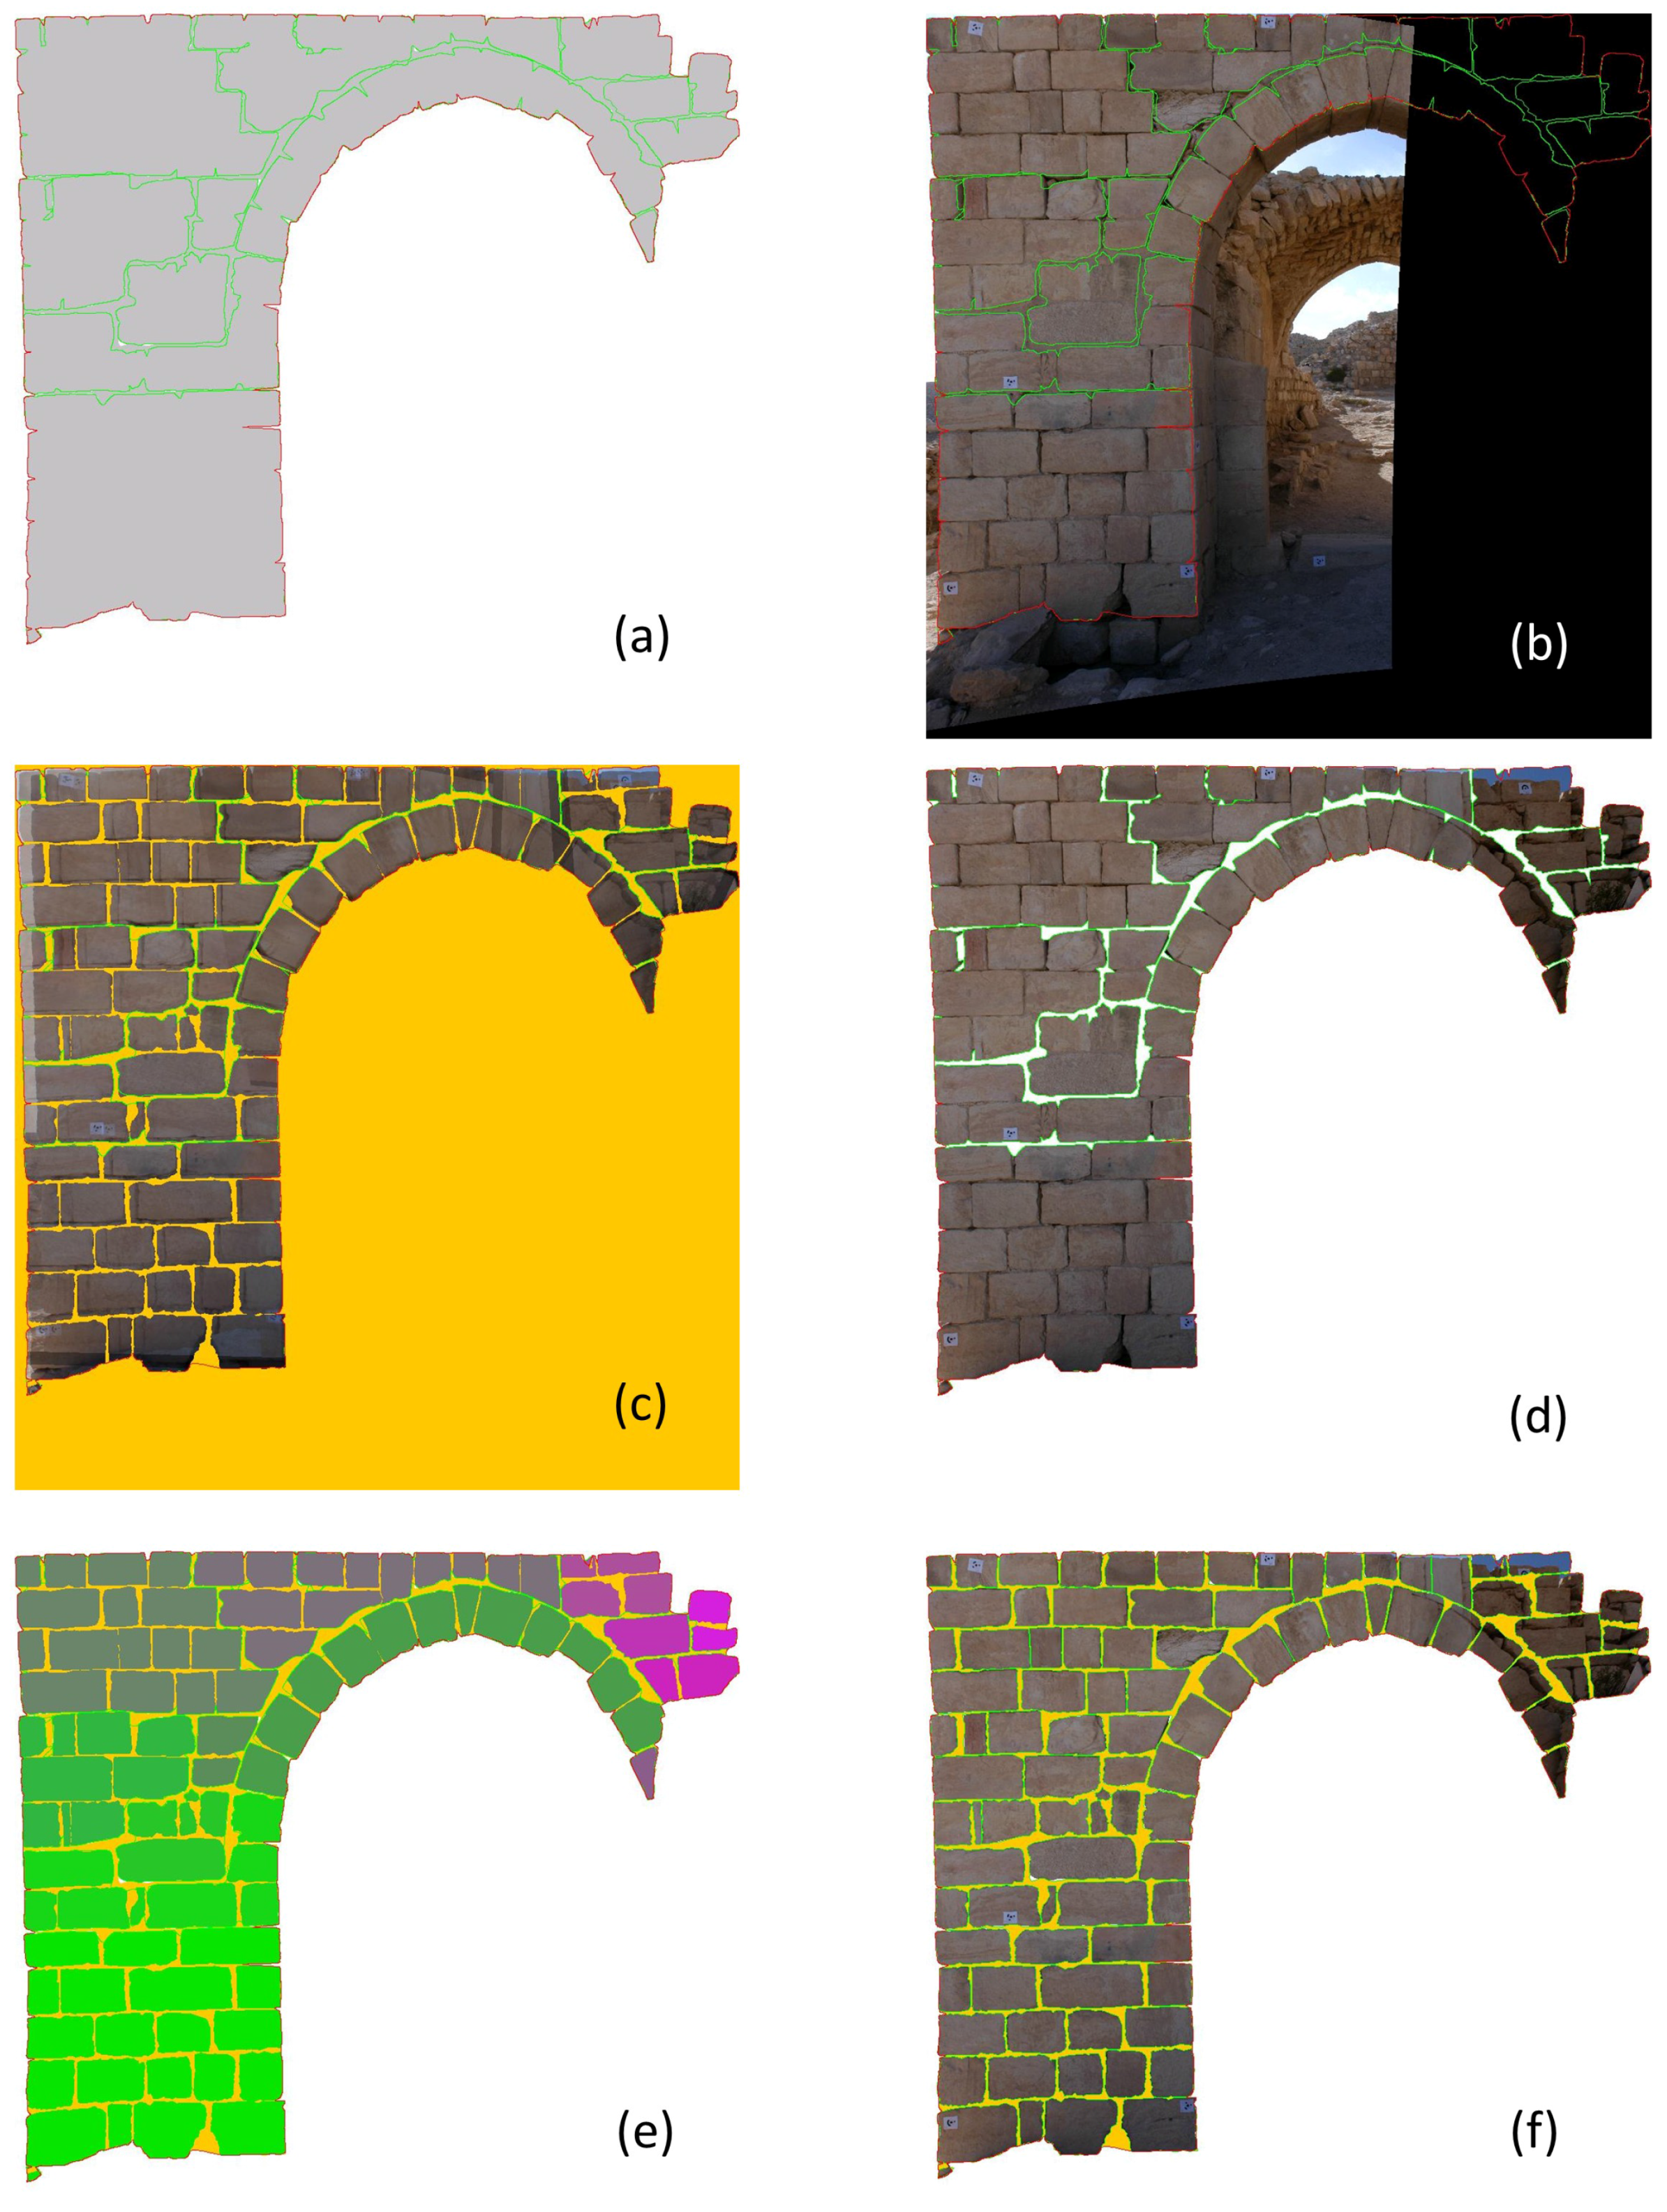
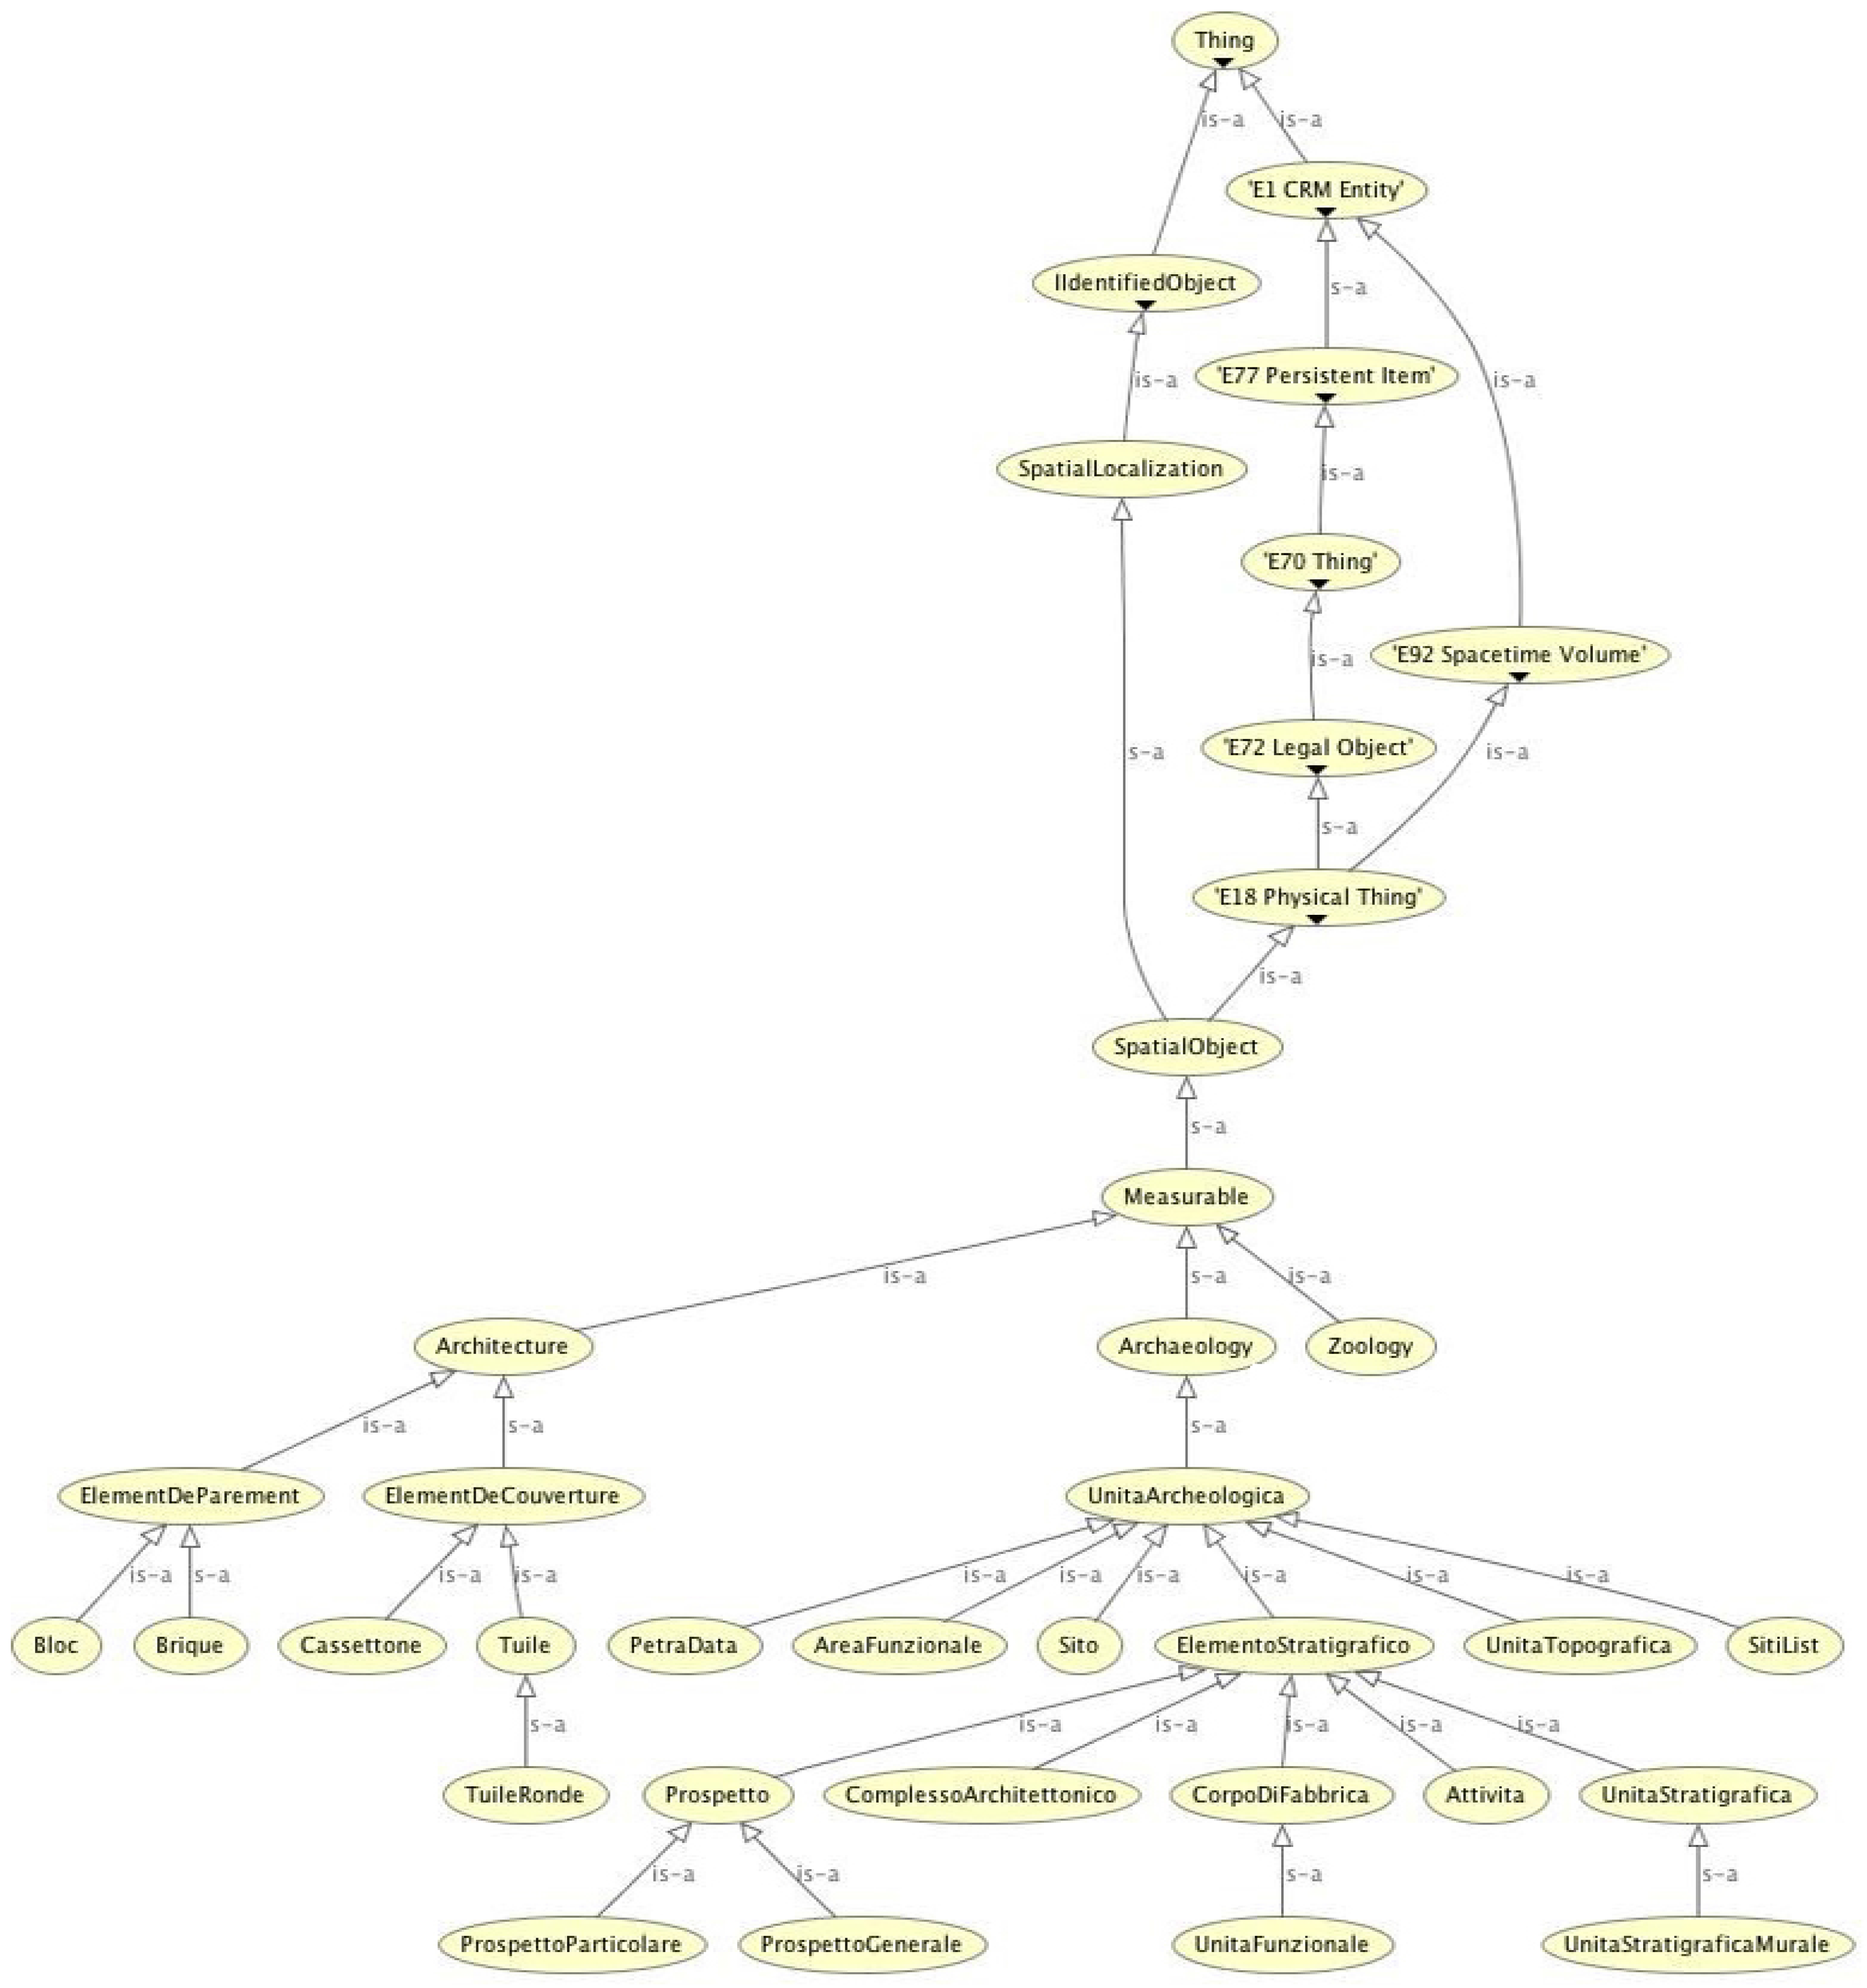
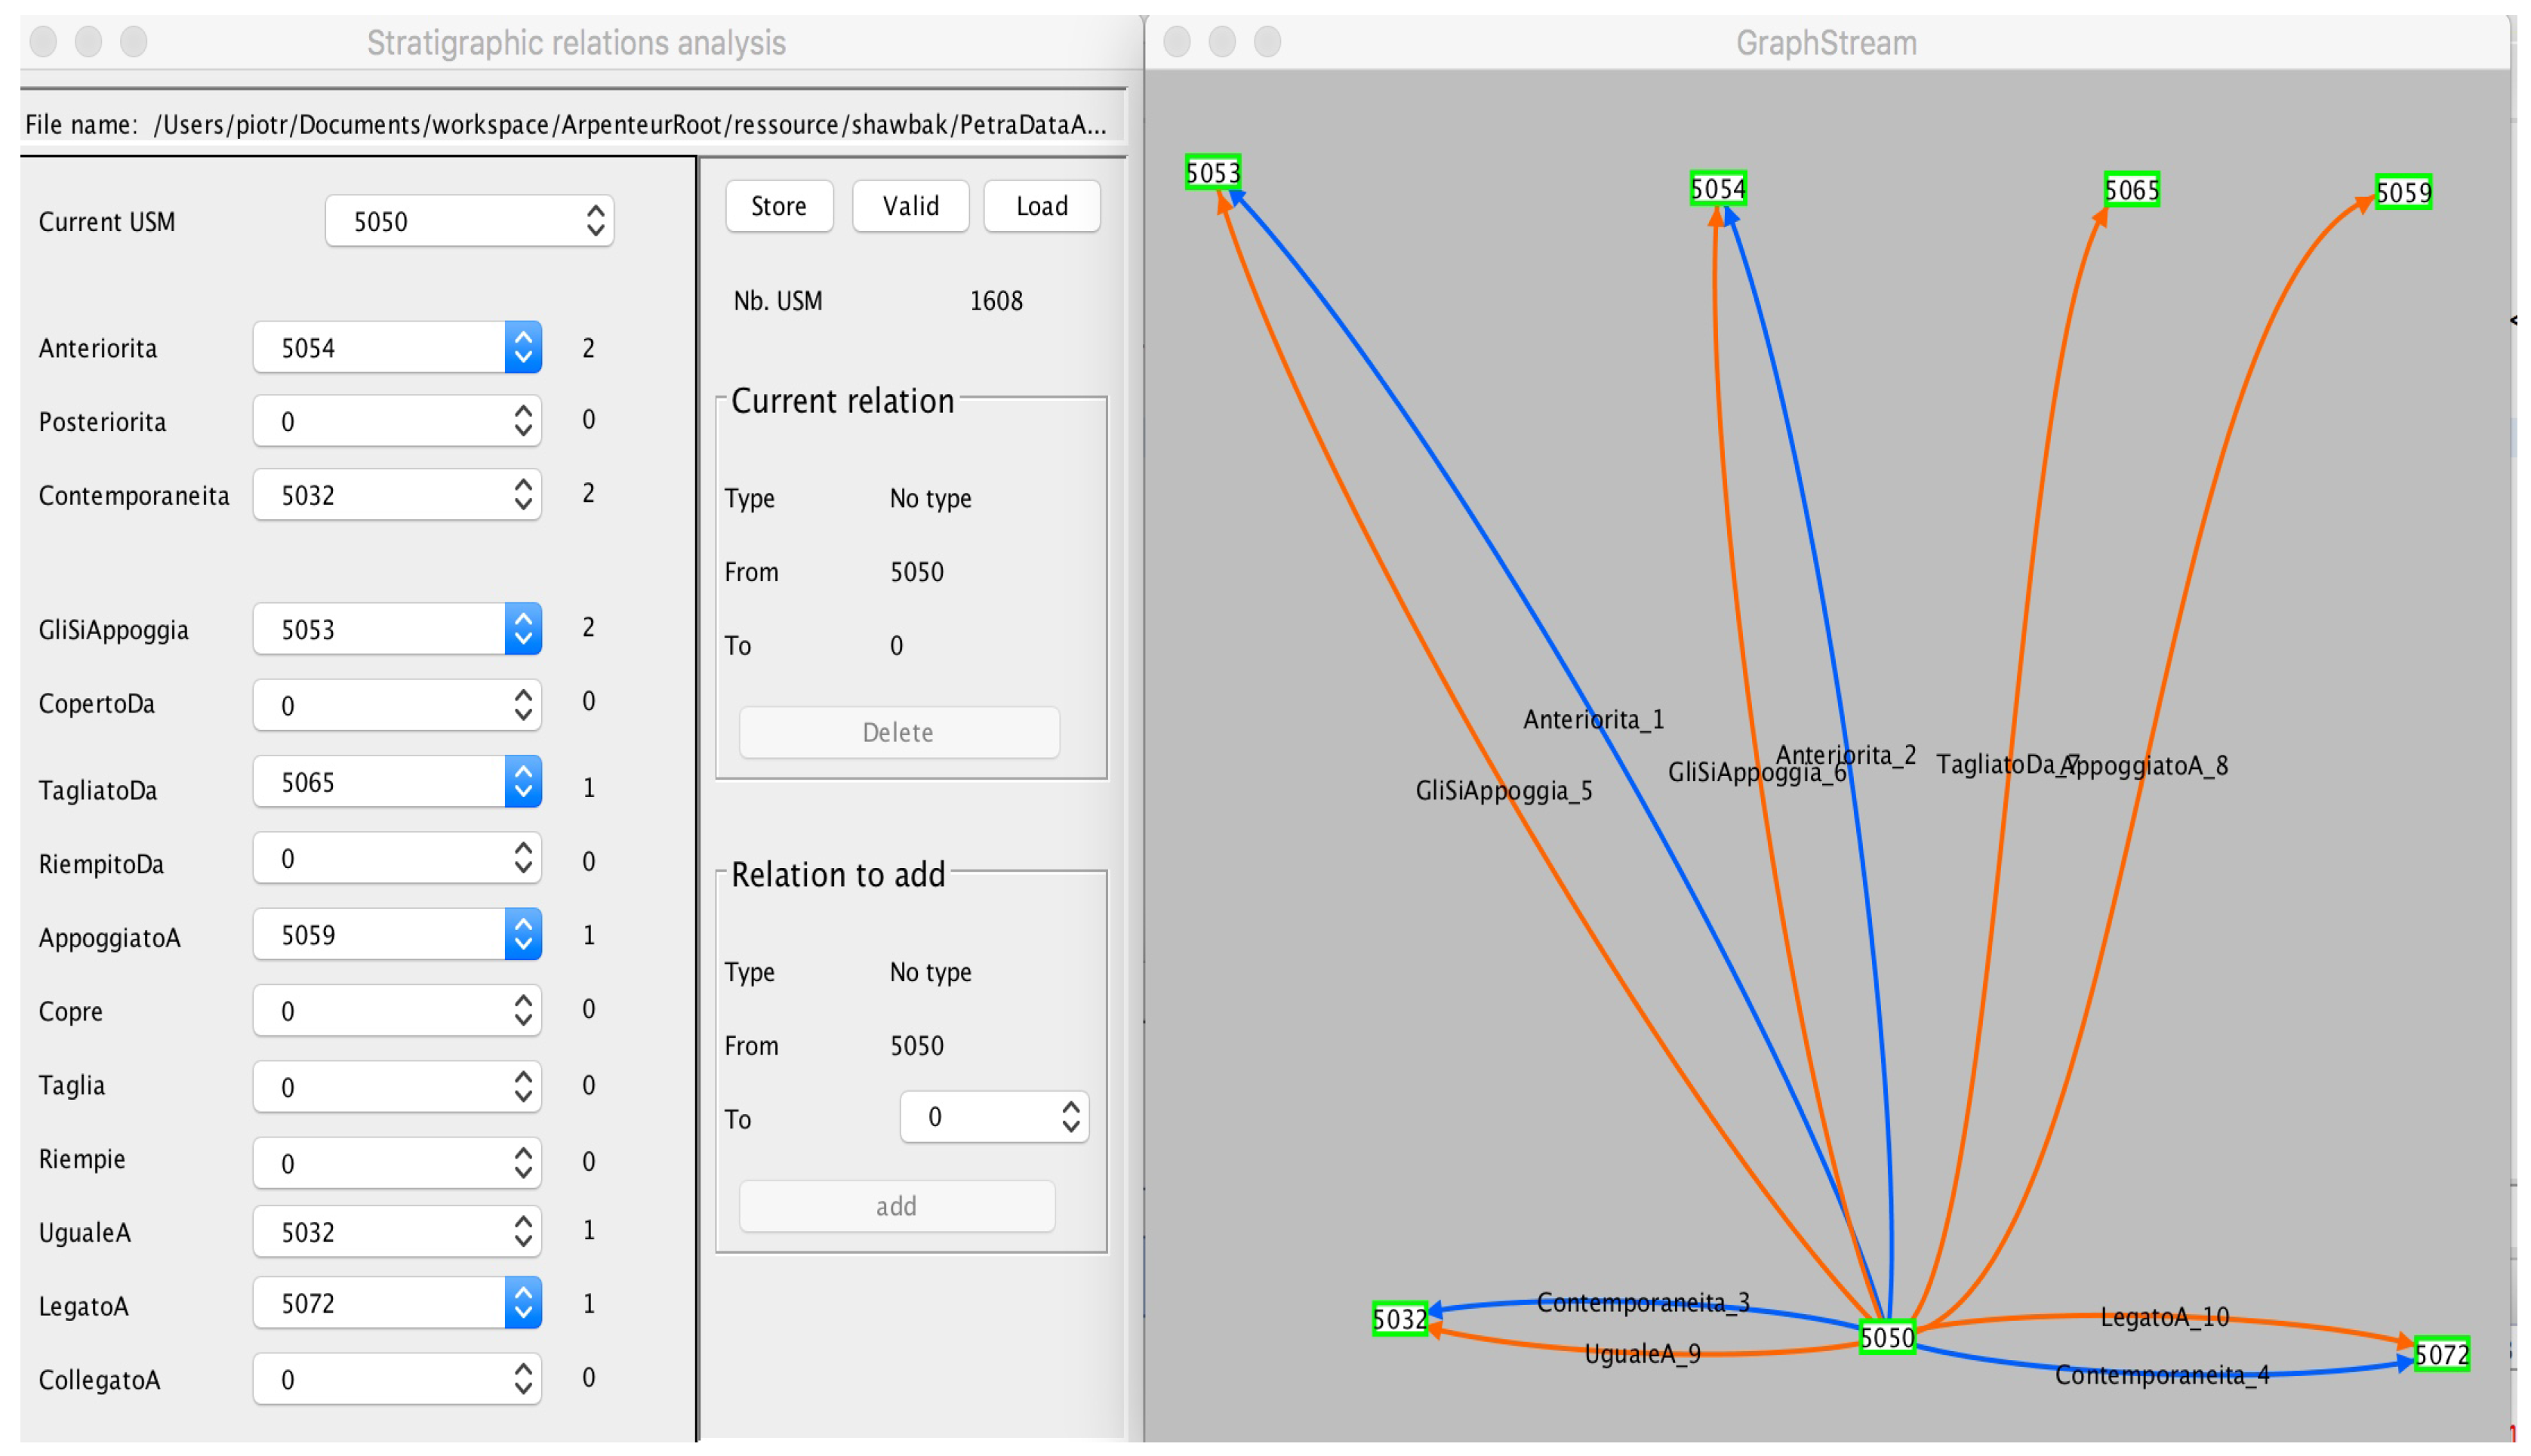
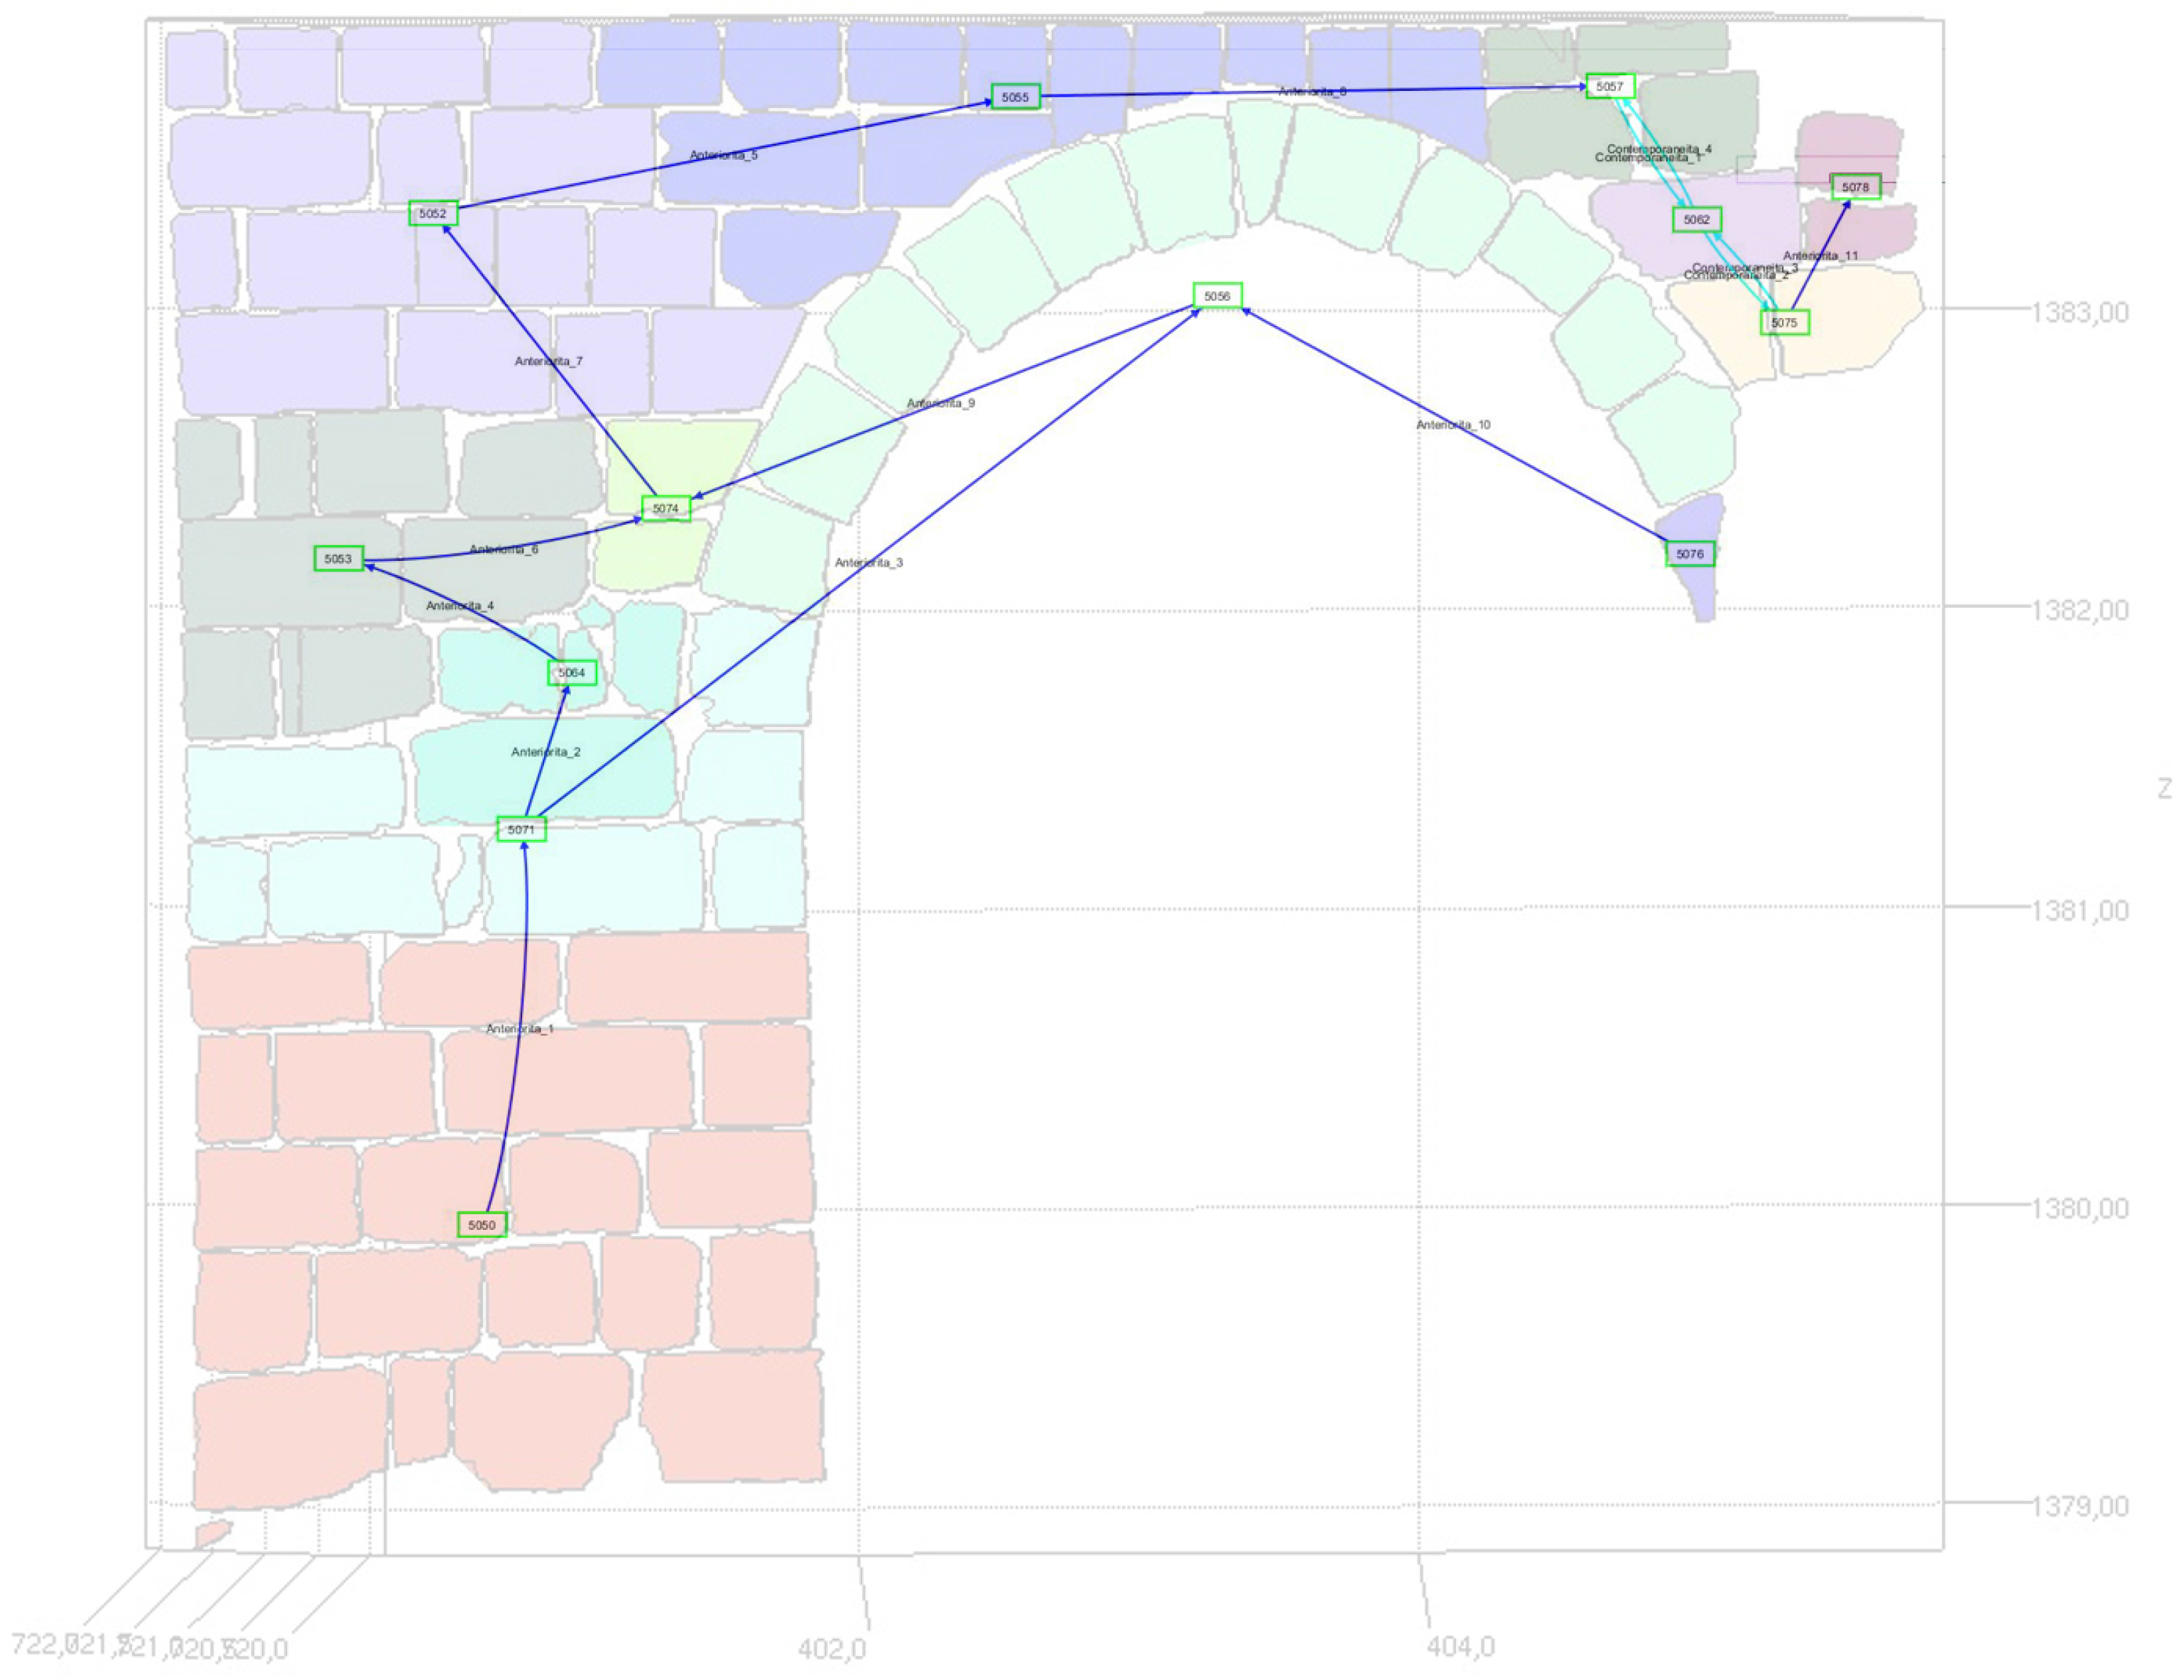
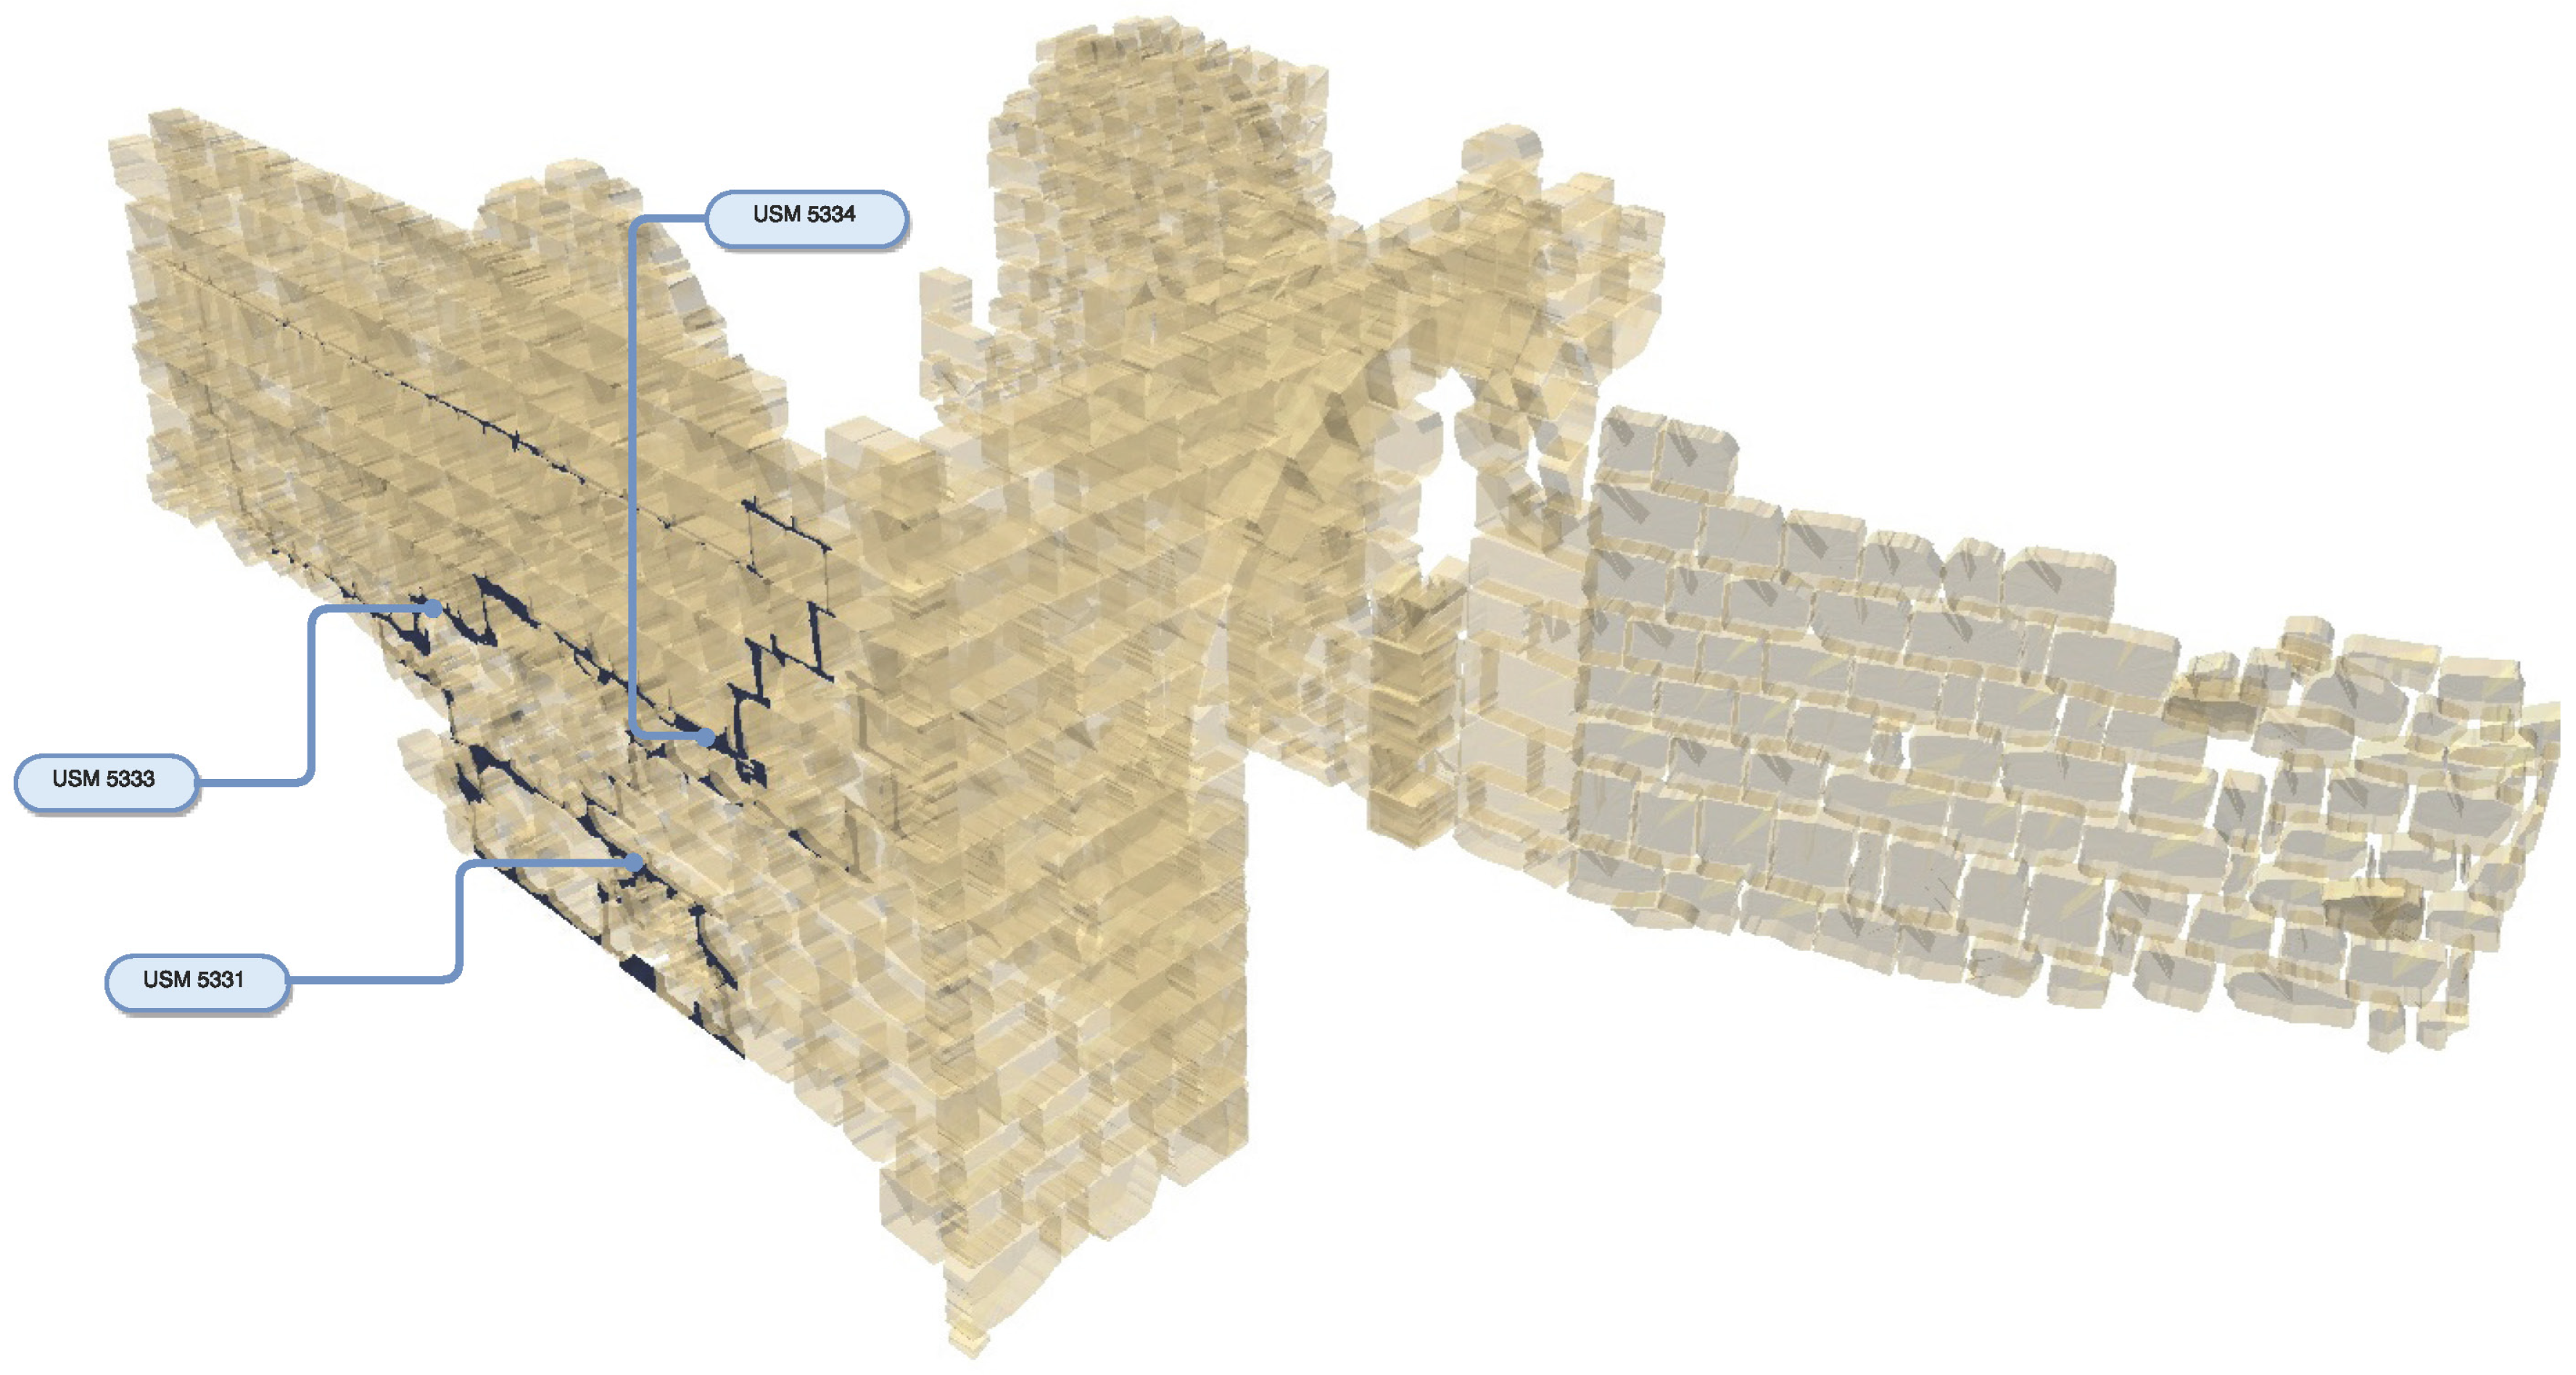
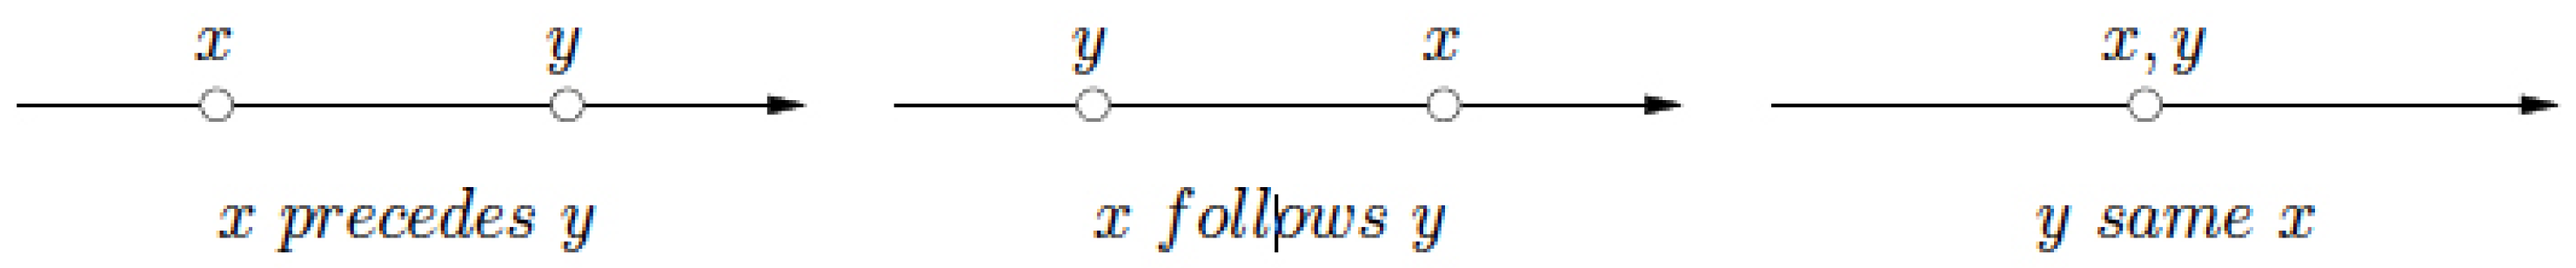
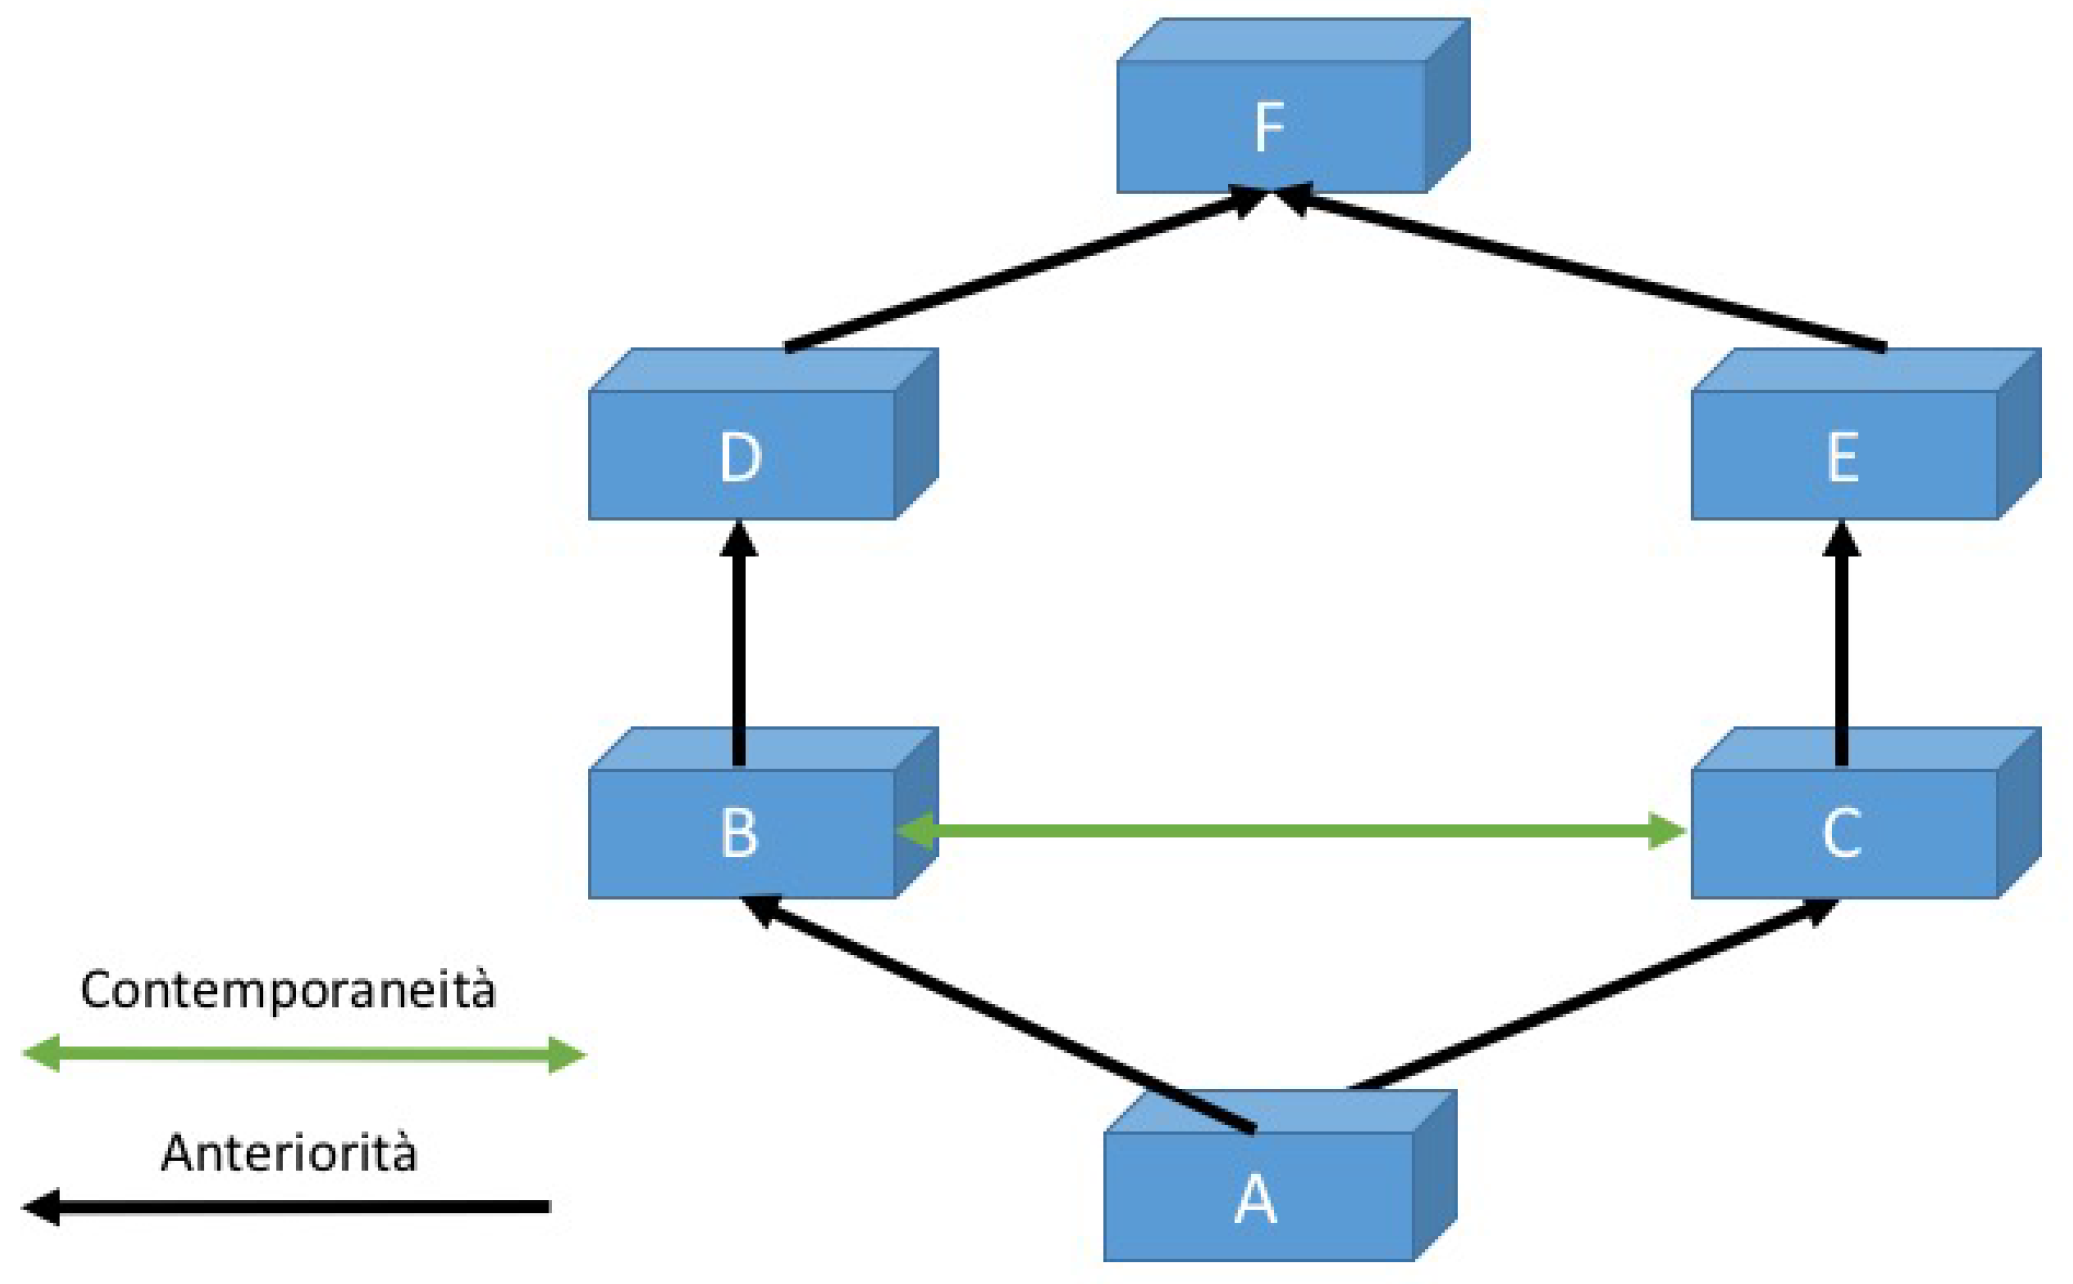
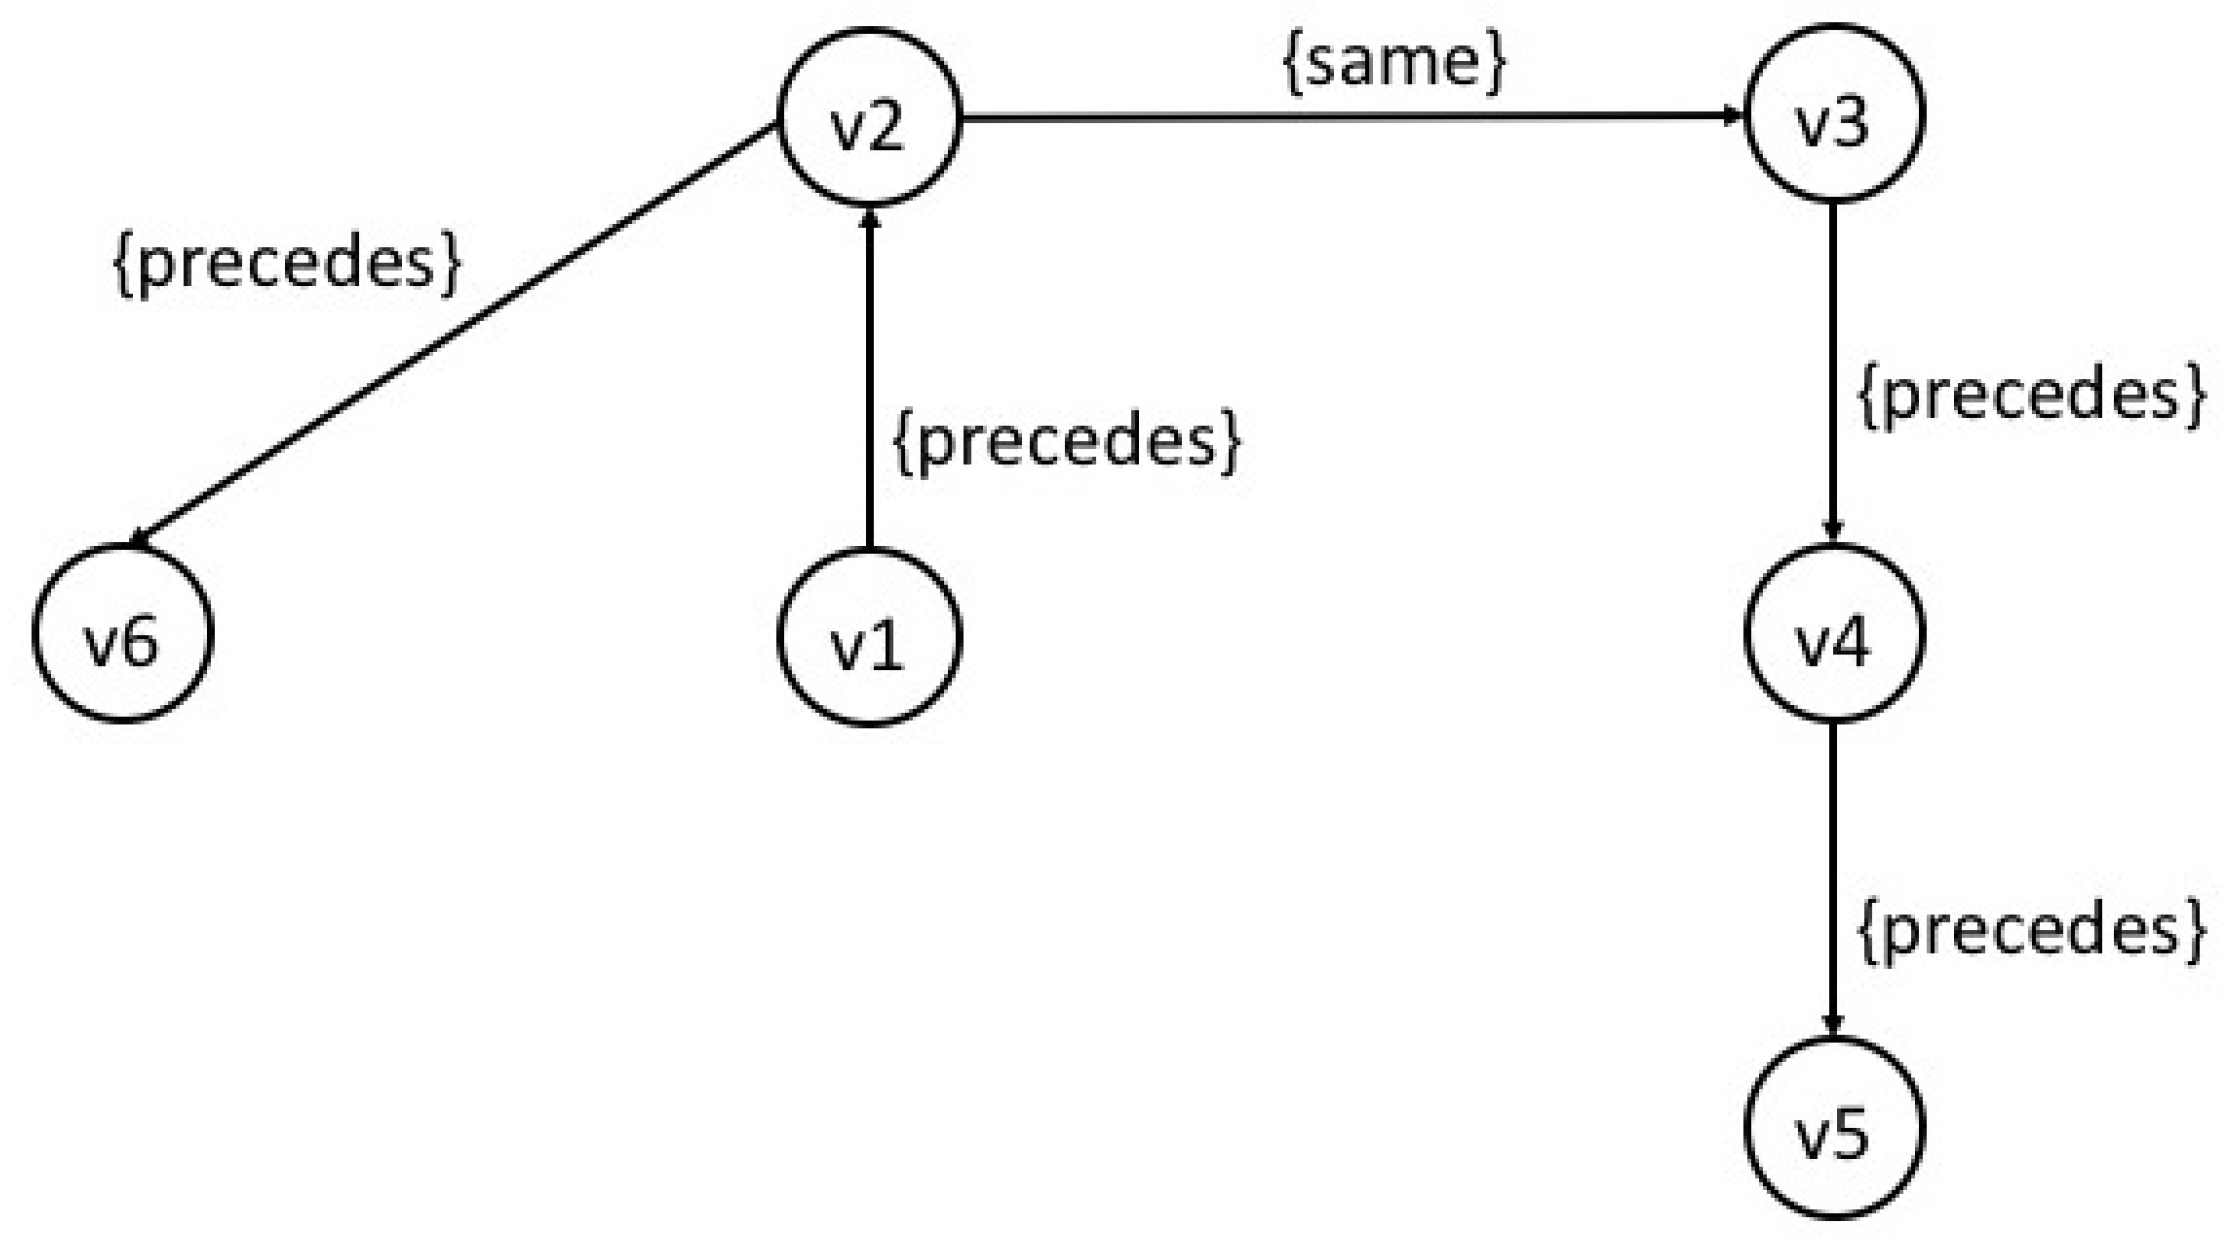
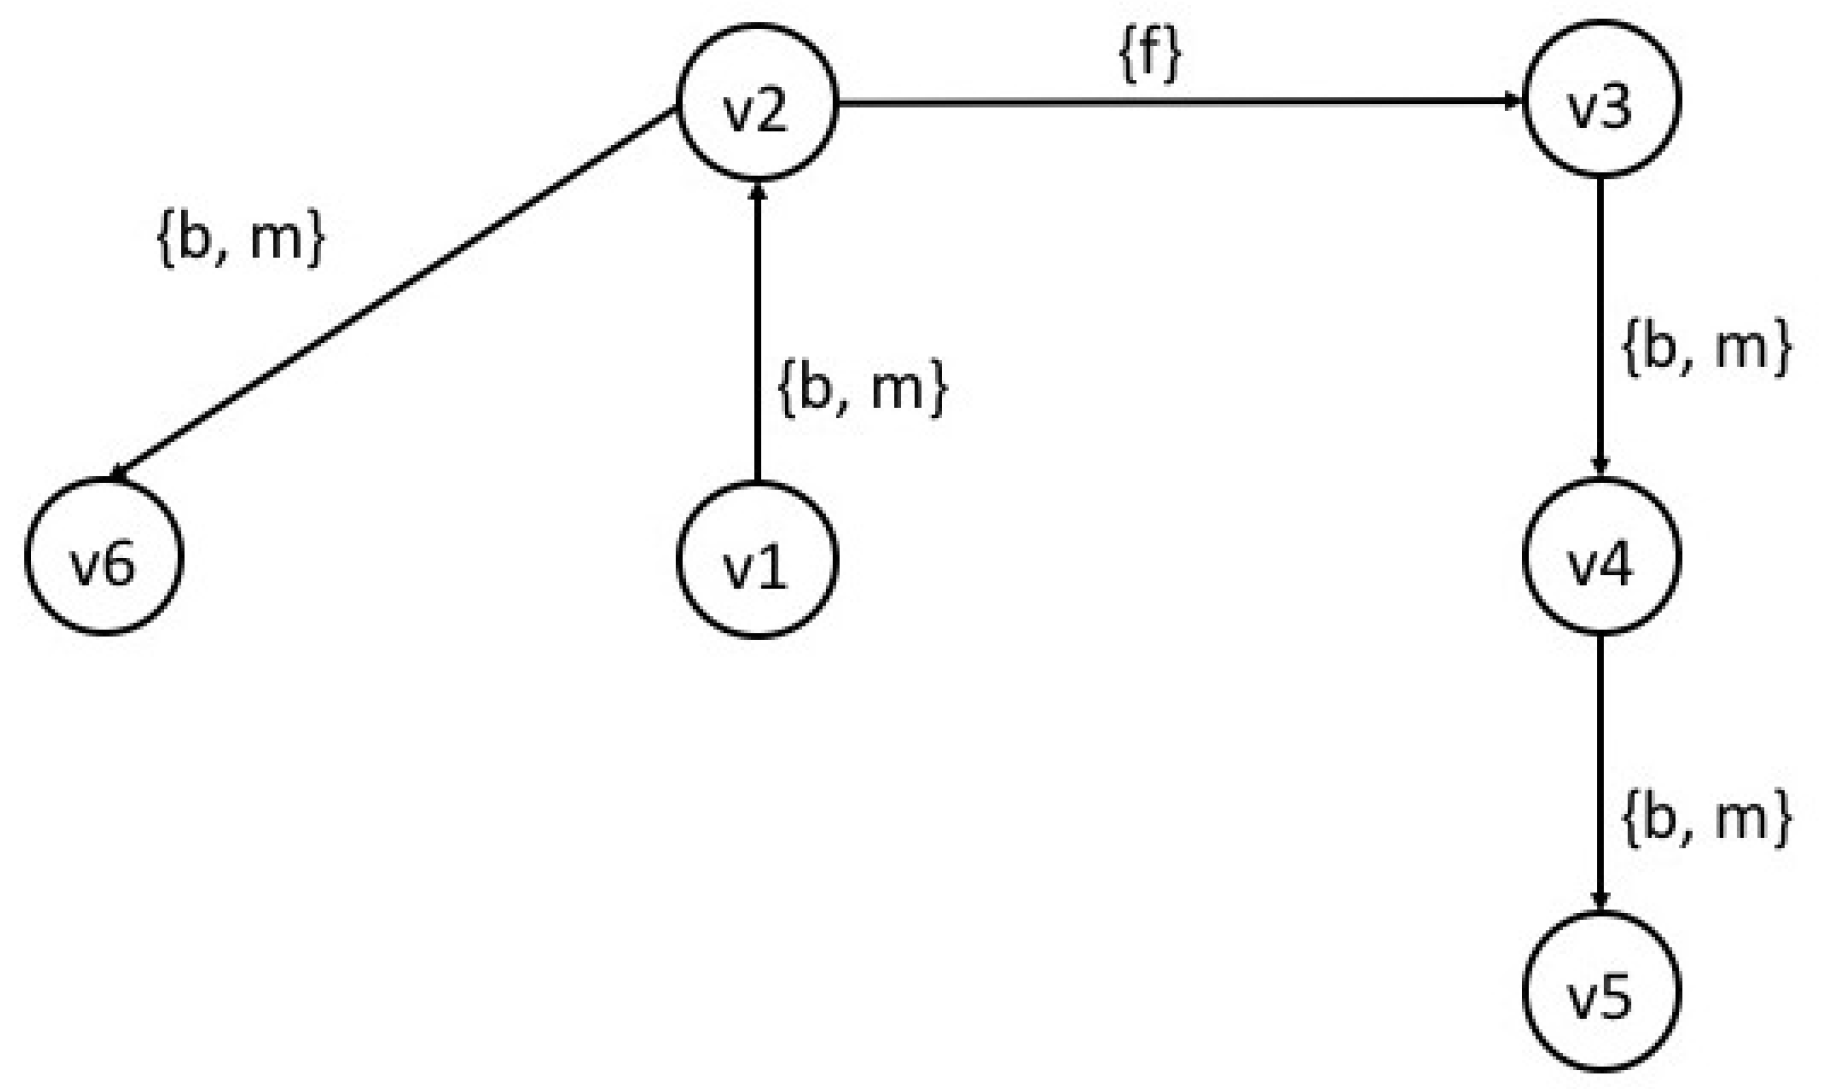
Table 1.
Link between physical and stratigraphical relations.
| Physical Relations | Stratigraphical Relations |
|---|---|
| Gli si appoggia (ad A si appoggia B) | A Anteriore B |
| Coperto da (A coperto da B) | A Anteriore B |
| Tagliato da (A tagliato da B) | A Anteriore B |
| Riempito da (A riempito da B) | A Anteriore B |
| Appoggiato a (A appoggiato a B) | A Posteriore B |
| Copre (A copre B) | A Posteriore B |
| Taglia (A taglia B) | A Posteriore B |
| Riempie (A riempie B) | A Posteriore B |
| Uguale a (A uguale a B) | A Contemporaneo B |
| Legato a (A legato a B) | A Contemporaneo B |
| Collegato a (A collegato a B) | A Contemporaneo B |
Table 2.
Harris relations seen from an interval point of view.
| Stratigraphical Relations | Start and End of US |
|---|---|
| A Contemporaneo B | A = B |
| A Anteriore B | A anterior B |
| A Anteriore B | A = B |
| A Posteriore B | B anterior A |
| A Posteriore B | B = A |
Table 3.
From Harris to Allen.
| n | (Harris) Physical Relations | (Harris) Stratigraphical Relation | Allen (More Than One Relation Is Possible) |
|---|---|---|---|
| 1 | It leans on (y leans on x) Appoggiato a (y appoggiato a x) | y is later than x y Posteriorità x | y preceded by x y met by x |
| 2 | leaned on by (x is leaned on by y) Gli si appoggia (ad x si appoggia y) | x is earlier than y x Anteriorita y | x precedes y x meets y |
| 3 | It connects (x is connected with y) CollegatoA (ad x si CollegatoA y) | x is contemporary to y x Contemporaneo y | x equals y x starts y x during y x finishes y |
| 4 | Linked to (x is linked to y) Legato a (x è legato a y) | x is contemporary to y x Contemporaneo y | x equals y x starts y x during y x finishes y |
| 5 | Covered by (y is covered by x) Coperto da (y è coperto da x) | x is earlier than y x Anteriorita y | y preceded by x y meet by x y overlaped by x |
| 6 | It covers (x covers y) Copre (x copre y) | x is later than y x Posteriorità y | x precedes y x meets y x overlaps y |
| 7 | It fills (x fills y) Riempie (x riempie y) | x is later than y x Posteriorità y | x preceded by y |
| 8 | Filled by (y is filled by x) Riempito da (y è riempito da x) | y is earlier than x y Anteriorita x | y preceded x |
| 9 | It cuts (x cuts y) Taglia (x taglia y) | x is later than y x Posteriorità y | x preceded by y |
| 10 | Cut by (y is cut by x) Tagliato da (y è tagliato da x) | y is earlier than x y Anteriorita x | y precedes x |
| 11 | Equal to (x is equal to y) Uguale a (x è uguale a y) | x is contemporary to y x Contemporaneo y | x equals y |
Table 4.
From Allen to Harris.
| n | Allen | Harris (Physical) | Harris (Temporal) | Example |
|---|---|---|---|---|
| 1 | x precedes y y preceded by x  | (a) x covers y Copre y is covered by da x Coperto da (b) x fills up y Riempie y is filled up by x Riempito da | (a) x is later than y y is earlier than x (b) x is later than y y is earlier than x | (a) Construction of upper floor, preparation layer of a brick floor, etc. (b) Filling of a wall post-hole; filling of a door, window, arch, etc. |
| 2 | x meets y y met by x  | x leans on y Gli si appoggia y is leaned on by x Appoggiato a | x is earlier than y y is later than x | Consecutive building phases. Until now, we are not be able to distinguish between meets and overlaps. We use for both subsequent and anteriority. |
| 3 | x overlaps y y overlapped by x  | x leans on y Gli si appoggia y is leaned on by x Appoggiato a | x is earlier than y y is later than x | Building of wall and angle wall in the same phase; generally speaking, every time, we are in front of USM built in the same phase Until now, we were not able to distinguish between MEETS and OVERLAPS. We use for both subsequent and anteriority. |
| 4 | x starts y y started by x  | x is linked to y Legato a y is linked to x Legato a | x is contemporary to y y is contemporary to x | Two linked walls (their building is started at the same time, but we cannot know if they are also finished at the same time); wall and arch (both are started at the same moment, but one of them is finished before the other): we cannot recognize this stratigraphically, so we use the contemporary relationship. |
| 5 | x during y y contains x  | x cuts y Taglia y is cut by x Tagliato da | x is later than y y is earlier than x | Cut in a wall to realize a post-hole or a window or a door in the same building phase of a wall. |
| 6 | x finishes y y finished by y  | x is linked with y Legato a y is linked with x Legato a | x is contemporary to y y is contemporary to x | Two walls linked with “wait joint” ashlars. |
| 7 | X equals y | X equals y UgualeA | x is contemporary to y | Post-hole equal for typology and for function. |
Table 5.
Harris physical and temporal relation definition.
| n | Harris Relation | Definition |
|---|---|---|
| 1 | It is leaned against (y is leaned against x) Appoggiato a (y appoggiato a x) | One US A is ‘AppoggiatoA’ on a US B if: A is in contact with B; A is ‘Posteriorità’ to B; There is a horizontal plane that touches both A and B. This connection is mainly used to define the physical relationship between walls or between layers and structures (between US and USM). |
| 2 | It leans against (x leans against y) Gli si appoggia (ad x si appoggia y) | A US A ‘GliSiAppoggia’ a US B if: A is in contact with B; A is ‘anteriorità’ B; there is a horizontal plane that touches both A and B. This connection is mainly used to define the physical relationship between walls or between layers and structures (between US and USM) |
| 3 | It connects (x is connected with y) CollegatoA (ad x si CollegatoA y) | A US A is ‘CollegatoA’ to a US B if: A can be in contact with B or there is a third US in contact with both A and B; A is ‘contemporaneita’ with B; this connection describes a link, for example, in the case of two wall edges crossed by a passing bridge pit. Used only for USM. This is a ternary relationship where the US responsible for the link does not exist, or no longer exists, or is not observable. |
| 4 | Linked to (x is linked to y) Legato a (x è legato a y) | One US A is ‘LegatoA’ to US B if: A is in contact with B; A is ‘contemporaneita’ with B; the convex volumes of A and B intersect. Often designed to merge A and B. Only used for USM. |
| 5 | Covered by (y is covered by x) Coperto da (y è coperto da x) | A US A is ‘CopertoDa’ by a US B if: A is in contact with B; A is ‘anteriorita’ to B; there is a vertical plane passing through both A and B. This connection is mainly used to define the physical relationship between layers and/or structures (between US and USM). |
| 6 | It covers (x covers y) Copre (x copre y) | A US ‘Copre’ a US B if: A is in contact with B; A is ‘posteriorita’ to B; there is a veritable plane passing through both A and B. This connection is mainly used to define the physical relationship between layers and/or structures (between US and USM). |
| 7 | It fills (x fills y) Riempie (x riempie y) | A US A ‘Riempie’ US B if: A is in contact with B; B has a solid concavity, even partially from A. B is generally, but not always, a negative US. |
| 8 | Filled by (y is filled by x) Riempito da (y è riempito da x) | A US A is ‘RiempitoDa’ a US B if: A is in contact with B; A is partially or in totality concave and even partially filled by B. A is generally, but not always, a negative US. |
| 9 | It cuts (x cuts y) Taglia (x taglia y) | A US ‘Taglia’ a US B if: A and in contact with B; it physically subtracts material from B, and A is a negative US. |
| 10 | Cut by (y is cut by x) Tagliato da (y è tagliato da x) | A US A is ‘TagliatoDa’ US B if: A is in contact with B; A was physically subtracted from material B, and B is a negative US. |
| 11 | Equal to (x is equal to y) Uguale a (x è uguale a y) | A US A is ‘UgualeA’ to US B if: A is not necessarily in contact with B; A is consecutive to B; A and B are physically the same US, but there may be a physical discontinuity between them. |
| 12 | x is earlier than y x Anteriorita y | An USM A is ‘Anteriorita’ to USM B if A is formed before USM B |
| 13 | x is contemporary to y x Contemporaneo y | A USM A is in ‘Contemporaneita’ with B if A and B have been formed at the same time. |
| 14 | x is later than y x Posteriorità y | An USM A is in ‘Posteriorita’ compared to B if A was formed when B was already formed. Posteriority |
© 2017 by the authors. Licensee MDPI, Basel, Switzerland. This article is an open access article distributed under the terms and conditions of the Creative Commons Attribution (CC BY) license (http://creativecommons.org/licenses/by/4.0/).
Share and Cite
MDPI and ACS Style
Drap, P.; Papini, O.; Pruno, E.; Nucciotti, M.; Vannini, G. Ontology-Based Photogrammetry Survey for Medieval Archaeology: Toward a 3D Geographic Information System (GIS). Geosciences 2017, 7, 93. https://doi.org/10.3390/geosciences7040093
AMA Style
Drap P, Papini O, Pruno E, Nucciotti M, Vannini G. Ontology-Based Photogrammetry Survey for Medieval Archaeology: Toward a 3D Geographic Information System (GIS). Geosciences. 2017; 7(4):93. https://doi.org/10.3390/geosciences7040093
Chicago/Turabian StyleDrap, Pierre, Odile Papini, Elisa Pruno, Micchele Nucciotti, and Guido Vannini. 2017. "Ontology-Based Photogrammetry Survey for Medieval Archaeology: Toward a 3D Geographic Information System (GIS)" Geosciences 7, no. 4: 93. https://doi.org/10.3390/geosciences7040093
Note that from the first issue of 2016, this journal uses article numbers instead of page numbers. See further details here.