1. Introduction
Geophysical prospection has proved to be a useful tool in helping archaeologists improving their knowledge of archaeological sites. In last decades, their use has notably grown and specialized literature has been developped (e.g., [
1,
2,
3,
4,
5]).
Thanks to the improvement in both the sensitivity of the sensors and the spacial resolution of the acquired data, high fidelity images of the subsurface can be now produced. Moreover, the development of multichannel geophysical systems allows large areas to be surveyed in a moderately short time (e.g., [
6,
7,
8,
9]).
The archaeological interpretation of geophysical data consists in offering plausible explanations for anomalies detected by geophysical systems [
10], and is one of the challenges of the archaeological geophysics. Indeed, many scenarios can generate a similar geophysical response and, in most circumstances, it is the expert knowledge of the surveyor, alongside insight into the site’s geophysical and archaeological characteristics, which guides further interpretation. However, any interpretation process is limited and the possibility of scenarios with erroneous or inaccurate interpretations should be considered.
In most cases, the validation through excavation would be the best option in order to check the interpretations. Nevertheless, it is not always possible, particularly in commercial projects, or only a small fraction of the surveyed area can be excavated. Often the least invasive approach is preferred, particularly in non-threatened sites. The sediment core survey is less invasive and less time-consuming than archaeological trenches. Therefore, more anomalies can be checked with this method, which is one of the benefits of this methodology. However, the amount of recovered information is highly dependent on the drilled location and, due to the limited view of sediments, interpretation problems can arise [
11]. Therefore, the context is more limited than the archaeological trenches and it could not be sufficient for answering some questions.
This paper analyzes the validity of geoarchaeological survey to check the archaeological interpretations based on geophysical results, as an extension of a previous contribution [
12].
1.1. The Background of the Research
The sediment core survey is a broadly used technique to characterize the stratigraphical sequence in geological investigation. After the 1970s, it has also been extensively used in archaeological research [
11]. A typical application is related to the reconstruction of the past landscape and its relationship to archaeological record (e.g., [
13,
14]). In some projects, sediment coring is used as a cost-effective archaeological evaluation tool to delineate archaeological sites, analyse sediment or soil sequences and built geoarchaeological site formation models, which can be used to support subsequent excavation work or further research (e.g., [
11,
15,
16]).
Some studies combine the use of geoarchaeological and geophysical investigations, but relative few studies have described the use of core sampling to target geophysical anomalies and validate the archaeological interpretation based on geophysical data (e.g., [
17,
18]). In many cases, the sediment core sampling is used, together with archaeological trenches, to access to soil samples that are characterized to have complementary data or to analyse the interactions between soil physical properties and geophysical techniques (e.g., [
19,
20,
21]). Indeed, the understanding of this interactions helps improving further interpretations. However, in some low budget projects, or in commercial projects where time is a constraint, there is no access to soil characterization techniques. This paper provides an example from a Roman site, where a sediment core sampling was used to target geophysical anomalies and validate the archaeological interpretation.
The site was discovered during a walk over survey in 2008, and the archaeological trenches excavated in 2012 revealed substantial Roman masonry building foundations [
22]. Since then, geophysical survey methods have been used to delimit and characterize the settlement.
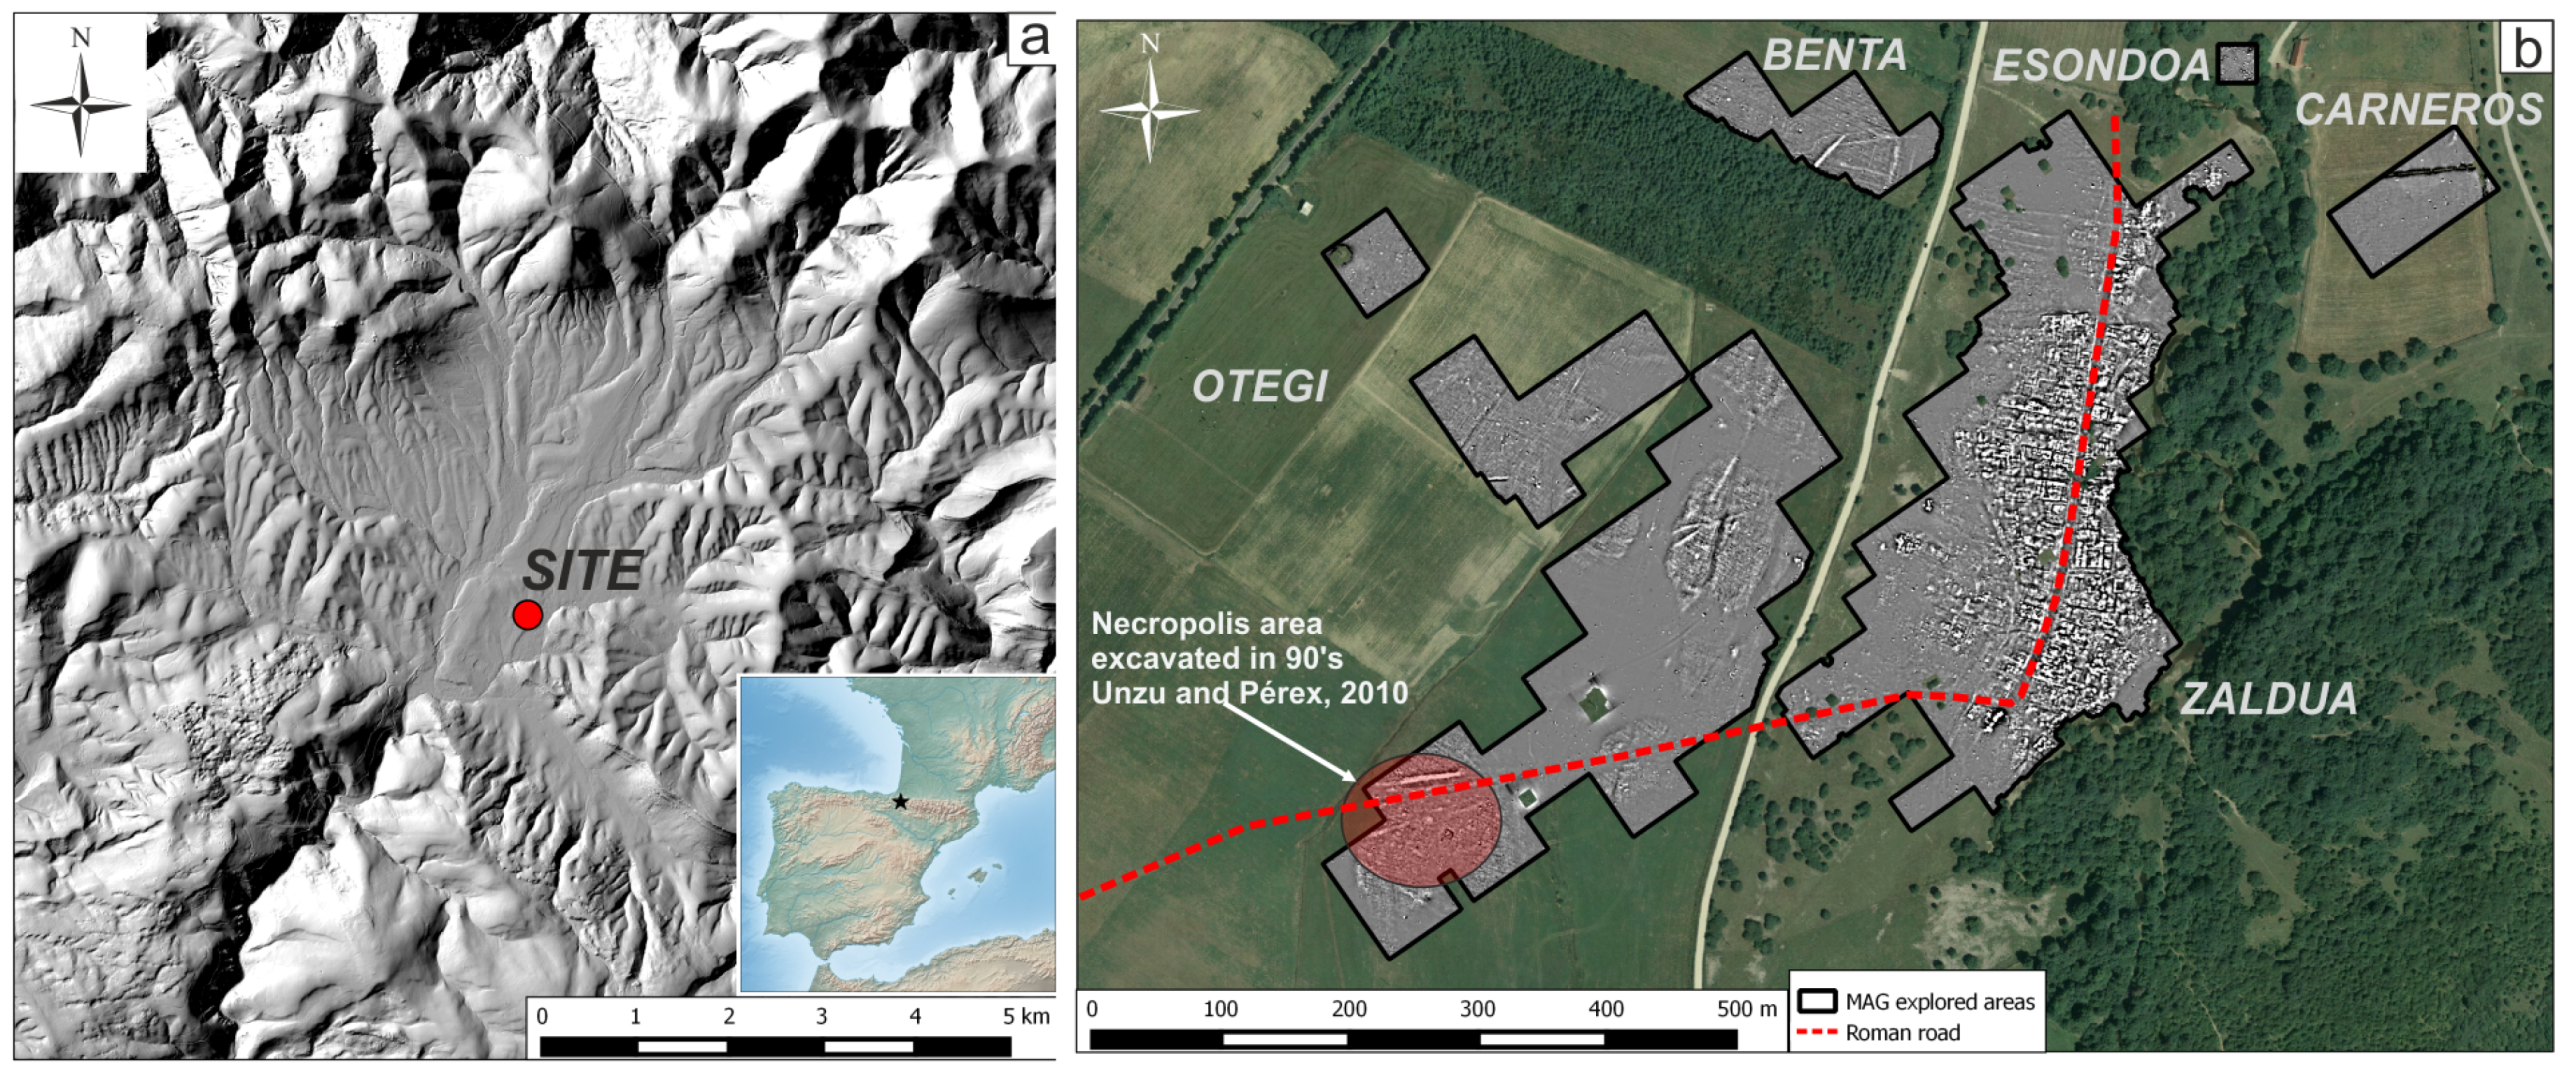
The site is situated south of the town of Auritz/Burguete, on a high plateau close to the crest line of the Pyrenees (
Figure 1a). The Pyrenees are characterized by complex structural geology and form a natural boundary between the Iberian Peninsula and the continent [
23,
24]. A number of mountain streams rise in the area to the north of the site and flow south to combine as the River Urrobi. The site is situated on the banks of this River, on a spacious plain or terrace surrounded by higher mountain peaks. Stepped, terrace topography is clear on site with the elevation dropping downwards towards and parallel to the Urrobi river in a north-south alignment along the length of the site. There is not a detailed geomorphological study of the Urrobi basin but it is known that the geological context is formed by quaternary fluvial terrace deposits of clay, silt and gravel [
25].
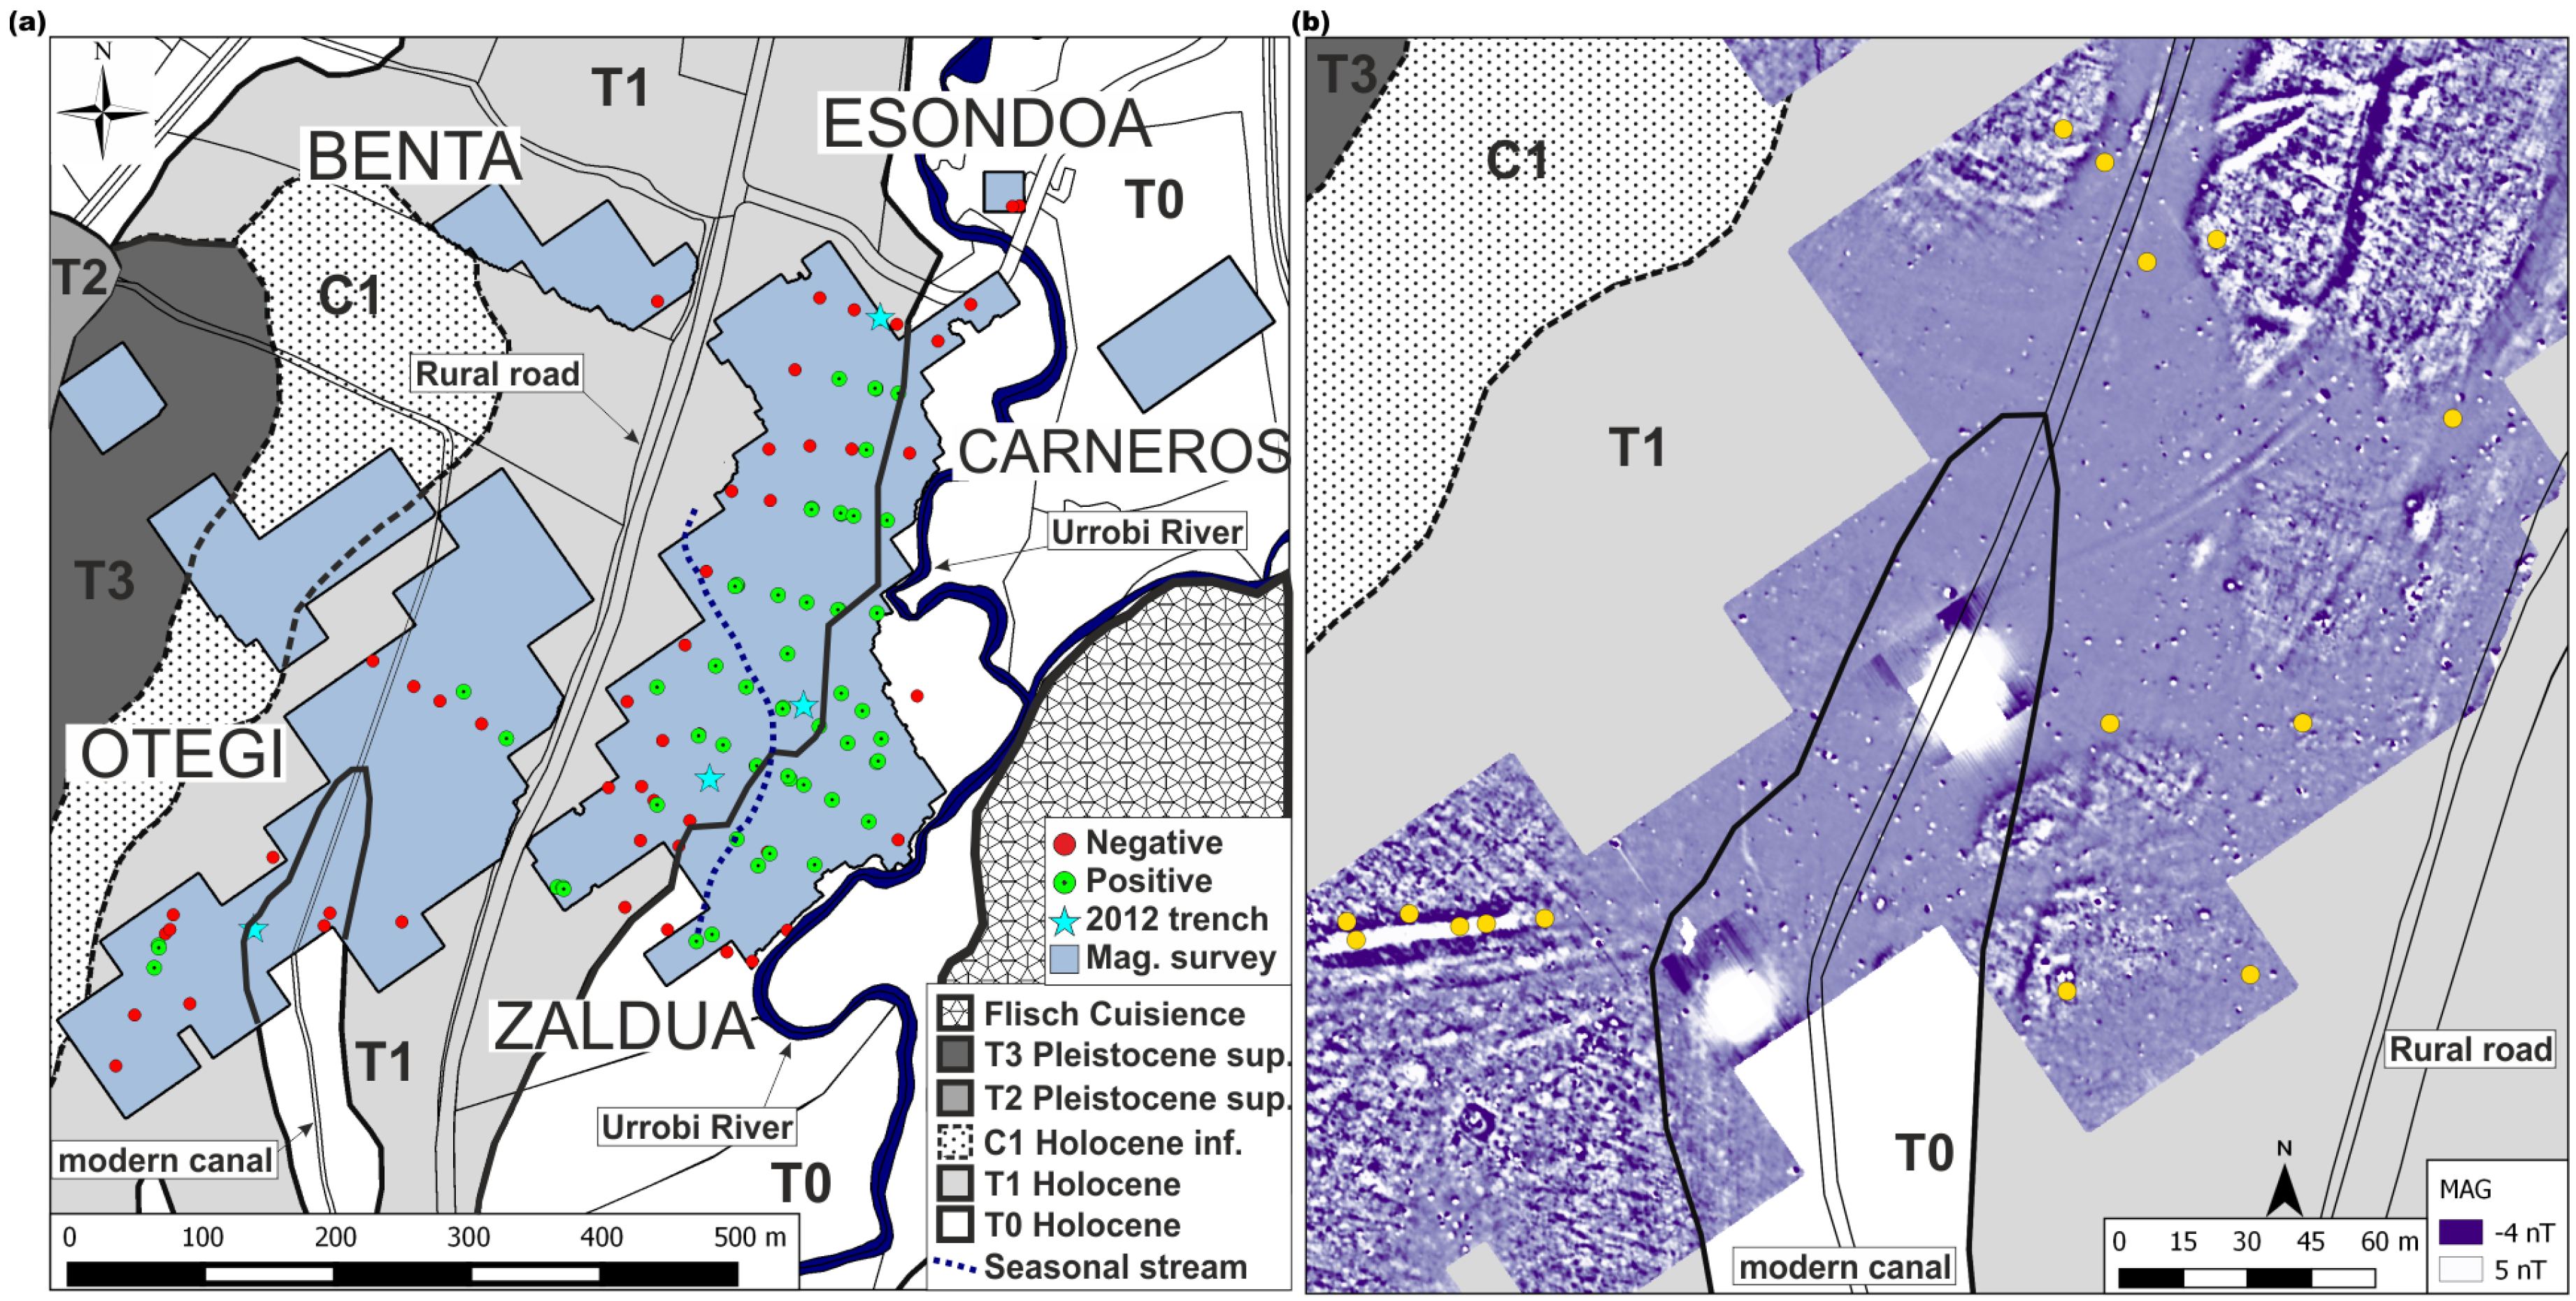
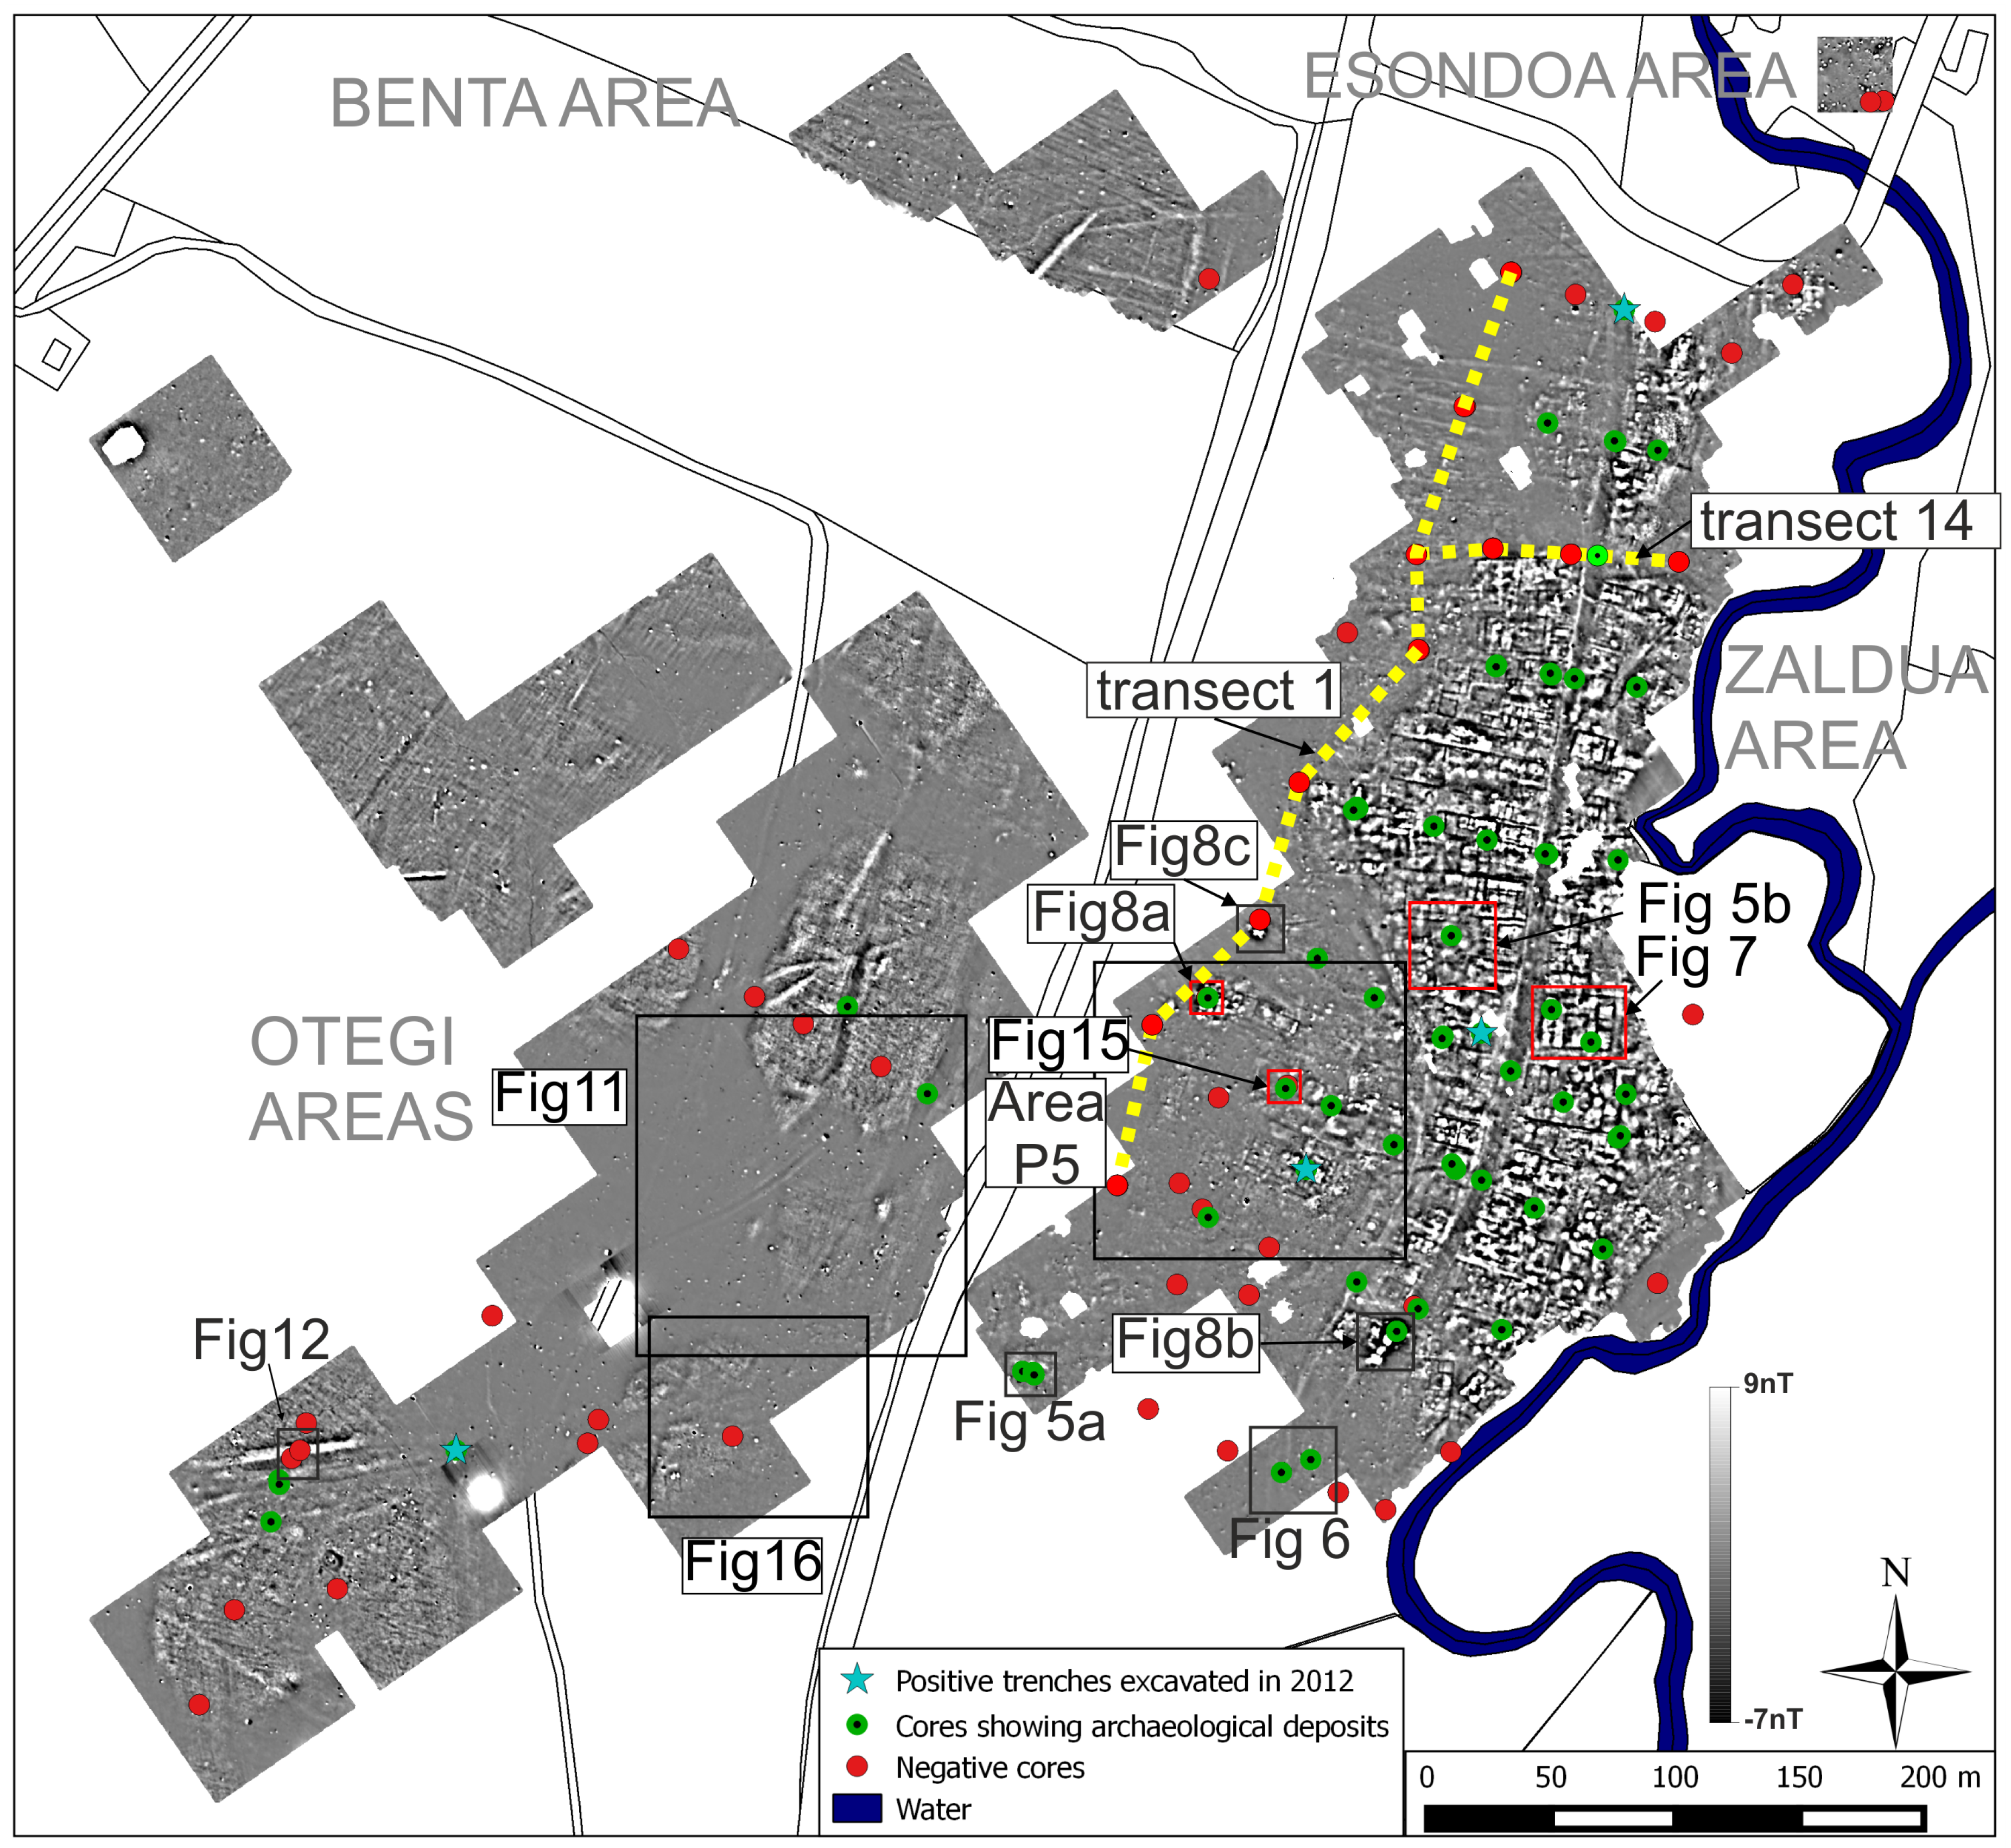
A magnetic survey performed in 2013 covered ca. 18 ha and revealed the main layout of the settlement [
26]. Results revealed differences in the magnetic response that had not been well explained and became, together with the archaeological description of the site, one of the main concerns of the investigation team (
Figure 1b).
2. Research Objectives
Following the magnetic survey, a sediment core sampling strategy was designed to refine interpretation of the prospection data. The main goal was to better characterize the archaeological deposits of the site, and to correlate the distribution and characteristics of the archaeological deposits with the magnetic response. In addition, some of the core sampling was undertaken with the specific goal of evaluating the geophysical interpretations [
27]. This paper will focus in this second goal.
Besides this, the validity of cores to identify occupation areas will be discussed on this paper.
3. Applied Methodology
The strategy is based on different techniques applied at different scale, starting from a broad context and focusing on the interesting areas for more detailed investigations (
Table 1).
The methodology and results of the magnetic survey can be found in [
26].
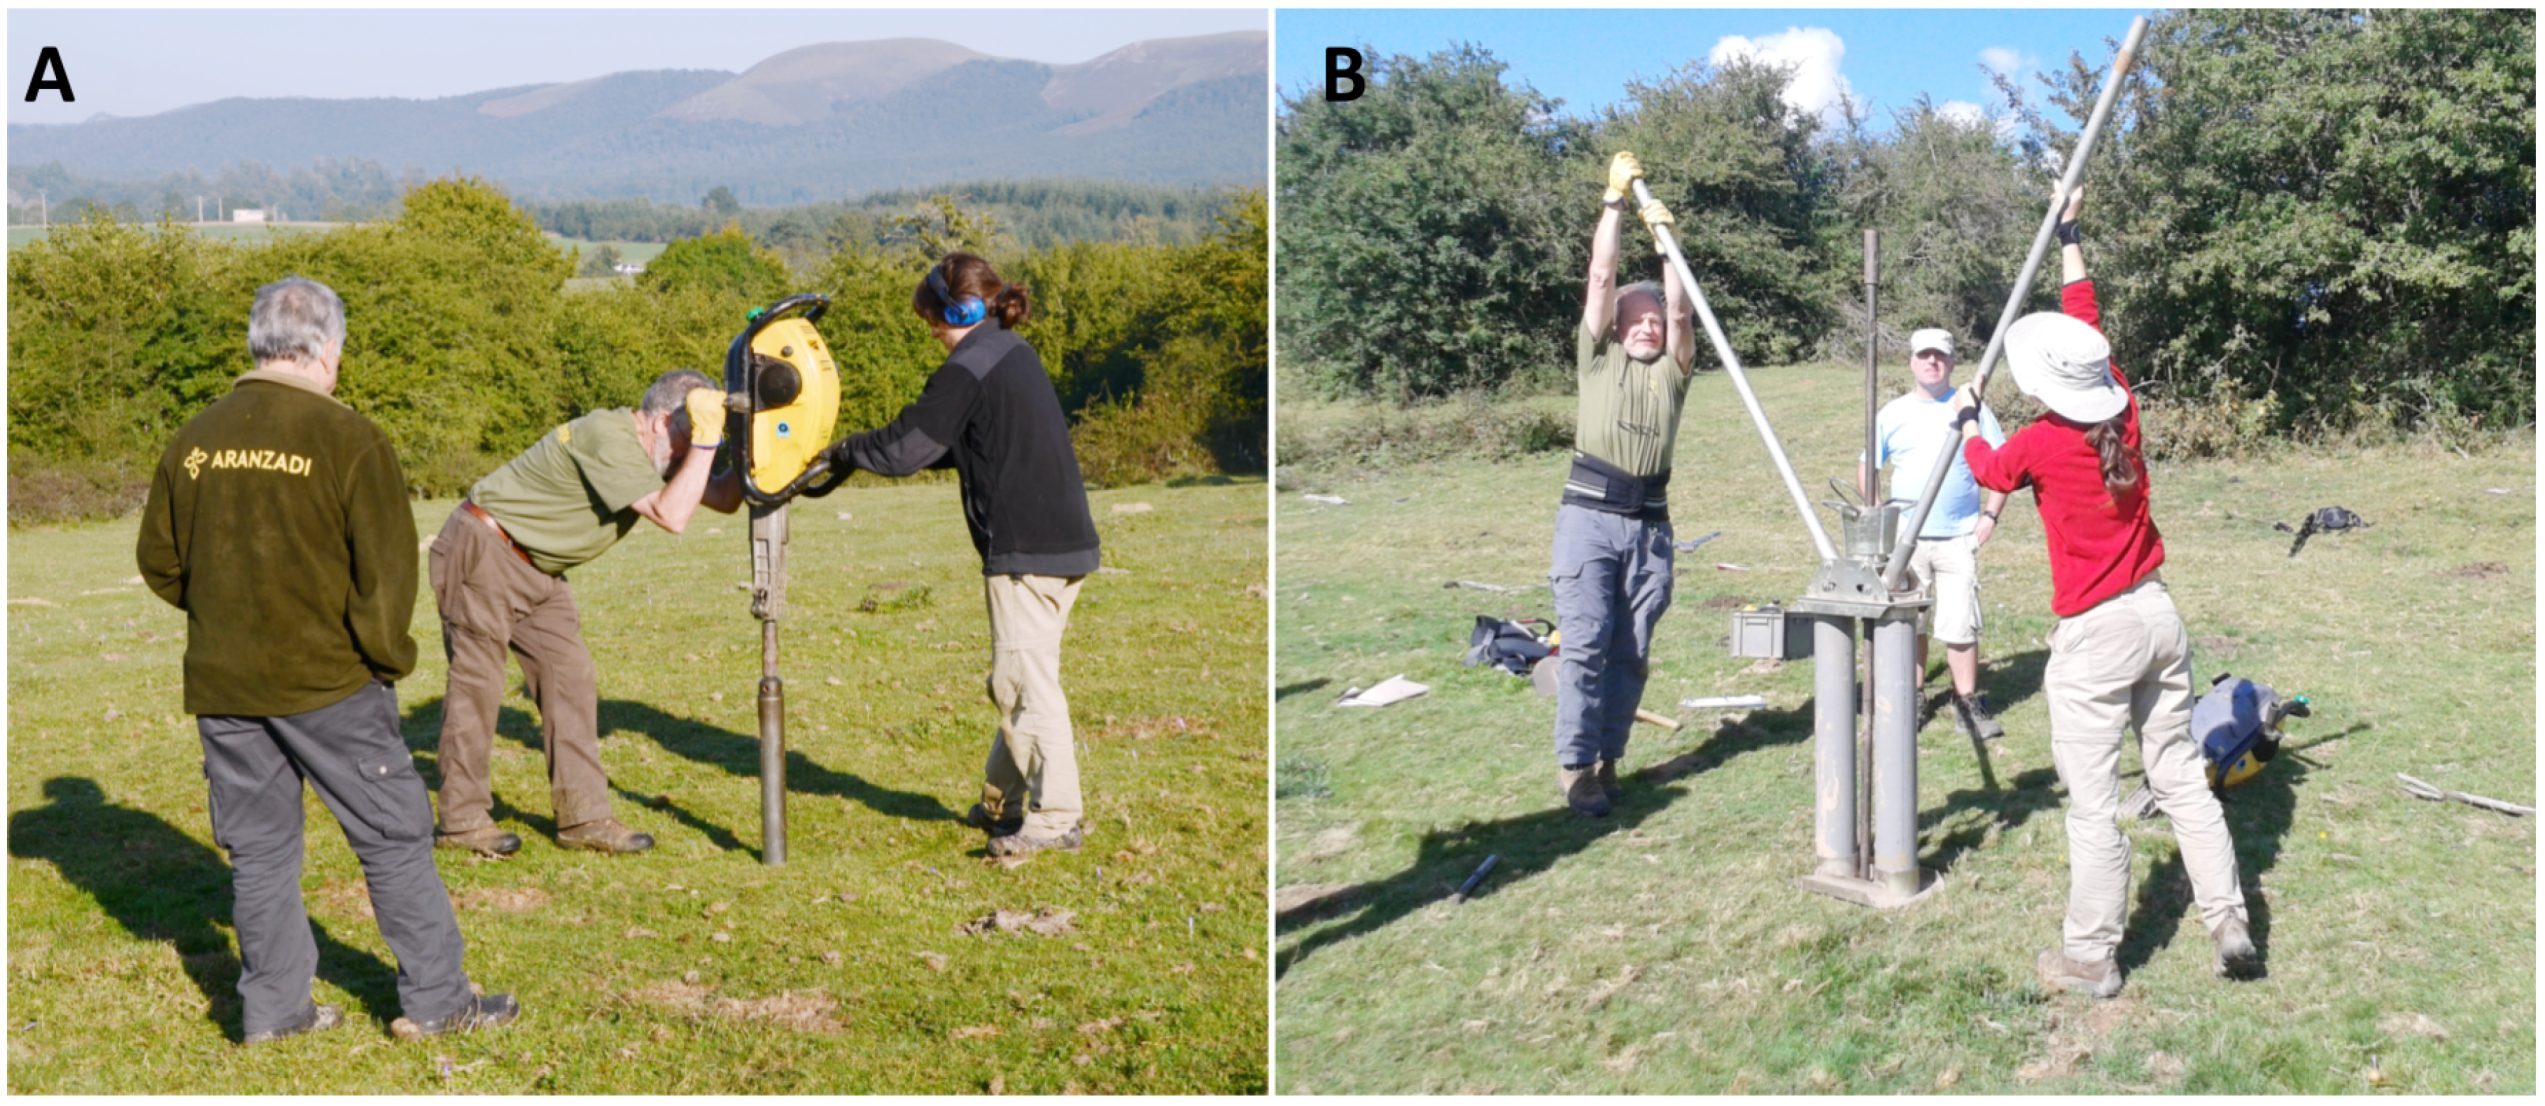
Cores were drilled with a mechanical petrol-driven 2-stroke power auger (Van Walt window corer equipped with a Cobra TT engine). This is a hand-held coring machine, which drives 1 m long, open-sided steel gouges into the ground (
Figure 2A). The sediment-filled gouge is then recovered from the ground using the two-person jacking device (
Figure 2B). Two gouges (of 100 mm and 60 mm diameter) were fitted with 1 m long steel extension rods to reach a maximum of 3 m depth. In general, the wider auger was used, reserving the second one to areas where the penetration was harder.
Once the gouges were retrieved, the deposits were cleaned and recorded on-site from the open-sided auger sample. Sediments were photographed and described according to standard sedimentary criteria [
28,
29]. Preliminary interpretations of the depositional conditions represented by the soils and sediments within each core were made, and the deposits or contexts grouped into broad stratigraphic units.
GPR prospecting was performed using an IDS Hi-Mod instrument with a single multi-frequency antenna (200 MHz and 600 MHz). Measurements were taken every 2.5 cm along parallel traverses, generally 0.2 m apart, and in zigzag mode. The time window was set at 90 ns for the 200 MHz antenna and at 60 ns for the 600 MHz antenna. Data were processed using GPR_SLICE software to generate horizontal maps [
30].
Archaeological excavation was carried out in accordance with MOLA recording techniques as set out in the Museum of London Archaeological Site Manual [
31]. Selected features and layers were additionally recorded with the total station theodolite.
4. The Layout of the Surveys
4.1. The Core Survey
Based on the magnetic survey, the area of investigation was divided into four zones. In a first campaign 105 locations were drilled across the site, but the cores were not equally distributed.
The main focus of the survey was on Zaldua area, which contains the most of the settlement. Here, the survey comprised cores acquired on nine east–west transects (
Figure 3a). The transects were positioned to create a grid of points covering the entire zone but also to include a number of specific points to resolve anomalies apparent in the geophysical survey.
In 2014 survey of the Otegi zone was less intensive and cannot be considered representative of the whole area. In 2016, some more cores were drilled in order to complete information about unanswered questions (
Figure 3b).
4.2. Complementary Geophysical Surveys and Archaeological Excavations
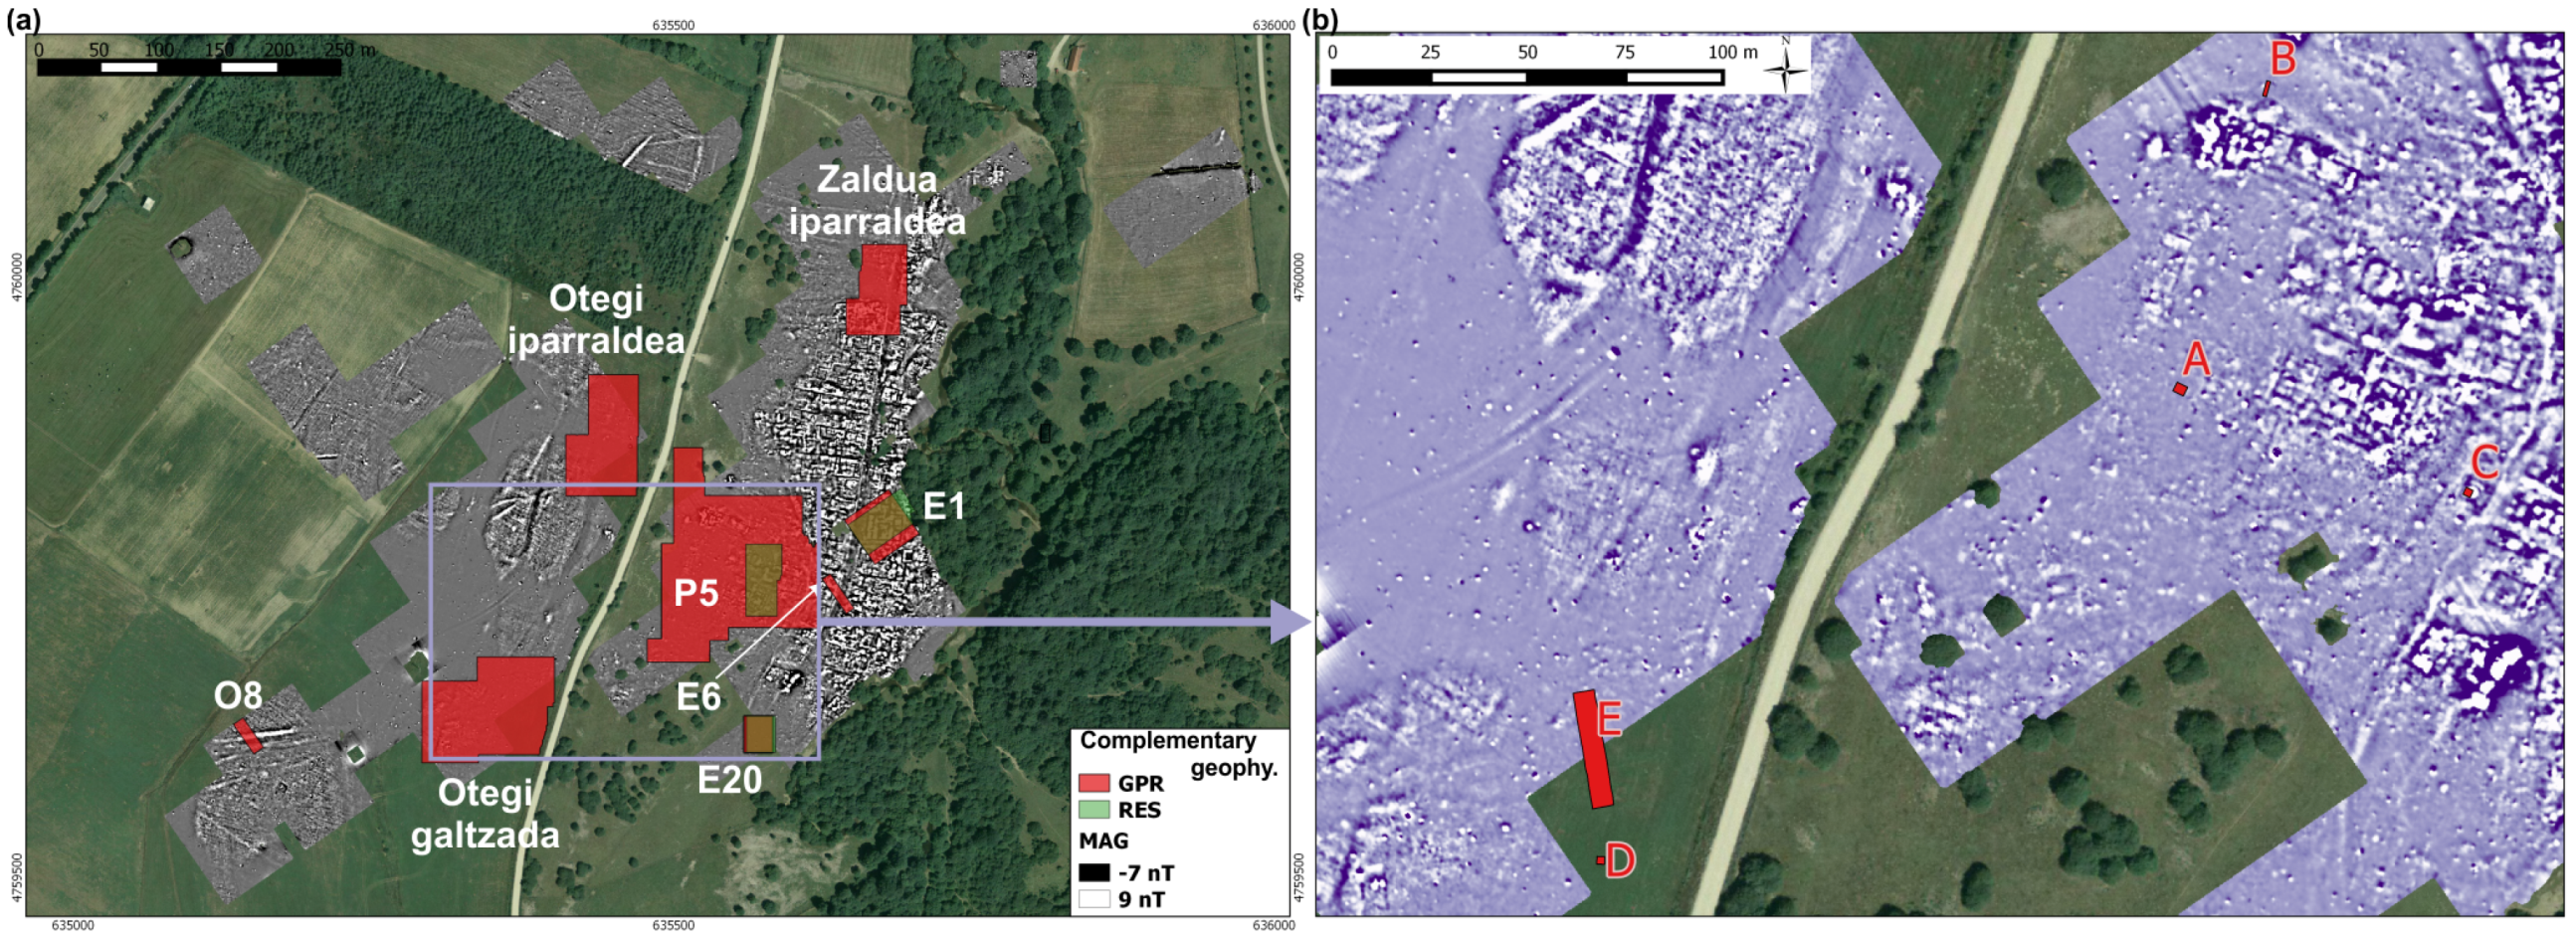
After the first campaign of sediment core survey was finish in 2014, new investigations were carried out on the site. In particular, some areas with low magnetic contrast or without clearly identified anomalies were analysed using GPR as the main system [
32,
33] (
Figure 4a). In addition, four verification trenches and an area of 165 m
were excavated in 2015 and 2016 respectively (
Figure 4b).
5. Results and Discussion
5.1. Comparison with Geophysical Anomalies
In areas where well defined magnetic anomalies were targeted, the cores generally confirmed the interpretation from the geophysical survey. Furthermore, the extracted sequences allowed these interpretations to be refined and permitted a better understanding of the origin of the anomalies. However, some discordance was found and new areas of interest were identified.
5.1.1. Target: Buildings
The magnetic survey had provided a great amount of information regarding building location and characteristics. It could be established that the buildings are mainly organized along the road and oriented perpendicularly to it, leading to an irregular urban layout. In general, the magnetic contrast allowed a good description of the main walls and the inner distribution of the buildings. Some areas, however, had shown a lack of magnetic contrast or poor definition of anomalies, even where the existence of archaeological deposits was known [
26]. The cores were mainly drilled in three different areas, expecting to obtain complementary information to understand the differences on magnetic contrast.
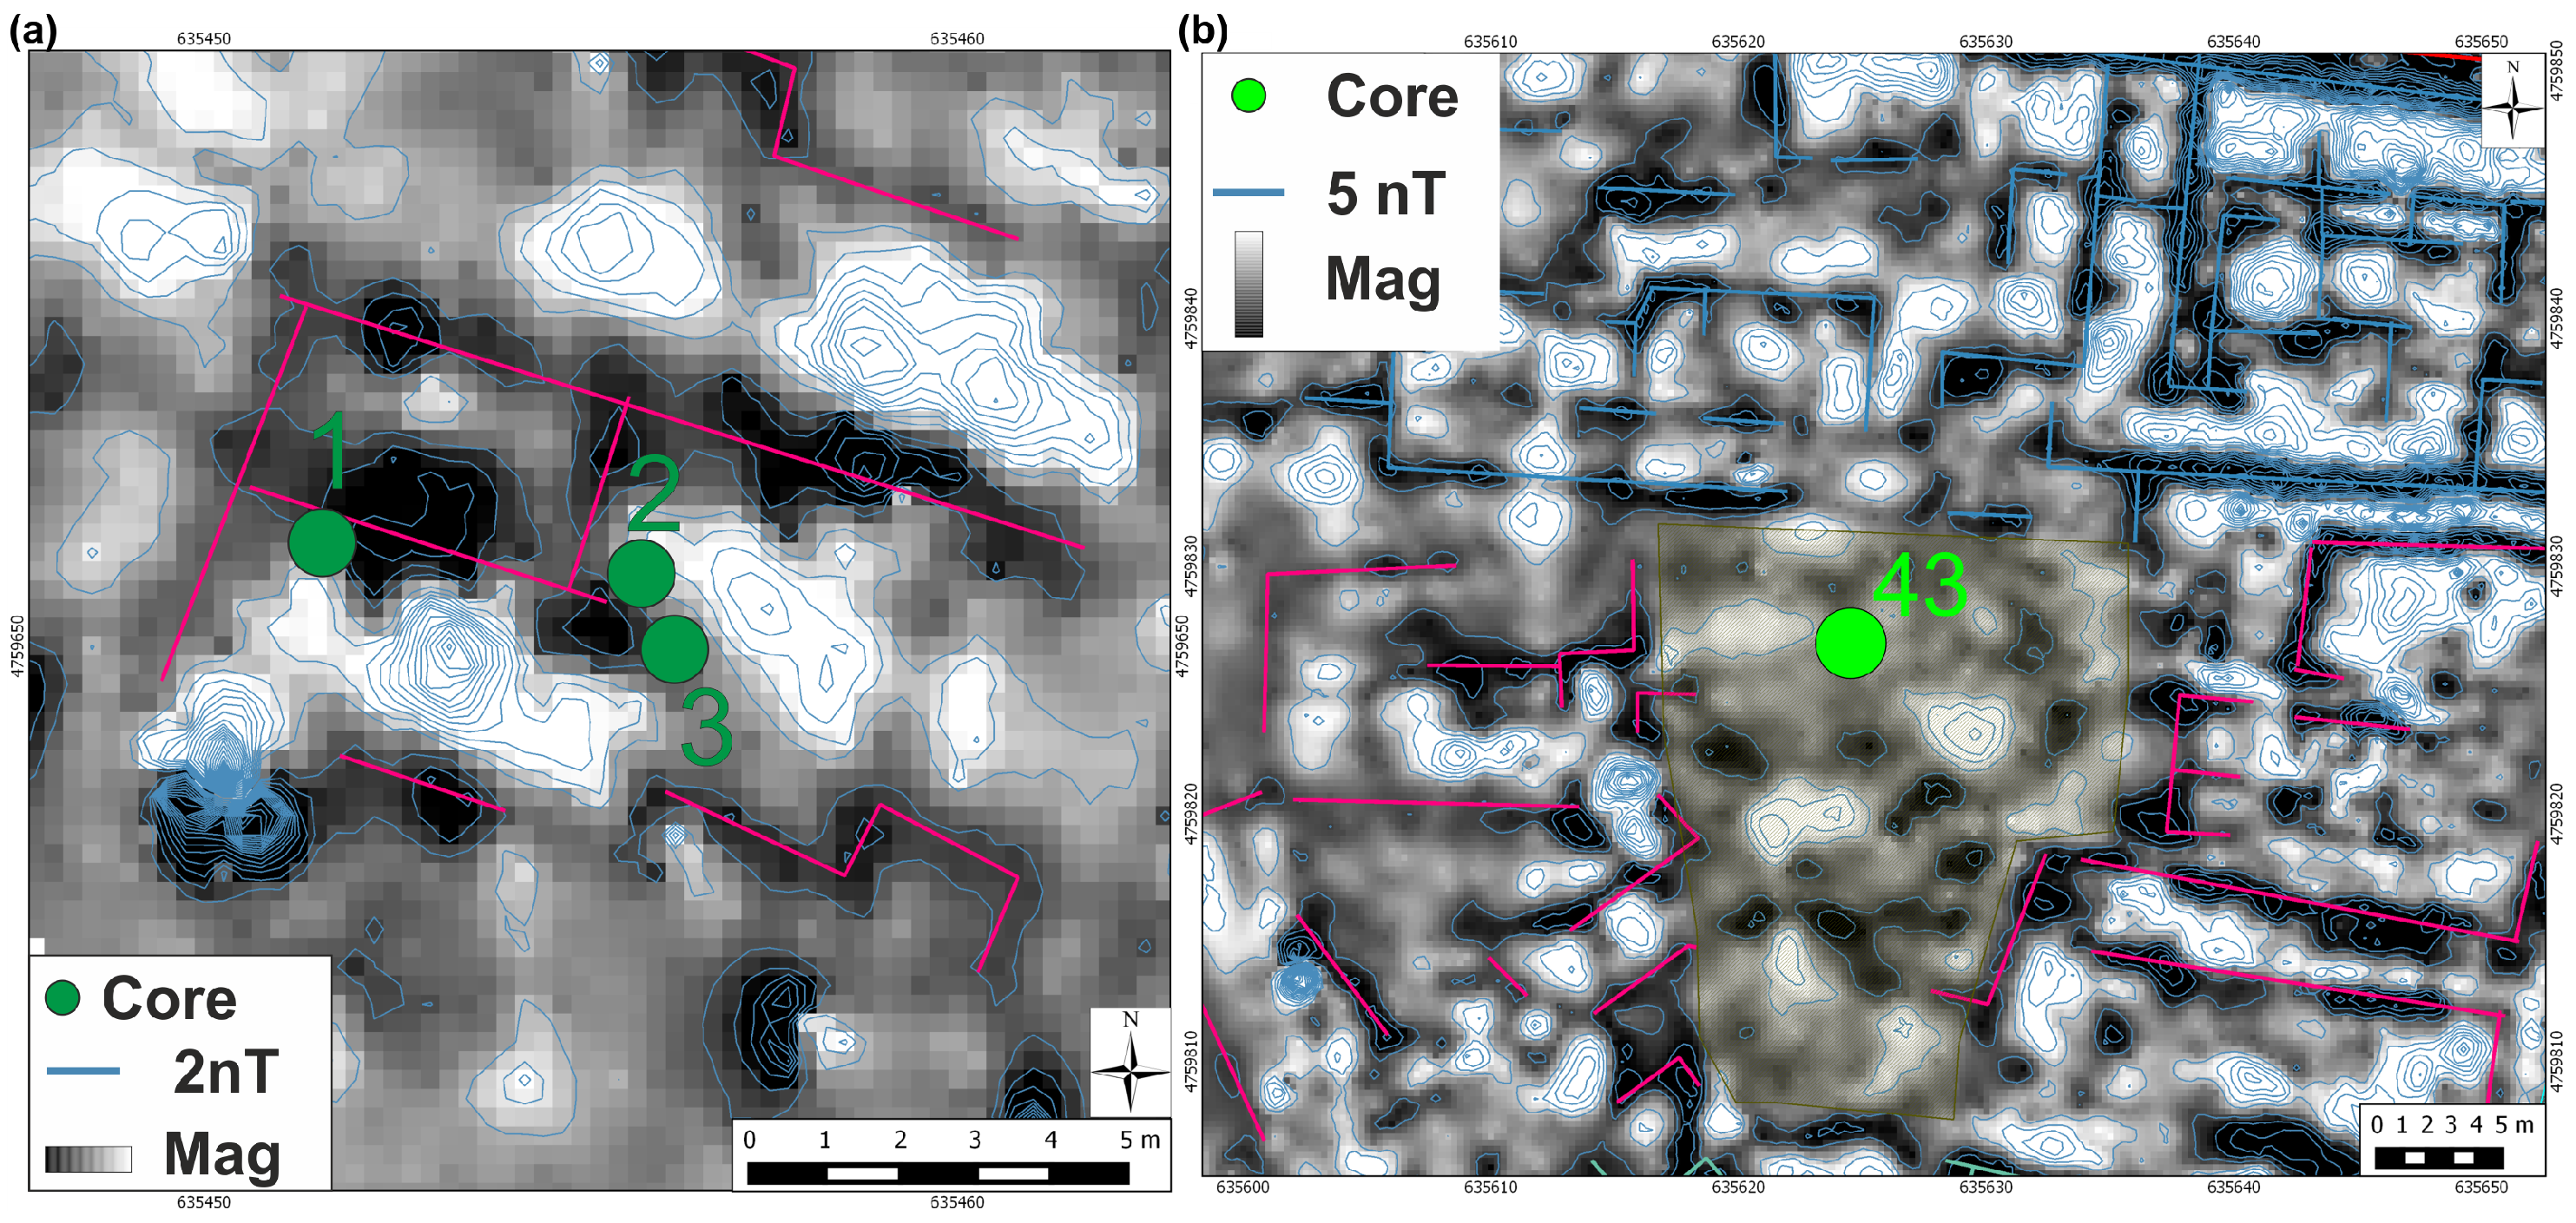
The cores BH1, BH2 and BH3 had been located at the south-west part of the Zaldua area. Archaeological remains (walls and pavements) had been observed during installation of a water channel. The magnetic contrast was, however, weak and the anomalies were not clearly defined (
Figure 5a). One of considered possibilities was that the remains were deeper in comparison with other areas. The sedimentary sequence of BH1 was a natural sequence consisting of turf and top soil layers over fluvial terrace silt and gravels (
Table 2). The other two encountered solid stone obstructions at 0.22 m and 0.37 m respectively. As BH1 demonstrated bedrock is situated below 2.0 m bgl, the obstructions are likely to be walls or stone/rubble from a collapsed wall. Because the remains are located just below the organic layer, the lack of magnetic contrast in not related to an increase of the deepness. The sequence, however, has no evidence of charcoal or pottery flecks. Therefore, it can be conjectured that only the basement levels have been conserved, which would explain the lack of the magnetic contrast.
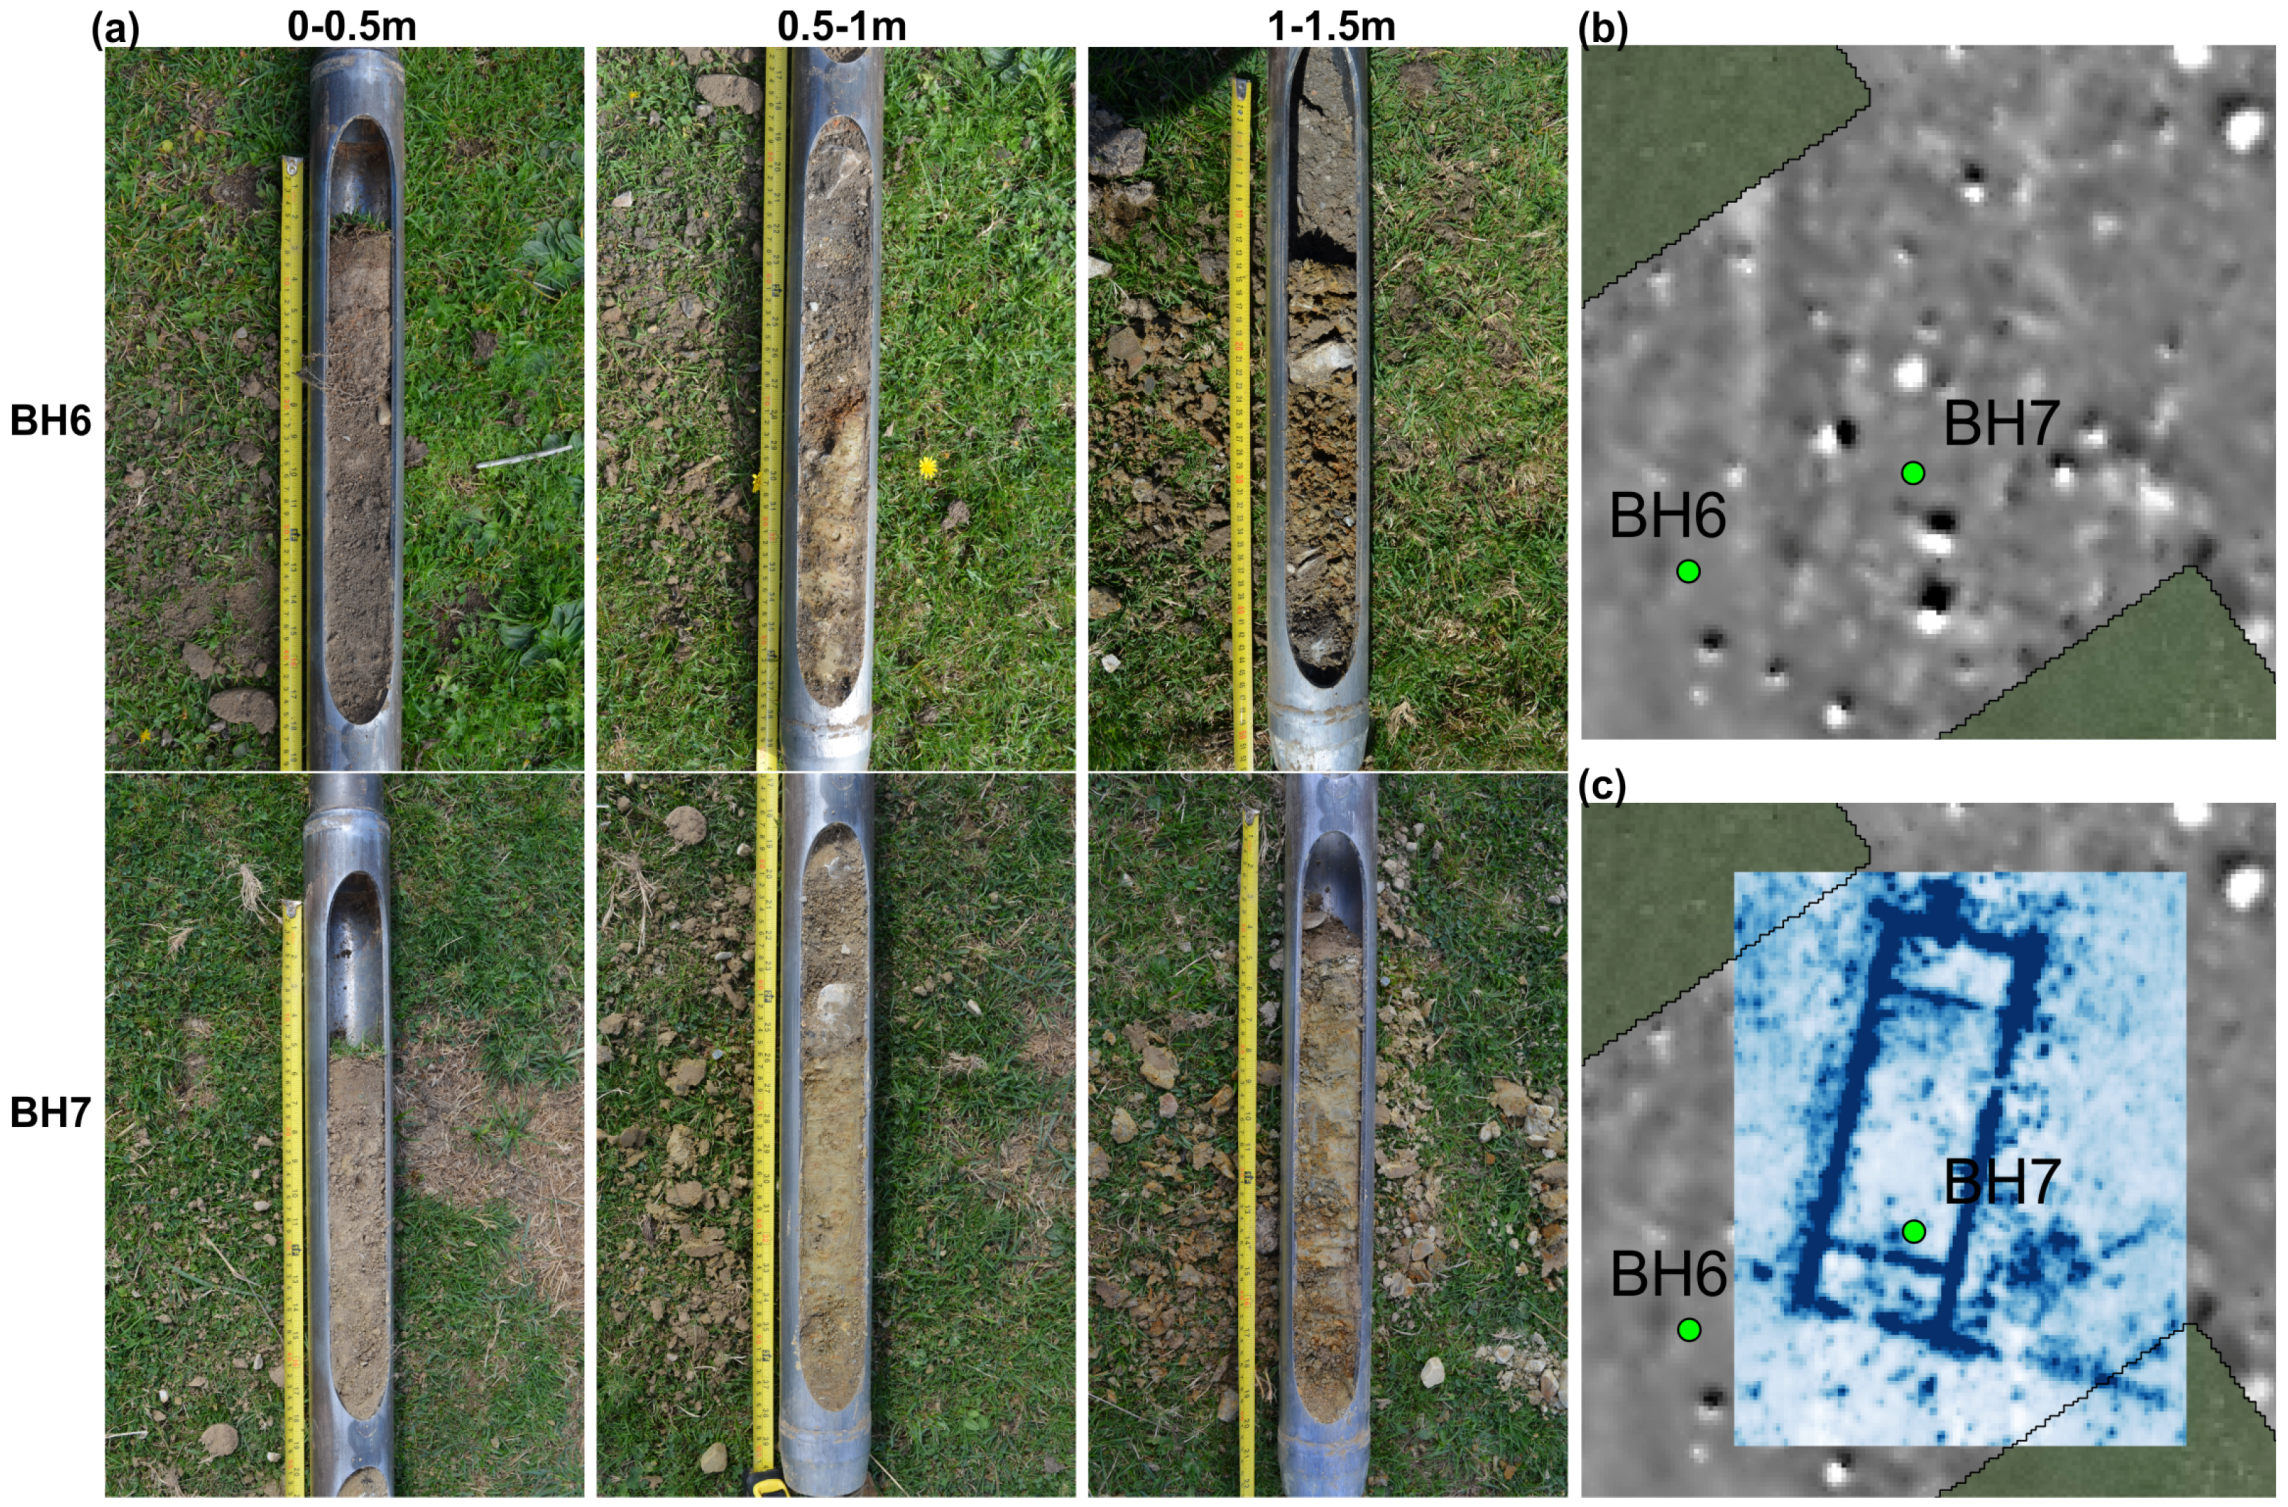
The cores BH6 and BH7 had been drilled at the south-east part of the Zaldua area. Analysis of aerial images revealed the existence of a building, and the existence of the walls was proven simply by removing the superficial turf layer. This building was not detected in the magnetic survey, but was clearly distinguished in GPR and electric surveys (
Figure 7).
The BH7 targeted the south of the building. A clean and very stiff layer of silt/clay was observed between 0.66 m and 0.87 m bgl, attributed to a clay floor. The deposits above this layer didn’t show neither charcoal or pottery flecks, but had been considered preliminarily archaeological based on disturbation evidences (i.e., unsorted gravels). The BH6 was drilled outside of the inferred building. Results show a thick archaeological deposit between 0.22 and 0.95 m consisting on differentiate layers where frequent charcoal and building material flecks had been observed. In this case, the archaeological layer found in the inner part of the building consisted in a clean levelling layer without evidence of magnetically enhanced deposits. However, the thick archaeological layer outside the building suggests that the walls could show a negative magnetic contrast.
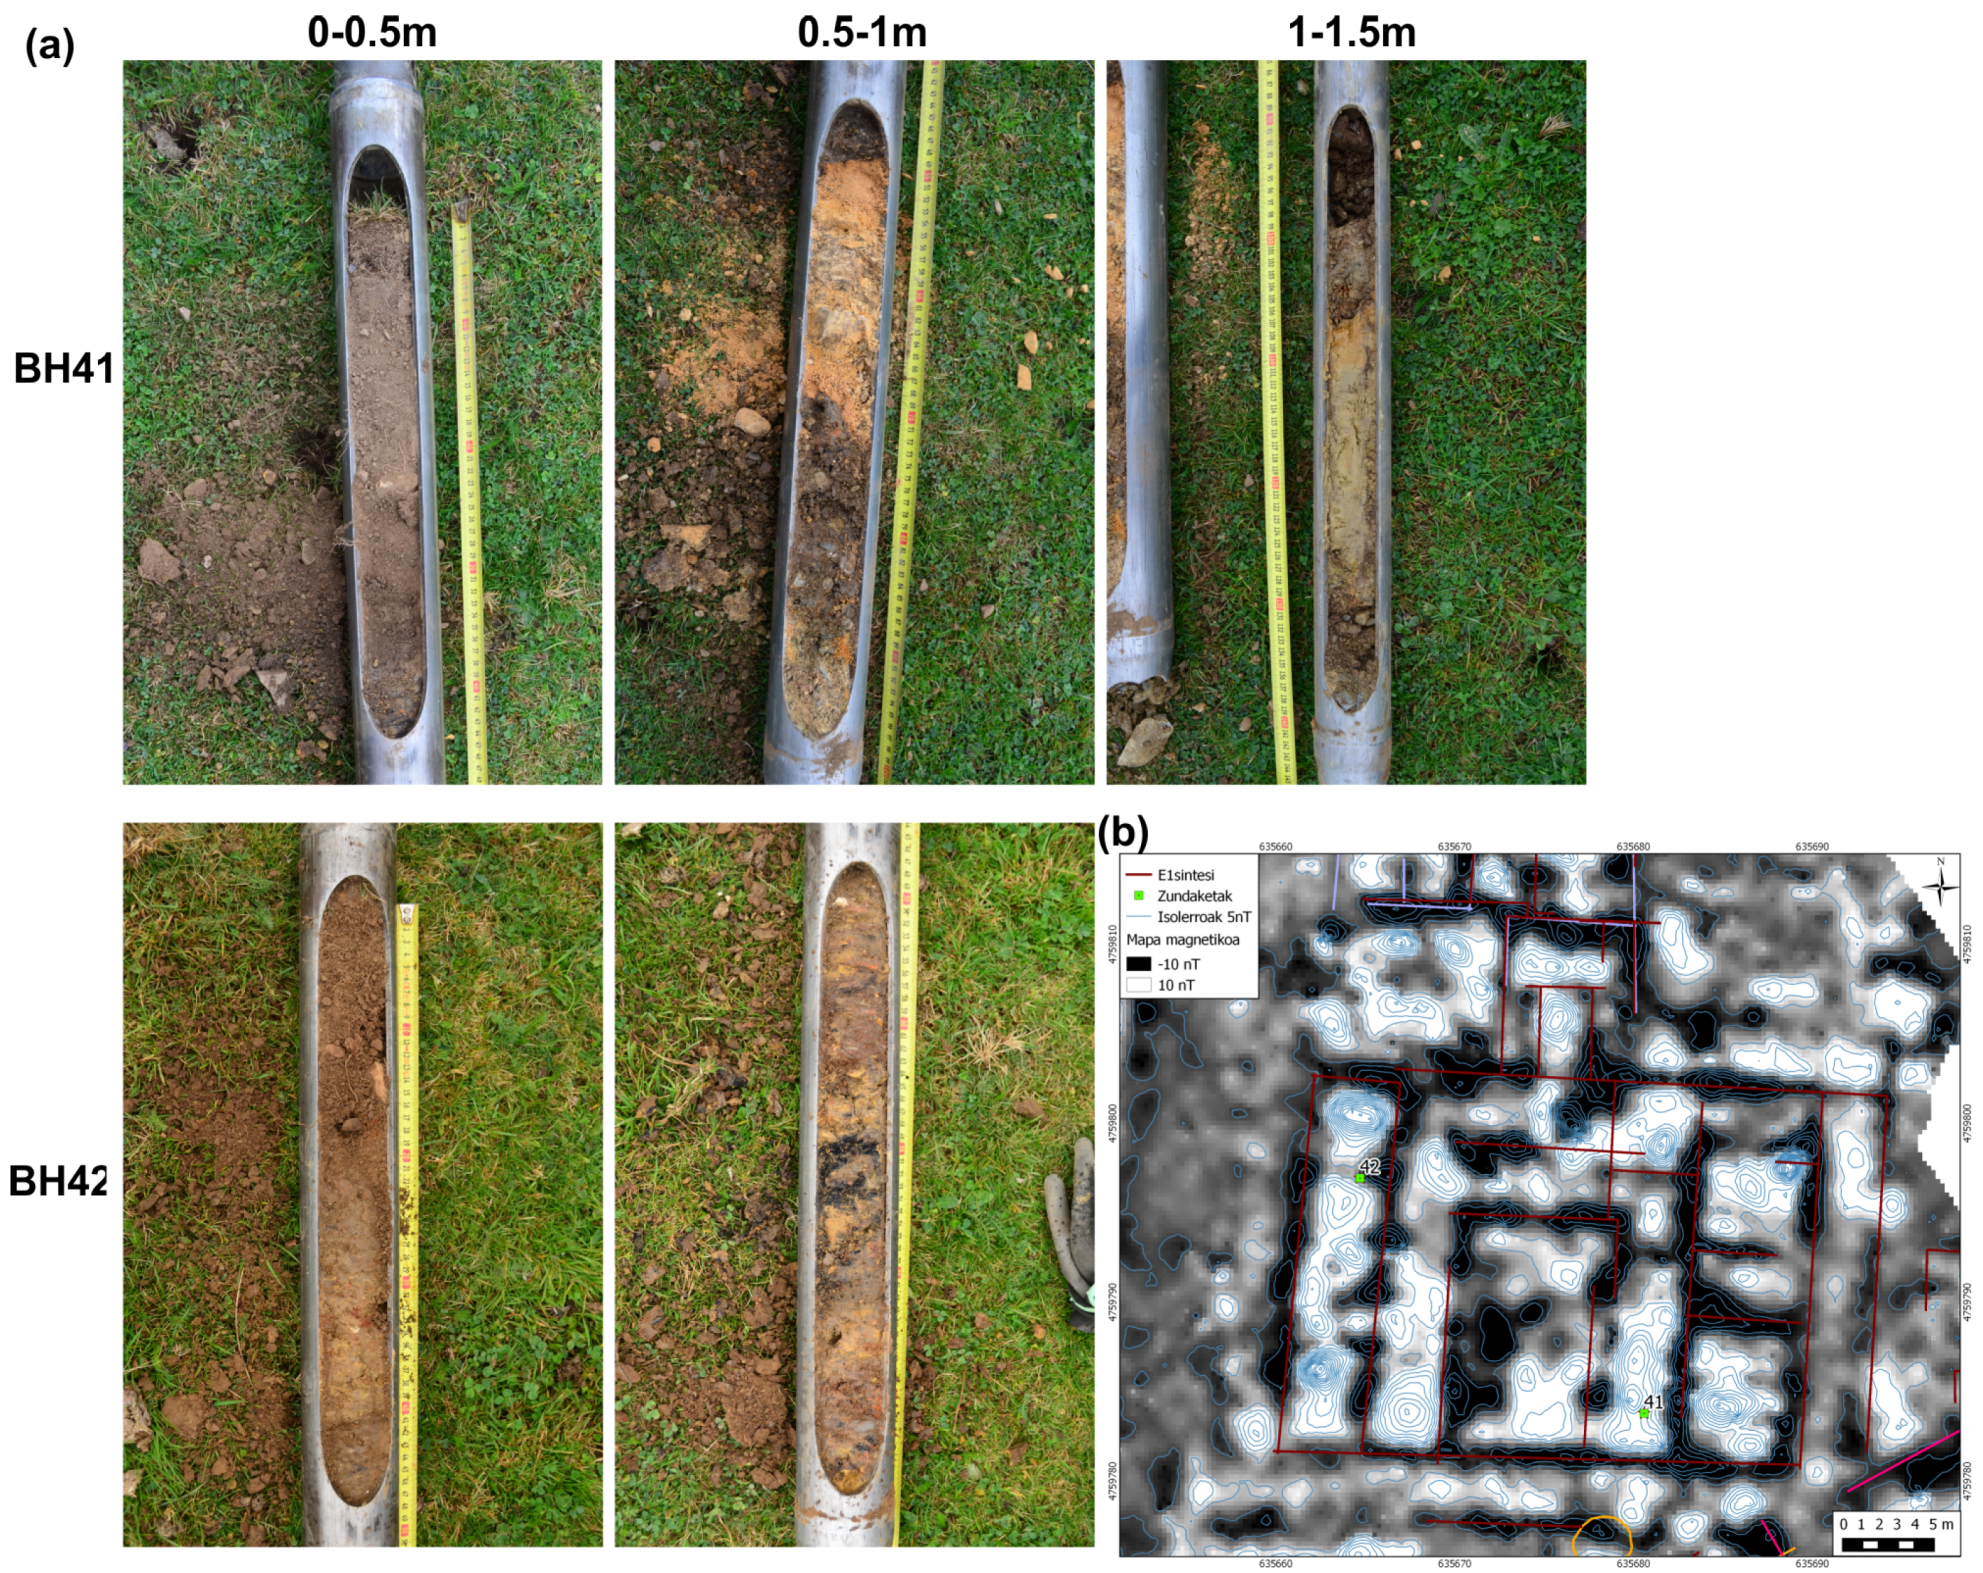
Finally, the cores BH41 and BH42 were drilled on the main part of the settlement, were the magnetic contrast is strong (
Figure 8). A series of floor layers were observed in BH41 (0.64–1.42 m bgl). In BH42, a possible collapsed mortared wall or mortar-rich construction debris interrupt a sequence of archaeological dumps (0.52–1.1 m bgl). The existence of thicker archaeological layers in those cores is in agreement with the stronger magnetic contrast detected on this area.
5.1.2. Target: Combustion Signatures
Magnetic data had provided several combustion evidences on the surveyed area. Some of them were attributed to kilns or massive fires, whereas others seem to be related to hearths. Some of those location had been included into the core survey in order to validate the interpretations based on magnetic data.
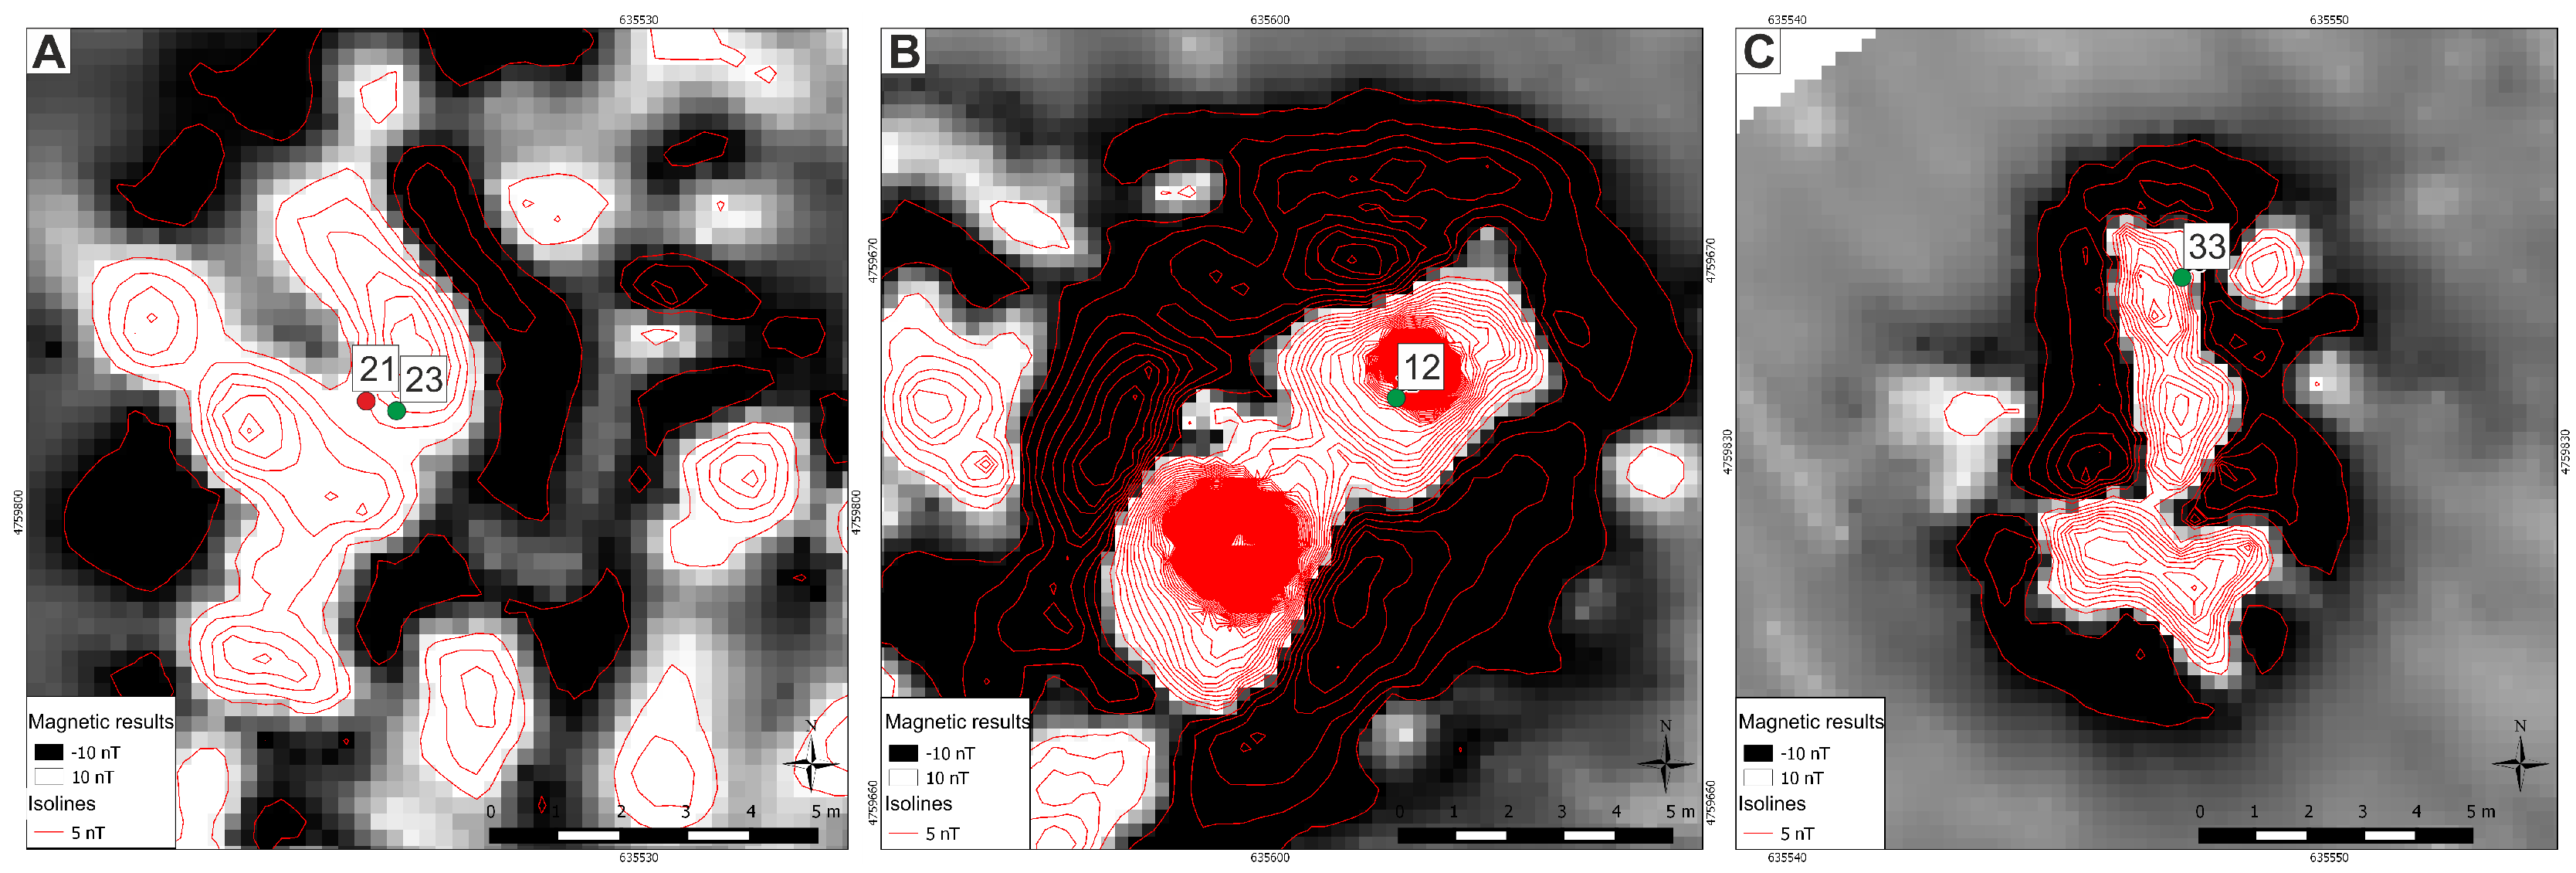
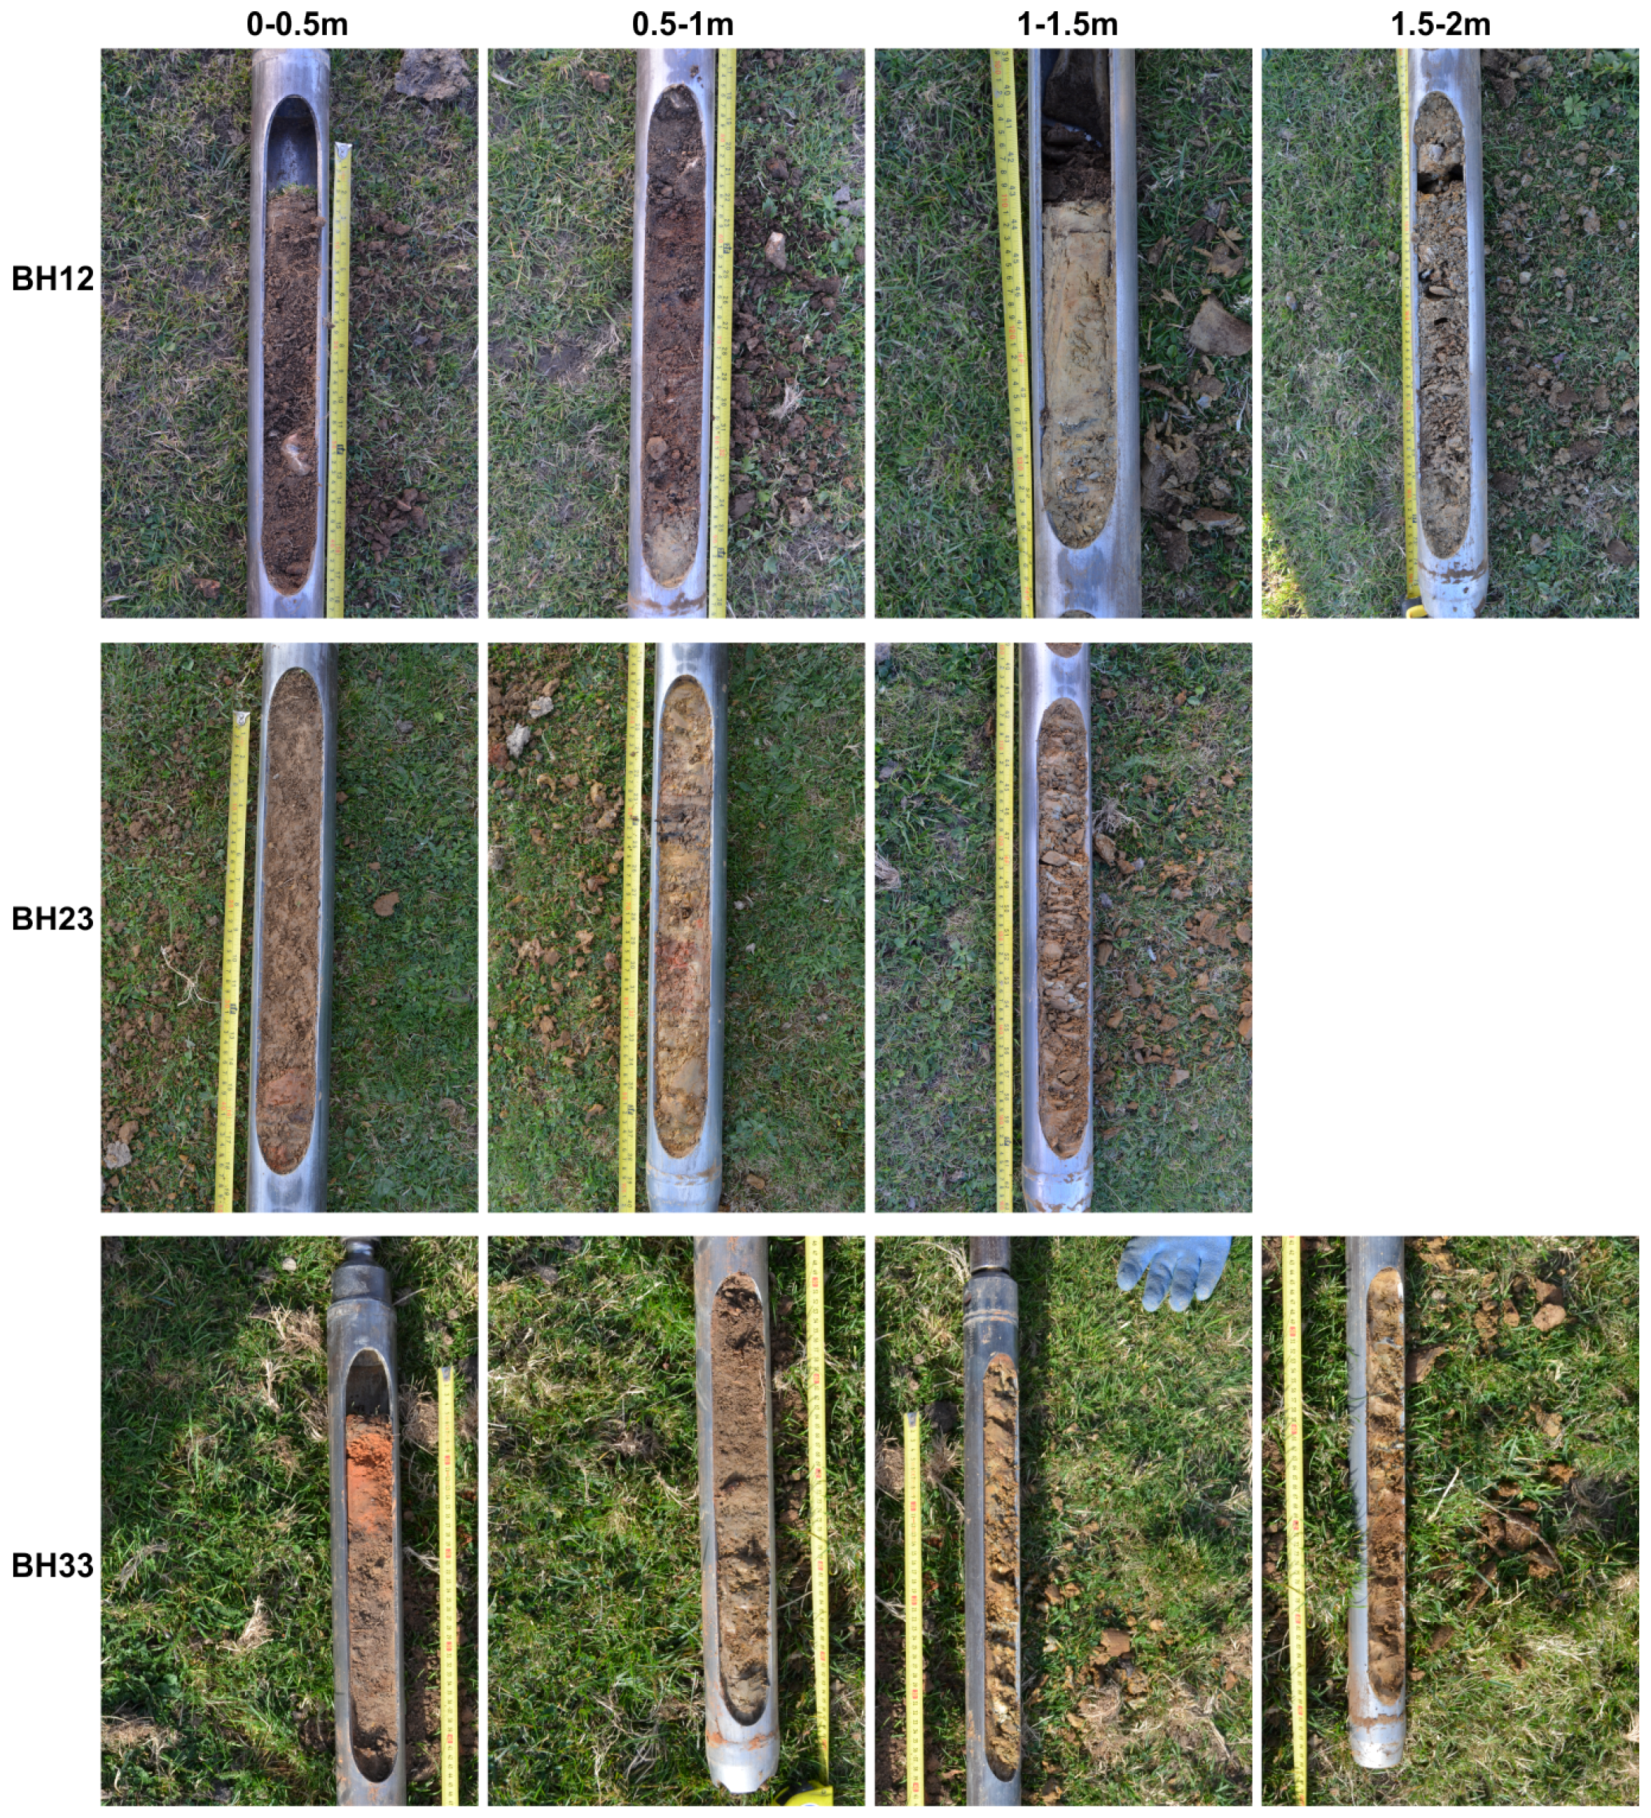
The core BH23 was drilled on the north limit of the P5 area, where magnetic data showed evidences of combustion processes but without any coherent shape of anomalies (
Figure 9A). It contains archaeological deposits between 0.3 m and 0.9 m consisting in a silt matrix where many heat affected clay, charcoal lumps and red sandstone clasts can be observed (
Figure 10). The absence of well defined stratification agrees to the characteristics of magnetic data, and it can be conjectured that a conflagration happened in this location.
Core 12 targeted an anomaly interpreted as a kiln (
Figure 9B). A series of archaeological layers containing fragments of slag were observed over a floor of firm clay with charcoal flecks. The absence of any heat scorching on the clay surface suggests that the core did not locate a kiln. However the abundance of slag in the above layers suggests metalworking was taking place nearby. Therefore, observations support the interpretation of a building associated with fire industry.
Core 33 targeted an intense magnetic anomaly isolated from the main occupation area, attributed to the traces of combustion related activity (
Figure 9C). The core showed a burnt clay surface immediately below the superficial layer (
Figure 10). The anomaly was then attributed to a recent fire for vegetation burning instead to an archaeological feature, confirmed by local people.
5.1.3. Target: Open Areas
The magnetic data layout revealed some areas without relevant anomalies surrounded by anomalies attributed to buildings. Those areas where preliminarily attributed to open areas that could be integrated into building complexes.
In the west part of Zaldua, magnetic data suggested the existence of a rectangular area surrounded by coherently oriented buildings (P5). Standing in a small hill, this area was preliminarily interpreted as a possible singular area of the site [
26,
32]. Four cores were drilled within this area: BH17, BH19, BH24 and BH25 (
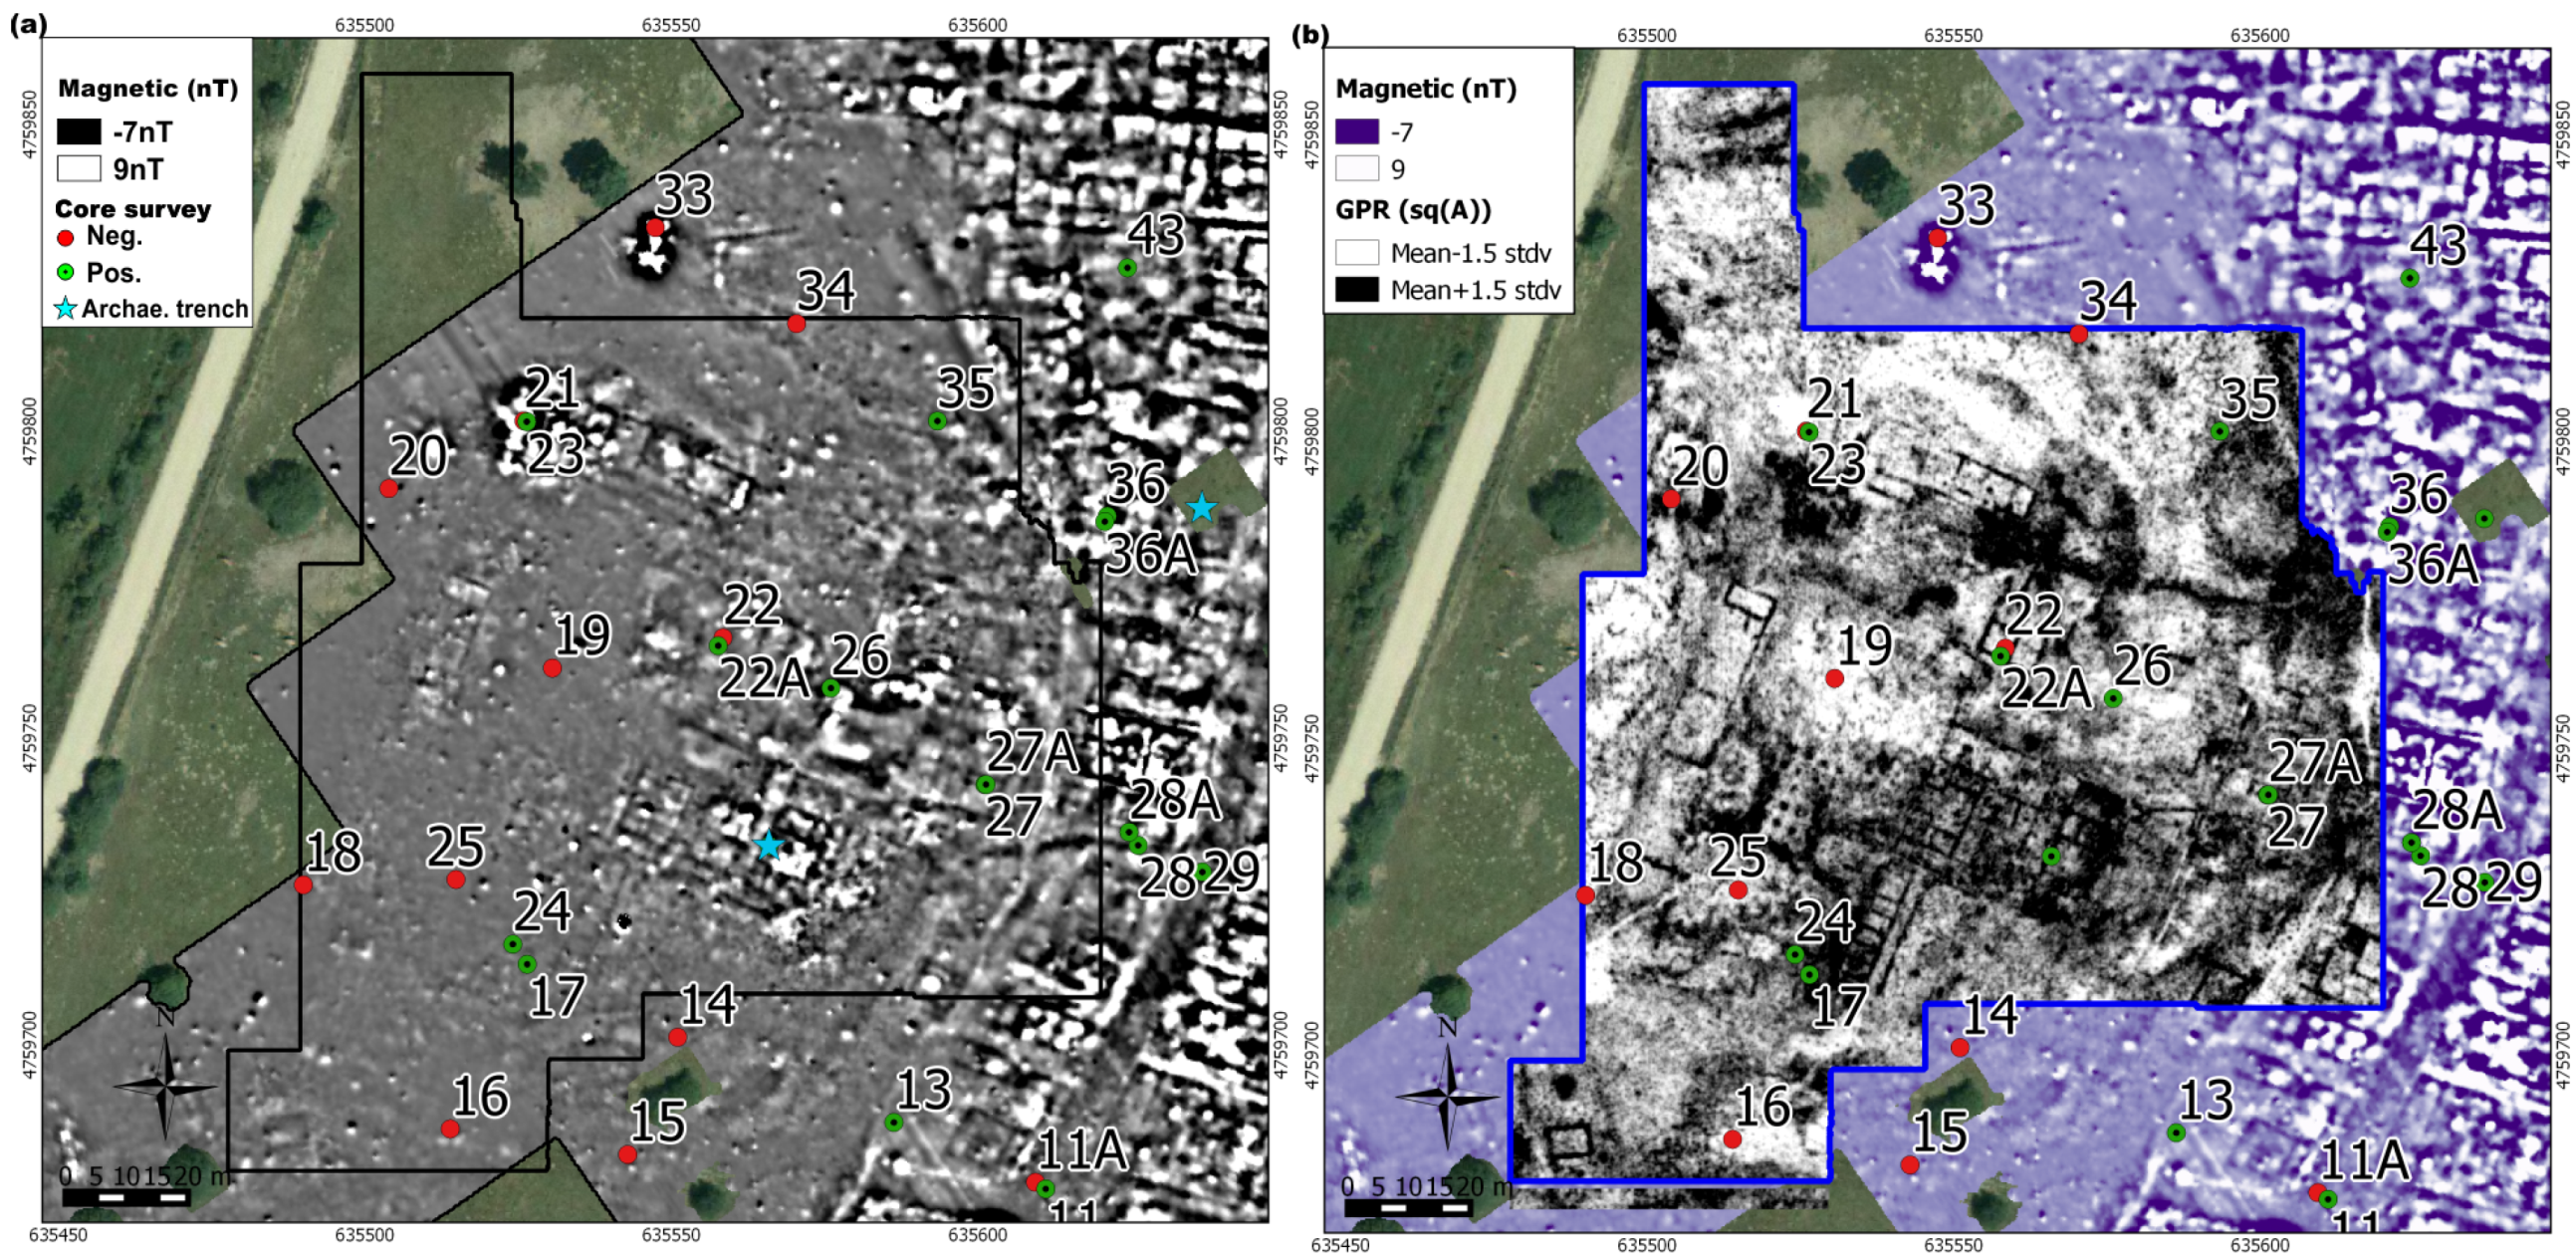
Figure 11a). In BH17 archaeological layers were encountered and comprised 2 possible gravel surfaces with levelling or dumped layers beneath (0.24–0.33 m bgl and 0.42–0.53 m bgl). The same sequence was observed 15 metres north-west in BH24 (0.25–0.39 m bgl and 0.5–0.64 m bgl). The levels and thickness of the gravel layers suggest than this area had been surfaced twice at least in the south-east corner of P5. In contrast, the sedimentary sequence observed in BH25 and BH19 consisted of turf and topsoil layers over fluvial terrace silts and gravels, and had no evidence of gravel floors. Given the contrasting results, the core survey cannot corroborate the interpretation of P5 as an archaeological unit.
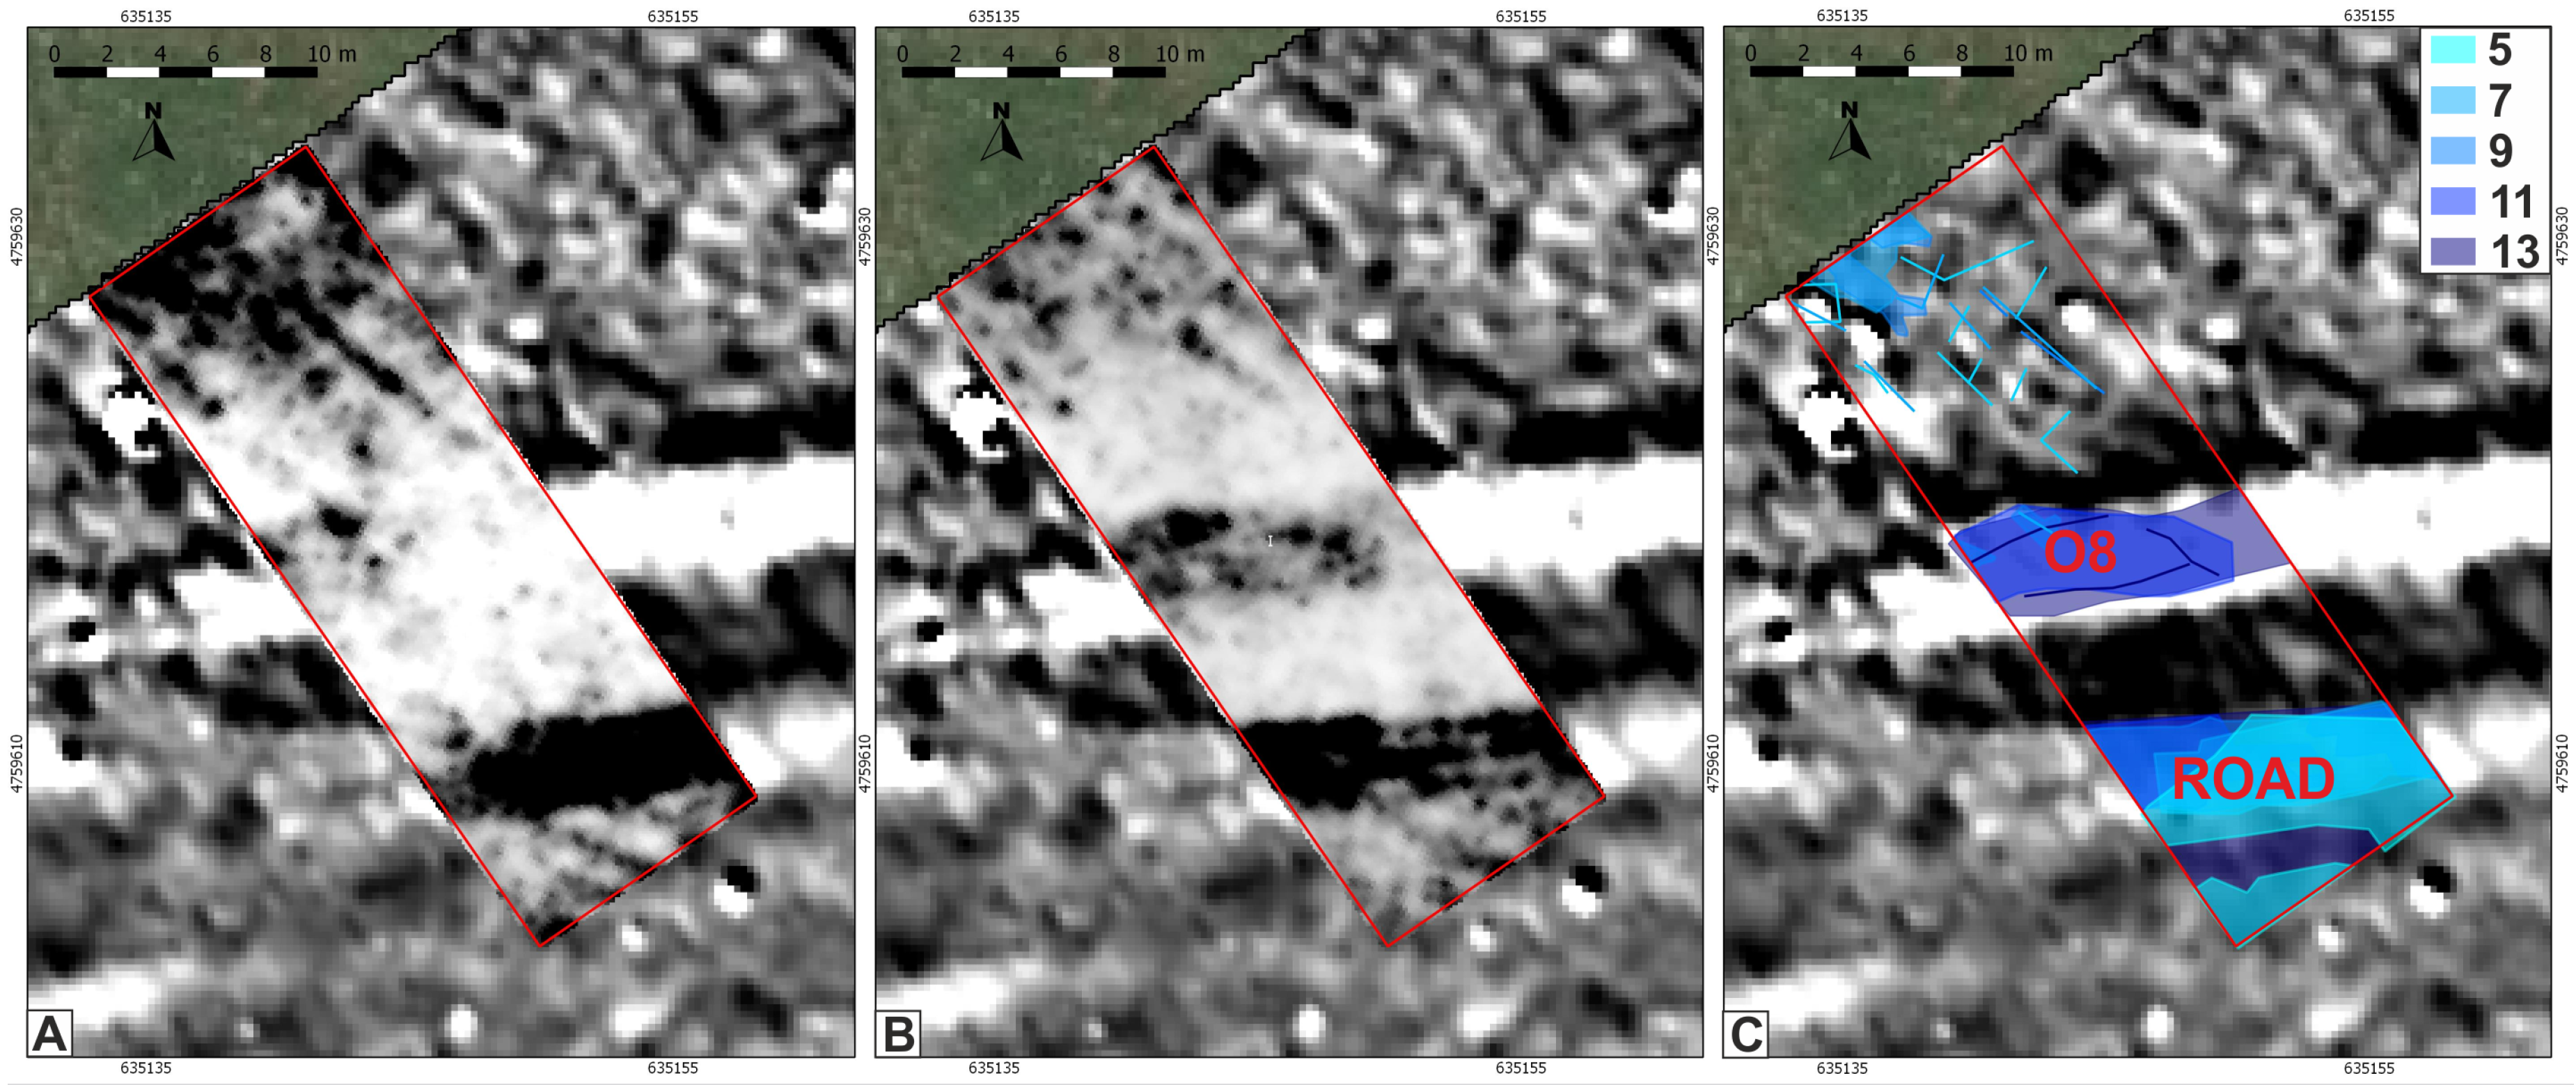
Further investigations focused in this area. The GPR surveys show complementary information to that obtained in the magnetic survey [
32]. The south-eastern limit of the P5 rectangle appears clearly on the time-slice sequence, allowing a more detailed description than the one obtained from magnetic data. Furthermore, new buildings could be described, improving notably the architectural information obtained from the magnetic survey. As it can be seen in
Figure 11b, the cores where the gravel levels were found have been drilled in areas where the GPR energy is reflected, whereas the others are located in areas without reflection. The non homogeneous stratigraphy of that areas was then confirmed, but as the coherent orientation of buildings is corroborated by the GPR results, the unity of the area is not discarded.
Core 43 was drilled through another potential open space (
Figure 5b). In contrast to P5 this much smaller area is surrounded by buildings. The sedimentary sequence is also very different to that of P5, no evidence was found of buildings or floor layers so the core supports the interpretation of an open space (
Table 3). The use of the area also differs, since a massive and homogeneous layer of mixed dumped material (0.5–1.3 m bgl) may suggest this area was used for the disposal of rubbish.
5.1.4. Target: The Road
The road is detected as a linear and weakly magnetic zone which is easily identifiable when is surrounded by other anomalies, but difficult to discern in other areas, as for example at the north of the main occupation area in Zaldua. Borehole 62 in transect 14 was drilled through the missing road section (
Figure 6). The road is visible as a compact gravel horizon (0.16–0.57 m bgl). The continuity of the road in that point was confirmed.
5.1.5. Magnetic Disturbance in Otegi Area
In Otegi area the geophysical survey revealed variations in background magnetic disturbance, that difficult the identification of archaeological remains [
26]. This disturbance had been preliminarily attributed to differences in soil properties, not related to archaeological occupation.
A series of cores were drilled in 2014 in order to clarify the origin of this magnetic disturbance, and no archaeological evidence was observed [
27]. It had been appointed that the disturbance could be related to differences in soil horizon composition and its thickness.
Finally, additional cores were drilled in 2016, in order to clarify the origin of this magnetic disturbance (
Figure 12). The magnetically stable areas coincide with areas where sedimentary deposits were identified, whereas in disturbed areas the deposits are related to the erosion of the bedrock and alterite type thin soil formation. Based on this data, the difference on magnetic response can be attributed to the activity of sedimentary processes related to the nowadays canalised water string. In that campaign soil samples have been collected to be analysed in laboratory in order to better understand the mineralogical composition that leads to the magnetic disturbance. This research is still ongoing and the result will be published in the future.
5.1.6. Geophysical Anomaly Parallel to the Road in Otegi Area
In the north of the necropolis a positively contrasted magnetic anomaly was detected running parallel to the road and located next to it. The GPR survey results show a reflective horizon consistent with magnetic data at approximately 80 cm below ground level (bgl), but without homogeneous intensity or coherent shape, as might be expected for a construction element (
Figure 13).
The sedimentary sequence in BH89 targeting this anomaly, comprised natural sequences of fluvial terrace silts above fluvial terrace gravels at 0.80 m bgl (
Table 4). The core survey cannot explain the magnetic anomaly. The GPR reflection, however, could be produced by the fluvial terrace gravels.
5.2. Presence and Absence of Archaeological Deposits
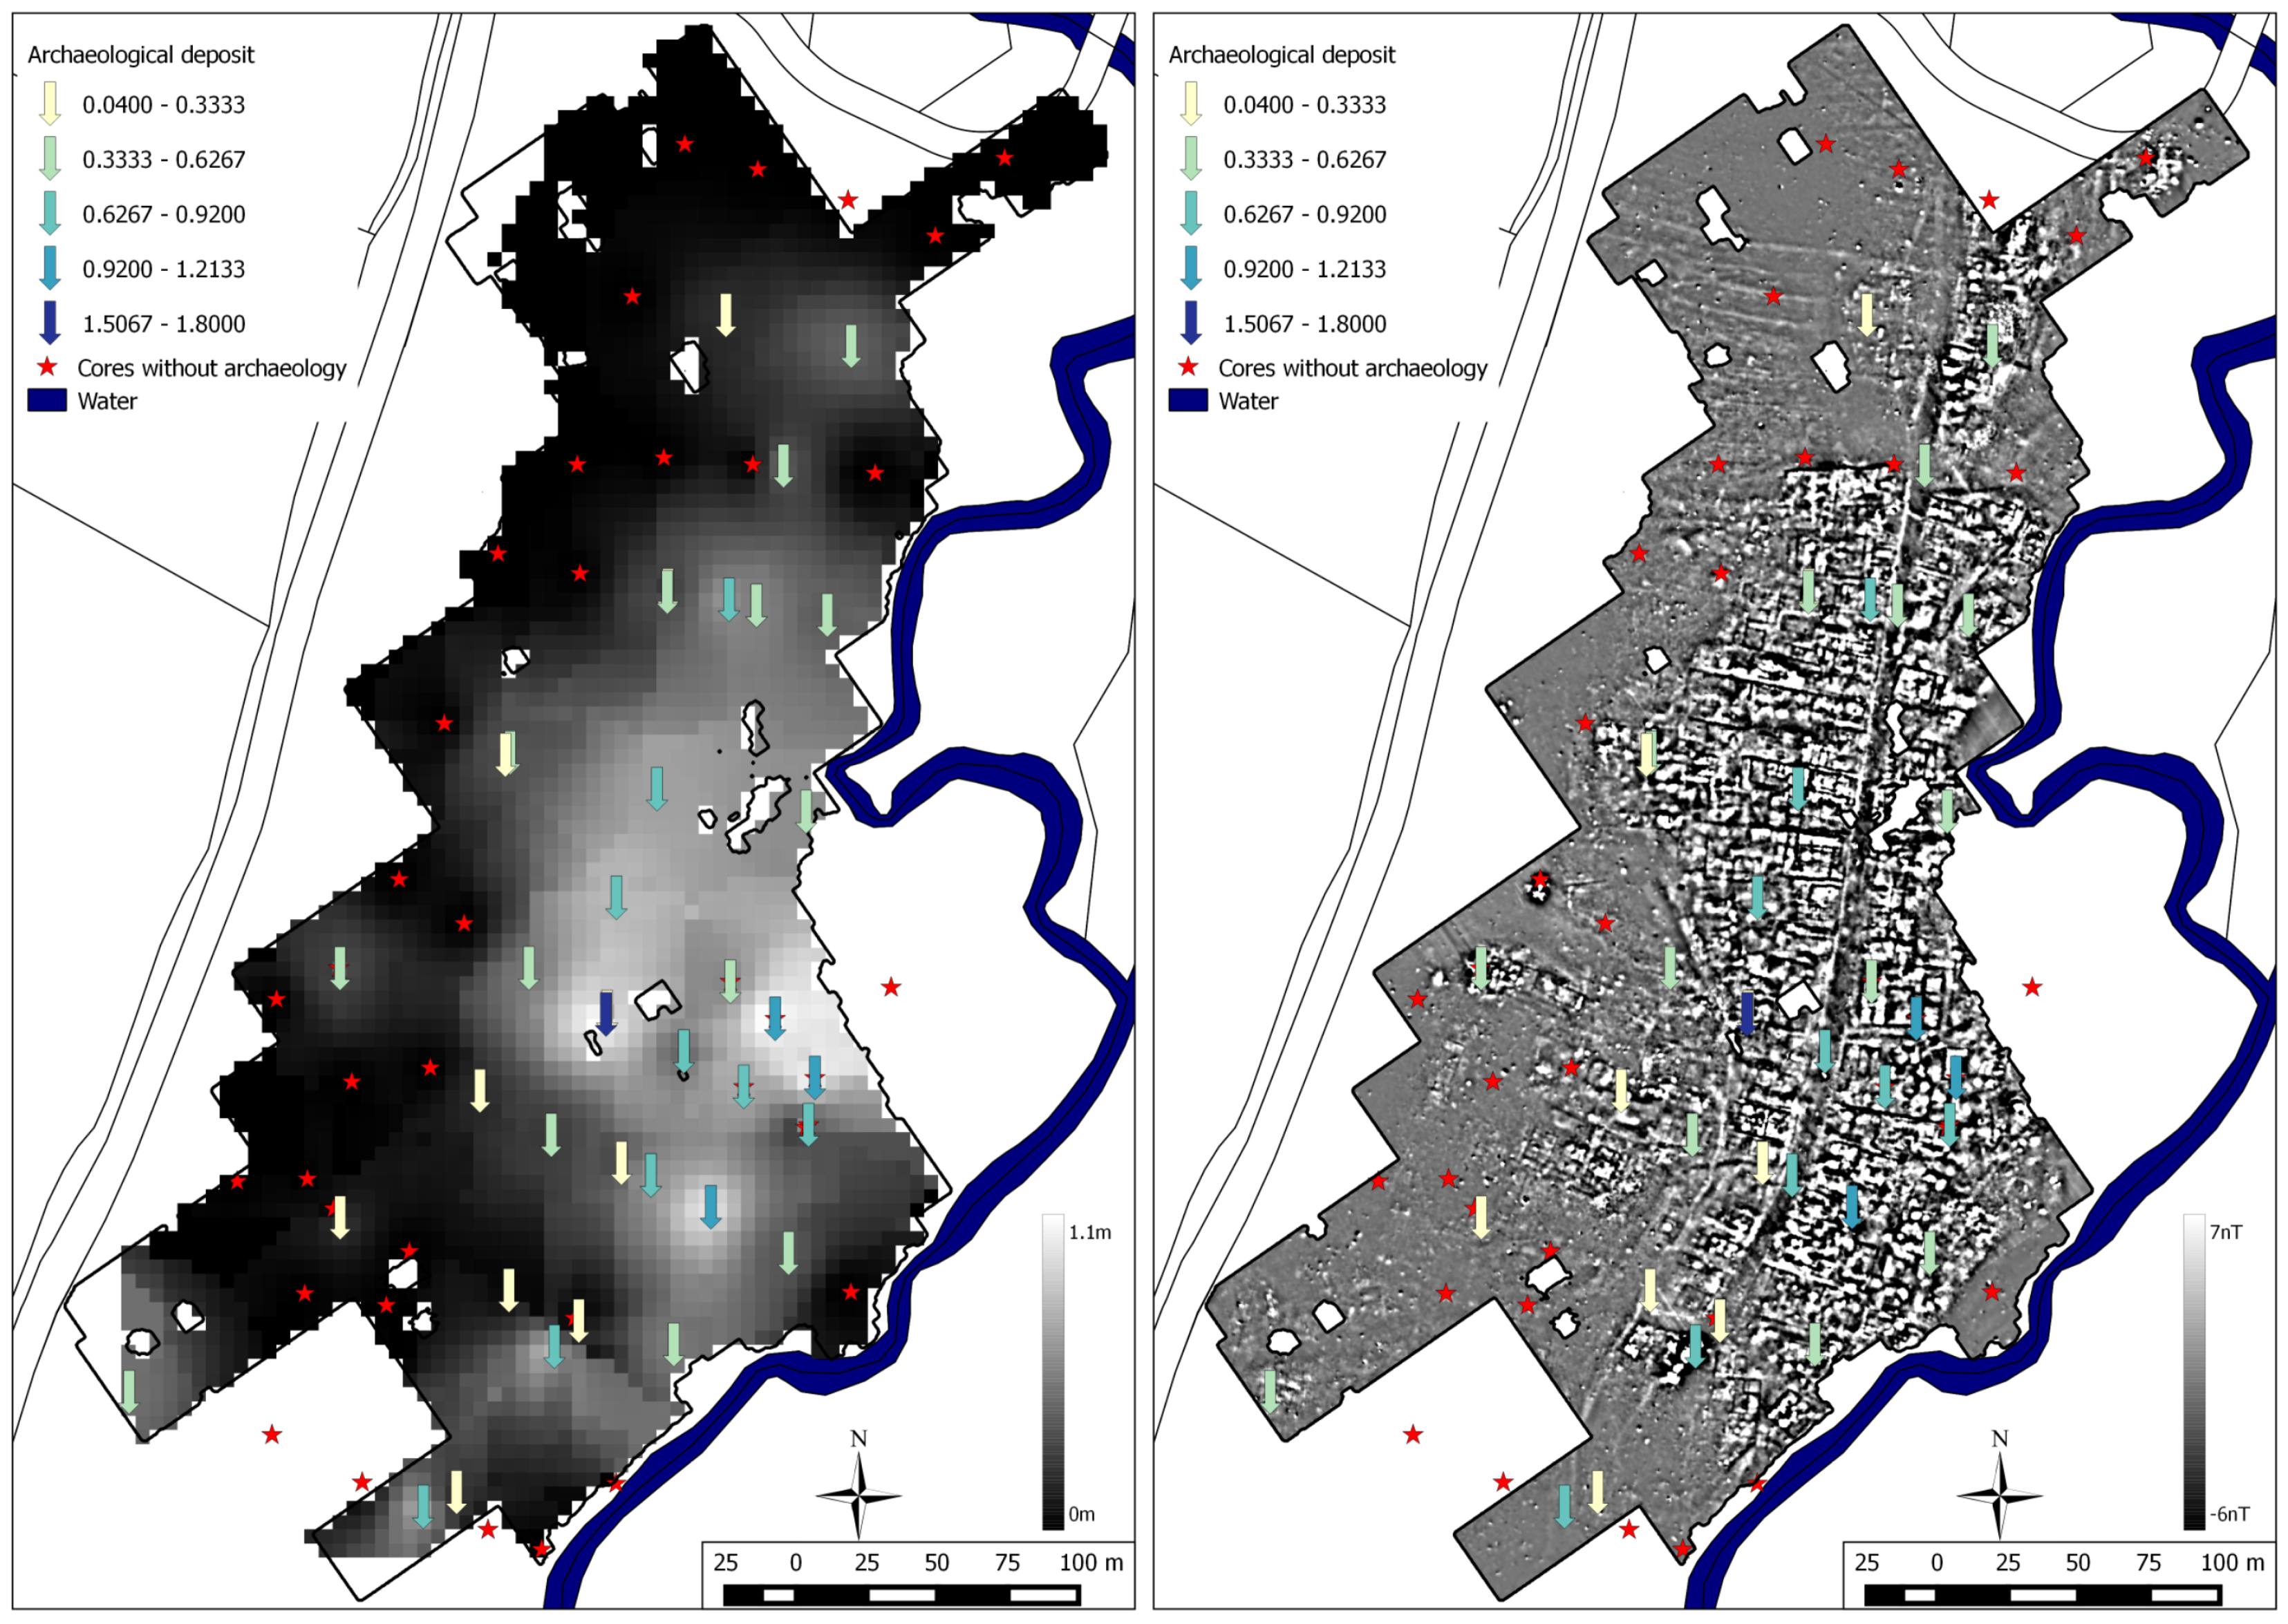
Between the 105 drilled cores, 73 showed archaeological deposits including the road and shallow obstructions, which had been attributed to walls. The majority of the cores reached undisturbed alluvial terrace deposits (silts or gravels) at between 1 and 2 m below modern ground level [
27]. The excavations performed in 2012, however, had revealed thicker archaeological deposits, near to 2 m thick, especially on the main area of Zaldua. That means that the trenches had been placed in areas where stratigraphy was especially thick and that the volume of archaeology across the site is lower than estimated until the core survey. An interpolated raster of the archaeological deposit thickness is shown for the Zaldua area in
Figure 14a.
Comparing with magnetic results, cores that showed natural sequences with no archaeology are mainly those at the edge of the surveyed area, outside the main focus of settlement area. Specifically, the northern transect (transec 14,
Figure 6) confirmed an absence of archaeological material and strengthened the interpretation of this area as the northern edge of the main settlement [
26].
Similarly, the western transect (transect 1,
Figure 6) did not detect any archaeological deposits apart from the BH23 located on the north-western limit of a possible square P5. Then, the western limit of the occupation seems to be coincident with that deduced from the magnetic survey.
The core survey across Otegi zone was less intensive and archaeological deposits were recorded in only five of the 19 holes drilled. The archaeological origin of the magnetically altered areas was, therefore, discounted. The occupation seems to be restricted to the necropolis area and to the surroundings of the road.
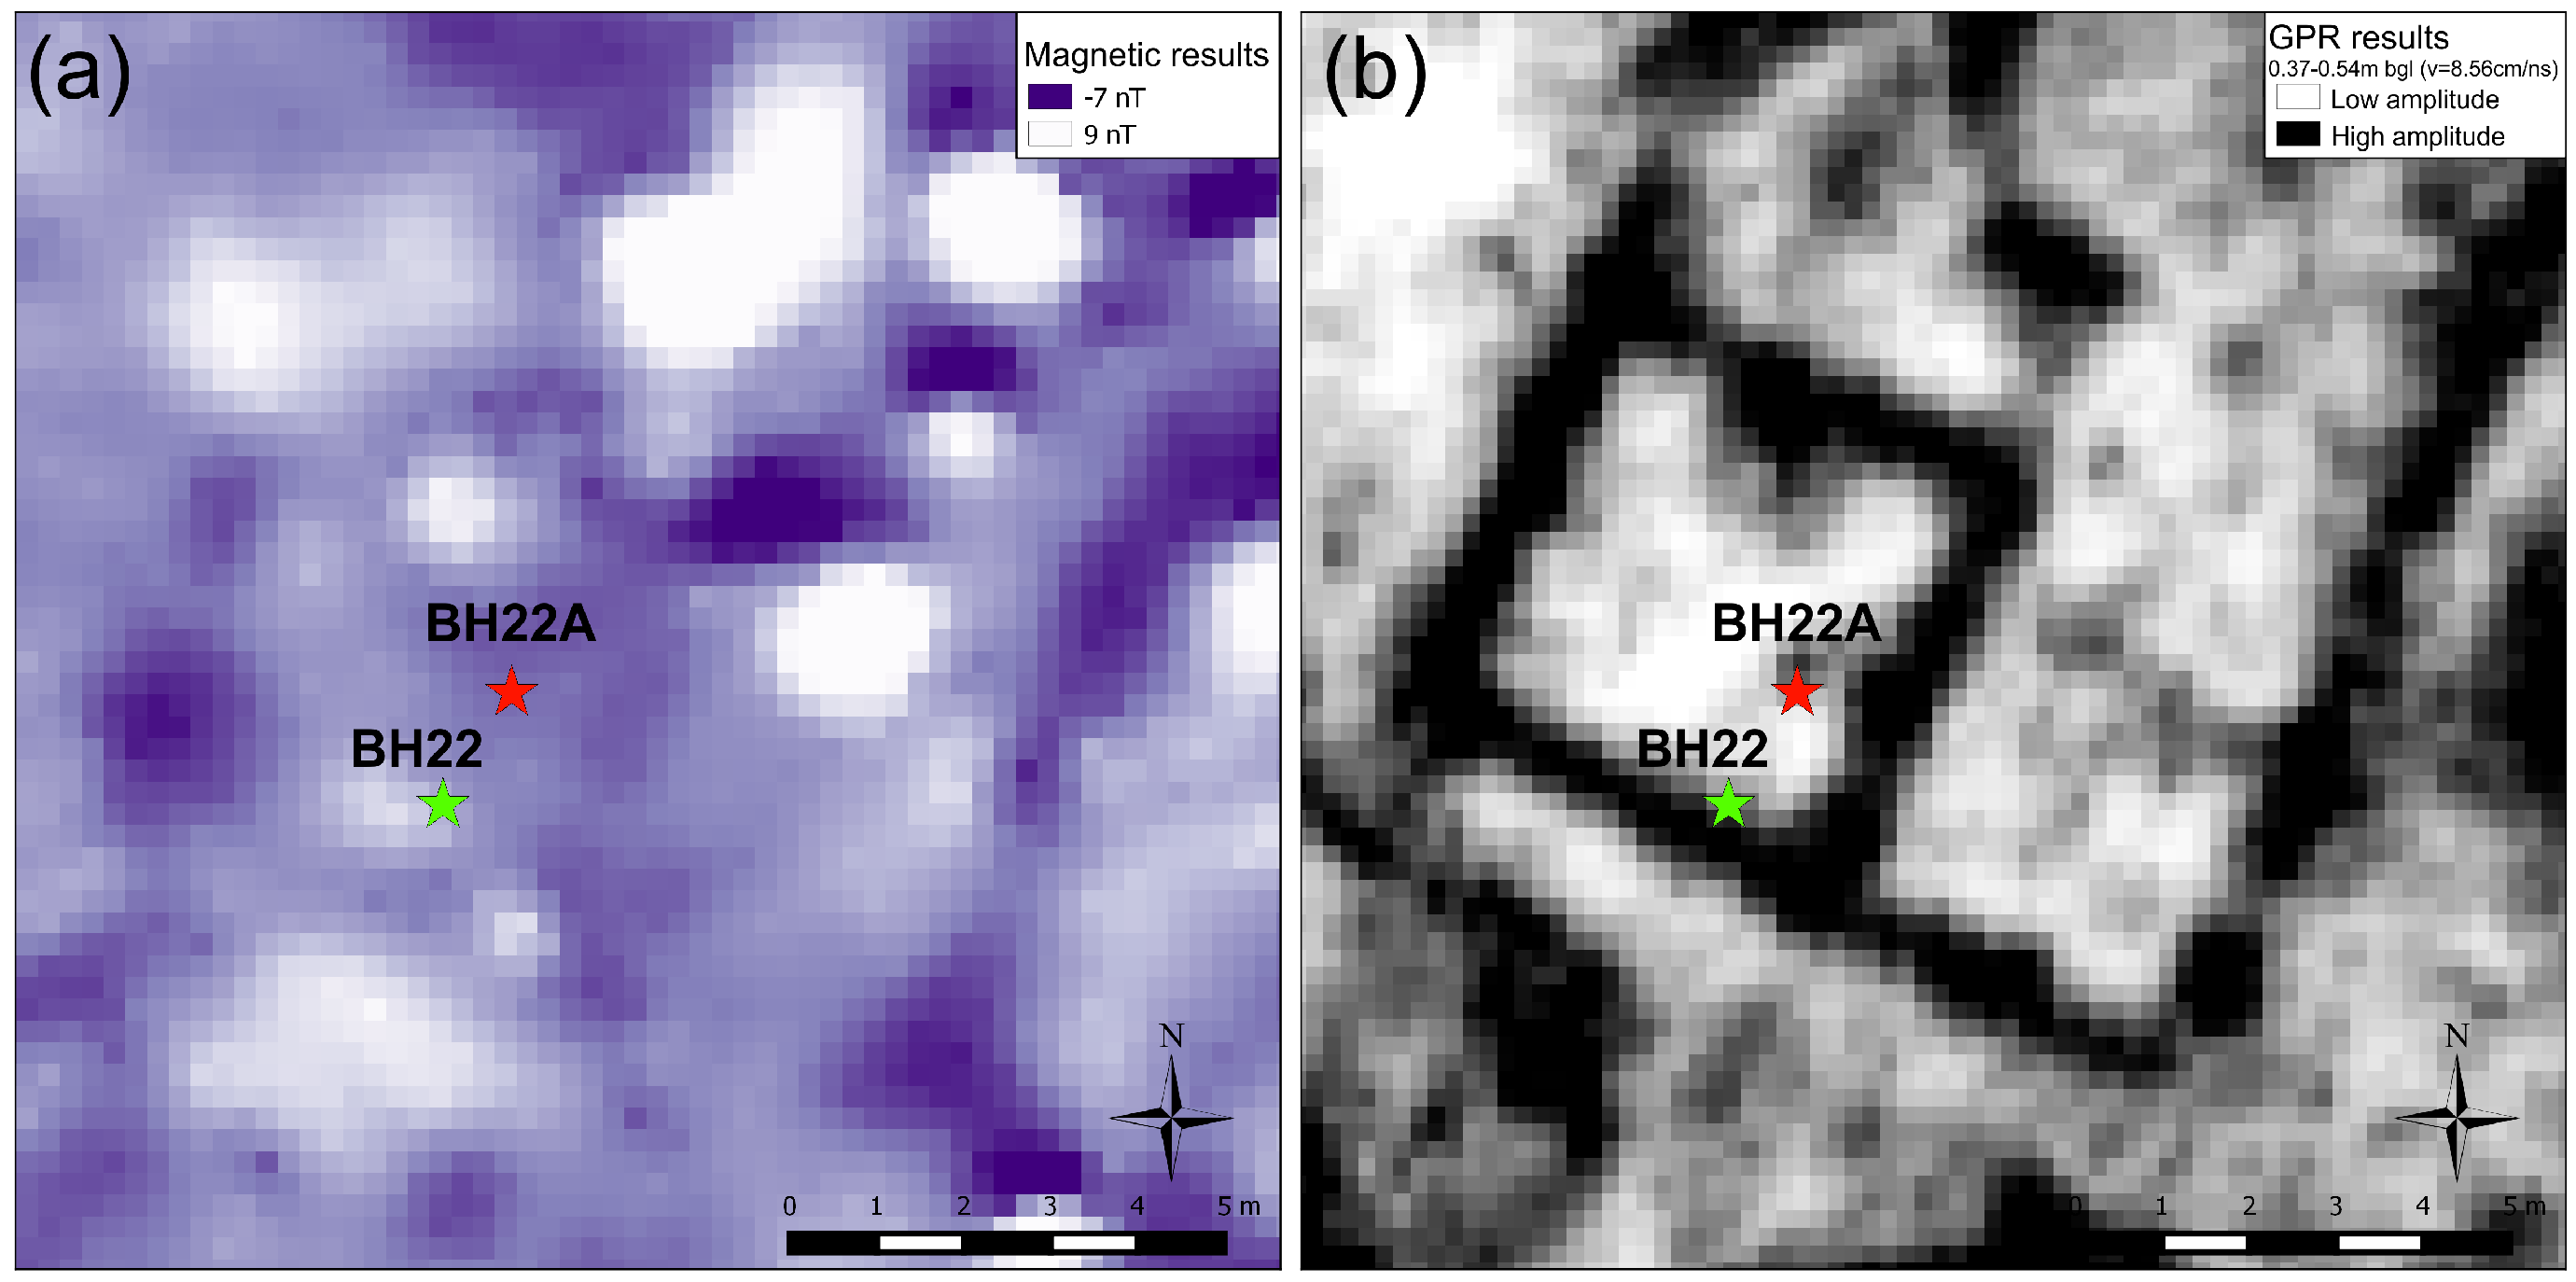
Therefore, the core survey across the site mirrors the presence and absences seen in the magnetic survey. However, when the GPR survey was performed, results revealed archaeological remains in areas were the core survey did not identify any archaeological evidence. Those areas are coincident with the areas where the magnetic contrast is not enough to detect any significant anomaly.
Figure 15 shows the location of the cores BH22 and BH22A over magnetic and GPR results. The first encountered an obstruction and, because of that, the second one was drilled. In this one no archaeological deposits were identified. The GPR results, however, clearly show a reflective rectangular anomaly attributed to the remains of a building.
Similarly,
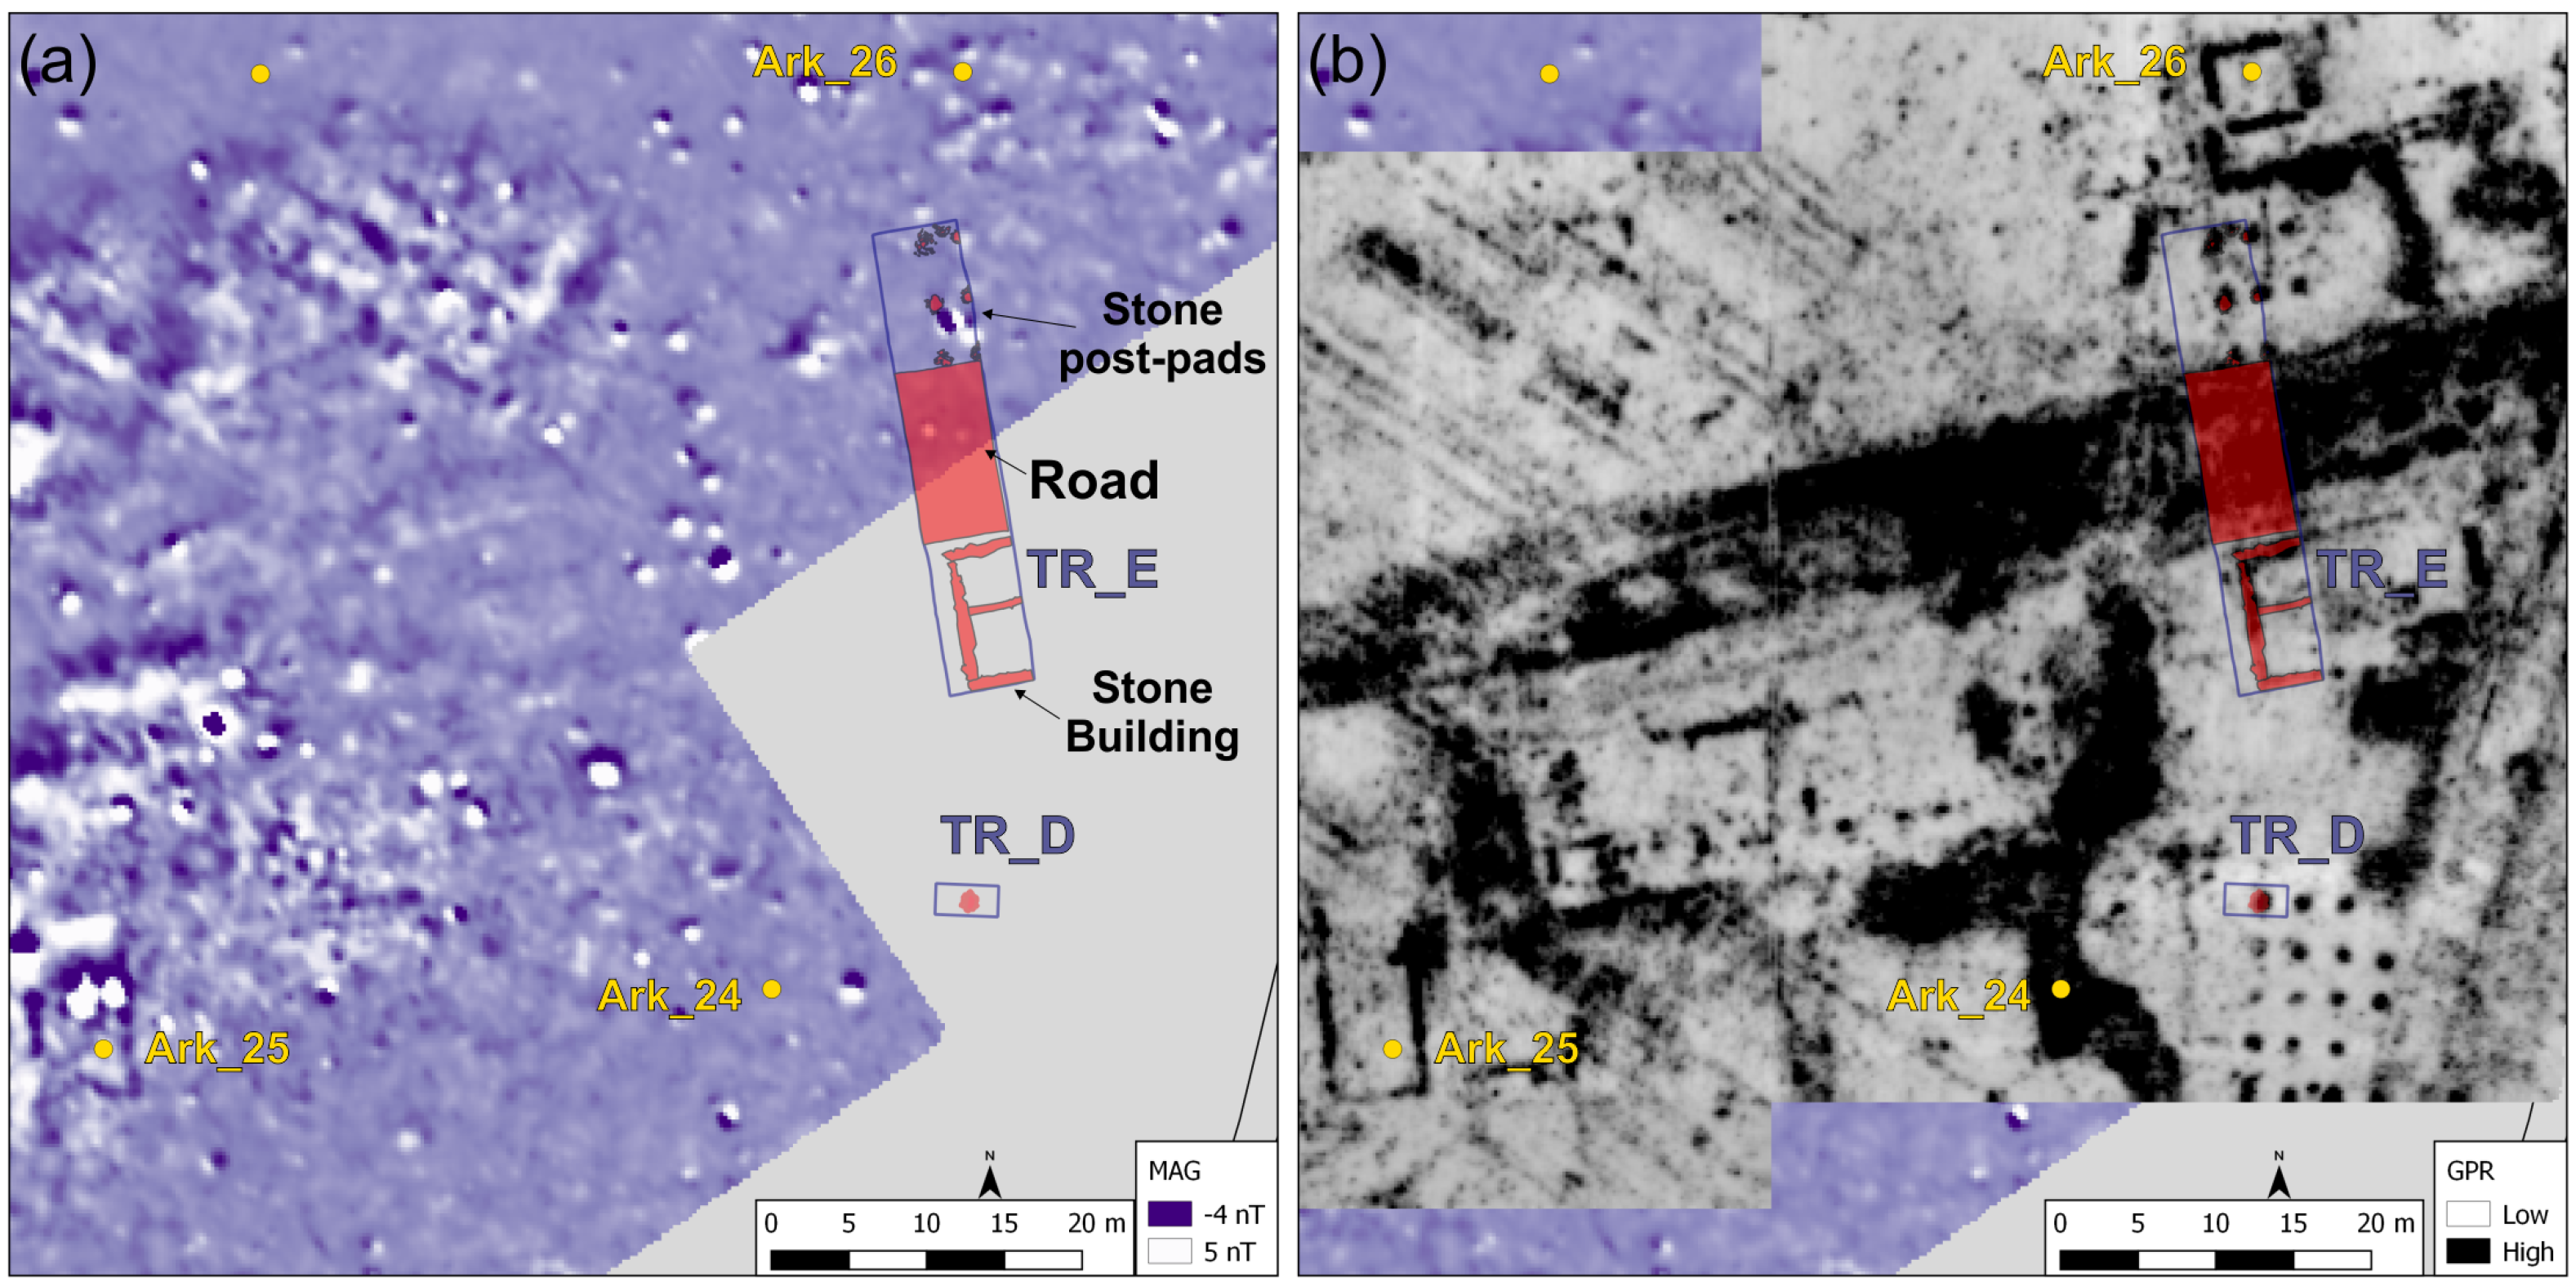
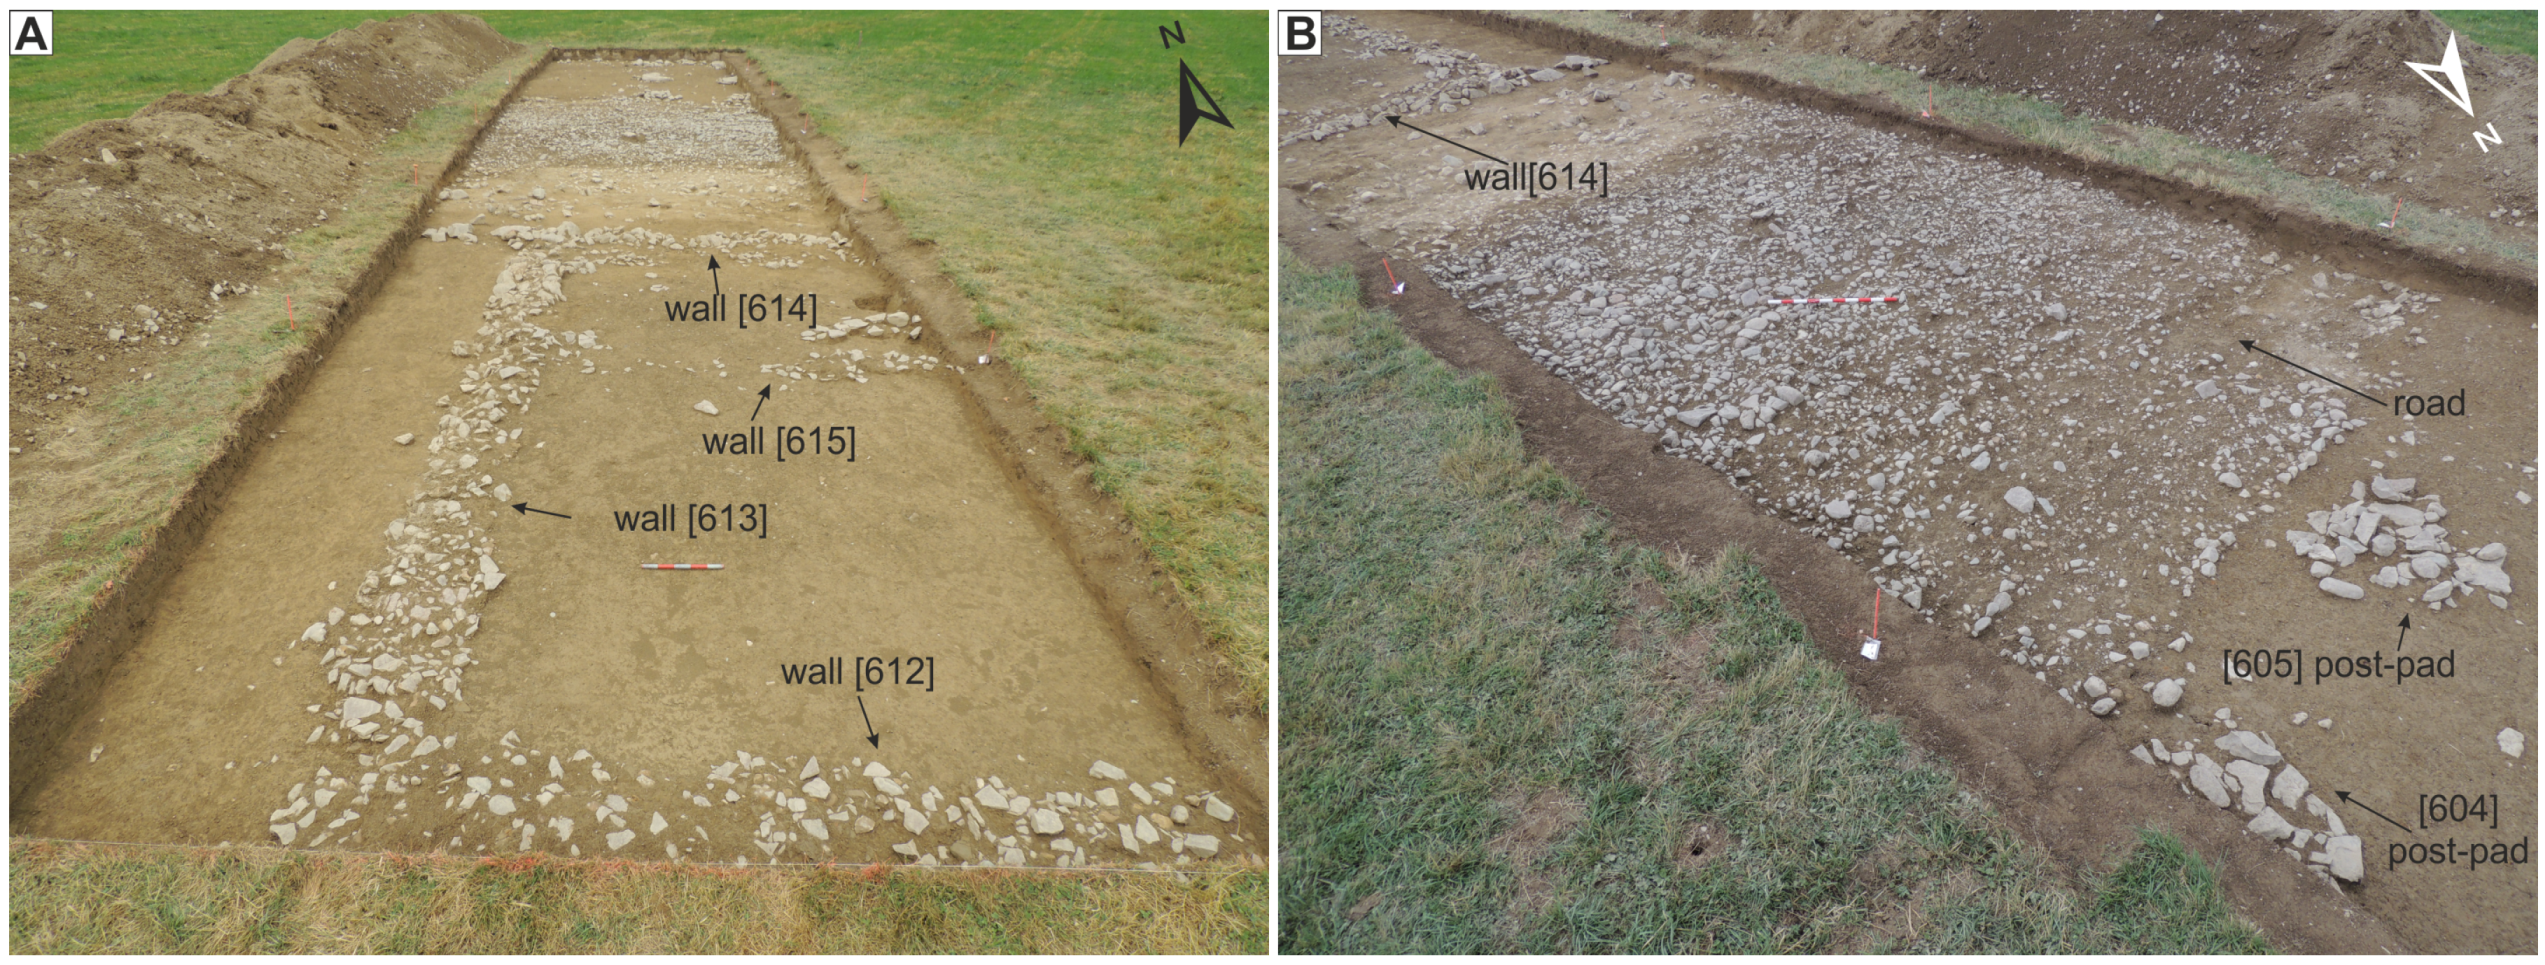
Figure 16 shows the location of a group of cores drilled in 2016 in Otegi area. Core Ark24 revealed a gravel deposit at 0.35 m bgl, corresponding to the reflective area detected in GPR results. Even that it is clear from the GPR that they have been drilled in the interior of buildings, no evidence of archaeological deposits were encountered in cores Ark25 and Ark26. Excavations performed in trench E revealed thin archaeological layers where only the building basements were preserved (
Figure 17). In that condition, the identification of archaeological sediments in the core is almost impossible, as they are the same materials of the geological sequence.
6. Conclusions
The sediment core survey approach to complement geophysical data has proven to be useful to improve the archaeological interpretation of this Roman site. Indeed, many anomalies could be targeted with limited cost in time and resources. The cores provide feedback on observations and assumptions based on geophysical data, which are hard to validate without access to the subsoil. Even the limited amount of extracted sediments, interpretations could be mainly validated and complemented. Some interpretations were discovered to be erroneous, and further investigations could be designed to resolve those anomalies.
However, the research highlights the necessity of using complementary analysis in order to have a better understanding of the geophysical properties of the involved soils. This was demonstrated in particular by the magnetic disturbance at Otegi area. It could be correlated to the shallowness of the bedrock, but the specific mechanism that produces the disturbance in not still understood. Soil analyses, such as the measurement of the magnetic and electric properties and micromorphological studies, could help to characterize better the extracted soils and determine the origin of such disturbance.
While the sediment core survey is sometimes proposed as a tool to delimit the extent of the archaeological sites (e.g., [
11,
34]), in this study it revealed to be less efficient. Results mainly mirror the presence and absences seen in the magnetic survey but, in some areas classified as non archaeological, indisputable evidence of remains had been found in further GPR investigations. Archaeological excavations conducted in 2015 and 2016 revealed that in those areas only the basement of the building remains, without evidence of any other archaeological deposit. The lack of magnetic contrast and the non identification of archaeological deposits in the cores can be therefore understood. This study proves that the identification of archaeological areas can be difficult through this method.
In summary, this study demonstrates that sediment coring is a powerful technique to target geophysical anomalies and provide feedback on archaeological interpretation in a reasonable time and cost. While the support of further analysis would help to better characterize the interactions of the environmental features and processes with the geophysical techniques, many of the targeted anomalies could be resolved by a simple observation. In addition, the extracted sediments can be sampled to further geoarchaeological investigation at inconclusive areas. Therefore, a combination between geophysical survey and sediment coring enables a more accurate archaeological interpretation and provides a robust basis for further research.
It is interesting to remark that the example outlined here is based on a Roman site of Navarre, a chronology in which often clear traces of human activity lie into the ground. Although the principles are applicable within any other chronologies and regions, depending on the site’s characteristics, the variations producing the targeted geophysical anomalies can be indiscernible by simple observation. In those cases, the validity of sediment coring to obtain a quick feedback would be compromised.
Acknowledgments
The different interventions of this research project were made possible by the volunteer work of a great number of people from the Aranzadi Science Society and the Museum of London Archaeology. In particular, the authors would like to thank all those who contributed to core surveys: Euken Alonso, Haizea Arrazola, Mikel Enparantza, Joxe Etxegoien, Juan J. Fuldáin, Enrique Lekuona, Juan Mari Mtz. Txoperena, Mary Nicholls, Peter Rauxloh, Begoña Yubero and Rafa Zubiria. The municipalities of affected areas and Eusko Kultur Fundazioa, together with some particulars, gave economical support. Finally, the authors wish to thank the Arrobi Society, which owns part of the lands explored, and to the municipality of Erro Valley, which owns the other part, for giving permission to conduct all the interventions related to the research.
Author Contributions
E. Garcia-Garcia participated in all the stages of the research after the discovery of the archaeological site in 2012 as part of her PhD research, and wrote the paper; J. Andrews participated in the core survey performed in 2014 and prepared the evaluation report; E. Iriarte participated in both core survey campaigns in 2014 and 2016, and contributed to the analysis of the results; R. Sala participated in the geophysical campaigns performed at this archaeological site; A. Aranburu supervised the research as promoter of the PhD research of E. Garcia-Garcia. J. Hill and J. Agirre-Mauleon supervised the research as directors of the archaeological project of the site.
Conflicts of Interest
The authors declare no conflict of interest. The founding sponsors had no role in the design of the study; in the collection, analyses, or interpretation of data; in the writing of the manuscript, and in the decision to publish the results.
Abbreviations
The following abbreviations are used in this manuscript:
| MDPI | Multidisciplinary Digital Publishing Institute |
| DOAJ | Directory of open access journals |
| ca. | circa |
| bgl | Below Ground Level |
| GPR | Ground Penetrating Radar |
| MHz | Mega Hertz ( Hz) |
| ns | nano seconds ( s) |
| MOLA | Museum of London Archaeology |
References
- Scollar, I.; Tabbagh, A.; Hesse, A.; Herzog, I. Archaeological Prospecting and Remote Sensing; Topics in Remote Sensing; Cambridge University Press: Cambridge, UK, 1990. [Google Scholar]
- Clark, A. Seeing Beneath the Soil: Prospecting Methods in Archaeology, 2nd ed.; Batsford: London, UK, 1996. [Google Scholar]
- Gater, J.; Gaffney, C. Revealing the Buried Past: Geophysics for Archaeologists; Tempus: Stroud, UK, 2003. [Google Scholar]
- Sala, R.; Tamba, R.; Garcia-Garcia, E. Application of Geophysical Methods to Cultural Heritage. Elements 2016, 12, 19–25. [Google Scholar] [CrossRef]
- Schmidt, A.; Linford, P.; Linford, N.; David, A.; Gaffney, C.; Sarris, A.; Fassbinder, J. EAC Guidelines for the Use of Geophysics in Archaeology: Questions to Ask and Points to Consider; Europae Archaeologiae Consilium: Namur, Belgium, 2016. [Google Scholar]
- Trinks, I.; Johansson, B.; Gustafsson, J.; Emilsson, J.; Friborg, J.; Gustafsson, C.; Nissen, J.; Hinterleitner, A. Efficient, large-scale archaeological prospection using a true three-dimensional ground-penetrating Radar Array system. Archaeol. Prospect. 2010, 17, 175–186. [Google Scholar] [CrossRef]
- Bossuet, G.; Thivet, M.; Trillaud, S.; Marmet, E.; Laplaige, C.; Dabas, M.; Hullin, G.; Favard, A.; Combe, L.; Barres, E.; et al. City Map of Ancient Epomanduodurum (Mandeure-Mathay, Franche-Comté, Eastern France): Contribution of Geophysical Prospecting Techniques. Archaeol. Prospect. 2012, 19, 261–280. [Google Scholar] [CrossRef]
- Gaffney, C.; Gaffney, V.; Neubauer, W.; Baldwin, E.; Chapman, H.; Garwood, P.; Moulden, H.; Sparrow, T.; Bates, R.; Löcker, K.; et al. The Stonehenge Hidden Landscapes Project. Archaeol. Prospect. 2012, 19, 147–155. [Google Scholar] [CrossRef]
- Garcia-Garcia, E.; de Prado, G.; Principal, J.E. Working with buried remains at Ullastret (Catalonia). Proceedings of the 1st MAC International Workshop of Archaeological Geophysics; Monografies d’Ullastret, Museu d’Arqueologia de Catalunya-Ullastret: Girona, Catalonia, 2016; Volume 3. [Google Scholar]
- Sala, R.; Garcia-Garcia, E.; Tamba, R. Archaeological Geophysics—From Basics to New Perspectives. In Archaeology, New Approaches in Theory and Techniques; InTech: Rijeka, Croatia, 2012; pp. 133–166. Available online: https://www.intechopen.com/books/archaeology-new-approaches-in-theory-and-techniques/archaeological-geophysics-from-basics-to-new-perspectives (accessed on 10 October 2017).
- Canti, M.G.; Meddens, F.M. Mechanical Coring as an Aid to Archaeological Projects. J. Field Archaeol. 1998, 25, 97–105. [Google Scholar] [CrossRef]
- Garcia-Garcia, E.; Agirre-Mauleon, J.; Andrews, J.; Aranburu, A.; Arrazola, H.; Etxegoien, J.; Fuldáin, J.; Hill, J.; Iriarte, E.; Legorburu, M.; et al. Geoarchaeological core prospection investigation to improve the archaeological interpretation of geophysical data: Case study of a Roman settlement at Auritz (Navarre). Archaeol. Polona 2015, 53, 88–91. [Google Scholar]
- Carey, C.; Howard, A.J.; Jackson, R.; Brown, A. Using geoarchaeological deposit modelling as a framework for archaeological evaluation and mitigation in alluvial environments. J. Archaeol. Sci. Rep. 2017, 11, 658–673. [Google Scholar] [CrossRef]
- Revelles, J.; Cho, S.; Iriarte, E.; Burjachs, F.; van Geel, B.; Palomo, A.; Piqué, R.; Peña-Chocarro, L.; Terradas, X. Mid-Holocene vegetation history and Neolithic land-use in the Lake Banyoles area (Girona, Spain). Palaeogeogr. Palaeoclimatol. Palaeoecol. 2015, 435, 70–85. [Google Scholar] [CrossRef]
- Horlings, R.L. Archaeological Microsampling by Means of Sediment Coring at Submerged Sites. Geoarchaeology 2013, 28, 308–315. [Google Scholar] [CrossRef]
- Neal, C. The Potential of Integrated Urban Deposit Modelling as a Cultural Heritage Planning Tool. Plan. Pract. Res. 2014, 29, 256–267. [Google Scholar] [CrossRef]
- Chapman, H.; Adcock, J.; Gater, J. An approach to mapping buried prehistoric palaeosols of the Atlantic seaboard in Northwest Europe using GPR, geoarchaeology and GIS and the implications for heritage management. J. Archaeol. Sci. 2009, 36, 2308–2313. [Google Scholar] [CrossRef]
- Ellwood, B.B.; Harrold, F.B.; Marks, A.E. Site Identification and Correlation Using Geoarchaeological Methods at the Cabeço do Porto Marinho (CPM) Locality, Rio Maior, Portugal. J. Archaeol. Sci. 1994, 21, 779–784. [Google Scholar] [CrossRef]
- Cuenca-Garcia, C.; Sarris, A.; Makarona, C.; Hafez, I. Integrated Geophysical and In-situ Soil Geochemical Survey at Dromolaxia-Vizakia (Hala Sultan Tekke, Cyprus). Archaeol. Polona 2015, 53, 72–75. [Google Scholar]
- Nowaczinski, E.; Schukraft, G.; Hecht, S.; Rassmann, K.; Bubenzer, O.; Eitel, B. A Multimethodological Approach for the Investigation of Archaeological Ditches -Exemplified by the Early Bronze Age Settlement of Fidvár Near Vráble (Slovakia). Archaeol. Prospect. 2012, 19, 281–295. [Google Scholar] [CrossRef]
- Schneidhofer, P.; Nau, E.; Leigh McGraw, J.; Tonning, C.; Draganits, E.; Gustavsen, L.; Trinks, I.; Filzwieser, R.; Aldrian, L.; Gansum, T.; et al. Geoarchaeological evaluation of ground penetrating radar and magnetometry surveys at the Iron Age burial mound Rom in Norway. Archaeol. Prospect. 2017. Available online: http://onlinelibrary.wiley.com/doi/10.1002/arp.1579/full (accessed on 10 October 2017). [CrossRef]
- Agirre-Mauleon, J.; Txoperena, J.M.; Puldain, J. Proyecto de Prospección Arqueológica en Los Términos Municipales de Luzaide-Valcarlos, Orreaga-Roncesvalles, Auritz-Burguete, Erroibar-Valle de Erro y Artzibar-Valle de Arce, Unpublished Technical Report. 2012.
- Barnolas, A.; Pujalte, V. La Cordillera Pirenaica: Definición, límites y división. In Geología de España; Sociedad Geológica de España-Instituto Geológico y Minero de España: Madrid, Spain, 2004; pp. 231–338. [Google Scholar]
- Gibbons, W.; Moreno, T. (Eds.) The Geology of Spain; Geology of Series, Geological Society of London: London, UK, 2002. [Google Scholar]
- Geological Map of Navarre. Government of Navarre 1997. Electronic Resource. Available online: http://geologia.navarra.es/ (accessed on 9 October 2017).
- Garcia-Garcia, E.; Mtz. Txoperena, J.M.; Sala, R.; Aranburu, A.; Agirre-Mauleon, J. Magnetometer Survey at the Newly-discovered Roman City of Auritz/Burguete (Navarre). Results and Preliminary Archaeological Interpretation. Archaeol. Prospect. 2016, 23, 243–256. [Google Scholar] [CrossRef]
- Andrews, J.; Hill, J.; Nicholls, M.; Rauxloh, P. Iturissa Roman Town (Navarra). Geo–archaeological Evaluation Report, Unpublished Technical Report. 2014.
- Jones, A.; Tucker, M.N.; Hart, J. The description and analysis of Quaternary stratigraphic field sections. In Technical Guide, Number 7; Quaternary Research Association: London, UK, 1999. [Google Scholar]
- Tucker, M. Sedimentary Rocks in the Field; John Wiley and Sons: Chichester, UK, 1982. [Google Scholar]
- Goodman, D.; Nishimura, Y.; Rogers, J.D. GPR time slices in archaeological prospection. Archaeol. Prospect. 1995, 2, 85–89. [Google Scholar]
- Museum of London Archaeology Service. Archaeological Site Manual, 3rd ed.; Museum of London: London, UK, 1994. [Google Scholar]
- Garcia-Garcia, E.; Agirre-Mauleon, J.; Aranburu, A.; Arrazola, H.; Hill, J.; Etxegoien, J.; Mtz. Txoperena, J.M.; Rauxloh, P.; Zubiria, R. The Roman settlement at Auritz (Navarre): Preliminary results of a multi-system approach to asses the functionality of a singular area. Archaeol. Polona 2015, 53, 92–94. [Google Scholar]
- Garcia-Garcia, E. Geofisika Tekniken Karakterizazioa Euskal Herriko Antzinateko Aztarnategi Arkeologikoetan. Ph.D. Thesis, Euskal Herriko Unibertsitatea (EHU/UPV), Leioa, Basque Country, 2017. [Google Scholar]
- Rapp, G.R.; Hill, C.L. Geoarchaeology: The Earth-Science Approach to Archaeological Interpretation, 2nd ed.; Yale University: New Haven, CT, USA, 2006. [Google Scholar]
© 2017 by the authors. Licensee MDPI, Basel, Switzerland. This article is an open access article distributed under the terms and conditions of the Creative Commons Attribution (CC BY) license (http://creativecommons.org/licenses/by/4.0/).

 ,
, 


