Prediction of Mineral Composition in Commercial Extruded Dry Dog Food by Near-Infrared Reflectance Spectroscopy


Department of Agronomy, Food, Natural Resources, Animals and Environment, University of Padova, Viale dell’Università 16, 35020 Legnaro (PD), Italy
*
Author to whom correspondence should be addressed.
Animals 2019, 9(9), 640; https://doi.org/10.3390/ani9090640
Submission received: 12 July 2019
/
Revised: 22 August 2019
/
Accepted: 29 August 2019
/
Published: 1 September 2019
(This article belongs to the Section Companion Animals)
Abstract
:Simple Summary
Mineral content in dog food is essential to ensure animals’ adequate development and health status, but its analysis is time-consuming and companies are not always equipped with the technology to perform it. Near-infrared spectroscopy (NIRS) is a rapid, objective, easy to manage, chemical-free, and non-destructive method that is already available in the food industry for the prediction of gross composition (e.g., moisture, protein, fat, etc.). However, this technological approach is not yet used for the prediction of minerals because there is scarce information regarding the feasibility of NIRS to predict minerals in pet food. Results of this study revealed that, among all minerals analyzed, adequate NIRS prediction models were obtained for S and K for extruded dry dog food. The development of prediction models for mineral content in dry dog food opens the possibility of on-line and at-line analyses of minerals in the products during the manufacturing process, which could help the manufacturing decision support system in the pet food industry.
Abstract
The pet food industry is interested in performing fast analyses to control the nutritional quality of their products. This study assessed the feasibility of near-infrared spectroscopy to predict mineral content in extruded dry dog food. Mineral content in commercial dry dog food samples (n = 119) was quantified by inductively coupled plasma optical emission spectrometry and reflectance spectra (850–2500 nm) captured with FOSS NIRS DS2500 spectrometer. Calibration models were built using modified partial least square regression and leave-one-out cross-validation. The best prediction models were obtained for S (coefficient of determination; R2 = 0.89), K (R2 = 0.85), and Li (R2 = 0.74), followed by P, B, and Sr (R2 = 0.72 each). Only prediction models for S and K were adequate for screening purposes. This study supports that minerals are difficult to determine with NIRS if they are not associated with organic molecules.
1. Introduction
Companion animals’ population is increasing worldwide, which has contributed to the growth of the pet food industry over the last decade in terms of sold volume and revenues [1]. The constant request for a better quality product from the animals’ owners makes the pet food sector particularly careful in ensuring foods that are nutritionally adequate for the health and welfare of the animals. Complete dog food has to supply the nutrients necessary to fulfil companion animals’ daily nutritional requirements without impairing animals’ health. Minerals play an important role in animals’ health and development. Calcium, P, and Mg are associated with the development and maintenance of bones and teeth, as well as muscle development. Potassium and Na are responsible for the body’s acid-base and fluid balance, and S is necessary for the dog’s hair, skin, and nails. Nevertheless, the excess of some minerals could impair animals’ health and be detrimental for the bioavailability of some trace minerals such as Fe [2,3] causing anemia, Mn [4,5] decreasing growth rate and leading to soft-tissue calcification, Cu [6,7] contributing to the development of hepatic and neurological disorders, and Zn [8,9,10] affecting skin, hair, and animals’ growth. Boron and Sr are related to Ca metabolism [11]. Molybdenum intervenes in several enzymatic reactions, an excess of Cr is related to gastroenteritis, dermatitis, kidney insufficiency, and liver damage, and Ni deficiency affects development and reproduction of the animal, as well as absorption and deposition of other minerals [12]. Vanadium has been demonstrated to have a hypoglycemic effect in dogs [13], and toxicity of Li [14], Ba [15], and Al [12] have been reported in dogs. On the other hand, the restriction of P intake has been recommended to prevent the appearance of kidney diseases [16,17,18], the reduction of Mg and P intake to diminish the probability to develop struvite uroliths [19], and the reduction of Ca and P intake to decrease the risk of calcium oxalate stones [20] and skeletal disorders [21]. To help owners in their buying decisions, it is mandatory for mineral content to be indicated on the label of companion animal food, depending on the ingredients used [22].
The analytical determination of minerals requires time and labor; it is expensive, and many pet food manufacturers may not have a laboratory equipped with the necessary instruments to perform such analyses. Therefore, the pet food industry is interested in more cost-effective and fast methods for the determination of minerals. Near-infrared spectroscopy (NIRS) is a rapid, objective, easy to manage, chemical-free, and non-destructive method that provides analysis of several traits simultaneously at a lower cost than the common reference analyses [23,24]. This technology is routinely used in most pet food factories for the determination of gross composition of their products, such as moisture, protein, and fat. It is difficult to achieve accurate prediction models for the determination of minerals with infrared spectroscopy because they do not have a specific absorption band in the infrared region [25]. The bonds that could be predicted with NIRS are O–H, C–H, N–H, and S–H [26], because NIRS responds to the bonding energies of hydrogen [27]. However, minerals can be predicted if they are part of organic complexes [27], or due to the alteration that minerals produce in the water region of the spectrum [25,27,28]. Prediction models for some minerals have been successfully proposed for cheese (Ca, P, S, Mg, Zn, and Cu [29]; Na and K [30]; Ca and Zn [31]) and processed meat products (Na [32]; [33,34]). Although, only one study has evaluated NIRS ability to determine minerals in pet food, showing unsatisfactory results in dry dog food [35]. Thus, the aim of the present study was to assess the feasibility of near-infrared spectroscopy to predict mineral content in extruded dry dog food.
2. Materials and Methods
2.1. Sample Selection
A total of 119 dry extruded commercial dog food sealed packages of 2, 2.5, and 3 kg were collected from September 2017 to January 2019 from a pet food factory in North Italy (Dorado S.r.l., Monsole di Cona, Venice, Italy) and stored in the dark at room temperature until their analysis. Samples were analyzed at the food laboratory of the Department of Agronomy, Food, Natural resources, Animals and Environment of the University of Padova (Legnaro, Italy) after receiving the product. A description of the dog food varieties included in this study based on the main protein source is displayed in Table 1 and gross composition (moisture, crude protein, ether extract, crude fiber, ash, and nitrogen-free extract) in Table 2. The different pet food compositions and the number of samples for each main protein source represent the availability of these products in the Italian pet food market. Moreover, pet food varieties included were intended for puppy and adult dogs, and small, medium, and large dog breed sizes. To develop more accurate NIRS prediction models, it is important to have a large variability of the reference data [36] and a set of samples that represents the population that will be analyzed in the future [35]. According to a standardized internal laboratory protocol, 100 g of each package was ground with a knife mill (Retsch Grindomix GM200, Retsch GmbH & Co, Haan, Germany) to pass through a 1 mm screen, and divided into two aliquots; the first one for the reference analysis and the second one for the NIRS analysis.
2.2. Mineral Reference Analyses
Major mineral (Ca, P, Mg, Na, K, and S) and trace mineral (Al, B, Ba, Cr, Cu, Fe, Li, Mn, Mo, Ni, Sr, V, and Zn) analyses were performed by mineralization of 350 mg of each ground sample in closed vessels with nitric acid in a microwave digestion system (Ethos 1600 Milestone S.r.l., Sorisole, Bergamo, Italy). Samples were diluted in ultrapure water to obtain a final volume of 25 mL, and then concentrations were quantified with inductively coupled plasma optical emission spectrometry (ICP-OES) Ciros Vision EOP (Spectro Analytical Instruments GmbH, Kleve, Germany). The ICP-OES determined Ca at 317.933 nm, P at 178.287 nm, Mg at 285.213 nm, Na at 589.592 nm, K at 766.941 nm, S at 182.034 nm, Al at 167.078 nm, B at 249.677 nm, Ba at 455.404 nm, Cr at 267.716 nm, Cu at 324.754 nm, Fe at 259.941 nm, Li at 670.780 nm, Mn at 257.611 nm, Mo at 202.095 nm, Ni at 231.604 nm, Sr at 407.771 nm, V at 292.464 nm, and Zn at 213.856 nm. All the minerals quantified were above the limit of detection of the instrument (0.001 ppm), with the exception of 11 samples for V.
All instrument operating parameters were optimized for acid solution and the conditions of ICP-OES were 2 mL/min of sample aspiration rate, plasma power 1350 W, coolant flow 11 L/min, auxiliary flow 0.60 L/min, nebulizer flow 0.75 L/min, and integration time of 28 s. Calibration standards for each mineral were prepared from monoelement solutions (Inorganic Ventures, Christiansburg, VA, USA) with 5% nitric acid and 65% Suprapur at concentration of 0, 1, 2, 5, 10, 20, 50, and 100 mg/L.
2.3. Near-Infrared Spectra Collection
To obtain the spectra of each sample, 50 g of ground product was placed in a large sample FOSS cup (diameter 105 mm, depth 35 mm; FOSS Electric A/S, Hillerød, Denmark) and scanned with NIRS DS2500 (FOSS Electric A/S, Hillerød, Denmark) every 0.5 nm from 850 to 2500 nm wavelength at room temperature. Each spectrum was an average of 32 sub-spectra recorded at eight different points by rotating the sample FOSS cup automatically. Spectra were collected through ISIscan Nova and Mosaic software (FOSS Electric A/S, Hillerød, Denmark) and recorded as log(1/reflectance).
2.4. Chemometric Data Analysis
The chemometric analysis was carried out using WinISI 4 software (Infrasoft International, Port Matilda, PA, USA). Modified partial least squares regression analysis was used to develop the prediction models for each mineral using leave-one-out cross-validation, which excludes a single sample in each iteration. In order to optimize the calibration accuracy for each mineral, i.e., to obtain a higher coefficient of determination and residual predictive deviation, three passes of outlier elimination were applied. A critical T-value of 2.5 was set for T outliers, thus samples for which the predicted value differed more than 2.5 standard error of cross-validation from the reference one were removed. Several combinations of scatter corrections (NONE, no correction; D, detrending; SNV, standard normal variate; SNV + D, standard normal variate and detrending; MSC, multiplicative scatter correction; WMSC, weighted multiplicative scatter correction; ISC, inverted scatter correction) and mathematical treatments [0,0,1,1; 1,4,4,1; 1,8,8,1; 2,5,5,1; 2,10,10,1; where the first digit is the number of the derivative, the second is the gap over which the derivative is calculated, the third is the number of data points in the first smoothing, and the fourth is the number of data points in the second smoothing] were tested [37].
The best model for each mineral was selected based on the number of latent factors (LF), the coefficient of determination of calibration (R2C) and of cross-validation (R2CrV), the standard error of calibration (SEC) and of cross-validation (SECrV), and the residual predictive deviation of cross-validation (RPD), which was calculated as the ratio between SD and SECrV [38]. Interpretation of R2CrV was based on Karoui et al. [39], who reported that a prediction model with a coefficient of determination between 0.66 and 0.81 could give an approximate quantitative estimation of the reference value, a coefficient of determination between 0.82 and 0.90 could give a good estimation, and above 0.91 could give an excellent estimation. Interpretation of RPD was based on Williams [40] for complex feed matrix, who indicated the applicability of the prediction models based on the RPD obtained. A prediction model with an RPD below 1.9 is not recommended to be used, an RPD between 2.5 and 2.9 could be applied for screening, an RPD above 3.0 could be adequate for quality control, and an RPD above 4.0 could be adequate for any application [40]. Moreover, normality of residuals of the predicted models was assessed and a t-test was performed to determine whether the bias differed statistically from zero using SAS ver. 9.4 (SAS Institute Inc., Cary, NC, USA).
3. Results
3.1. Chemical Composition
The most abundant mineral was Ca (13.57 g/kg in dry matter basis, DM), followed by P (9.94 g/kg DM) and K (7.19 g/kg DM; Table 3). The lowest variability among major minerals was observed for Mg (coefficient of variation (CV) = 17%) and the greatest one for K (CV = 40%), with a CV above 30% for Na, P, Ca, and S. A total of 13 trace minerals were quantified, being the most abundant Fe (379.87 mg/kg DM) and the lowest one Li (0.19 mg/kg DM; Table 3). The lowest variability among trace minerals was observed for Fe and Mn (CV = 25%), and the greatest one for Sr (CV = 61%), with a CV above 30% for the rest of minerals.
3.2. Near-Infrared Spectroscopy Prediction Models
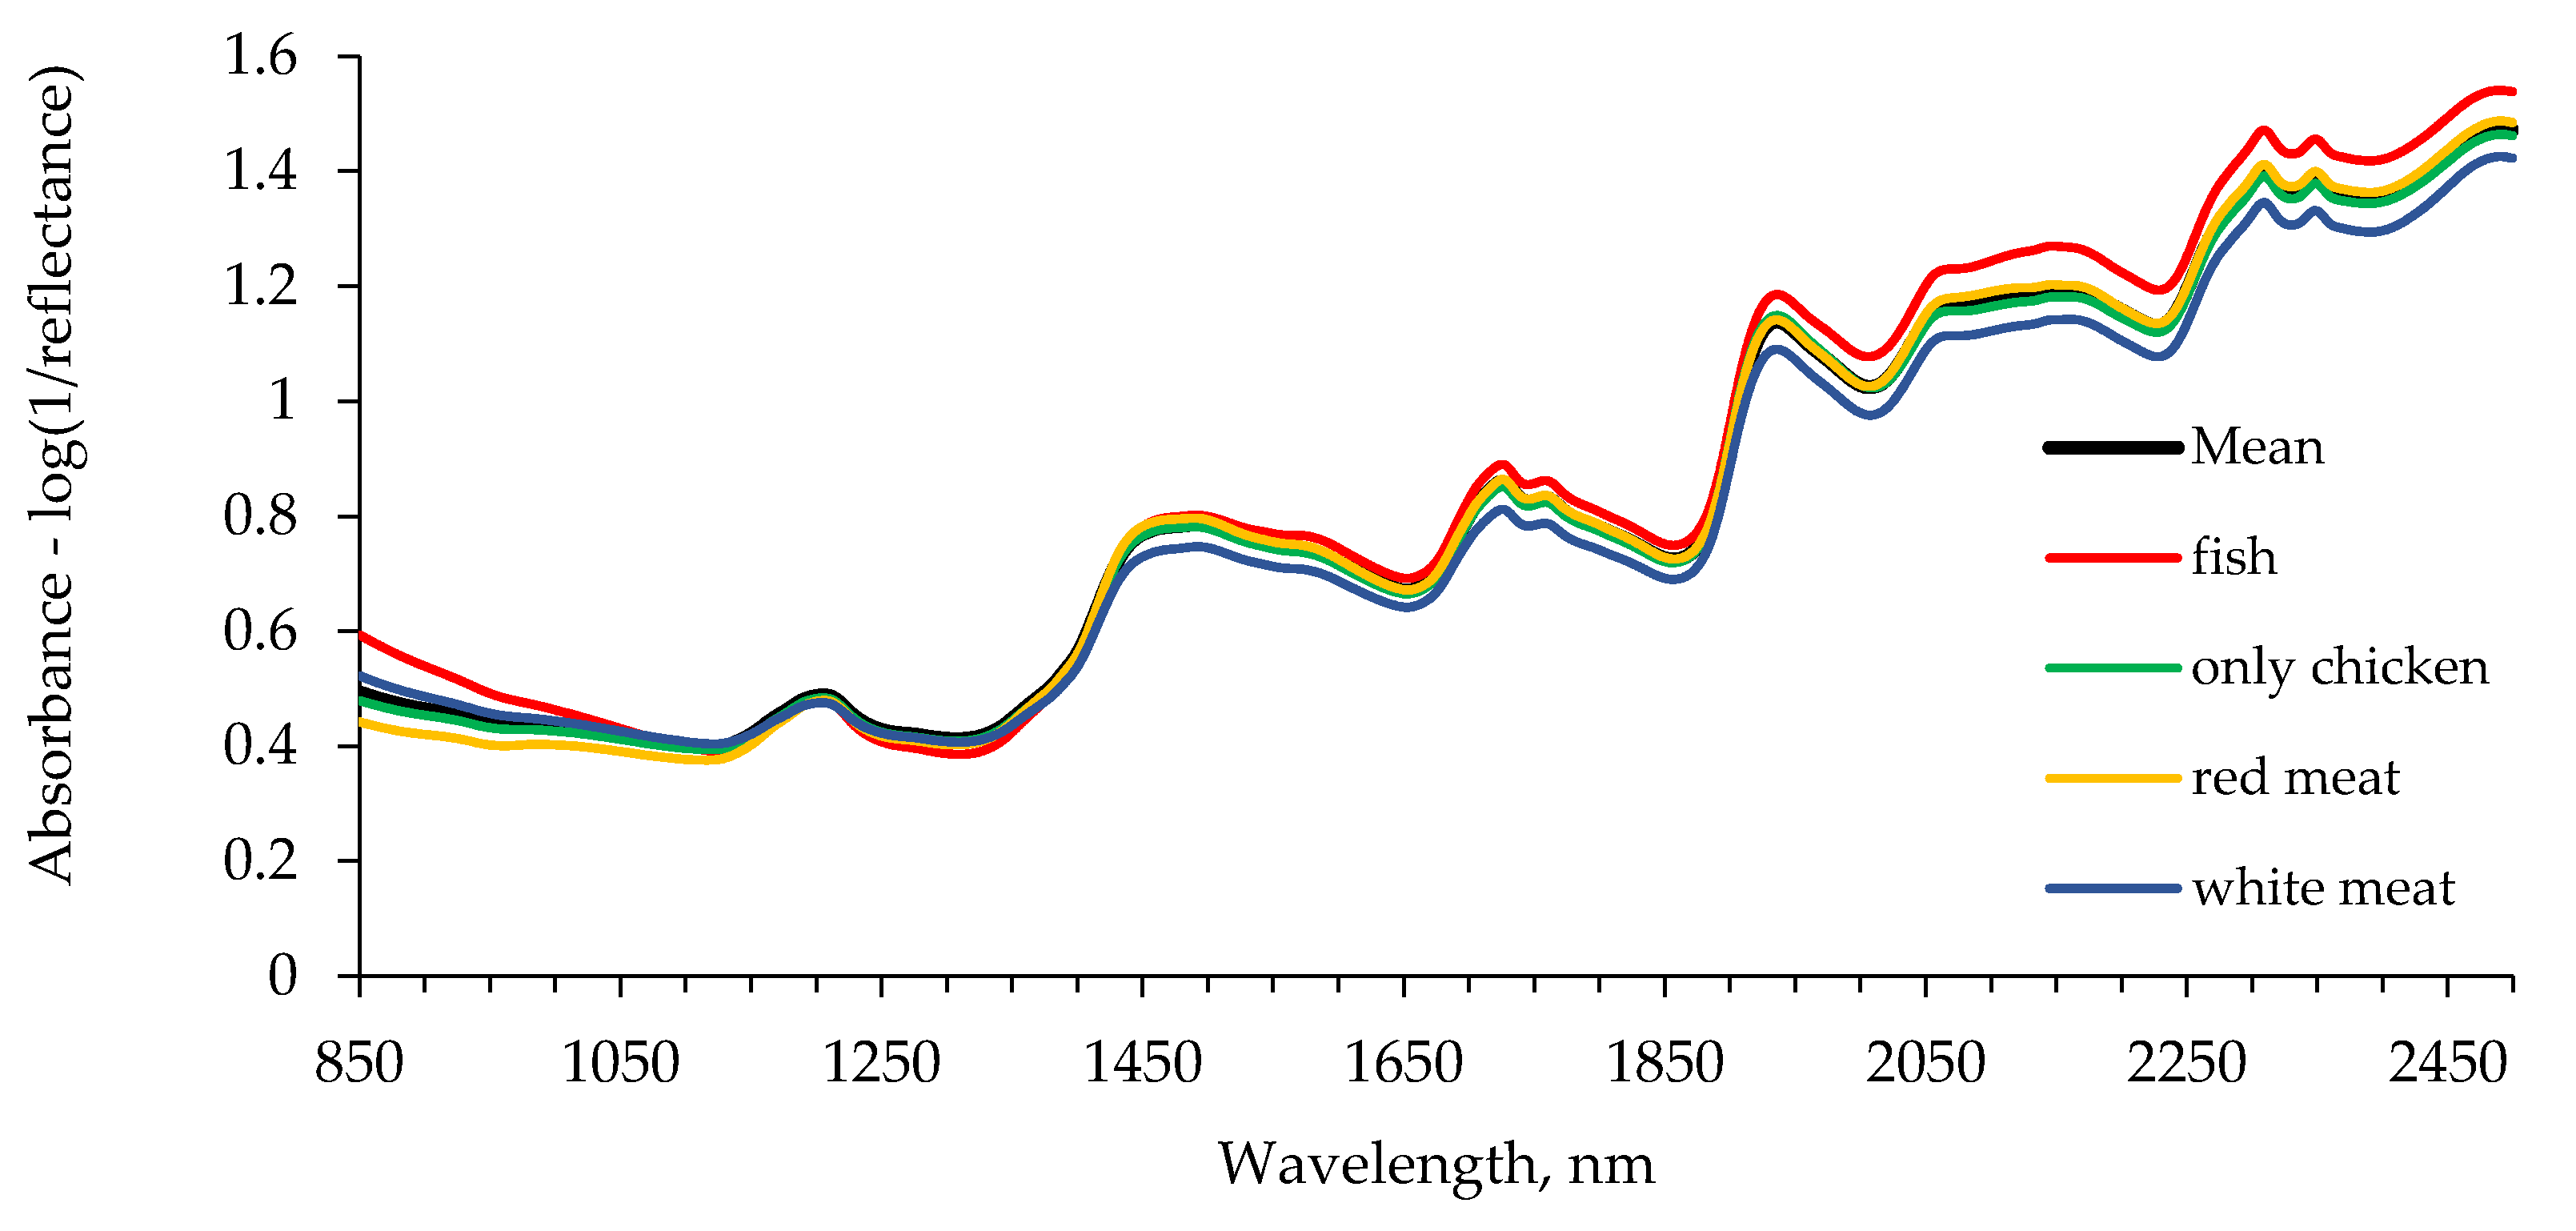
Average raw absorbance spectrum for extruded dry dog food is depicted in Figure 1. The average raw spectra, as well as the spectra of the samples considering the groups indicated in Table 1, followed the same pattern. On the raw spectrum, a first and defined peak was observed at 1208 nm and a wider peak that included wavelengths from 1450 to about 1505 nm. Further peaks were found close to 1726, 1760, and 1938 nm. Moreover, a wide peak from 2060 to 2170 nm, and two peaks at 2307 and 2350 nm were also observed.
The statistics of the best NIRS prediction models for each mineral are reported in Table 4. Outliers detected were <11% for all the minerals, except for Cu (14% of outliers). Latent factors ranged from 8 (Ca and Na) to 10 (P) for major minerals, and from 1 (Cu and Cr) to 10 (Fe) for trace minerals. The most selected scatter correction was D, and half of the equations chosen were developed applying a second derivate, over a gap of ten or five data points.
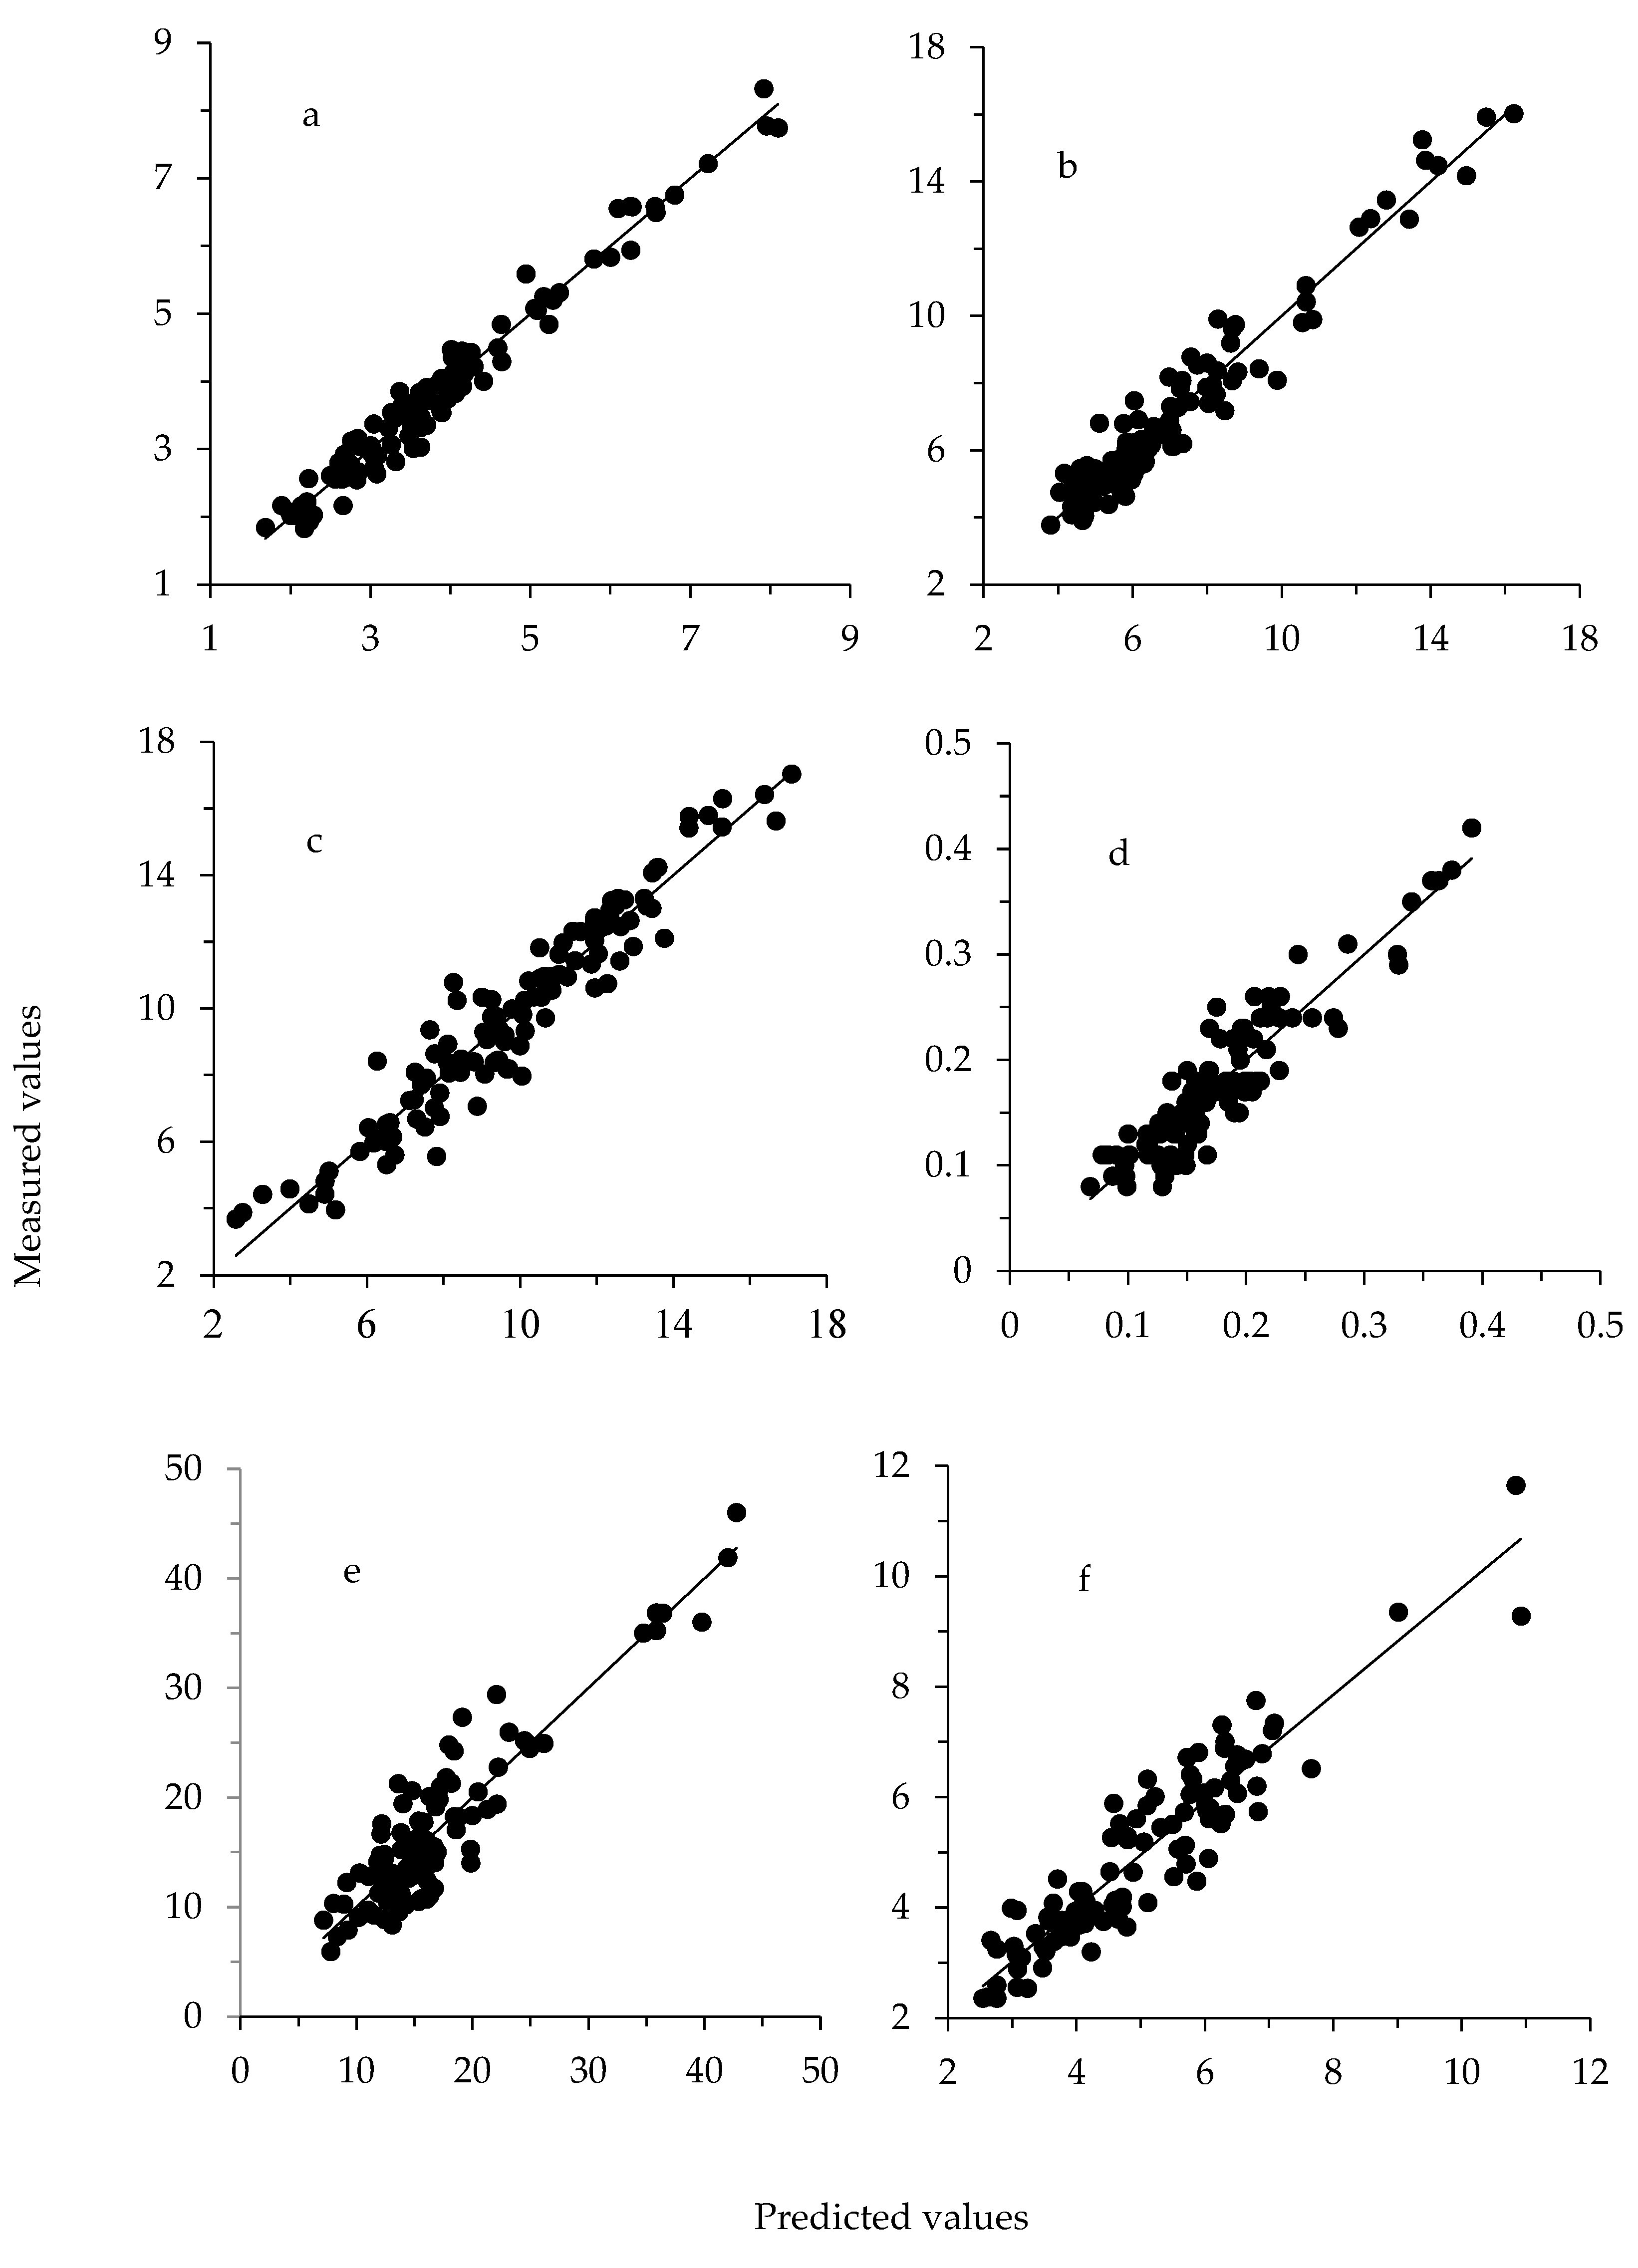
The R2C was greater than the R2CrV, and the best prediction models were obtained for S (RPD = 3.04) and K (RPD = 2.58). Moreover, the minerals with greater RPD were those with greater CV. For trace minerals, prediction equations with RPD close to 2.0 were obtained for Li, B, and Sr. Considering major minerals, the prediction model with the lowest accuracy was obtained for Ca (RPD = 1.49), whereas among trace minerals they were obtained for Cr, Mn, and Cu (RPD between 1.10 and 1.16). The linear regression of measured versus predicted values for the best three major and trace minerals prediction equations (R2CrV > 0.66) are represented in Figure 2. Residuals of those prediction equations were normally distributed and bias did not differ from zero.
4. Discussion
4.1. Chemical Composition
The average gross composition and minerals of the samples were consistent with FEDIAF recommendations [41]. The greater abundance of Ca, P, and K among all the major minerals agreed with several authors [35,42,43]. In contrast with our results, Alomar et al. [35] reported the lowest variability for K and the greatest for Mg and Ca, with a CV below 30% for P and Na; whereas Pereira et al. [43] observed the lowest CV for P and the greatest for Ca, with a variability that ranged from 27 to 38%. Moreover, Alomar et al. [35] and Pereira et al. [43] determined some trace minerals in dog food. Alomar et al. [35] reported similar values for Fe, Cu, Mn, and Zn, but a greater variability of Mn content. Pereira et al. [43] reported a similar quantity of Cu and Mn, but a lower content of Fe with greater variability, and a greater content of Zn with a similar variability compared with the present study.
4.2. Near-Infrared Spectroscopy Prediction Models
The average NIRS raw spectrum obtained followed a similar shape to those previously reported in unground [44] and ground dog food samples [35]. Peaks nearby 1208, 1728, 1762, 2308, and 2348 nm are assumed to be related to lipids. In particular, they have been assigned to a CH second overtone (1208 nm), CH first overtone (1728 and 1762 nm), and CH stretch and deformation in a CH2 group (2308 and 2348 nm; [31]). However, Hervera et al. [45] indicated that the peak at 1210 nm in pet food corresponded to absorption by OH groups in carbohydrates. Peaks at 1502, 2056, and 2174 nm have been associated to NH stretch, NH stretch and amide II, and amide I and amide III, respectively [31]. Peaks around 1452 and 1938 nm have been also related to water; to an OH stretch first overtone and an OH bend second overtone, respectively [31].
Although minerals do not have a specific absorption band in the infrared spectroscopy region, the ability of NIRS to predict some minerals has been related to the bonds of minerals to proteins or other organic molecules as reported in cheese [29], to the S-H bonds [26], and to the effect of the element on the water absorption band [25,27,28], such as for Na [32] and K [46,47]. However, it has been described that P forms only establish weak hydrogen bridges due to their low electronegativity making difficult its determination with NIRS [47].
Infrared spectroscopy capacity to determine mineral content has been evaluated on several food matrices [48] but, to the best of our knowledge, only Alomar et al. [35] have evaluated the feasibility of NIRS to predict minerals in pet food. The percentage of samples removed as outliers partially agreed with Manuelian et al. [29], who reported <14% for almost all major and trace minerals in cheese, and De Marchi et al. [32], who reported between 4 and 9% of outliers for Na in several groups of processed meat products. The most accurate calibrations were obtained mainly using the scatter correction D, similarly to what was reported for Na in meat products [32,46]. On the other hand, Alomar et al. [35] obtained better results not using a scatter correction. The most used mathematical treatments agreed to what was reported by Alomar et al. [35] in dog food and Manuelian et al. [29] in cheese. The high number of LF showed the difficulty in obtaining accurate prediction models for minerals from near-infrared spectrum information, which agreed with the results in cheese [29,49] and processed meat products [32].
Minerals that presented greater CV showed higher R2CrV, which supports that better prediction models may be related to a wider range of variability. Although it is commonly agreed that the higher the RPD the better the model, researchers do not agree on the interpretation of RPD at the low end of the range. Based on Williams’ interpretation of the RPD [40], the K prediction model could be adequate for screening purposes and the S prediction model could be adequate for quality control. Being S the best predicted mineral could be related to the capacity of NIRS to detect the S-H bonds [26], which are related to the sulfhydryl groups in proteins. All the other mineral prediction models were below 2.5, which is the threshold to consider an equation fair enough to be used [40]. Alomar et al. [35] did not achieve a good calibration model for any mineral, reporting RPD between 1.1 (Fe) and 1.8 (Cl and Mg). The highest RPD reported by Alomar et al. [35] was lower than the one obtained in our study. However, the RPD for Mg reported by those authors was greater than the one in the present study (RPD = 1.6), whereas we obtained greater RPD for Ca (1.5), P (1.9), Na (1.6), and K (2.6) than they did.
On the other hand, a greater accuracy of the prediction models to predict Ca (RPD = 4.57), Na (RPD = 3.28), P (RPD 4.02), S (RPD = 4.22), Mg (RPD = 3.71), and Zn (RPD = 3.9) has been reported in commercial cheeses [29] than in the present study. Also, predictions of Ca (R2CrV = 0.76), Na (R2CrV = 0.64), Fe (R2CrV = 0.84), and Zn (R2CrV = 0.70) in meat [46] and Na in processed meat products (RPD = 3.38 to 5.71) [32] were more accurate than the values reported in Table 4. The greater accuracy of the mineral prediction equations could be related to the matrix of study and the manufacturing process. Minerals that were better predicted in cheese and meat are those minerals that were probably linked to organic complexes or that interfered with the water of the product; for example, Ca, Mg, and P in cheese are part of the casein micelle, and a huge quantity of NaCl is used during the brining process of cheese [29] or processed meat products [32], increasing the level of Na in the product. As reviewed by De Marchi et al. [36], the absorbance depends on the number of molecular bonds; the lower the quantity of the element, the lower the number of molecular bonds that can be excited and detected by NIRS. Another aspect that negatively affects the feasibility of NIRS to predict minerals in compound food for animals is that minerals, and often trace minerals, are usually added to the product in inorganic form to adjust their amount to the animals’ requirements. As indicated above, the capacity of NIRS to detect minerals is based on the association of those elements to organic complexes [27,36], so the inorganic forms are less likely to be detected using NIRS [27]. However, the feasibility of NIRS to predict minerals from inorganic salts could be related to the association of the cations to organic or hydrated inorganic molecules [27]. Thus, the low accuracy of the prediction models obtained for minerals in dog food could be partially related to the low quantity of the elements in the product, especially when referring to trace minerals, and to the addition of inorganic salts during the manufacturing process.
5. Conclusions
In conclusion, results of the present study demonstrate that, among all the minerals analyzed, NIRS prediction models for S (R2CrV = 0.89; RPD = 3.04) and K (R2CrV = 0.85; RPD = 2.58) could be used for screening purposes in extruded dry dog food. This study supports the hypothesis that minerals are difficult to determine using NIRS if they are not associated with organic molecules or hydrated inorganic molecules. Based on these results, further studies with wet pet food could be interesting to confirm that hypothesis.
Author Contributions
Conceptualization, M.D.M.; methodology, A.G.; software, A.G.; validation, C.L.M.; formal analysis, A.G.; investigation, A.G. and S.C.; resources, M.D.M. and C.L.M.; data curation, A.G.; writing—original draft preparation, A.G.; writing—review and editing, C.L.M. and M.D.M.; visualization, A.G. and C.L.M.; supervision, M.D.M.; project administration, C.L.M. and M.D.M.; funding acquisition, M.D.M.
Funding
This research received no external funding.
Acknowledgments
The authors gratefully acknowledge Dorado S.r.l. (Monsole di Cona, Venice, Italy) for providing the samples and the financial support to conduct this research, and Luciano Magro and Massimo Cagnin (University of Padova, Italy) for technical assistance.
Conflicts of Interest
The authors declare no conflicts of interest.
References
- Fuchs, M.; Obernhuber, C. Hypercompetitive rivalries in the pet food industry. In Fallstudien zum Internationalen Management; Zentes, J., Swoboda, B., Morschett, D., Eds.; Gabler Verlag: Wiesbaden, Germany, 2011; pp. 943–962. ISBN 9783834967930. [Google Scholar]
- O’Dell, B.L. Bioavailability of and interactions among trace elements. In Trace Elements in Nutrition of Children; Chandra, R.K., Ed.; Nestlé Nutrition; Vevey/Raven Press: New York, NY, USA, 1985; pp. 41–62. [Google Scholar]
- Kochanowski, B.A.; McMahan, C.L. Inhibition of iron absorption by calcium in rats and dogs: Effects of mineral separation by time and enteric coating. Nutr. Res. 1990, 10, 219–226. [Google Scholar] [CrossRef]
- O’Dell, B.L. Mineral interactions relevant to nutrient requirements. J. Nutr. 1989, 119, 1832–1838. [Google Scholar] [CrossRef] [PubMed]
- Wedekind, K.J.; Titgemeyer, E.C.; Twardock, R.; Baker, H.D. Phosphorus but not calcium affects manganese absorption and turnover in chicks. J. Nutr. 1991, 121, 1776–1786. [Google Scholar] [CrossRef] [PubMed]
- Shackelford, M.E.; Collins, T.F.X.; Black, T.N.; Ames, M.J.; Dolan, S.; Sheikh, N.S.; Chi, R.K.; O’Donnell, M.W. Mineral interactions in rats fed AIN-76A diets with excess calcium. Food Chem. Toxicol. 1994, 32, 255–263. [Google Scholar] [CrossRef]
- Gaetke, L.M.; Chow-Johnson, H.S.; Chow, C.K. Copper: Toxicological relevance and mechanisms. Arch. Toxicol. 2014, 88, 1929–1938. [Google Scholar] [CrossRef] [PubMed]
- Robertson, B.T.; Burns, M.J. Zinc metabolism and the zinc-deficiency syndrome in the dog. Am. J. Vet. Res. 1963, 24, 997–1002. [Google Scholar] [PubMed]
- Sanecki, R.K.; Corbin, J.E.; Forbes, R.M. Tissue changes in dogs fed a zinc-deficient ration. Am. J. Vet. Res. 1982, 43, 1642–1646. [Google Scholar]
- Sanecki, R.K.; Corbin, J.E.; Forbes, R.M. Extracutaneous histologic changes accompanying zinc deficiency in pups. Am. J. Vet. Res. 1985, 46, 2120–2123. [Google Scholar]
- Budis, H.; Kalisińska, E.; Łanocha, N.; Kosik-Bogacka, D. Concentrations of manganese, iron, and strontium in bones of the domestic dog (Canis lupus familiaris). Turk. J. Vet. Anim. Sci. 2015, 39, 279–286. [Google Scholar] [CrossRef]
- Kim, H.; Loftus, J.; Gagne, J.W.; Rutzke, M.A.; Glahn, R.P.; Wakshlag, J.J. Evaluation of selected ultra-trace minerals in commercially available dry dog foods. Vet. Med. Res. Rep. 2018, 9, 43–51. [Google Scholar] [CrossRef]
- Kim, J.-M.; Chung, J.-Y.; Lee, S.-Y.; Choi, E.-W.; Kim, M.-K.; Hwang, C.-Y.; Youn, H.-Y. Hypoglycemic effects of vanadium on alloxan monohydrate induced diabetic dogs. J. Vet. Sci. 2006, 7, 391–395. [Google Scholar] [CrossRef] [PubMed] [Green Version]
- Davies, N.L. Lithium toxicity in two dogs. J. S. Afr. Vet. Assoc. 1991, 62, 140–142. [Google Scholar] [PubMed]
- Adam, F.H.; Noble, P.J.M.; Swift, S.T.; Higgins, B.M.; Sieniawska, C.E. Barium toxicosis in a dog. J. Am. Vet. Med. Assoc. 2010, 237, 547–550. [Google Scholar] [CrossRef] [PubMed]
- Osborne, C.A.; Polzin, D.J.; Lulich, J.P.; Kruger, J.M.; Johnston, G.R.; O’Brien, T.D.; Felice, L.J. Relationship of nutritional factors to the cause, dissolution, and prevention of canine uroliths. Vet. Clin. N. Am. Small Anim. Pract. 1989, 19, 583–619. [Google Scholar] [CrossRef]
- Jacob, F.; Polzin, D.J.; Osborne, C.A.; Allen, T.A.; Kirk, C.A.; Neaton, J.D.; Lekcharoensuk, C.; Swanson, L.L. Clinical evaluation of dietary modification for treatment of spontaneous chronic kindney failure in dogs. J. Am. Vet. Med. Assoc. 2002, 220, 1163–1170. [Google Scholar] [CrossRef] [PubMed]
- Ross, S.J.; Osborne, C.A.; Kirk, C.A.; Lowry, S.R.; Koehler, L.A.; Polzin, D.J. Clinical evaluation of dietary modification for treatment of spontaneous chronic kidney disease in cats. J. Am. Vet. Med. Assoc. 2006, 229, 949–957. [Google Scholar] [CrossRef] [PubMed]
- Lulich, J.P.; Berent, A.C.; Adams, L.G.; Westropp, J.L.; Bartges, J.W.; Osborne, C.A. ACVIM Small animal consensus recommendations on the treatment and prevention of uroliths in dogs and cats. J. Vet. Intern. Med. 2016, 30, 1564–1574. [Google Scholar] [CrossRef] [PubMed]
- Lulich, J.P.; Osborne, C.A.; Lekcharoensuk, C.; Allen, T.A.; Nakagawa, Y. Canine calcium oxalate urolithiasis: Case-based applications of therapeutic principles. Vet. Clin. N. Am. Small Anim. Pract. 1999, 29, 123–139. [Google Scholar] [CrossRef]
- Case, L.P.; Daristotle, L.; Hayek, M.G.; Raasch, M.F. Vitamin and mineral requirements. In Canine and Feline Nutrition A Resource for Companion Animal Professionals; Mosby Inc.: St. Louis, MO, USA, 2011; pp. 107–117. [Google Scholar]
- European Commission. Commission Regulation (EU) 2017/1017 of 15 June 2017 amending Regulation (EU) No 68/2013 on the Catalogue of feed materials. Available online: https://eur-lex.europa.eu/legal-content/EN/TXT/?uri=CELEX%3A32017R1017 (accessed on 12 July 2019).
- Manley, M. Near-infrared spectroscopy and hyperspectral imaging: Non-destructive analysis of biological materials. Chem. Soc. Rev. 2014, 43, 8200–8214. [Google Scholar] [CrossRef]
- De Marchi, M.; Manuelian, C.L.; Ton, S.; Cassandro, M.; Penasa, M. Feasibility of near infrared transmittance spectroscopy to predict fatty acid composition of commercial processed meat. J. Sci. Food Agric. 2018, 98, 64–73. [Google Scholar] [CrossRef]
- Büning-Pfaue, H. Analysis of water in food by near infrared spectroscopy. J. Food Chem. 2003, 82, 107–115. [Google Scholar] [CrossRef]
- Pasquini, C. Near infrared spectroscopy: Fundamentals, practical aspects and analytical applications. J. Braz. Chem. Soc. 2003, 14, 198–219. [Google Scholar] [CrossRef]
- Clark, D.H.; Mayland, H.F.; Lamb, R.C. Mineral analysis of aorages with near anfrared aeflectance apectroscopy. Agron. J. 1987, 79, 485–490. [Google Scholar] [CrossRef]
- Begley, T.H.; Lanza, E.; Norris, K.H.; Hruschka, W.R. Determination of aodium chloride in meat by near-infrared diffuse reflectance spectroscopy. J. Agric. Food Chem. 1984, 32, 984–987. [Google Scholar] [CrossRef]
- Manuelian, C.L.; Currò, S.; Penasa, M.; Cassandro, M.; De Marchi, M. Prediction of minerals, fatty acid composition and cholesterol content of commercial cheeses by near infrared transmittance spectroscopy. Int. Dairy J. 2017, 71, 107–113. [Google Scholar] [CrossRef]
- González-Martín, I.; Hernández-Hierro, J.M.; Revilla, I.; Vivar-Quintana, A.; Lobos Ortega, I. The mineral composition (Ca, P, Mg, K, Na) in cheeses (cow’s, ewe’s and goat’s) with different ripening times using near infrared spectroscopy with a fibre-optic probe. Food Chem. 2011, 127, 147–152. [Google Scholar] [CrossRef]
- Lucas, A.; Andueza, D.; Rock, E.; Martin, B. Prediction of dry matter, fat, pH, vitamins, minerals, carotenoids, total antioxidant capacity, and color in fresh and freeze-dried cheeses by visible-near-infrared reflectance spectroscopy. J. Agric. Food Chem. 2008, 56, 6801–6808. [Google Scholar] [CrossRef] [PubMed]
- De Marchi, M.; Manuelian, C.L.; Ton, S.; Manfrin, D.; Meneghesso, M.; Cassandro, M.; Penasa, M. Prediction of sodium content in commercial processed meat products using near infrared spectroscopy. Meat Sci. 2017, 125, 61–65. [Google Scholar] [CrossRef]
- Prevolnik, M.; Škrlep, M.; Janeš, L.; Velikonja-Bolta, Š.; Škorjanc, D.; Čandek-Potokar, M. Accuracy of near infrared spectroscopy for prediction of chemical composition, salt content and free amino acids in dry-cured ham. J. Meat Sci. 2011, 88, 299–304. [Google Scholar] [CrossRef] [PubMed]
- Boschetti, L.; Ottavian, M.; Facco, P.; Barolo, M.; Serva, L.; Balzan, S.; Novelli, E. A correlative study on data from pork carcass and processed meat (Bauernspeck) for automatic estimation of chemical parameters by means of near-infrared spectroscopy. J. Meat Sci. 2013, 95, 621–628. [Google Scholar] [CrossRef]
- Alomar, D.; Hodgkinson, S.; Abarzúa, D.; Fuchslocher, R.; Alvarado, C.; Rosales, E. Nutritional evaluation of commercial dry dog foods by near infrared reflectance spectroscopy. J. Anim. Physiol. Anim. Nutr. 2006, 90, 223–229. [Google Scholar] [CrossRef] [PubMed]
- De Marchi, M.; Penasa, M.; Zidi, A.; Manuelian, C.L. Invited review: Use of infrared technologies for the assessment of dairy products—Applications and perspectives. J. Dairy Sci. 2018, 101, 10589–10604. [Google Scholar] [CrossRef] [PubMed]
- Shenk, J.S.; Westerhaus, M.O.; Abrams, S. Protocol for NIR calibrations: Monitoring analysis results and recalibration. In Near Infrared Spectroscopy (NIRS): Analysis of Forage Quality. USDA-ARS Agriculture Handbook, II; Martens, G., Shenk, J., Barton, F., Eds.; US Government Printing Office: Washington, DC, USA, 1989; pp. 104–110. [Google Scholar]
- Williams, P.; Sobering, D. Comparison of commercial near infrared transmittance and reflectance instruments for analysis of whole grains and seeds. J. Near Infrared Spectrosc. 1993, 1, 25–32. [Google Scholar] [CrossRef]
- Karoui, R.; Mouazen, A.M.; Dufour, E.; Pillonel, L.; Picque, D.; Bosset, J.O.; De Baerdemaeker, J. Mid-infrared spectrometry: A tool for the determination of chemical parameters in Emmental cheeses produced during winter. Lait 2006, 86, 83–97. [Google Scholar] [CrossRef]
- Williams The RPD Statistic: A Tutorial Note. NIR News 2014, 25, 22–26. [CrossRef]
- FEDIAF. Nutritional Guidelines for Complete and Complementary Pet Food for Cats and Dogs; FEDIAF: Bruxelles, Belgium, 2 December 2018. [Google Scholar]
- Davies, M.; Alborough, R.; Jones, L.; Davis, C.; Williams, C.; Gardner, D.S. Mineral analysis of complete dog and cat foods in the UK and compliance with European guidelines. Sci. Rep. 2017, 7, 1–9. [Google Scholar] [CrossRef] [PubMed]
- Pereira, A.M.; Pinto, E.; Matos, E.; Castanheira, F.; Almeida, A.A.; Baptista, C.S.; Segundo, M.A.; Fonseca, A.J.M.; Cabrita, A.R.J. Mineral composition of dry dog foods: Impact on nutrition and potential toxicity. J. Agric. Food Chem. 2018, 66, 7822–7830. [Google Scholar] [CrossRef] [PubMed]
- De Marchi, M.; Righi, F.; Meneghesso, M.; Manfrin, D.; Ricci, R. Prediction of chemical composition and peroxide value in unground pet foods by near-infrared spectroscopy. J. Anim. Physiol. Anim. Nutr. 2016, 102, 337–342. [Google Scholar] [CrossRef] [PubMed]
- Hervera, M.; Castrillo, C.; Albanell, E.; Baucells, M.D. Use of near-infrared spectroscopy to predict energy content of commercial dog food. J. Anim. Sci. 2012, 90, 4401–4407. [Google Scholar] [CrossRef] [PubMed]
- González-Martín, I.; González-Pérez, C.; Hernández-Méndez, J.; Alvarez-García, N. Mineral analysis (Fe, Zn, Ca, Na, K) of fresh Iberian pork loin by near infrared reflectance spectrometry. Anal. Chim. Acta 2002, 468, 293–301. [Google Scholar] [CrossRef]
- González-Martín, I.; Álvarez-García, N.; González-Pérez, C.; Villaescusa-García, V. Determination of inorganic elements in animal feeds by NIRS technology and a fibre-optic probe. Talanta 2006, 69, 711–715. [Google Scholar] [CrossRef] [PubMed]
- Schmitt, S.; Garrigues, S.; de la Guardia, M. Determination of the mineral composition of foods by infrared spectroscopy: A review of a green alternative. Crit. Rev. Anal. Chem. 2014, 44, 186–197. [Google Scholar] [CrossRef] [PubMed]
- Manuelian, C.L.; Currò, S.; Visentin, G.; Penasa, M.; Cassandro, M.; Dellea, C.; Bernardi, M.; De Marchi, M. Technical note: At-line prediction of mineral composition of fresh cheeses using near-infrared technologies. J. Dairy Sci. 2017, 100, 6084–6089. [Google Scholar] [CrossRef] [PubMed]
Figure 1.
Average raw spectra of extruded dry dog food using near-infrared spectroscopy for the complete dataset (n = 119), and groups according to the main protein source: Red meat group (n = 37), fish group (n = 13), mixed group (n = 15), chicken group (n = 29), and white meat group (n = 21).
Figure 1.
Average raw spectra of extruded dry dog food using near-infrared spectroscopy for the complete dataset (n = 119), and groups according to the main protein source: Red meat group (n = 37), fish group (n = 13), mixed group (n = 15), chicken group (n = 29), and white meat group (n = 21).
Figure 2.
Linear regression plot of measured versus predicted values (dry matter basis, DM) for (a) S, g/kg DM; (b) K, g/kg DM; (c) P, g/kg DM; (d) Li, mg/kg DM; (e) Sr, mg/kg DM; and (f) B, mg/kg DM. Values in leave-one-out cross-validation (n = 119).
Figure 2.
Linear regression plot of measured versus predicted values (dry matter basis, DM) for (a) S, g/kg DM; (b) K, g/kg DM; (c) P, g/kg DM; (d) Li, mg/kg DM; (e) Sr, mg/kg DM; and (f) B, mg/kg DM. Values in leave-one-out cross-validation (n = 119).

Table 1.
Classification by main protein source of the commercial extruded dry food samples for dogs included in the study.
Table 1.
Classification by main protein source of the commercial extruded dry food samples for dogs included in the study.
| Group | Main Protein Sources | Other Ingredients | Number of Samples |
|---|---|---|---|
| Red meat | Pork, lamb, horse, venison | Eggs, pea, rice, potato | 37 |
| Fish | Only fish | Potato, rice | 13 |
| Mixed | Chicken, pork, fish | - | 15 |
| Chicken | Only chicken | Rice | 29 |
| White meat | Rabbit, chicken, duck | Eggs, potato | 21 |
| Other | Not specified on the label | - | 4 |
Table 2.
Chemical composition (% as fed) of extruded dry dog food samples (n = 119) included in this study, determined using near-infrared spectroscopy, applying pre-installed commercial calibrations of FOSS for pet food.
Table 2.
Chemical composition (% as fed) of extruded dry dog food samples (n = 119) included in this study, determined using near-infrared spectroscopy, applying pre-installed commercial calibrations of FOSS for pet food.
| Trait | Mean | SD | Minimum | Maximum |
|---|---|---|---|---|
| Moisture | 5.56 | 1.22 | 2.50 | 8.00 |
| Crude protein | 28.14 | 3.95 | 21.26 | 43.09 |
| Ether extract | 13.71 | 2.20 | 8.12 | 17.86 |
| Crude fiber | 3.36 | 0.94 | 1.92 | 9.38 |
| Ash | 6.25 | 1.21 | 3.25 | 10.24 |
| Nitrogen-free extract 1 | 42.98 | 5.91 | 23.70 | 54.05 |
SD = standard deviation; 1 Nitrogen-free extract = 100 – (moisture + crude protein + ether extract + crude fiber + ash).
Table 3.
Mineral composition (dry matter basis, DM) of extruded dry dog food samples (n = 119) included in the present study quantified with inductively coupled plasma optical emission spectrometry.
Table 3.
Mineral composition (dry matter basis, DM) of extruded dry dog food samples (n = 119) included in the present study quantified with inductively coupled plasma optical emission spectrometry.
| Mineral | Mean | SD | Minimum | Maximum | CV |
|---|---|---|---|---|---|
| Major minerals, g/kg DM | |||||
| Ca | 13.57 | 4.89 | 4.34 | 37.69 | 36.1 |
| P | 9.94 | 3.24 | 3.68 | 19.41 | 32.6 |
| K | 7.19 | 2.88 | 3.77 | 16.02 | 40.0 |
| Na | 5.34 | 1.64 | 1.23 | 9.66 | 30.8 |
| S | 3.87 | 1.43 | 1.54 | 8.32 | 37.0 |
| Mg | 1.21 | 0.21 | 0.80 | 1.97 | 17.3 |
| Trace minerals, mg/kg DM | |||||
| Fe | 370.87 | 90.89 | 128.58 | 702.70 | 24.5 |
| Zn | 190.24 | 57.07 | 37.77 | 357.53 | 30.0 |
| Al | 152.83 | 54.99 | 65.54 | 307.38 | 36.0 |
| Mn | 74.66 | 18.39 | 19.48 | 122.16 | 24.6 |
| Cu | 25.58 | 8.02 | 11.08 | 55.34 | 31.3 |
| Sr | 18.77 | 11.45 | 5.94 | 72.25 | 61.0 |
| Ba | 5.60 | 2.47 | 1.47 | 18.63 | 44.1 |
| B | 5.08 | 1.73 | 2.36 | 11.65 | 34.1 |
| Cr | 1.74 | 0.89 | 0.54 | 5.26 | 50.9 |
| Ni | 1.28 | 0.45 | 0.57 | 3.81 | 34.8 |
| Mo | 0.86 | 0.40 | 0.25 | 2.70 | 45.9 |
| V1 | 0.44 | 0.22 | 0.16 | 1.18 | 49.8 |
| Li | 0.19 | 0.09 | 0.08 | 0.65 | 47.3 |
SD = standard deviation; CV = coefficient of variation, %; 1 The number of samples used for V was 108.
Table 4.
Fitting statistics for modified partial least square regression models developed for major (g/kg in dry matter basis ) and trace mineral content (mg/kg in dry matter basis) in ground commercial extruded dry dog food samples 1.
Table 4.
Fitting statistics for modified partial least square regression models developed for major (g/kg in dry matter basis ) and trace mineral content (mg/kg in dry matter basis) in ground commercial extruded dry dog food samples 1.
| Item | Outliers | n | Scatter Correction 2 | Math Treatment 3 | LF | Mean | SD | R2C | SEC | R2CrV | SECrV | RPD |
|---|---|---|---|---|---|---|---|---|---|---|---|---|
| Major minerals | ||||||||||||
| Ca | 7 | 112 | D | 1881 | 8 | 13.32 | 4.34 | 0.68 | 2.47 | 0.55 | 2.91 | 1.49 |
| P | 5 | 114 | D | 210101 | 10 | 9.80 | 3.14 | 0.91 | 0.92 | 0.72 | 1.66 | 1.89 |
| K | 6 | 113 | MSC | 210101 | 9 | 7.03 | 2.74 | 0.94 | 0.69 | 0.85 | 1.06 | 2.58 |
| Na | 6 | 113 | ISC | 210101 | 8 | 5.31 | 1.60 | 0.83 | 0.66 | 0.60 | 1.00 | 1.59 |
| S | 5 | 114 | D | 2551 | 9 | 3.82 | 1.36 | 0.96 | 0.26 | 0.89 | 0.45 | 3.04 |
| Mg | 10 | 109 | ISC | 1441 | 9 | 1.19 | 0.17 | 0.78 | 0.08 | 0.63 | 0.11 | 1.64 |
| Trace minerals | ||||||||||||
| Fe | 7 | 112 | WMSC | 210101 | 10 | 363.84 | 78.24 | 0.89 | 25.89 | 0.59 | 49.67 | 1.58 |
| Zn | 9 | 110 | NONE | 1441 | 7 | 189.46 | 50.20 | 0.65 | 29.89 | 0.49 | 35.78 | 1.40 |
| Al | 5 | 114 | SNV | 210101 | 4 | 149.25 | 52.70 | 0.66 | 30.76 | 0.52 | 36.47 | 1.44 |
| Mn | 9 | 110 | SNV | 1881 | 4 | 74.22 | 14.97 | 0.38 | 11.75 | 0.20 | 13.29 | 1.13 |
| Cu | 17 | 102 | WMSC | 2551 | 1 | 23.72 | 3.95 | 0.34 | 3.22 | 0.25 | 3.41 | 1.16 |
| Sr | 10 | 109 | SNV + D | 1441 | 9 | 16.65 | 7.44 | 0.83 | 3.08 | 0.72 | 3.92 | 1.90 |
| Ba | 6 | 113 | MSC | 2551 | 5 | 5.34 | 1.93 | 0.71 | 1.04 | 0.47 | 1.39 | 1.38 |
| B | 9 | 110 | ISC | 2551 | 6 | 5.06 | 1.72 | 0.86 | 0.64 | 0.72 | 0.91 | 1.90 |
| Cr | 11 | 108 | D | 0011 | 1 | 1.53 | 0.54 | 0.23 | 0.48 | 0.16 | 0.49 | 1.10 |
| Ni | 6 | 113 | WMSC | 1881 | 6 | 1.25 | 0.36 | 0.64 | 0.21 | 0.44 | 0.27 | 1.35 |
| Mo | 13 | 106 | NONE | 1881 | 6 | 0.76 | 0.24 | 0.66 | 0.14 | 0.50 | 0.17 | 1.43 |
| V | 5 | 103 | SNV + D | 2551 | 3 | 0.43 | 0.21 | 0.68 | 0.12 | 0.53 | 0.14 | 1.46 |
| Li | 10 | 109 | D | 1441 | 9 | 0.18 | 0.07 | 0.84 | 0.03 | 0.74 | 0.03 | 1.98 |
1 LF = optimal number of model factors; n = number of samples; R2C = R2 for calibration; SD = standard deviation; SEC = SE of calibration; R2CrV = R2 for the cross-validation; SECrV = SE of cross-validation; RPD = ratio of performance to deviation. 2 D = detrend; MSC = multiplicative scatter correction; ISC = inverted scatter correction; WMSC = weighted multiplicative scatter correction; NONE = no correction; SNV = standard normal variate; SNV + D = standard normal variate and detrending. 3 Derivate order, gap (nm), first smoothing, and second smoothing intervals (nm).
© 2019 by the authors. Licensee MDPI, Basel, Switzerland. This article is an open access article distributed under the terms and conditions of the Creative Commons Attribution (CC BY) license (http://creativecommons.org/licenses/by/4.0/).
Share and Cite
MDPI and ACS Style
Goi, A.; Manuelian, C.L.; Currò, S.; De Marchi, M. Prediction of Mineral Composition in Commercial Extruded Dry Dog Food by Near-Infrared Reflectance Spectroscopy. Animals 2019, 9, 640. https://doi.org/10.3390/ani9090640
AMA Style
Goi A, Manuelian CL, Currò S, De Marchi M. Prediction of Mineral Composition in Commercial Extruded Dry Dog Food by Near-Infrared Reflectance Spectroscopy. Animals. 2019; 9(9):640. https://doi.org/10.3390/ani9090640
Chicago/Turabian StyleGoi, Arianna, Carmen L. Manuelian, Sarah Currò, and Massimo De Marchi. 2019. "Prediction of Mineral Composition in Commercial Extruded Dry Dog Food by Near-Infrared Reflectance Spectroscopy" Animals 9, no. 9: 640. https://doi.org/10.3390/ani9090640
Note that from the first issue of 2016, this journal uses article numbers instead of page numbers. See further details here.