
Statistical Evaluations of Variations in Dairy Cows’ Milk Yields as a Precursor of Earthquakes

Abstract
:Simple Summary
Abstract
1. Introduction
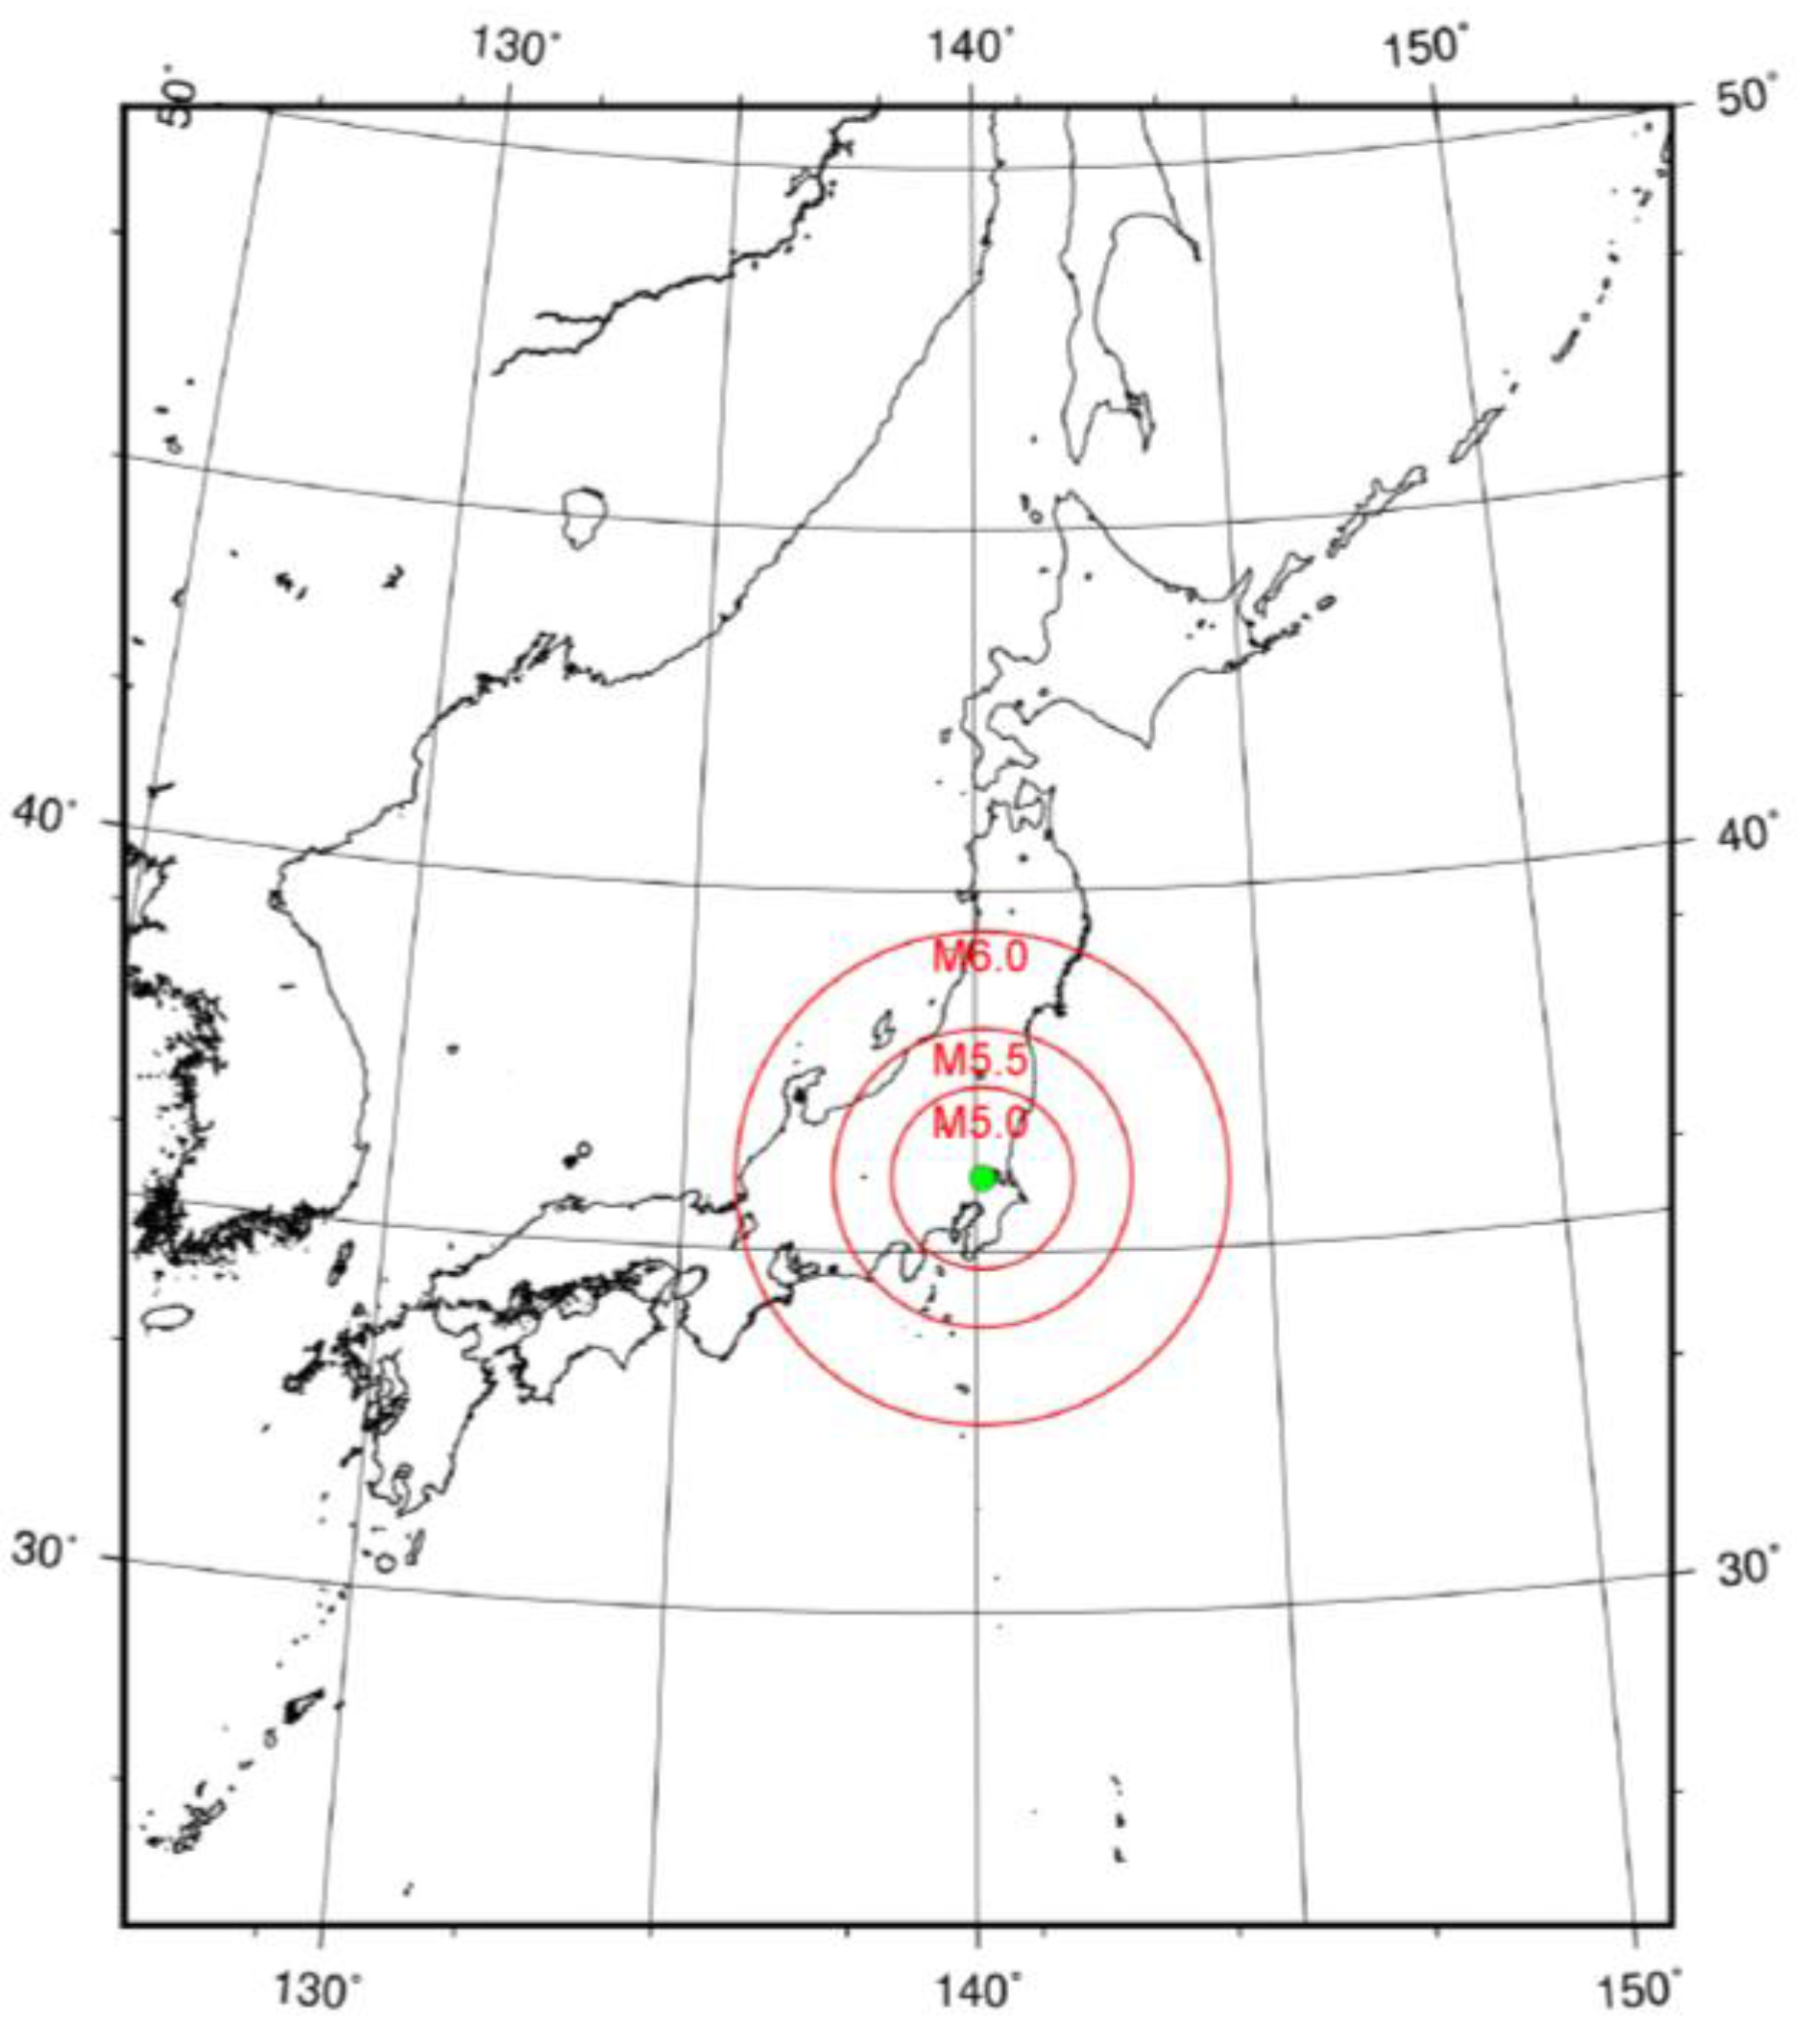
2. Materials and Methods
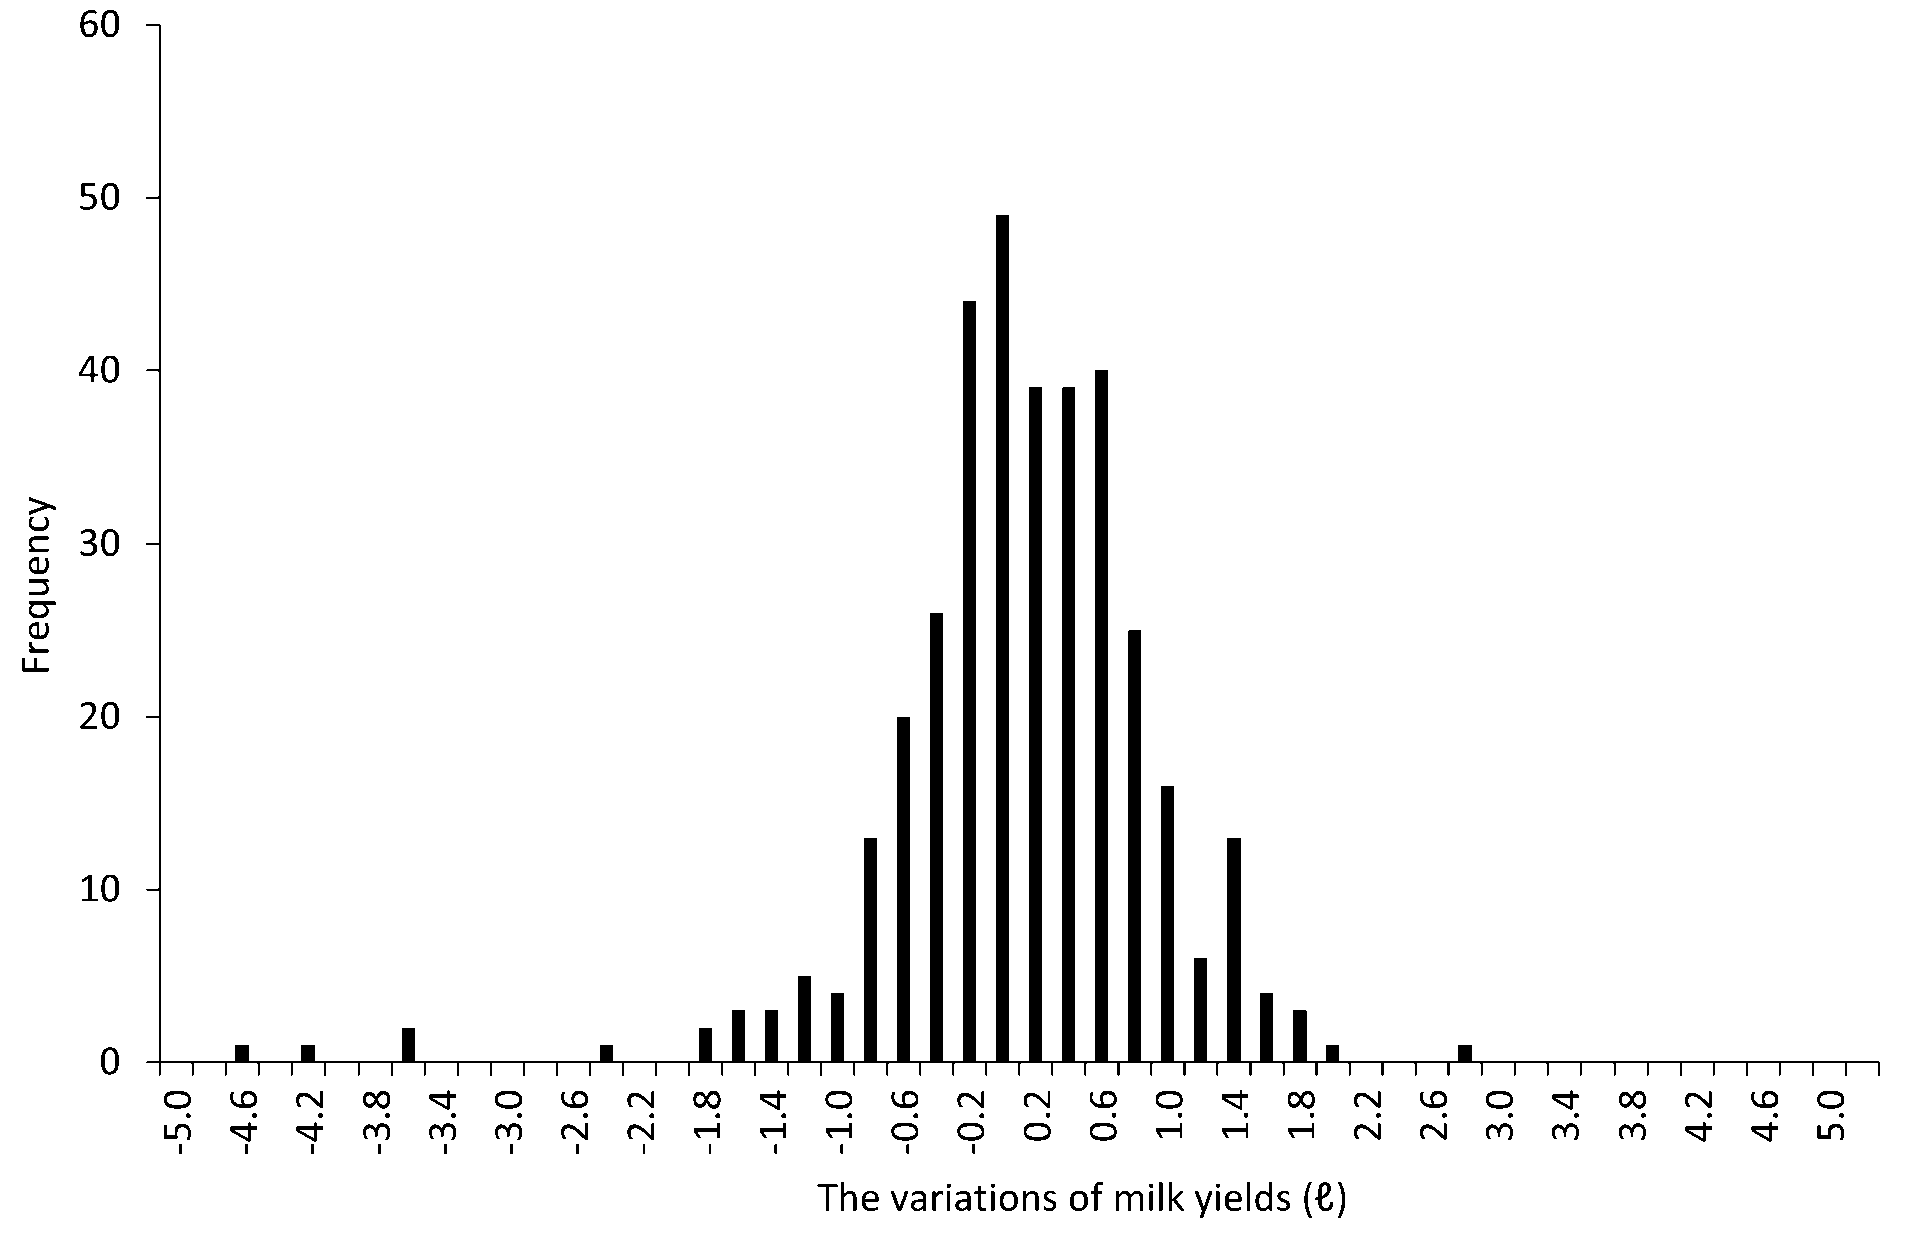
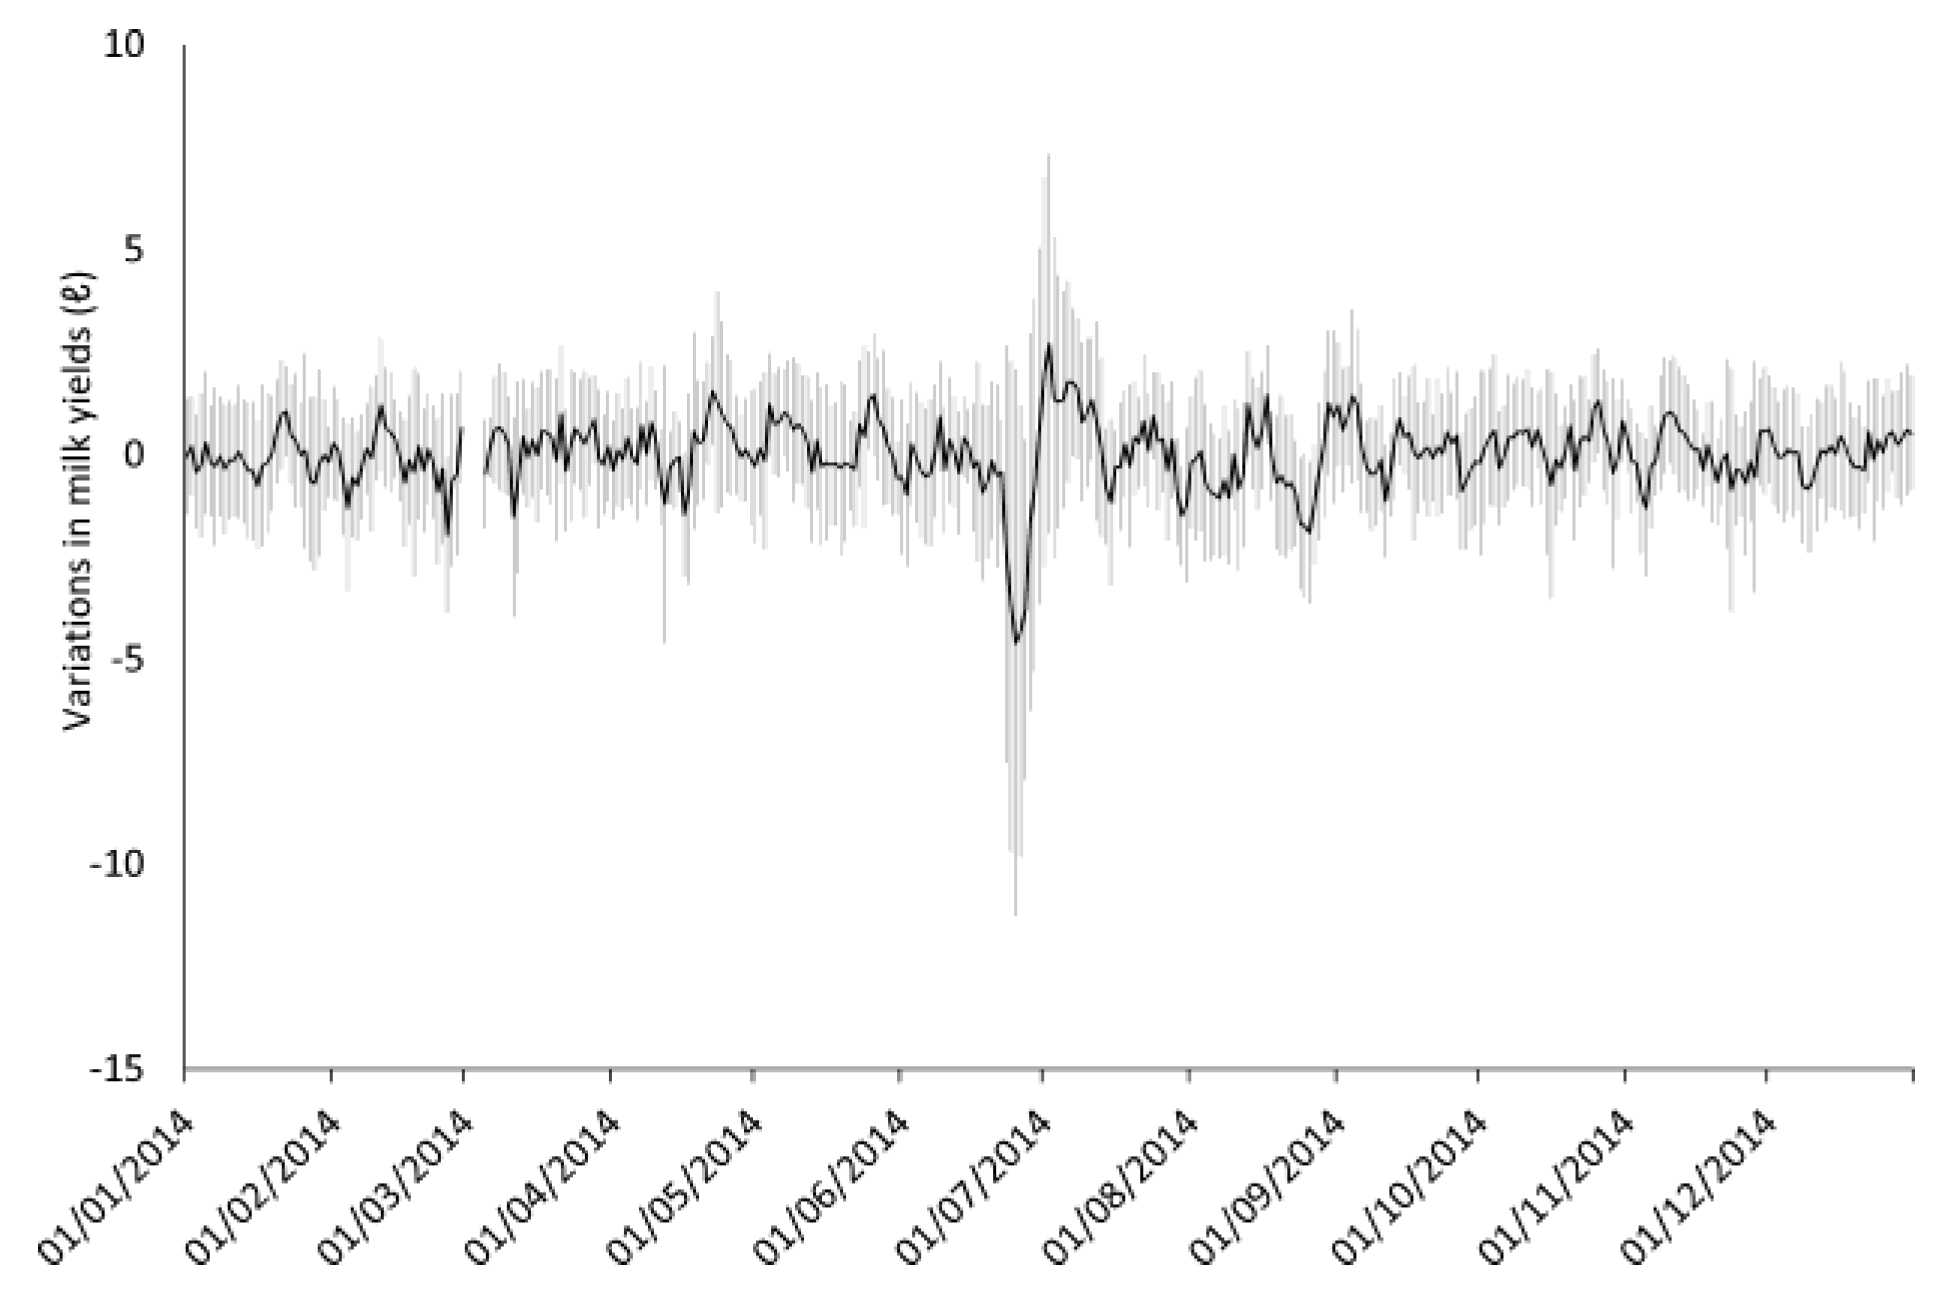
2.1. Milk Yields
2.2. Cross-Correlation Analyses
2.3. Performance Evaluations of Binary Earthquake Forecasts
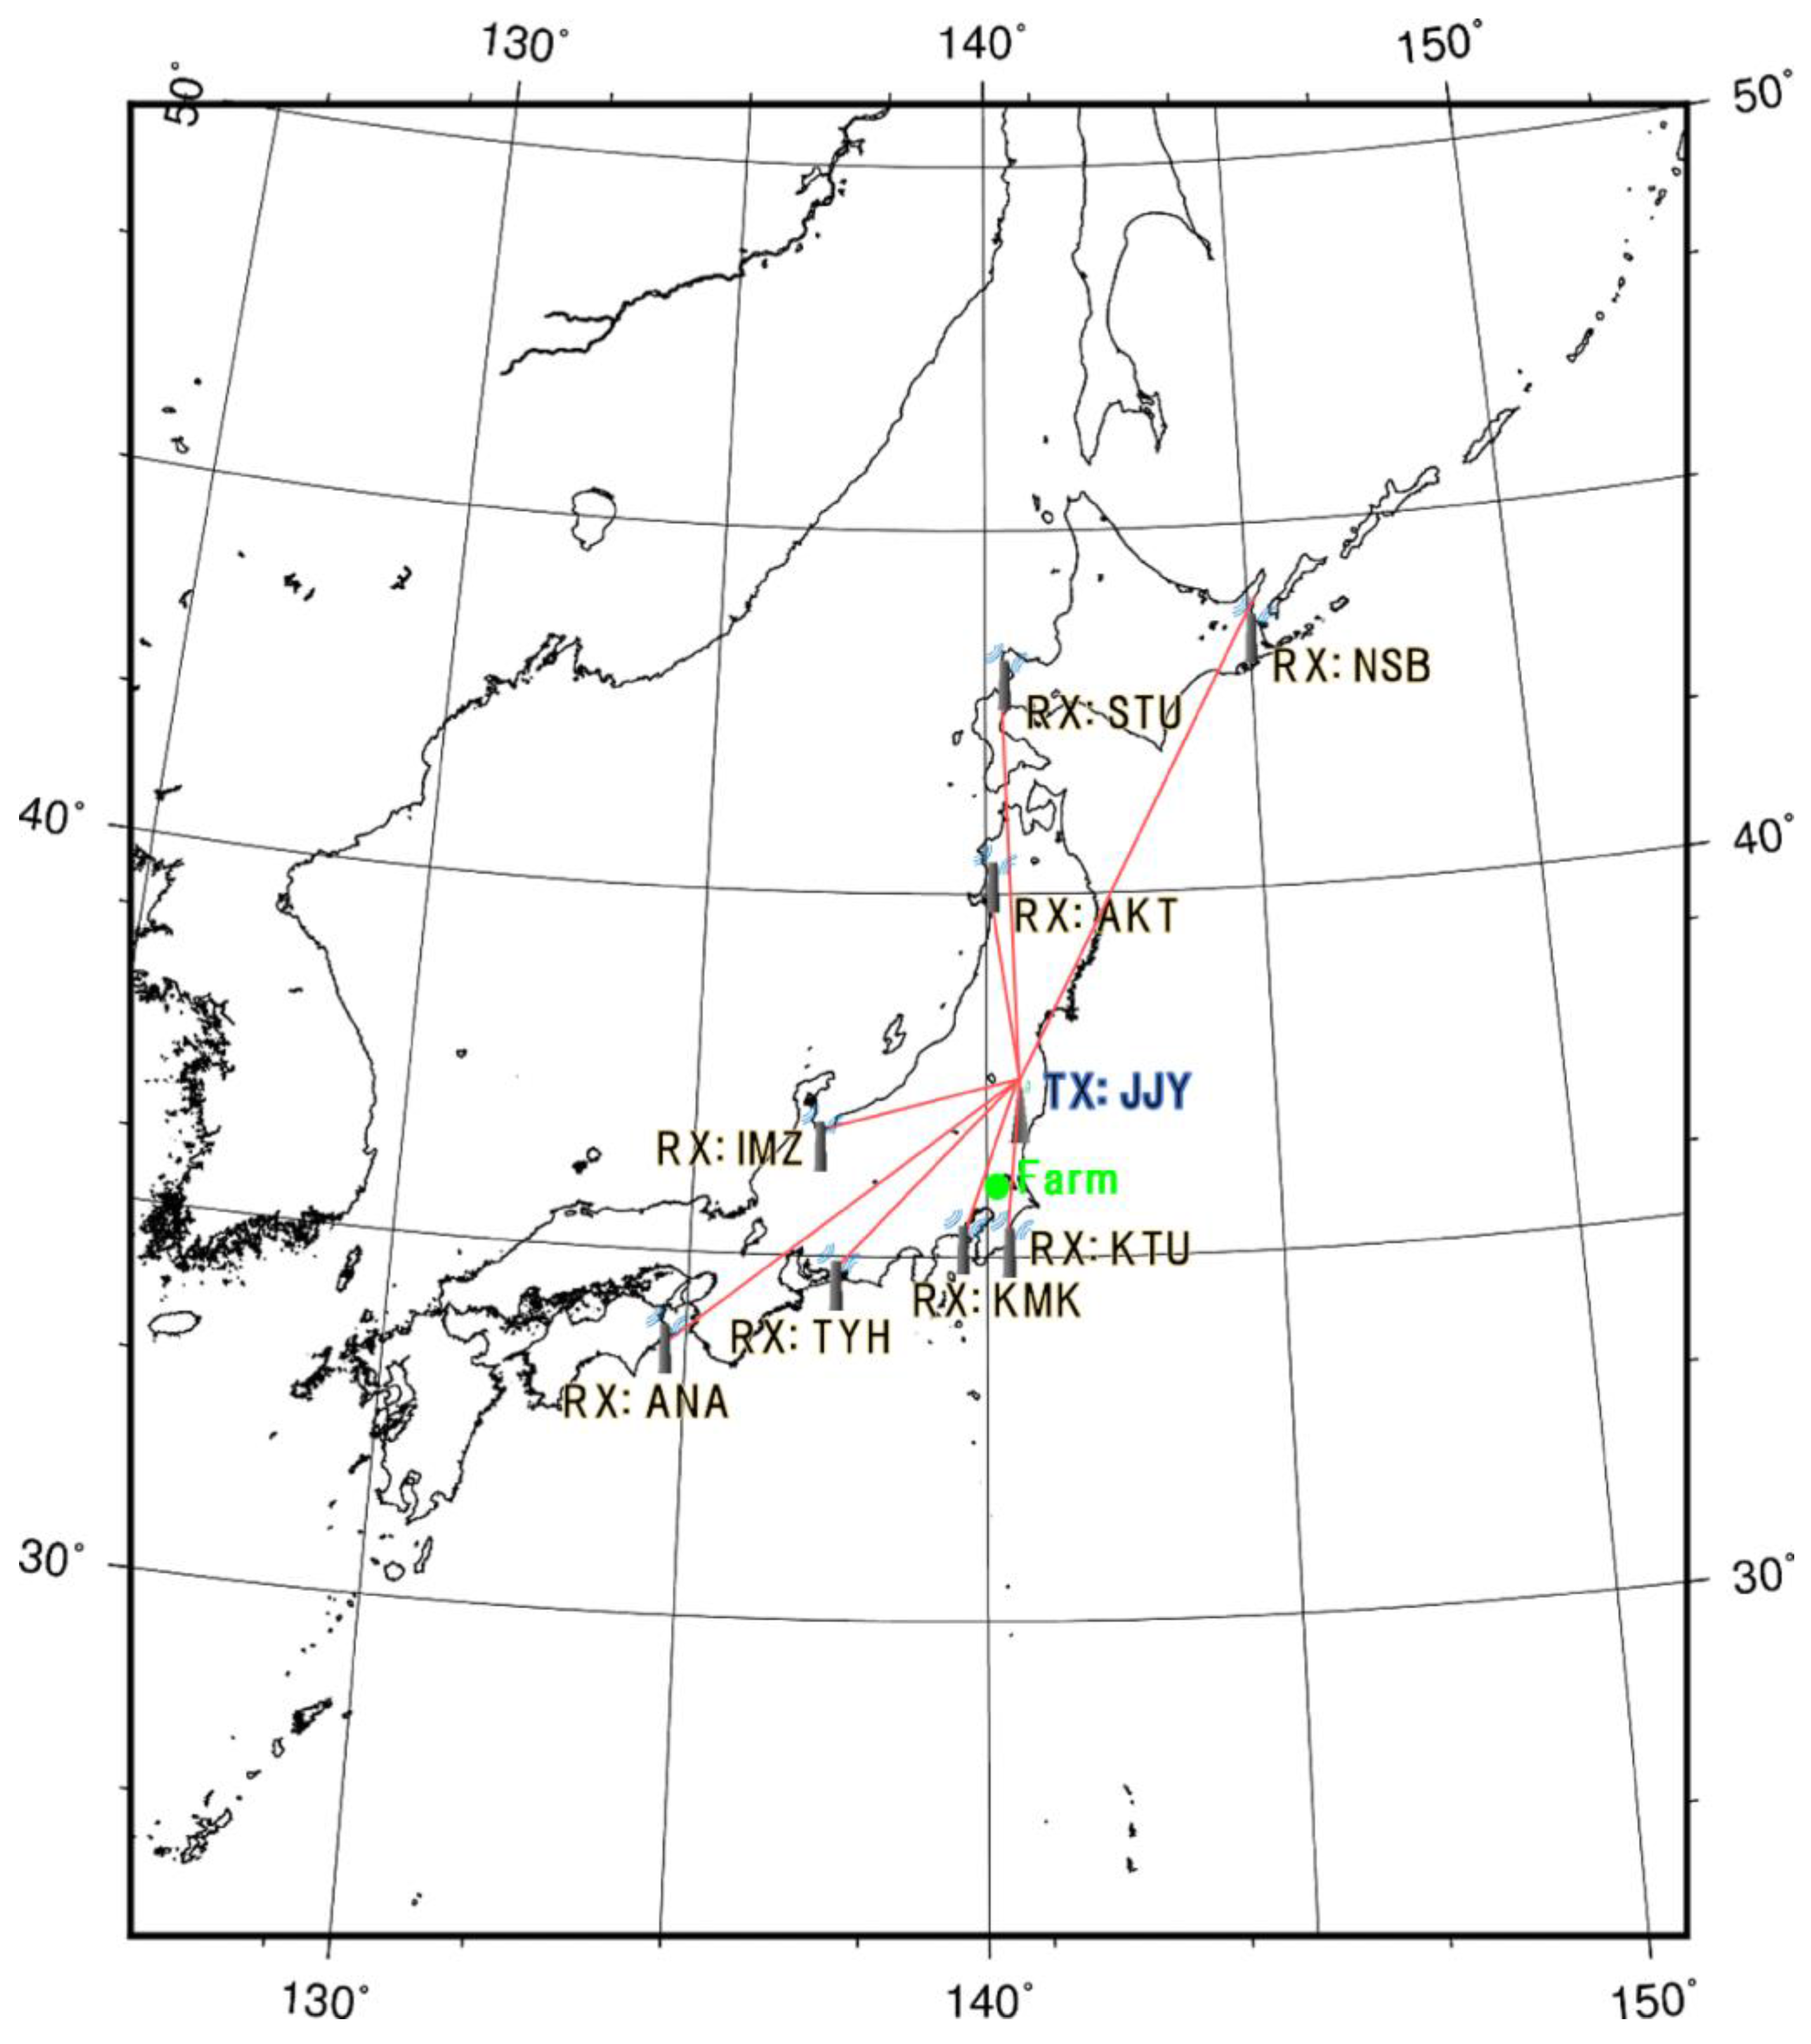
2.4. Comparison with Anomalies of VLF/LF Propagation Data
3. Results
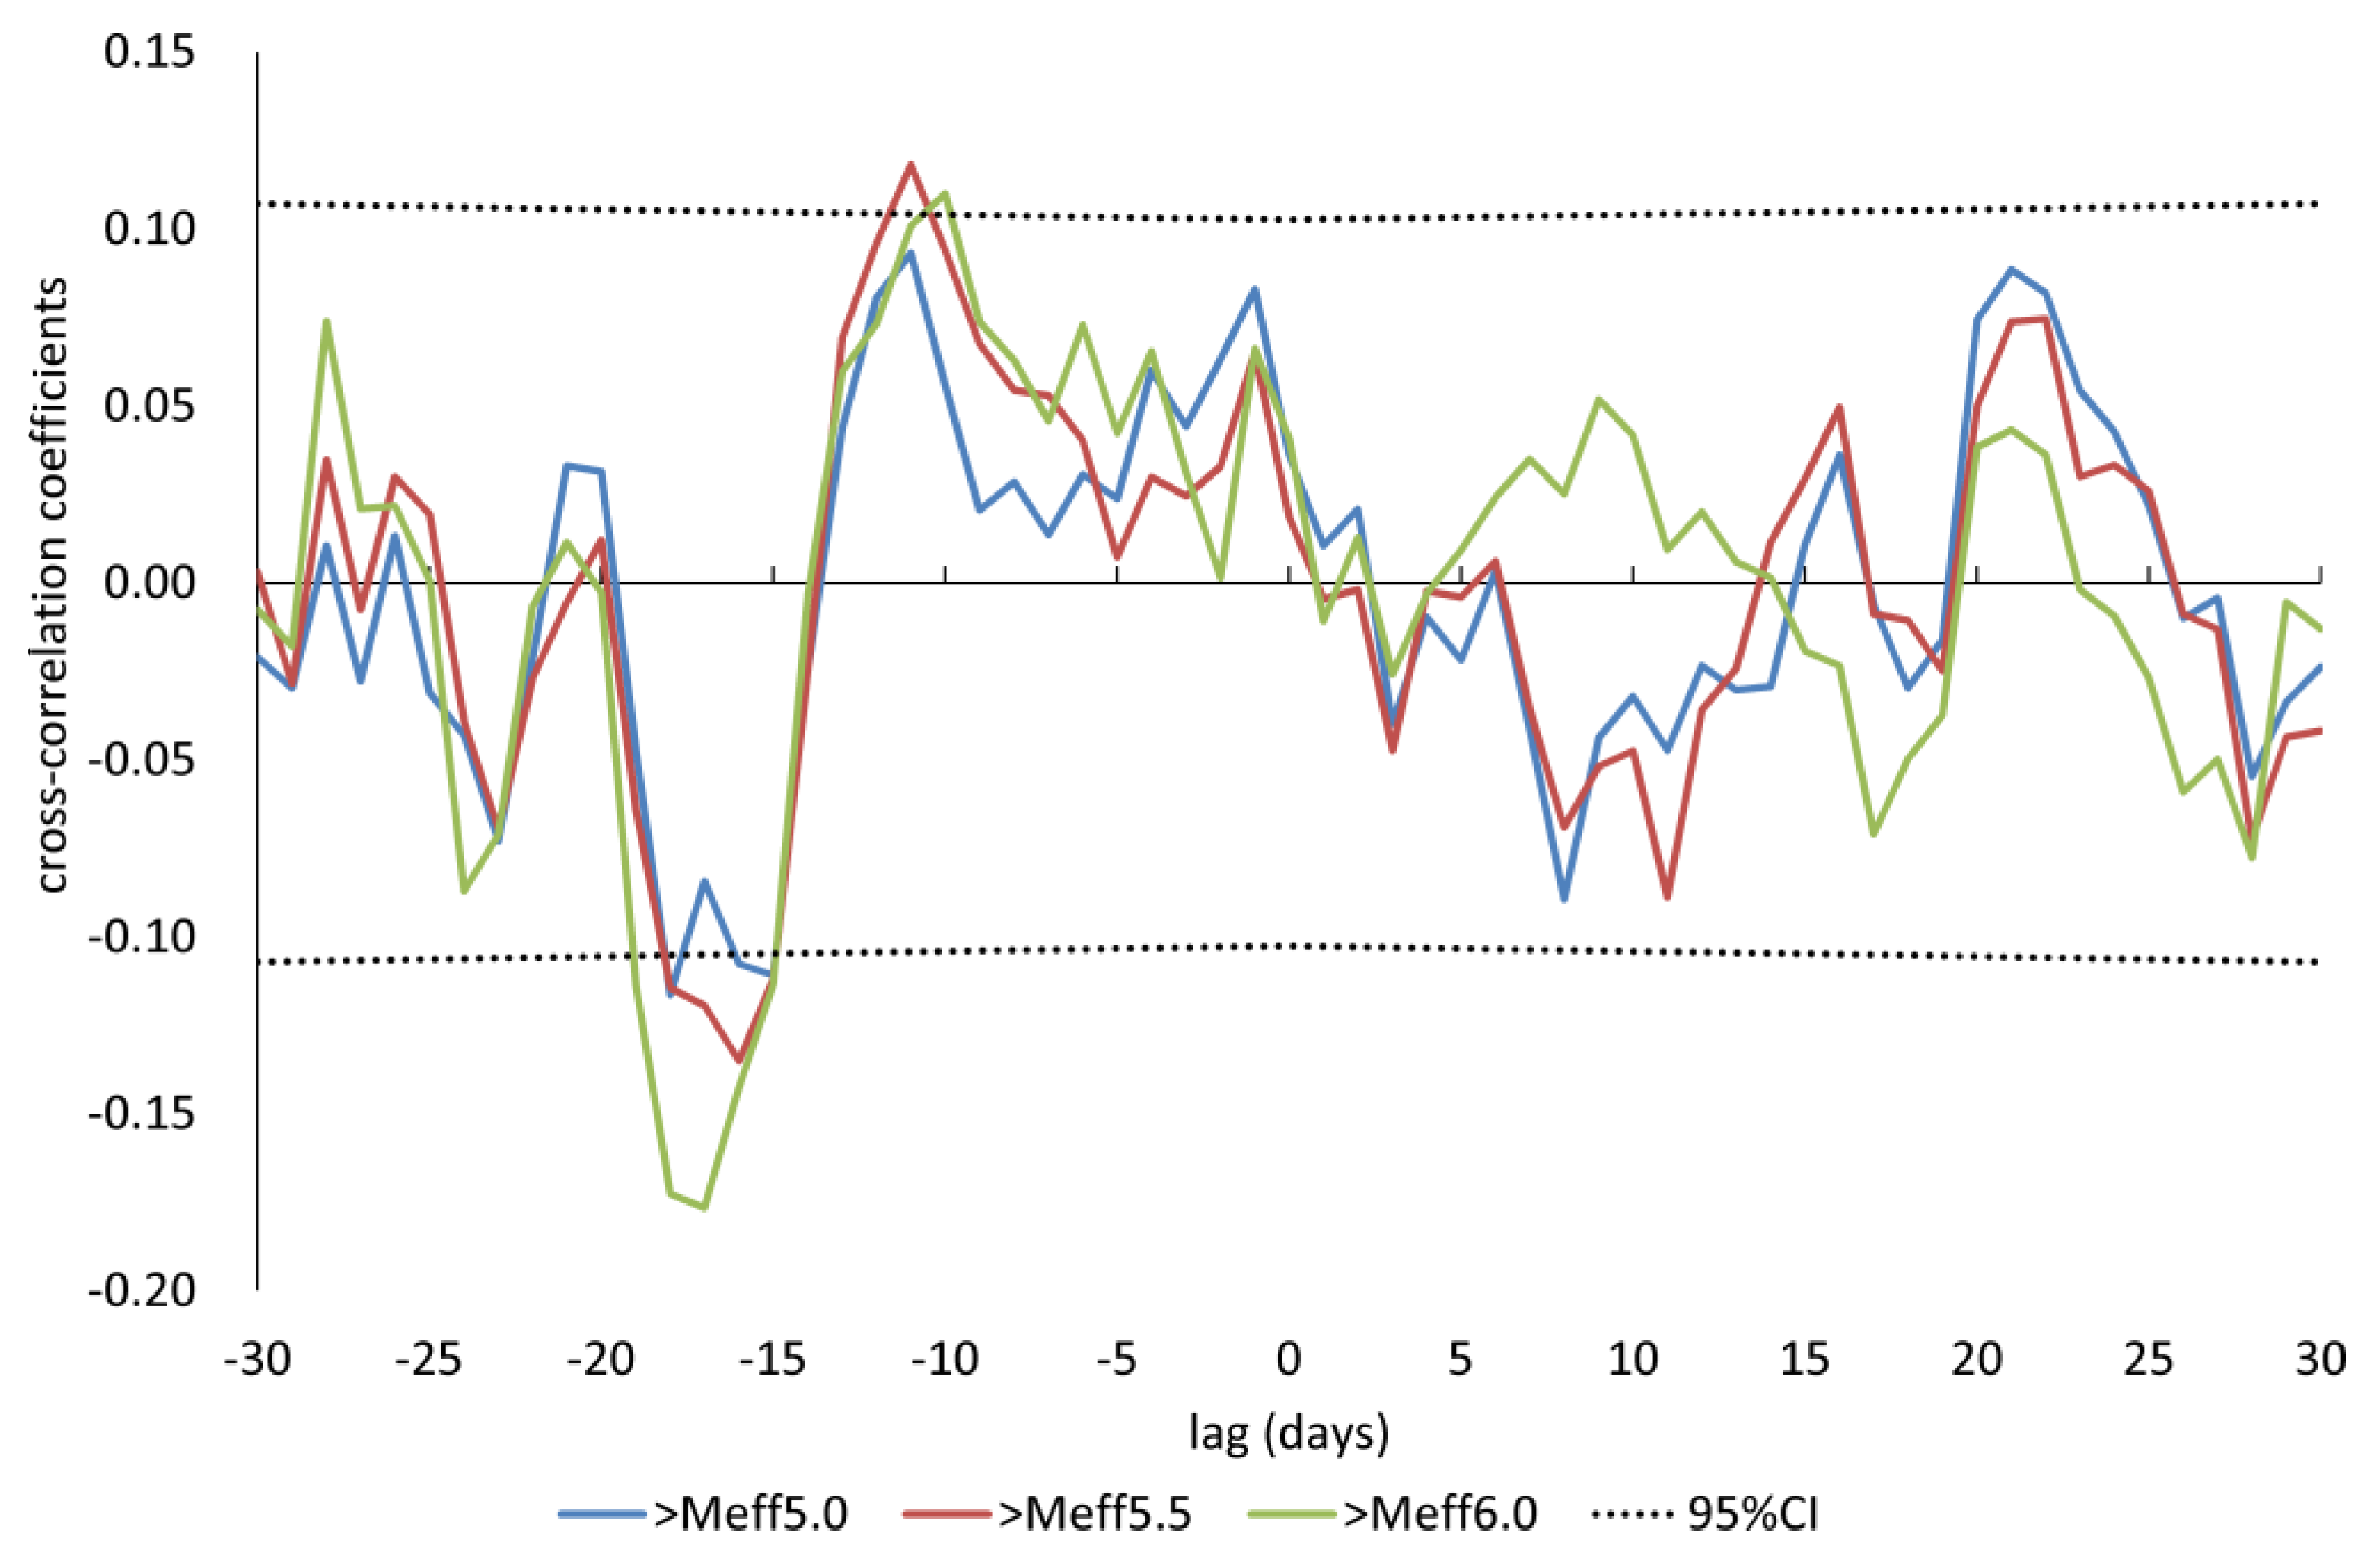
3.1. Cross-Correlation Analyses
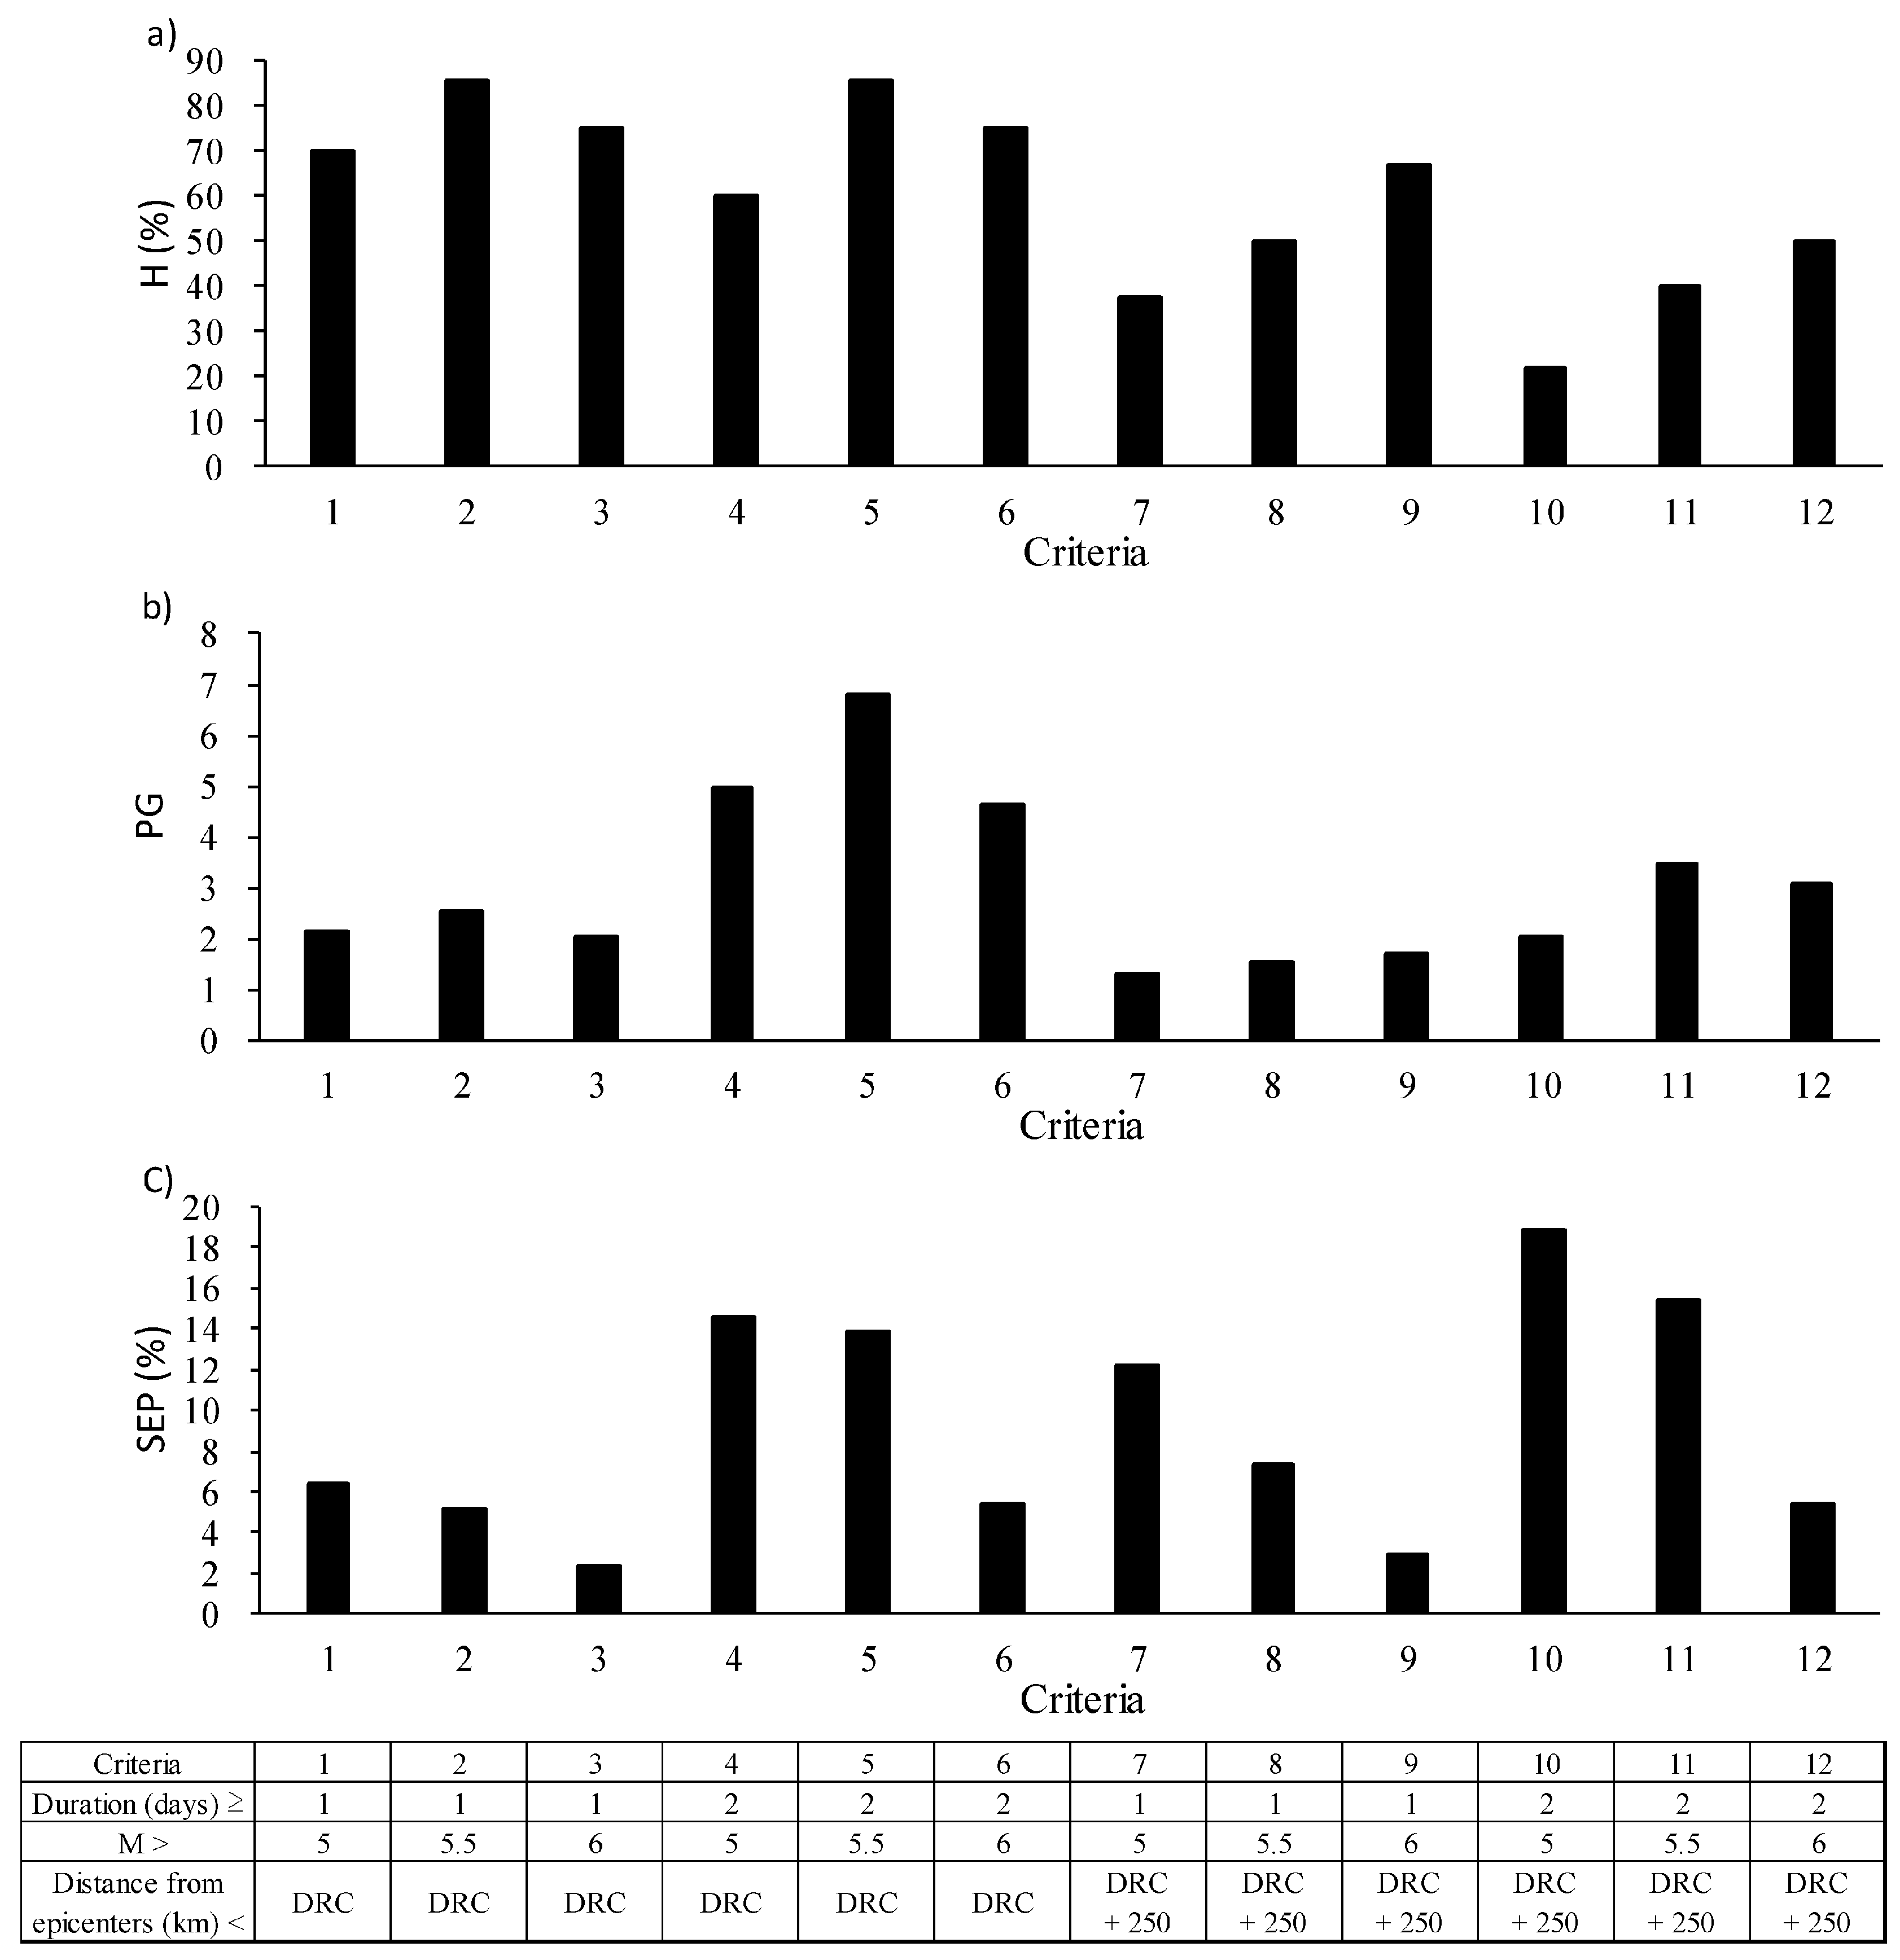
3.2. Binary Earthquake Forecasts
3.3. Comparison with Anomalies in VLF/LF Propagation Data
4. Discussion
4.1. Cross-Correlation Analyses
4.2. Binary Earthquake Forecasts
4.3. Comparison with Anomalies of VLF/LF Propagation Data
5. Conclusions
Acknowledgments
Author Contributions
Conflicts of Interest
References
- Wattananikorn, K.; Kanaree, M.; Wiboolsake, S. Soil gas radon as an earthquake precursor: Some considerations on data improvement. Radiat. Meas. 1998, 29, 593–598. [Google Scholar] [CrossRef]
- Hayakawa, M.; Fujinawa, Y. Electromagnetic Phenomena Related to Earthquake Prediction; Terra Scientific Publishing Company: Tokyo, Japan, 1994. [Google Scholar]
- Hayakawa, M.; Kawate, R.; Molchanov, O.A.; Yumoto, K. Results of ultra-low-frequency magnetic field measurements during the Guam earthquake of 8 August 1993. Geophys. Res. Lett. 1996, 23, 241–244. [Google Scholar] [CrossRef]
- Athanasiou, M.; Anagnostopoulos, G.; Iliopoulos, A.; Pavlos, G.; David, C. Enhanced ULF radiation observed by DEMETER two months around the strong 2010 Haiti earthquake. Nat. Hazards Earth Syst. Sci. 2011, 11, 1091–1098. [Google Scholar] [CrossRef] [Green Version]
- Hartmann, J.; Levy, J.K. Hydrogeological and gasgeochemical earthquake precursors—A review for application. Nat. Hazards 2005, 34, 279–304. [Google Scholar] [CrossRef]
- Park, S.K.; Johnston, M.J.S.; Madden, T.R.; Morgan, F.D.; Morrison, H.F. Electromagnetic precursors to earthquakes in the ULF band: A review of observations and mechanisms. Rev. Geophys. 1993, 31, 117–132. [Google Scholar] [CrossRef]
- Ohta, K.; Izutsu, J.; Schekotov, A.; Hayakawa, M. The ULF/ELF electromagnetic radiation before the 11 March 2011 Japanese earthquake. Radio Sci. 2013, 48, 589–596. [Google Scholar] [CrossRef]
- Schekotov, A.; Zhou, H.; Qiao, X.; Hayakawa, M. ULF/ELF Atmospheric Radiation in Possible Association to the 2011 Tohoku Earthquake as Observed in China. Earth Sci. Res. 2016, 5, 47–58. [Google Scholar] [CrossRef]
- Athanasiou, M.; Anagnostopoulos, G.; David, C.; Machairides, G. The ultra low frequency electromagnetic radiation observed in the topside ionosphere above boundaries of tectonic plates. Res. Geophys. 2014, 4. [Google Scholar] [CrossRef]
- Anagnostopoulos, G.C.; Vassiliadis, E.; Pulinets, S. Characteristics of flux-time profiles, temporal evolution, and spatial distribution of radiation-belt electron precipitation bursts in the upper ionosphere before great and giant earthquakes. Ann. Geophys. 2012, 55, 21–36. [Google Scholar]
- Sidiropoulos, N.; Anagnostopoulos, G.; Rigas, V. Comparative study on earthquake and ground based transmitter induced radiation belt electron precipitation at middle latitudes. Nat. Hazards Earth Syst. Sci. 2011, 11, 1901–1913. [Google Scholar] [CrossRef]
- Silva, H.G.; Bezzeghoud, M.; Oliveira, M.M.; Reis, A.H.; Rosa, R.N. A simple statistical procedure for the analysis of radon anomalies associated with seismic activity. Ann. Geophys. 2013, 56. [Google Scholar] [CrossRef]
- Hayakawa, M.; Kasahara, Y.; Nakamura, T.; Muto, F.; Horie, T.; Maekawa, S.; Hobara, Y.; Rozhnoi, A.; Solovieva, M.; Molchanov, O. A statistical study on the correlation between lower ionospheric perturbations as seen by subionospheric VLF/LF propagation and earthquakes. J. Geophys. Res. 2010, 115. [Google Scholar] [CrossRef]
- Maekawa, S.; Horie, T.; Yamauchi, T.; Sawaya, T.; Ishikawa, M.; Hayakawa, M.; Sasaki, H. A statistical study on the effect of earthquakes on the ionosphere, based on the subionospheric LF propagation data in Japan. Ann. Geophys. 2006, 24, 2219–2225. [Google Scholar] [CrossRef]
- Němec, F.; Santolík, O.; Parrot, M. Decrease of intensity of ELF/VLF waves observed in the upper ionosphere close to earthquakes: A statistical study. J. Geophys. Res. 2009, 114. [Google Scholar] [CrossRef]
- Zhang, X.; Fidani, C.; Huang, J.; Shen, X.; Zeren, Z.; Qian, J. Burst increases of precipitating electrons recorded by the DEMETER satellite before strong earthquakes. Nat. Hazards Earth Syst. Sci. 2013, 13, 197–209. [Google Scholar] [CrossRef]
- Wadatsumi, K. 1591 Witnesses Phenomena Prior to Earthquakes; Tokyo Publisher: Tokyo, Japan, 1995. (In Japanese) [Google Scholar]
- Wadatsumi, K.; Haraguchi, R.; Okamoto, K.; Koga, H. Macroscopic anomaly on the Taiwan Earthquake, the Western Tottori Prefecture Earthquake and Geiyo Earthquake. Geoinformatics 2001, 12, 130–133. [Google Scholar] [CrossRef]
- Ulsoy, Ü.; Ikeya, M. Retrospective Statements of Earthquake Precursors by Eye-Witnesses. In Future Systems for Earthquake Early Warning; Ulsoy, Ü., Kundu, K.H., Eds.; Nova Science Publishers, Inc.: New York, NY, USA, 2008; pp. 3–53. [Google Scholar]
- Yokoi, S.; Ikeya, M.; Yagi, T.; Nagai, K. Mouse circadian rhythm before the Kobe earthquake in 1995. Bioelectromagnetics 2003, 24, 289–291. [Google Scholar] [CrossRef] [PubMed]
- Li, Y.; Liu, Y.; Jiang, Z.; Guan, J.; Yi, G.; Cheng, S.; Yang, B.; Fu, T.; Wang, Z. Behavioral change related to Wenchuan devastating earthquake in mice. Bioelectromagnetics 2009, 30, 613–620. [Google Scholar] [CrossRef] [PubMed]
- Grant, R.A.; Raulin, J.P.; Freund, F.T. Changes in animal activity prior to a major (M = 7) earthquake in the Peruvian Andes. Phys. Chem. Earth 2015, 85–86, 69–77. [Google Scholar] [CrossRef]
- Rushen, J.; de Passille, A.M.B.; Munksgaard, L. Fear of people by cows and effects on milk yield, behavior, and heart rate at milking. J. Dairy Sci. 1999, 82, 720–727. [Google Scholar] [CrossRef]
- Rushen, J.; Munksgaard, L.; Marnet, P.; DePassillé, A. Human contact and the effects of acute stress on cows at milking. Appl. Anim. Behav. Sci. 2001, 73, 1–14. [Google Scholar] [CrossRef]
- Rigalma, K.; Duvaux-Ponter, C.; Barrier, A.; Charles, C.; Ponter, A.; Deschamps, F.; Roussel, S. Medium-term effects of repeated exposure to stray voltage on activity, stress physiology, and milk production and composition in dairy cows. J. Dairy Sci. 2010, 93, 3542–3552. [Google Scholar] [CrossRef] [PubMed]
- Fidani, C. Biological Anomalies around the 2009 L’Aquila Earthquake. Animals 2013, 3, 693–721. [Google Scholar] [CrossRef] [PubMed]
- Nikonov, A.A. Abnormal animal behaviour as a precursor of the 7 December 1988 Spitak, Armenia, earthquake. Nat. Hazards 1992, 6, 1–10. [Google Scholar] [CrossRef]
- Yamauchi, H.; Uchiyama, H.; Ohtani, N.; Ohta, M. Unusual Animal Behavior Preceding the 2011 Earthquake off the Pacific Coast of Tohoku, Japan: A Way to Predict the Approach of Large Earthquakes. Animals 2014, 4, 131–145. [Google Scholar] [CrossRef] [PubMed]
- Aki, K. A probabilistic synthesis of precursory phenomena. In Earthquake Prediction; American Geophysical Union: Washington, DC, USA, 1981; pp. 566–574. [Google Scholar]
- Holliday, J.R.; Rundle, J.B.; Tiampo, K.F.; Klein, W.; Donnellan, A. Systematic procedural and sensitivity analysis of the pattern informatics method for forecasting large (M > 5) earthquake events in southern California. Pure Appl. Geophys. 2006, 163, 2433–2454. [Google Scholar] [CrossRef]
- Molchanov, O.A.; Hayakawa, M. Seismo-Electromagnetics and Related Phenomena: History and Latest Results; Terra Scientific Publishing Company: Tokyo, Japan, 2008. [Google Scholar]
- Pulinets, S.; Boyarchuk, K. Ionospheric Precursors of Earthquakes; Springer Science & Business Media: Berlin, Germany, 2004. [Google Scholar]
- Hayakawa, M.; Hobara, Y.; Yasuda, Y.; Yamaguchi, H.; Ohta, K.; Izutsu, J.; Nakamura, T. Possible precursor to the March 11, 2011, Japan earthquake: Ionospheric perturbations as seen by subionospheric very low frequency/low frequency propagation. Ann. Geophys. 2012, 55, 95–99. [Google Scholar]
- Wood, P.D.P. Algebraic model of the lactation curve in cattle. Nature 1967, 216, 164–165. [Google Scholar] [CrossRef]
- Catillo, G.; Macciotta, N.P.P.; Carretta, A.; Cappio-Borlino, A. Effects of age and calving season on lactation curves of milk production traits in Italian water buffaloes. J. Dairy Sci. 2002, 85, 1298–1306. [Google Scholar] [CrossRef]
- Olori, V.E.; Brotherstone, S.; Hill, W.G.; McGuirk, B.J. Fit of standard models of the lactation curve to weekly records of milk production of cows in a single herd. Livest. Prod. Sci. 1999, 58, 55–63. [Google Scholar] [CrossRef]
- West, J.; Mullinix, B.; Bernard, J. Effects of hot, humid weather on milk temperature, dry matter intake, and milk yield of lactating dairy cows. J. Dairy Sci. 2003, 86, 232–242. [Google Scholar] [CrossRef]
- National Oceanic and Atmospheric Administration. Livestock Hot Weather Stress. Operations Manual Letter C-31-76; Department of Commerce, NOAA, National Weather Service Central Region: Kansas City, MO, USA, 1976.
- Vitali, A.; Segnalini, M.; Bertocchi, L.; Bernabucci, U.; Nardone, A.; Lacetera, N. Seasonal pattern of mortality and relationships between mortality and temperature-humidity index in dairy cows. J. Dairy Sci. 2009, 92, 3781–3790. [Google Scholar] [CrossRef] [PubMed]
- Dobrovolsky, I.P.; Zubkov, S.I.; Miachkin, V.I. Estimation of the size of earthquake preparation zones. Pure Appl. Geophys. 1979, 117, 1025–1044. [Google Scholar] [CrossRef]
- Gutenberg, B.; Richter, C.F. Magnitude and energy of earthquakes. Ann. Geophys. 2010, 53, 7–12. [Google Scholar]
- Molchanov, O.; Hayakawa, M. Subionospheric VLF signal perturbations possibly related to earthquakes. J. Geophys. Res. 1998, 103, 17489–17504. [Google Scholar] [CrossRef]
- Hayakawa, M.; Molchanov, O.A. Summary report of NASDA’s earthquake remote sensing frontier project. Phys. Chem. Earth 2004, 29, 617–625. [Google Scholar] [CrossRef]
- Hayakawa, M.; Hobara, Y.; Rozhnoi, A.; Solovieva, M.; Ohta, K.; Izutsu, J.; Nakamura, T.; Kasahara, Y. The ionospheric precursor to the 2011 march 11 earthquake based upon observations obtained from the Japan-Pacific subionospheric VLF/LF network. Terr. Atmos. Ocean Sci. 2013, 24, 393–408. [Google Scholar] [CrossRef]
- Němec, F.; Santolík, O.; Parrot, M.; Berthelier, J. Spacecraft observations of electromagnetic perturbations connected with seismic activity. Geophys. Res. Lett. 2008, 35. [Google Scholar] [CrossRef] [Green Version]
- Anagnostopoulos, G.C.; Basta, M.; Stefanakis, Z.; Vassiliadis, V.G.; Vgontzas, A.N.; Rigas, A.G.; Koutsomitros, S.T.; Baloyannis, S.J.; Papadopoulos, G. A study of correlation between seismicity and mental health: Crete, 2008–2010. Geomat. Nat. Hazards Risk 2015, 6, 45–75. [Google Scholar] [CrossRef]
- Fraser-Smith, A.C.; Bernardi, A.; McGill, P.R.; Ladd, M.E.; Helliwell, R.A.; Villard, O.G. Low-frequency magnetic field measurements near the epicenter of the Ms 7.1 Loma Prieta earthquake. Geophys. Res. Lett. 1990, 17, 1465–1468. [Google Scholar] [CrossRef]
- Hayakawa, M.; Hattori, K.; Ohta, K. Monitoring of ULF (ultra-low-frequency) geomagnetic variations associated with earthquakes. Sensors 2007, 7, 1108–1122. [Google Scholar] [CrossRef]
- Mahdavi, S.M.; Sahraei, H.; Yaghmaei, P.; Tavakoli, H. Effects of Electromagnetic Radiation Exposure on Stress-Related Behaviors and Stress Hormones in Male Wistar Rats. Biomol. Ther. 2014, 22, 570–576. [Google Scholar] [CrossRef] [PubMed]
- Mahdavi, S.M.; Sahraei, H.; Tavakoli, H.; Yaghmaei, P. Effect of 5Hz electromagnetic waves on movement behavior in male wistar rats (in vitro). J. Paramedical Sci. 2013, 5, 1. [Google Scholar]
- Mahdavi, S.M.; Rezaei-Tavirani, M.; Nikzamir, A.; Ardeshirylajimi, A. 12 Hz electromagnetic field changes stress-related hormones of rat. J. Paramedical Sci. 2014, 5, 4. [Google Scholar]
- Engelmann, W.; Hellrung, W.; Johnsson, A. Circadian locomotor activity of Musca flies: Recording method and effects of 10 Hz square-wave electric fields. Bioelectromagnetics 1996, 17, 100–110. [Google Scholar] [CrossRef]
- Dowse, H. The effects of phase shifts in a 10 Hz electric field cycle on locomotor activity rhythm of Drosophila melanogaster. Biol. Rhythm Res. 1982, 13, 257–264. [Google Scholar]
- Begall, S.; Cerveny, J.; Neef, J.; Vojtech, O.; Burda, H. Magnetic alignment in grazing and resting cattle and deer. Proc. Natl. Acad. Sci. USA 2008, 105, 13451–13455. [Google Scholar] [CrossRef] [PubMed]
- Begall, S.; Burda, H.; Červený, J.; Gerter, O.; Neef-Weisse, J.; Němec, P. Further support for the alignment of cattle along magnetic field lines: Reply to Hert et al. J. Comp. Psychol. 2011, 197, 1127–1133. [Google Scholar] [CrossRef] [PubMed]
- Slaby, P.; Tomanova, K.; Vacha, M. Cattle on pastures do align along the North-South axis, but the alignment depends on herd density. J. Comp. Physiol. A Neuroethol. Sens. Neural Behav. Physiol. 2013, 199, 695–701. [Google Scholar] [CrossRef] [PubMed]


| a | b | c |
|---|---|---|
| 27.1 ± 15.9 | 0.183 ± 0.520 | 0.00644 ± 0.01981 |
| a | b | c | x0 |
|---|---|---|---|
| −0.24 | 17.86 | 0.27 | 74.60 |
| Earthquake | Alarm | Total | |
|---|---|---|---|
| Yes | No | ||
| Yes | a | b | a + b |
| No | c | d | c + d |
| Total | a + c | b + d | a + b + c + d |
| Anomalies in Milk Yields | Targeted Earthquakes | |||
|---|---|---|---|---|
| σ < | Duration (Days) ≥ | M > | Distance from Epicenters < | |
| Criterion 1 | −1.5 | 1 | 5.0 | DRC |
| Criterion 2 | −1.5 | 1 | 5.5 | DRC |
| Criterion 3 | −1.5 | 1 | 6.0 | DRC |
| Criterion 4 | −1.5 | 2 | 5.0 | DRC |
| Criterion 5 | −1.5 | 2 | 5.5 | DRC |
| Criterion 6 | −1.5 | 2 | 6.0 | DRC |
| Criterion 7 | −1.5 | 1 | 5.0 | DRC + 250 km |
| Criterion 8 | −1.5 | 1 | 5.5 | DRC + 250 km |
| Criterion 9 | −1.5 | 1 | 6.0 | DRC + 250 km |
| Criterion 10 | −1.5 | 2 | 5.0 | DRC + 250 km |
| Criterion 11 | −1.5 | 2 | 5.5 | DRC + 250 km |
| Criterion 12 | −1.5 | 2 | 6.0 | DRC + 250 km |
| Criterion 1 | Criterion 7 | ||||||
| Earthquake | Alarm | Total | Earthquake | Alarm | Total | ||
| Yes | No | Yes | No | ||||
| Yes | 7 | 3 | 10 | Yes | 11 | 21 | 32 |
| No | 103 | 231 | 334 | No | 66 | 246 | 312 |
| Total | 110 | 234 | 344 | Total | 77 | 267 | 344 |
| Criterion 2 | Criterion 8 | ||||||
| Earthquake | Alarm | Total | Earthquake | Alarm | Total | ||
| Yes | No | Yes | No | ||||
| Yes | 6 | 1 | 7 | Yes | 7 | 8 | 15 |
| No | 109 | 228 | 337 | No | 90 | 239 | 329 |
| Total | 115 | 229 | 344 | Total | 97 | 247 | 344 |
| Criterion 3 | Criterion 9 | ||||||
| Earthquake | Alarm | Total | Earthquake | Alarm | Total | ||
| Yes | No | Yes | No | ||||
| Yes | 3 | 1 | 4 | Yes | 4 | 2 | 6 |
| No | 124 | 216 | 340 | No | 116 | 222 | 338 |
| Total | 127 | 217 | 344 | Total | 120 | 224 | 344 |
| Criterion 4 | Criterion 10 | ||||||
| Earthquake | Alarm | Total | Earthquake | Alarm | Total | ||
| Yes | No | Yes | No | ||||
| Yes | 6 | 4 | 10 | Yes | 7 | 25 | 32 |
| No | 35 | 299 | 334 | No | 30 | 282 | 312 |
| Total | 41 | 303 | 344 | Total | 37 | 307 | 344 |
| Criterion 5 | Criterion 11 | ||||||
| Earthquake | Alarm | Total | Earthquake | Alarm | Total | ||
| Yes | No | Yes | No | ||||
| Yes | 6 | 1 | 7 | Yes | 6 | 9 | 15 |
| No | 37 | 300 | 337 | No | 33 | 296 | 329 |
| Total | 43 | 301 | 344 | Total | 39 | 305 | 344 |
| Criterion 6 | Criterion 12 | ||||||
| Earthquake | Alarm | Total | Earthquake | Alarm | Total | ||
| Yes | No | Yes | No | ||||
| Yes | 3 | 1 | 4 | Yes | 3 | 3 | 6 |
| No | 52 | 288 | 340 | No | 52 | 286 | 338 |
| Total | 55 | 289 | 344 | Total | 55 | 289 | 344 |
| Anomalies of Milk Yields | Earthquake Data | VLF Data | ||||||||||||
|---|---|---|---|---|---|---|---|---|---|---|---|---|---|---|
| Start | End | Duration (Days) | Lead Time (Days) | σ (min) | Date (dd/mm/yyyy) | Lat | Lon | D (km) | DRC (km) | Depth (km) | M | Anomalies (Yes or No) | Lead Time (Days) | Path (Anomalous Day) |
| 11/4/2014 | 12/4/2014 | 2 | - | −3.57 | - | - | - | - | - | - | - | - | - | - |
| 16/04/2014 | 17/04/2014 | 2 | 18–19 | −3.30 | 5/5/2014 | 34.95 | 139.48 | 132 | 380 | 156 | 6.0 | Yes | 13 | JJY-KTU (22/04/2014) |
| 31/05/2014 | 2/6/2014 | 3 | 14–16 | −2.13 | 16/06/2014 | 36.62 | 141.80 | 165 | 282 | 37 | 5.7 | Yes | 10 | JJY-KTU (06/06/2014) |
| 16/06/2014 | 37.07 | 141.16 | 149 | 312 | 52 | 5.8 | Yes | 10 | JJY-NSB (06/06/2014) | |||||
| 23/06/2014 | 27/06/2014 | 5 | 15–19 | −4.78 | 12/7/2014 | 37.05 | 142.32 | 228 | 1023 | 33 | 7.0 | Yes | 11 | JJY-IMZ (01/07/2014) |
| 29/07/2014 | 31/07/2014 | 3 | - | −2.31 | - | - | - | - | - | - | - | - | - | - |
| 24/08/2014 | 26/08/2014 | 3 | 21–23 | −1.90 | 16/09/2014 | 36.09 | 139.86 | 24 | 256 | 47 | 5.6 | Yes | 11 | JJY-TYH (05/09/2014) |
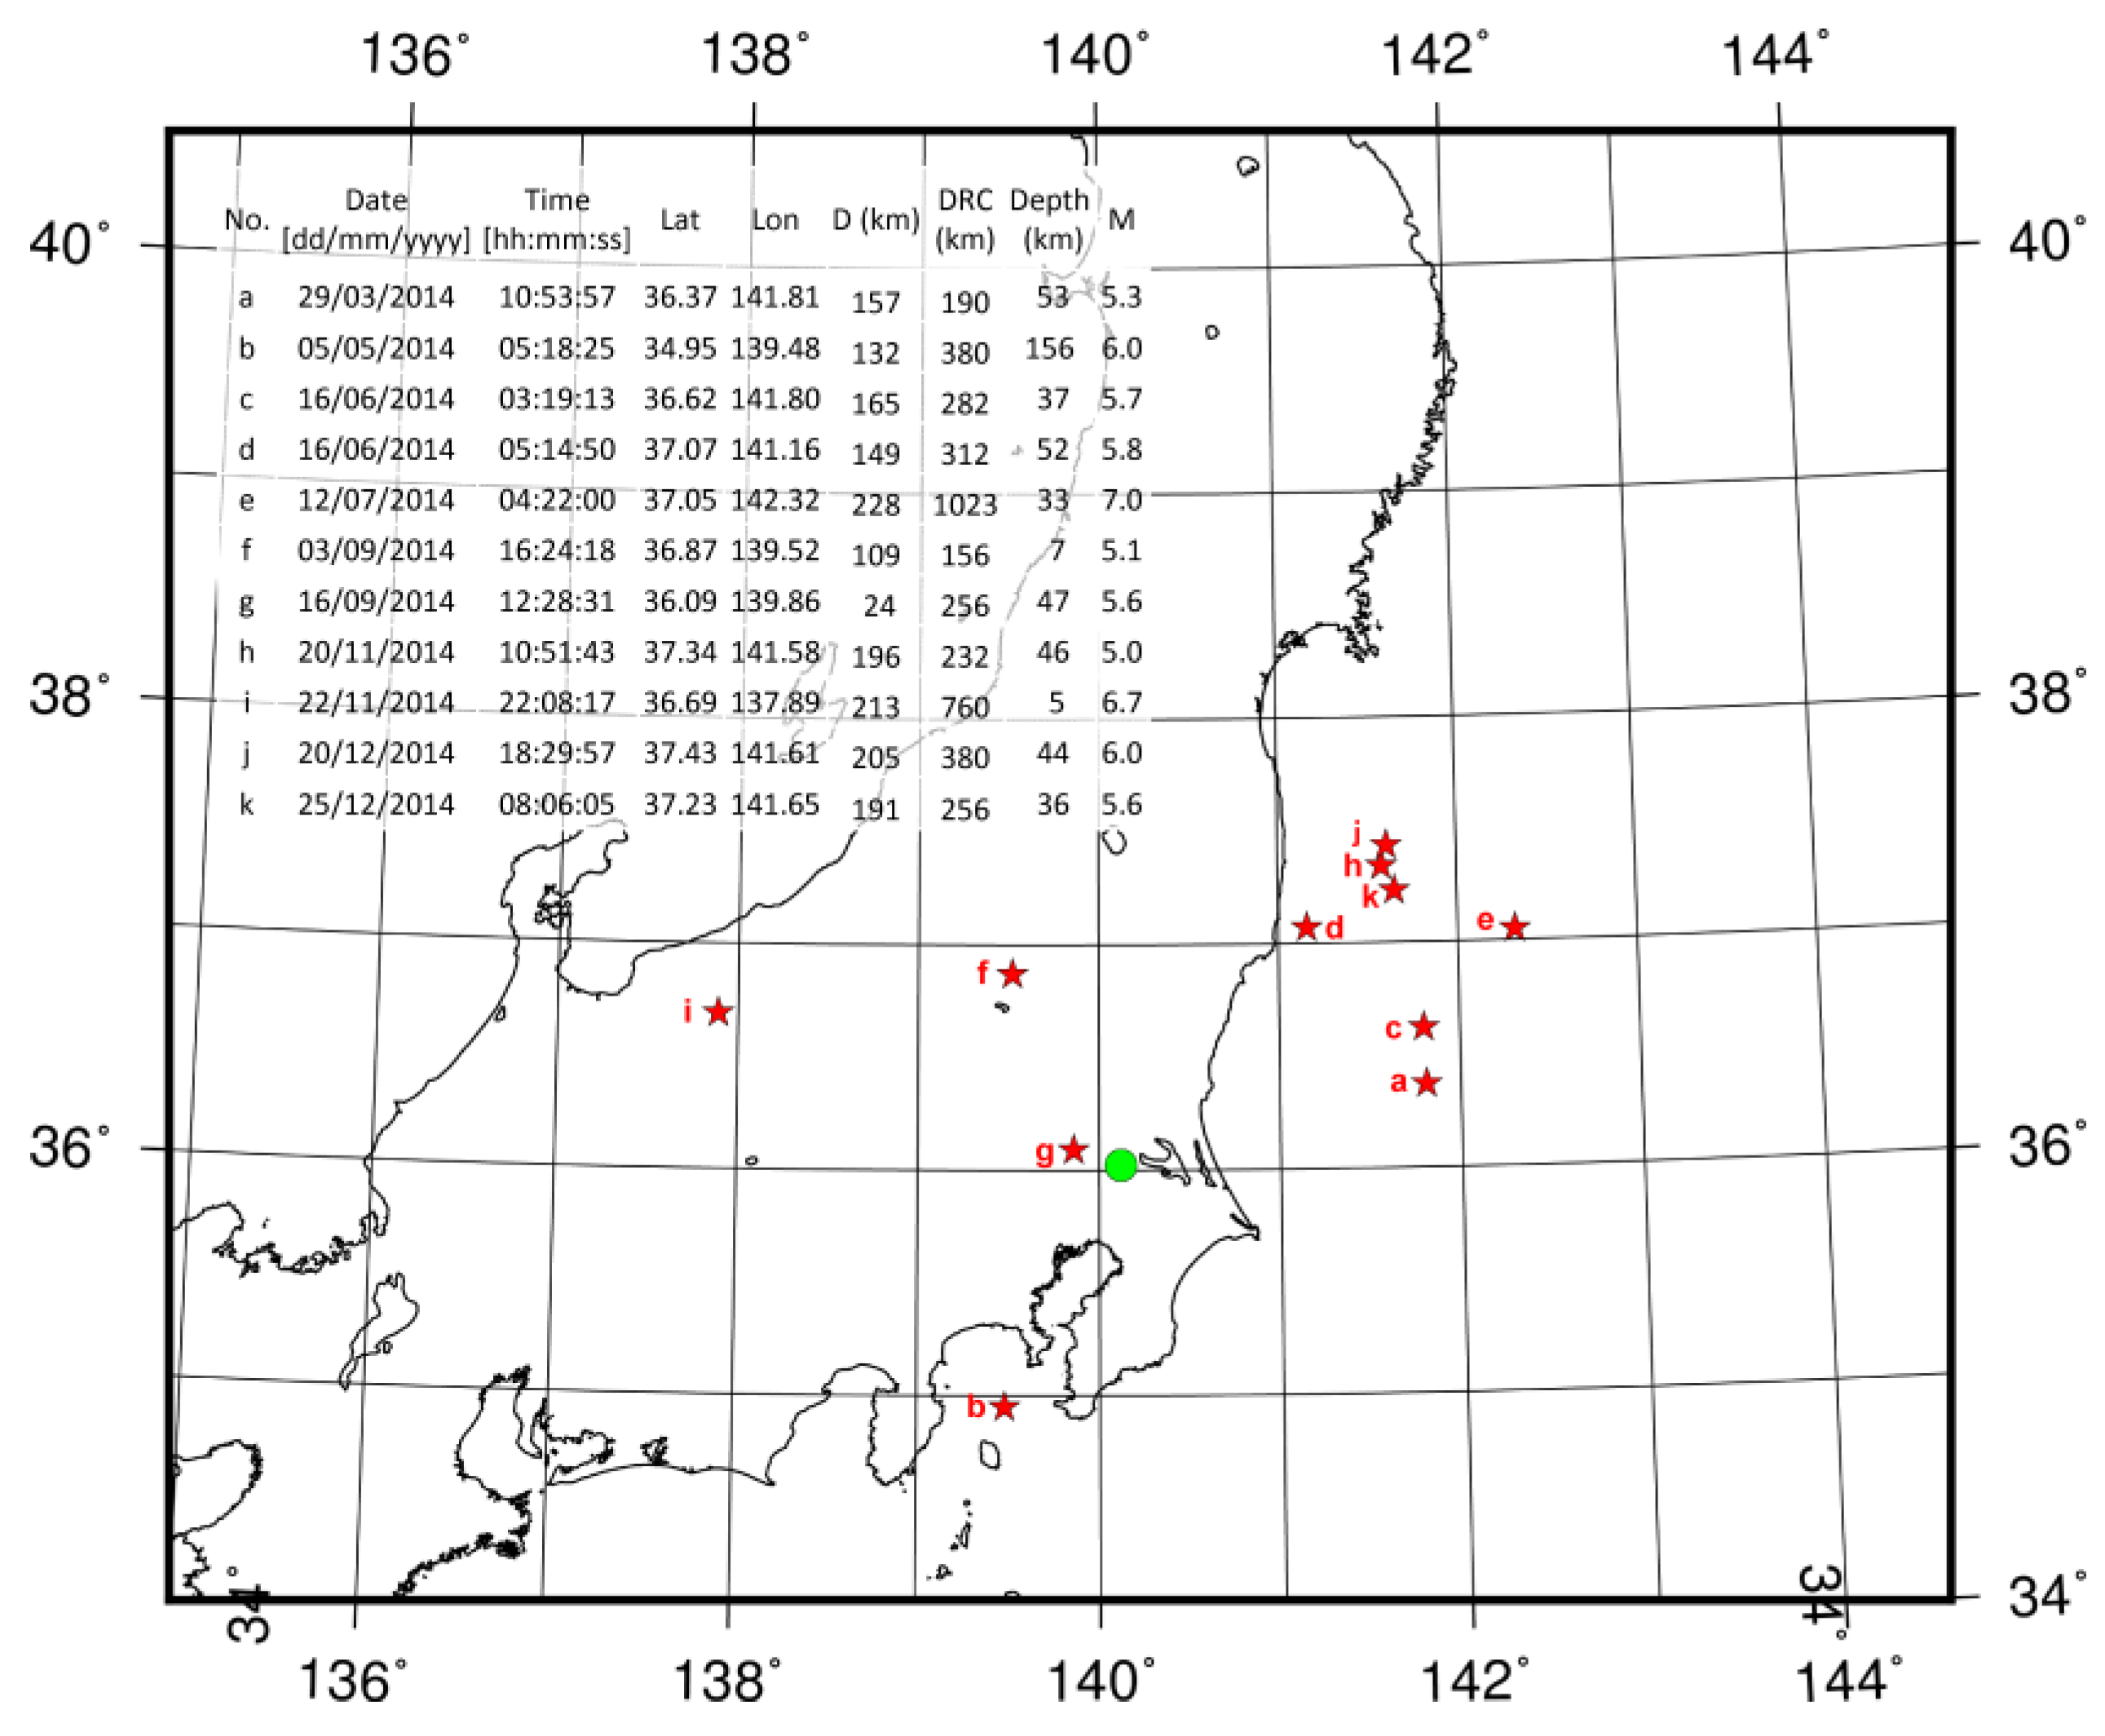
| 4/11/2014 | 5/11/2014 | 2 | 17–18 | −2.93 | 22/11/2014 | 36.69 | 137.89 | 213 | 760 | 5 | 6.7 | Yes | 10 | JJY-IMZ (12/11/2014) |
| - | - | - | - | - | 20/12/2014 | 37.43 | 141.61 | 205 | 380 | 44 | 6.0 | Yes | 11 | JJY-STU (09/12/2014) |
| 8/12/2014 | 9/12/2014 | 2 | 16–17 | −1.74 | 25/12/2014 | 37.23 | 141.65 | 191 | 256 | 36 | 5.6 | Yes | 8 | JJY-NSB (17/12/2014) |
© 2017 by the authors. Licensee MDPI, Basel, Switzerland. This article is an open access article distributed under the terms and conditions of the Creative Commons Attribution (CC BY) license ( http://creativecommons.org/licenses/by/4.0/).
Share and Cite
Yamauchi, H.; Hayakawa, M.; Asano, T.; Ohtani, N.; Ohta, M. Statistical Evaluations of Variations in Dairy Cows’ Milk Yields as a Precursor of Earthquakes. Animals 2017, 7, 19. https://doi.org/10.3390/ani7030019
Yamauchi H, Hayakawa M, Asano T, Ohtani N, Ohta M. Statistical Evaluations of Variations in Dairy Cows’ Milk Yields as a Precursor of Earthquakes. Animals. 2017; 7(3):19. https://doi.org/10.3390/ani7030019
Chicago/Turabian StyleYamauchi, Hiroyuki, Masashi Hayakawa, Tomokazu Asano, Nobuyo Ohtani, and Mitsuaki Ohta. 2017. "Statistical Evaluations of Variations in Dairy Cows’ Milk Yields as a Precursor of Earthquakes" Animals 7, no. 3: 19. https://doi.org/10.3390/ani7030019