
The Microbiota of Modified-Atmosphere-Packaged Cooked Charcuterie Products throughout Their Shelf-Life Period, as Revealed by a Complementary Combination of Culture-Dependent and Culture-Independent Analysis

 ,
,  , ,
, ,  and
and
Abstract
:1. Introduction
2. Materials and Methods
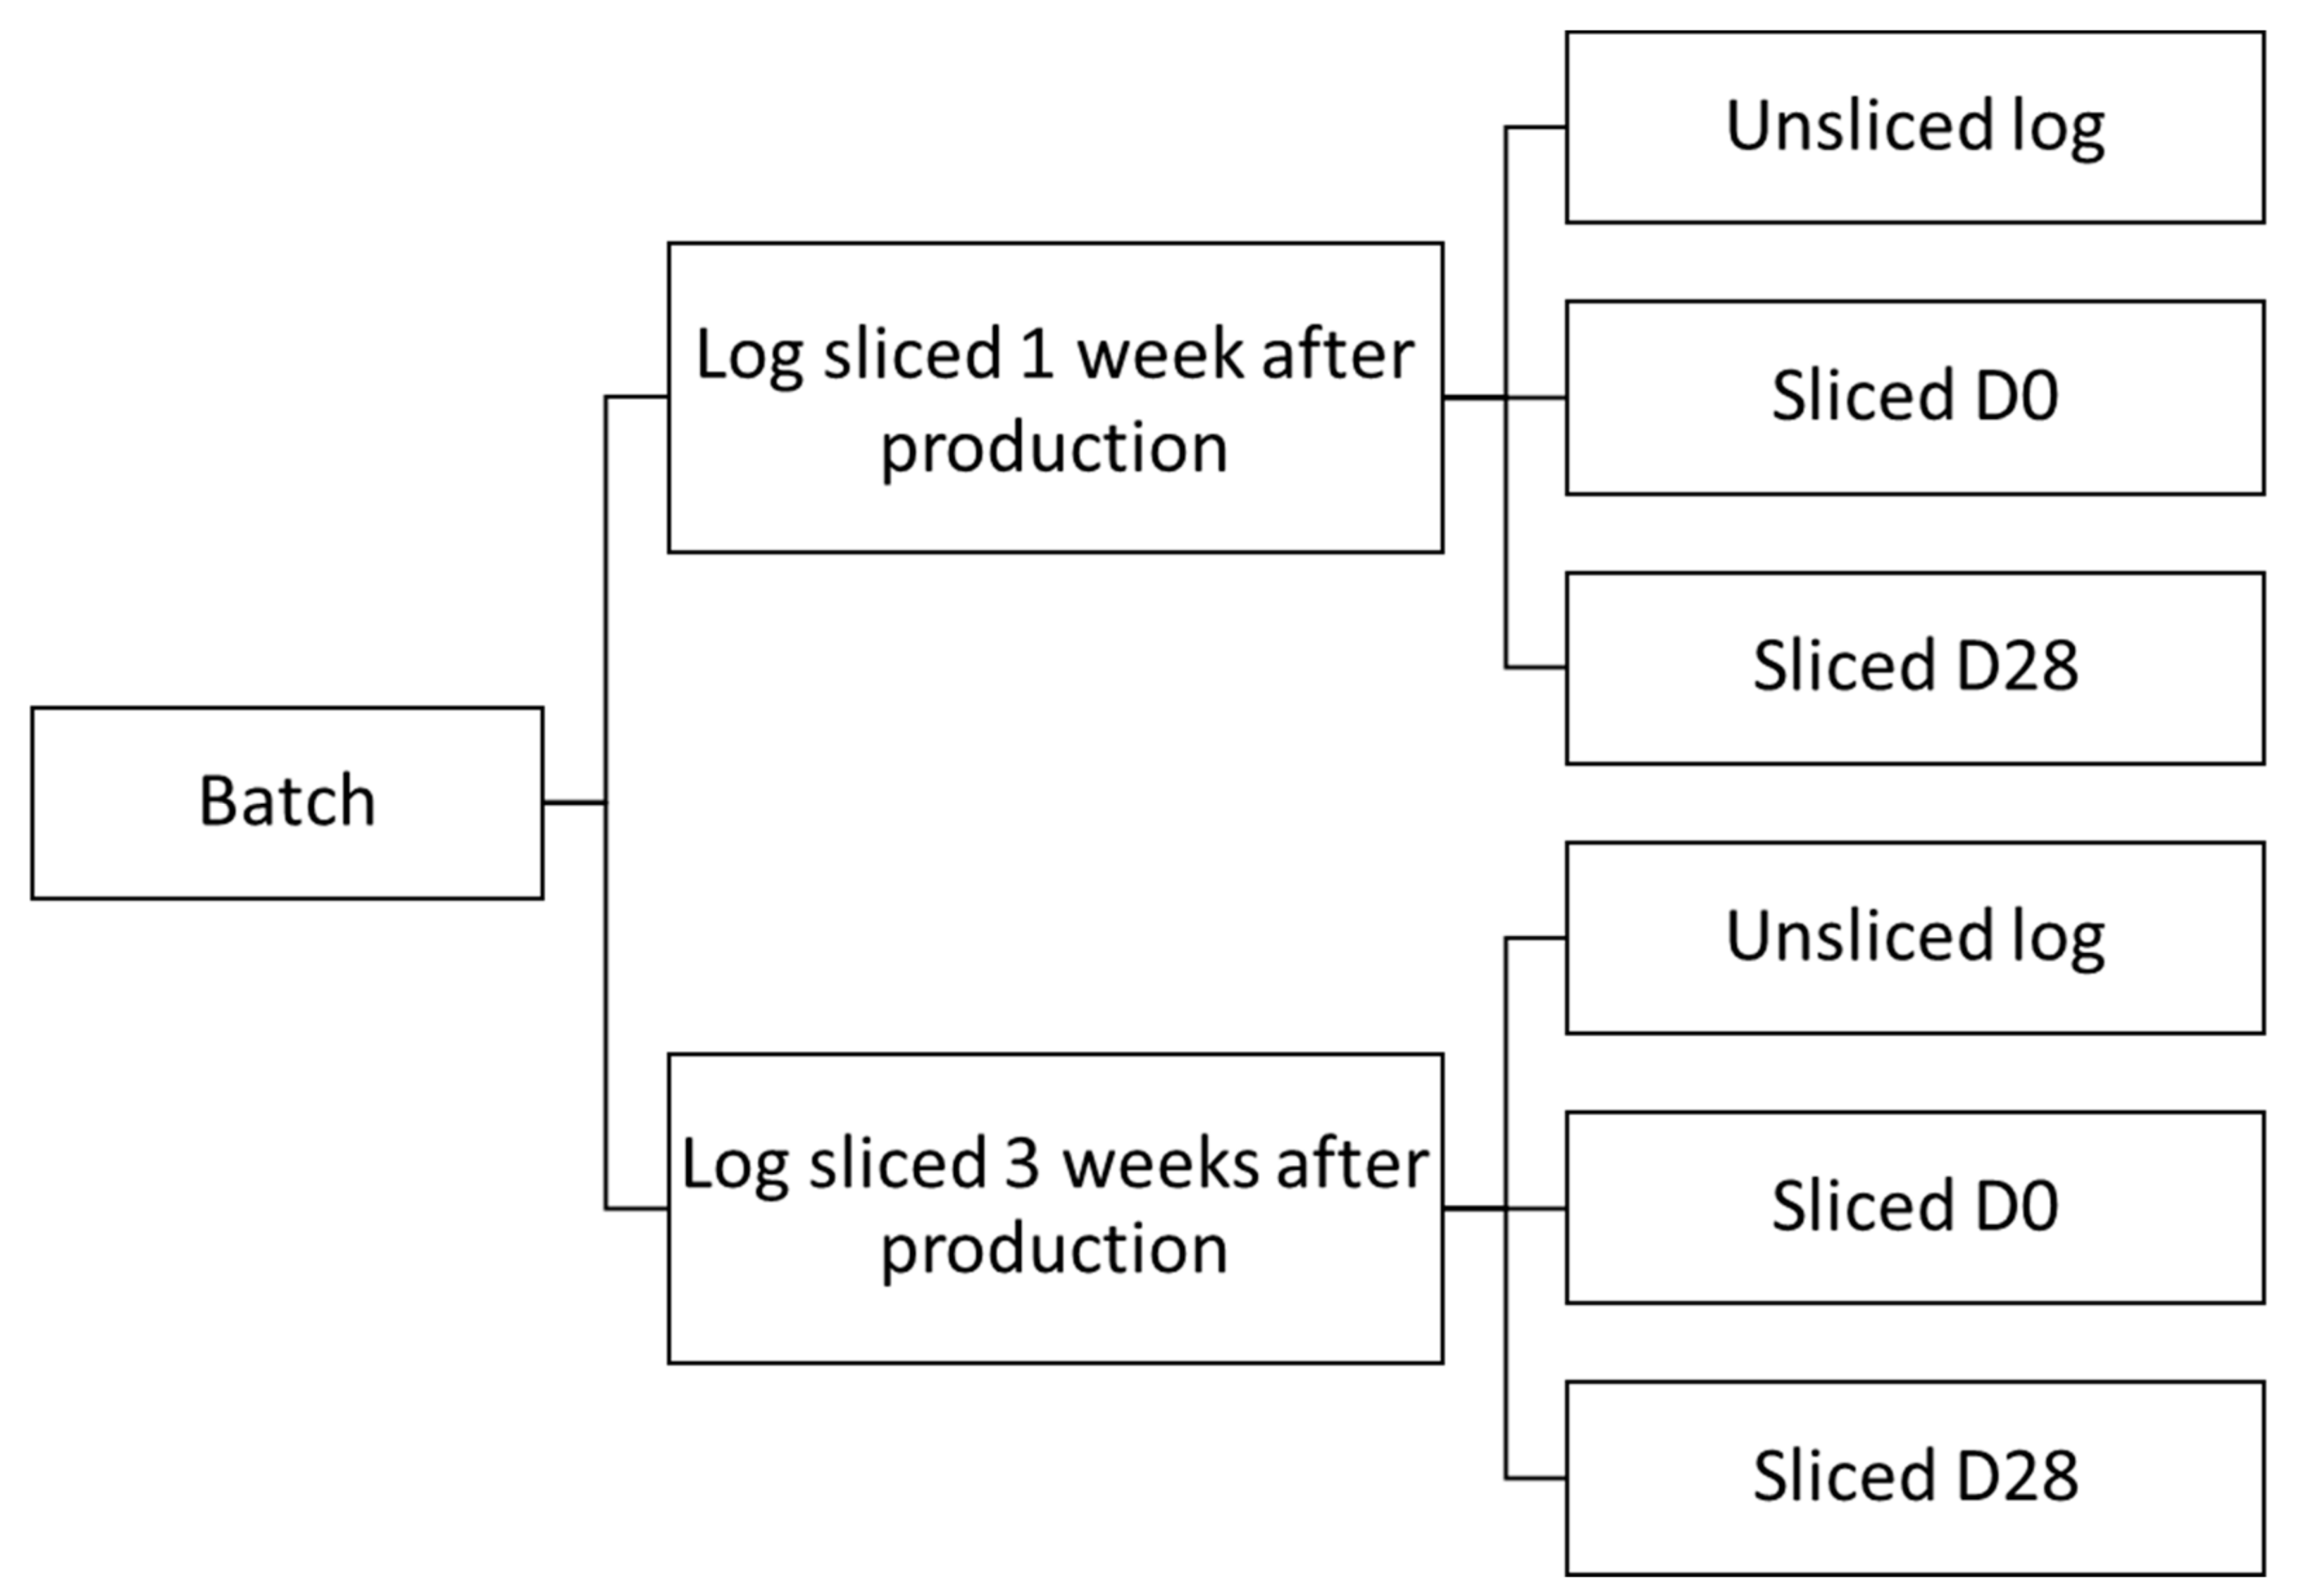
2.1. Sample Collection and Storage
2.2. Microbiological Analysis
2.3. Isolate Collection
2.4. Identification of Isolates
2.5. Metabarcoding
2.6. Statistical Analysis
3. Results
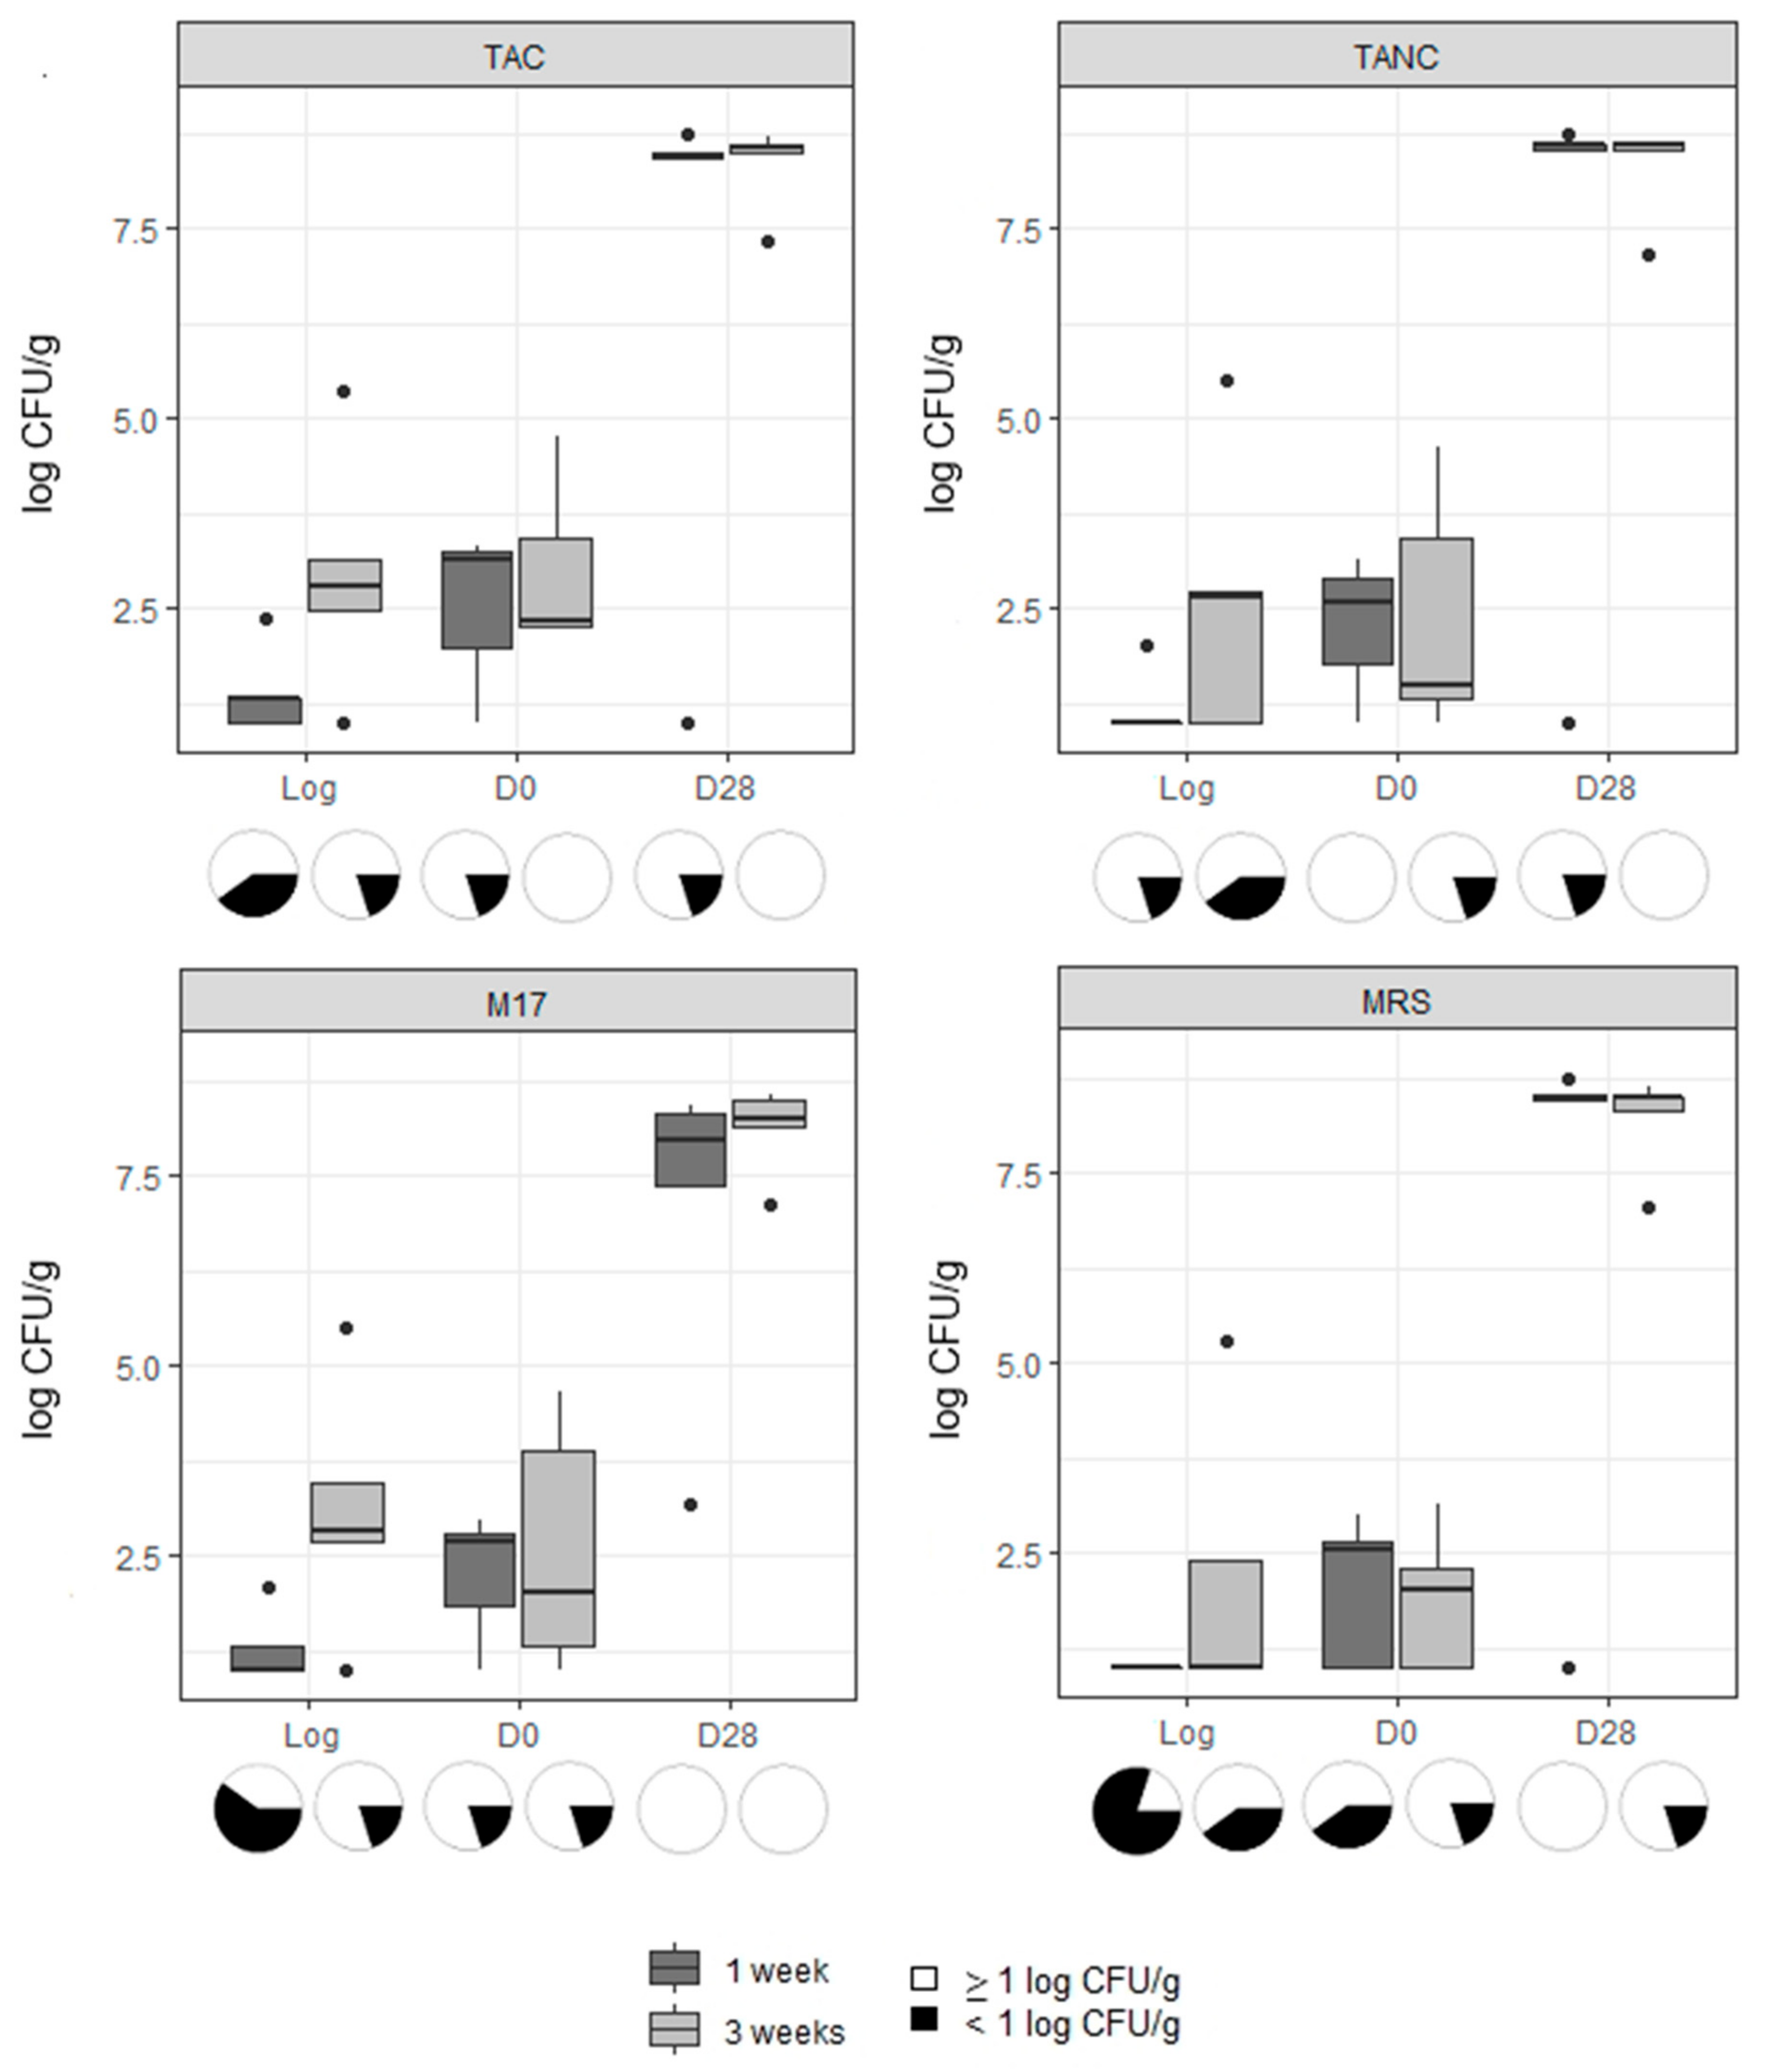
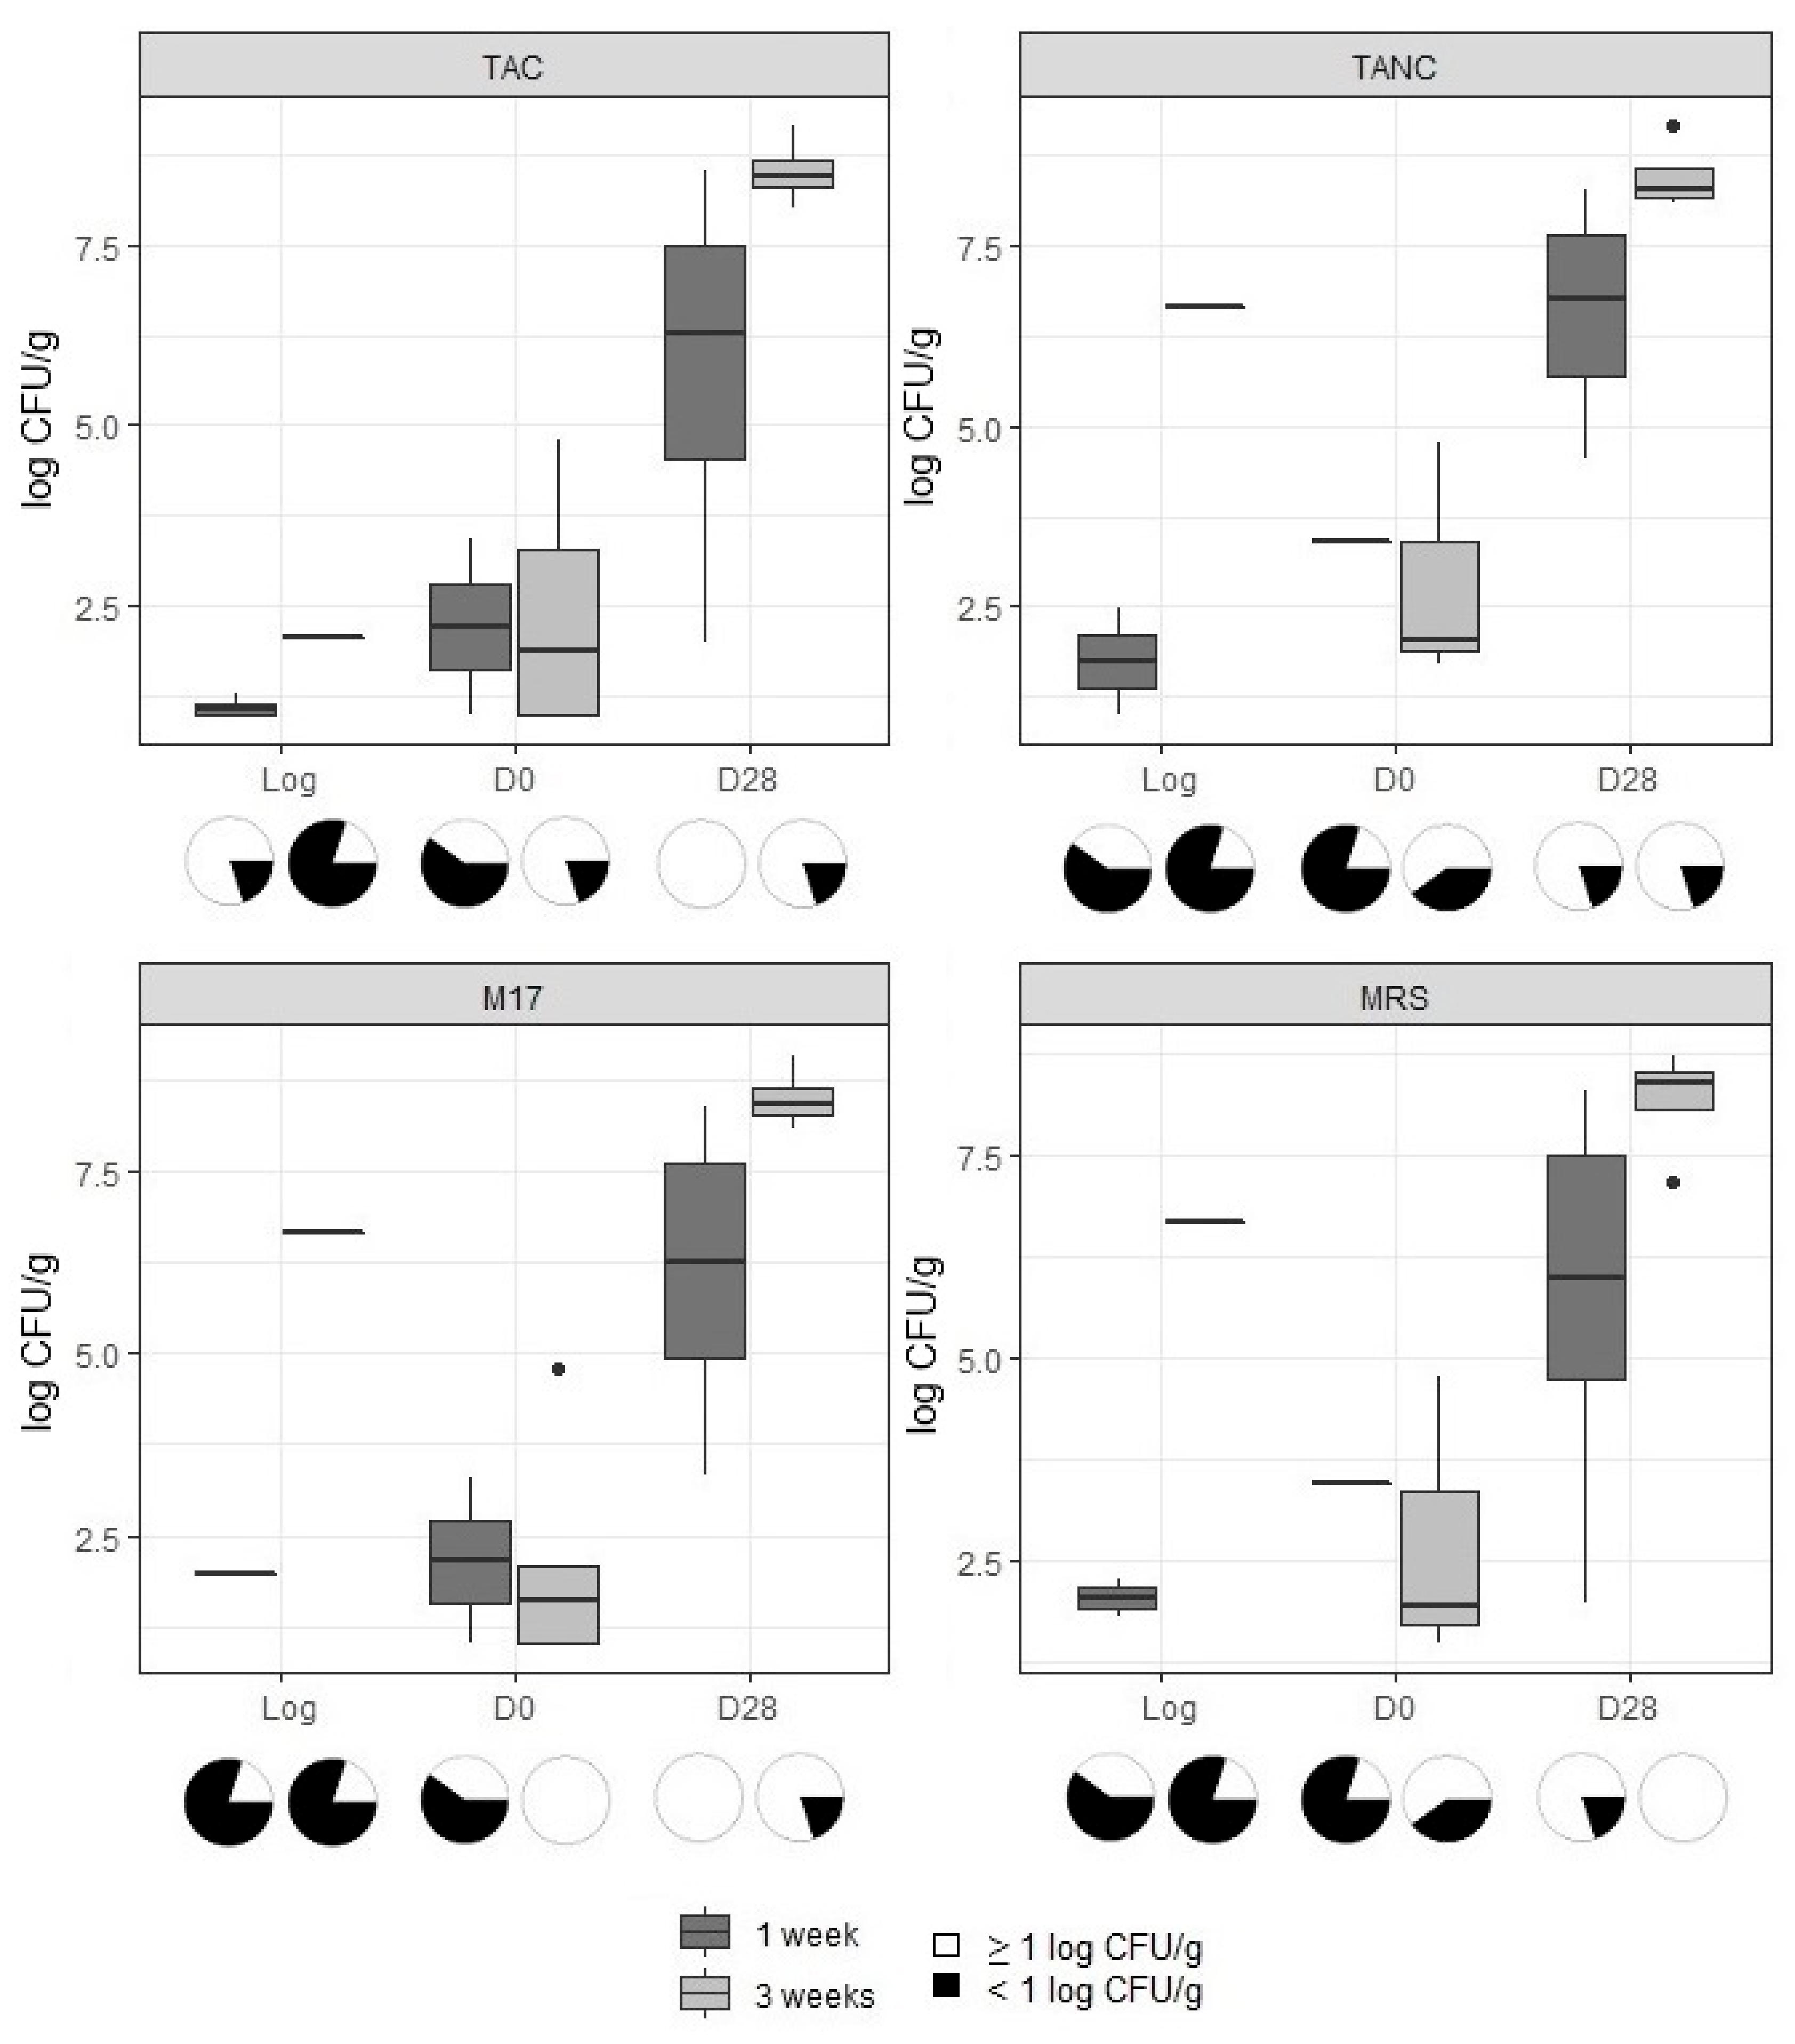
3.1. Microbiological Analysis
3.2. Identification
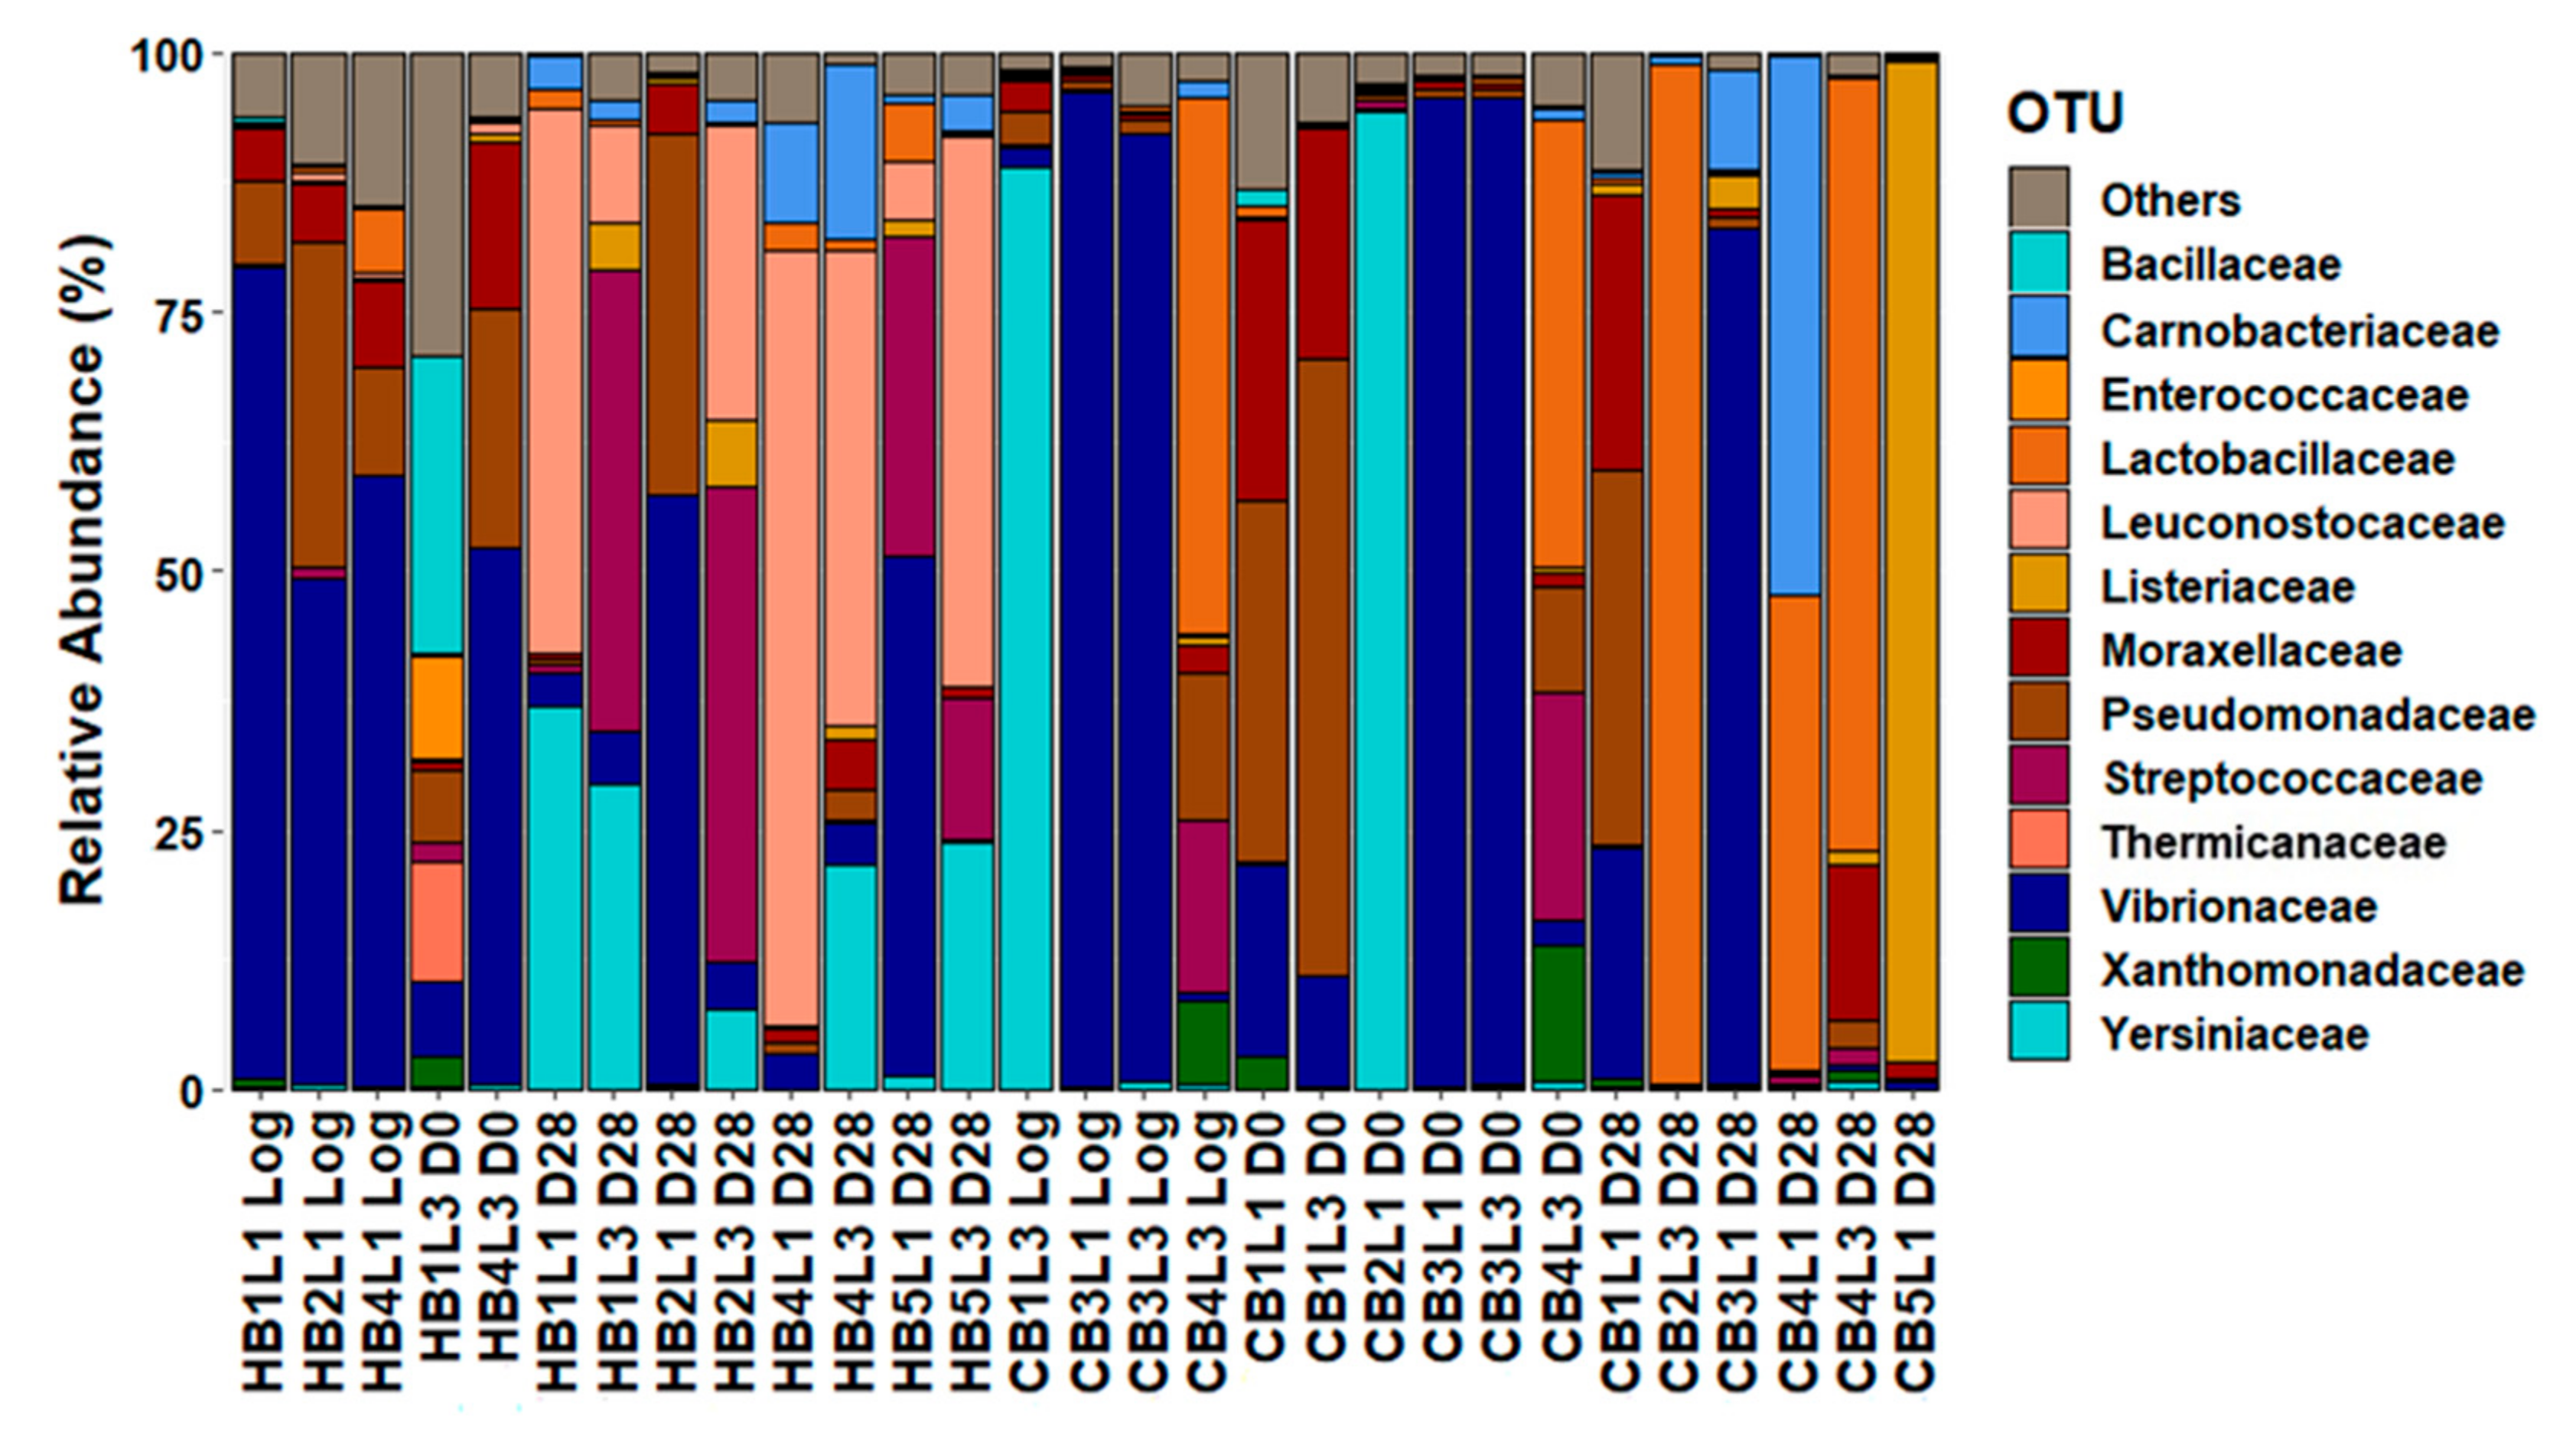
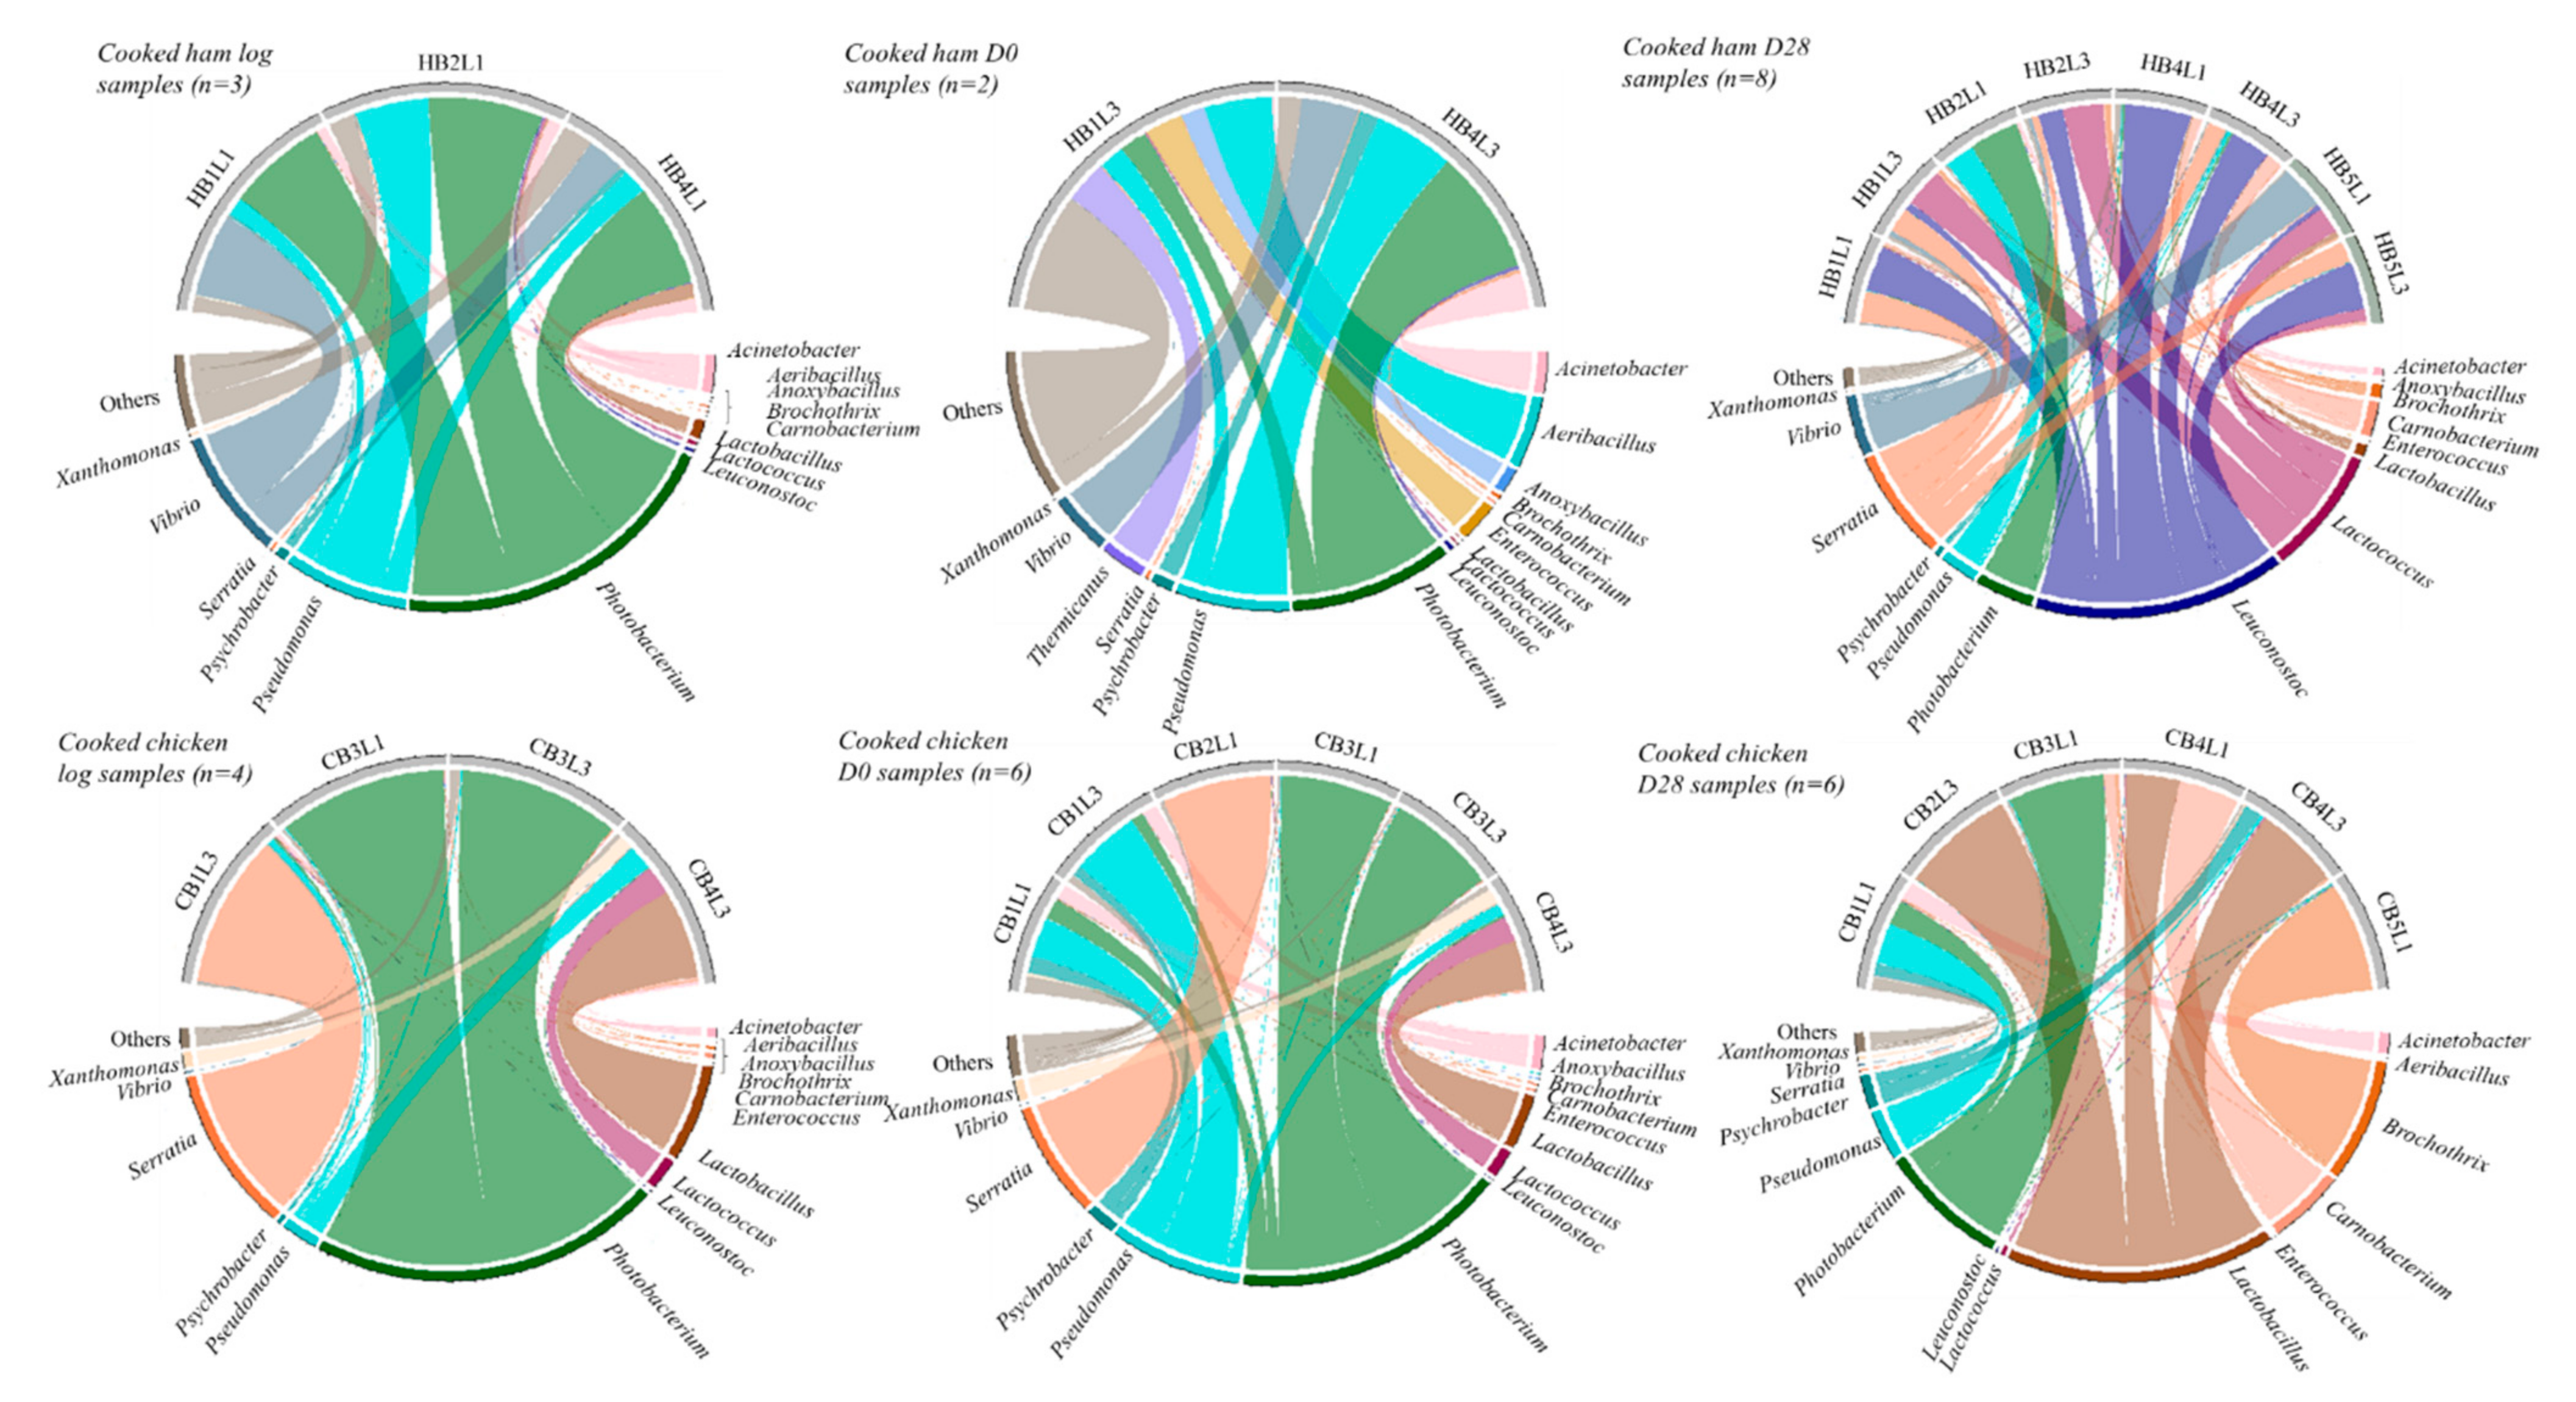
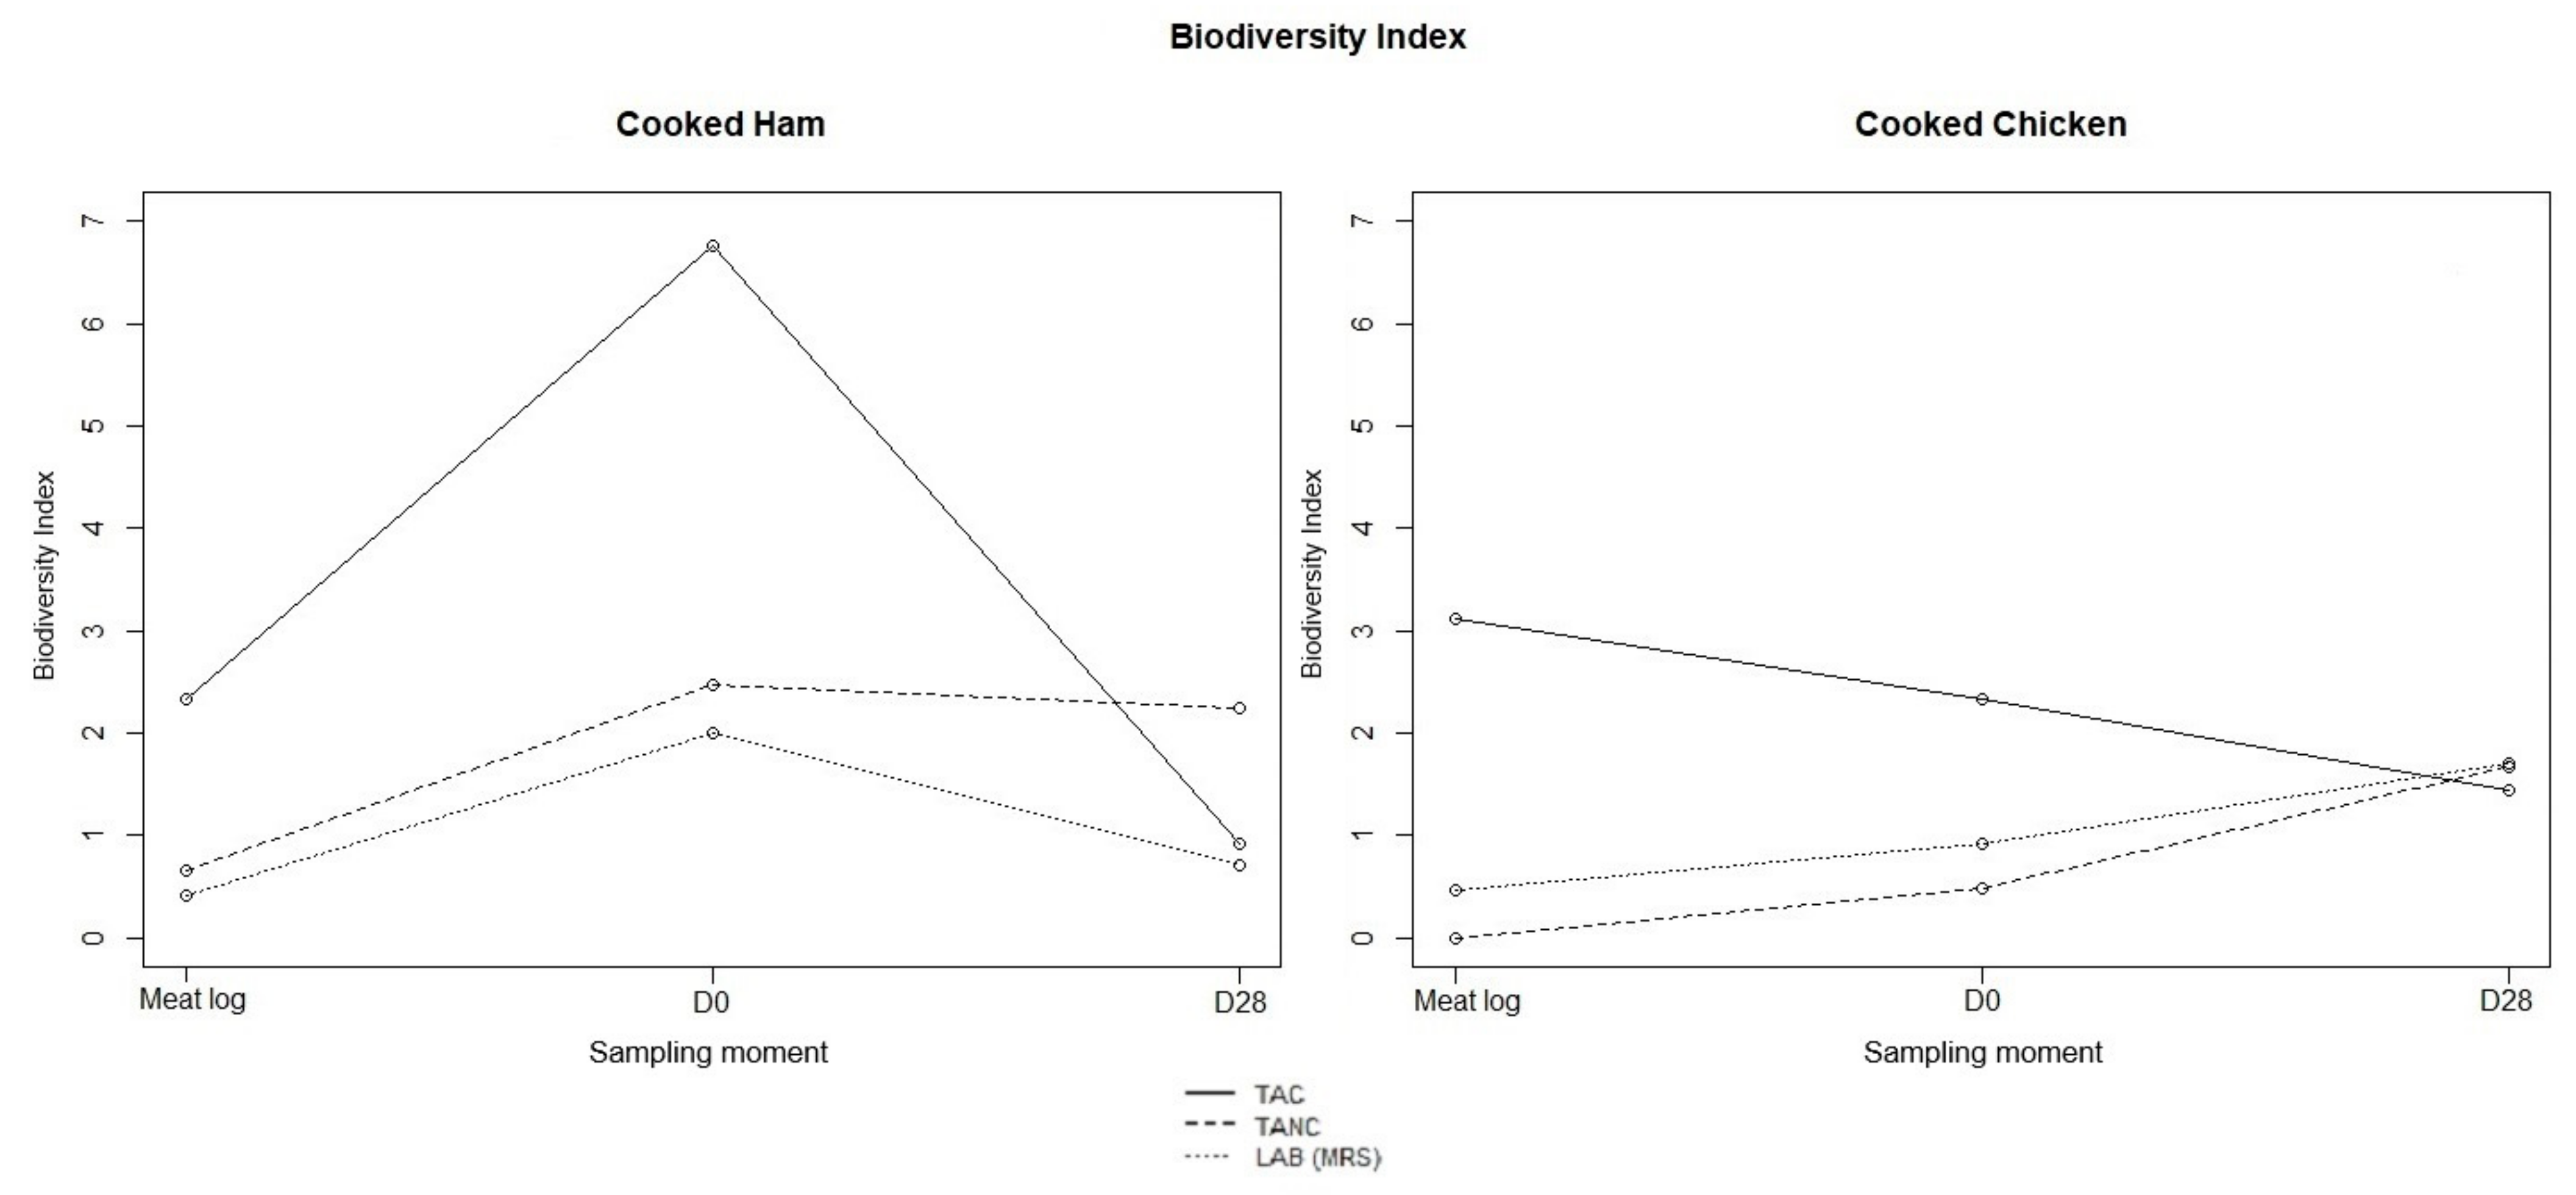
3.3. Metabarcoding
4. Discussion
Supplementary Materials
Author Contributions
Funding
Institutional Review Board Statement
Informed Consent Statement
Data Availability Statement
Acknowledgments
Conflicts of Interest
References
- United Nations Environment Programme. Food Waste Index Report; United Nations Environment Programme: Nairobi, Kenya, 2021. [Google Scholar]
- Gustavsson, J.; Cederberg, C.; Sonesson, U.; Van Otterdijk, R.; Meybeck, A. Global Food Losses and Food Waste—Extent, Causes and Prevention; Food and Agriculture Organization of the United Nations: Rome, Italy, 2011. [Google Scholar]
- Food and Agriculture Organization. Food Wastage Footprint; Food and Agriculture Organization of the United Nations: Rome, Italy, 2013; ISBN 978-92-5-107752-8. [Google Scholar]
- Pellissery, A.J.; Vinayamohan, P.G.; Amalaradjou, M.A.R.; Venkitanarayanan, K. Spoilage Bacteria and Meat Quality; Elsevier Inc.: Amsterdam, The Netherlands, 2019; ISBN 9780128192337. [Google Scholar]
- Audenaert, K.; D’Haene, K.; Messens, K.; Ruyssen, T.; Vandamme, P.; Huys, G. Diversity of lactic acid bacteria from modified atmosphere packaged sliced cooked meat products at sell-by date assessed by PCR-denaturing gradient gel electrophoresis. Food Microbiol. 2010, 27, 12–18. [Google Scholar] [CrossRef]
- Kreyenschmidt, J.; Hübner, A.; Beierle, E.; Chonsch, L.; Scherer, A.; Petersen, B. Determination of the shelf life of sliced cooked ham based on the growth of lactic acid bacteria in different steps of the chain. J. Appl. Microbiol. 2010, 108, 510–520. [Google Scholar] [CrossRef]
- Gänzle, M.G. Lactic metabolism revisited: Metabolism of lactic acid bacteria in food fermentations and food spoilage. Curr. Opin. Food Sci. 2015, 2, 106–117. [Google Scholar] [CrossRef]
- Björkroth, K.J.; Korkeala, H.J. Use of rRNA gene restriction patterns to evaluate lactic acid bacterium contamination of vacuum-packaged sliced cooked whole-meat product in a meat processing plant. Appl. Environ. Microbiol. 1997, 63, 448–453. [Google Scholar] [CrossRef] [PubMed] [Green Version]
- Borch, E.; Kant-Muermans, M.L.; Blixt, Y. Bacterial spoilage of meat and cured meat products. Int. J. Food Microbiol. 1996, 33, 103–120. [Google Scholar] [CrossRef]
- Comi, G.; Iacumin, L. Identification and process origin of bacteria responsible for cavities and volatile off-flavour compounds in artisan cooked ham. Int. J. Food Sci. Technol. 2012, 47, 114–121. [Google Scholar] [CrossRef]
- Vasilopoulos, C.; De Vuyst, L.; Leroy, F. Shelf-life reduction as an emerging problem in cooked hams underlines the need for improved preservation strategies. Crit. Rev. Food Sci. Nutr. 2015, 55, 1425–1443. [Google Scholar] [CrossRef]
- Samelis, J. Managing microbial spoilage in the meat industry. In Food Spoilage Microorganisms; Woodhead Publishing Limited: Sawston, UK, 2006; pp. 213–286. ISBN 9781855739666. [Google Scholar]
- Raimondi, S.; Luciani, R.; Sirangelo, T.M.; Amaretti, A.; Leonardi, A.; Ulrici, A.; Foca, G.; D’Auria, G.; Moya, A.; Zuliani, V.; et al. Microbiota of sliced cooked ham packaged in modified atmosphere throughout the shelf life: Microbiota of sliced cooked ham in MAP. Int. J. Food Microbiol. 2019, 289, 200–208. [Google Scholar] [CrossRef] [PubMed]
- Geeraerts, W.; Pothakos, V.; De Vuyst, L.; Leroy, F. Variability within the dominant microbiota of sliced cooked poultry products at expiration date in the Belgian retail. Food Microbiol. 2018, 73, 209–215. [Google Scholar] [CrossRef]
- Rodríguez-Pérez, M.R.; Zurera-Cosano, G.; García-Gimeno, R.M.; Barco-Alcalá, E.; Castdllejo-Rodríguez, A.M. Sensory and microbiological quality evaluation of vacuum-packed sliced cooked chicken breast. Shelf-life estimation. J. Food Qual. 2003, 26, 105–122. [Google Scholar] [CrossRef]
- Opara, U.L.; Caleb, O.J.; Belay, Z.A. Modified Atmosphere Packaging for Food Preservation; Elsevier Inc.: Amsterdam, The Netherlands, 2019; ISBN 9780128171905. [Google Scholar]
- Hauzoukim, S.S.; Biswajit, M. Modified Atmosphere Packaging of Fish and Fish Products. J. Entomol. Zool. Stud. 2020, 8, 651–659. [Google Scholar] [CrossRef]
- Cocolin, L.; Mataragas, M.; Bourdichon, F.; Doulgeraki, A.; Pilet, M.F.; Jagadeesan, B.; Rantsiou, K.; Phister, T. Next generation microbiological risk assessment meta-omics: The next need for integration. Int. J. Food Microbiol. 2018, 287, 10–17. [Google Scholar] [CrossRef]
- Jagadeesan, B.; Gerner-Smidt, P.; Allard, M.W.; Leuillet, S.; Winkler, A.; Xiao, Y.; Chaffron, S.; Van Der Vossen, J.; Tang, S.; Katase, M.; et al. The use of next generation sequencing for improving food safety: Translation into practice. Food Microbiol. 2019, 79, 96–115. [Google Scholar] [CrossRef]
- Rouger, A.; Moriceau, N.; Prévost, H.; Remenant, B.; Zagorec, M. Diversity of bacterial communities in French chicken cuts stored under modified atmosphere packaging. Food Microbiol. 2018, 70, 7–16. [Google Scholar] [CrossRef] [PubMed]
- Strandén, A.; Frei, R.; Widmer, A.F. Molecular typing of methicillin-resistant Staphylococcus aureus: Can PCR replace pulsed-field gel electrophoresis? J. Clin. Microbiol. 2003, 41, 3181–3186. [Google Scholar] [CrossRef] [Green Version]
- Rademaker, J.L.W.; Louws, F.J.; Versalovic, J.; De Bruijn, F.J. Characterization of the diversity of ecological important microbes by rep-PCR genomic fingerprinting. In Molecular Microbial Ecolog Manual, 2nd ed.; Kluwer Academic Publishers: Dordrecht, The Netherlands, 2004; pp. 1–33. [Google Scholar]
- Bandeira, B.; Jamet, J.L.; Jamet, D.; Ginoux, J.M. Mathematical convergences of biodiversity indices. Ecol. Indic. 2013, 29, 522–528. [Google Scholar] [CrossRef]
- Klindworth, A.; Pruesse, E.; Schweer, T.; Peplies, J.; Quast, C.; Horn, M.; Glöckner, F.O. Evaluation of general 16S ribosomal RNA gene PCR primers for classical and next-generation sequencing-based diversity studies. Nucleic Acids Res. 2013, 41, e1. [Google Scholar] [CrossRef] [PubMed]
- Morgan, M.; Anders, S.; Lawrence, M.; Aboyoun, P.; Pagès, H.; Gentleman, R. ShortRead: A bioconductor package for input, quality assessment and exploration of high-throughput sequence data. Bioinformatics 2009, 25, 2607–2608. [Google Scholar] [CrossRef] [Green Version]
- Callahan, B.J.; McMurdie, P.J.; Rosen, M.J.; Han, A.W.; Johnson, A.J.A.; Holmes, S.P. DADA2: High-resolution sample inference from Illumina amplicon data. Nat. Methods 2016, 13, 581–583. [Google Scholar] [CrossRef] [Green Version]
- Wang, Q.; Garrity, G.M.; Tiedje, J.M.; Cole, J.R. Naïve Bayesian Classifier for Rapid Assignment of rRNA Sequences into the New Bacterial Taxonomy. Appl. Environ. Microbiol. 2007, 73, 5261–5267. [Google Scholar] [CrossRef] [Green Version]
- McMurdie, P.J.; Holmes, S. Phyloseq: An R Package for Reproducible Interactive Analysis and Graphics of Microbiome Census Data. PLoS ONE 2013, 8, e0061217. [Google Scholar] [CrossRef] [Green Version]
- Yost, C.K.; Nattress, F.M. Molecular typing techniques to characterize the development of a lactic acid bacteria community on vacuum-packaged beef. Int. J. Food Microbiol. 2002, 72, 97–105. [Google Scholar] [CrossRef]
- Héquet, A.; Laffitte, V.; Brocail, E.; Aucher, W.; Cenatiempo, Y.; Frère, J.; Fremaux, C.; Berjeaud, J.M. Development of a new method for the detection of lactic acid bacteria capable of protecting ham against Enterobacteriaceae. Lett. Appl. Microbiol. 2009, 48, 668–674. [Google Scholar] [CrossRef]
- Björkroth, J.; Ridell, J.; Korkeala, H. Characterization of Lactobacillus sake strains associating with production of ropy slime by randomly amplified polymorphic DNA (RAPD) and pulsed-field gel electrophoresis (PFGE) patterns. Int. J. Food Microbiol. 1996, 31, 59–68. [Google Scholar] [CrossRef]
- Pothakos, V.; Devlieghere, F.; Villani, F.; Björkroth, J.; Ercolini, D. Lactic acid bacteria and their controversial role in fresh meat spoilage. Meat Sci. 2015, 109, 66–74. [Google Scholar] [CrossRef]
- Samelis, J.; Björkroth, J.; Kakouri, A.; Rementzis, J. Leuconostoc carnosum Associated with Spoilage of Refrigerated Whole Cooked Hams in Greece. J. Food Prot. 2016, 69, 2268–2273. [Google Scholar] [CrossRef]
- Dušková, M.; Kameník, J.; Lačanin, I.; Šedo, O.; Zdráhal, Z. Lactic acid bacteria in cooked hams—Sources of contamination and chances of survival in the product. Food Control 2016, 61, 1–5. [Google Scholar] [CrossRef]
- Andreevskaya, M.; Jääskeläinen, E.; Johansson, P.; Ylinen, A.; Paulin, L.; Björkroth, J.; Auvinen, P. Food Spoilage-Associated Leuconostoc, Lactococcus, and Lactobacillus Species Display Different Survival Strategies in Response to Competition. Appl. Environ. Microbiol. 2018, 84, 1–16. [Google Scholar] [CrossRef] [Green Version]
- Vasilopoulos, C.; De Mey, E.; Dewulf, L.; Paelinck, H.; De Smedt, A.; Vandendriessche, F.; De Vuyst, L.; Leroy, F. Interactions between bacterial isolates from modified-atmosphere-packaged artisan-type cooked ham in view of the development of a bioprotective culture. Food Microbiol. 2010, 27, 1086–1094. [Google Scholar] [CrossRef]
- Fall, P.A.; Leroi, F.; Cardinal, M.; Chevalier, F.; Pilet, M.F. Inhibition of Brochothrix thermosphacta and sensory improvement of tropical peeled cooked shrimp by Lactococcus piscium CNCM I-4031. Lett. Appl. Microbiol. 2010, 50, 357–361. [Google Scholar] [CrossRef] [PubMed] [Green Version]
- Casaburi, A.; Piombino, P.; Nychas, G.J.; Villani, F.; Ercolini, D. Bacterial populations and the volatilome associated to meat spoilage. Food Microbiol. 2015, 45, 83–102. [Google Scholar] [CrossRef] [PubMed]
- Laursen, B.G.; Bay, L.; Cleenwerck, I.; Vancanneyt, M.; Swings, J.; Dalgaard, P.; Leisner, J.J. Carnobacterium divergens and Carnobacterium maltaromaticum as spoilers or protective cultures in meat and seafood: Phenotypic and genotypic characterization. Syst. Appl. Microbiol. 2005, 28, 151–164. [Google Scholar] [CrossRef]
- Leisner, J.J.; Laursen, B.G.; Prévost, H.; Drider, D.; Dalgaard, P. Carnobacterium: Positive and negative effects in the environment and in foods. FEMS Microbiol. Rev. 2007, 31, 592–613. [Google Scholar] [CrossRef] [PubMed] [Green Version]
- Ben Braïek, O.; Smaoui, S. Enterococci: Between Emerging Pathogens and Potential Probiotics. BioMed Res. Int. 2019, 2019, 5938210. [Google Scholar] [CrossRef]
- Malinowska-Pańczyk, E.; Królik, K.; Skorupska, K.; Puta, M.; Martysiak-Żurowska, D.; Kiełbratowska, B. Microwave heat treatment application to pasteurization of human milk. Innov. Food Sci. Emerg. Technol. 2019, 52, 42–48. [Google Scholar] [CrossRef]
- Vasilopoulos, C.; Ravyts, F.; De Maere, H.; De Mey, E.; Paelinck, H.; De Vuyst, L.; Leroy, F. Evaluation of the spoilage lactic acid bacteria in modified-atmosphere- packaged artisan-type cooked ham using culture-dependent and culture-independent approaches. J. Appl. Microbiol. 2008, 104, 1341–1353. [Google Scholar] [CrossRef]
- Petruzzi, L.; Corbo, M.R.; Sinigaglia, M.; Bevilacqua, A. Microbial Spoilage of Foods: Fundamentals; Elsevier Ltd.: Amsterdam, The Netherlands, 2017; ISBN 9780081005033. [Google Scholar]
- Lages, M.A.; Balado, M.; Lemos, M.L. The expression of virulence factors in vibrio anguillarum is dually regulated by iron levels and temperature. Front. Microbiol. 2019, 10, 1–11. [Google Scholar] [CrossRef] [Green Version]
- Pennacchia, C.; Ercolini, D.; Villani, F. Spoilage-related microbiota associated with chilled beef stored in air or vacuum pack. Food Microbiol. 2011, 28, 84–93. [Google Scholar] [CrossRef]
- Delhalle, L.; Korsak, N.; Taminiau, B.; Nezer, C.; Burteau, S.; Delcenserie, V.; Poullet, J.B.; Daube, G. Exploring the Bacterial Diversity of Belgian Steak Tartare Using Metagenetics and Quantitative Real-Time PCR Analysis. J. Food Prot. 2016, 79, 220–229. [Google Scholar] [CrossRef]
- Stoops, J.; Ruyters, S.; Busschaert, P.; Spaepen, R.; Verreth, C.; Claes, J.; Lievens, B.; Van Campenhout, L. Bacterial community dynamics during cold storage of minced meat packaged under modified atmosphere and supplemented with different preservatives. Food Microbiol. 2015, 48, 192–199. [Google Scholar] [CrossRef]
- Hilgarth, M.; Fuertes, S.; Ehrmann, M.; Vogel, R.F. Photobacterium carnosum sp. nov., isolated from spoiled modified atmosphere packaged poultry meat. Syst. Appl. Microbiol. 2018, 41, 44–50. [Google Scholar] [CrossRef] [PubMed]
- Nieminen, T.T.; Dalgaard, P.; Björkroth, J. Volatile organic compounds and Photobacterium phosphoreum associated with spoilage of modified-atmosphere-packaged raw pork. Int. J. Food Microbiol. 2016, 218, 86–95. [Google Scholar] [CrossRef] [PubMed] [Green Version]
- Labella, A.M.; Arahal, D.R.; Castro, D.; Lemos, M.L.; Borrego, J.J. Revisiting the genus Photobacterium: Taxonomy, ecology and pathogenesis. Int. Microbiol. 2017, 20, 1–10. [Google Scholar] [CrossRef] [PubMed]
- Betts, G. Other Spoilage Bacteria; Woodhead Publishing Limited: Sawston, UK, 2006; ISBN 9781855739666. [Google Scholar]
- Fuertes-Perez, S.; Hauschild, P.; Hilgarth, M.; Vogel, R.F. Biodiversity of Photobacterium spp. Isolated From Meats. Front. Microbiol. 2019, 10, 1–13. [Google Scholar] [CrossRef] [PubMed]
- Höll, L.; Hilgarth, M.; Geissler, A.J.; Behr, J.; Vogel, R.F. Prediction of in situ metabolism of photobacteria in modified atmosphere packaged poultry meat using metatranscriptomic data. Microbiol. Res. 2019, 222, 52–59. [Google Scholar] [CrossRef]


| OGYE | TSC | VRBG | MYP | STAA | Slanetz & Bartley | |||||||||
|---|---|---|---|---|---|---|---|---|---|---|---|---|---|---|
| pH | aw | Countable (%) | Mean ± SD | Countable (%) | Mean ± SD | Countable (%) | Mean ± SD | Countable (%) | Mean ± SD | Countable (%) | Mean ± SD | Countable (%) | Mean ± SD | |
| Cooked ham | ||||||||||||||
| 1 week | ||||||||||||||
| Log | 6.18 ± 0.09 | 0.9752 ± 0.0028 | 2 (40) | 1.0 ± 0.0 | 0 (0) | na | 0 (0) | na | 0 (0) | na | 0 (0) | na | 0 (0) | na |
| D0 | 6.11 ± 0.16 | 0.9759 ± 0.0037 | 2 (40) | 1.3 ± 0.5 | 0 (0) | na | 0 (0) | na | 0 (0) | na | 1 (20) | 1.9 | 0 (0) | na |
| D28 | 5.73 ± 0.18 | 0.9738 ± 0.0042 | 2 (40) | 2.0 ± 0.1 | 0 (0) | na | 3 (60) | 4.4 ± 1.1 | 0 (0) | na | 2 (40) | 4.2 ± 1.7 | 2 (40) | 5.5 ± 0.1 |
| 3 weeks | ||||||||||||||
| Log | 6.17 ± 0.16 | 0.9755 ± 0.0017 | 1 (20) | 1.0 | 1 (20) | 2.0 | 0 (0) | na | 1 (20) | 1.0 | 0 (0) | na | 0 (0) | na |
| D0 | 6.23 ± 0.15 | 0.9756 ± 0.0033 | 2 (40) | 1.0 ± 0.0 | 0 (0) | na | 0 (0) | na | 0 (0) | na | 0 (0) | na | 1 (20) | 1.3 |
| D28 | 5.74 ± 0.10 | 0.9742 ± 0.0026 | 4 (80) | 2.4 ± 1.1 | 0 (0) | na | 4 (80) | 3.9 ± 0.7 | 0 (0) | na | 3 (60) | 4.1 ± 2.1 | 3 (60) | 5.7 ± 0.3 |
| Cooked chicken | ||||||||||||||
| 1 week | ||||||||||||||
| Log | 6.04 ± 0.25 | 0.9727 ± 0.0019 | 0 (0) | Na a | 1 (20) | 1.0 | 0 (0) | na | 0 (0) | na | 0 (0) | na | 0 (0) | na |
| D0 | 6.08 ± 0.08 | 0.9735 ± 0.0021 | 0 (0) | na | 0 (0) | na | 0 (0) | na | 0 (0) | na | 0 (0) | na | 0 (0) | na |
| D28 | 6.04 ± 0.39 | 0.9729 ± 0.0042 | 2 (40) | 1.6 ± 0.5 | 0 (0) | na | 0 (0) | na | 0 (0) | na | 2 (40) | 6.2 ± 1.4 | 0 (0) | na |
| 3 weeks | ||||||||||||||
| Log | 6.21 ± 0.11 | 0.9730 ± 0.0028 | 2 (40) | 1.5 ± 0.7 | 0 (0) | na | 0 (0) | na | 0 (0) | na | 0 (0) | na | 0 (0) | na |
| D0 | 6.18 ± 0.16 | 0.9719 ± 0.0015 | 0 (0) | na | 0 (0) | na | 0 (0) | na | 0 (0) | na | 0 (0) | na | 0 (0) | na |
| D28 | 5.90 ± 0.40 | 0.9711 ± 0.0043 | 2 (40) | 3.3 ± 2.3 | 0 (0) | na | 0 (0) | na | 1 (20) | 1.0 | 1 (20) | 8.1 | 0 (0) | na |
| Presumptive Species | Isolates from Cooked Ham (n = 425) | ||||||||
|---|---|---|---|---|---|---|---|---|---|
| Log (n = 64) | D0 (n = 125) | D28 (n = 236) | |||||||
| PCA (%) n = 31 | RCA (%) n = 21 | MRS (%) n = 12 | PCA (%) n = 54 | RCA (%) n = 38 | MRS (%) n = 33 | PCA (%) n = 78 | RCA (%) n = 86 | MRS (%) n = 72 | |
| Gram positive (n = 381) | |||||||||
| Arthrobacter glacialis | 0 | 0 | 0 | 1 (2) | 0 | 0 | 0 | 0 | 0 |
| Arthrobacter psychrochitiniphilus | 1 (3) | 0 | 0 | 0 | 0 | 0 | 0 | 0 | 0 |
| Brochothrix thermosphacta | 15 (48 [31–66]) | 15 (68 [49–88]) | 6 (50 [22–78]) | 9 (17 [9–27]) | 19 (50 [34–66]) | 7 (21 [7–35]) | 0 | 0 | 0 |
| Carnobacterium divergens | 0 | 0 | 0 | 0 | 2 (5) | 1 (3) | 1 (1) | 3 (4) | 0 |
| Carnobacterium maltaromaticum | 1 (3) | 0 | 0 | 0 | 2 (5) | 1 (3) | 8 (10 [4–17]) | 5 (6 [1–11]) | 0 |
| Corynebacterium testudinoris | 0 | 0 | 0 | 2 (4) | 0 | 0 | 0 | 0 | 0 |
| Enterococcus devriesei | 0 | 2 (11 [0–24]) | 0 | 0 | 1 (3) | 0 | 0 | 0 | 0 |
| Enterococcus gilvus | 2 (7) | 0 | 6 (50 [22–78]) | 0 | 0 | 0 | 0 | 2 (2) | 0 |
| Enterococcus malodoratus | 0 | 0 | 0 | 0 | 0 | 1 (3) | 0 | 0 | 1 (1) |
| Latilactobacillus fuchuensis | 0 | 0 | 0 | 0 | 0 | 1 (3) | 0 | 1 (1) | 0 |
| Latilactobacillus sakei | 0 | 0 | 0 | 0 | 0 | 0 | 0 | 2 (2) | 0 |
| Lactococcus piscium | 0 | 0 | 0 | 2 (4) | 3 (8 [0–17]) | 2 (6 [0–14]) | 9 (12 [4–19]) | 6 (7 [2–12]) | 3 (4 [0–9]) |
| Leucobacter aridicollis | 1 (3) | 0 | 0 | 0 | 0 | 0 | 0 | 0 | 0 |
| Leucobacter spp. | 2 (6) | 0 | 0 | 0 | 0 | 0 | 0 | 0 | 0 |
| Leucobacter luti | 0 | 0 | 0 | 1 (2) | 0 | 0 | 0 | 0 | 0 |
| Leuconostoc carnosum | 0 | 0 | 0 | 4 (7 [0–14]) | 5 (13 [2–24]) | 19 (58 [41–74]) | 59 (76 [66–85]) | 61 (71 [61–81]) | 67 (93 [87–99]) |
| Leuconostoc gelidum | 0 | 0 | 0 | 0 | 0 | 1 (3) | 0 | 4 (5) | 1 (1) |
| Luteococcus japonicas | 0 | 0 | 0 | 0 | 2 (5) | 0 | 0 | 0 | 0 |
| Microbacterium oxydans | 0 | 0 | 0 | 1 (2) | 0 | 0 | 0 | 0 | 0 |
| Paeniglutamicibacter antarcticus | 0 | 0 | 0 | 1 (2) | 0 | 0 | 0 | 0 | 0 |
| Staphylococcus saprophyticus | 0 | 0 | 0 | 2 (4) | 0 | 0 | 0 | 0 | 0 |
| Streptococcus parauberis | 0 | 0 | 0 | 1 (2) | 1 (3) | 0 | 0 | 0 | 0 |
| Vagococcus fluvialis | 0 | 0 | 0 | 0 | 0 | 0 | 1 (1) | 1 (1) | 0 |
| Vagococcus salmoninarum | 0 | 0 | 0 | 0 | 1 (3) | 0 | 0 | 0 | 0 |
| Vagococcus spp. | 0 | 0 | 0 | 0 | 0 | 0 | 0 | 1 (1) | 0 |
| Gram negative (n = 44) | |||||||||
| Brevundimonas intermedia | 0 | 0 | 0 | 1 (2) | 0 | 0 | 0 | 0 | 0 |
| Comamonas koreensis | 0 | 0 | 0 | 1 (2) | 0 | 0 | 0 | 0 | 0 |
| Flavobacterium ardleyense | 0 | 0 | 0 | 3 (6) | 0 | 0 | 0 | 0 | 0 |
| Limnohabitans planktonicus | 0 | 0 | 0 | 1 (2) | 0 | 0 | 0 | 0 | 0 |
| Paracoccus aminophilus | 0 | 0 | 0 | 1 (2) | 0 | 0 | 0 | 0 | 0 |
| Proteus terrae | 0 | 0 | 0 | 2 (4) | 0 | 0 | 0 | 0 | 0 |
| Pseudochrobactrum spp. | 0 | 0 | 0 | 1 (2) | 0 | 0 | 0 | 0 | 0 |
| Pseudomonas canadensis | 0 | 0 | 0 | 2 (4) | 0 | 0 | 0 | 0 | 0 |
| Pseudomonas gessardii | 0 | 0 | 0 | 2 (2) | 0 | 0 | 0 | 0 | 0 |
| Pseudomonas lactis | 0 | 0 | 0 | 1 (2) | 0 | 0 | 0 | 0 | 0 |
| Pseudomonas psychrophila | 0 | 0 | 0 | 1 (2) | 0 | 0 | 0 | 0 | 0 |
| Pseudomonas mandelii | 3 (10 [0–20]) | 0 | 0 | 0 | 0 | 0 | 0 | 0 | 0 |
| Pseudomonas thivervalensis | 1 (3) | 0 | 0 | 0 | 0 | 0 | 0 | 0 | 0 |
| Psychrobacter faecalis | 0 | 0 | 0 | 1 (2) | 0 | 0 | 0 | 0 | 0 |
| Psychrobacter maritimus | 0 | 0 | 0 | 8 (15 [5–24]) | 0 | 0 | 0 | 0 | 0 |
| Psychrobacter pulmonis | 0 | 0 | 0 | 1 (2) | 0 | 0 | 0 | 0 | 0 |
| Rhizobium radiobacter | 0 | 0 | 0 | 1 (12) | 0 | 0 | 0 | 0 | 0 |
| Serratia myotis | 5 (16 [3–29]) | 4 (21 [4–39]) | 0 | 0 | 2 (5) | 0 | 0 | 0 | 0 |
| Shewanella putrefaciens | 0 | 0 | 0 | 1 (2) | 0 | 0 | 0 | 0 | 0 |
| Sphingobacterium anhuiense | 0 | 0 | 0 | 1 (2) | 0 | 0 | 0 | 0 | 0 |
| Sphingobacterium faecium | 0 | 0 | 0 | 1 (2) | 0 | 0 | 0 | 0 | 0 |
| Presumptive Species | Isolates from Cooked Chicken (n = 258) | ||||||||
|---|---|---|---|---|---|---|---|---|---|
| Log (n = 30) | D0 (n = 36) | D28 (n = 192) | |||||||
| PCA (%) n = 13 | RCA (%) n = 8 | MRS (%) n = 9 | PCA (%) n = 19 | RCA (%) n = 8 | MRS (%) n = 9 | PCA (%) n = 64 | RCA (%) n = 66 | MRS (%) n = 62 | |
| Gram positive (n = 247) | |||||||||
| Bacillus licheniformis | 1 (8) | 0 | 0 | 0 | 0 | 0 | 0 | 0 | 0 |
| Brochothrix thermosphacta | 0 | 0 | 0 | 0 | 0 | 0 | 14 (22 [12–32]) | 16 (24 [14–35]) | 6 (10 [2–17]) |
| Carnobacterium divergens | 0 | 0 | 0 | 0 | 0 | 1 (11) | 15 (23 [13–34]) | 8 (12 [7–24]) | 15 (24 [14–35]) |
| Carnobacterium inhibens | 4 (31 [6–56]) | 0 | 2 (22 [0–49]) | 5 (26 [7–46]) | 0 | 1 (11) | 0 | 0 | 0 |
| Carnobacterium maltaromaticum | 0 | 0 | 0 | 0 | 2 (25 [0–55]) | 0 | 4 (6) | 10 (15) | 3 (5) |
| Enterococcus malodoratus | 0 | 0 | 0 | 0 | 0 | 0 | 0 | 0 | 1 (2) |
| Enterococcus viikkiensis | 0 | 0 | 0 | 0 | 0 | 0 | 1 (2) | 0 | 0 |
| Kocuria rhizophila | 0 | 0 | 0 | 1 (5) | 0 | 0 | 0 | 0 | 0 |
| Latilactobacillus sakei | 2 (13 [0–35]) | 8 (100 [100]) | 7 (78 [51–100]) | 7 (37 [15–59]) | 6 (75 [45–100]) | 7 (78 [51–100]) | 24 (38 [26–49]) | 27 (41 [28–51]) | 30 (48 [36–61]) |
| Leuconostoc carnosum | 0 | 0 | 0 | 0 | 0 | 0 | 1 (2) | 1 (2) | 1 (2) |
| Micrococcus caseolyticus | 1 (8) | 0 | 0 | 0 | 0 | 0 | 0 | 0 | 0 |
| Staphylococcus spp. | 0 | 0 | 0 | 1 (5) | 0 | 0 | 0 | 0 | 0 |
| Staphylococcus sciuri | 0 | 0 | 0 | 1 (5) | 0 | 0 | 0 | 0 | 0 |
| Vagococcus spp. | 0 | 0 | 0 | 0 | 0 | 0 | 0 | 0 | 1 (2) |
| Vagococcus silagei | 0 | 0 | 0 | 0 | 0 | 0 | 5 (8) | 2 (3) | 5 (8) |
| Gram negative (n = 11) | |||||||||
| Acinetobacter albensis | 0 | 0 | 0 | 2 (11 [0–24]) | 0 | 0 | 0 | 0 | 0 |
| Comamonas spp. | 0 | 0 | 0 | 1 (5) | 0 | 0 | 0 | 0 | 0 |
| Pseudomonas migulae | 1 (8) | 0 | 0 | 0 | 0 | 0 | 0 | 0 | 0 |
| Pseudomonas weihenstephanensis | 1 (8) | 0 | 0 | 0 | 0 | 0 | 0 | 0 | 0 |
| Psychrobacter maritimus | 0 | 0 | 0 | 1 (5) | 0 | 0 | 0 | 0 | 0 |
| Ralstonia mannitolilytica | 1 (8) | 0 | 0 | 0 | 0 | 0 | 0 | 0 | 0 |
| Serratia proteamaculans | 0 | 0 | 0 | 0 | 0 | 0 | 0 | 2 (3) | 0 |
| Sphingobacterium cladoniae | 1 (8) | 0 | 0 | 0 | 0 | 0 | 0 | 0 | 0 |
| Sphingobacterium pakistanense | 1 (8) | 0 | 0 | 0 | 0 | 0 | 0 | 0 | 0 |
Publisher’s Note: MDPI stays neutral with regard to jurisdictional claims in published maps and institutional affiliations. |
© 2021 by the authors. Licensee MDPI, Basel, Switzerland. This article is an open access article distributed under the terms and conditions of the Creative Commons Attribution (CC BY) license (https://creativecommons.org/licenses/by/4.0/).
Share and Cite
Duthoo, E.; Rasschaert, G.; Leroy, F.; Weckx, S.; Heyndrickx, M.; De Reu, K. The Microbiota of Modified-Atmosphere-Packaged Cooked Charcuterie Products throughout Their Shelf-Life Period, as Revealed by a Complementary Combination of Culture-Dependent and Culture-Independent Analysis. Microorganisms 2021, 9, 1223. https://doi.org/10.3390/microorganisms9061223
Duthoo E, Rasschaert G, Leroy F, Weckx S, Heyndrickx M, De Reu K. The Microbiota of Modified-Atmosphere-Packaged Cooked Charcuterie Products throughout Their Shelf-Life Period, as Revealed by a Complementary Combination of Culture-Dependent and Culture-Independent Analysis. Microorganisms. 2021; 9(6):1223. https://doi.org/10.3390/microorganisms9061223
Chicago/Turabian StyleDuthoo, Evelyne, Geertrui Rasschaert, Frédéric Leroy, Stefan Weckx, Marc Heyndrickx, and Koen De Reu. 2021. "The Microbiota of Modified-Atmosphere-Packaged Cooked Charcuterie Products throughout Their Shelf-Life Period, as Revealed by a Complementary Combination of Culture-Dependent and Culture-Independent Analysis" Microorganisms 9, no. 6: 1223. https://doi.org/10.3390/microorganisms9061223