
A Thermoacoustic Model for High Aspect Ratio Nanostructures


Abstract
:
1. Introduction
2. Analytical Model
3. Thermoacoustic Finite Element Model (FEM)
4. Results
5. Discussion and Conclusions
Acknowledgments
Author Contributions
Conflicts of Interest
Appendix A. Nomenclature
| Angular natural frequency of nanoresonator at different modes | |
| Density of nanoresonator | |
| Cross-section of nanoresonator | |
| Pressure | |
| Molecular weight | |
| Temperature | |
| Universal gas constant | |
| Effective area for damping per unit length | |
| The constant coefficient of natural frequency for different modes | |
| Elastic modulus of nanoresonator | |
| Length of nanoresonator | |
| Width of nanoresonator | |
| Height of nanoresonator | |
| Planar second moment of nanoresonator area | |
| Special coordinates of nanoresonator | |
| Lateral displacement of vibrating nanoresonator in time domain | |
| Time | |
| Deflection of nanoresonator in special coordinates | |
| Base excitement of nanoresonator | |
| Actuating angular frequency | |
| Amplitude of base excitation | |
| , , , , , | Constant |
| Eigenvalue | |
| Reaction moment at clamp end of nanoresonator | |
| Stress | |
| Diameter of nanowire | |
| Elastic strain energy |
References
- Jensen, K.; Peng, H.B.; Zettl, A. Limits of nanomechanical resonators. In Proceedings of the IEEE International Conference on Nanoscience and Nanotechnology, Brisbane, Australia, 3–7 July 2006.
- Erbe, A.; Blick, R.H. Nanomechanical resonators operating at radio frequencies. Phys. B Condens. Matter 1999, 272, 575–577. [Google Scholar] [CrossRef]
- Kiracofe, D.R.; Yazdanpanah, M.M.; Raman, A. Mass and stiffness calibration of nanowires using thermally driven vibration. Nanotechnology 2011, 22, 1–5. [Google Scholar] [CrossRef] [PubMed]
- Mohanty, P.; Harrington, D.A.; Ekinci, K.L.; Yang, Y.T.; Murphy, M.J.; Roukes, M.L. Intrinsic dissipation in high-frequency micromechanical resonators. Phys. Rev. B 2002, 66, 1–15. [Google Scholar] [CrossRef]
- Bhiladvala, R.B.; Wang, Z.J. Effect of fluids on the Q factor and resonance frequency of oscillating micrometer and nanometer scale beams. Phys. Rev. E 2004, 69, 1–5. [Google Scholar] [CrossRef] [PubMed]
- Yazdanpanah, M.M.; Hosseini, M.; Pabba, S.; Berry, S.M.; Dobrokhotov, V.V.; Safir, A.; Keynton, R.S.; Cohn, R.W. Micro-Wilhelmy and related liquid property measurements using constant-diameter nanoneedle-tipped atomic force microscope probes. Langmuir 2008, 24, 13753–13764. [Google Scholar] [CrossRef] [PubMed]
- Jalilian, R.; Rivera, J.; Askari, D.; Arva, S.; Rathfon, J.M.; Cohn, R.W.; Yazdanpanah, M.M. Toward wafer-scale patterning of freestanding intermetallic nanowires. Nanotechnology 2011, 22, 1–6. [Google Scholar] [CrossRef] [PubMed]
- Biedermann, L.B. Vibrational Spectra of Nanowires Measured Using Laser Doppler Vibrometry and STM Studies of Epitaxial Graphene: An LDRD Fellowship Report; Sandia National Laboratories: Livermore, CA, USA, 2009. [Google Scholar]
- Fischer, L.M.; Wright, V.A.; Guthy, C.; Yang, N.; McDermott, M.T.; Buriak, J.M.; Evoy, S. Specific detection of proteins using nanomechanical resonators. Sens. Actuators B Chem. 2008, 134, 613–617. [Google Scholar] [CrossRef]
- Arcamone, J.; Rius, G.; Abadal, G.; Teva, J.; Barniol, N.; Perez-Murano, F. Micro/nanomechanical resonators for distributed mass sensing with capacitive detection. Microelectron. Eng. 2006, 83, 1216–1220. [Google Scholar] [CrossRef]
- Blick, R.H.; Erbe, A.; Krommer, H.; Kraus, A.; Kotthaus, J.P. Charge detection with nanomechanical resonators. Phys. E Low Dimens. Syst. Nanostruct. 2000, 6, 821–827. [Google Scholar] [CrossRef]
- Hutchinson, A.B.; Truitt, P.A.; Schwab, K.C.; Sekaric, L.; Parpia, J.M.; Craighead, H.G.; Butler, J.E. Dissipation in nanocrystalline-diamond nanomechanical resonators. Appl. Phys. Lett. 2004, 84, 972–974. [Google Scholar] [CrossRef]
- Eom, K.; Kwon, T.Y.; Yoon, D.S.; Lee, H.L.; Kim, T.S. Dynamical response of nanomechanical resonators to biomolecular interactions. Phys. Rev. B 2007, 76, 1–4. [Google Scholar] [CrossRef]
- Wilson, N.R.; Macpherson, J.V. Carbon nanotube tips for atomic force microscopy. Nat. Nanotechnol. 2009, 4, 483–491. [Google Scholar] [CrossRef] [PubMed]
- Ye, Q.; Cassell, A.M.; Liu, H.B.; Chao, K.J.; Han, J.; Meyyappan, M. Large-scale fabrication of carbon nanotube probe tips for atomic force microscopy critical dimension Imaging applications. Nano Lett. 2004, 4, 1301–1308. [Google Scholar] [CrossRef]
- Yenilmez, E.; Wang, Q.; Chen, R.J.; Wang, D.W.; Dai, H.J. Wafer scale production of carbon nanotube scanning probe tips for atomic force microscopy. Appl. Phys. Lett. 2002, 80, 2225–2227. [Google Scholar] [CrossRef]
- Jalilian, R.; Jauregui, L.A.; Lopez, G.; Tian, J.F.; Roecker, C.; Yazdanpanah, M.M.; Cohn, R.W.; Jovanovic, I.; Chen, Y.P. Scanning gate microscopy on graphene: Charge inhomogeneity and extrinsic doping. Nanotechnology 2011, 22, 1–9. [Google Scholar] [CrossRef] [PubMed]
- Parot, P.; Dufrene, Y.F.; Hinterdorfer, P.; le Grimellee, C.; Navajas, D.; Pellequer, J.L.; Scheuring, S. Past, present and future of atomic force microscopy in life sciences and medicine. J. Mol. Recognit. 2007, 20, 418–431. [Google Scholar] [CrossRef] [PubMed]
- Jalili, N.; Laxminarayana, K. A review of atomic force microscopy imaging systems: Application to molecular metrology and biological sciences. Mechatronics 2004, 14, 907–945. [Google Scholar] [CrossRef]
- Xie, X.N.; Chung, H.J.; Sow, C.H.; Wee, A.T.S. Nanoscale materials patterning and engineering by atomic force microscopy nanolithography. Mater. Sci. Eng. R Rep. 2006, 54, 1–48. [Google Scholar] [CrossRef]
- Minne, S.C.; Soh, H.T.; Flueckiger, P.; Quate, C.F. Fabrication of 0.1-µm metal-oxide-semiconductor field-effect transistors with the atomic-force microscope. Appl. Phys. Lett. 1995, 66, 703–705. [Google Scholar] [CrossRef]
- Li, H.B.; Rief, M.; Oesterhelt, F.; Gaub, H.E.; Zhang, X.; Shen, J.C. Single-molecule force spectroscopy on polysaccharides by AFM-nanomechanical fingerprint of alpha-(1,4)-linked polysaccharides. Chem. Phys. Lett. 1999, 305, 197–201. [Google Scholar] [CrossRef]
- Tranchida, D.; Piccarolo, S.; Deblieck, R.A.C. Some experimental issues of AFM tip blind estimation: The effect of noise and resolution. Meas. Sci. Technol. 2006, 17, 2630–2636. [Google Scholar] [CrossRef]
- Martinez, J.; Yuzvinsky, T.D.; Fennimore, A.M.; Zettl, A.; Garcia, R.; Bustamante, C. Length control and sharpening of atomic force microscope carbon nanotube tips assisted by an electron beam. Nanotechnology 2005, 16, 2493–2496. [Google Scholar] [CrossRef]
- Dai, H.J.; Hafner, J.H.; Rinzler, A.G.; Colbert, D.T.; Smalley, R.E. Nanotubes as nanoprobes in scanning probe microscopy. Nature 1996, 384, 147–150. [Google Scholar] [CrossRef]
- Wang, Z.L. Zinc oxide nanostructures: Growth, properties and applications. J. Phys. Condens. Matter 2004, 16, R829–R858. [Google Scholar] [CrossRef]
- Yum, K.; Wang, Z.Y.; Suryavanshi, A.P.; Yu, M.F. Experimental measurement and model analysis of damping effect in nanoscale mechanical beam resonators in air. J. Appl. Phys. 2004, 96, 3933–3938. [Google Scholar] [CrossRef]
- Sader, J.E. Frequency response of cantilever beams immersed in viscous fluids with applications to the atomic force microscope. J. Appl. Phys. 1998, 84, 64–76. [Google Scholar] [CrossRef]
- Vancura, C.; Dufour, I.; Heinrich, S.M.; Josse, F.; Hierlemann, A. Analysis of resonating microcantilevers operating in a viscous liquid environment. Sens. Actuators A Phys. 2008, 141, 43–51. [Google Scholar] [CrossRef]
- Herrera-May, A.L.; Garica-Ramirez, P.J.; Aguilera-Cortes, L.A.; Plascencia-Mora, H.; Garcia-Gonzalez, L.; Manjarrez, E.; Narducci, M.; Figueras, E. Analytical modeling for the bending resonant frequency of sensors based on micro and nanoresonators with complex structural geometry. IEEE Sens. J. 2011, 11, 1361–1374. [Google Scholar] [CrossRef]
- Li, M.W.; Bhiladvala, R.B.; Morrow, T.J.; Sioss, J.A.; Lew, K.K.; Redwing, J.M.; Keating, C.D.; Mayer, T.S. Bottom-up assembly of large-area nanowire resonator arrays. Nat. Nanotechnol. 2008, 3, 88–92. [Google Scholar] [CrossRef] [PubMed]
- Verbridge, S.S.; Craighead, H.G.; Parpia, J.M. A megahertz nanomechanical resonator with room temperature quality factor over a million. Appl. Phys. Lett. 2008, 92, 1–3. [Google Scholar] [CrossRef]
- Belov, M.; Quitoriano, N.J.; Sharma, S.; Hiebert, W.K.; Kamins, T.I.; Evoy, S. Mechanical resonance of clamped silicon nanowires measured by optical interferometry. J. Appl. Phys. 2008, 103, 1–7. [Google Scholar] [CrossRef]
- Zhou, J.; Lao, C.S.; Gao, P.X.; Mai, W.J.; Hughes, W.L.; Deng, S.Z.; Xu, N.S.; Wang, Z.L. Nanowire as pico-gram balance at workplace atmosphere. Solid State Commun. 2006, 139, 222–226. [Google Scholar] [CrossRef]
- Biedermann, L.B.; Tung, R.C.; Raman, A.; Reifenberger, R.G.; Yazdanpanah, M.M.; Cohn, R.W. Characterization of silver-gallium nanowires for force and mass sensing applications. Nanotechnology 2010, 21, 1–10. [Google Scholar] [CrossRef] [PubMed]
- Loeian, S.M.; Panchapakesan, B. High Frequency Resonators using Exotic Nanomaterials. In Proceedings of the COMSOL Conference, Boston, MA, USA, 8–10 October 2014.
- Timoshenko, S.; Young, D.H.; Weaver, W. Vibration Problems in Engineering, 4th ed.; Wiley: New York, NY, USA, 1974. [Google Scholar]
- Harris, C.M.; Piersol, A.G. Harris' Shock and Vibration Handbook, 5th ed.; McGraw-Hill: New York, NY, USA, 2002. [Google Scholar]
- Lee, J.W.; Tung, R.; Raman, A.; Sumali, H.; Sullivan, J.P. Squeeze-film damping of flexible microcantilevers at low ambient pressures: Theory and experiment. J. Micromech. Microeng. 2009, 19, 1–14. [Google Scholar] [CrossRef]
- Gusso, A. Energy loss mechanism for suspended micro- and nanoresonators due to the Casimir force. Phys. Rev. B 2010, 81, 1–7. [Google Scholar] [CrossRef]
- Rieger, J.; Isacsson, A.; Seitner, M.J.; Kotthaus, J.P.; Weig, E.M. Energy losses of nanomechanical resonators induced by atomic force microscopy-controlled mechanical impedance mismatching. Nat. Commun. 2014, 5, 1–6. [Google Scholar] [CrossRef] [PubMed]
- Blom, F.R.; Bouwstra, S.; Elwenspoek, M.; Fluitman, J.H.J. Dependence of the quality factor of micromachined silicon beam resonators on pressure and geometry. J. Vac. Sci. Technol. B 1992, 10, 19–26. [Google Scholar] [CrossRef]
- Pandey, A.K.; Pratap, R. Effect of flexural modes on squeeze film damping in MEMS cantilever resonators. J. Micromech. Microeng. 2007, 17, 2475–2484. [Google Scholar] [CrossRef]
- Chon, J.W.M.; Mulvaney, P.; Sader, J.E. Experimental validation of theoretical models for the frequency response of atomic force microscope cantilever beams immersed in fluids. J. Appl. Phys. 2000, 87, 3978–3988. [Google Scholar] [CrossRef]
- Zhang, W.; Turner, K. Frequency dependent fluid damping of micro/nano flexural resonators: Experiment, model and analysis. Sens. Actuators A Phys. 2007, 134, 594–599. [Google Scholar] [CrossRef]
- Leveque, G.; Girard, P.; Belaidi, S.; Solal, G.C. Effects of air damping in noncontact resonant force microscopy. Rev. Sci. Instrum. 1997, 68, 4137–4144. [Google Scholar] [CrossRef]
- Salapaka, M.V.; Bergh, H.S.; Lai, J.; Majumdar, A.; McFarland, E. Multi-mode noise analysis of cantilevers for scanning probe microscopy. J. Appl. Phys. 1997, 81, 2480–2487. [Google Scholar] [CrossRef]
- Green, C.P.; Sader, J.E. Torsional frequency response of cantilever beams immersed in viscous fluids with applications to the atomic force microscope. J. Appl. Phys. 2002, 92, 6262–6274. [Google Scholar] [CrossRef]
- Comsol, A.B. COMSOL Multiphysics User’s Guide; COMSOL Inc.: Burlington MA, USA, 2014. [Google Scholar]
- Czarny, J.; Walther, A.; Desloges, B.; Robert, P.; Redon, E.; Verdot, T.; Ege, K.; Guianvarc'h, C.; Guyader, J.L. New Architecture of MEMS Microphone for Enhanced Performances. In Proceedings of the IEEE International Semiconductor Conference Dresden Grenoble (ISDSG 2013), Dresden, Germany, 26–27 September 2013.
- Yazdanpanah, M.M.; Harfenist, S.A.; Safir, A.; Cohn, R.W. Selective self-assembly at room temperature of individual freestanding Ag2Ga alloy nanoneedles. J. Appl. Phys. 2005, 98, 1–7. [Google Scholar] [CrossRef]
- zurMuhlen, E.; Munoz, M.; Gehring, S.; Reineke, F. Metrology in scanning probe microscopy with atomic force microscopy and near-field scanning optical microscopy. Eur. J. Cell Biol. 1997, 74, 72. [Google Scholar]
- Hafner, J.H.; Cheung, C.L.; Lieber, C.M. Direct growth of single-walled carbon nanotube scanning probe microscopy tips. J. Am. Chem. Soc. 1999, 121, 9750–9751. [Google Scholar] [CrossRef]
- Lee, D.W.; Ono, T.; Esashi, M. Cantilever with integrated resonator for application of scanning probe microscope. Sens. Actuators A Phys. 2000, 83, 11–16. [Google Scholar] [CrossRef]
- Kanda, T.; Morita, T.; Kurosawa, M.K.; Higuchi, T. A flat type touch probe sensor using PZT thin film vibrator. Sens. Actuators A Phys. 2000, 83, 67–75. [Google Scholar] [CrossRef]
- Kim, B.; Masuzawa, T.; Bourouina, T. The vibroscanning method for the measurement of micro-hole profiles. Meas. Sci. Technol. 1999, 10, 697–705. [Google Scholar] [CrossRef]
- Bar, G.; Delineau, L.; Brandsch, R.; Ganter, M.; Whangbo, M.H. Hysteresis in the distance-sweep curves of elastomers and its implications in tapping mode atomic force microscopy. Surf. Sci. 2000, 457, L404–L412. [Google Scholar] [CrossRef]
- Rabe, U.; Amelio, S.; Kopycinska, M.; Hirsekorn, S.; Kempf, M.; Goken, M.; Arnold, W. Imaging and measurement of local mechanical material properties by atomic force acoustic microscopy. Surf. Interface Anal. 2002, 33, 65–70. [Google Scholar] [CrossRef]


| Material | Length (μm) | Cross-Section | Bending Modulus (GPa) | Density (kg/m3) |
|---|---|---|---|---|
| ZnO nanobelt [27] | 31.6 | Rect. (228 × 314 nm2) | 84.8 | 5606 |
| Ag2Ga nanowire [35] | 60 | Circle (dia. 206 nm) | 83.2 | 8960 |
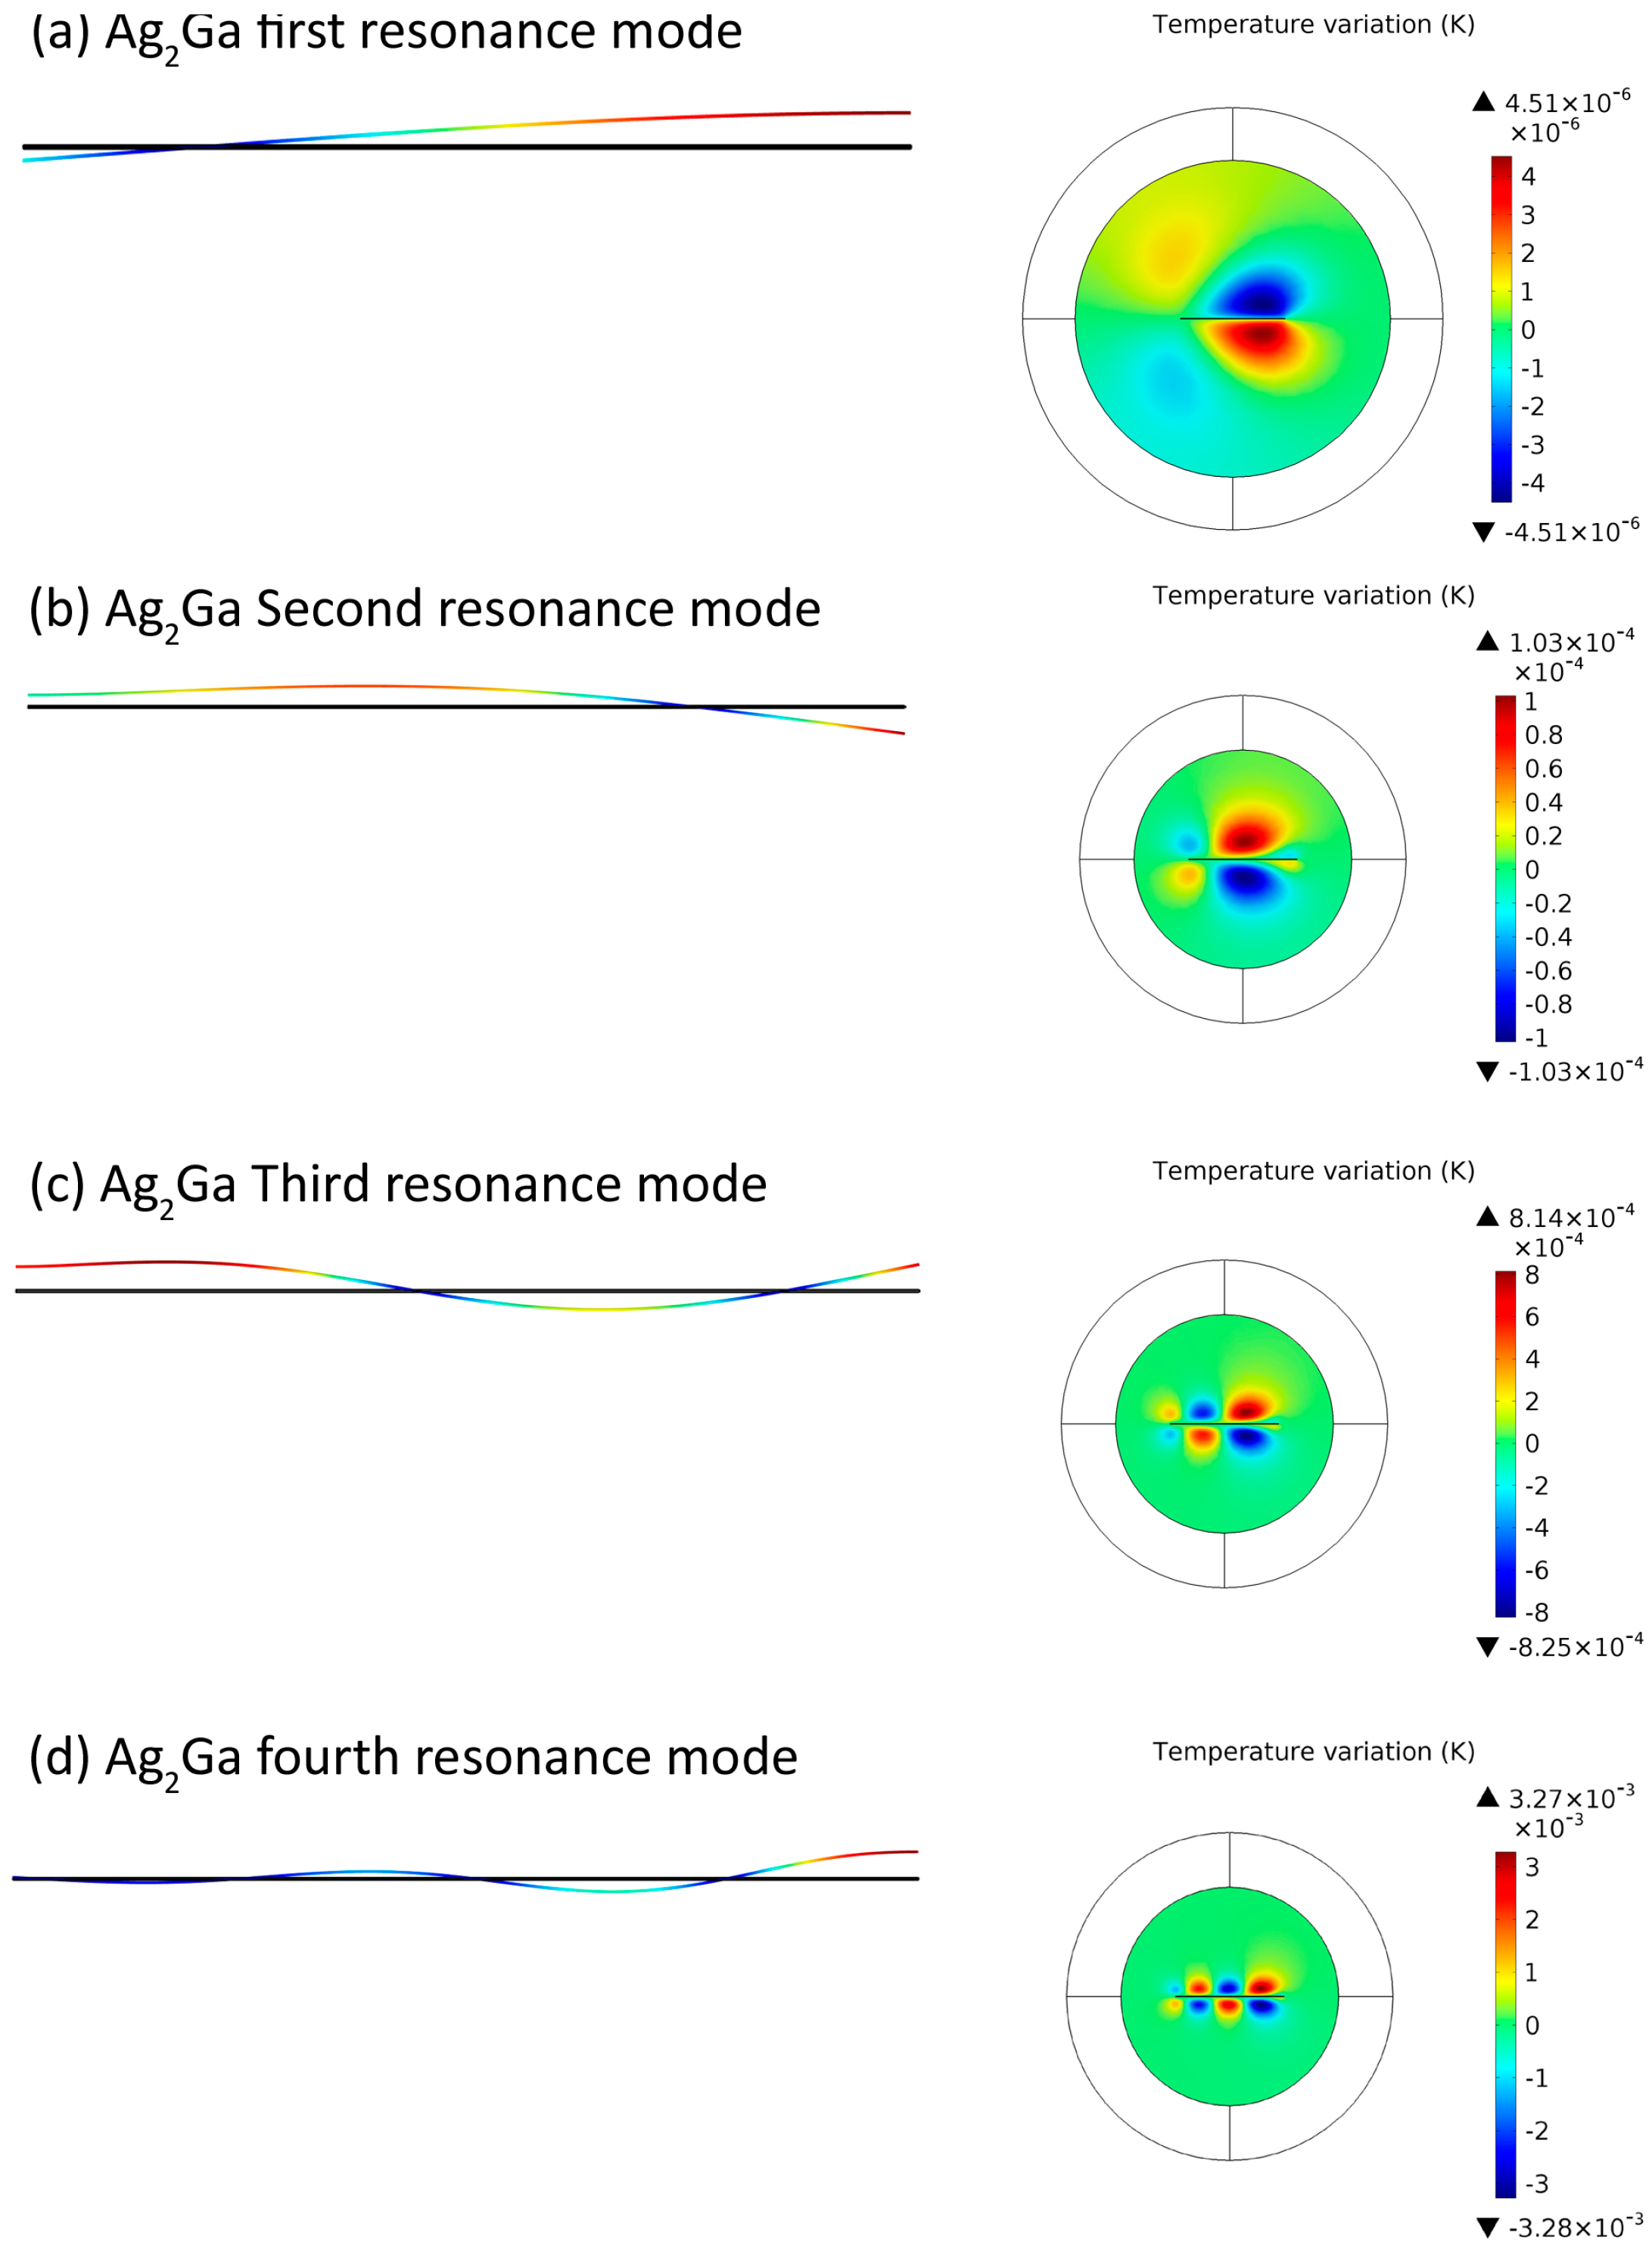
| Nanoresonator | Vibration Mode | Natural Frequency (kHz) From Equation (10) | Damped Resonance fexp (kHz) | Damped Resonance fsim (kHz) | Δf (kHz) (% Error) | Qexp ([35]) | Qsim | Estimated Q ([35]) |
|---|---|---|---|---|---|---|---|---|
| Ag2Ga nanowire | 1st mode | 24.7 | 22.5 | 23.4 | 1.1 (4.8) | 1.2 | 0.9406 | 0.49 |
| Ag2Ga nanowire | 2nd mode | 154.5 | 151 | 149.5 | 2.5 (1.6) | 6.0 | 4.8362 | 2.90 |
| Ag2Ga nanowire | 3rd mode | 432.6 | 428 | 428.8 | −0.8 (0.1) | 12.0 | 12.1473 | 8.17 |
| Ag2Ga nanowire | 4th mode | 847.7 | 845 | 844.2 | −6.2 (0.7) | 22.0 | 21.4809 | 16.00 |
| ZnO nanobelt | 1st mode | 143.44 | 140.3 | 3.14 (2.2) | 3.85 | 4.0963 | − |
| Mechanical Response | Ag2Ga 1st Mode (23.4 KHz) | Ag2Ga 2nd Mode (149.5 KHz) | Ag2Ga 3rd Mode (428.8 KHz) | Ag2Ga 4th Mode (844.2 KHz) | ZnO Nanobelt (140.3 KHz) |
|---|---|---|---|---|---|
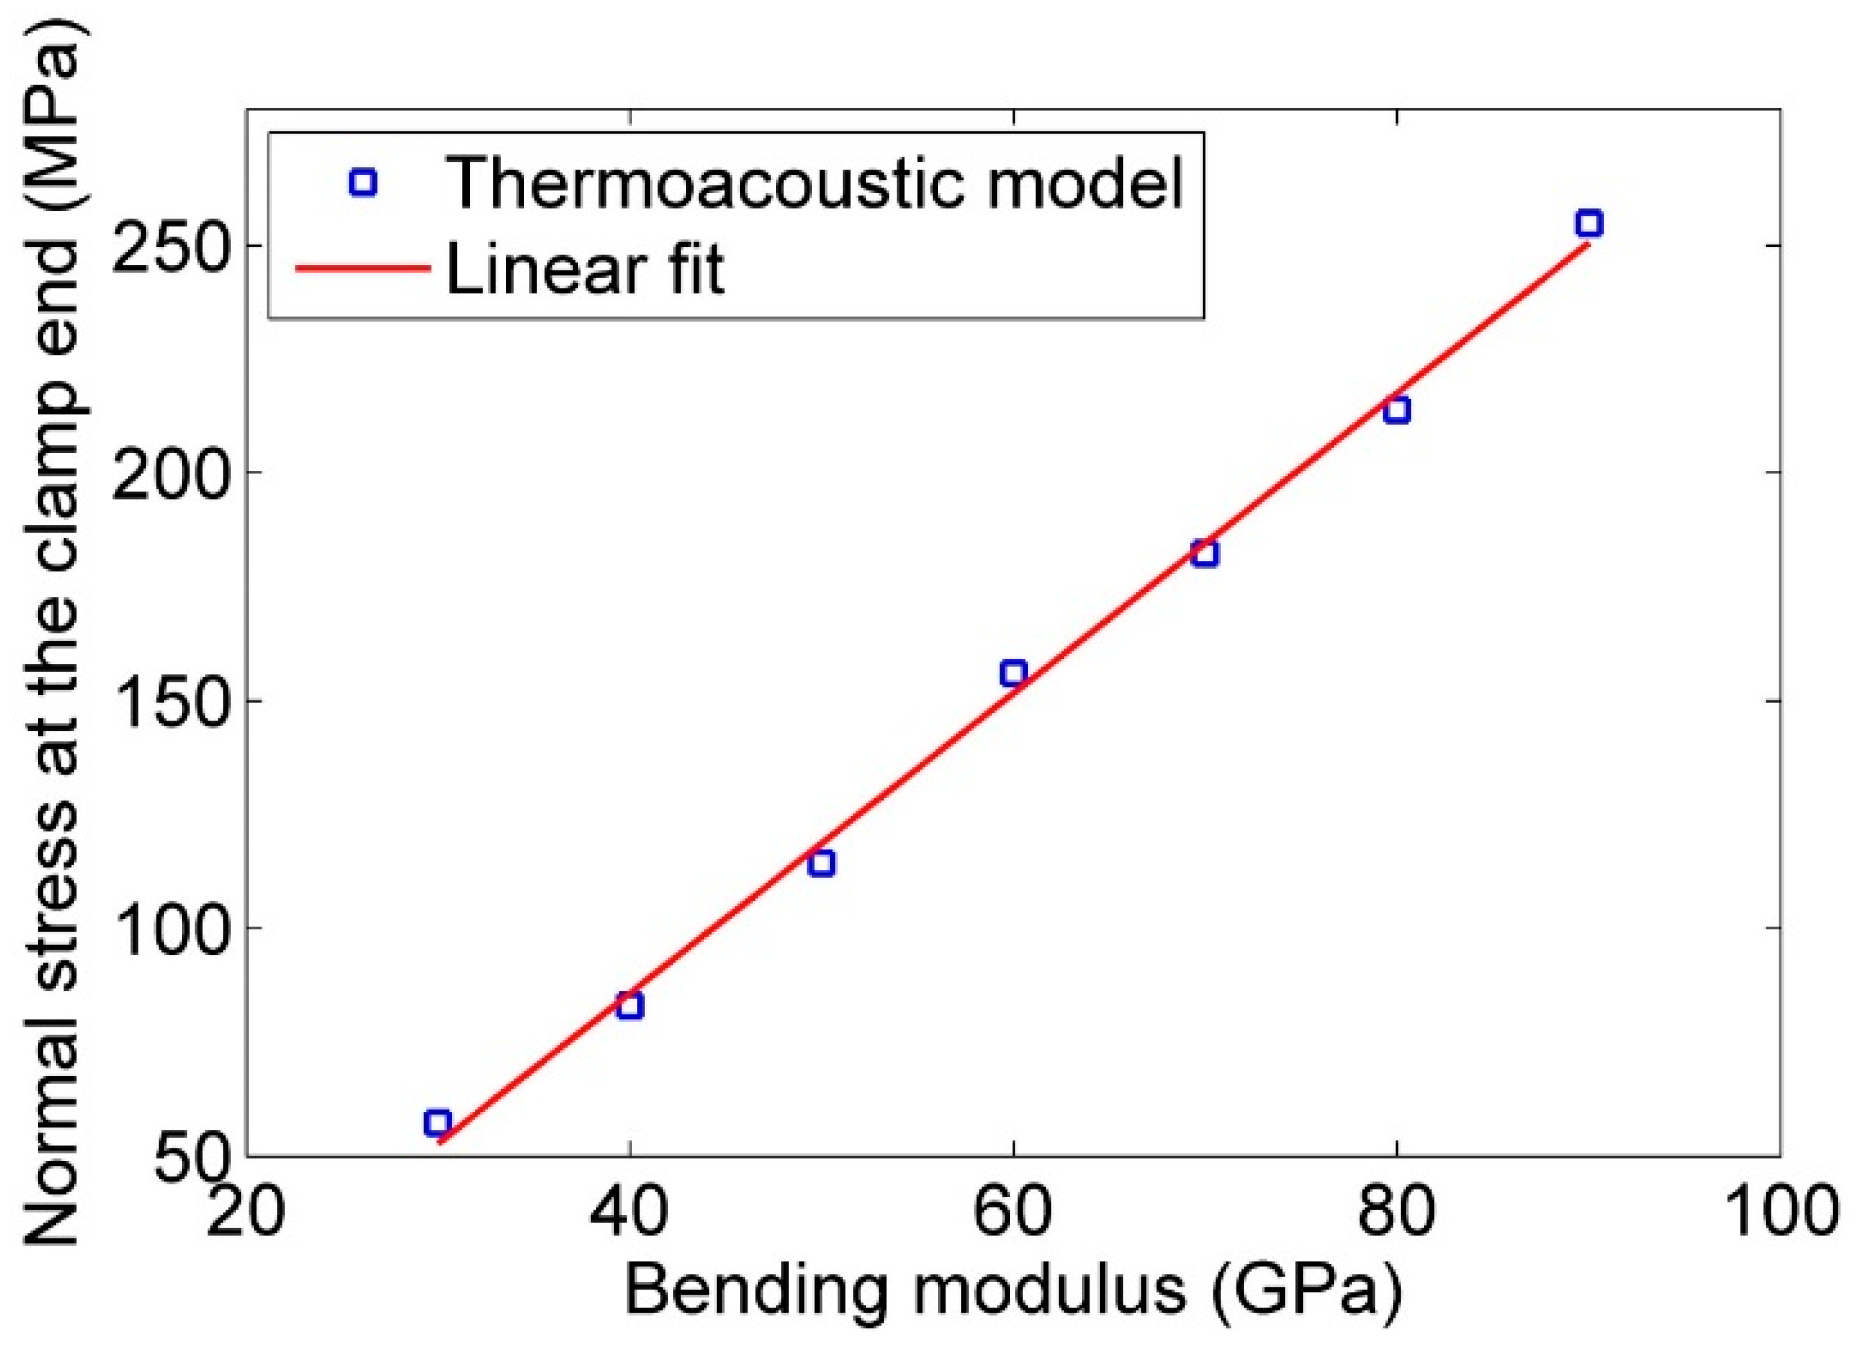
| Stress (MPa) | 5.9 | 76.9 | 286.7 | 680.3 | 98.9 |
| Strain energy (J) | 2.0474 × 10⁻¹⁷ | 4.6904 × 10⁻¹⁸ | 4.0924 × 10⁻¹⁴ | 2.4916 × 10⁻¹⁴ | 5.9527 × 10⁻¹⁵ |
| Mechanical Response | Effect of Length | Effect of Diameter | Effect of Bending Modulus | Effect of Density |
|---|---|---|---|---|
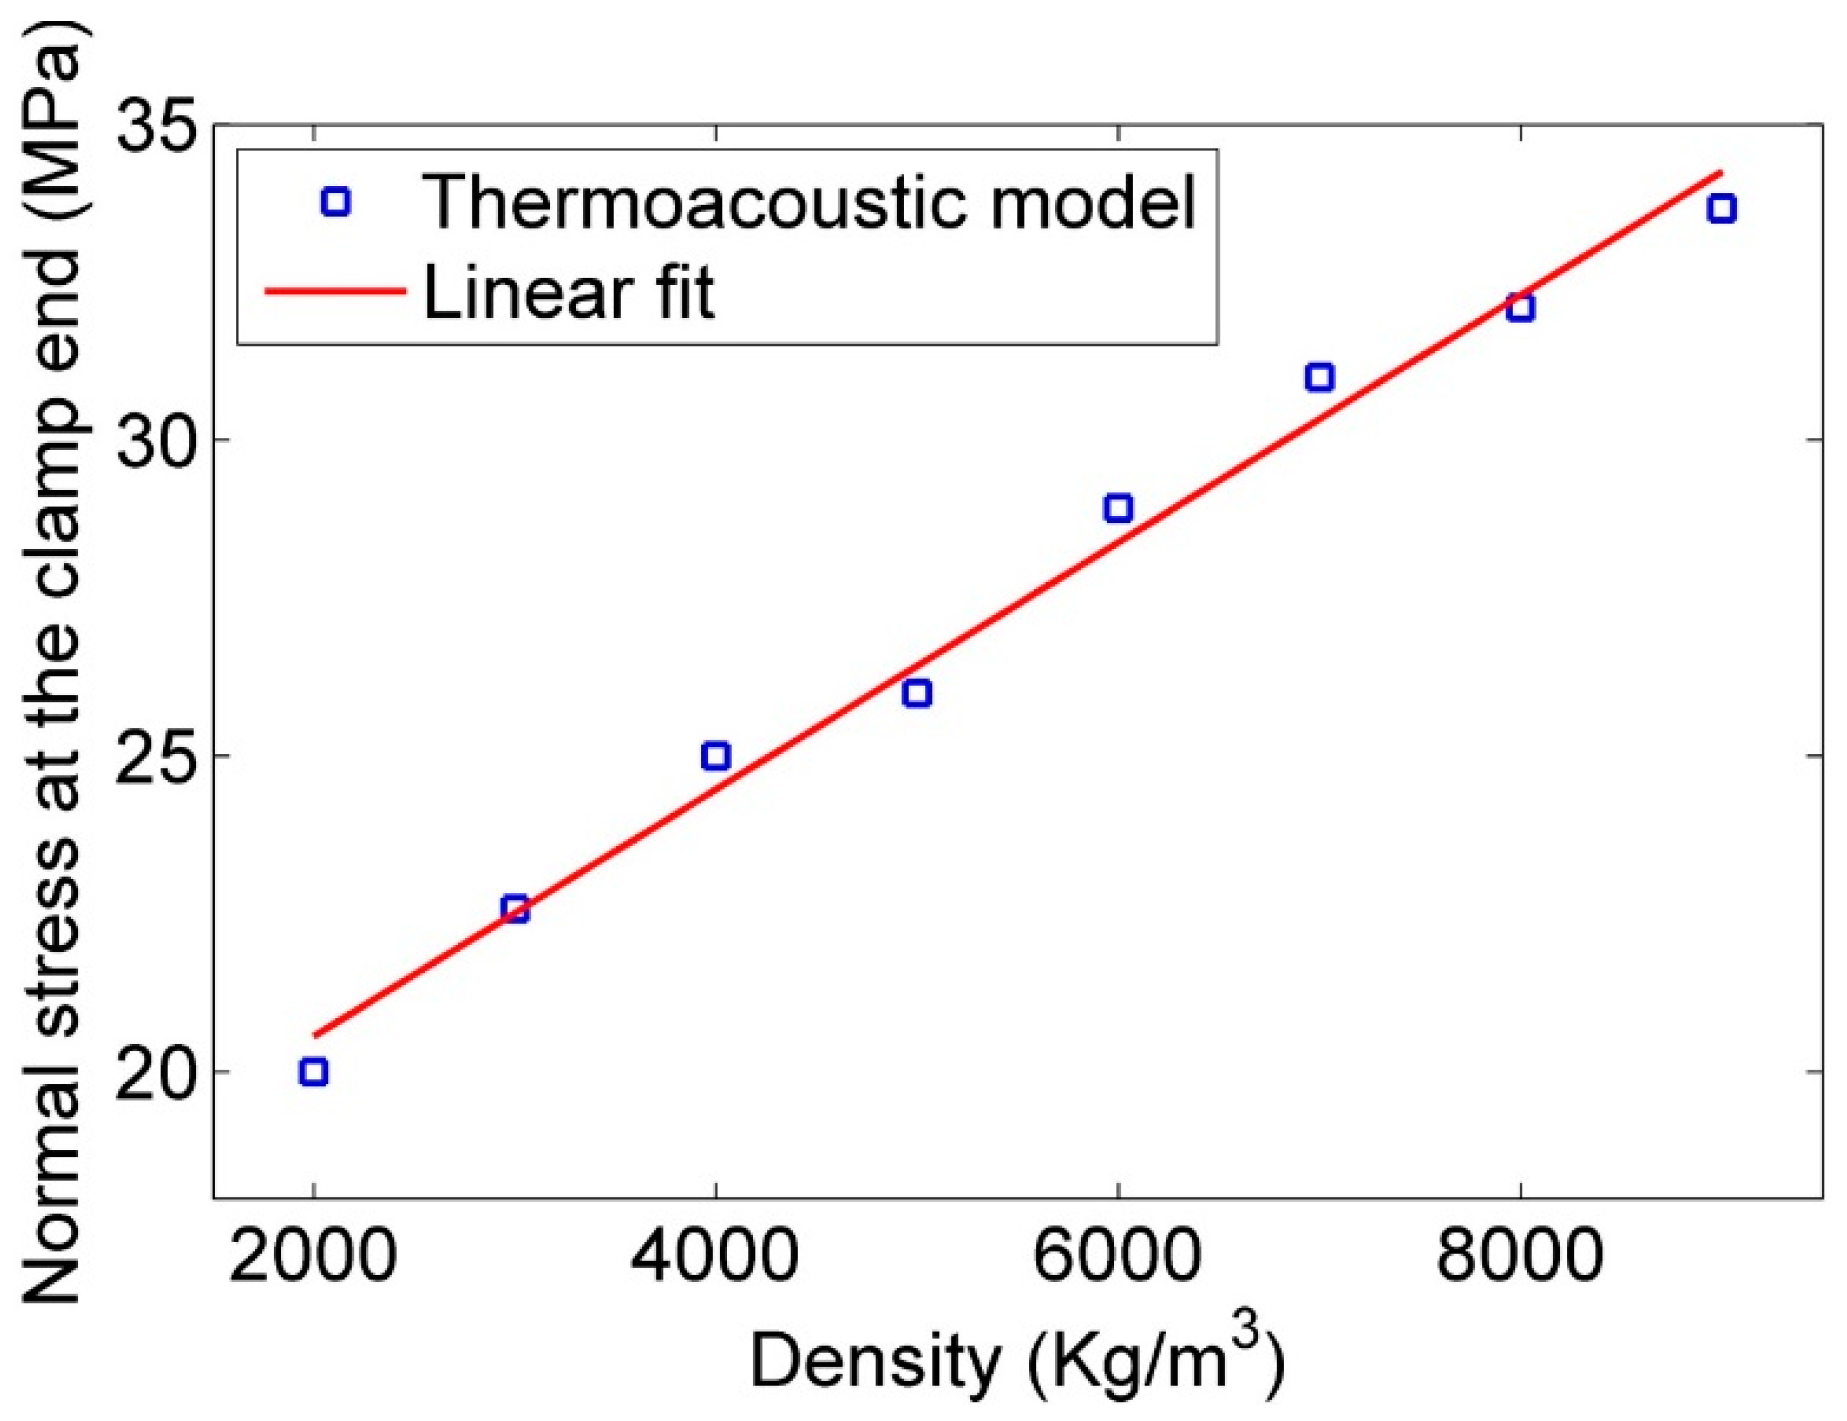
| Normal stress at the clamp end (high vacuum) | No effect | |||
| Normal stress at the clamp end (ambient condition) | No effect | |||
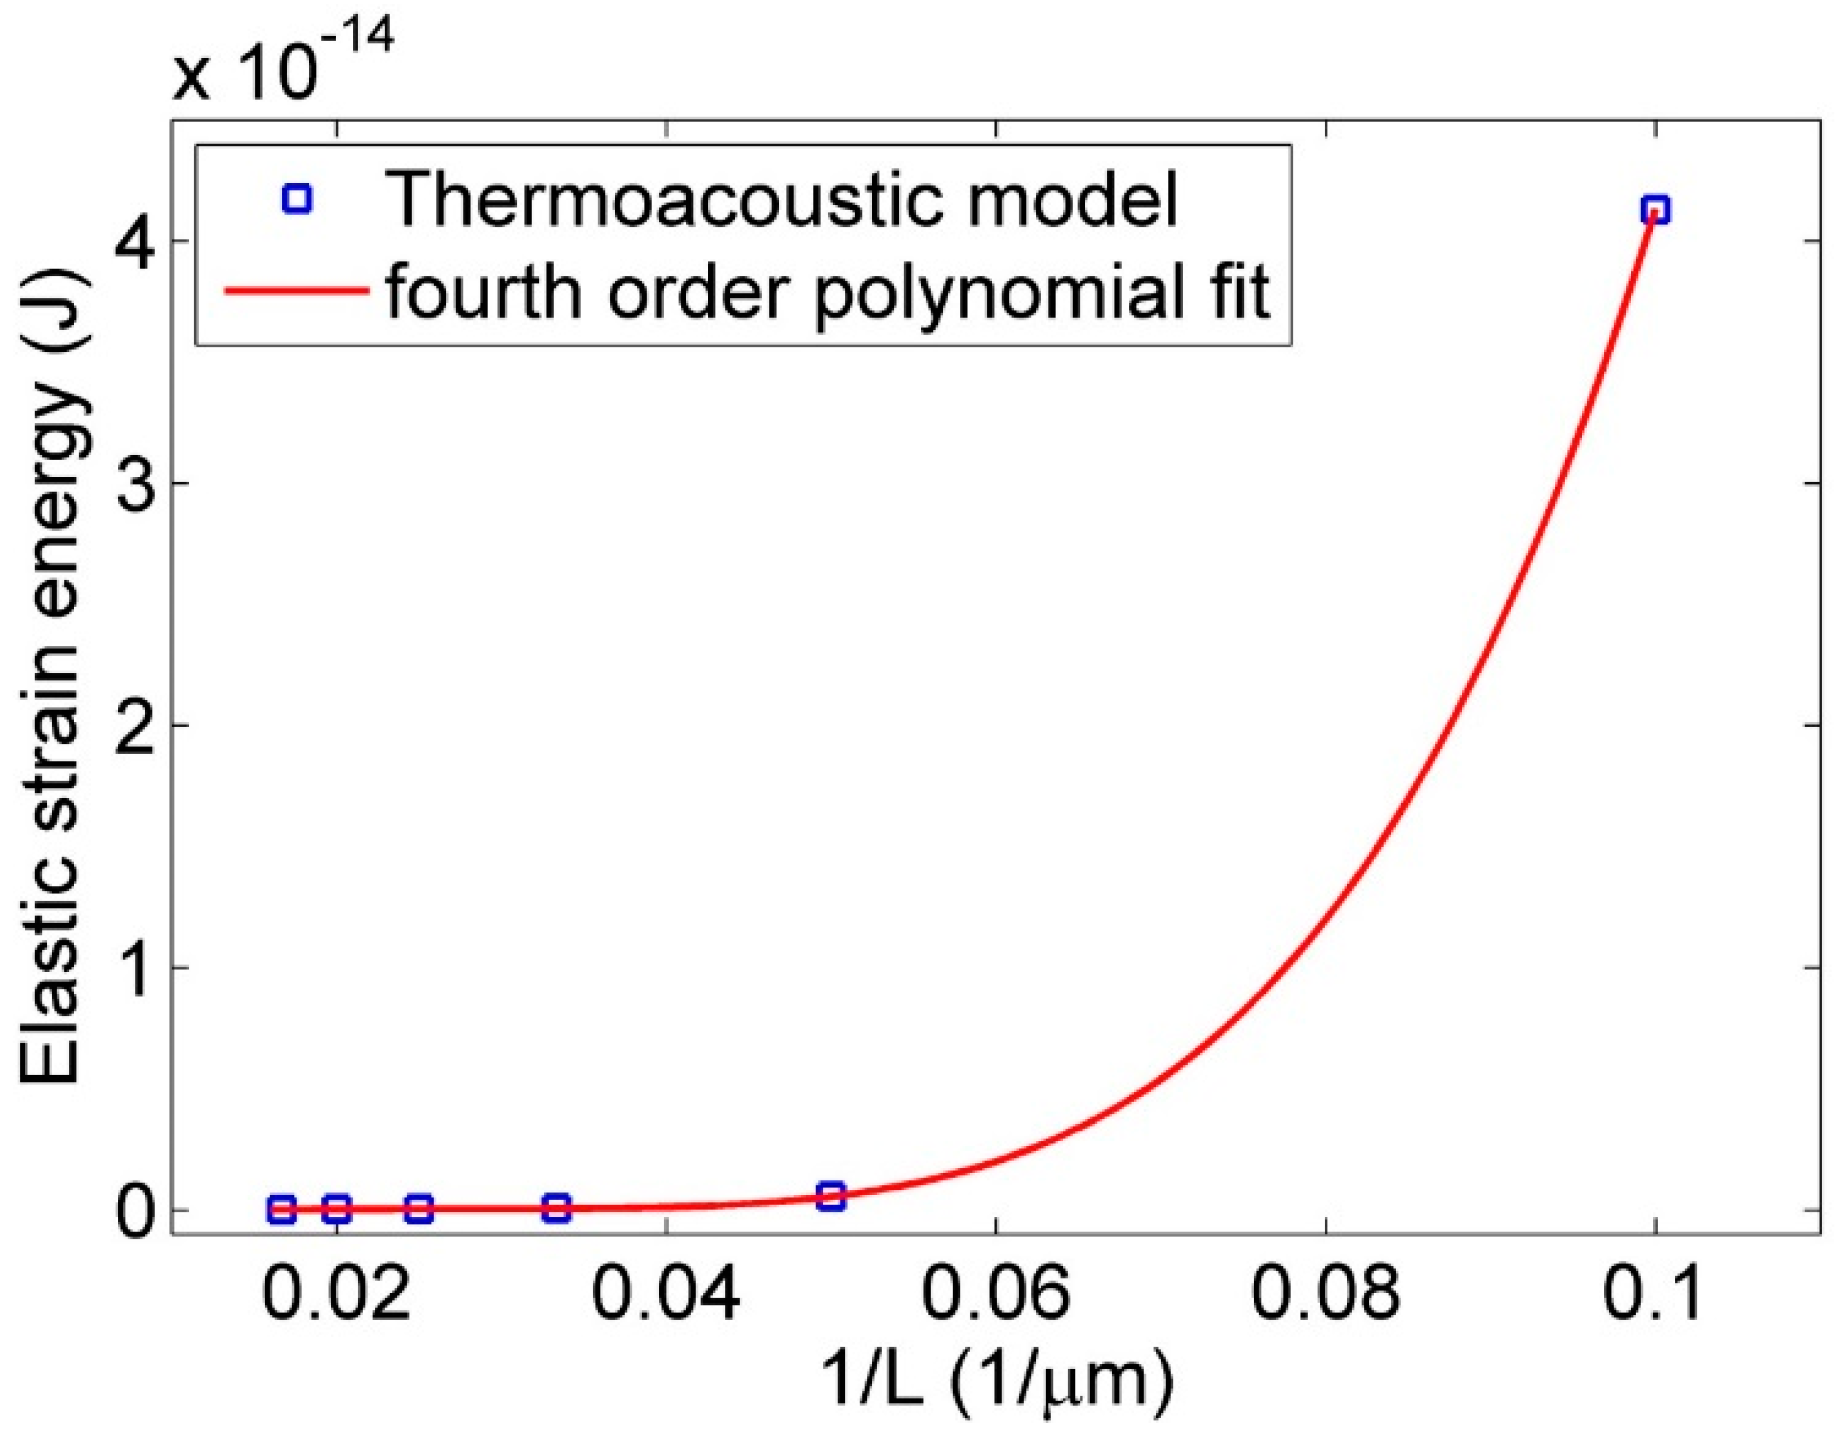
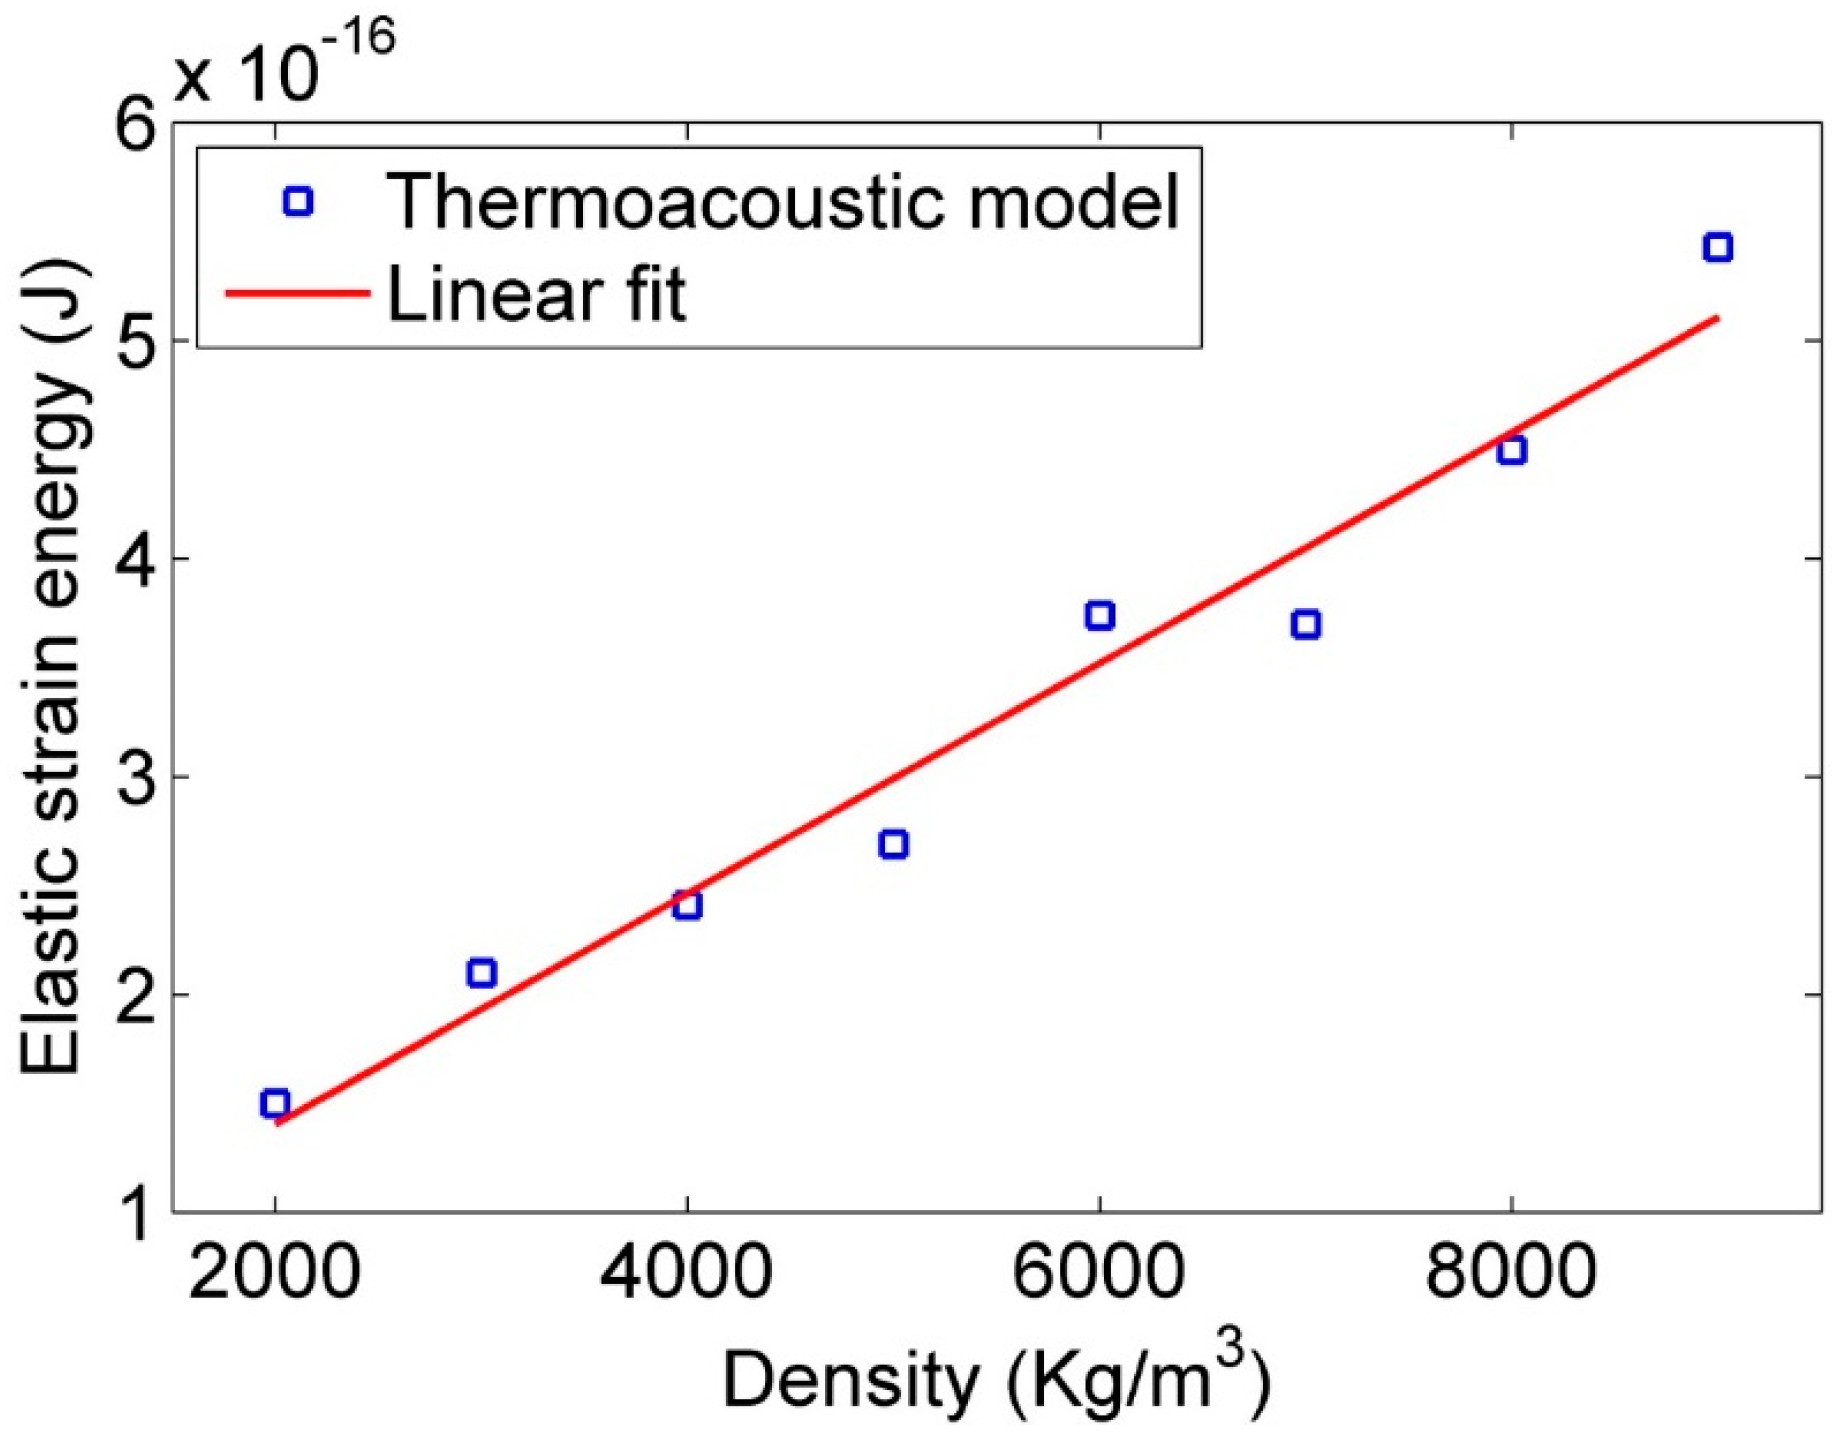
| Elastic stored energy (high vacuum) | E | No effect | ||
| Elastic stored energy end (ambient condition) | E | No effect |
© 2016 by the authors; licensee MDPI, Basel, Switzerland. This article is an open access article distributed under the terms and conditions of the Creative Commons Attribution (CC-BY) license (http://creativecommons.org/licenses/by/4.0/).
Share and Cite
Loeian, M.S.; Cohn, R.W.; Panchapakesan, B. A Thermoacoustic Model for High Aspect Ratio Nanostructures. Actuators 2016, 5, 23. https://doi.org/10.3390/act5040023
Loeian MS, Cohn RW, Panchapakesan B. A Thermoacoustic Model for High Aspect Ratio Nanostructures. Actuators. 2016; 5(4):23. https://doi.org/10.3390/act5040023
Chicago/Turabian StyleLoeian, Masoud S., Robert W. Cohn, and Balaji Panchapakesan. 2016. "A Thermoacoustic Model for High Aspect Ratio Nanostructures" Actuators 5, no. 4: 23. https://doi.org/10.3390/act5040023