Next Article in Journal / Special Issue
Aichi Virus 1: Environmental Occurrence and Behavior
Previous Article in Journal
Pathogenicity of Isolates of Serratia Marcescens towards Larvae of the Scarab Phyllophaga Blanchardi (Coleoptera)
 
 
Correction published on 1 March 2016, see Pathogens 2016, 5(1), 26.
Article

Global Occurrence and Emission of Rotaviruses to Surface Waters

1
Department of Fisheries and Wildlife, Michigan State University East Lansing, MI 48824, USA
2
Enteric Viruses Research Group, Institute of Primate Research, P.O Box 24481, 00502 Karen, Nairobi, Kenya
3
Environmental Systems Analysis Group, Wageningen University, P.O. Box 47, 6700 AA, Wageningen, The Netherlands
4
Faculty of Civil Engineering and Geosciences, Delft University of Technology, P.O. Box 5048, 2600 GA, Delft, The Netherlands
5
KWR Watercycle Research Institute, Groningenhaven 7, 3433 PE, Nieuwegein, The Netherlands
*
Author to whom correspondence should be addressed.
Pathogens 2015, 4(2), 229-255; https://doi.org/10.3390/pathogens4020229
Submission received: 15 April 2015 / Revised: 6 May 2015 / Accepted: 7 May 2015 / Published: 13 May 2015
(This article belongs to the Special Issue Waterborne Pathogens)

Abstract

:
Group A rotaviruses (RV) are the major cause of acute gastroenteritis in infants and young children globally. Waterborne transmission of RV and the presence of RV in water sources are of major public health importance. In this paper, we present the Global Waterborne Pathogen model for RV (GloWPa-Rota model) to estimate the global distribution of RV emissions to surface water. To our knowledge, this is the first model to do so. We review the literature to estimate three RV specific variables for the model: incidence, excretion rate and removal during wastewater treatment. We estimate total global RV emissions to be 2 × 10¹⁸ viral particles/year, of which 87% is produced by the urban population. Hotspot regions with high RV emissions are urban areas in densely populated parts of the world, such as Bangladesh and Nigeria, while low emissions are found in rural areas in North Russia and the Australian desert. Even for industrialized regions with high population density and without tertiary treatment, such as the UK, substantial emissions are estimated. Modeling exercises like the one presented in this paper provide unique opportunities to further study these emissions to surface water, their sources and scenarios for improved management.

1. Introduction

Global estimates have reported that in 2010, 1.8 billion people drank unsafe water and an additional 1.2 billion people were exposed to drinking water with substantial sanitary risk [1]. As of 2004, approximately 2.6 billion people lacked adequate sanitation [2,3] and this figure has seen little improvement [4,5,6]. The combination of inadequate sanitation, poor hygiene, and unsafe drinking water [7] is responsible for an estimated annual burden of 0.7 million diarrheal deaths [8], making diarrhea the fourth leading cause of death among children under five years of age [9]. The Millennium Development Goal (MDG) 7, Target 7.C was to “halve, by 2015, the proportion of the population without sustainable access to safe drinking water and basic sanitation” [6,10]. While the goal for access to improved sources of drinking water has been met, the goal for proper sanitation has not been achieved. Even with access to improved water and sanitation sources, the safety of the water for domestic use is not always guaranteed [6,11].
Water quality will remain an important issue as the Sustainability Development Goals (SDGs) are developed to address the post 2015 targets. For sewage and sanitation, several targets (2015–2030) have been articulated to reduce open defecation and improve treatment. These include:
  • “All urban wastewater is adequately treated before being reused or discharged to the (aquatic) environment.
  • All wastewater is managed in a sustainable way to protect water resources and aquatic ecosystems.” [12].
Achieving the SDGs is important for reducing waterborne diseases. Rotavirus (RV) epitomizes these waterborne diseases as the enteric viruses are specific to human sewage and represent the impact that poor sanitation has on health [13]. Rotavirus was first identified in humans in the 1970s via electron microscopic examination of the duodenums of children who had severe diarrhea [14] and is a uniquely segmented, double stranded ribonucleic acid (RNA), non-enveloped virus in the family Reoviridae [15]. Rotaviruses are classified into at least seven serogroups, A–G, on the basis of distinctive antigenic and genetic properties [15]. Group A, B and C RVs are known to cause disease in humans [15] and group A RVs are the most important cause of acute gastroenteritis in infants and children globally [16].
The presence of RV in water sources is a public health concern due to its impacts on young children, low infectious dose (dose-response models demonstrate that RV is one of the most infectious pathogens, ID50 is ~6 viral units) [17], persistence, and excretion rates [18,19,20]. In infected people, RVs are excreted in very large quantities; >1010–1012 per gram and/or milliliter of stool are reported [19,21].
The primary mode of transmission of RV is the fecal-oral route via person-to-person contact or ingestion of fecally contaminated food and water, with waterborne being one of the important exposure pathways [22,23,24]. In young children, the onset of symptoms is sudden and includes moderate to severe watery diarrhea, vomiting, fever, abdominal discomfort and dehydration [21,25]. The RV incubation period ranges from 5–7 days but it may be as short as 48 h [21,26]. Thus, once the virus enters a community due to contaminated water it can spread quickly through other fecal oral routes.
The virus can also affect older children and adults but the severity of the disease is highest in children below two years of age [16,27,28,29,30,31]. As of 2008, the global RV surveillance network coordinated by World Health Organization (WHO) estimated an annual global mortality as a result of RV infections of approximately 453,000 (range 420,000 to 494,000) [32]. Rotavirus accounted for about 5% of all deaths in children and a cause-specific mortality rate of 86 deaths per 100,000 population of those below 5 of years of age [16,32]. Rotavirus has also been reported as the most common cause of severe and fatal diarrhea and it is associated with 28% of severe cases and 28% of fatal cases before vaccination was introduced [8]. The severity of the infection and the ability of RV to spread quickly (and via water) has promoted an interest in understanding the global discharges from feces and sewage into the water environment, in order to more effectively combat RV transmission via the water route.
Although water was previously considered to be less important for RV transmission compared to person-to-person contact [33], the true attribution of community cases is not well documented. Many cases of RV-associated waterborne disease have been reported in several countries, such as Greece [34], France [35], USA [36], Turkey [37], Albania [38] and Italy [39].
Rotavirus contamination of water is widespread and is demonstrated by its detection in sewage and water sources in several studies. For instance, in Kenya, clinically relevant RVs were identified in rural and urban Kenya water sources [40]; and in South Africa, RV was detected in water sources and raw vegetables [41]. In France, RV was detected in drinking water from homes of children who had been diagnosed with acute gastroenteritis caused by RV [42]. In the Netherlands, RVs have been detected in a water source reservoir and rivers [43]. Sewage and receiving surface water may be an environmental reservoir and a transmission route [17]. Therefore, RV monitoring in water sources that are used for domestic, irrigation and recreation purposes has become important to assess the public health risks of RV [44,45].
Improved hygiene, water quality and sanitation practices are necessary for the prevention of diarrheal disease caused by numerous etiological agents. However, as RV is excreted in high numbers, is persistent and highly infectious, routine wastewater treatment is often not efficient enough to prevent RV transmission, yet this has not been well documented. An RV vaccine has been developed [46] to reduce the number of severe cases of the disease, hospitalizations and deaths [32]. The RV vaccine have been shown to improve the health and well-being of children in countries where it has been introduced [47,48,49,50], leading to rapid and substantial drops in hospitalization and deaths due to RV infections [51,52,53]. Although the immunity induced by the vaccine protects against severe RV disease, re-infections by different genotypes of RV can occur throughout life as these viruses have a high genetic diversity [54,55,56]. This is a concern as several studies have reported the emergence of new RV strains that are not covered by the vaccines. It also implies that environmental circulation of RV continues in vaccinated populations. Environmental monitoring of RV, including molecular characterization of RV genotypes, can serve to detect the circulation of new RV strains in the population.
Monitoring enteric pathogens in sewage systems is one of the approaches to assess the presence of pathogens that are circulating in a specific community. Infectious RVs can be discharged into water sources used for domestic, irrigation and recreation purposes such as rivers, reservoirs, seawater and lakes, due to their resistance to typical wastewater treatment processes [57]. Rotavirus monitoring data are poor and cannot provide information on the spatial distribution and hotspots associated with RV discharges globally. Modeling approaches show great promise for understanding the impacts of (partially and inadequately) treated wastewater discharges on water resources and guiding future decision-making, both in regard to the SDGs for sanitation and vaccination programs.
Many modeling approaches exist. We are interested in understanding the global distribution of potential viral water pollution associated with a lack of sanitation. Therefore, we choose to apply an update of the modeling approach that Hofstra et al. [58] used for Cryptosporidium to RV. This model estimates pathogen emissions to surface water. In the case of group A RV, only human emissions are relevant. These emissions depend on the population size, their age distribution of the population, RV incidence and RV excretion, the sanitation type and wastewater treatment based on data from the year 2010. The model outcome is RV emissions at a 0.5 × 0.5 degree latitude × longitude grid and can be used to understand spatial distribution, hotspots and main sources of emissions. The great advantage of this modeling approach is that we can get a better understanding of the situation in areas where no monitoring data exist, but where we do have model input data available. Hotspot areas can then be selected for investigative monitoring programs. Moreover, the model can be used to explore the impact of sanitation options on environmental RV emissions.
The main aim of this paper is to develop a framework, which can be used to examine the global emission of RV from human wastewater to surface waters and ultimately for supporting risk mitigation. We present a literature review to determine the three RV specific model parameters: RV incidence, excretion rates and removal by wastewater treatment (Section 2.1), a map of RV emissions to surface water worldwide (Section 2.2) calculated with the GloWPa model adapted for RV (GloWPa-Rota model version H1, Section 4.2) and discuss the use of such maps for risk mitigation and decisions on wastewater treatment to address pathogen control.

2. Results

2.1. Literature Review

In this Section we present the results of the literature review to obtain the RV specific parameters for the GloWPa-Rota model (Section 4.2). These parameters are the incidence (Section 2.1.1), the excretion rate of the population (Section 2.1.2) and the removal by wastewater treatment (Section 2.1.3). The literature review methodology is explained in Section 4.1.

2.1.1. RV Incidence

We reviewed the literature on diarrheal illness and the detection of RV in clinical samples from 2000–2014. We found that 27 countries had conducted RV surveillance studies covering a period of either one or two full calendar years, and a total of 34,972 children <15 years of age with acute gastroenteritis (Table 1). Most of the studies surveyed hospitalized, and hence severe, cases of diarrhea. In these populations the mean detection rate of RV was 33.4% (range 6%–56.3%) and the median was 34.3%.
Overall, the majority of RV infections studied occurred in children under five years of age and the rate of RV detection varied somewhat between countries (Table 1). Among the 27 studies that we included in our review, three countries reported enrollment of children below 15 years. These counties were Argentina, France and Tunisia with a RV detection rate that was between 19.7%–48.8%. One country (Saudi Arabia) recruited children under six years of age and RV accounted for 6% of all diarrheal cases. The other 23 enrolled only children below five years of age and had a mean RV detection rate of 34.7% (range 19.2%–56.3%) (Table 1). In all these studies the duration of RV diarrhea was reported to be less than seven days.
Table 1. Summary of the rate of rotavirus infection in children with (severe) cases of diarrhea in different countries 2002–2014.
ContinentCountryDuration of Study# Sample RecruitedAge (years)(%) Prevalence of RV Diarrheal CasesReference
AfricaKenya2009–2011500<538[59]
Libya2007–20081090<531.5[60]
Morocco2006–20091388<541.7[61]
Morocco2011335<526.6[61]
Sierra Leone2005128<337.5[62]
South Africa2003–20063191<522.8[63]
Tunisia2007–2010435<1327.6[64]
AsiaCambodia2005–20072281<556[65]
China2008–2009766<527.94[66]
China2011–2012767<534.3[67]
India2004–2008412<319.2[68]
India2009–20111807<535.9[69]
India2009–20121191<539[70]
India2007–2012756<538.4[71]
Lao PDR2005–20071158<554[72]
Myanmar2004–20052179<556.3[73]
South Korea2005–20076057<522[74]
South Korea2007–2008702<125.2[75]
Taiwan2005–20073435<525[76]
EuropeAlbania2007–20101066<521[77]
France2001–2004457<1548.8[78]
Spain2006–20082048<540.1[79]
Middle EastIran2009–2010163<546.02[80]
Israel2007–2008472<539.1[81]
Saudi Arabia2002–20031000<66[82]
South AmericaArgentina2004–2007710<1519.7[83]
Venezuela2013480<521[84]
The reported detection rate of RV in clinical samples in this case is not a true reflection of the total incidence of RV infection in the entire population, particularly for RV since the detection rate reported is mostly from severe diarrheal cases and it is an estimate for children under five years of age, but not for other age groups. Additionally, people suffering from RV diarrhea may require hospitalization and emergency doctor visit more often than people with diarrhea from other pathogens. Therefore, these clinical data from selected subpopulations with severe symptoms are only a fraction of the RV circulation in the population. Alternatively, Walker et al. [8,85] estimated diarrheal incidence rates for children under five in different regions of the world of 2.2–4.0 episodes per child per year, also from severe episodes. A recent study on the burden and etiology of diarrheal disease in infants and young children in developing countries (the Global Enteric Multicenter Study, GEMS) estimated the incidence of RV cases for children under five with moderate to severe diarrhea to be 0.035–0.413 episodes per person per year [86]. Rotavirus incidence for the total population have been reported for Brazil, China, the Netherlands and the USA in population-based surveys and ranged from 0.0093–0.24 per year (Table 3).
For use in the model, we selected an incidence of 0.24 episodes of RV diarrhea per person per year for children under five in developing countries with Human Development Index (HDI) lower than 0.785, which is the RV incidence for children under five in Brazil and in the mid-range of the RV incidence reported in the GEMS study. For children under five in industrial countries we used a RV incidence of 0.08 based on the data for this age group from the population study in the Netherlands [87]. For the rest of the population we assumed a RV incidence of 0.01, based on the data for the under five age groups in the Netherlands [87].

2.1.2. Excretion Rate

In addition to the incidence we required the excretion rate for RV cases. Data on RV excretion by symptomatic and asymptomatic children and adults are limited. Many studies indicate that RV is excreted in very large quantities (1010–1012 per gram) [19,21]. Recent studies with quantitative polymerase chain reaction (qPCR) determined the shedding of RV over time [88], but present the data in qPCR-cycles rather than in virus particles or genome copies. Moreover, studies on virus excretion by mild or asymptomatic RV cases are even more limited.
The population excretion rate may also be estimated via sewage surveillance. Surveillance data of RV in sewage reflect RV shedding in the community and has been used to study the circulation of RV and other enteric viruses in the population [89,90,91,92,93,94,95]. Where sewage surveillance produces quantitative data on virus concentration (dynamics) in sewage, these data can be used to estimate RV shedding rates in the population. This includes all RV shedding by symptomatic and asymptomatic children and adults. We reviewed 17 studies over the last seven years (2008–2014) reporting on occurrence and/or detection of RV in untreated sewage: three studies in Africa, three in Asia, four in Europe, six in the Americas and one in the Middle East. In these studies the mean RV detection rate was 60% (range 8.3%–100%) (Table 2). In Africa (Kenya, Tunisia and Egypt), the rate of RV detection was between 8.3% and 69.2% (Table 2). In Asia, the occurrence of RV in untreated sewage was reported in China at 44.4% and in India a detection rate of 77% was reported. The four studies in Europe reported a RV detection rate of between 37.5% and 100% (Table 2). In the Americas, the occurrence of RV in untreated sewage was reported in three studies from Brazil with a mean of 58% (range 28.6%–100%); Venezuela at 66.7%, Argentina at 100% and the USA at 58.3% (Table 2). Most studies used qPCR to detect RV in sewage. Only three of the studies reported concentrations of RV in sewage. These concentrations ranged from 3.12 × 10³ to 2.8 × 10⁶ genome copies per liter.
Table 2. Summary of the occurrence of rotavirus in untreated sewage from selected countries in Africa, Asia, Europe, Middle East and Americas from the last decade.
ContinentCountryYear of Study# Samples Collected (n)# (%) RV PositiveRV ConcentrationReference
AfricaEgypt2006–2007726 (8.3)NRa[94]
Kenya2007–2008139 (69.2)NR[40]
Tunisia2003–200712553(42.4)NR[96]
AmericasArgentina20095252 (100)NR[97]
Brazil2004–20052411(45.8)NR[98]
Brazil2009–20102424 (100)2.40E+05 genome copies/L b[99]
Brazil200972 (28.6)NR[100]
USA2011–20122414 (58.3)2.8E+06 genome copies/L c[101]
Venezuela2007–2008128 (66.7)NR[102]
AsiaChina2006–20071010 (100)NR[103]
China2006–20073616 (44.4)3.12E+03 genome copies/L b[104]
India2009–2010144111(77)NR[105]
EuropeFrance2003–20042911(37.9)NR[106]
Italy2006–2007166 (37.5)NR[107]
Italy2010–2011285172 (60.4)NR[108]
Sweden201377 (100)NR[109]
Middle EastIran2010–2011155 (33.3)NR[110]
a NR—not reported; b mean concentration, c Maximum concentration.
To be able to combine sewage concentration data with data on incidence of RV cases in the population, we selected the studies with quantitative data on RV in sewage (adding one study from before the literature review selection period for the Netherlands) and combined these with data on incidence of RV in the general population.
A study in the USA reported the detection of viruses at two wastewater treatment plants in Arizona [101]. In this study samples from sewage were collected monthly for a period of one year. The concentration of several enteric viruses was determined, including group A RV, by qPCR. Rotavirus concentrations were relatively high from January–June and it was detected at lower rates in the other months, reflecting an apparent seasonality of RV diarrhea in the population. RV shedding was assumed to occur in the months in which high RV concentrations were detected in sewage (January to June, a duration of six months). The incidence of RV in the USA in the pre-vaccine years was reported as 2.7 million cases in a total population of approximately 290 million (0.93%) [111]. Virus shedding by people with RV infection is high in the first days of the illness, coinciding with the diarrheal symptoms and drops to low shedding rates that may last as long as 51 days [88]. We only considered the initial high shedding phase of seven days, since the shedding rate in the later stage is several logs lower. Using the wastewater production of 265 liters per capita per day [112], we estimated a RV shedding rate of 7.4 × 10¹⁰ genome copies per RV case per day (shedding rate = concentration in sewage (genome copies per liter) × wastewater per capita (liter per person per day)/((RV incidence (episodes per person per year) × high shedding duration (days))/(seasonality (months per year) × days in a month (days per month)), Table 3).
Similarly, RV shedding estimates were calculated for the Netherlands, using qPCR data from sewage [90], wastewater use [113] and a RV incidence based on a population study on diarrheal incidence and the percentage of RV detected in these diarrheal cases [87]. Again, a similar approach was used for China. A population-based surveillance study in Zhengding produced a RV incidence of 0.151 in children under five [114] and we assumed this reflected the largest part of the incidence of RV infections. Sewage concentrations of RV were reported for three wastewater treatment plants [104]. We selected the plant with the highest mean RV concentration. These data were completed with data on wastewater use in Beijing [115] to calculate the shedding. Also, in the Netherlands and China, seasonality was observed in the measured sewage concentrations, with the reported sewage concentrations found in six months of the year. To calculate the shedding, we used a seasonality correction. For Brazil, RV concentrations in sewage and wastewater use were available for Rio de Janeiro [99] together with a national estimate of the number of RV cases in young children [116] and we assumed this reflected the majority of the RV incidence in Brazil (Table 3).
The RV shedding rates that were deducted from the concentrations in sewage ranged 2 × 10⁹–7 × 10¹⁰ genome copies per case per day, primarily determined by the concentration that was detected in sewage (Table 3). We therefore decided to use the excretion rate of 1010 genome copies per case per day, together with the assumption that cases shed seven days, so 7 × 10¹⁰ genome copies per case per episode.

2.1.3. Removal during Wastewater Treatment

The removal of viruses in wastewater treatment is important to reduce the concentrations of infectious viral particles in the water environment. Removal efficiency is variable depending on the design and operation of the treatment facility. A number of studies, primarily in industrialized countries, have characterized the rate of enteric virus removal in wastewater treatment (Table 4) but only a few studies have focused on RV removal. Wastewater treatment processes tested for virus removal include primary sedimentation, secondary biological treatment such as activated sludge and trickling filters and tertiary treatment processes, such as coagulative precipitation and sand filtration, ultraviolet (UV) light and chlorination for disinfection and membrane bioreactors. A study in China [117] analyzed RV removal and inactivation with cell culture PCR by three different wastewater treatment plants. Activated sludge treatment produced a mean log10 removal of range 2–2.83 and coagulative precipitation a mean log10 removal of 0.72 ± 0.08. More data are available on removal of other enteric viruses, for example human adenovirus (HAdV), which is prevalent in sewage.
In general, primary sedimentation does little to reduce virus concentrations. Both activated sludge and chlorination were utilized in the USA study. The virus removal by secondary treatment (with chlorination) varied between the different virus types between a mean log10 removal of 0.7 to 2.56. Viruses were assayed with qPCR, which may overestimate the concentration of infectious virus particles [101]. In general, secondary biological treatment reduces the concentration of all viruses. The removal ranges from around 0.8–2.5 log.
Table 3. Deduction of rotavirus shedding rates in the population from sewage surveillance data.
CountryConcentration in Sewage (Genome copies/L)Seasonality in Sewage (m/y)Wastewater per Capita (L per day)RV Incidence (Episodes per person per year)Shedding (Genome Copies per case per day)References
Brazil1.0E+06121440.243.1E+10[88,99,116]
China6.8E+0361900.152.2E+08[88,104,114,115]
NL4.6E+0363060.0211.8E+09[87,88,90,113]
USA1.0E+0562650.00937.4E+10[88,101,111,112]
Tertiary treatment may be comprised of very different treatment processes. The studies indicate that tertiary disinfection with chlorine or UV has limited effect on virus concentrations in practice, even where infectivity assays were used. Advanced tertiary treatment processes such as membrane bioreactors can produce a very significant reduction of virus concentrations in wastewater. Though secondary and tertiary systems are common processes for larger wastewater treatment plants in industrialized countries, wastewater treatment ponds are the most common treatment process worldwide. A recent review of wastewater treatment ponds [118] showed that virus removal in pond systems is also highly variable. In 62% of the field studies of pond systems, virus removal was more than 1 log. The authors showed that there is a weak to moderate relation between virus removal and hydraulic retention time with 1 log virus removal for every 14.9–20.7 days retention time.
Table 4. Log removals of viruses by secondary and tertiary treatments.
Virus aCountry bDetection Method cTreatment process(es) dnRemoval/InactivationReference
Mean (log10)Stdev (Log10)
RVChinaICC-qPCRActivated sludge122.080.63[117]
RVChinaICC-qPCRActivated sludge122.830.49[117]
RVChinaICC-qPCRActivated sludge1221.1[117]
RVChinaICC- qPCRCoagulative precipitation and sand filtration120.720.08[117]
PPMVUSAqPCRActivated sludge + Cl2120.760.53[101]
PPMVUSAqPCRTrickling filter + Cl2120.990.12[101]
AdVUSAqPCRActivated sludge + Cl2120.7[101]
AdVUSAqPCRTrickling filter + Cl2121.5[101]
JCPyVUSAqPCRActivated sludge + Cl2121.640.98[101]
JCPyVUSAqPCRTrickling filter + Cl2122.560.64[101]
BKPyVUSAqPCRActivated sludge + Cl2121[101]
BKPyVUSAqPCRTrickling filter + Cl2121.5[101]
AiVUSAqPCRActivated sludge + Cl2120.940.33[101]
AiVUSAqPCRTrickling filter + Cl2120.990.12[101]
EVUSAqPCRActivated sludge + Cl2121.5[101]
EVUSAqPCRTrickling filter + Cl2122.1[101]
EVNLCCActivated sludge51.40.42[90]
ReoVNLCCActivated sludge51.20.22[90]
HAdVSpainqPCRTertiary1.2[119]
HAdVSpainqPCRTertiary1.9[119]
AdVUSAqPCRMembrane Bioreactor3.9–5.5[120]
NoVIIUSAqPCRMembrane Bioreactor4.6–5.7[120]
a RV—rotavirus, PPMV—pepper mild mottle virus, HAdV—human adenovirus, JCPyV—JC polyomavirus, BKPyV—BK polyomavirus, AiV—aichivirus, EV—enterovirus, ReoV—reovirus, NoVII—norovirus genogroup 2; b USA—United States, NL—Netherlands; c ICC-qPCR—integrated cell culture and quantitative polymerase chain reaction, CC—cell cultures; d Cl2—chlorination.
For the model, we have assigned 0.1 log virus removal to primary sedimentation, 1.5 log virus removal to secondary biological treatment and 0.5 log to tertiary treatment. This corresponds to 20% removal for primary treatment, 97.5% removal for primary followed by secondary treatment and 99.21% removal when tertiary treatment is added. Lagoons and other tertiary treatment methods may have different removal capacities, but these were not reported within the available treatment datasets.

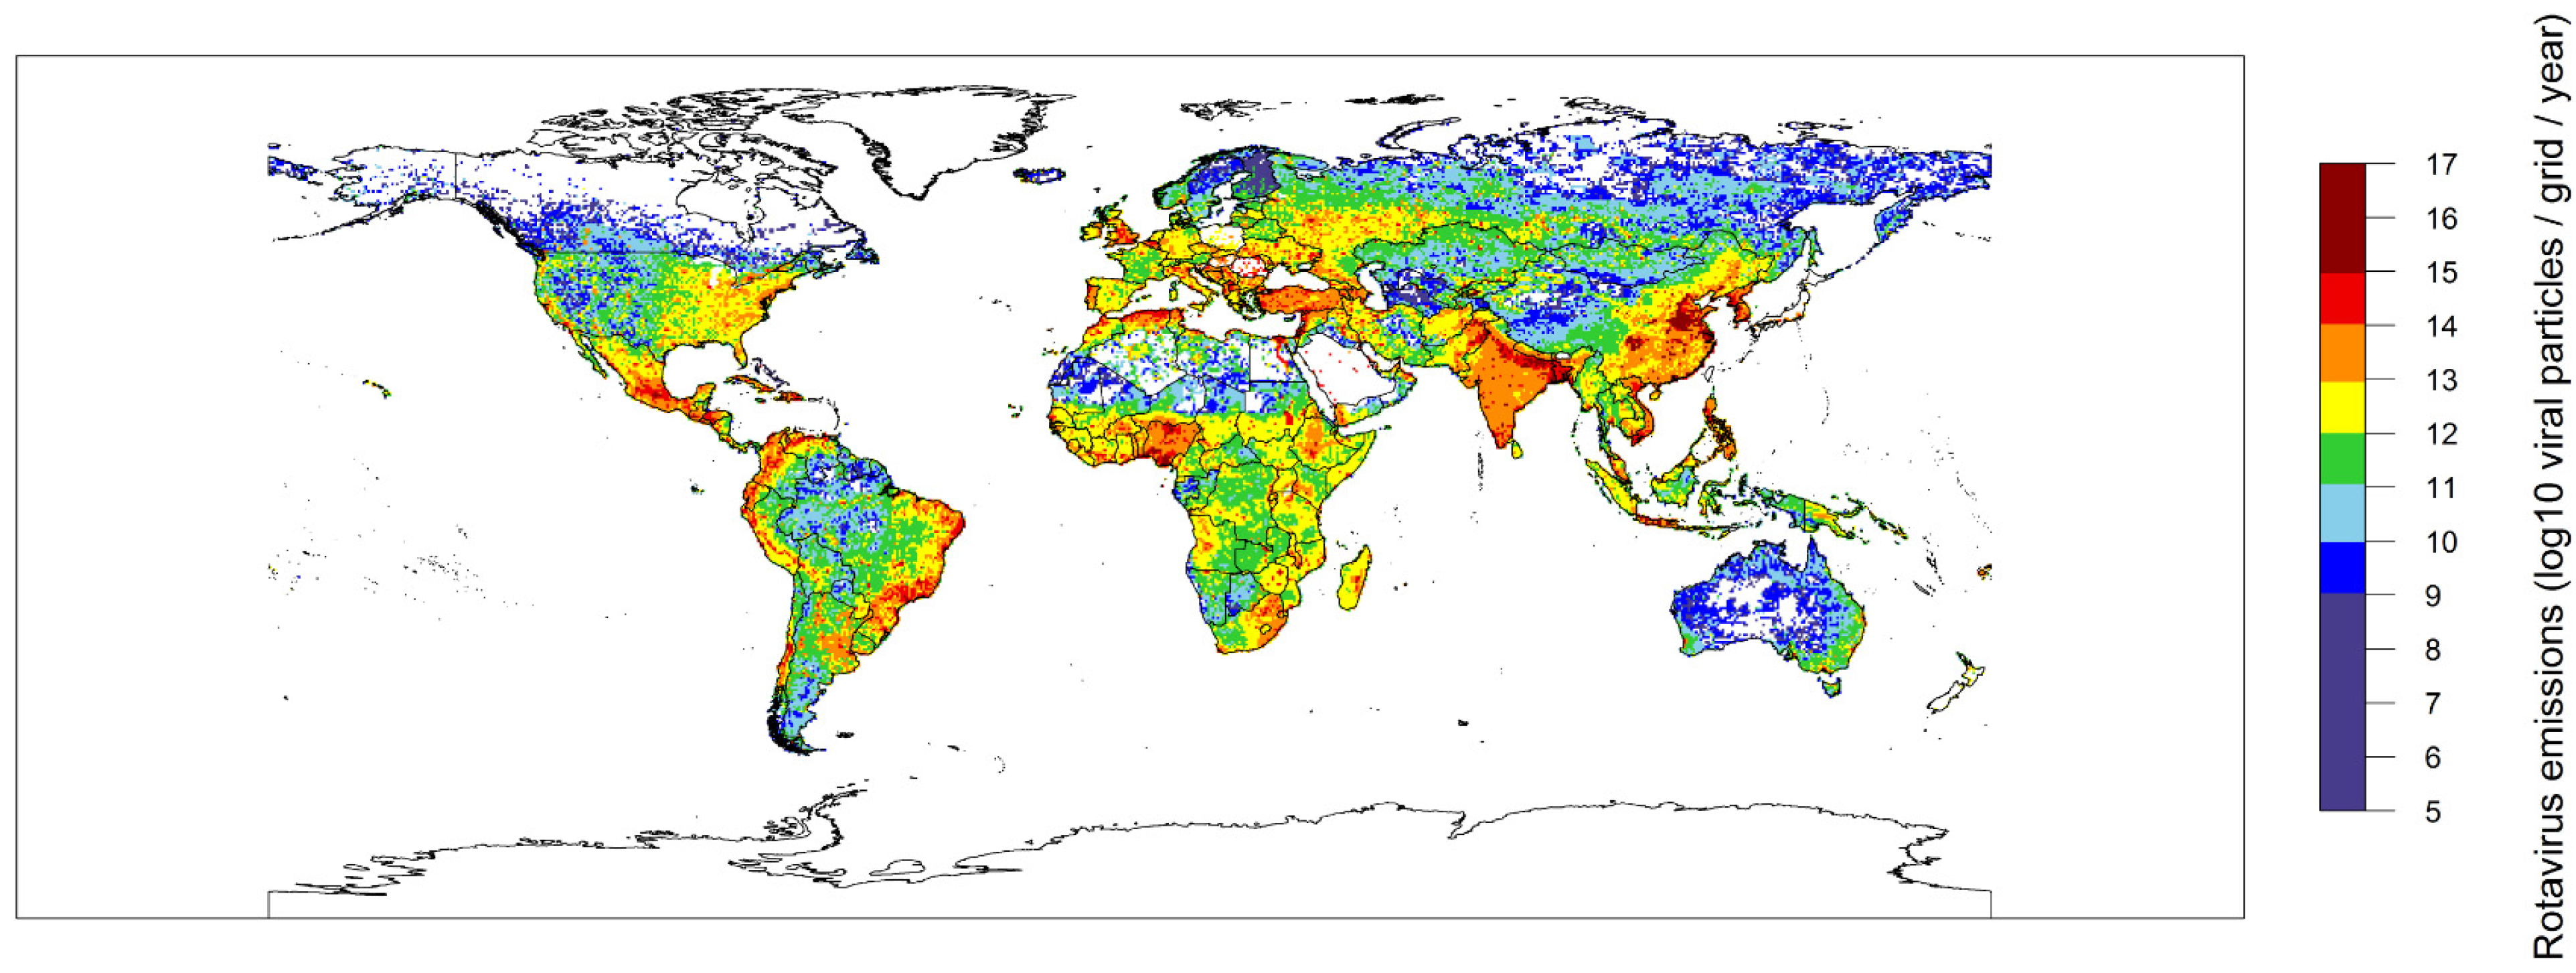
2.2. Global Rotavirus Emissions

We have used the excretion rates and removal fractions distilled from the literature in Section 2.1.1 to develop the GloWPa-Rota model. This model is explained in detail in Section 4.2. The model was used to produce an emission map (Figure 1). This map shows the global distribution of human RV emissions per 0.5 × 0.5 latitude × longitude grid (based on 2010 data for population, access to sanitation and waste water treatment (none, primary, primary + secondary, or primary + secondary + tertiary). Total global RV emissions are 2 × 10¹⁸ viral particles/year, of which 87% is produced by the urban population. Urban areas also stand out in Figure 1. High emissions are observed in urban areas in Bangladesh, East China, India, Korea, Turkey, Nigeria, the northern part of Algeria, the UK, Belgium, Mexico, Colombia and coastal Brazil. Low emissions are observed in rural areas in Canada, Scandinavia, Russia, China, the Sahel and Australia. Main drivers for the spatial differences in emissions are population size in a grid, sanitation type and removal by wastewater treatment plants.
Figure 1. Total RV emissions in log10 viral particles per grid (based on data for approximately the year 2010).
Pathogens 04 00229 g001
We zoom in on two example countries to get an understanding of the spatial differences. We picked Nigeria as an example of a country with high concentrations of RV emissions and the United Kingdom (UK) as an example of an industrialized country with relatively high emissions. Total emissions in Nigeria are 1.1 × 10¹⁷ and in the UK 8.9 × 10¹⁵. For Nigeria 18% and for the UK 13% of total emissions by the population reach the surface water. The population of Nigeria (158 million people, 50% urban) is much larger than that of the UK (62 million, 78% urban) and the sanitation types are very different. The sanitation types are summarized in the categories ‘connected to sewer’, ‘direct emissions’, ‘diffuse emissions’ and ‘non source’ as explained in Section 4.2. In urban areas in Nigeria, only 18.8% of the population is connected to a sewer and there is no treatment available. In rural areas, only 3.8% of the population is connected to a sewer without treatment [121]. In total, 24.7% of the urban and 3.3% of the rural population emit directly into surface water. In rural areas, 39.8% of the people produce diffuse emissions. The remaining people in Nigeria have access to septic tanks or pit latrines and we assume their emissions do not enter the surface water (non-source). In the UK in urban areas 100% of the population is connected to a sewer system and in rural areas 73% (the remaining 27% is a non-source) and they have access to no (9%), primary (9%), primary + secondary (56%) or primary + secondary + tertiary (26%) treatment, respectively.
The difference in access to sanitation types is immediately visible when looking at the fraction of emissions caused by people with access to the different sanitation types (Figure 2). In both regions, the majority of the emissions comes from urban areas (85% in Nigeria; 84% in the UK). In Nigeria, 59% are direct emissions, but since there is no treatment, also the emissions from the population connected to sewers are actually direct emissions. Rural emissions are mostly from the population connected to sewers (5% in Nigeria and 16% in the UK) and direct emissions (8% in Nigeria). Only a small part of the emissions in Nigeria (2%) are diffuse emissions. This number is relatively low; the percentage of the feces on the land that enters the surface water is assumed to be only 2.5% (see Section 4.2).
Figure 2. Fraction of the emissions caused by population with access to the different sanitation types for Nigeria (top) and UK (bottom).
Pathogens 04 00229 g002
We have also studied the differences in emissions between age groups. Children under two years of age are more susceptible to RV and they shed much more viruses in their feces than other age groups, who often have more asymptomatic shedding. Figure 3 provides the pie charts for Nigeria and the UK. The difference between both countries is remarkable. In Nigeria the population younger than five years of age is responsible for 80% of the emissions, while in the UK the same age category only produces 21% of the emissions. The main variables driving this difference are the higher percentage of children under five years of age in Nigeria (17.5% compared to 6.3% in the UK), the RV incidence rate in children under five that is assumed to be higher in Nigeria (0.24) than in the UK (0.08) and the assumption that in the UK all children under 2.5 years of age wear nappies, while in Nigeria only the children under 2.5 years of age with access to a sewer do.
Figure 3. Fraction of the emissions caused by population from the age categories under five and over five for Nigeria (top) and the UK (bottom).
Pathogens 04 00229 g003

3. Discussion and Conclusions

To our knowledge, this is the first paper estimating the global distribution of RV emissions, which we believe will serve as an example for a number of important waterborne pathogens. There is a significant need to understand biological water quality and the concentration of pathogens in global water systems. This knowledge base is needed to create an efficient framework for achieving the new Sustainable Development Goals directed toward progress in sanitation and drinking water safety. Thirty years ago, Feachem et al. [122] synthesized existing scientific knowledge on the occurrence and persistence of pathogens in the environment. Since its publication, this document has been the key reference point for the development of quantitative guidance for safe drinking water and sanitation practices including defining safe and unsafe activities, evaluation of low technology treatment and disposal options, and for addressing adequate controls for protection of health. Over the past decades, there has been a dramatic increase in knowledge and data regarding emerging pathogens, new technologies for measuring pathogens, new information on pathogen occurrence and persistence, and new interventions. A global consortium of researchers in the field of health-related water microbiology are committed to updating and producing a new resource, so that the knowledge can be translated into life-saving interventions. The paper contributes to this global water pathogen project (GWPP) [123], which aims to obtain a better understanding of occurrence, fate and transport of pathogens in sewage and surface water ultimately used to define the risks associated with the emissions of pathogens to surface water from fecal wastes and wastewater.
The RV map shows global coverage of emissions, except for some very remote areas in deserts or at high latitudes. Emissions are highest in urban areas and in most countries these account for the majority of the emissions. Reasons for this include the population density in these regions and the fact that emissions by the population not connected to sewer systems are assumed to be direct emissions to surface waters in our model. However, one of the main determining factors for the order of magnitude of the emissions calculated by our model is the excretion rate, which is estimated based on the literature. A wide shedding range is quoted (>1010–1012 per gram feces) but good data on RV shedding by symptomatic or asymptomatic children and adults are limited. The shedding rates are related to the age and distribution over the course of the infection [19,21,88]. The range was found to be too high for an average to explain the concentrations found in sewage. We therefore used a reverse calculation from sewage concentrations and infection rates to determine the excretion rate per RV illness case per year.
Other determining variables for the emission maps are the RV incidence and the removal by wastewater treatment. We extracted these data from the literature as explained in Section 2.1. Data on RV incidence are limited and what is available shows considerable differences in incidence between study populations and countries. Similarly, for RV removal by wastewater treatment data availability is limited and virus removal rates vary between virus and treatment system. Also, the coverage data of primary, secondary or tertiary treatment in a country do not specify lagoons or disinfection. Additional data on RV incidence in the general population, RV removal by wastewater treatment and on treatment coverage would increase the robustness of the estimated emissions.
The results of our analysis show that some areas have relatively low emissions, because a large part of their population use septic tanks or pit latrines that have limited influence on surface water quality and hence were classified as a non-source in our model. That may be an underestimation, as often these tanks and latrines are emptied and their contents either treated or dumped in the surface water directly. Obviously, the excreta will have had a residence time in the tanks or latrines, reducing the RV concentrations, but still some RV may enter the surface water via this route.
The emission maps are a first step towards a better understanding of RV hotspots. In future studies, the emissions could be converted to surface water concentrations to enable risk assessment. Moreover, scenario analysis could be performed. Such an analysis could study how RV concentrations change if vaccination is applied that strongly reduces the RV incidence in children under five years of age as is indicated in the literature [49,51,53], if immunity in the population is included, or if specified sanitation strategies are implemented. Such management strategies could include improved sanitation for all, tertiary treatment that includes disinfection and other combinations of treatment improvements for different countries. Finally, the seasonality of RV surface water concentrations could be studied further. This seasonality is visible from the sewage concentrations (Table 3) and influences the treatment required to reduce the health risk.
Our analysis can be used to evaluate different sanitation scenarios also on country level. The analysis of UK and Nigeria suggests that connecting the population to sewers may even increase emissions to surface water, if the sewage is not properly treated. Connection to sewers of people that previously used a latrine or open defecation will now take RV and other pathogens to surface water. Even in the UK, where almost everyone is connected to a sewer, but where only a limited percentage of the sewage is treated by tertiary treatment, emissions are considerable. Very few countries have full coverage with tertiary treatment that includes disinfection. This would be essential to reduce RV emissions to surface water. The focus of the SDGs on ending open defecation may therefore result in increased emissions to surface water unless it is planned in conjunction with improved wastewater treatment to protect water resources.
Rotavirus is a major source of diarrheal infection worldwide. This paper provides insight in the spatial differences and hotspot areas in the RV emissions and opens the possibility of scenario analysis to evaluate alternative sanitation strategies. Hotspot areas include urban areas in densely populated parts of the world, such as Bangladesh and Nigeria, while low emissions are estimated in rural areas with low population density, such as in northern Russia or the Australian desert. Modeling exercises like the one presented in this paper provide unique opportunities to further study these emissions to surface water, their sources and scenarios for improved management.

4. Experimental Section

4.1. Literature Review

4.1.1. Search Strategy

We searched for all studies reporting the epidemiology and occurrence of RVs in pediatrics in online databases, including Google Scholar, PubMed, PubMed Central, Science Direct and the citation tracking system of related articles thorough Thomson Reuters’ Web of Science, for articles published between 2000 and 2014. For the occurrence of RV in untreated sewage, we searched for articles published from 2008 to 2014. To estimate the RV removal by wastewater treatment, we searched literature of 2005 to 2015. Only relatively recent studies were included since molecular virus detection methods in sewage have evolved rapidly over the past decade. We restricted the search to only the articles published in the English Language. We used key words/subject terms, including one or combinations of the following: “Rotavirus infection AND humans”, “diarrhea or diarrhea”, “global epidemiology of rotavirus” and/or “acute gastroenteritis OR diarrhea”, “burden of rotavirus infection”, “rotavirus in Africa AND Asia, Europe, America, and Australia”. We also used the articles identified by using the PubMed option of related articles and manually checked the reference lists of the original and review articles.
We used the same search strategy for occurrence of RV in untreated sewage using keywords like “rotavirus AND sewage”, “occurrence of rotavirus in sewage”, “surveillance of rotavirus in sewage”, “molecular characterization of rotavirus in sewage”. In most cases, we had to read the articles to identify cases where only untreated sewage or influent was reported. We also included the papers that reported concentration of RVs in sewage.
To get an understanding of the removal rates by wastewater treatment, we used the keywords “wastewater” or “sewage” and “treatment and rotavirus”. Only few papers were found that included RV and therefore we extended the search to other viruses.

4.1.2. Quality Assessment

To assess the quality of the articles all the entries were checked and edited, including the clinical demographic data. Articles that were selected were assessed for quality data by looking at the data presentation. Experiences as part of the WHO RV surveillance team and facilitation of data quality assessment using WHO checklist and guidelines used for the global surveillance of RV helped to judge the assessment quality.

4.2. Explanation of the GloWPa-Rota H1 Model

We estimate human emissions for RV based on the approach of Hofstra et al. [58] used for Cryptosporidium. This exploration of global Cryptosporidium emissions used the preliminary version of the Global Waterborne Pathogen (GloWPa) model that we present here for RV. We use the updated version of the human emissions part of the model that is in Vermeulen et al. [124] applied in a case study for India and Bangladesh. The updated version improves the model by including emission from people not connected to sewer systems in the model.
We present here the GloWPa-Rota H1 model (Global Waterborne Pathogen model for RV version 1 for Human emissions). Humans, through their feces, are the only source of RV. We estimated human emissions for the year 2010 based on population, sanitation availability and excretion by the population. The base equation for the calculation for a country is:
T o t a l   h u m a n   e m i s s i o n s   H = P × f s a n × V p × f s w
Where P is the population of the country, fsan the fraction of the population using a particular type of sanitation facilities (connected to sewer, direct emissions, emissions on the land), Vp is the viral particles excretion rate per person, as explained in Section 2.1 and fsw the fraction that reaches the surface water (and is not removed by waste water treatment or left behind on the land).
We estimate emissions for different age categories: 0–4 years, 5–15 years, 15–25 years and 25+ years of age, because diarrheal incidence and prevalence of RV are different for each age category:
H =   a g e = < 5 25 + H a g e
Where age is the age category (<5, 5–14, 15–25 and 25+ years of age).
We estimate emissions separately for urban and rural areas, because sanitation is different in each area. Additionally, we assume that in the industrial countries (Human Development Index (HDI) > 0.785) all children use nappies until the age of 2.5 and their feces are thrown away and therefore are not emitted in the sewage, while in developing countries (HDI < 0.785) only children under 2.5 years of age living in households that are connected to sewers wear nappies. To allow for the nappies and a lower weight of stools, the equations for H<5 are different from the other age categories:
H < 5 = { ( C E u , < 5 +   C E r , < 5 + D E u , < 5 + D E r , < 5 + D i f E r , < 5 ) / 2   i f   H D I > 0.785 C E u , < 5 2 + C E r , < 5 2 + D E u , < 5 + D E r , < 5 + D i f E r , < 5   i f   H D I < 0.785
H a g e = C E u , a g e +   C E r , a g e + D E u , a g e + D E r , a g e + D i f E r , a g e   f o r   a g e = 5 14 ,   15 25   a n d   25 +
Where CE are the emissions from people connected to sewer systems in urban (u) and rural (r) areas, DE are direct emissions from people with hanging toilets (both urban and rural) and without sanitary facilities (urban areas only). Finally, DifE are emissions from people defecating on the land in rural areas. We assume that emissions from people using septic tanks and pit latrines do not reach the surface water.
For each emission category, emissions are calculated as follows:
C o n n e c t e d   e m i s s i o n s   u r b a n   CE u,age   =   P u × f a g e × f c u × V p , a g e ×   ( 1 f r e m )
C o n n e c t e d   e m i s s i o n s   r u r a l   CE r,age   = P r ×   f a g e ×   f c r × V p , a g e ×   ( 1 f r e m )
D i r e c t   e m i s s i o n s   u r b a n   DE u,age   = P u ×   f a g e ×   f d u × V p , a g e
D i r e c t   e m i s s i o n s   r u r a l   DE r,age   = P r ×   f a g e ×   f d r × V p , a g e
D i f f u s e   e m i s s i o n s   r u r a l   DifE r,age   = P r ×   f a g e ×   f d i f r × V p , a g e × f r u n
Where:
-
Pu and Pr are the total urban and rural population of a country, respectively.
-
fage the fraction of the population for the age categories (<5, 5–14, 15–25 and 25+)(−).
-
fcu and fcr are the fractions of the urban and rural populations using sanitation that is connected to a sewer system (−).
-
fdu and fdr are the fractions of the urban and rural populations using sanitation that is a direct source (−). As explained in Vermeulen et al. [124], this includes WHO/UNICEF Joint Monitoring Programme (JMP) sanitation types hanging toilets (for both urban and rural population) and no facility, bush, field, unknown, elsewhere, other unimproved (for urban population only).
-
fdifr is the fraction of the rural population that has no sanitation facilities and forms a diffuse source (−). This includes JMP sanitation type no facility, bush, field, unknown, elsewhere, other unimproved Vermeulen et al. [124].
-
frun is the fraction of feces transported with runoff from land to surface water (−). frun is assumed to be 0.025, which is the median value for animal manure mobilization estimated in Ferguson et al. [125]. The actual RV mobilization depends on wet weather events, runoff amounts, dry weather duration, manure accumulation on the land and survival in the manure. Such an in-depth analysis is a step too far for this paper, so we assume RV mobilization is comparable to animal manure mobilization. That may be a slight overestimation.
-
Vp,age is the average viral particle excretion (viral particles person−1·year−1). Vp differs for the age categories and is calculated as described in Section 2.1.1.
-
frem is the fraction of viral particles removed by wastewater treatment (−). frem is calculated as described below (Equation (10).
See Table 5 for data sources of the variables used in the model.
The wastewater of the people connected to sewer systems may be treated in a wastewater treatment plant. The removal depends on the type of treatment (no treatment, primary, primary + secondary or primary +secondary + tertiary). For each country the removal is estimated as follows:
f rem = f p × R E p + f s × R E s + f t × R E t
Where fp, fs and ft are the fraction of primary, secondary and tertiary wastewater treatment systems in a country, respectively (see Table 5), and REp, REs and REt are the removal efficiencies for primary, secondary and tertiary wastewater treatment systems, respectively (−). The removal efficiencies are estimated from the literature as explained in Section 2.1.3 at 0.2, 0.975, and 0.9921, for primary, primary + secondary and primary + secondary + tertiary treatment, respectively.
After the human emissions (H) are calculated for each country, we spatially distribute the country data over a 0.5 × 0.5 degree latitude × longitude grid. We spatially identify a country’s urban and rural population via density ranking, where the population in the most densely populated grid cells is defined as urban, based on a LandScan 2010 density map [126]. We assume that among a population defined as urban or rural, sanitation is distributed equally, proportional to the occurrence of different sanitation types. All age categories are distributed equally over the grids.
Table 5. Data sources.
VariableVariable NameData Source
PPopulation[127]
PuUrban populationUrban fraction x P
PrRural population(1 − urban fraction) × P
fageFraction of the population younger than 5 years of age, from 5 to 14, from 15 to 25 and older than 25.UN World Population Prospects [128]
HDIHuman Development Index[129]
fcu, fcr
fdu, fdr
fdifr
Fraction connected (urban and rural)
Fraction direct (urban and rural)
Fraction diffuse (rural only)
WHO/UNICEF JMP data [121], www.wssinfo.org). Year closest to 2010 was taken from JMP country files. When unavailable, fractions were estimated based on the fraction connected used in Van Puijenbroek et al. [130], which were based on WHO/UNICEF [121] supplemented with data from [131,132,133]. When incomplete (mostly missing values only around 0.01–0.02), missing values were added to non-source, or in case non-source was non-existing, to the category with the highest fraction.
fp, fs and ft Fraction primary, primary + secondary and primary + secondary + tertiary treatment[131,132,133] as explained in Van Puijenbroek et al. [130]
Population density in a grid cellLandScan 2010 data [126]

Acknowledgments

Nicholas M. Kiulia acknowledges the Michigan State University Midland Research Institute for Value Chain Creation for supporting his PhD program.

Author Contributions

N.M.K. and M.O.A. carried out literature review, data extraction and data analysis for Table 1 and Table 2. G.M. performed the literature review for Table 3 and Table 4. N.H. and L.C.V. applied the GloWPa model for rotavirus. N.M.K., N.H. drafted the manuscript. J.B.R. and G.M. edited the manuscript and data analysis. All authors gave final approval of the version to be published.

Conflicts of Interest

The authors declare no conflict of interest.

References

  1. Onda, K.; LoBuglio, J.; Bartram, J. Global access to safe water: Accounting for water quality and the resulting impact on MDG progress. Int. J. Environ. Res. Public Health 2012, 9, 880–894. [Google Scholar] [CrossRef] [PubMed]
  2. Ashbolt, N.J. Microbial contamination of drinking water and disease outcomes in developing regions. Toxicology 2004, 198, 229–238. [Google Scholar] [CrossRef] [PubMed]
  3. Moe, C.L.; Rheingans, R.D. Global challenges in water, sanitation and health. J. Water Health 2006, 4, 41. [Google Scholar] [PubMed]
  4. WHO. Progress on Drinking-Water and Sanitation–2012 Update" Launched on 6 March 2012; World Health Organization: Geneva, Switzerland, 2012. [Google Scholar]
  5. WHO/UNICEF. Joint Monitoring Programme (JMP) for Water Supply and Sanitation, Progress on Sanitation and Drinking-Water, 2013 Update; WHO/UNICEF: Geneva, Switzerland, 2013. [Google Scholar]
  6. WHO/UNICEF. Joint Monitoring Programme (JMP) for Water Supply and Sanitation, Progress on Sanitation and Drinking-Water, 2014 Update; WHO/UNICEF: Geneva, Switzerland, 2014. [Google Scholar]
  7. WHO. Global Health Observatory Data Repository. Mortality and Global Health Estimates: Child Mortality: Causes of Child Death: Number of Deaths by Cause: By Region: World: Diarrhoeal Diseases; World Health Organization: Geneva, Switzerland, 2012. [Google Scholar]
  8. Walker, C.L.; Rudan, I.; Liu, L.; Nair, H.; Theodoratou, E.; Bhutta, Z.A.; O’Brien, K.L.; Campbell, H.; Black, R.E. Global burden of childhood pneumonia and diarrhea. Lancet 2013, 381, 1405–1416. [Google Scholar] [CrossRef] [PubMed]
  9. United Nations. Inter-Agency Group for Child Mortality Estimation. Levels & Trends in Child Mortality, Report 2013. New York: United Nations Children’s Fund. Available online: http://www.childinfo.org/files/Child_Mortality_Report_2013.pdf (accessed on 16 March 2015).
  10. WHO/UNICEF. First Consultation on post-2015 Monitoring of Drinking-Water and Sanitation; WHO/UNICEF: Geneva, Switzerland, 2011. [Google Scholar]
  11. Baum, R.; Luh, J.; Bartram, J. Sanitation: A global estimate of sewerage connections without treatment and the resulting impact on MDG progress. Environ. Sci. Technol. 2013, 47, 1994–2000. [Google Scholar] [CrossRef] [PubMed]
  12. United Nations. Open Working Group Proposal for Sustainable Development Goals. Available online: https://sustainabledevelopment.un.org/sdgsproposal (accessed on 10 March 2015).
  13. La Rosa, G.; Fratini, M.; della Libera, S.; Iaconelli, M.; Muscillo, M. Emerging and potentially emerging viruses in water environments. Ann. Ist. Super. Sanita 2012, 48, 397–406. [Google Scholar] [CrossRef] [PubMed]
  14. Bishop, R.F.; Davidson, G.P.; Holmes, I.H.; Ruck, B.J. Virus particles in epithelial cells of duodenal mucosa from children with acute non-bacterial gastroenteritis. Lancet 1973, 2, 1281–1283. [Google Scholar] [CrossRef] [PubMed]
  15. Estes, M.; Kapikian, A. Rotaviruses. In Fields Virology, 5th ed.; Knipe, D.M., Howley, P.M., Griffin, D.E., Lamb, R.A., Martin, M.A., Roizman, B., Straus, S.E., Eds.; Wolters Kluwer/Lippincott, Williams and Wilkins: Philadelphia, PA, USA, 2007; Volume 2, pp. 1917–1974. [Google Scholar]
  16. Tate, J.E.; Burton, A.H.; Boschi-Pinto, C.; Steele, A.D.; Duque, J.; Parashar, U.D. 2008 estimate of worldwide rotavirus-associated mortality in children younger than 5 years before the introduction of universal rotavirus vaccination programmes: A systematic review and meta-analysis. Lancet Infect. Dis. 2012, 12, 136–141. [Google Scholar] [CrossRef] [PubMed]
  17. QMRAwiki. Available online: Http://qmrawiki.Canr.Msu.Edu/index.Php/rotavirus:_dose_response_models (accessed on 16 March 2015).
  18. O’Ryan, M.L.; Lucero, Y.; Vidal, R. Enteric viruses in wastewaters: An interesting approach to evaluate the potential impact of rotavirus vaccination on viral circulation. Expert Rev. Vaccines 2012, 11, 419–422. [Google Scholar] [CrossRef] [PubMed]
  19. Bishop, R.F. Natural history of human rotavirus infection. Arch. Virol. Suppl. 1996, 12, 119–128. [Google Scholar] [PubMed]
  20. Ward, R.L.; Bernstein, D.I.; Young, E.C.; Sherwood, J.R.; Knowlton, D.R.; Schiff, G.M. Human rotavirus studies in volunteers: Determination of infectious dose and serological response to infection. J. Infect. Dis. 1986, 154, 871–880. [Google Scholar] [CrossRef] [PubMed]
  21. WHO. Generic portocols for (i) hospital-based surveillance to estimate the burden of rotavirus gastroenteritis in children and (ii) a community-based survey on utilization of health care services for gastroenteritis in children: Field test version. 2002. [Google Scholar]
  22. Caceres, V.M.; Kim, D.K.; Bresee, J.S.; Horan, J.; Noel, J.S.; Ando, T.; Steed, C.J.; Weems, J.J.; Monroe, S.S.; Gibson, J.J. A viral gastroenteritis outbreak associated with person-to-person spread among hospital staff. Infect. Control Hosp. Epidemiol. 1998, 19, 162–167. [Google Scholar] [CrossRef] [PubMed]
  23. Wikswo, M.E.; Hall, A.J. Outbreaks of acute gastroenteritis transmitted by person-to-person contact--United States, 2009–2010. MMWR Surveill. Summ. 2012, 61, 1–12. [Google Scholar] [PubMed]
  24. CDC. Foodborne outbreak of group A rotavirus gastroenteritis among college students--District of Columbia, March-April 2000. MMWR Morb. Mortal. Wkly. Rep. 2000, 49, 1131–1133. [Google Scholar]
  25. Mwenda, J.M.; Ntoto, K.M.; Abebe, A.; Enweronu-Laryea, C.; Amina, I.; McHomvu, J.; Kisakye, A.; Mpabalwani, E.M.; Pazvakavambwa, I.; Armah, G.E.; et al. Burden and epidemiology of rotavirus diarrhea in selected African countries: Preliminary results from the African Rotavirus Surveillance Network. J. Infect. Dis. 2010, 202 (Suppl.), S5–S11. [Google Scholar] [CrossRef]
  26. Lee, R.M.; Lessler, J.; Lee, R.A.; Rudolph, K.E.; Reich, N.G.; Perl, T.M.; Cummings, D.A. Incubation periods of viral gastroenteritis: A systematic review. BMC Infect. Dis. 2013, 13, 446. [Google Scholar] [CrossRef] [PubMed]
  27. Parashar, U.D.; Burton, A.; Lanata, C.; Boschi-Pinto, C.; Shibuya, K.; Steele, D.; Birmingham, M.; Glass, R.I. Global mortality associated with rotavirus disease among children in 2004. J. Infect. Dis. 2009, 200 (Suppl. 1), S9–S15. [Google Scholar] [CrossRef] [PubMed]
  28. Anandan, S.; Peter, R.; Aramugam, R.; Ismail, N.; Veeraraghavan, B.; Kang, G. Group A rotavirus gastroenteritis in older children and adults at a hospital in Southern India. Vaccine 2014, 32 (Suppl. 1), A33–A35. [Google Scholar] [CrossRef] [PubMed]
  29. Anderson, E.J.; Weber, S.G. Rotavirus infection in adults. Lancet Infect. Dis. 2004, 4, 91–99. [Google Scholar] [CrossRef] [PubMed]
  30. Gastanaduy, P.A.; Curns, A.T.; Parashar, U.D.; Lopman, B.A. Gastroenteritis hospitalizations in older children and adults in the United States before and after implementation of infant rotavirus vaccination. JAMA 2013, 310, 851–853. [Google Scholar] [CrossRef] [PubMed]
  31. Nakajima, H.; Nakagomi, T.; Kamisawa, T.; Sakaki, N.; Muramoto, K.; Mikami, T.; Nara, H.; Nakagomi, O. Winter seasonality and rotavirus diarrhea in adults. Lancet 2001, 357, 1950. [Google Scholar] [CrossRef] [PubMed]
  32. WHO. Rotavirus vaccines. WHO position paper—January 2013. Wkly. Epidemiol. Rec. 2013, 88, 49–64. [Google Scholar]
  33. Grabow, W.O.K. Overview of health- related water virology. Hum. Viruses Water 2007, 17, 1–25. [Google Scholar]
  34. Mellou, K.; Katsioulis, A.; Potamiti-Komi, M.; Pournaras, S.; Kyritsi, M.; Katsiaflaka, A.; Kallimani, A.; Kokkinos, P.; Petinaki, E.; Sideroglou, T.; et al. A large waterborne gastroenteritis outbreak in Central Greece, March 2012: Challenges for the investigation and management. Epidemiol. Infect. 2014, 142, 40–50. [Google Scholar]
  35. Gallay, A.; De Valk, H.; Cournot, M.; Ladeuil, B.; Hemery, C.; Castor, C.; Bon, F.; Megraud, F.; Le Cann, P.; Desenclos, J. A large multi-pathogen waterborne community outbreak linked to fecal contamination of a groundwater system, France, 2000. Clin. Microbiol. Infect. 2006, 12, 561–570. [Google Scholar] [CrossRef] [PubMed]
  36. Borchardt, M.A.; Haas, N.L.; Hunt, R.J. Vulnerability of drinking-water wells in La Crosse, Wisconsin, to enteric-virus contamination from surface water contributions. Appl. Environ. Microbiol. 2004, 70, 5937–5946. [Google Scholar] [CrossRef] [PubMed]
  37. Koroglu, M.; Yakupogullari, Y.; Otlu, B.; Ozturk, S.; Ozden, M.; Ozer, A.; Sener, K.; Durmaz, R. A waterborne outbreak of epidemic diarrhea due to group A rotavirus in Malatya, Turkey. Microbiol. Q. J. Microbiol. Sci. 2011, 34, 17. [Google Scholar]
  38. Villena, C.; Gabrieli, R.; Pinto, R.; Guix, S.; Donia, D.; Buonomo, E.; Palombi, L.; Cenko, F.; Bino, S.; Bosch, A. A large infantile gastroenteritis outbreak in Albania caused by multiple emerging rotavirus genotypes. Epidemiol. Infect. 2003, 131, 1105–1110. [Google Scholar] [CrossRef] [PubMed]
  39. Martinelli, D.; Prato, R.; Chironna, M.; Sallustio, A.; Caputi, G.; Conversano, M.; Ciofi Degli Atti, M.; DLAncona, F.; Germinario, C.; Quarto, M. Large outbreak of viral gastroenteritis caused by contaminated drinking water in Apulia, Italy, May-October 2006. Euro Surveill. 2007, 12, E070419. [Google Scholar] [PubMed]
  40. Kiulia, N.M.; Netshikweta, R.; Page, N.A.; Van Zyl, W.B.; Kiraithe, M.M.; Nyachieo, A.; Mwenda, J.M.; Taylor, M.B. The detection of enteric viruses in selected urban and rural river water and sewage in Kenya, with special reference to rotaviruses. J. Appl. Microbiol. 2010, 109, 818–828. [Google Scholar] [CrossRef] [PubMed]
  41. Van Zyl, W.B.; Page, N.; Grabow, W.; Steele, A.D.; Taylor, M.B. Molecular epidemiology of group A rotaviruses in water sources and selected raw vegetables in Southern Africa. Appl. Environ. Microbiol. 2006, 72, 4554–4560. [Google Scholar] [CrossRef] [PubMed]
  42. Gratacap-Cavallier, B.; Genoulaz, O.; Brengel-Pesce, K.; Soule, H.; Innocenti-Francillard, P.; Bost, M.; Gofti, L.; Zmirou, D.; Seigneurin, J. Detection of human and animal rotavirus sequences in drinking water. Appl. Environ. Microbiol. 2000, 66, 2690–2692. [Google Scholar] [CrossRef] [PubMed]
  43. Rutjes, S.; Lodder, W.; Van Leeuwen, A.D.; de Roda Husman, A. Detection of infectious rotavirus in naturally contaminated source waters for drinking water production. J. Appl. Microbiol. 2009, 107, 97–105. [Google Scholar] [CrossRef] [PubMed]
  44. Sinclair, R.; Jones, E.; Gerba, C. Viruses in recreational water-borne disease outbreaks: A review. J. Appl. Microbiol. 2009, 107, 1769–1780. [Google Scholar] [CrossRef] [PubMed]
  45. Ruggeri, F.M.; Fiore, L. Advances in understanding of rotaviruses as food- and waterborne pathogens and progress with vaccine developmen. In Viruses in Food and Water: Risks, Surveillance and Control; Cook, N., Ed.; Woodhead Publ Ltd: Cambridge, UK, 2013; pp. 362–400. [Google Scholar]
  46. Glass, R.I.; Parashar, U.D.; Bresee, J.S.; Turcios, R.; Fischer, T.K.; Widdowson, M.A.; Jiang, B.; Gentsch, J.R. Rotavirus vaccines: Current prospects and future challenges. Lancet 2006, 368, 323–332. [Google Scholar] [CrossRef] [PubMed]
  47. Tate, J.E.; Patel, M.M.; Steele, A.D.; Gentsch, J.R.; Payne, D.C.; Cortese, M.M.; Nakagomi, O.; Cunliffe, N.A.; Jiang, B.; Neuzil, K.M.; et al. Global impact of rotavirus vaccines. Expert Rev. Vaccines 2010, 9, 395–407. [Google Scholar] [CrossRef] [PubMed]
  48. Linhares, A.C.; Justino, M.C. Rotavirus vaccination in Brazil: Effectiveness and health impact seven years post-introduction. Expert Rev. Vaccines 2014, 13, 43–57. [Google Scholar] [CrossRef] [PubMed]
  49. Msimang, V.M.; Page, N.; Groome, M.J.; Moyes, J.; Cortese, M.M.; Seheri, M.; Kahn, K.; Chagan, M.; Madhi, S.A.; Cohen, C. Impact of rotavirus vaccine on childhood diarrheal hospitalization after introduction into the South African public immunization program. Pediatr. Infect. Dis. J. 2013, 32, 1359–1364. [Google Scholar] [CrossRef] [PubMed]
  50. Kollaritsch, H.; Kundi, M.; Giaquinto, C.; Paulke-Korinek, M. Rotavirus vaccines: A story of success. Clin. Microbiol. Infect. 2015. [Google Scholar] [CrossRef]
  51. Rha, B.; Tate, J.E.; Payne, D.C.; Cortese, M.M.; Lopman, B.A.; Curns, A.T.; Parashar, U.D. Effectiveness and impact of rotavirus vaccines in the United States - 2006–2012. Expert Rev. Vaccines 2014, 13, 365–376. [Google Scholar] [CrossRef] [PubMed]
  52. Giaquinto, C.; Dominiak-Felden, G.; Van Damme, P.; Myint, T.T.; Maldonado, Y.A.; Spoulou, V.; Mast, T.C.; Staat, M.A. Summary of effectiveness and impact of rotavirus vaccination with the oral pentavalent rotavirus vaccine: A systematic review of the experience in industrialized countries. Hum. Vaccines 2011, 7, 734–748. [Google Scholar] [CrossRef]
  53. Karafillakis, E.; Hassounah, S.; Atchison, C. Effectiveness and impact of rotavirus vaccines in Europe, 2006–2014. Vaccine 2015, 33, 2097–2107. [Google Scholar] [CrossRef] [PubMed]
  54. Than, V.T.; Jeong, S.; Kim, W. A systematic review of genetic diversity of human rotavirus circulating in South Korea. Infect. Genet. Evol. 2014, 28, 462–469. [Google Scholar] [CrossRef] [PubMed]
  55. Degiuseppe, J.I.; Parra, G.I.; Stupka, J.A. Genetic diversity of G3 rotavirus strains circulating in Argentina during 1998–2012 assessed by full genome analyses. PLoS ONE 2014, 9, e110341. [Google Scholar] [CrossRef] [PubMed]
  56. Patton, J.T. Rotavirus diversity and evolution in the post-vaccine world. Discov. Med. 2012, 13, 85–97. [Google Scholar] [PubMed]
  57. Gerba, C.P.; Rose, J.B.; Haas, C.N.; Crabtree, K.D. Waterborne rotavirus: A risk assessment. Water Res. 1996, 30, 2929–2940. [Google Scholar] [CrossRef]
  58. Hofstra, N.; Bouwman, A.; Beusen, A.; Medema, G. Exploring global cryptosporidium emissions to surface water. Sci. Total Environ. 2013, 442, 10–19. [Google Scholar] [CrossRef] [PubMed]
  59. Kiulia, N.M.; Nyaga, M.M.; Seheri, M.L.; Wolfaardt, M.; van Zyl, W.B.; Esona, M.D.; Irimu, G.; Inoti, M.; Gatinu, B.W.; Njenga, P.K.; et al. Rotavirus G and P types circulating in the Eastern region of Kenya: Predominance of G9 and emergence of G12 genotypes. Pediatr. Infect. Dis. J. 2014, 33, S85–S88. [Google Scholar] [CrossRef] [PubMed]
  60. Abugalia, M.; Cuevas, L.; Kirby, A.; Dove, W.; Nakagomi, O.; Nakagomi, T.; Kara, M.; Gweder, R.; Smeo, M.; Cunliffe, N. Clinical features and molecular epidemiology of rotavirus and norovirus infections in Libyan children. J. Med. Virol. 2011, 83, 1849–1856. [Google Scholar] [CrossRef] [PubMed]
  61. El Qazoui, M.; Oumzil, H.; Baassi, L.; El Omari, N.; Sadki, K.; Amzazi, S.; Benhafid, M.; El Aouad, R. Rotavirus and norovirus infections among acute gastroenteritis children in Morocco. BMC Infect. Dis. 2014, 14, 300. [Google Scholar] [CrossRef] [PubMed]
  62. Jere, K.C.; Sawyerr, T.; Seheri, L.M.; Peenze, I.; Page, N.A.; Geyer, A.; Steele, A.D. A first report on the characterization of rotavirus strains in Sierra Leone. J. Med. Virol. 2011, 83, 540–550. [Google Scholar] [CrossRef] [PubMed]
  63. Seheri, L.M.; Page, N.; Dewar, J.B.; Geyer, A.; Nemarude, A.L.; Bos, P.; Esona, M.; Steele, A.D. Characterization and molecular epidemiology of rotavirus strains recovered in Northern Pretoria, South Africa during 2003–2006. J. Infect. Dis. 2010, 202, S139–S147. [Google Scholar] [CrossRef] [PubMed]
  64. Hassine-Zaafrane, M.; Sdiri-Loulizi, K.; Ben Salem, I.; Kaplon, J.; Ayouni, S.; Ambert-Balay, K.; Sakly, N.; Pothier, P.; Aouni, M. The molecular epidemiology of circulating rotaviruses: Three-year surveillance in the region of Monastir, Tunisia. BMC Infect. Dis. 2011, 11, 266. [Google Scholar] [CrossRef] [PubMed]
  65. Nyambat, B.; Meng, C.Y.; Vansith, K.; Vuthy, U.; Rin, E.; Kirkwood, C.; Bogdanovic-Sakran, N.; Kilgore, P.E. Hospital-based surveillance for rotavirus diarrhea in Phnom Penh, Cambodia, March 2005 through February 2007. Vaccine 2009, 27, F81–F84. [Google Scholar] [CrossRef] [PubMed]
  66. Ouyang, Y.; Ma, H.; Jin, M.; Wang, X.; Wang, J.; Xu, L.; Lin, S.; Shen, Z.; Chen, Z.; Qiu, Z.; et al. Etiology and epidemiology of viral diarrhea in children under the age of five hospitalized in Tianjin, China. Arch. Virol. 2012, 157, 881–887. [Google Scholar] [CrossRef] [PubMed]
  67. Sai, L.; Sun, J.; Shao, L.; Chen, S.; Liu, H.; Ma, L. Epidemiology and clinical features of rotavirus and norovirus infection among children in Ji’nan, China. Virol. J. 2013, 10, 302. [Google Scholar] [CrossRef] [PubMed]
  68. Mishra, V.; Awasthi, S.; Nag, V.; Tandon, R. Genomic diversity of group A rotavirus strains in patients aged 1–36 months admitted for acute watery diarrhea in Northern India: A hospital-based study. Clin. Microbiol. Infect. 2010, 16, 45–50. [Google Scholar] [CrossRef] [PubMed]
  69. Mathew, M.; Paulose, A.; Chitralekha, S.; Nair, M.; Kang, G.; Kilgore, P. Prevalence of rotavirus diarrhea among hospitalized under-five children. Indian Pediatr. 2014, 51, 27–31. [Google Scholar] [CrossRef] [PubMed]
  70. Babji, S.; Arumugam, R.; Sarvanabhavan, A.; Moses, P.D.; Simon, A.; Aggarwal, I.; Mathew, A.; Sr, A.; Kang, G. Multi-center surveillance of rotavirus diarrhea in hospitalized children <5 years of age in India, 2009–2012. Vaccine 2014, 32 (Suppl. 1), A10–A12. [Google Scholar]
  71. Tiku, V.R.; Sharma, S.; Verma, A.; Kumar, P.; Raghavendhar, S.; Aneja, S.; Paul, V.K.; Bhan, M.K.; Ray, P. Rotavirus diversity among diarrheal children in Delhi, India during 2007–2012. Vaccine 2014, 32 (Suppl. 1), A62–A67. [Google Scholar] [CrossRef] [PubMed]
  72. Aloun, D.S.; Nyambat, B.; Phetsouvanh, R.; Douangboupha, V.; Keonakhone, P.; Xoumphonhphakdy, B.; Vongsouvath, M.; Kirkwood, C.; Bogdanovic-Sakran, N.; Kilgore, P.E. Rotavirus diarrhea among children aged less than 5 years at Mahosot Hospital, Vientiane, LAO PDR. Vaccine 2009, 27 (Suppl. 5), F85–F88. [Google Scholar] [CrossRef] [PubMed]
  73. Moe, K.; Thu, H.M.; Oo, W.M.; Aye, K.M.; Shwe, T.T.; Mar, W.; Kirkwood, C.D. Genotyping of rotavirus isolates collected from children less than 5 years of age admitted for diarrhea at the Yangon Children’s Hospital, Myanmar. Vaccine 2009, 27, F89–F92. [Google Scholar] [CrossRef] [PubMed]
  74. Lee, S.Y.; Hong, S.K.; Lee, S.G.; Suh, C.I.; Park, S.W.; Lee, J.H.; Kim, J.H.; Kim, D.S.; Kim, H.M.; Jang, Y.T.; et al. Human rotavirus genotypes in hospitalized children, South Korea, April 2005 to March 2007. Vaccine 2009, 27 (Suppl. 5), F97–F101. [Google Scholar] [CrossRef] [PubMed]
  75. Shim, J.O.; Son, D.W.; Shim, S.Y.; Ryoo, E.; Kim, W.; Jung, Y.C. Clinical characteristics and genotypes of rotaviruses in a neonatal intensive care unit. Pediatr. Neonatol. 2012, 53, 18–23. [Google Scholar] [CrossRef] [PubMed]
  76. Wu, F.T.; Liang, S.Y.; Tsao, K.C.; Huang, C.G.; Lin, C.Y.; Lin, J.S.; Su, C.Y.; Eng, H.L.; Yang, J.Y.; Chen, P.J.; et al. Hospital-based surveillance and molecular epidemiology of rotavirus infection in Taiwan, 2005–2007. Vaccine 2009, 27 (Suppl. 5), F50–F54. [Google Scholar] [CrossRef] [PubMed]
  77. Kota, M.; Bino, S.; Delogu, R.; Simaku, A.; Neza, B.; Ruggeri, F.M.; Fiore, L. Epidemiology of rotavirus diarrhea in Albania. Arch. Virol. 2014, 159, 2491–2495. [Google Scholar] [CrossRef] [PubMed]
  78. Lorrot, M.; Bon, F.; El Hajje, M.J.; Aho, S.; Wolfer, M.; Giraudon, H.; Kaplon, J.; Marc, E.; Raymond, J.; Lebon, P.; et al. Epidemiology and clinical features of gastroenteritis in hospitalized children: Prospective survey during a 2-year period in a Parisian Hospital, France. Eur. J. Clin. Microbiol. Infect. Dis. 2011, 30, 361–368. [Google Scholar] [CrossRef] [PubMed] [Green Version]
  79. Sanchez-Fauquier, A.; Montero, V.; Colomina, J.; Gonzalez-Galan, V.; Aznar, J.; Aisa, M.L.; Gutierrez, C.; Sainz de Baranda, C.; Wilhelmi, I. Global study of viral diarrhea in hospitalized children in Spain: Results of structural surveillance of viral gastroenteritis network (VIGESS-net) 2006–2008. J. Clin. Virol. 2011, 52, 353–358. [Google Scholar] [CrossRef] [PubMed]
  80. Kargar, M.; Akbarizadeh, A.R. Prevalence and molecular genotyping of group A rotaviruses in Iranian children. Indian J. Virol. 2012, 23, 24–28. [Google Scholar] [CrossRef] [PubMed]
  81. Muhsen, K.; Shulman, L.; Rubinstein, U.; Kasem, E.; Kremer, A.; Goren, S.; Zilberstein, I.; Chodick, G.; Ephros, M.; Cohen, D.; et al. Incidence, characteristics, and economic burden of rotavirus gastroenteritis associated with hospitalization of Israeli children <5 years of age, 2007–2008. J. Infect. Dis. 2009, 200 (Suppl. 1), S254–S263. [Google Scholar]
  82. Tayeb, H.T.; Dela Cruz, D.M.; Al-Qahtani, A.; Al-Ahdal, M.N.; Carter, M.J. Enteric viruses in pediatric diarrhea in Saudi Arabia. J. Med. Virol. 2008, 80, 1919–1929. [Google Scholar] [CrossRef] [PubMed]
  83. Esteban, L.E.; Rota, R.P.; Gentsch, J.R.; Jiang, B.; Esona, M.; Glass, R.I.; Glikmann, G.; Castello, A.A. Molecular epidemiology of group A rotavirus in Buenos Aires, Argentina 2004–2007: Reemergence of G2P[4] and emergence of G9P[8] strains. J. Med. Virol. 2010, 82, 1083–1093. [Google Scholar] [CrossRef] [PubMed]
  84. Gonzalez, G.G.; Liprandi, F.; Ludert, J.E. Molecular epidemiology of enteric viruses in children with sporadic gastroenteritis in Valencia, Venezuela. J. Med. Virol. 2011, 83, 1972–1982. [Google Scholar] [CrossRef] [PubMed]
  85. Walker, C.L.; Perin, J.; Aryee, M.J.; Boschi-Pinto, C.; Black, R.E. Diarrhea incidence in low-and middle-income countries in 1990 and 2010: A systematic review. BMC Public Health 2012, 12, 220. [Google Scholar] [CrossRef] [PubMed]
  86. Kotloff, K.L.; Nataro, J.P.; Blackwelder, W.C.; Nasrin, D.; Farag, T.H.; Panchalingam, S.; Wu, Y.; Sow, S.O.; Sur, D.; Breiman, R.F.; et al. Burden and etiology of diarrheal disease in infants and young children in developing countries (the Global Enteric Multicenter Study, GEMS): A prospective, case-control study. Lancet 2013, 382, 209–222. [Google Scholar] [CrossRef] [PubMed]
  87. De Wit, M.; Koopmans, M.; Kortbeek, L.; Wannet, W.; Vinje, J.; Van Leusden, F.; Bartelds, A.; Van Duynhoven, Y. Sensor, a population-based cohort study on gastroenteritis in the Netherlands: Incidence and etiology. Am. J. Epidemiol. 2001, 154, 666–674. [Google Scholar] [CrossRef] [PubMed]
  88. Mukhopadhya, I.; Sarkar, R.; Menon, V.K.; Babji, S.; Paul, A.; Rajendran, P.; Sowmyanarayanan, T.V.; Moses, P.D.; Iturriza-Gomara, M.; Gray, J.J. Rotavirus shedding in symptomatic and asymptomatic children using reverse transcription-quantitative PCR. J. Med. Virol. 2013, 85, 1661–1668. [Google Scholar] [CrossRef] [PubMed]
  89. Gajardo, R.; Bouchriti, N.; Pinto, R.M.; Bosch, A. Genotyping of rotaviruses isolated from sewage. Appl. Environ. Microbiol. 1995, 61, 3460–3462. [Google Scholar] [PubMed]
  90. Lodder, W.J.; de Roda Husman, A.M. Presence of noroviruses and other enteric viruses in sewage and surface waters in the Netherlands. Appl. Environ. Microbiol. 2005, 71, 1453–1461. [Google Scholar] [CrossRef]
  91. Lodder, W.J.; Rutjes, S.A.; Takumi, K.; de Roda Husman, A.M. Aichi virus in sewage and surface water, the Netherlands. Emerg. Infect. Dis. 2013, 19, 1222–1230. [Google Scholar] [CrossRef]
  92. Lodder, W.J.; Wuite, M.; de Roda Husman, A.M.; Rutjes, S.A. Environmental surveillance of human parechoviruses in sewage in the Netherlands. Appl. Environ. Microbiol. 2013, 79, 6423–6428. [Google Scholar] [CrossRef] [PubMed]
  93. Prado, T.; Silva, D.M.; Guilayn, W.C.; Rose, T.L.; Gaspar, A.M.; Miagostovich, M.P. Quantification and molecular characterization of enteric viruses detected in effluents from two hospital wastewater treatment plants. Water Res. 2011, 45, 1287–1297. [Google Scholar] [CrossRef] [PubMed]
  94. Kamel, A.H.; Ali, M.A.; El-Nady, H.G.; Aho, S.; Pothier, P.; Belliot, G. Evidence of the co-circulation of enteric viruses in sewage and in the population of Greater Cairo. J. Appl. Microbiol. 2010, 108, 1620–1629. [Google Scholar] [CrossRef] [PubMed]
  95. Kokkinos, P.A.; Ziros, P.G.; Mpalasopoulou, A.; Galanis, A.; Vantarakis, A. Molecular detection of multiple viral targets in untreated urban sewage from Greece. Virol. J. 2011, 8, 195. [Google Scholar] [CrossRef] [PubMed]
  96. Sdiri-Loulizi, K.; Hassine, M.; Aouni, Z.; Gharbi-Khelifi, H.; Chouchane, S.; Sakly, N.; Neji-Guediche, M.; Pothier, P.; Aouni, M.; Ambert-Balay, K. Detection and molecular characterization of enteric viruses in environmental samples in Monastir, Tunisia between January 2003 and April 2007. J. Appl. Microbiol. 2010, 109, 1093–1104. [Google Scholar] [CrossRef] [PubMed]
  97. Barril, P.A.; Giordano, M.O.; Isa, M.B.; Masachessi, G.; Ferreyra, L.J.; Castello, A.A.; Glikmann, G.; Nates, S.V. Correlation between rotavirus A genotypes detected in hospitalized children and sewage samples in 2006, Cordoba, Argentina. J. Med. Virol. 2010, 82, 1277–1281. [Google Scholar] [CrossRef] [PubMed]
  98. Ferreira, F.F.; Guimaraes, F.R.; Fumian, T.M.; Victoria, M.; Vieira, C.B.; Luz, S.; Shubo, T.; Leite, J.P.; Miagostovich, M.P. Environmental dissemination of group A rotavirus: P-type, G-type and subgroup characterization. Water Sci. Technol. 2009, 60, 633–642. [Google Scholar] [CrossRef] [PubMed]
  99. Fumian, T.M.; Leite, J.P.; Rose, T.L.; Prado, T.; Miagostovich, M.P. One year environmental surveillance of rotavirus specie A (RVA) genotypes in circulation after the introduction of the rotarix® vaccine in Rio de Janeiro, Brazil. Water Res. 2011, 45, 5755–5763. [Google Scholar] [CrossRef] [PubMed]
  100. Vecchia, A.D.; Fleck, J.D.; Kluge, M.; Comerlato, J.; Bergamaschi, B.; Luz, R.B.; Arantes, T.S.; Silva, J.V.; Thewes, M.R.; Spilki, F.R. Assessment of enteric viruses in a sewage treatment plant located in Porto Alegre, Southern Brazil. Braz. J. Biol. 2012, 72, 839–846. [Google Scholar] [CrossRef] [PubMed]
  101. Kitajima, M.; Iker, B.C.; Pepper, I.L.; Gerba, C.P. Relative abundance and treatment reduction of viruses during wastewater treatment processes--identification of potential viral indicators. Sci. Total Environ. 2014, 488℃489, 290–296. [Google Scholar] [CrossRef]
  102. Rodriguez-Diaz, J.; Querales, L.; Caraballo, L.; Vizzi, E.; Liprandi, F.; Takiff, H.; Betancourt, W.Q. Detection and characterization of waterborne gastroenteritis viruses in urban sewage and sewage-polluted river waters in Caracas, Venezuela. Appl. Environ. Microbiol. 2009, 75, 387–394. [Google Scholar] [CrossRef] [PubMed]
  103. He, X.Q.; Cheng, L.; Li, W.; Xie, X.M.; Ma, M.; Wang, Z.J. Detection and distribution of rotavirus in municipal sewage treatment plants (STPs) and surface water in Beijing. J. Environ. Sci. Health A Tox. Hazard. Subst. Environ. Eng. 2008, 43, 424–429. [Google Scholar] [CrossRef] [PubMed]
  104. He, X.Q.; Cheng, L.; Zhang, D.Y.; Xie, X.M.; Wang, D.H.; Wang, Z. One-year monthly survey of rotavirus, astrovirus and norovirus in three sewage treatment plants (STPs) in Beijing, China and associated health risk assessment. Water Sci. Technol. 2011, 64, 1202–1210. [Google Scholar] [CrossRef] [PubMed]
  105. Vivek, R.; Zachariah, U.G.; Ramachandran, J.; Eapen, C.E.; Rajan, D.P.; Kang, G. Characterization of hepatitis E virus from sporadic hepatitis cases and sewage samples from Vellore, South India. Trans. R. Soc. Trop. Med. Hyg. 2013, 107, 363–367. [Google Scholar] [CrossRef] [PubMed]
  106. Arraj, A.; Bohatier, J.; Arraj, A.; Aumeran, C.; Bailly, J.L.; Laveran, H.; Traoré, O. An epidemiological study of enteric viruses in sewage with molecular characterization by RT-PCR and sequence analysis. J. Water Health 2008, 6, 351. [Google Scholar] [CrossRef] [PubMed]
  107. Grassi, T.; Bagordo, F.; Idolo, A.; Lugoli, F.; Gabutti, G.; De Donno, A. Rotavirus detection in environmental water samples by tangential flow ultrafiltration and RT-nested PCR. Environ. Monit. Assess. 2010, 164, 199–205. [Google Scholar] [CrossRef] [PubMed]
  108. Ruggeri, F.M.; Bonomo, P.; Ianiro, G.; Battistone, A.; Delogu, R.; Germinario, C.; Chironna, M.; Triassi, M.; Campagnuolo, R.; Cicala, A.; et al. Rotavirus genotypes in sewage treatment plants and in children hospitalized with acute diarrhea in Italy, 2010–2011. Appl. Environ. Microbiol. 2015, 81, 241–249. [Google Scholar] [CrossRef] [PubMed]
  109. Hellmer, M.; Paxeus, N.; Magnius, L.; Enache, L.; Arnholm, B.; Johansson, A.; Bergstrom, T.; Norder, H. Detection of pathogenic viruses in sewage provided early warnings of hepatitis A virus and norovirus outbreaks. Appl. Environ. Microbiol. 2014, 80, 6771–6781. [Google Scholar] [CrossRef] [PubMed]
  110. Kargar, M.; Javdani, N.; Najafi, A.; Tahamtan, Y. First molecular detection of group A rotavirus in urban and hospital sewage systems by nested RT-PCR in Shiraz, Iran. J. Environ. Health Sci. Eng. 2013, 11, 4. [Google Scholar] [CrossRef] [PubMed]
  111. Payne, D.C.; Wikswo, M.; Parashar, U.D. Rotavirus. Pediatr. Infect. Dis. J. 2011, 30, S54–S55. [Google Scholar] [CrossRef] [PubMed]
  112. Ellis, T.G. Chemistry of wastewater. Encyclopedia of Life Support System (EOLSS). Available online: http://www.eolss.net/eolsssamplechapters/c06/e6-13-04-05/E6-13-04-05-TXT-05.aspx (accessed on 8 March 2015).
  113. StatLine. Available online: http://statline.cbs.nl/StatWeb/publication/?VW=T&DM=SLnl&PA=71476ned&LA=nl (accessed on 16 March 2015).
  114. Wang, X.-Y.; Xu, Z.-Y.; von Seidlein, L.; Zhang, Y.-L.; Zhao, S.-J.; Hao, Z.-Y.; Han, O.P.; Kilgore, P.; Xing, Z.-C.; Han, C.-Q. Incidence of diarrhea caused by rotavirus infections in rural Zhengding, China: Prospective, population-based surveillance. J. Infect. Dis. 2005, 192, S100–S105. [Google Scholar] [CrossRef] [PubMed]
  115. National Bureau of Statistics of China. National Statistics Database. Available online: http://data.stats.gov.cn/workspace/index?m=fsnd (accessed on 8 March 2015).
  116. Sartori, A.M.C.; Valentim, J.; Soárez, P.C.; Novaes, H.M.D. Rotavirus morbidity and mortality in children in Brazil. Rev. Panam. Salud Publica 2008, 23, 92–100. [Google Scholar] [CrossRef] [PubMed]
  117. Li, D.; Gu, A.Z.; Zeng, S.Y.; Yang, W.; He, M.; Shi, H.C. Monitoring and evaluation of infectious rotaviruses in various wastewater effluents and receiving waters revealed correlation and seasonal pattern of occurrences. J. Appl. Microbiol. 2011, 110, 1129–1137. [Google Scholar] [CrossRef] [PubMed]
  118. Verbyla, M.E.; Mihelcic, J.R. A review of virus removal in wastewater treatment pond systems. Water Res. 2015, 71, 107–124. [Google Scholar] [CrossRef] [PubMed]
  119. Rodriguez-Manzano, J.; Alonso, J.; Ferrús, M.; Moreno, Y.; Amorós, I.; Calgua, B.; Hundesa, A.; Guerrero-Latorre, L.; Carratala, A.; Rusiñol, M. Standard and new fecal indicators and pathogens in sewage treatment plants, microbiological parameters for improving the control of reclaimed water. Water Sci. Technol. 2012, 66, 2517–2523. [Google Scholar] [CrossRef] [PubMed]
  120. Chaudhry, R.M.; Nelson, K.L.; Drewes, J.E. Mechanisms of pathogenic virus removal in a full-scale membrane bioreactor. Environ. Sci. Technol. 2015, 49, 2815–2822. [Google Scholar] [CrossRef] [PubMed]
  121. WHO/UNICEF. Progress on Sanitation and Drinking-Water. 2012 Update; WHO/UNICEF: Geneva, Switzerland, 2013. [Google Scholar]
  122. Feachem, R.; Mara, D.D.; Bradley, D.J. Sanitation and Disease; John Wiley & Sons: Washington DC, USA, 1983. [Google Scholar]
  123. Global Water Pathogen Project (GWPP). Available online: www.waterpathogens.org (accessed on 8 March 2015).
  124. Vermeulen, L.C.; De Kraker, J.; Hofstra, N.; Kroeze, C.; Medema, G.J. Modelling the impact of sanitation, population growth and urbanization on human emissions of cryptosporidium to surface waters—A case study for Bangladesh and India. Environ. Res. Lett. 2015. submitted. [Google Scholar]
  125. Ferguson, C.M.; Croke, B.F.W.; Beatson, P.J.; Ashbolt, N.J.; Deere, D.A. Development of a process-based model to predict pathogen budgets for the Sydney drinking water catchment. J. Water Health 2007, 5, 187–208. [Google Scholar] [CrossRef] [PubMed]
  126. Bright, E.A.; Coleman, P.R.; Rose, A.N.; Urban, M.L. Landscan 2010 High Resolution Global Population Data Set, 2010 ed.; Oak Ridge National Laboratory: Oak Ridge, TN, USA, 2011. [Google Scholar]
  127. SSP Database. Available online: Https://secure.Iiasa.Ac.At/web-apps/ene/sspdb/dsd?Action=htmlpage&page=about (accessed on 16 March 2015).
  128. UN World Population Prospects. Available online: Http://esa.Un.Org/wpp/excel-data/population.Htm (accessed on 8 March 2015).
  129. UNDP. Human Development Report 2010, 20th Anniversary edition. The Real Wealth of Nations: Pathways to Human Development; United Nations Development Programme (UNDP): New York, NY, USA, 2010. [Google Scholar]
  130. Van Puijenbroek, P.J.T.M.; Bouwman, A.F.; Beusen, A.H.W.; Lucas, P.L. Global implementation of two shared socioeconomic pathways for future sanitation and wastewater flows. Water Sci. Technol. 2015, 71, 227–233. [Google Scholar] [CrossRef] [PubMed]
  131. Van Drecht, G.; Bouwman, A.F.; Harrison, J.; Knoop, J.M. Global nitrogen and phosphate in urban wastewater for the period 1970 to 2050. Glob. Biogeochem. Cycles 2009, 23, GB0A03. [Google Scholar] [CrossRef]
  132. Miller, M.; Parker, C. Sanitation Status of African Cities. Available online: http://www.iwawaterwiki.org/xwiki/bin/view/Articles/AfricanCitiesSanitationStatus (accessed on 8 April 2015).
  133. Eurostat. Eurostat Statistics. Available online: Http://ec.Europa.Eu/eurostat/web/environment/water/main-tables (accessed on 8 April 2015).

