The Heavy Cost of Care: Systemic Challenges in Norwegian Work Absenteeism


RURALIS—Institute for Rural and Regional Research, 7491 Trondheim, Norway
Soc. Sci. 2018, 7(6), 94; https://doi.org/10.3390/socsci7060094
Submission received: 26 March 2018
/
Revised: 30 May 2018
/
Accepted: 5 June 2018
/
Published: 7 June 2018
Abstract
:The cost of work absenteeism (sickness absence) is high in Norway (120 billion NOK), which threatens the economic sustainability of the Norwegian welfare state. Social sustainability is also challenged with women having a higher absenteeism rate than men. I use system dynamics modeling to explore how women attain a high rate of work absenteeism. Care work is the chosen case because this is the profession category where women are most represented. The results do not support the double burden theory, though several structural mechanisms indicate that competing theories of female absenteeism illustrate different sides of the same phenomenon.
1. Introduction and Background
Despite a rise in the level of public health, work absenteeism (also referred to as sickness absence) remains very high in Norway, with a current annual cost of 120 billion NOK. This total annual cost includes: sickness benefits, disability benefits, vocational rehabilitation allowance, work assessment allowance, and rehabilitation allowance (SSB 2017), which since 1990 has amounted to around 5% of GDP (OECD 2010). This is high compared with the OECD average of 2–2.5% during this time period. In this study, the term work absenteeism includes only work absences due to illnesses longer than one week. Absences of this nature require a doctor’s approval. Women have a much higher rate of work absenteeism than men, and there are many theories offered to explain this phenomenon (Ose et al. 2014). The largest diagnosis categories for both men and women are muscle/skeletal complaints and mental illness. Aside from pregnancy-related reasons, these two illness categories also have the largest gender difference (NAV 2014). One theory for the gender difference is the ‘double burden theory’, which states that because women work full-time jobs and do the majority of care work at home; they then become fatigued/burned out and more likely to take sick leave (Kostøl 2010). Another theory for the gender difference in work absenteeism rates is that men and women are susceptible to different illnesses, i.e., women generally have higher rates of anxiety and depression (Eaton et al. 2007) and skeletal and muscle complaints (Gjesdal et al. 2011). Yet another theory explains that the gender disparity in work absenteeism rates is related to gender differences in profession categories (Campos-Serna et al. 2013).
Despite government policy that encourages women to enter male-dominated fields (and vice versa), the gender distribution in the Norwegian labor market follows traditional gender norms. Women make up the vast majority of what are called ‘care workers’. In this study, care workers include: nurses, teachers (up to and including middle school—‘ungdomsskole’), and elder and childcare workers. Care work is shown to be not only much more physically demanding than typical male-dominated professions (e.g., engineering), but it also has a unique psychological strain on the employees. Besides the emotional toll that care work has on the employee, the psychological strain in care work derives largely from understaffing/over-work and low employee involvement in decision-making (Mitchie and Williams 2003; Elstad and Vabo 2008; Magnusson Hanson et al. 2008). In addition, care work is characterized by a high rate of part-time employees (Yerkes 2009).
There are approximately 5.2 million people in Norway and circa 2.77 million people in the labor force. Unemployment in Norway is very low (see discussion), and there are circa 2.64 million employed persons in Norway (SSB 2016a). Care work employs around 250,000 people with 86% of them women. The care work absenteeism rate is about 10%, which is high compared to the overall work absenteeism rates for both men (ca. 4.5%) and women (ca. 8%) (SSB 2016b). Care work is a large contributor to high overall work absenteeism rates for women. In addition to this, the two highest diagnosis categories are muscle/skeletal complaints and mental illness. Care work has been cited as both very physically and psychologically demanding work (Barford and Whelton 2010; Ose et al. 2014).
Because of the large economic burden to the state, more research focusing on how women attain such a high rate of work absenteeism is vital for the economic and social sustainability of the Norwegian welfare state. In addition to this, varied methods have the potential to shed new light on the problem (Ferragina and Seeleib-Kaiser 2011). To understand how women experience higher rates of work absenteeism, this study investigates operationally the working life of women using system dynamics modeling. To do this, the model focuses on where women are highly represented in the workplace: care professions.
This research is not a comparative study between men and women’s work absenteeism. This is a case study, where care work is taken as the representative profession for female employees because 86% of care workers are women, representing 21% of the total female labor force (Karlsen 2012; SSB 2010; Bakken 2009). There are two research questions that this study addresses: (1) How does the nature of care work lead to higher rates of work absenteeism? (2) What does this mean in terms of cost to the state? This study does not attempt to build or contribute to theory as is typical in social policy studies, but instead focuses on empirically testing theories of the high female work absenteeism rate in Norway. Work absenteeism literature is rich and includes many concepts than are not covered in this study. This study investigates only work absenteeism due to sicknesses longer than one week (which require a doctor’s approval). Because of this, this study does not include motivational absenteeism, presenteeism, seasonal influenza, and work absences due to illnesses of children.
An additional aim of this study is contribute new methodological approaches to the study of absenteeism. Absenteeism is complex, and in many countries, is a persistent problem. No single research methodology can tackle it alone. Although there are many system dynamics studies on public health issues (Homer and Hirsch 2006) and decision-making for occupational health and safety (Nikolaou 2016), absenteeism is a new domain for system dynamics modeling. In addition, system dynamics has made limited inroads in the social sciences in general (Palmer 2017a), and this study seeks not only to contribute to work absenteeism literature, but also to illustrate system dynamics as a method for absenteeism research.
The following section explains what system dynamics is and why it was chosen to investigate the research questions. The system dynamics model in this paper utilizes data from Statistics Norway (SSB) and the Norwegian Labour and Welfare Administration (NAV), and relationships modeled endogenously (not using data) are based on published literature. The results section explains how system dynamics was used to address these questions, and the discussion puts the results in a wider context. The Appendix A provides further information about system dynamics modeling and its limitations, including the documentation of the model.
2. Methods: System Dynamics
2.1. Basic Elements
System dynamics is a term used when analyzing problems as a system in order to understand the system feedback (Meadows 2008). In this case, system dynamics is used to investigate how absenteeism in care work develops over time, and how system feedback contributes to this system behavior. System dynamics involves identifying elements, subsystems, and the systems’ context, boundaries, and properties. In this way, system dynamics systematically gathers what is known about how a system operates. However, system dynamics also systemically investigate relationships within that system with the analysis of feedback in the system structure (Haskins 2008).
A system dynamics model is a set of ordinary differential equations (ODEs), which are used to simulate system behavior (Sterman 2000). These models are represented with a stock and flow diagram (SFD). A SFD contains stocks, flows, and variables, which represent either data, equations, or parameter values. Stocks are accumulations over time, where the flows add and subtract from the stock. Variables affect the flows and each other through relationships represented as ‘instantaneous causal links’. The SFD is not the model itself, but a simplified representation of the model structure used to communicate the model. A system dynamics model is developed and simulated with software, and this study uses Stella Architect 1.5.1 by isee systems (please see Appendix A for more information on the model and model building).
Working backwards from the stock in question (in this case ‘care worker absentees’), system dynamics methods require the modeler to understand what is influencing the behavior in the stock. This process is aided by literature review and talking with experts in the field. The goal of developing the SFD is to replicate actual system behavior (called the ‘reference mode’). There are various reference points in the model in which the model is validated, and the main reference mode acts as the focal point in which to validate the model.
The model presented in this study is one part of a larger model. The SFD given in the results section is a graphical representation of this part of the model structure, the Appendix A provides the equations that form the basis of the simulation. The remaining sectors of the larger model are part of other published works (see Palmer 2017a, 2017b).
2.2. Exogenous vs. Endogenous
System dynamics models have both endogenous and exogenous relationships. The relationships chosen for endogenous representation depend on the research boundary. It is also possible for a variable to be partially exogenous, where part of a variable’s value is determined by relationships in the system structure and part of its value is determined by data. In this case study, for example, cost is partially exogenous. The cost per absentee is not studied endogenously because the intent of this study is not to understand how the cost per absentee develops over time. To be represented in the model endogenously, this variable would need to be developed into several relationships involving variables such as: average absentee salary, medical cost variables, and rehabilitation cost variables. Because this is outside the boundary of the model, exogenous data is used in the model for the variable ‘cost per absentee’. What is of interest in this study is the number of female work absentees, and the relationships for calculating this are endogenous, represented with equations.
2.3. Feedback
The concept of feedback is a fundamental part of system dynamics models (Lane 1999). When evaluating endogenous relationships, very often there are relationships that feedback onto itself through the interconnection of other variables (i.e., a closed-loop system). Feedback loops can be either reinforcing (behavior continually increasing/decreasing over time) or balancing (behavior reaching an equilibrium). A causal loop diagram (CLD) is a simplified version of the feedback loops in the model and is used as the centrepiece of the discussion. It is essential to understand the feedback structures in a system when developing policy, and this is one reason that system dynamics was chosen to investigate Norwegian work absenteeism rates for women. It is important to note that CLDs, as with SFDs, are graphical representations used to communicate system dynamics models and are not the model itself (which is given in the Appendix A).
2.4. Using System Dynamics to Understand Work Absenteeism
Although there are many statistical modeling studies, there is currently no study using dynamic modeling to understand female work absenteeism rates in Norway. In addition to this, in an overview of the theories explaining this phenomenon, Ose et al. (2014) highlights the need for more empirical evidence for these theories (Ose et al. 2014). This study helps answer this call.
One of the major goals of system dynamics is to understand the structure of the system that is generating a particular problematic behavior. Another reason for using system dynamics as the methodology for this study is because of the dearth of literature addressing structural relationships in the work absenteeism problem in Norway. In addition to this, there is value in researching social problems with varied methodology because of the potential for new and unique insight (Esping-Andersen 2009; Ferragina and Seeleib-Kaiser 2011). Using dynamic modeling can serve to complement other methodological approaches in social policy research.
System dynamics does not attempt to explain ‘why’ work absenteeism rates are different, but instead it explains the operational ‘how’. The model explains how the nature of care work brings about its absenteeism rate, but it does not explain why various elements of care work make people sick. This is not meant to suggest that system dynamics modeling does not rely on scientific data that attempts to explain ‘the why’. System dynamics modeling is a valuable addition to the body of work absenteeism literature because of its ability to bring together what is known about the system from the scientific literature in order to understand the problem operationally.
Models evolve over time through many iterations in published literature. This study presents a first iteration model, meaning that the model has not been built based on a previously published model. Because of this, the model scope is narrow and relies on model assumptions (though supported by literature and tested—see Appendix A). It should also be noted that system dynamics modeling is not only a new method in researching the female work absenteeism rate in Norway, but it has also made few inroads into the analysis of social policy in general. One of the goals of this study is to illustrate how system dynamics can be used in the social sciences.
3. Results
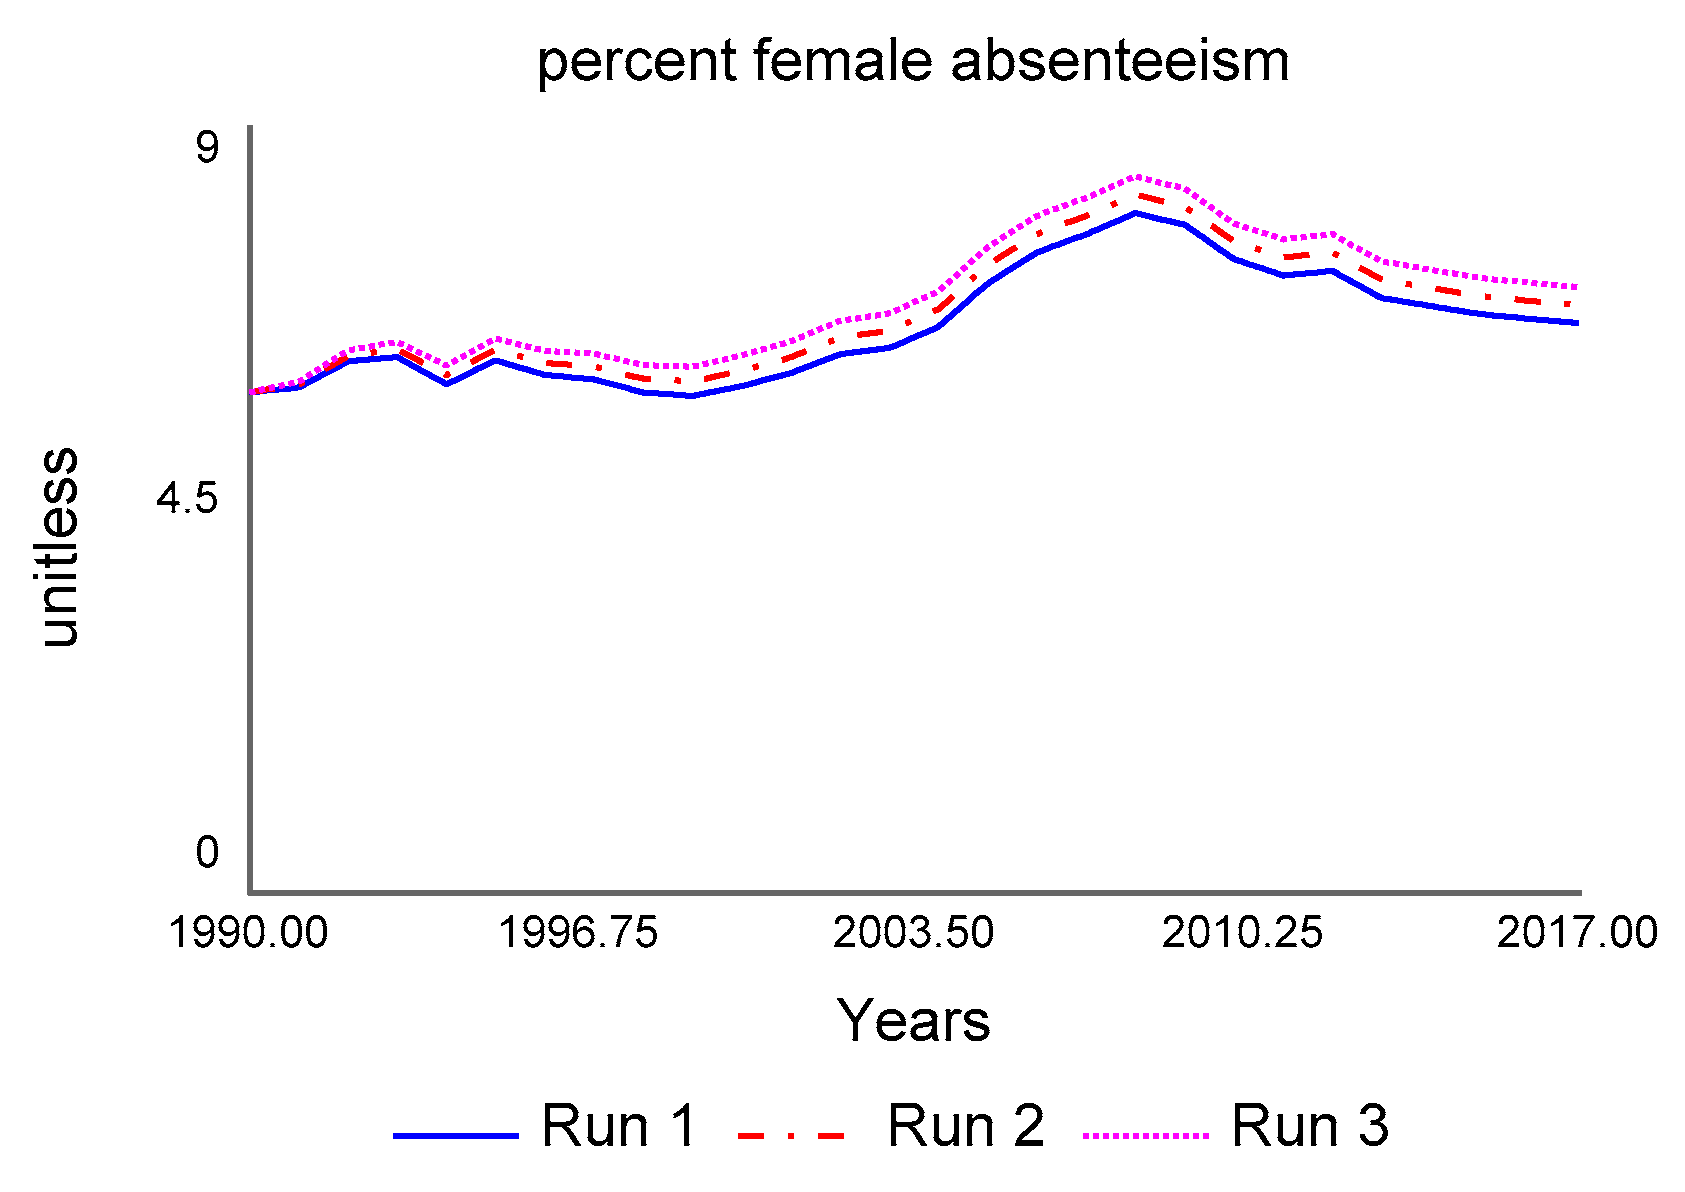
The results of this study include the system dynamics model (illustrated as an SFD) and the simulations it produces (the behavior graphs). The starting point for the model development is the problematic reference mode behavior showing the gender difference in work absenteeism rates (Figure 1). Figure 1 shows the total male (green) and total female (pink) work absentees divided by the number of employed males and females, respectively. These are the actual (data, not simulated) Norwegian male and female work absenteeism rates. The goal of the model is to reproduce this actual system behavior through model simulation. This means that if the model closely simulates the actual system behavior, the model structure is a supported hypothesis of how the actual system works operationally. In this study, the model reasonably reproduces the male (red) and female (blue) work absenteeism rate behavior as shown in Figure 1. Male work absenteeism behavior is largely exogenous in the model (aside from population dynamics—which is why male absenteeism does not exactly fit the data) and shown only as a comparison to female work absenteeism. Only female work absenteeism is investigated in this study, which is modeled endogenously for care work with exogenous data used for other professions. For simplicity purposes, and noted as a limitation of the model, all care workers in the model are assumed female. The male work absenteeism simulation is for males in all other professions. The simulated behavior is generated by the system dynamics model represented by the SFD shown in Figure 2, and this section explains what this part of the model includes and how it was developed. Further technical information about the model is provided in the Appendix A.
3.1. Stock and Flow Diagram of Care Work Absenteeism
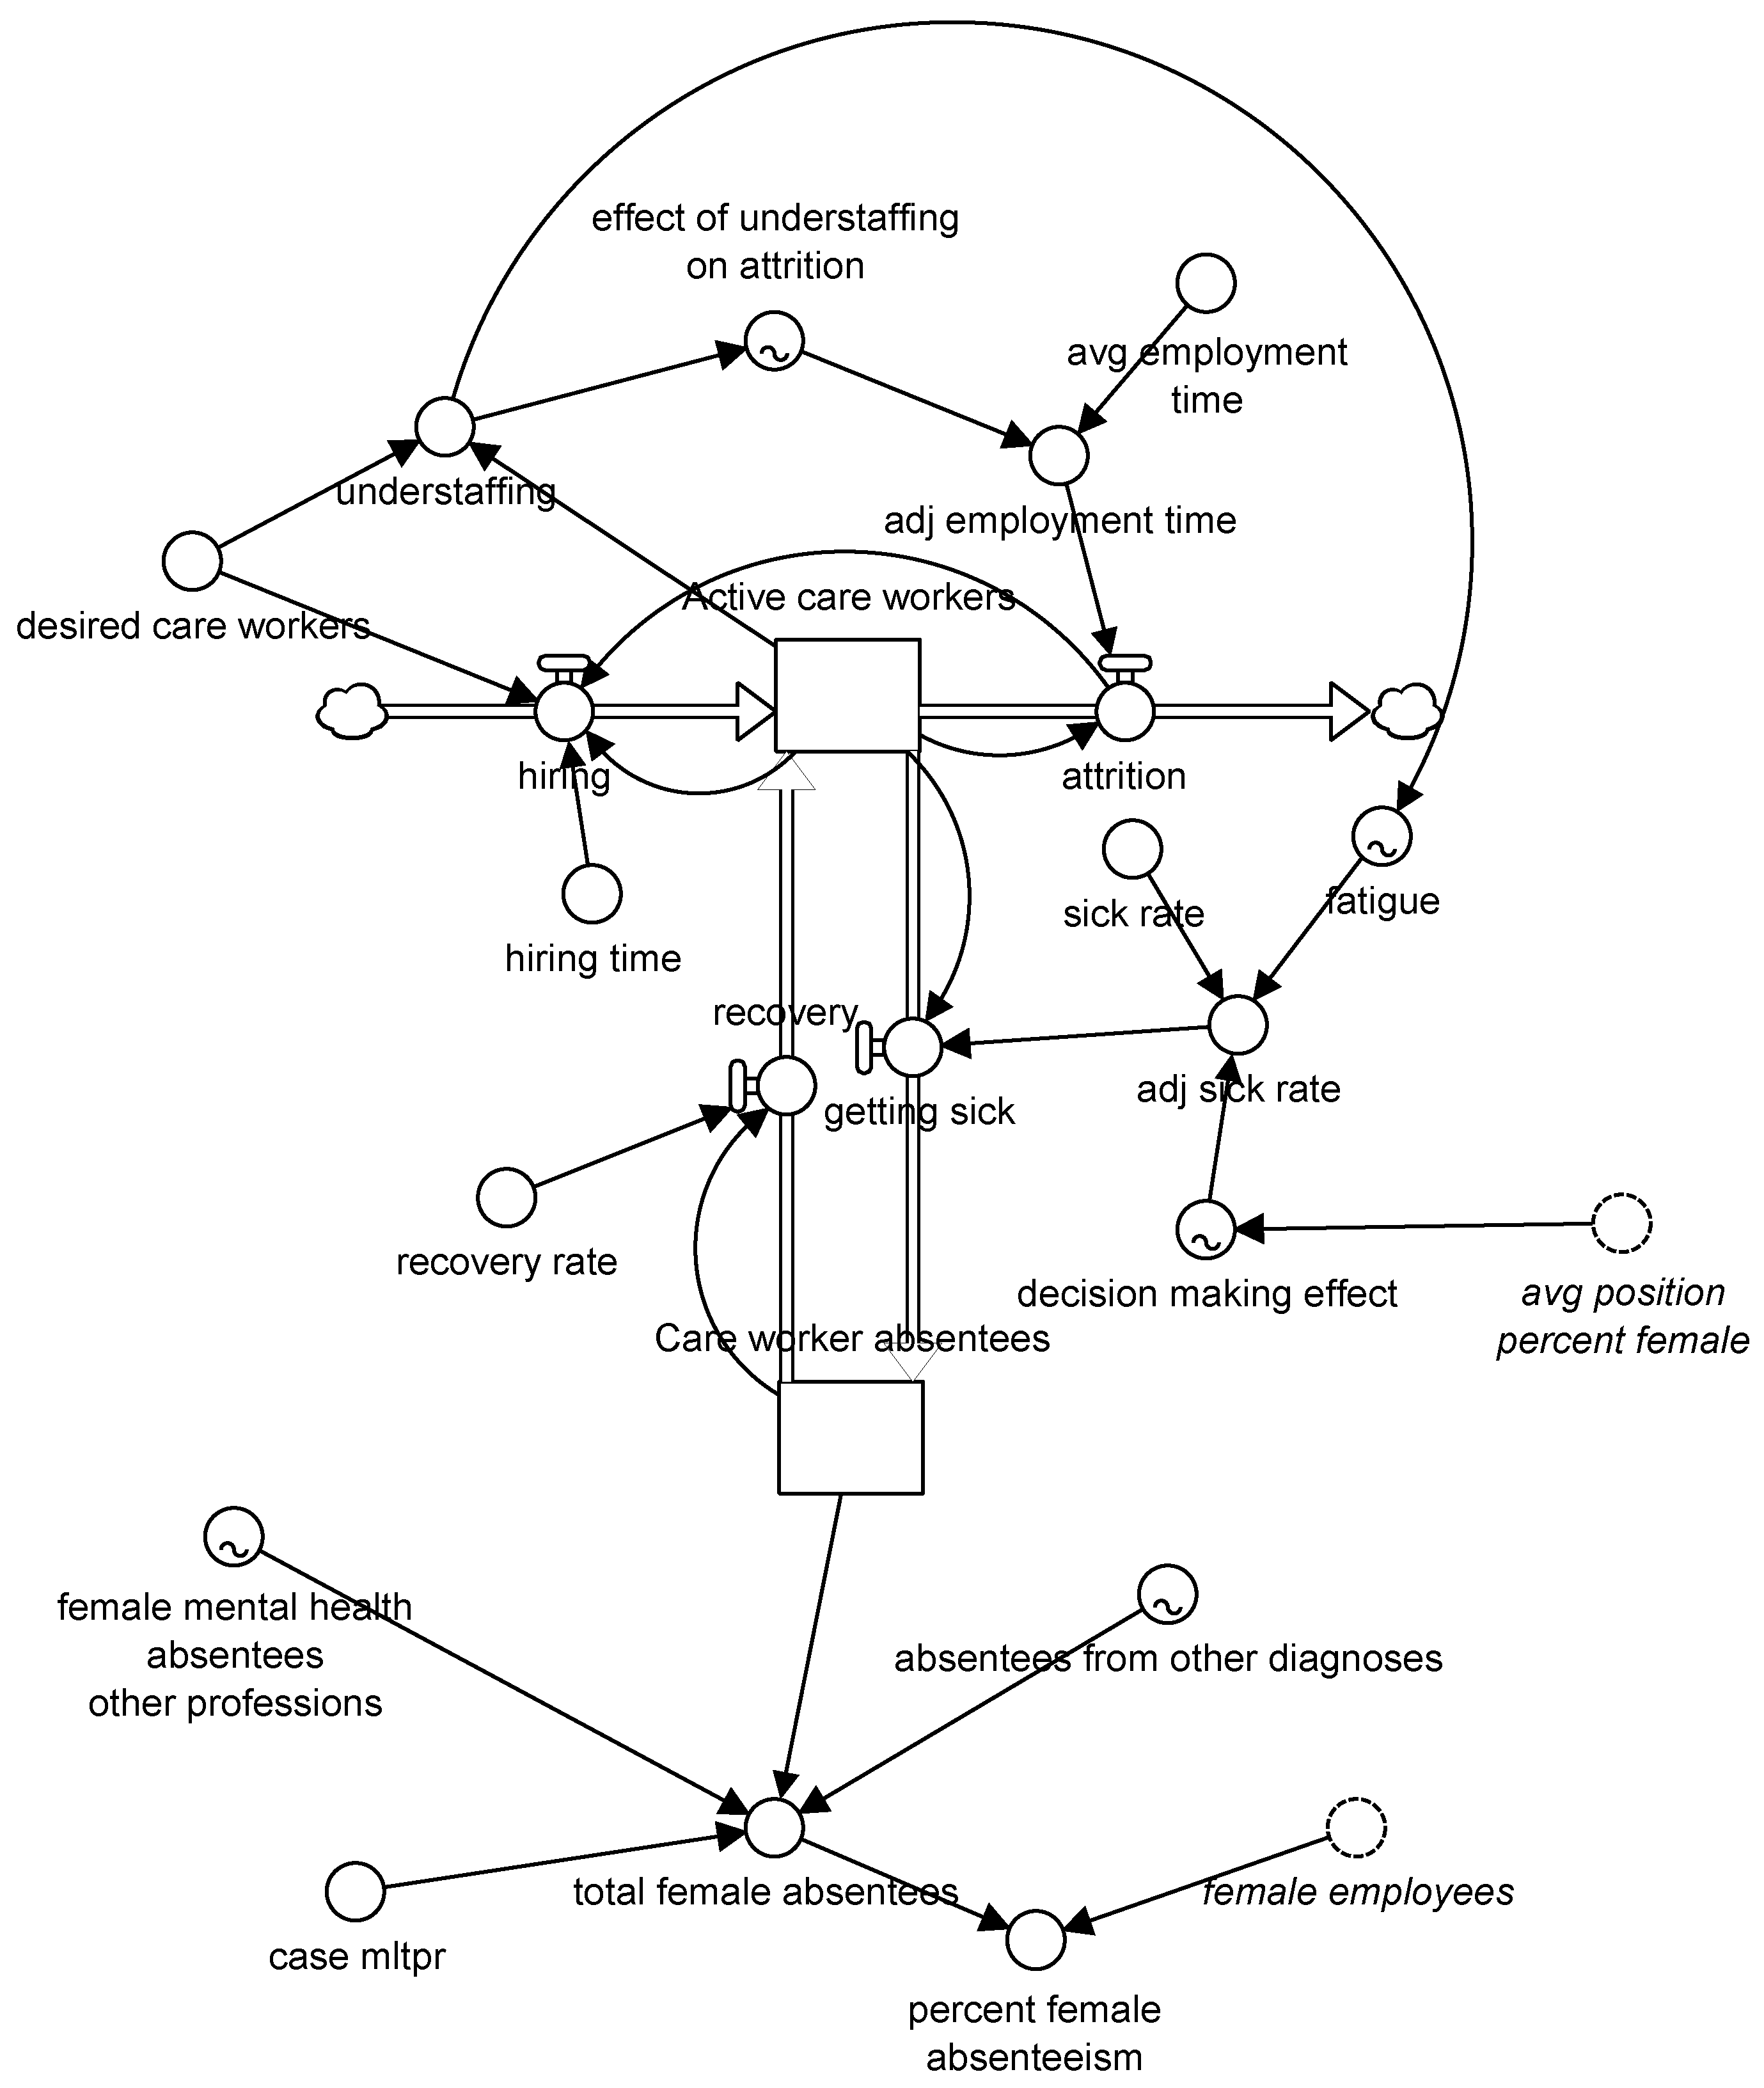
This section will explain all the parts of the system dynamics model that are represented by the SFD in Figure 2. Please note the SFD is a graphical representation of part of the system dynamics model given in the Appendix A and is not a comprehensive picture of the entire model structure.
There are two stocks in the model: active care workers and care worker absentees. The number of people employed in care work are in the ‘active care workers’ stock. ‘Active’ means they are employed as care workers and are not on sick leave. The sum of these two stocks is the total number of people employed in care work.
They come into the active care worker stock when they are hired, and they leave when they move onto another industry, retire, die, or are fired. When care workers are on sick leave, they leave the ‘active care workers’ stock and enter the ‘care worker absentees’ stock. The sick leave rate is 0.0052, which is the average time it takes for a worker to get sick (in years, called ‘sick rate’ in the SFD). This average sick rate is based on the male sick rate and is used as the baseline to understand how it becomes higher due to the nature of care work.
Once the care worker recovers from their illness, they return to work and are an ‘active care worker’. The average number of days for sick leave is 42. The reason this number is high is that the model is normalized for seasonal influenza, leaving shorter sick leave instances out of the average. Hiring is based on a desired number of care workers (at the start of the simulation, desired equals the number of active care workers: 250,000). The ratio of active and desired care workers shows how understaffed care facilities are. This affects the attrition rate: the more overworked the employees are, the more likely they are to find employment elsewhere.
There are two main influences in care work discussed in psychological literature leading to high rates of sick leave in care work: understaffing and low involvement in work place decision-making (Mitchie and Williams 2003). Understaffing indicates that care workers are overworked. Being overworked leads to fatigue, and fatigue leads to higher rates of sick leave. Involvement in decision-making in the workplace affects absenteeism because of the loss of control over one’s daily working life.
The variables: ‘effect of understaffing on attrition’, ‘fatigue’, and ‘decision-making effect’ are represented as non-linear graphical functions in the model (see Appendix A for more information). In short, this means that as understaffing increases, the effect of understaffing on attrition and fatigue increases to a certain level, where the effect stabilizes. Part-time work is in a non-linear relationship with the sick-rate, meaning that as part-time work increases (position percent decreases), the involvement in decision-making decreases. This increases the sick rate to a certain level, where the effect stabilizes.
A reduced position percent (100% is full-time; less than 100% is part-time) affects the level of employee involvement in decision-making. Women have a weakened position in the labor market and in the work place due to higher rates of part-time work in childbearing/rearing years (Zanier and Crespi 2015). This is modeled endogenously in another part of the model and ‘female position percent’ is shown as a ghost variable where it links to this model section (dotted circle in Figure 2). This is modeled endogenously using the total number of childcare hours needed during childrearing/bearing years and the societal norm of women taking the vast majority of the hours that are not covered by state-provided childcare services. This decreases the female position percent (more part-time work).
Care work is also affected by part-time work because of the high rate of absenteeism leading to the need for either part-time or temporary workers. This leads to a low involvement in decision-making. This (along with fatigue) decreases the amount of time it takes for an active care worker to become sick, thereby making the care worker absentee stock increase.
The double burden of women was tested with this model design and did not show an effect on care work absenteeism rates. The reason for this is that, in this model design, women work part-time in childbearing/rearing years, and in addition to this, care work has a large number of part-time workers due to the understaffing issues caused by high turnover (see Section 4.1). The women’s double burden does not materialize into higher rates of work absenteeism even though women are taking responsibility for the majority of unpaid care work at home. This is because part-time work prevents burnout in this model design. Although this model design does not lend support to the double burden theory for work absenteeism, this does not mean that the double burden theory would not be supported with a different model design (in the Norwegian care work context or others) or with this model design in a different context. There are many different model designs that need to test the double burden theory in a variety of contexts. This model design focuses only on care work, and there needs to be further modeling/research on part-time work regardless of profession type and other psychological factors and societal norms in relation to burnout absenteeism (and other absenteeism types) related to the double burden.
3.2. Cost to the State
The second research question concerns the cost of work absenteeism to the state. The average cost per absentee per year is almost 1 million NOK. This includes not only the employee’s salary, but also medical rehabilitation and benefits for vocational rehabilitation. The loss of productivity is not included in the cost per absentee per year.
Cost per year is calculated by the average cost per absentee multiplied by the total number of male and female absentees. To understand the cost of low involvement in decision-making and understaffing on work absenteeism costs, the work absentee expenditures were calculated with these effects (referred to as ‘care work effects’) until 2017 and then were taken out of the simulation with an extended time horizon (see Figure 3).
By turning off the care work effects in the model, the fatigue and part-time work reinforcing loops (see Figure 4) are cut, and the potential cost reduction of policy addressing these effects amounts to approximately 10 billion NOK in annual cost to the state by 2025. The future cost of care work absenteeism does not take into account the future increased need for care workers as the elderly population increases (this is the next step in model development.) This is an important area of future research, as care work is identified (for better or worse) as a sector to strengthen youth employment (Montgomery et al. 2017). The extended time horizon should not be seen as a prediction of absenteeism expenditures if care work effects are eliminated because other factors may influence total expenditures. Figure 3 is meant to highlight that eliminating care work effects could reduce total work absenteeism expenditures by approximately 10 billion NOK annually with all else being equal. Cost is discussed further in the following section.
4. Discussion
4.1. Causal Loop Diagram
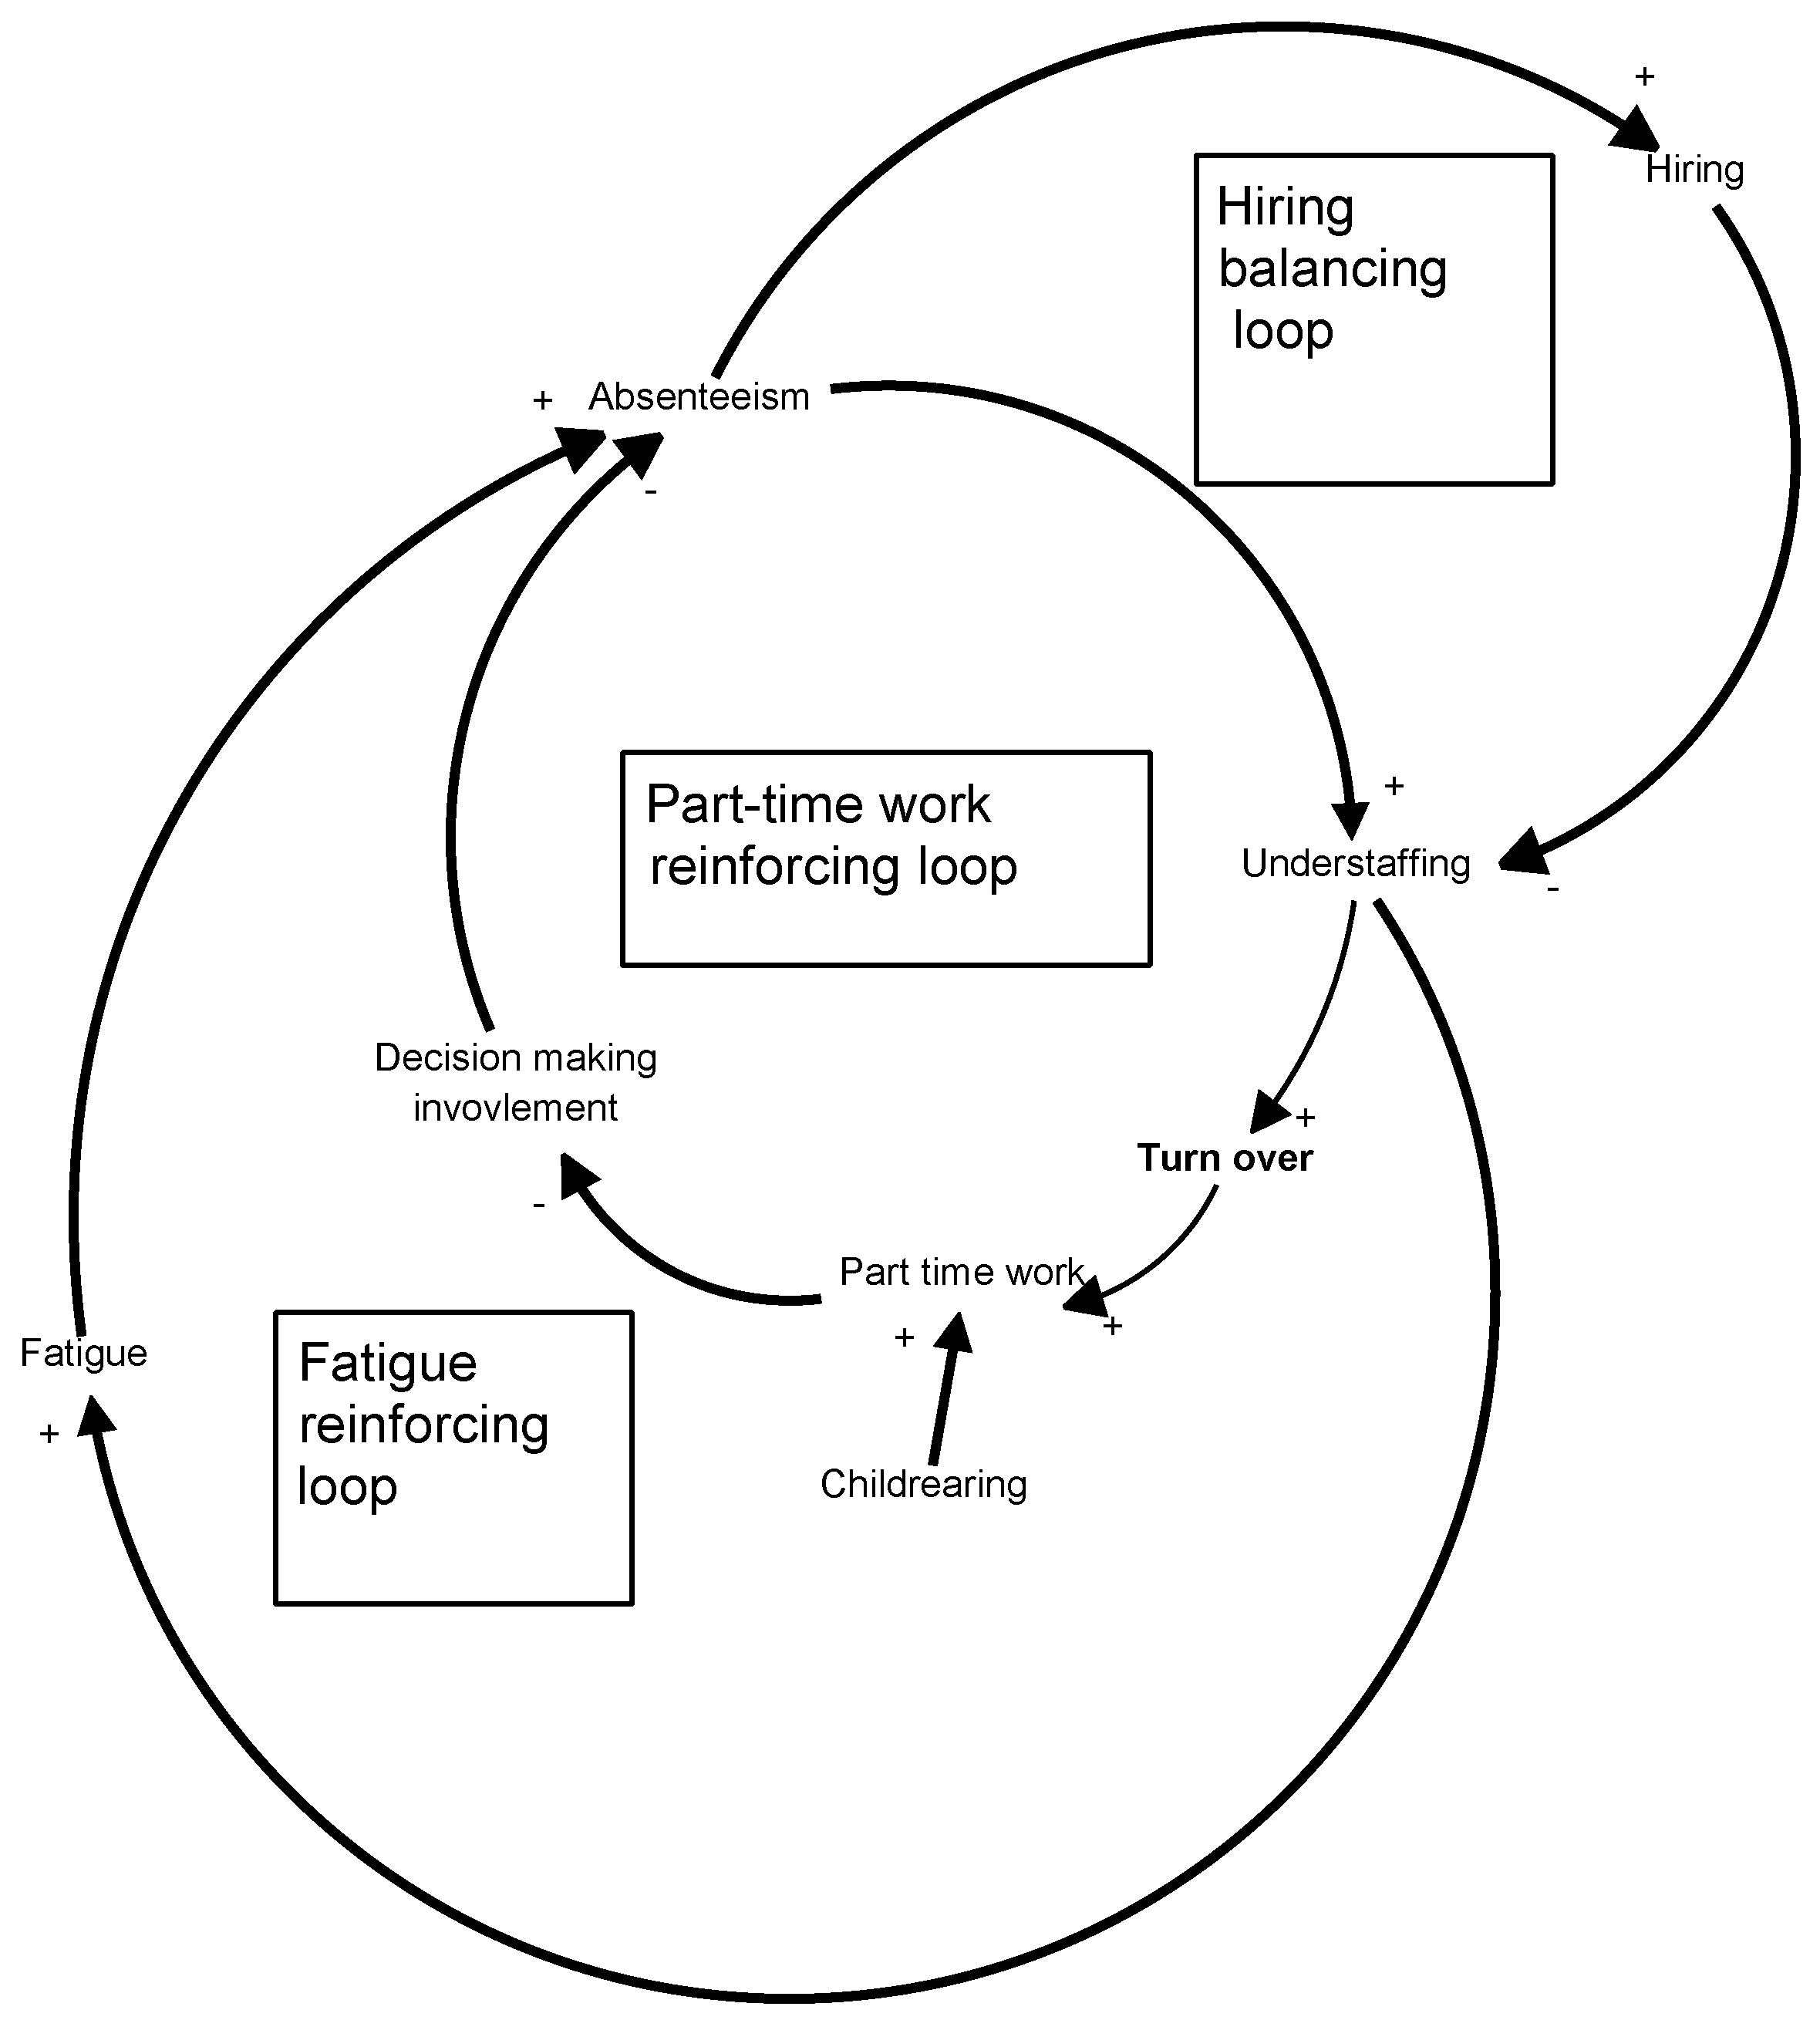
The feedback in the model is simplified in the CLD, shown in Figure 4. The CLD has three interacting feedback loops: (1) the part-time work reinforcing loop; (2) the fatigue reinforcing loop; and (3) the hiring balancing loop.
- (1)
- Part-time work reinforcing loop: As part-time work increases, the level of decision-making involvement decreases. Part-time employees are more likely to have low involvement in decision-making. The more part-time employees there are, the larger the number of employees with a low involvement in decision-making. The larger the number of employees with a low involvement in decision-making, the higher the number of absentees. As discussed earlier, this is due to a loss of control over their daily working life. As absenteeism increases, so does understaffing. This leads to more turnover (higher attrition rate) because of the stress an environment that an understaffed workplace creates. Higher turnover leads to more part-time workers in care work (creating the part-time work reinforcing loop) because more workers are needed to quickly fill staffing needs. This is higher for part-time workers rather than full-time workers in care work because of the path dependency that this system has. Part-time workers are the standard in many care work jobs. It is also important to mention that childbearing/rearing also keeps part-time work high (built into another part of the model, not shown in the SFD in Figure 2).
- (2)
- Fatigue reinforcing loop: Understaffing leads to higher fatigue and higher rates of absenteeism, creating another reinforcing loop (the fatigue reinforcing loop), representing the burnout loop structure in the model.
- (3)
- Hiring balancing loop: The first two reinforcing loops are kept from continually increasing the absenteeism rate by the hiring balancing loop. As absenteeism increases, the more people are hired to replace them, which reduces understaffing. There is a hiring delay however, which keeps hiring from eliminating understaffing.
Please note that the CLD is a graphical representation of the feedback in the system dynamics model given in Appendix A and is not a comprehensive picture of the model. The CLD is a communication tool to discuss the results presented in the results section. Not all feedback relationships in the model are shown (only those important for the research questions) nor do these feedback loops live in isolation as many processes influence the variables shown in Figure 4. The feedback loops represented in Figure 4 illustrate the logic in the operations of the model design. Both the SFD and the CLD are partial representations of the model, which is why there are differences in the variables shown in each. In the following sections, the CLD is evaluated in terms of cost (‘Sick or Unemployed?’) and in the context of the theories regarding gender and the absenteeism rate (‘The Double Burden’ and ‘The Gender Difference in Employment and Risk of Illness’).
4.2. Sick or Unemployed?
Norway fits into the Nordic welfare model (Esping-Andersen 1990; Andersen et al. 2007), and in this context, this study addresses concerns relating to making assumptions in measurability transparent (Ferragina and Seeleib-Kaiser 2011). The discussion of the cost of welfare services is not merely a matter of totalling expenditures in different spending categories. As expanded welfare benefits in various parts of the welfare system become available, people can become shifted from one part of the welfare system to another. Taking away the influences of understaffing and low decision-making ability in the model shows an annual 10 billion NOK difference in work absenteeism expenditures by 2025. It can be very tempting to say that policy designed to reduce these influences has the potential to save the state this large annual expenditure, but the reality is not quite so simple. To illustrate this, comparative examples are helpful. In a study by Hytti (2006) titled: ‘Why are Swedes sick and Finns unemployed?’ there is an argument that though Sweden and Finland have structurally similar welfare systems, Sweden has a high rate of work absenteeism and low unemployment (and in Finland vice versa) because of Sweden’s goal of maximizing labor force mobility and the number of employed persons. Sweden’s high rate of work absenteeism could be concealed unemployment; this raises the question: are we seeing the same thing in Norway? Framing high work absenteeism in this manner, however, does not address the gender issue. Norway may have high work absenteeism and low unemployment, but if this is concealed unemployment, there is still the issue of why women are more absent than men.
Work absenteeism as concealed unemployment means that those with a weakened position in the labor market because of health reasons, who would normally find themselves on unemployment benefits, are instead pushed into the labor market where they have the right to sick leave benefits, which are more generous than unemployment benefits. In the case of absenteeism in care work, this would mean that the care workers who are absent from work are people who would not normally find themselves in the labor market because of a history of illness. As mentioned above, women generally have higher rates of anxiety and depression and skeletal and muscle complaints. Care work may attract employees with a weakened position in the labor market for any reason, health or otherwise, because there is a very high hiring rate due to high turnover and absenteeism. However, on the whole, the high rate of women in care work is due to societal norms in the form of following traditional gender roles (Ose et al. 2014), not the ease in finding employment because of a weakened position due to health reasons in the labor market. Concealed unemployment can only account for a small portion of the total amount of the absenteeism rate in care work. Assuming the gender difference in work absenteeism rates is concealed unemployment ignores the effect of work environment on the health of employees. Work environment is well documented as having both positive (healthy worker effect (Barnett 2004)) and negative effects (as shown above and elsewhere (Ose et al. 2014)) on employee health. The outcome of this model supports the argument that work environment has a net negative effect on employee health in care work.
In addition to this, care work in many countries with varying levels of unemployment rates also experience high rates of care work absenteeism compared with other professions, for example: the US (BLS 2014), Canada (Stewart 2013), Sweden (Häggebrink and Lovén 2010), and the UK (ONS 2014). This indicates that there is more to the story of absenteeism in care work other than concealed unemployment.
Though the high rate of work absenteeism as a whole in Norway could possibly partially be explained as concealed unemployment, limiting total cost reduction potential of policy, it does not explain the gender disparity in the work absenteeism rate; and the cost reduction potential could be as high as 10 billion NOK annually by 2025. The potential cost reduction of policies addressing the gender disparity of work absenteeism however needs further research.
4.3. The Double Burden
The results section mentioned how the model did not support the double burden theory for work absenteeism. There has generally been little empirical evidence to support the double burden theory (Ose et al. 2014), and this study also fails to show support, though this model is limited to the care work profession.
The average position percent for women in Norway is just over 80% (Palmer 2017b; SSB 2016a; Egeland and Drange 2014). This average includes those with no children and grown children. The actual position percent for women at risk for the double burden is between 60% and 65% (SSB 2016a; Egeland and Drange 2014). The total number of childcare hours that are not covered by state provided childcare per week (shared care hours) is 48 h (Palmer 2017b). If women take 100% of these 48 h, the double burden amounts to approximately a 65-h work week, and this is if the spouse (or any other help: grandparents, other family members or hired help) takes 0% of the shared care hours. This is unlikely, though possible in some cases, but not common enough to be relevant for work absenteeism rates. It is true that not all women work part-time in childbearing/rearing years, but part-time work is ubiquitous enough to avoid a significant impact of the double burden on female work absenteeism rates.
The model tested the double burden at its most extreme. Women were set as having an 80% position and taking all shared care hours. Even in this unlikely scenario, there was only a small effect on the sick rate, and not enough to explain the large gender disparity.
4.4. The Gender Difference in Employment and Diagnoses
As mentioned, women are cited as having a greater risk of developing skeletal and muscle complaints, as well as mental illness (e.g., depression and anxiety). These are also the categories with the largest gender disparity. This could be interpreted as an implacable/innate condition, making further analysis and policy discussion focus on the medical nature of the problem. The outcome of the model indicates that, even if it is an innate condition, it is not the only force at work leading to high female work absenteeism. Women may have higher rates of skeletal/muscle and mental illness absenteeism, but this is heavily influenced by the professions in which women work. Care work is demanding both physically and mentally, and the work environment encourages a higher rate of absenteeism because of understaffing and low involvement in decision-making, both enabled by high rates of part-time work. Often, cases of absenteeism for skeletal and muscle complaints show no physical evidence in which doctors can pinpoint as the cause (Ihlebæk et al. 2010; Elstad and Vabo 2008). This makes sense given the outcome of the model. Fatigue and loss of control over one’s working life may not leave physical injury, but stress can exhibit itself in many forms (Hansson et al. 2008).
Choice of profession and differing disease risks are two separate theories for the higher rate of female work absenteeism. The outcome of this model indicates that these are two parts of a more complicated story. Choice of profession dictated by strict gender roles in the labor market leads to the high representation of women in care work. This is reinforced by the need for more part-time employees in care work because of understaffing, which women are more likely to be. The weakened position women have in the labor market carries over into the work place with this high propensity to work part-time, leading to loss of control in their working life because of low involvement in decision-making. Both the fatigue from understaffing and loss of control leads to illness; how it manifests in the individual is proportional to the overall sick rate for each diagnosis category.
4.5. Policy
This study does not develop policy structures in the model or provide implementation analysis of policy structure. Instead, this study identifies where policy could potentially be aimed to affect the structural forces leading to the problematic system behavior. Any policy that aims to reduce female work absenteeism needs to start with where women work. The interaction between the nature of care work and the position of women in the labor market is where the issue lies. Investigating how to get women into a better position in the work place to involve themselves in decision-making is identified in this study as having a high impact potential for policy development. This study also supports the results of an older study that implemented a shorter working day (6-h day) in two care organizations, which showed that a shortened work day had no effect on work absenteeism rates (Bjørnskau 1997). This makes sense when evaluating that policy with the model presented in this study. A shorter working day as a policy does not alleviate the effect of involvement in decision-making. The double burden would be alleviated by this policy, which this model indicates as having only a small effect at its most extreme. Policy measures must be developed with a systemic understanding of the problem to effect change in the actual system behavior (Hennum 2014).
5. Conclusions
Empirical support for theories of the gender disparity in the work absenteeism rate is lacking, especially those using dynamic modeling. Despite this, politicians need to make policy decisions addressing the problem without having much in the way of empirical evidence or a comprehensive dynamic understanding of work absenteeism. This study contributes in addressing this situation, using care work absenteeism behavior as a case study. Further research must be done to find out how other profession categories experience their work absenteeism rates, and how this influences the gender disparity and overall cost. In addition to this, central variables in this model, such as part-time work and its balancing feedback relationship with burnout itself, need to be further researched. It is also important to look outside the boundaries of the model. For example, reducing the absenteeism rate overall could increase presenteeism. Failing to investigate the systemic root of high female work absenteeism will lead to policy decisions with a high potential for failure or at worst with unintentional consequences for the labor force. More studies addressing the systemic forces leading to work absenteeism must be conducted to investigate not only gender disparity, but also the high total rate of work absenteeism in Norway.
Conflicts of Interest
The author declares no conflict of interest.
Appendix A
Appendix A.1. Notes on Model Building
The system dynamics model presented in this study was built using Stella Architect 1.5.1 from isee systems. The portion of the model shown in this study is one part of a larger model. The total model includes dynamic demography, state accounting, pension, and work absenteeism modeling. The population model is broken up into four age cohorts (0–14, 15–49, 50–74, and 74+). Immigration also forms part of the demography model as a separate inflow into each age group corresponding to the percentage of immigrants belonging to each age group. The working age population (the sum of the 14–49 and 50–74 population stocks, with retirees between 67 and 74 removed) is linked to state income, whereby labor force participation is calculated and then linked (with the unemployed removed) to the state income section of the model. In the state income section of the model, all income to the state that is connected to the labor force is disaggregated (e.g., pension contribution, income tax, employer fees, and social security fees) and connected to the demography modeling. There is also an individual capital tax that is linked to the total population. All oil-related income is disaggregated, though not linked to any other part of the model.
The state income section of the model also includes the Norwegian pension fund (Pension Fund Global) stock. Though not relevant to the discussion in this study, the model has a reinforcing feedback loop involving the state general fund and the Norwegian pension fund (Pension Fund Global). The general fund stock is a state accounting stock (state income minus expenditures). In Norway, this stock is always (in the model’s time horizon) positive. All surplus income is invested in the Norwegian pension fund (Pension Fund Global). This stock is not related to the pension system and is the new name for the Norwegian Petroleum Fund. There are discretionary drawdowns on this interest-bearing fund where the maximum annual drawdown is 4%, though the fund consistently yields higher returns, thus creating the reinforcing loop in the Norwegian pension fund (Pension Fund Global).
In the state expenditures portion of the model, only pension expenditures (named pension transfers in the model) and work absenteeism expenditures are disaggregated, making three outflows from the general fund stock: pension transfers, work absenteeism expenditures, and other expenditures. Pension transfers are linked to the 74+ population stock (and retiree portion of late adult population stock), with males and females disaggregated. Work absenteeism expenditures are linked to care work absentees in the work absenteeism model sector (together with other absentees and average cost per absentee).
The pension sector of the model is where part-time work for women is calculated. Pension is largely determined by lifetime-accumulated income, which for women is affected by: the wage difference between male-/female-dominated professions, the male/female wage gap, and part-time work (Zanier and Crespi 2015). Shared cared hours and childcare hours covered by the state are used to dynamically determine part-time work for women over time. Women are more likely to work part-time versus full-time, and this is usually due to childbearing and rearing even with state childcare resources in place. The part-time work variable is affected by shared care hours. ‘Shared care hours’ are the number of unpaid childcare hours parents must provide, which are not available to be outsourced to state childcare services. Either the mother or the father can provide unpaid childcare work, but this is (as a societal norm) usually provided by the mother. The part-time work variable is connected to the work absenteeism sector of the model presented in this study.
The time horizon for the model is 1990–2017. This was chosen because this is the maximum number of years that data is available for the majority of the key variables (i.e., those represented in the reference mode and reference points used for validation.)
Appendix A.2. Notes on Data and Support for Variables and Relationships
The demography sector data was retrieved from SSB. The state accounting sector data was retrieved from the Norwegian National Budget (Statsbudsjettet), which is an online database of state budget information. The pension sector also includes data from SSB and Statsbudsjettet. The work absenteeism model sector includes data from NAV and SSB, as explained in the ‘Results’ section. However, an important model assumption in the work absenteeism model sector is the variable representing low-involvement in decision-making. This is supported in the literature by Mitchie and Williams (2003). This non-linear graphical function is explained in the section: ‘Stock and Flow Diagram of Care Work Absenteeism Rates’. A sensitivity analysis of this variable is given at the end of Appendix A.
Appendix A.3. Model Equations
The entire system dynamics model consists of: four sectors (of which care work absenteeism is one sector), 12 stocks, 28 flows, and 111 converters (variables). There are 38 constants and 101 equations.
Care Work Absenteeism Stock Equations:
where t = time.
Appendix A.4. Notes on Validation
Validation of the model presented in this study took several forms. Face validity of the model architecture was achieved by presenting the model and results with Nordic welfare state experts at the Centre for Welfare State Research at the University of Southern Denmark and at the Nordic Centre of Excellence: The Nordic Welfare State—Historical Foundations and Future Challenges (NordWel), 2016.
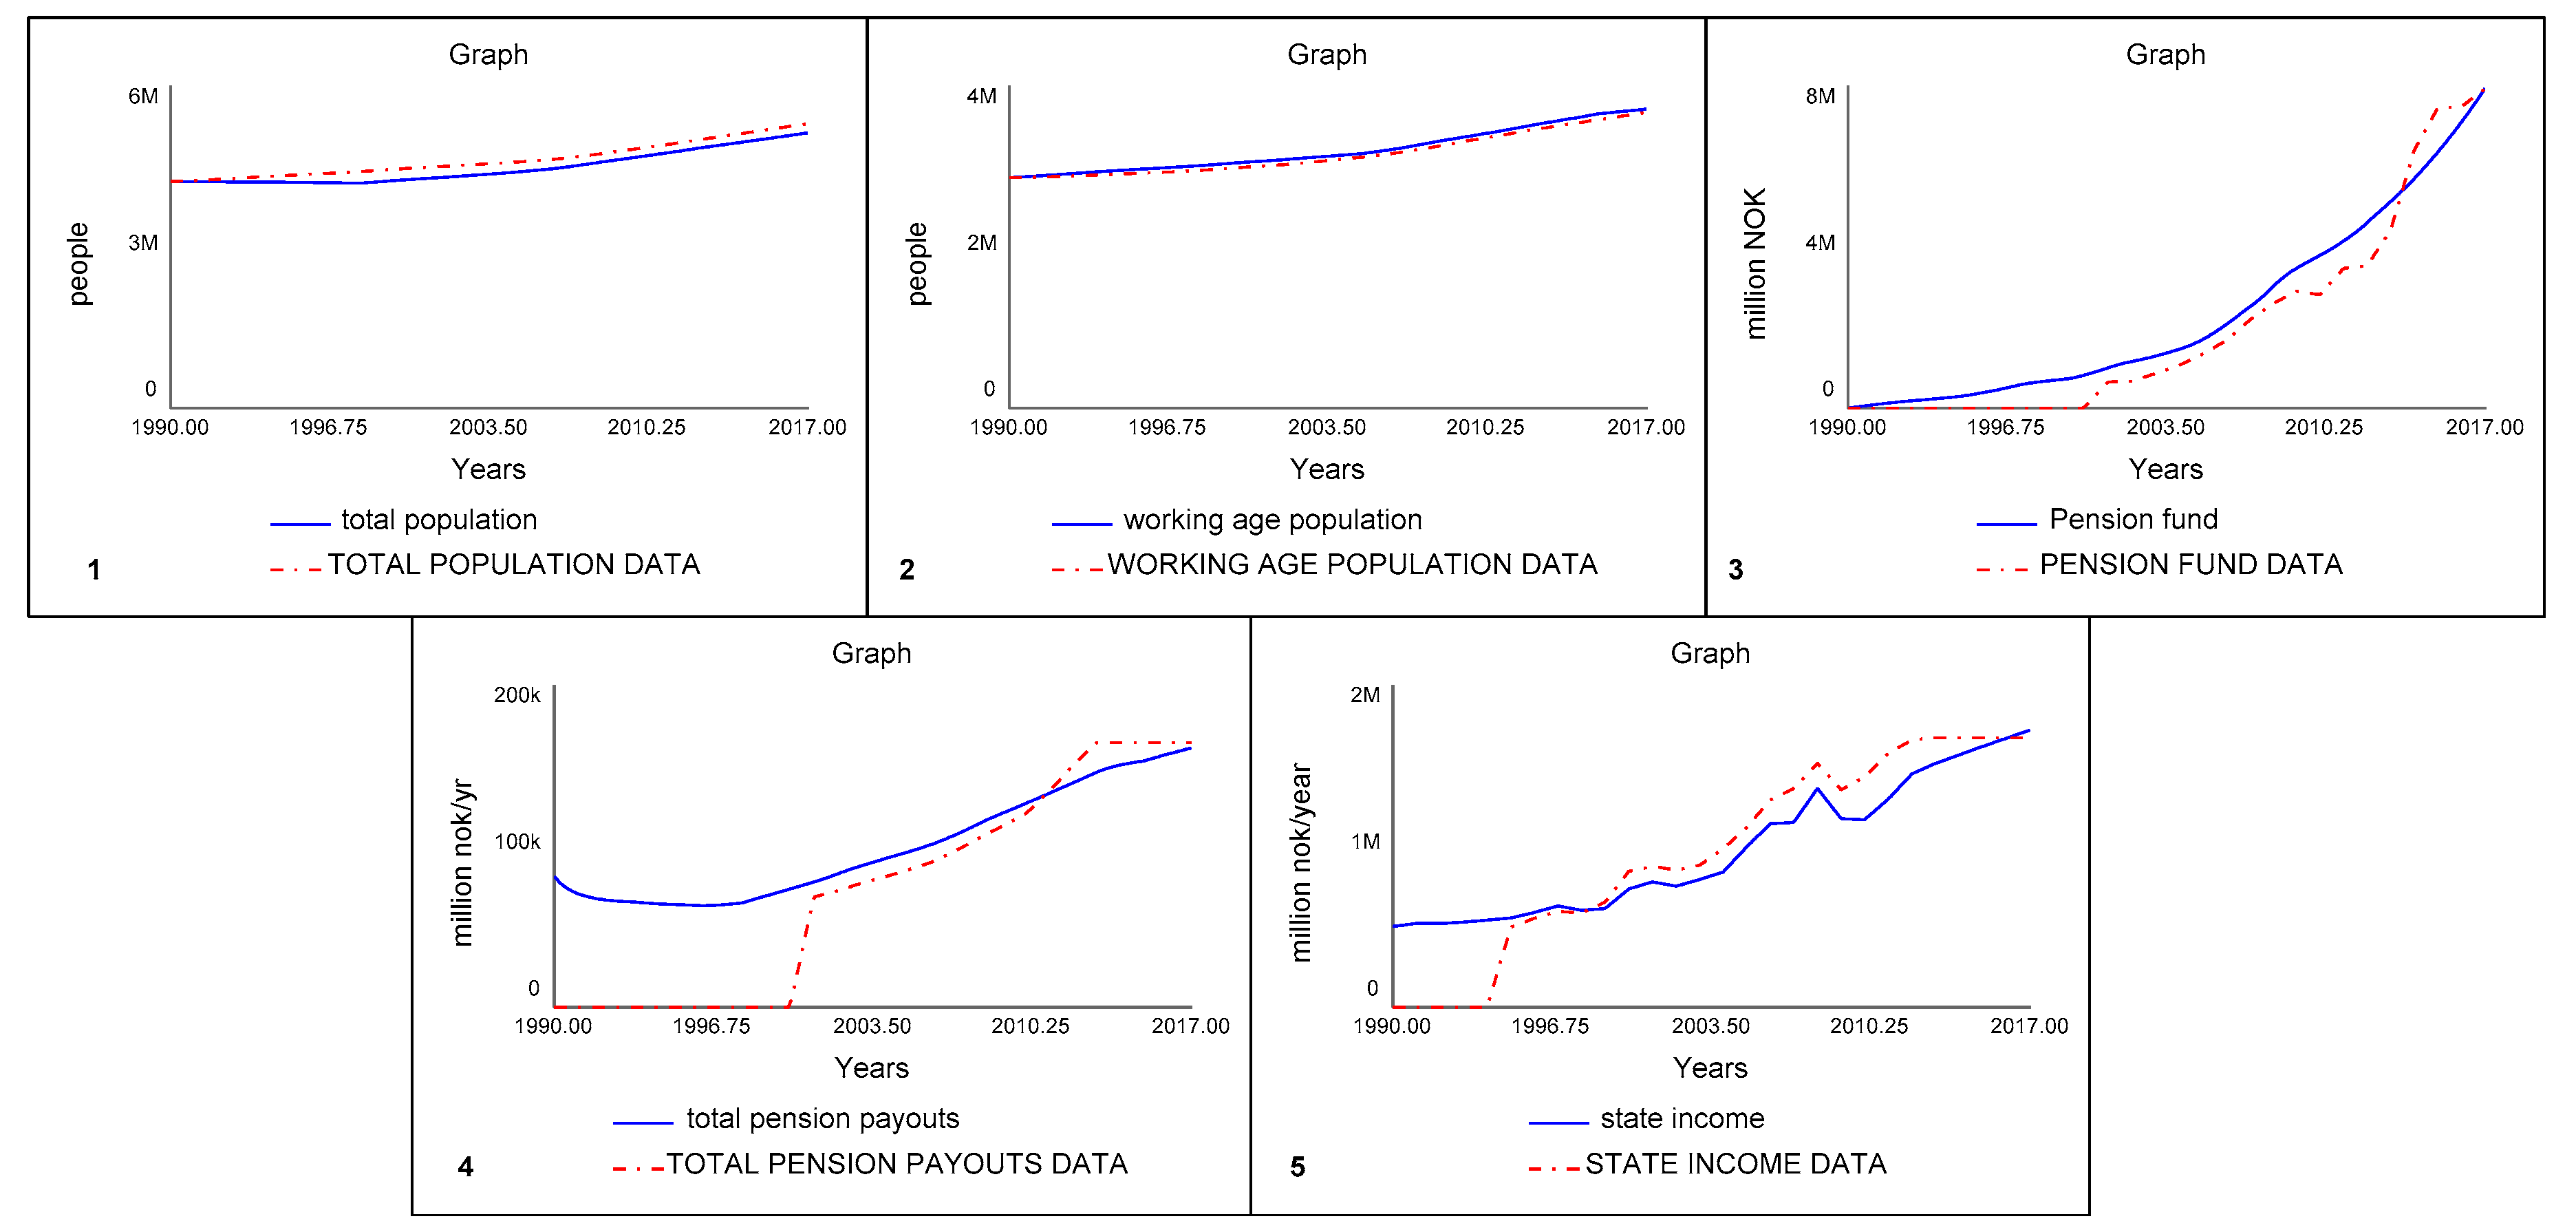
The model validation process involved comparing simulations to historical data. Model behavior is compared to several different sets of historical data (the reference mode and reference points). The reference mode along with the simulated behavior is shown in Figure 1. Several reference points were chosen in the population and state accounting systems to validate the model, including: population stocks (total Norwegian population and working age population), the Norwegian pension fund (Pension Fund Global), annual pension transfers and annual state income. These simulations along with the historical data are shown in Figure A1. It should be noted that the historical data is set to 0 to make data gaps transparent, and this is the reason simulated behavior does not match actual system behavior before the year 2000 and 1995 in graphs 4 and 5 respectively in Figure A1.
Figure A1.
Reference points used for validation. 1 = total Norwegian population (persons/year); 2 = working age population (persons/year); 3 = Norwegian pension fund (Pension Fund Global) (million NOK/year); 4 = pension transfers (million NOK/year); 5 = state income (million NOK/year). All simulations are in blue, and all historical data are in red.

Appendix A.5. Sensitivity Analysis
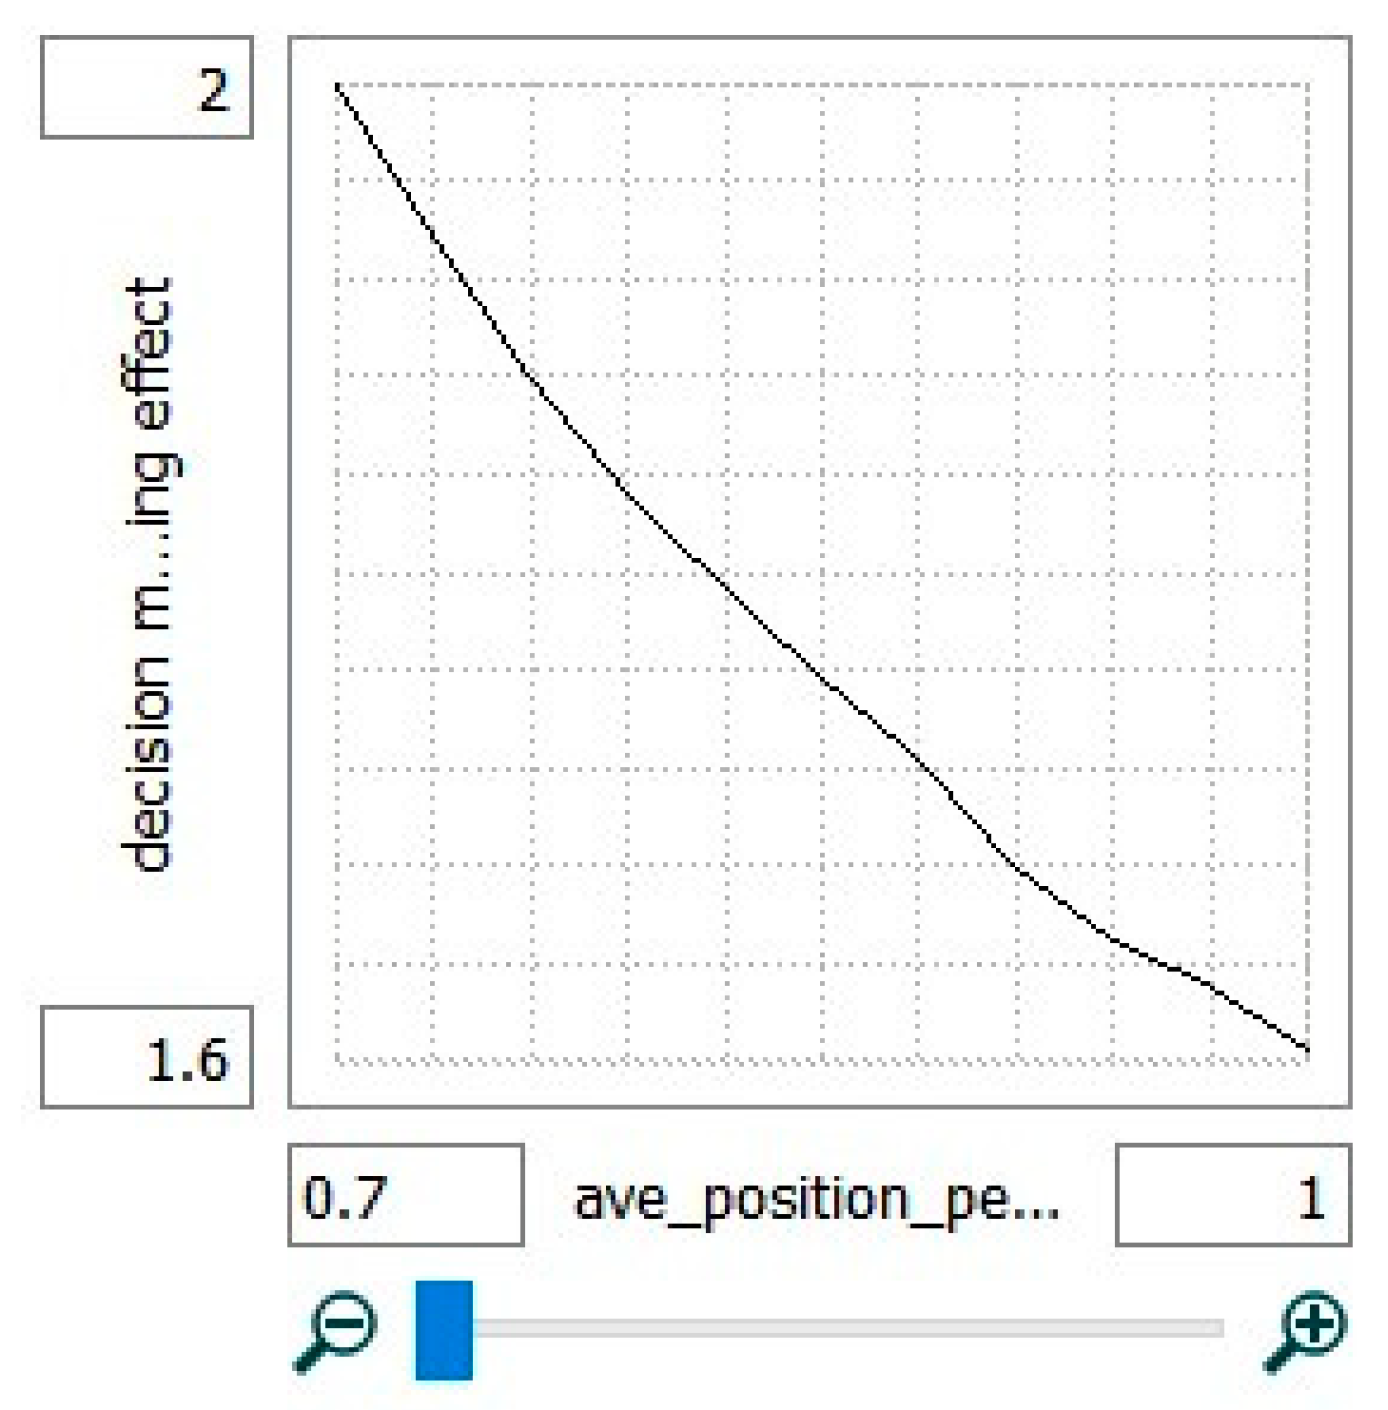
Because the model assumption concerning the decision-making effect is important for the model behavior, a sensitivity analysis was performed with this variable. This effect was modeled as shown in Figure A2 (the non-linear graphical function explained in the section: ‘Stock and Flow Diagram of Care Work Absenteeism Rates’). The effect was increased and decreased by 25% in the sensitivity analysis. The results on the reference mode behavior are shown in Figure A3, which indicate that the model is not sensitive to changes in the decision-making effect variable.
Figure A2.
Decision-making effect non-linear graphical function, explaining: as the average position percent decreases (more part-time work), the decision-making effect increases (which increases the sick rate).
Figure A2.
Decision-making effect non-linear graphical function, explaining: as the average position percent decreases (more part-time work), the decision-making effect increases (which increases the sick rate).


Appendix A.6. Methodological Limitations
System dynamics modeling is not without its limitations. All forms of mathematical modeling are simplifications of reality. Although there are validation tests that evaluate the robustness of the model, as in the sensitivity analysis shown in Appendix A, uncertainty is never fully resolved. System dynamics modeling can be taken as a very deterministic method, especially when uncertainty is not made transparent, and modelers must take extreme care of not assuming or influencing others to believe that the assumed causality represented in the model structure are actual causal relationships. System dynamics models are engineering tools, where system model design can be represented in nearly limitless ways. When one system design shows a certain outcome, this does not mean that a different model design of the same system will replicate that outcome.
This is of specific concern in a study of this nature because of the limited application of system dynamics modeling in social policy literature. As mentioned, models evolve over time, and the novelty of this study is that this is a first-iteration model, meaning there are no published models on which the model in this study could be built. Because of this, there are issues regarding not only robustness, but also of model scope. As models evolve over time, with many modelers of different backgrounds developing them, the robustness of the model is strengthened and the scope is widened, making the model outcome much more supported.
In addition to this, and related to robustness, is that one of the strengths of system dynamics modeling is also one of its weaknesses. System dynamics modeling is largely secondary analysis, but when there are literature gaps about system structure, system dynamics modeling has techniques to cope with this shortcoming. Graphical functions, e.g., as shown in Figure A2 in Appendix A, are able to approximate relationships between variables when there is a dearth of literature. System dynamics models are engineering models that do not attempt to make causal claims. In doing so, justification gaps are supported by model validation. Although graphical functions are a useful technique, it must be used with caution and tested, with its limitations made transparent. In this model, this was done with the sensitivity analysis for the decision-making effect non-linear graphical function. It is recognized that further model development is needed to strengthen the understanding of this system.
References
- Andersen, Torben, Bengt Holmström, Seppo Honkapohja, Sixten Korkman, Hans Söderström, and Juhana Vartiainen. 2007. The Nordic Model: Embracing Globalization and Sharing Risks. Helsinki: Taloustieto Oy. [Google Scholar]
- Bakken, Frøydis. 2009. Det kjønnsdelte arbeidsmarkedet i Norge. Arbeid og Velferd 4: 79–86. [Google Scholar]
- Barford, Sean, and William Whelton. 2010. Understanding Burnout in Child and Youth Care Workers. Child & Youth Care Forum 39: 271–87. [Google Scholar] [CrossRef]
- Barnett, Rosalind. 2004. Women and multiple roles: Myths and reality. Harvard Review of Psychiatry 12: 158–64. [Google Scholar] [CrossRef] [PubMed]
- Bjørnskau, Torkel. 1997. Seks Timers Dag i Omsorgsyrker: En Evaluering av Forsøket i Oslo Kommune, Rapport 232, Forskningsrapport Fafo. Oslo: Falck Hurtigtrykk. [Google Scholar]
- BLS (Bureau of Labor Statistics). 2014. Labor Force Statistics from the Current Population Survey. Available online: http://www.bls.gov/cps/cpsaat47.htm (accessed on 24 April 2016).
- Campos-Serna, Javier, Elena Ronda-Perez, Lucia Artazcoz, Bente Moen, and Fernando Benavides. 2013. Gender inequalities in occupational health related to the unequal distribution of working and employment conditions: A systematic review. International Journal for Equity in Health 12: 12–57. [Google Scholar] [CrossRef] [PubMed] [Green Version]
- Eaton, William, Amanda Kalaydjian, Daniel Scharfstein, Briana Mezuk, and Yu Ding. 2007. Prevalence and incidence of depressive disorder: The Baltimore ECA follow-up, 1981–2004. Acta Psychiatrica Scandinavica 116: 182–88. [Google Scholar] [CrossRef]
- Egeland, Catherine, and Ida Drange. 2014. Frivillig deltid-kun et spørsmål om tid? AFI 4: 2014. [Google Scholar]
- Elstad, Jon Ivar, and Mia Vabo. 2008. Job stress, sickness absence and sickness presenteeism in Nordic elderly care. Scandinavian Journal of Public Health 36: 467–74. [Google Scholar] [CrossRef] [PubMed]
- Esping-Andersen, Gøsta. 1990. Three Worlds of Welfare Capitalism. Cambridge: Polity Press. [Google Scholar]
- Esping-Andersen, Gøsta. 2009. Report to VAM. Norway’s Research Council, Velferd, Arbeidsliv og Migrasjon (VAM). Sentrale Documenter. Norway: Forskningsrådet. [Google Scholar]
- Ferragina, Emanuele, and Martin Seeleib-Kaiser. 2011. Thematic Review: Welfare regime debate: Past, present, futures? Policy & Politics 39: 583–611. [Google Scholar] [CrossRef]
- Gjesdal, Sturla, Espen Bratberg, and John Mæland. 2011. Gender differences in disability after sickness absence with musculoskeletal disorders: Five-year prospective study of 37,942 women and 26,307 men. BMC Musculoskeletal Disorders 12: 37. [Google Scholar] [CrossRef] [PubMed] [Green Version]
- Häggebrink, Ellinor, and Karolin Lovén. 2010. Absence from Work—Sweden, Eurofound. Available online: https://www.eurofound.europa.eu/observatories/eurwork/comparative-information/national-contributions/sweden/absence-from-work-sweden (accessed on 28 April 2016).
- Hansson, Anne-Sophie, Eva Vingard, Bengt Arnetz, and Ingrid Anderzan. 2008. Organizational change, health, and sick leave among health care employees: A longitudinal study measuring stress markers, individual, and work site factors. Work & Stress 22: 69–80. [Google Scholar] [CrossRef]
- Haskins, Cecilia. 2008. Systems Engineering Analyzed, Synthesized, and Applied to Sustainable Industrial Park Development. Ph.D. dissertation, Norwegian University of Science and Technology, Trondheim, Norway. [Google Scholar]
- Hennum, Nicole. 2014. Developing Child-Centered Social Policies: When Professionalism Takes Over. Social Sciences 3: 441–59. [Google Scholar] [CrossRef] [Green Version]
- Homer, Jack, and Gary Hirsch. 2006. System dynamics modeling for public health: Background and opportunities. American Journal of Public Health 96: 452–58. [Google Scholar] [CrossRef] [PubMed]
- Hytti, Helka. 2006. Why are Swedes Sick but Finns Unemployed? International Journal of Social Welfare 15: 131–41. [Google Scholar] [CrossRef]
- Ihlebæk, Camilla, Søren Brage, Bård Natvig, and Dag Bruusgaard. 2010. Forekomst av muskelog skjelettlidelser i Norge. Tidsskrift for den Norske Legeforening 130: 2365. [Google Scholar] [CrossRef]
- Karlsen, Hilde. 2012. Not so Unconventional after All: A Quantitative Study of Men in Care-Oriented Study Programmes and Professional Occupations in Norway. Oslo: Oslo and Akershus University College of Applied Sciences. [Google Scholar]
- Kostøl, Andreas. 2010. Kunnskapsoppsummering av Samfunnsvitenskapelig Litteratur om Årsaker til Sykefravær og Utstøting: Kunnskapsoppsummering til Almlid-Utvalget. Oslo: Statistisk sentralbyrå. [Google Scholar]
- Lane, David. 1999. Social theory and system dynamics practice. European Journal of Operational Research 113: 501–27. [Google Scholar] [CrossRef]
- Magnusson Hanson, Linda, Töres Theorell, Gabriel Oxenstierna, Martin Hyde, and Hugo Westerlund. 2008. Demand, control, and social climate as predictors of emotional exhaustion symptoms in working Swedish men and women. Scandinavian Journal of Public Health 36: 737–43. [Google Scholar] [CrossRef] [PubMed]
- Meadows, Donella. 2008. Thinking in Systems: A Primer. White River: Chelsea Green. [Google Scholar]
- Mitchie, Susan, and Sian Williams. 2003. Reducing work related ill-health and sickness absence: A systematic literature review. Occupational and Environmental Medicine 60: 3–9. [Google Scholar] [CrossRef]
- Montgomery, Tom, Micaela Mazzei, Simone Baglioni, and Stephen Sinclair. 2017. Who cares? The social care sector and the future of youth employment. Policy & Politics 45: 413–29. [Google Scholar] [CrossRef]
- NAV (Arbeids- og velferdsforvaltningen/Norwegian Labour and Welfare Administration). 2014. Sykefraværsstatistikk: Sykefraværstilfeller 4. Kvartal 2005–2014. Diagnose og Kjønn. Antall og Present. Available online: https://www.nav.no/no/NAV+og+samfunn/Statistikk/Sykefravar+-+statistikk/Sykefravar (accessed on 24 April 2016).
- Nikolaou, Ioannis. 2016. Occupational health and safety within corporate social responsibility context: A balanced scorecard dynamic decision making model. International Journal of Decision Support Systems 2: 54–70. [Google Scholar] [CrossRef]
- OECD (Organisation for Economic Co-operation and Development). 2010. Sickness, Disability and Work: Breaking the Barriers: A Synthesis of Findings across OECD Countries. Paris: OECD Publishing. [Google Scholar]
- ONS (Office for National Statistics). 2014. Full Report: Sickness Absence in the Labour Market. Available online: www.ons.gov.uk/ons/dcp171776_353899.pdf (accessed on 24 April 2016).
- Ose, Solveig Osborg, Lin Jiang, and Brita Bungum. 2014. Det Kjønnsdelte Arbeidsmarkedet og Kvinners Arbeidshelse. Trondheim: SINTEF Teknologi og Samfunn. [Google Scholar]
- Palmer, Erika. 2017a. Systems Engineering Applied to Evaluate Social Systems: Analyzing Systemic Challenges to the Norwegian Welfare State. Ph.D. dissertation, University of Bergen, Bergen, Norway. [Google Scholar]
- Palmer, Erika. 2017b. Structural disadvantage: Evidence of gender disparities in the Norwegian pension system. Social Sciences 6: 22. [Google Scholar] [CrossRef]
- SSB (Statistisk sentralbyrå/Statistics Norway). 2010. Women and Men in Norway: What the Figures Say. Available online: https://www.regjeringen.no/globalassets/upload/bld/rapporter/2010/cedaw_rapporten/annex_3.pdf (accessed on 24 April 2016).
- SSB (Statistisk sentralbyrå/Statistics Norway). 2016a. Arbeidskraftundersøkelsen, 1. Kvartal 2016. Available online: https://www.ssb.no/arbeid-og-lonn/statistikker/aku (accessed on 3 May 2017).
- SSB (Statistisk sentralbyrå/Statistics Norway). 2016b. Sykefravær, 4. Kvartal 2015. Available online: https://www.ssb.no/arbeid-og-lonn/statistikker/sykefratot/kvartal (accessed on 3 May 2017).
- SSB (Statistisk sentralbyrå/Statistics Norway). 2017. Sykefravær. Available online: https://www.ssb.no/arbeid-og-lonn/statistikker/sykefratot (accessed on 31 January 2018).
- Sterman, John. 2000. Business Dynamics: Systems Thinking and Modeling for a Complex World. New York: McGraw-Hill. [Google Scholar]
- Stewart, Nicole. 2013. Missing in Action: Absenteeism Trends in Canadian Organizations. Ottawa: The Conference Board of Canada. [Google Scholar]
- Yerkes, Mara. 2009. Part-time work in the Dutch welfare state: The ideal combination of work and care? Policy & Politics 37: 535–52. [Google Scholar] [CrossRef]
- Zanier, Maria Letizia, and Isabella Crespi. 2015. Facing the Gender Gap in Aging: Italian Women’s Pension in the European Context. Social Sciences 4: 1185–206. [Google Scholar] [CrossRef]
Figure 1.
Reference mode and simulated behavior of male (green-data, red-simulation) and female (pink-data, blue-simulation) work absenteeism rates (in percent).
Figure 1.
Reference mode and simulated behavior of male (green-data, red-simulation) and female (pink-data, blue-simulation) work absenteeism rates (in percent).
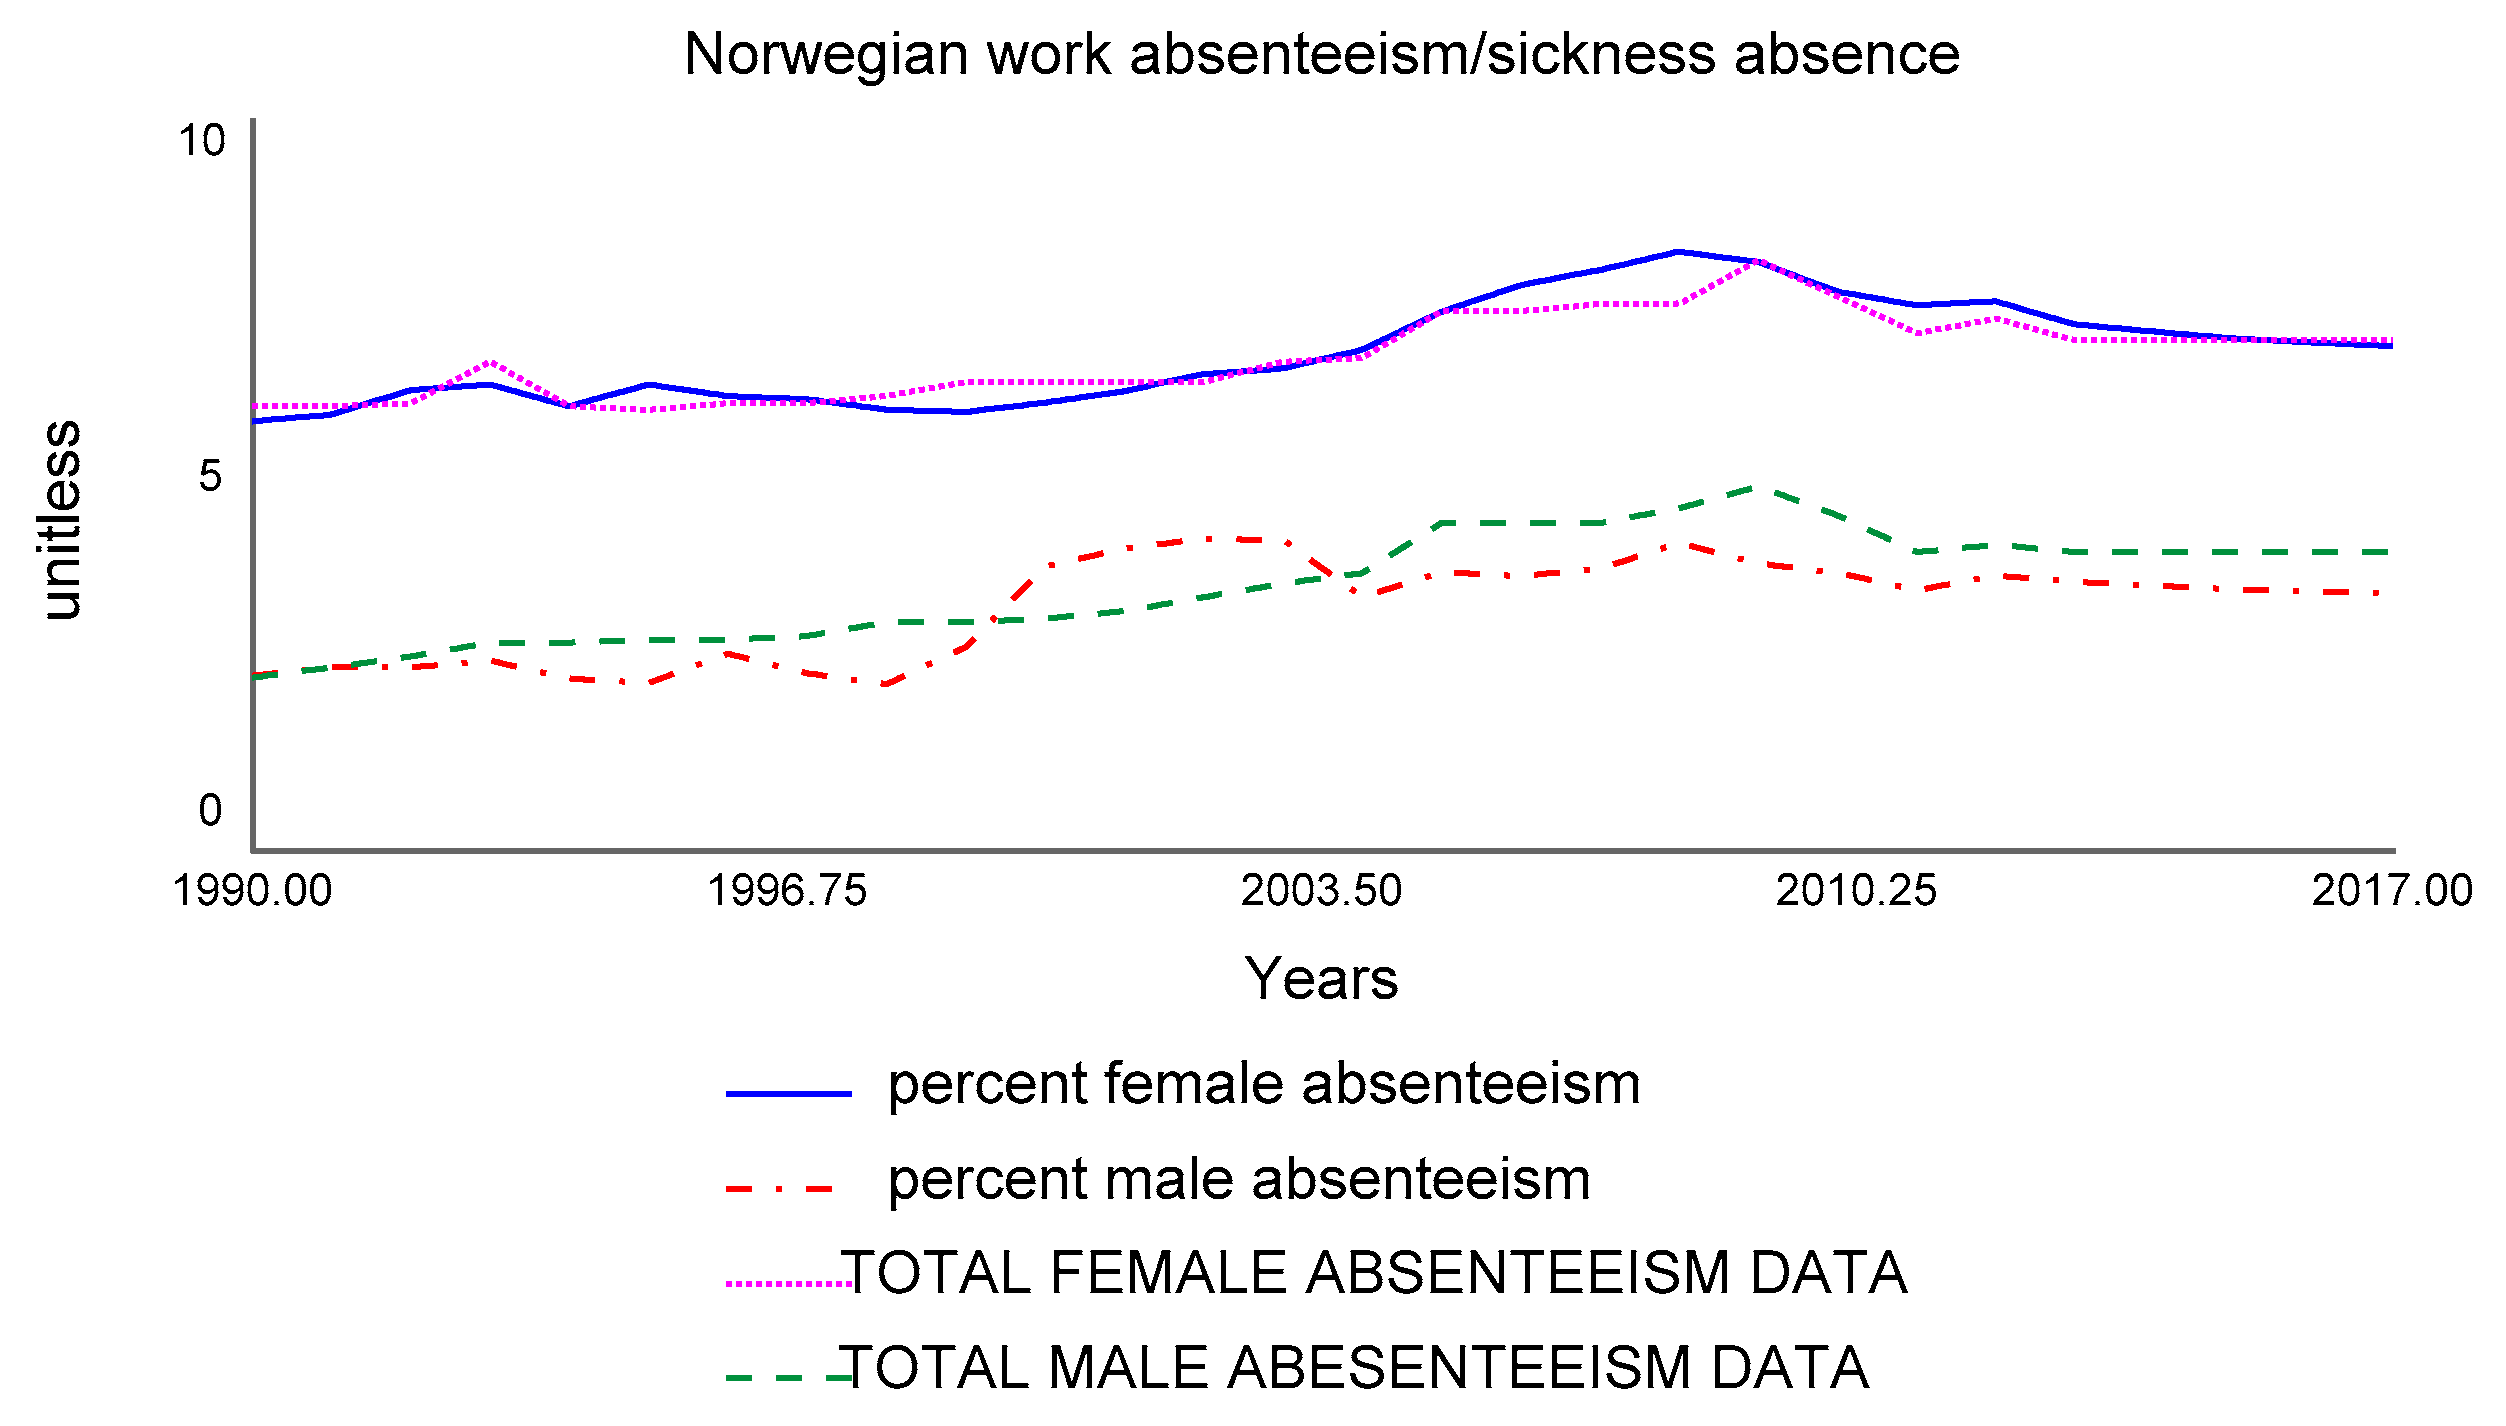
Figure 2.
The stock and flow diagram for absenteeism in care work. Adj. = adjusted; Mltpr. = multiplier; Avg. = average.
Figure 2.
The stock and flow diagram for absenteeism in care work. Adj. = adjusted; Mltpr. = multiplier; Avg. = average.

Figure 3.
Total work absenteeism expenditures (Run 1 to 2017) and total work absenteeism expenditures without care work effects after 2017 (Run 2) in million NOK per year.
Figure 3.
Total work absenteeism expenditures (Run 1 to 2017) and total work absenteeism expenditures without care work effects after 2017 (Run 2) in million NOK per year.
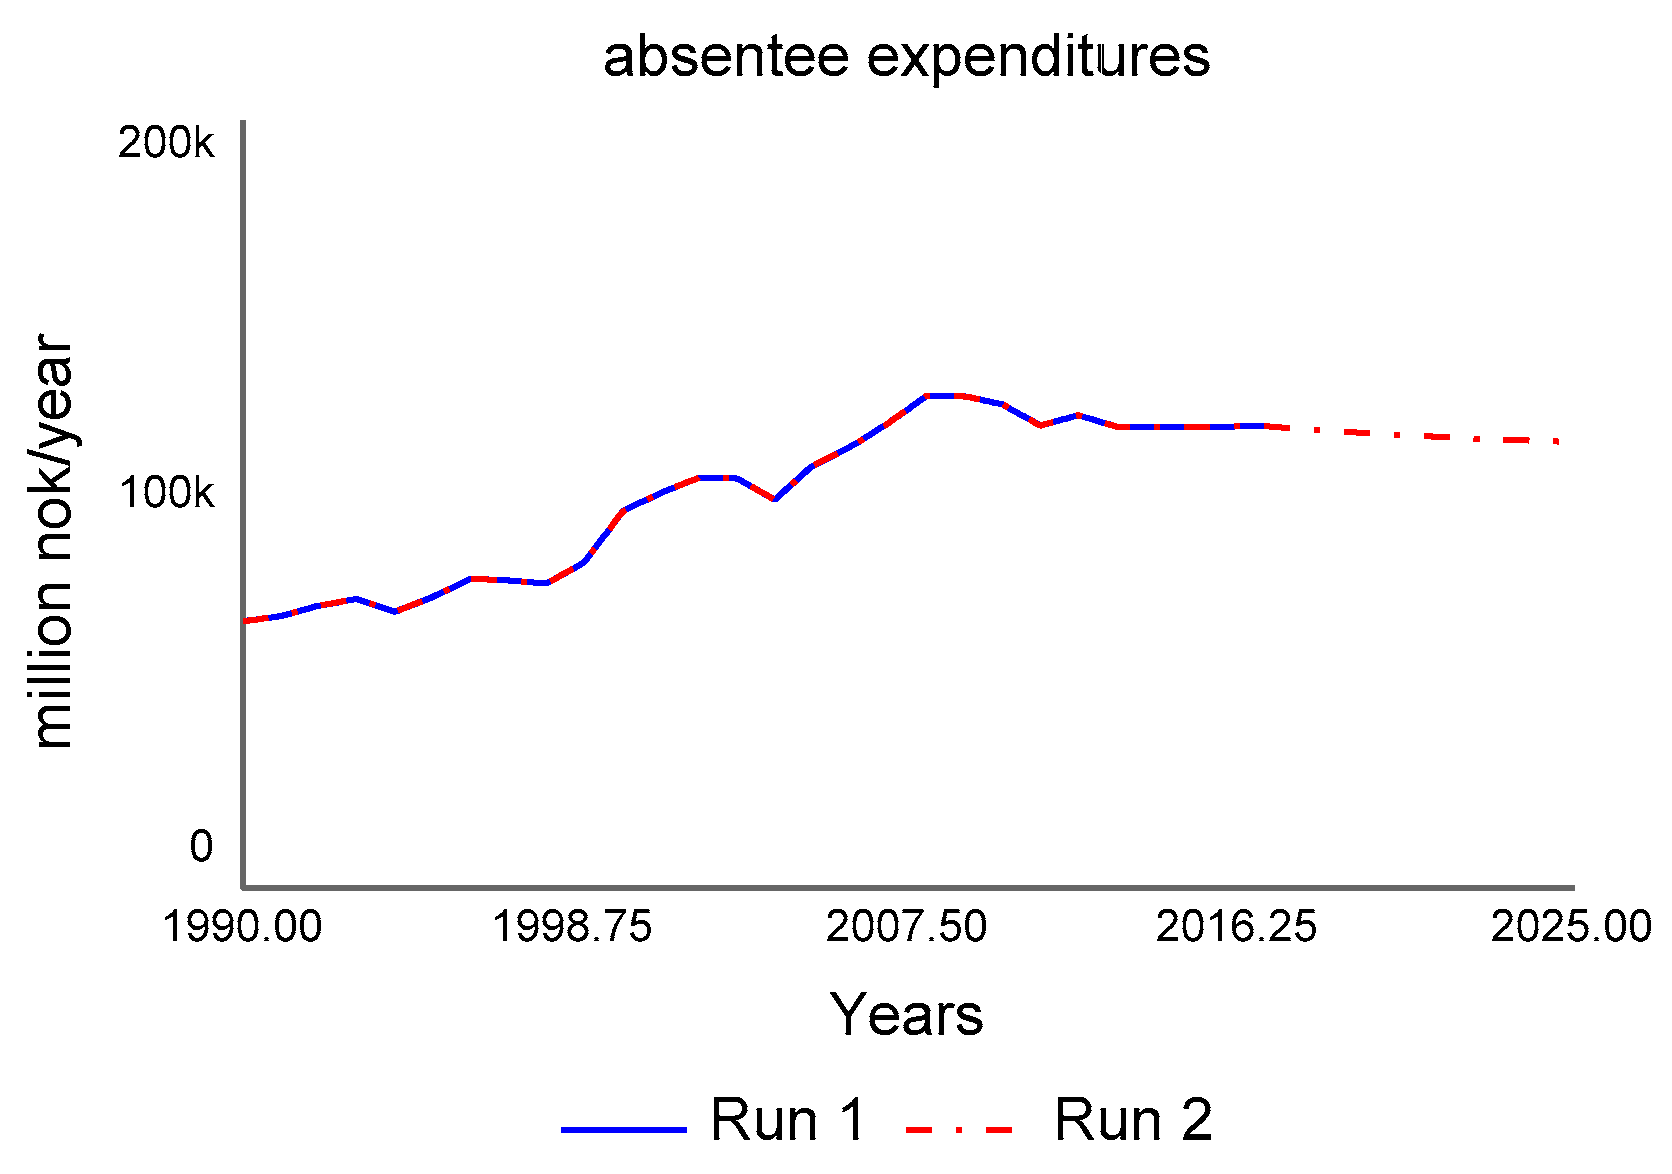
Figure 4.
CLD of the model showing part-time work and fatigue reinforcing loops and the hiring balancing loop.
Figure 4.
CLD of the model showing part-time work and fatigue reinforcing loops and the hiring balancing loop.

© 2018 by the author. Licensee MDPI, Basel, Switzerland. This article is an open access article distributed under the terms and conditions of the Creative Commons Attribution (CC BY) license (http://creativecommons.org/licenses/by/4.0/).
Share and Cite
MDPI and ACS Style
Palmer, E. The Heavy Cost of Care: Systemic Challenges in Norwegian Work Absenteeism. Soc. Sci. 2018, 7, 94. https://doi.org/10.3390/socsci7060094
AMA Style
Palmer E. The Heavy Cost of Care: Systemic Challenges in Norwegian Work Absenteeism. Social Sciences. 2018; 7(6):94. https://doi.org/10.3390/socsci7060094
Chicago/Turabian StylePalmer, Erika. 2018. "The Heavy Cost of Care: Systemic Challenges in Norwegian Work Absenteeism" Social Sciences 7, no. 6: 94. https://doi.org/10.3390/socsci7060094
Note that from the first issue of 2016, this journal uses article numbers instead of page numbers. See further details here.