Article

Can Social Capital influence Smallholder Farmers’ Climate-Change Adaptation Decisions? Evidence from Three Semi-Arid Communities in Burkina Faso, West Africa

by
Thomas B. Yaméogo
1,
William M. Fonta
1,2,* and
Tobias Wünscher
3
1
West African Science Service Center on Climate Change and Adapted Land Use, Ouagadougou 22650, Burkina Faso
2
Earth Institute, Columbia University in the City of New York, New York, NY 10027, USA
3
Center for Development Research, University of Bonn, Walter-Flex-Str. 3, 53113 Bonn, Germany
*
Author to whom correspondence should be addressed.
Soc. Sci. 2018, 7(3), 33; https://doi.org/10.3390/socsci7030033
Submission received: 5 February 2018 / Revised: 23 February 2018 / Accepted: 24 February 2018 / Published: 28 February 2018

Abstract

:
This study examines the influence of farmers’ social capital on their decisions to deal with climate change and climate variability in Burkina Faso. The study is based on a household survey conducted among 450 households, randomly selected from three communities in Burkina Faso. Two indexes were constructed to capture farmers’ structural and cognitive social capital; and using generalized Poisson regression (GPR) and a multivariate probit model, the study probes the effect of farmers’ social capital on their choice of adaptation alternatives, the number of adaptation practices used, and the extent to which adaptation measures were applied. The results indicated that the effect of social capital depends on the type of indicator used and on the type of adaptation strategies necessary. Farmers’ cognitive social capital was significantly and positively related to their choice of soil and water conservation techniques (SWCT), and techniques such as agroforestry and irrigation. Structural social capital, on the other hand, was positively associated with the adoption of new varieties and conservation tillage strategies and negatively associated with the use of a crop-diversification strategy. The results also highlighted that socio-economic, institutional and agro-ecological variables determine farmers’ decisions to adapt to climate change.

1. Introduction

Producers in Sub-Saharan African are among the most vulnerable to climate change impacts (Hummel et al. 2012; Niang et al. 2014). This vulnerability is exacerbated by multiple stresses occurring at different levels, namely the dependence of agriculture on rainfall, recurrent drought, poverty, population growth and low adaptive capacity (Kurukulasuriya et al. 2006; Boko et al. 2007; West et al. 2008; Hassan 2010). Climate change projections using the MAGICC/SCENGEN model show that Burkina Faso’s climate will undergo a gradual decrease in rainfall over the years (decline in rainfall of 3.4% by 2025, and 7.3% by 2050); and this low drop in rainfall would more likely be coupled with a very strong seasonal and inter-annual variability of climatic factors. As far as temperature is concerned, the simulations indicate that the country will experience an increase in average temperature of about 0.8 °C by 2025 and 1.7 °C by 2050 (SP/CONEDD 2007). Such changes may engender, among other things, disruption of the agricultural calendar, a reduction in agricultural yields, the extinction of less-resilient species, water deficits, and the emergence of some pests. Consequently, farmers have to make significant changes in their management practices, land use and off-farm activities. It is, therefore, important to identify and analyse the factors and incentives that can hinder or facilitate the implementation of climate-change adaptation measures.
According to some scholars, climate-change adaptation is also a dynamic social process (Adger 2001) and, thus, underpinned by socio-cultural characteristics of the society or group that is adapting (Wolf 2011). In other words, social capital, besides human and physical capital, also plays a crucial role in farmers’ decision-making processes. Many authors for example, (Isham 2002; Katungi 2007), have acknowledged the non-negligible role played by this capital on farmers’ decision process. In this study, social capital refers to the World Bank conception in which it is defined as the norms and networks that enable collective action (World Bank 2005). More generally, it refers to the degree of social connectivity and can have both positive and negative effects on an individual’s decision. Social capital manifests in two ways: structural social capital (SSC) and cognitive social capital (CSC) (Uphoff 2000; Dasgupta et al. 2014). The structural form is extrinsic and observable, and is associated with various forms of social organization such as roles, rules, precedents and procedures, as well as social networks and associations (Hampel-Milagrosa 2007). The cognitive form of social capital is more internal (subjective) and unobservable (norms, shared values, attitudes and beliefs). This form predisposes people towards cooperation and collective decisions.
In the rural African context, social ties (reciprocity, cooperation, solidarity etc.) and local area dynamism (perception, beliefs, norms etc.) shape farmers’ daily actions in the sense that they can help them to speed up disaster responses and reduce exposure to external risks (Carter and Maluccio 2003). It is, therefore, important to take these features into account when introducing new technologies or knowledge in a given society; otherwise, they may act against adaptation decisions (Di Falco and Bulte 2009, 2013). Another important pillar to consider in rural society are farmers’ social networks. Indeed, membership in social groups, kinship and friendship networks can provide channels for information dissemination, knowledge sharing, and social interaction. These networks can lead to informal or formal financial sources. For example, a farmer can easily have access to an informal source of credit (from his friends and kinsmen) or formal credit (through farmers’ associations); in this respect, Katungi (2007) argues that the availability of credit relaxes the financial constraints and allows farmers to afford the cost of adaptation.
In climate-change adaptation literature, less attention has been paid to the effect of farmers’ social capital (especially, concepts such as trust, solidarity and cooperation) in their decision-making process. However, there is no unanimous agreement on the definition of social capital within the literature; early attempts in Burkina Faso only reduced farmers’ social capital to their membership in groups and associations (McCarthy et al. 2002; Dutilly-Diane et al. 2003). To fill the gap, this paper incorporates the missing dimensions of social capital (kinship and friendship networks, trust, solidarity and cooperation) to examine the role of social capital on farmers’ decisions to deal with climate change and climate variability in Burkina Faso. More specifically, the study seeks to answer the following research questions: what effects do cognitive and structural social capitals have in farmers’ climate-change adaptation decisions? Are social capital variables determinants of the number of adaptation practices used, and the extent of adaptation? In answering these questions, the following working hypotheses were formulated.
H1. 
Households with higher social capital have greater adaptive capacity.
H2. 
The scale of farmers’ adaptation to climate change is positively correlated with the degree of their social capital.
The rest of the paper is structured as follows. The next section briefly reviews the theoretical and empirical literature on the concept of social capital and its role in the decision-making process. The methodology is presented in Section 3. This includes the sampling procedure, data description and analytical methods. The results are presented and discussed in Section 4. Section 5 concludes and provides some useful policy recommendations.

2. The Concept of Social Capital: A Brief Review

The concept of social capital has been subject to multiple definitions, interpretations, and uses in previous studies. It came to prominence following the work of Pierre Bourdieu (1983), James S. Coleman (1988) and Robert D. Putnam (1993, 2000). According to Bourdieu, economic capital, cultural capital and social capital are interrelated and intersubstitutable; the volume of an individual’s social capital is related to the size of the network of connections he can effectively mobilize, as well as to the volume of the other forms of capital he has accumulated. For Coleman, social capital refers to anything that can facilitate individual or collective action. Furthermore, Coleman views social capital as a conceptual tool between two broad intellectual streams in the description and explanation of social action: the sociological theory, in which the actor is socialized and his action, governed by social norms, rules, and obligations; and economic theory, in which the actor is “homo economicus” or economic man, rational and narrowly self-interested. By contrast, Putnam defines social capital as: “features of social organization, such as networks, norms, and trust, which facilitate coordination and cooperation for mutual benefit” (Putnam 1993). Nevertheless, to date, for substantive and ideological reasons, there is no unanimous agreement on the definition of social capital within the literature (Claridge 2004).
Most empirical studies have shown a positive link between social capital and the adoption of fertilizers (Isham 2002), soil-fertility management technologies (Ali et al. 2007; Njuki et al. 2008), sustainable agricultural practices (Munasib and Jordan 2011; Silici 2016), forest-resource management (Nath et al. 2011), new technology (Katungi 2007), and climate-change adaptation strategies (Balew et al. 2014). In Burkina Faso, McCarthy et al. (2002) found a positive effect of social capital (in the form of cooperation) on farmers’ natural-resource management activities such as reforestation and erosion-control activities in the north-eastern part of the country. According to Dutilly-Diane et al. (2003), in the Sahelian zone of Burkina Faso, the population’s social capital improves their capacity to cooperate in the management of common property pastures used to graze livestock, and thus raises livestock productivity. By contrast, some studies have shown that social capital may also inhibit farmers’ activities (dark side effects) as a result of obligations within the network. For instance, Paul et al. (2016), examined the relationship between social capital and climate-adaptation behaviours in 20 rural communities in the Ethiopian Rift Valley. The authors found that social capital is negatively related to individual-level adaptation activities. For Adger et al. (2009), cultural and societal norms and values could act as hindering factors to adaptation. According to the authors, these factors, together with perceptions, determine what is perceived to be a limit to adaptation at both individual and social levels in any particular society. Strong social networks may act as a conduit for misperception (Agrawal 2010); this may therefore distort household decision-making (Di Falco and Bulte 2009), and attenuates the incentives to adopt technologies (Di Falco and Bulte 2013). Exploring the effects of sharing norms within kinship networks on the adoption of technologies in Ethiopia, Di Falco and Bulte (2013) demonstrated how traditional sharing norms invite free riding and attenuate incentives to adopt technologies that reduce exposure to weather shocks.

3. Material and Methods

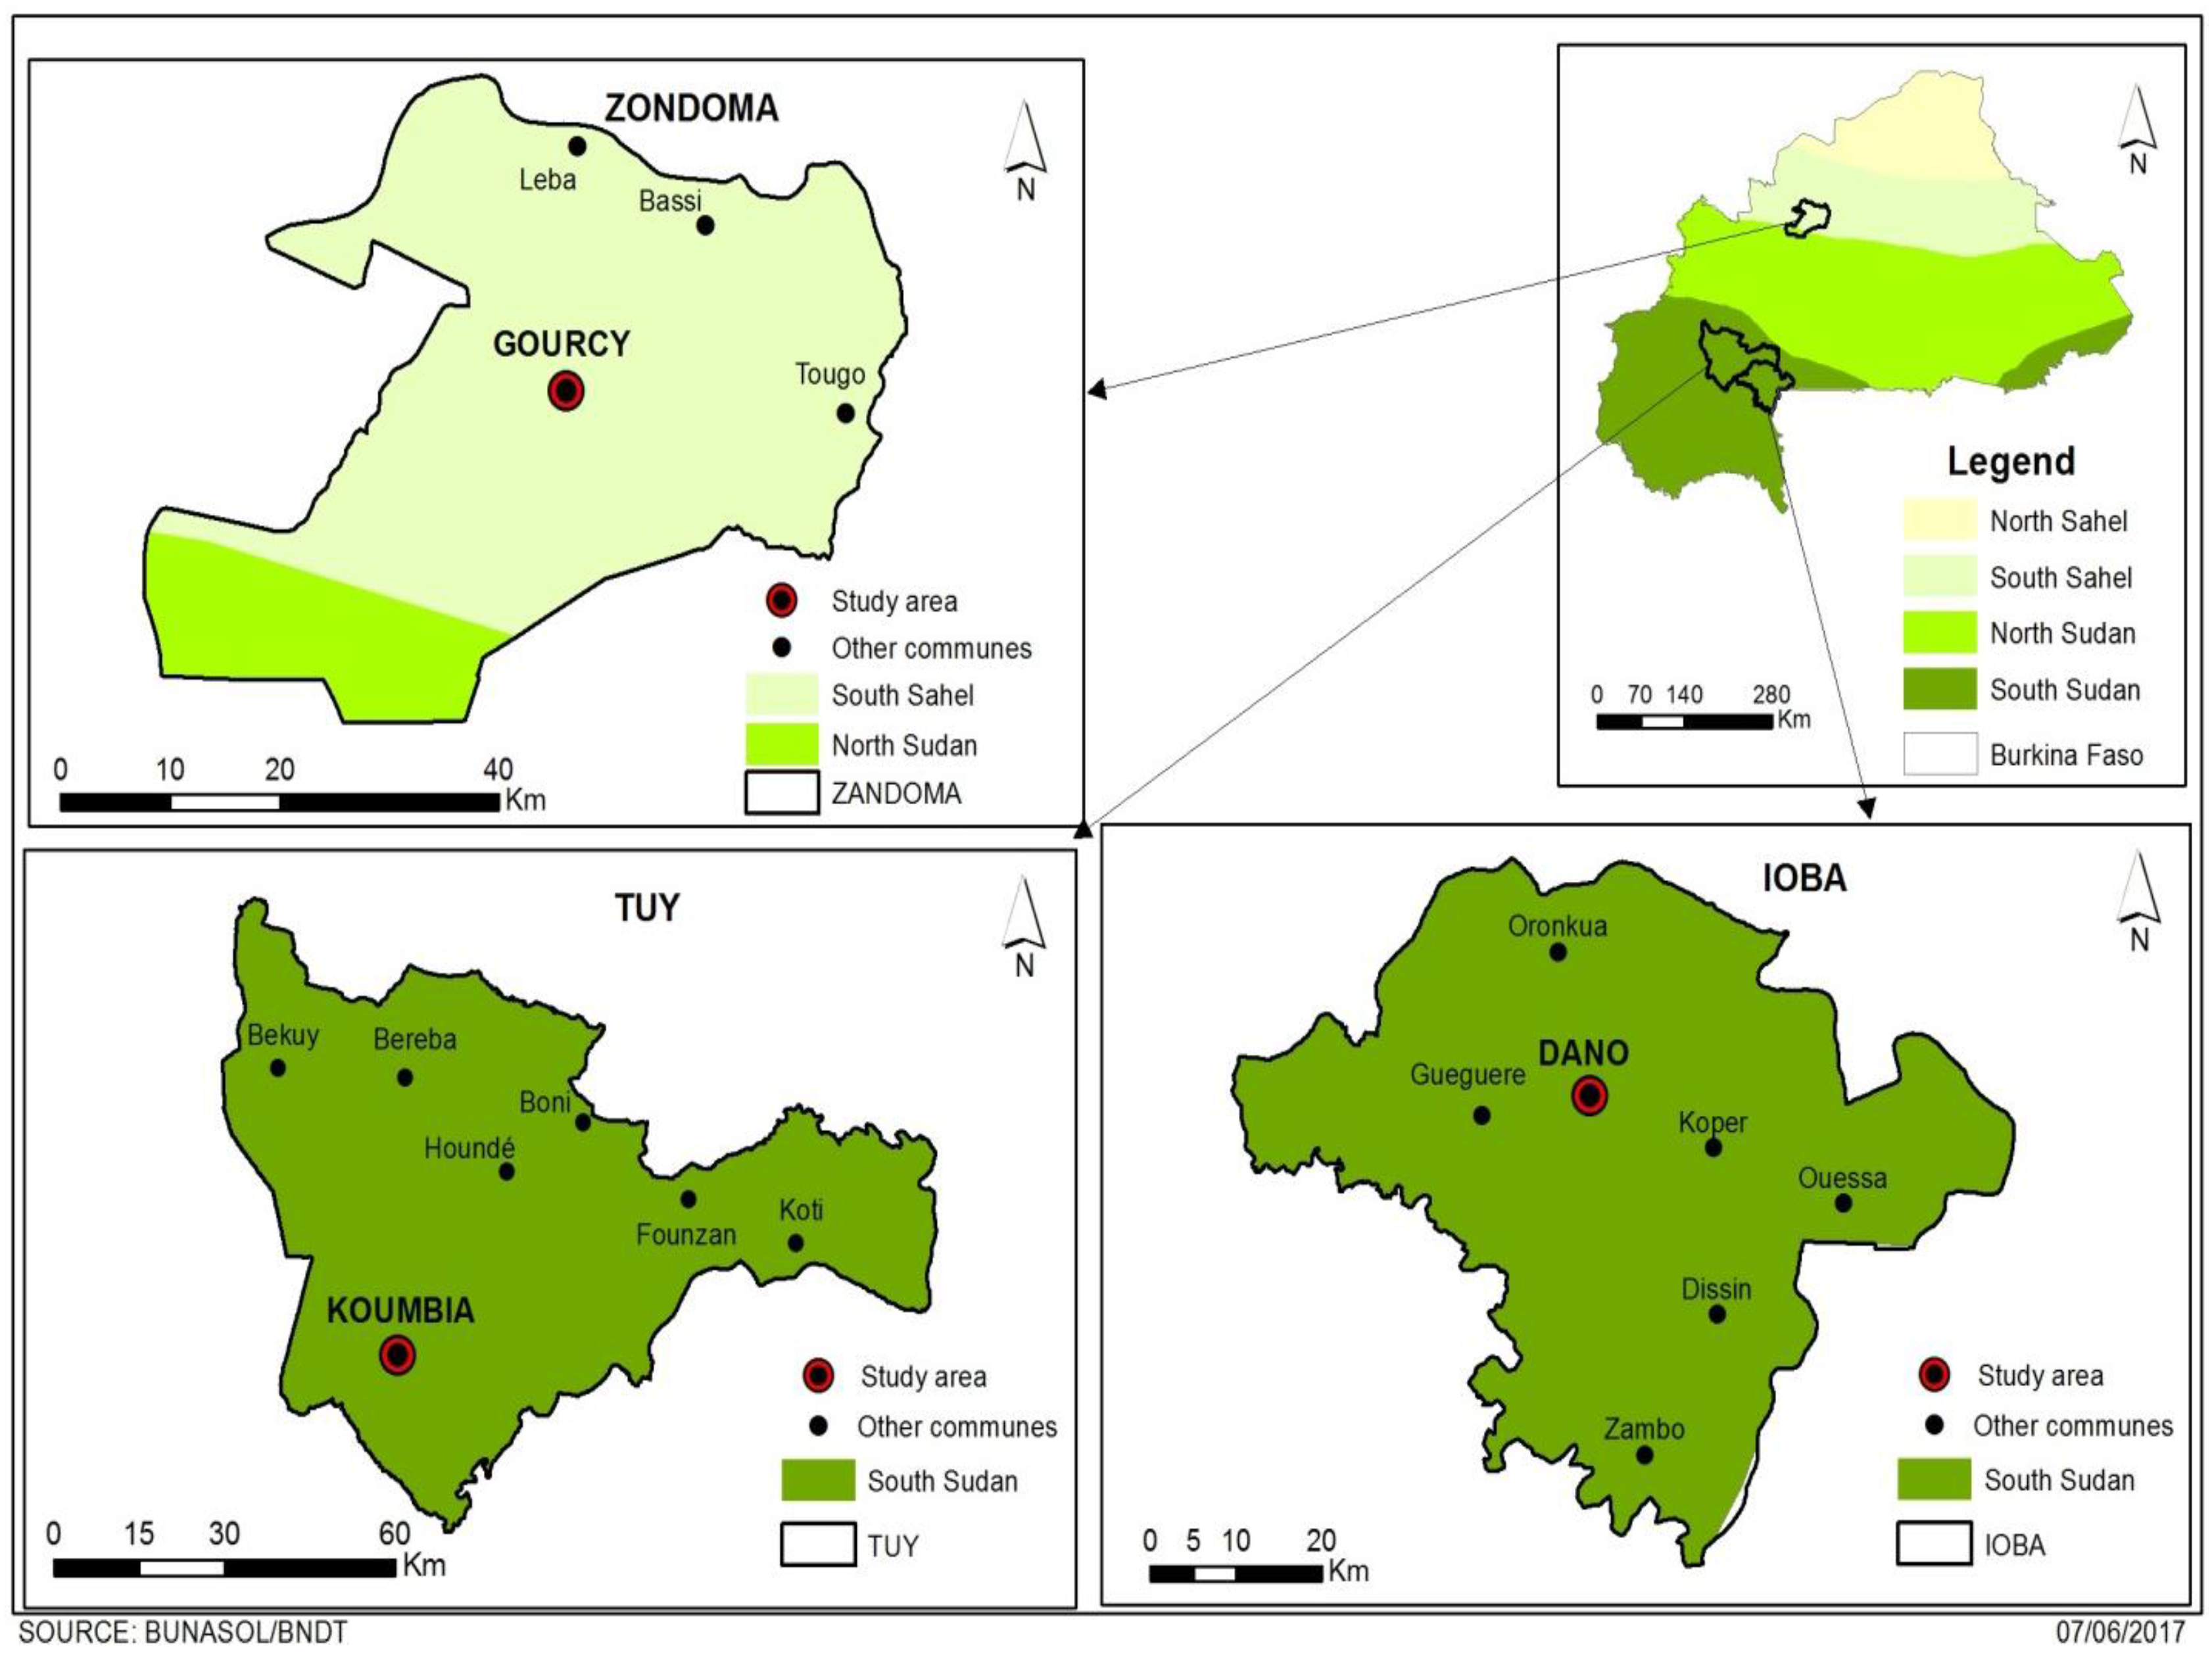
3.1. Study Area and Data

The data used in this study was drawn from a cross-sectional study at household and village levels in three (3) rural communes in Burkina Faso (Figure 1). These include the rural communes of Gourcy (13°13′ N–2°21′ W) in Zondoma province, Dano (11°55′ N–3°22′ W) in Ioba province and Koumbia (11.226898° N–3.713379° W) in Tuy province1. Zondoma province is located in the Nord region of Burkina Faso. The area is characterized by erratic, insufficient, and improperly distributed precipitation. The annual rainfall is between 500 mm and 750 mm with a mean annual temperature of 28.3 °C. Ioba and Tuy provinces are situated in the Sud-Ouest and Hauts-Bassins regions, respectively. These areas are endowed with relatively good rainfall and are among the better-watered areas of Burkina Faso. The annual rainfall is between 900 mm and 1200 mm and average annual temperature is 27.7 °C; this adds to the good quality of soils, conferring on these provinces propitious areas for agro-pastoral activities. The three sites were selected in order to capture the effect of farmers’ geographical position (weather conditions’ impact) on their response to climate hazards.
Data were collected between May and September 2013 through two complementary approaches: a household survey and focus group discussions. Considering the budget constraints, logistical realities and time frame devoted to this research, a homogeneous sampling method was adopted. The main disadvantage of this technique is that it can be highly prone to researcher bias (subjectivity and non-probability based nature of unit selection). The sampling technique used was a multi-stage sampling technique. In the first stage, three rural communes were purposively selected to capture differences in weather conditions. The rural commune of Dano was selected as a given area based on the authors’ experiences and familiarities with the region. The two other rural communes (Koumbia and Gourcy) were selected based on their local agroecological and climate conditions compared to Dano. For that, we used statistical tests (the F-test for the variability; the T-test to insure that the variability is not caused by difference in means) to compare data of different rainfall stations of Burkina Faso. In each rural commune, villages were classified into three strata based on the number of associations and organizations (low, medium, and high concentration). Within each stratum, one village was randomly selected. Thus, a total of nine villages were selected: Gnikpière, Tampiri and Tambikpière for Dano rural commune; Mako, Koundouba and Zindiguessé for Gourcy; and Waly, Kongolékan and Sébèdougou for Koumbia. In the last stage, a sample of fifty (50) households was randomly chosen in each village resulting in a total sample of 450 households.
The study areas are characterized by tropical climate with an unimodal rainfall curve with two seasons: a short rainy season and a long dry season (5 to 6 months in the Dano and Koumbia areas and 7 to 9 months in the Gourcy area), which is marked by small climatic variations.

3.2. Analytical Methods

A two-step econometric approach was used to identify factors influencing farmers’ choice of adaptation alternatives, the number of adaptation practices used by farmers, and the extent to which they are applied. In the first approach, we analysed the impact of social capital on the level of adoption of adaptation technologies (extent of adaptation and intensity of adaptation). In the second approach, the effect of social capital on farmers’ choice of adaptation measures was investigated using a multivariate probit model.

3.2.1. Social Capital and Adoption of Adaptation Technologies by Farmers

Following Van Rijn et al. (2012), the relationship between social capital and the adoption of adaptation technologies (extent of adaptation and number of technologies used) can be stated as:
I i j k = β 0 + β 1 S C i j k c + β 2 S C i j k s + β 3 X i j k + + β 4 Z k + ε i j k   ,
where I ij k refers to the “adoption indexes” of farmer i in village j in local area k (k = 1, 2, 3); S C i j k c , S C i j k s refers, respectively, to the cognitive and the structural social capital indicator of farmer i in village j in local area k. X i j k ; and Z k refers to the vector of household characteristics and a set of local area dummies.
Two sets of adoption indexes are constructed: “the intensity of use of adaptation strategies” and “the extent of adoption of adaptation technologies”. The intensity of adaptation (number of adaptation strategies) and the extent of adaptation (portion of the total farm area) are measured as counts. Since the response variables are all positive integers, we can assumed this follows the Poisson process (Cameron and Trivedi 2005; Greene 2011) and can thus be modelled using the basic Poisson model. In the literature, this model has been used to explain the adoption of agricultural and natural-resource management (Ramirez and Shultz 2000), the intensity of adoption of conservation agriculture (Pedzisa et al. 2015), and soil- and water-conservation practices (Nkegbe and Shankar 2014).
The probability of adopting k practices (the k t h degree of adaptation) given n independent technologies is represented by the binomial distribution as follows:
P ( Y = k ) = ( n k ) P k ( 1 P ) n k ,
where ( n k ) = n ! k ! ( n k ) ! and P is the probability of adopting k practices (the k t h degree of adaptation). The density function for Poisson regression is given as:
f ( y i | X i ) = e λ i λ i y i y i ! ,
where λ i is assumed to be log-linearly related to regressors X i   : l n λ i = X i β .
The log-likelihood function for a Poisson regression model is given as:
l n L = [ λ i + y i X i β l n y i ! ] ,
The mean and variance of this distribution can be shown to be:
E ( y i | X i ) = V a r ( y i | X i ) = λ i = e X i β     E ( y i | X i ) X i = λ i β ,
This model has been criticized because it assumes equidispersion, which restricts the conditional variance to equal the conditional mean (Greene 2011). The equidispersion condition in the Poisson distribution is often not realistic because count data variance usually exceeds the mean (Cameron and Trivedi 2005). The data is called overdispersed if the variance exceeds the mean, and underdispersed if the variance is less than the mean.
Since the Poisson estimator is still consistent but inefficient, the most common solution proposed by the literature is to generalize the Poisson model by relaxing the equidispersion condition (Consul and Famoye 1992; Famoye 1993; Winkelmann and Zimmermann 1993):
f ( y i | X i ) = λ i ( λ i + δ y i ) y i 1   e λ i δ y i y i ! ,
where y i > 0 , λ i > 0 , a n d   m a x ( 1 ,   λ i / 4 )   < δ < 1 .
The mean and variance of the generalized Poisson random variable Yi are given by:
μ i = E ( Y i ) = λ i 1 δ i ,
V a r ( Y i ) = λ i ( 1 δ i ) 3   = 1 ( 1 δ i ) 2 E ( Y i ) = E ( Y i ) ,
The generalized Poisson regression (GPR) assumes the conditional variance to be proportional to the mean by some dispersion factor , which by definition,   V a r ( Y i ) = E ( Y i ) .
The term = 1 ( 1 δ i ) 2 represents the dispersion factor, and if:
  • δ < 0 , then the variance is smaller than the mean, and there is underdispersion;
  • δ = 0 , then the variance is equal to the mean, and there is equidispersion;
  • δ > 0 , then the variance is larger than the mean, and there is overdispersion.
In this approach, we applied a GPR to determine the effect of the different forms of social capital on the extent and intensity of adaptation measures taken by farmers to cope with climate change.

3.2.2. Social Capital and Choice of Adaptation Measures by Farmers

Considering the multiple adaptation options available to households, we chose the multivariate probit model (MVP) to analyse the determinants affecting household adaptation decisions. This model was similarly applied to analyse the determinants affecting the choice of household adaptation strategies to deal with extreme events (Francisco et al. 2011), factors affecting farmers’ choice of agricultural risk-management tools (Velandia et al. 2009), and crop choices (Kurukulasuriya et al. 2006; Deressa et al. 2009).
A general multivariate probit model can be specified as follows:
y i j = x i j β j + ε i j ,
where y i j ( j = 1 , , m ) represent the adaptations strategies used by the i t h producer ( i = 1 , , n ) ; x i j is a 1   ×   k vector of observed variables that affect climate change adaptations strategies; β j is a k   ×   1 vector of unknown parameters; and ε i j is the unobserved error term.

3.3. Definitions of Variables

3.3.1. Definitions of the Independent Variables

Following the World Bank (2005), we used categorical principal components analysis (CATPCA) with two-dimensional solutions to group the different dimensions of social capital variables. CATPCA was carried out on 12 items, namely trust among people in the village, exclusion from community activities, being honest and trustworthy, cooperation among village members, participation in the community’s activities, number of supports received in time of crisis, membership in associations, total number of associations household members belong to, household head relatives in and outside the village, and household head close friends in and outside the village. The results of the CATPCA are presented in Appendix B (Table B1 and Table B2). This method is appropriate for data reduction when variables are nominal, ordinal and numerical. Simultaneously, it provides an optimal quantification of categorical variables and reduces the dimensionality of the data. Both dimensions account for 37.9% (4.548/12) of the variance in the optimally scaled items.
Cronbach’s alpha, which measures how much a set of items corresponds to a single latent phenomenon and has a maximum value of 1, is equal to 0.851. This means that the hypothesis that the observed variables are related to a single latent phenomenon can be reasonably accepted. Two components were extracted: the first reflects cognitive social capital (component 1) and structural social capital (component 2).
We control for household characteristics (age of the household head, gender of the head of household, his/her education, and number of active persons in the household); household assets and wealth-factor effects (livestock ownership-TLU2, and land ownership); institutional-factor effects (distance to market); and local area-fixed effects. Since the age of a household head can be used as a proxy of the household head’s experience in weather forecasting, the age of the household head is expected to positively influence adaptation activities (Table 1). An age-squared variable is included to control for the possibility of the decreasing marginal effects of age. The age of the household head is expected to positively act on farmers’ adaptation decisions, while a negative effect of age squared is expected. The gender of the head of household is included to assess any gender disparities in adaptation practices, as some results indicate that male-headed households adapt more readily to climate change (Deressa et al. 2009). Meanwhile, other authors assert the opposite. The latter have found that households headed by females are more likely to adopt climate-change adaptation strategies (Nhemachena and Hassan 2007; Ndambiri et al. 2013). In this study, households headed by males are hypothesized to adopt more adaptation measures than those headed by females.
Education is more likely to enlarge farmers’ sources of information (through various media: newspapers, TV, radio etc.). More educated farmers will have a greater ability to receive, decipher and comprehend information relevant to making innovative decisions in their farms. We expect educated farmers to adopt various other strategies to non-educated farmers. In African rural areas, a high number of working persons in a household implies a large workforce. A larger number of workers in a household (labour force) is expected to enable the household head to take up labour-intensive adaptation techniques (stone bundles, zaï techniques etc.). Farmers who are owners of their farms have a greater incentive to invest in adaptation options compared to non-owners (Deressa et al. 2009). Land ownership is expected to be positively related to the adoption of adaptation methods such as conserving soil and planting trees. Proximity to market is an important determinant of adaptation, because the marketplace serves as a place where farmers exchange information easily (Maddison 2007). Farmers living in different geographical settings make use of different adaptation methods.

3.3.2. Definitions of Dependent Variables

1. Approach I
Two sets of “adoption indexes” are constructed: the intensity of use of adaptation strategies and the extent of adoption of adaptation technologies. The intensity of use of adaptation strategies as presented in Table 2 is measured by the number of adaptation strategies (from one to six) practised at the same time by a farmer. The extent of the adoption of adaptation technologies refers to the portion of the total farm area in which adaptation measures have been taken. It ranges from “Low level” to “Very high level” with scores as:
  • 1 = Low level (adoption in plot [0–¼] of total farm size);
  • 2 = Medium level (adoption in plot [¼–½] of total farm size);
  • 3 = High level, (adoption in plot ( [½–¾] of total farm size);
  • 4 = Very high level, (adoption in plot [¾–1] of total farm size).
2. Approach II
Farmers use a range of adaptation measures in response to climate variability/climate change. The main measures reported by farmers are: adoption of land-management techniques (organic manure, soil- and water-conservation techniques, and conservation tillage), improved crop variety, crops diversification, change of planting date, agroforestry, irrigation, reduction of farm size and abandoning agriculture for other activities. For this study, seven strategies are retained (Table 3): the six most important adaptation measures, adopted by at least 15% of farmers and a last strategy grouping together all the remaining strategies (agroforestry, irrigation, reduction of farm size).

4. Results and Discussions

4.1. Empirical Results

This section presents and discusses the results of the empirical estimations. The first section presents the results of the GPR on the relationship between social capital and the adoption of adaptation strategies. In the second section, we present the results of the multivariate probit approach used to find out the determinants of farmers’ choice of adaptation methods.

4.1.1. Social Capital and Use of Adaptation Technologies

The incident rate ratios (IRRs) from the GPR for both adoption indexes are presented in Table 4. Negative and highly significant dispersion factors confirm the under dispersion of the dependent variables, and indicate that the use of GPR is more appropriate compared to the regular Poisson model.
Regarding social capital variables, the CSC of the head of household significantly affects the extent to which an individual adopts climate-change adaptation strategies. Having higher CSC increases the probability of taking adaptation measures in a big portion of the total farm area. We did not uncover any significant relationship between the number of adaptation strategies practised and social capital variables. Also, as expected, a household head’s education significantly increases the extent to which farmers applied climate-change adaptation measures, but does not have any effect on the number of strategies used. More active people in the household increase the likelihood of using more measures at the same time to cope with climate-change effects. Unlike the expected result, the number of active people in the household does not have a significant effect on the extent of the adaptation; which is quite surprising since the high number of workers in a household is associated with a large workforce. Farming in the Dano and Koumbia areas significantly decreases the probability of combining many strategies and the extent to which they are used, compared with farming in the Gourcy area. This is probably due to the harsh weather faced by farmers in this part of the country. Among the three areas, Gourcy is located in the driest part of the country and has been also subject to more pronounced environmental degradation since the 1970s drought. Authors such as West et al. (2008) argued that farmers in the driest areas of Burkina Faso now view drought as a normal phenomenon and have incorporated “drought mitigation/adaptations” into their routine farming practices.

4.1.2. Social Capital and Adoption of Adaptation Technologies

Results from the Multivariate Probit (MVP) regression model, presented in Table 5, show that farmers’ CSC is positively linked to the adoption of soil- and water-conservation techniques and other techniques such as agroforestry, irrigation and other technologies (OtherT). Farmers’ SSC is negatively linked to the adoption of a crop diversification strategy and positively affects their choice of new varieties and conservation tillage.
The age and education of the household head significantly increase the probability of taking up other adaptation techniques such as agroforestry and irrigation, implying that older and educated farmers have a higher probability of adopting these techniques than younger and non-educated ones, respectively. However, the negative and significant sign of the age-squared variable denotes that farmers of advanced age are less likely to adapt to climate change through the adoption of agroforestry and/or irrigation. Households with higher numbers of workers are more likely to use measures such as conservation tillage, new varieties, and techniques such as agroforestry and irrigation, to adapt to climate change. Dummy variables representing the study area were included to control for the unobserved variations. The results show that farmers’ choice of adaptation measures is different from one study area to the next. Compared to the drier area (Gourcy), farming in wetter areas (Dano and Koumbia) significantly decreases the probability of using organic fertilizer, changing planting date, using new varieties, adopting conservation tillage, and techniques such as agroforestry and irrigation. However, farming in Koumbia significantly increases the chance of using a crop-diversification strategy. The gender of the head of household has no significant effect on the adoption of climate-change adaptation strategies. Previous studies have shown that households headed by males were more likely to adopt adaptation technologies (Deressa et al. 2009; Tazeze et al. 2012; Ndambiri et al. 2013).

4.2. Discussion

The effect of social capital depends on its form and the type of adaptation strategy adopted. The results indicated that the CSC of the head of household significantly affects the extent of their adoption of climate-change adaptation strategies (Table 4). This implies that cooperation, trust and solidarity within a rural community play an important role in the extent to which adaptation measures are applied. Interestingly, for this form of social capital, the results further revealed a positive and significant relationship with the adoption of soil- and water-conservation techniques and techniques such as agroforestry and irrigation (Table 5). In the light of the foregoing, it is obvious that the extent of the use of soil- and water-conservation techniques and other techniques are positively linked to farmers’ CSC. This means that farmers with high CSC are more likely to adopt these practices to a high degree than those endowed with relatively less or no CSC. A possible explanation is that technologies such as soil- and water-conservation techniques (that are more physical and financially intensive capital) are only achievable for wealthier households, large households (labour), or households headed by farmers who can mobilise more people in mutual-assistance activities (self-help groups/labour sharing). The latter option is facilitated by people with CSC that predisposes them towards collective decisions in mutual-assistance activities. As demonstrated in previous studies (Fu 2004; Khanh Nam 2010), this form of social capital plays a significant role in terms of influencing knowledge-sharing, facilitating information exchange, lubricating cooperation, and fostering solidarity between individuals. Additionally, trust and solidarity among farmers promote collective action through cooperative labour in their villages (Moazami 2006); farmers in villages help one another on their farms without involving the payment of wages. As a result, trustworthy people who have moral authority in the community would more likely benefit from help from their peers in times of need through mechanisms such as cooperation, social interaction, and mutual help (transportation of breeze blocks for the construction of stone bundles, for instance).
SSC (membership in social groups, kinship and friendship networks in the community) positively influenced farmers’ choice of new varieties and their adoption of conservation tillage practices. With regard to the positive effect of SSC on the adoption of conservation-tillage practices, the results are consistent with Bezabih et al. (2013) who argue that household heads who can easily get help from their peers in the community are more likely to adopt conservation-tillage practices. It is important to realize that, more often, training programmes on sustainable agriculture practices (i.e., conservation tillage) are usually directed towards organised structures such as farming-related groups and associations. As for the relationship between SSC and the choice of new varieties, this result confirmed the findings of several works in the literature. In general, scholars have linked membership in a group to the diffusion of new technologies and practices (Nkegbe et al. 2011; Van Rijn et al. 2012; Abdul-Hanan et al. 2014). Muange et al. (2014), for instance, assert that the flow of information through networks is important for seed technologies for which formal markets fail. Hence, access to information about new varieties and other services are undeniably linked to farmers’ SSC (membership in social groups, kinship and friendship networks in/outside the community).
This is also confirmed by the Spearman’s rank correlation analysis performed in Appendix D. The results show a significant and positive association between SSC variables (membership in social groups, friendship) and farmers’ access to services. Put differently, farmers’ access to information, extension services and/or technical support from local agricultural services are positively and significantly associated with their SSC. Indeed, social networks and connections are conduits for transferring information between members, facilitating the dissemination of adaptation innovations (new varieties and practices). For instance, members can learn from their peers’ experiences and success stories and can benefit from the collective investments made by their groups (Wambugu et al. 2010; Abdul-Hanan et al. 2014). Moreover, they can also have access to the latest information about new varieties, since they are more often in contact with extension agents.
Additional analyses were undertaken (Appendix C) in order to see how robust both social capital variables (cognitive and structural) are to sensible changes in model specification. In this order, we estimated the effect of social capital variables on adoption, with the dependent variable indicating whether or not the farmer has taken at least one adaptation measure; under these circumstances, a probit model can be used. In the first column (I) of Appendix C, we estimated the effect of social capital variables on adoption; while household socio-economic characteristics and household assets (livestock and land ownership) were, respectively, controlled in columns (II) and (III). Finally, we control for local area fixed effects (IV).
As indicated in Appendix C, there is a positive association between farmers’ structural social capital and adoption of climate-change adaptation strategies; while the result of the cognitive index is only significant at the first stage. Structural social capital is largely independent of changes of conditions (more robust) than cognitive social capital.

5. Conclusions and Policy Implications

This study examines factors influencing rural households’ decisions to deal with climate change and climate variability in Burkina Faso. The study found that the effect of social capital depends on the type of indicator used and on the type of adaptation strategies necessary. Farmers’ CSC were found to significantly and positively impact their choice of soil- and water-conservation techniques and techniques such as agroforestry and irrigation. The structural form of social capital was positively associated with the adoption of new varieties and conservation-tillage strategies and negatively associated with the use of a crop diversification strategy. Government extension programmes, extension services, NGOs and training institutions should channel their efforts towards the development of all aspects of social capital among farmers through: training and educative programmes in strengthening the different forms of social capital; supporting local groups that generate social capital; and promoting farmers access and links to external organizations and other farmer associations from whom they can learn. Individual farmers can improve their structural social capital by joining formal organizations and community groups.
Research on social capital remains in its infancy; further research may use experimental methods to clarify the relationship between farmers’ social capital and their behaviour towards climate change. A group-based approach (net-mapping tool) will help to understand how social networks and key individuals contribute to rural adaptability to climate-change impacts in Burkina Faso.
In both models, the results further revealed that farmers living in relatively more propitious areas in term of weather conditions (Dano and Koumbia) were less likely to adopt land-management techniques (organic manure, soil- and water-conservation techniques, and conservation tillage) and other technologies such as irrigation than their peers living in areas with harsh weather conditions (Gourcy). In terms of policy implications, it appears that promoting training in “good practice” in soil and water conservation and soil protection and restoration would play an important role in enhancing the adaptive capacity of farmers in areas such as Dano and Koumbia; besides, such a policy can still greatly enhance farmers’ use and appropriation of these technologies in Gourcy.
The results also revealed some interesting facts that have significant policy implications. Firstly, the age and age-squared variable indicated that farmers of advanced age were less likely to adapt to climate change through the adoption of agroforestry and/or irrigation. Secondly, the results highlighted the importance of a household head’s education in the extent of adoption of other technologies (irrigation, agroforestry). Thirdly, the result revealed the importance of land ownership on the intensity of use of adaptation strategies and on the likelihood of changing planting dates. Therefore, policy should focus on: (i) promoting/enhancing community-based programmes (that include farmers of advanced age) designed to promote farmer-managed natural regeneration practices (FMNR) and improved irrigation technologies (drip irrigation, supplemental irrigation…); (ii) increasing farmers’ access to education (adult education), additional information resources (farmer-to-farmer education programme), and group-based learning processes (farmer field school (FFS)); and (iii) reviewing tenure rights through a broadly participatory process, decentralized land management, and harmonizing statutory and customary rights.

Acknowledgments

The authors gratefully acknowledge support of this work by the West African Science Service Center on Climate Change and Adapted Land Use (WASCAL) through the support of the German Federal Ministry of Education and Research (BMBF).

Author Contributions

Thomas B. Yaméogo, William M. Fonta and Tobias Wünscher conceived and designed the experiments; Thomas B. Yaméogo performed the experiments; Thomas B. Yaméogo analyzed the data; Thomas B. Yaméogo, William M. Fonta and Tobias Wünscher contributed reagents/materials/analysis tools; Thomas B. Yaméogo, William M. Fonta and Tobias Wünscher wrote the paper.

Conflicts of Interest

The authors declare no conflict of interest.

Appendix A. Excerpt of Household Questionnaire

III. Social Capital
III.1. 
Organizational Density and Characteristics
III.1.1. 
Are you or is someone in your household a member of any community group (organizations, associations…)? Yes/____/ No /____/ (If no, skip to question III.1.6)
III.1.2. 
What is your (your household member) status and the degree of your participation in this (these) group(s)?
Do you consider yourself (your household member) to be active in the group, such as by attending meetings or volunteering your time in other ways, or are you relatively inactive? Are you (your household member) a leader in the group?
Household memberName of organizationType of organization (codes 1)Your status
(your household member)
(codes 2)
Degree of participation
(code 3)
     
     
Code 1: Type of organization Code 2 : Status
1 = Executive member
2 = Honorary Member
3 = Ordinary member
Code 3: Degree of participation
1 = Very active
2 = Somewhat active
3 = Not active
1 = Farmers’ group
2 = NGO /project
3 = Cooperative
4 = Religious group
5 = Cultural association
6 = Parent group
7 = Village association
8 = Other
III.1.3. 
Of all the groups to which you (or members of your household) belong, which are the most important to your household?
(List up to three by name and code type of organization.)
Group 1: .......................................................................... ; Group 2: ..........................................................................;
Group 3: ..........................................................................
III.1.4. 
What is the main benefit of joining this (these) group(s)?
Group 1Group 2Group 3
1Improves my household’s current livelihood or access to services
2Important in times of emergency/in future
3Benefits the community
4Enjoyment/recreation
5Spiritual, social status, self-esteem
6Other (specify): ……………………………………………………
III.1.5. 
Thinking about the members of this group, are most of them of the same.
Group 1Group 2Group 3
Village
Family or kin group
Ethnic or linguistic group
Religion
Gender
Age
III.1.6. 
Do you receive any technical support from the government, extension services?
Yes/__/; No /__/ (skip to question III.1.8)
III.1.7. 
Is some of the support linked to climate-change adaptation?
Yes/___/; No /___/ (skip to question III.1.8)
III.1.8. 
How often were you visited by field extension staff last year (2012)? /_____/
III.1.9. 
Do you have access to any formal credit facilities (bank…)? Yes/___/; No /___/
If no why…………………………………………………
III.1.10. 
Do you have access to any informal credits (from neighbours, friends, relatives etc)?
Yes/___/; No /___/
III.1.11. 
About how many relatives do you have these days? (Don’t include those living inside the household) /_____/ 1 = No one; 2 = One to five people; 3 = Six or more people
In the village? /_____/ 1 = No one; 2 = One to five people; 3 = Six or more people
Outside the village?/_____/ 1 = No one; 2 = One to five people; 3 = Six or more people
III.1.12. 
About how many close friends do you have these days in this village? These are people you feel at ease with, can talk to about private matters, or call on for help. /_____/ 1 = No one; 2 = One to five people; 3 = Six or more people
How often do you see or visit each other? /_____/ 1 = Very often; 2 = At least once a month; 3 = Less often
In case of emergency, how many of those people do you think are currently able to provide you a large sum of money or help in kind? /_____/
III.1.13. 
About how many close friends do you have these days outside this village? These are people you feel at ease with, can talk to about private matters, or call on for help. /_____/ 1 = No one; 2 = One to five people; 3 = Six or more people
How often do you see or visit each other? /_____/ 1 = Very often; 2 = At least once a month; 3 = Less often
In case of emergency, how many of those people do you think are currently able to provide you a large sum of money or help in kind? /_____/
III.2. 
Solidarity, Trust and Cooperation
III.2.1. 
Suppose someone in the village had something unfortunate happen to them, such as (crop failure…). Who do you think they could turn to for help in this situation? (Record first three mentioned.)
ABC
   
0 = No one would help2 = Neighbours4 = Mutual support group to which s/he belongs
1 = Family3 = Friends5 = The whole village
6 = Other (specify): ………………….............
III.2.2. 
Do you think that in this village, people generally trust one another in matters of lending and borrowing? Yes /_____/ No /_____/ Don’t know /_____/
III.2.3. 
Compared with other villages, how much do people of this village trust each other in matters of lending and borrowing?/_____/ 0 = Don’t know; 1 = Less than other villages; 2 = The same as other villages; 3 = More than other villages
III.2.4. 
Do you or anyone in your household usually participate in any communal activities, in which people come together (mutual aid) to do some work for the benefit of the community?
Always /_____/ Not often /_____/ Rarely /_____/ Never /_____/
III.2.5. 
If a community project does not directly benefit you but has benefits for many others in the village, would you contribute
time to the project? Yes /_____/ No /_____/
money to the project? Yes /_____/ No /_____/
III.2.6. 
Please tell me whether in general you agree or disagree with the following statements:
Most people in this village are basically honest and can be trusted.
Strongly agree /____/ Agree /____/ Disagree /____/ Strongly disagree /____/ Don’t know/____/
If you lose a goat or money, someone in the village would help look for it (or would return it to you if he found it).
Strongly agree /____/ Agree /____/ Disagree /____/ Strongly disagree /____/ Don’t know/____/
III.2.7. 
Are there any community activities in which you are unable to participate?
Yes /_____/ No /_____/
If yes, in which activities are you unable to participate? ……………………………………………………

Appendix B. Categorical Principal Components Analysis (CATPCA)

Table B1. CATPCA (model summary).
DimensionCronbach’s AlphaVariance Accounted for
Total (Eigenvalue)
10.6412.422
20.5782.126
Total0.851 a4.548
a Total Cronbach’s alpha is based on the total eigenvalue.
Table B2. Categorical principal components analysis (component loadings).
Dimension
12
Trust among people in the village0.643−0.296
Exclusion from community activities0.0870.105
Household head (HH) membership in associations 0.776−0.312
HH1 participation in the community’s activities0.807−0.166
Number of support in time of crisis0.43−0.216
Total number of associations HH belong to0.257−0.073
Honest and trustworthy0.1030.365
Cooperation among community members0.0830.298
HH relatives in the village0.0730.767
Household relatives outside the village0.1260.769
HH close friends in the village0.4820.458
HH close friends outside the village0.4750.49
HH: Household head.

Appendix C. Robustness Check

Table C1. Probit Model Results.
(I) a(II) b(III) c(IV) d
Cognitive social capital 0.007 ***
(0.004)
0.008
(0.004)
0.008 *
(0.004)
0.007
(0.005)
Structural social capital0.009 **
(0.004)
0.009 **
(0.004)
0.009 **
(0.004)
0.009 **
(0.005)
Age −0.034
(0.044)
−0.037
(0.044)
−0.036
(0.044)
Age2 0.000
(0.000)
0.000
(0.000)
0.000
(0.000)
Gender 0.149
(0.456)
0.180
(0.456)
0.188
(0.459)
Education 0.123
(0.203)
0.114
(0.205)
0.142
(0.217)
Working people 0.032
(0.040)
0.038
(0.043)
0.040
(0.044)
Distance to market −0.009
(0.013)
−0.010
(0.013)
Land ownership −0.146
(0.316)
−0.183
(0.327)
Livestock −0.006
(0.019)
−0.004
(0.020)
Dano −0.022
(0.256)
Koumbia −0.120
(0.284)
Constant0.538
(0.371)
0.946
(1.188)
1.171
(1.238)
1.314
(1.285)
Notes: ***, **, * showing significant at 1%, 5%, and 10% probability level, respectively; standard errors are in parenthesis. Note: a model (I), estimate the overall effect of cognitive and structural social capital in adoption of climate change adaptation measures; b in model (II), we control for household socio-economic characteristics; c in model (III), we control for household assets (livestock and land ownership); d finally, we control for local area-fixed effects in model (IV).

Appendix D. Spearman’s Rank Correlation SSC Variables and Farmers’ Access to Services

Table D1. Spearman’s Rank Correlation.
Extension ServicesTechnical SupportInformation
Membership0.250 **0.348 **0.053
Friends inside0.183 **0.097 *0.097 *
Friends outside0.204 **0.0810.143 **
Relatives inside0.0420.0210.018
Relatives outside0.0700.0610.030
Notes: **, * showing significant at 1%, and 5%.

References

  1. Abdul-Hanan, Abdallah, Michael Ayamga, and Samuel A. Donkoh. 2014. Smallholder adoption of soil and water conservation techniques in Ghana. African Journal of Agricultural Research 9: 539–46. [Google Scholar]
  2. Adger, W. Neil. 2001. Social Capital and Climate Change. Tyndall Centre Working Paper No. 8. Norwich: Tyndall Centre, University of East Anglia, p. 19. [Google Scholar]
  3. Adger, W. Neil, Suraje Dessai, Marisa Goulden, Mike Hulme, Irene Lorenzoni, Donald R. Nelson, Lars Otto Naess, Johanna Wolf, and Anita Wreford. 2009. Are there social limits to adaptation to climate change? Climatic Change 93: 335–54. [Google Scholar] [CrossRef]
  4. Agrawal, Arun. 2010. Local institutions and adaptation to climate change. In Social Dimensions of Climate Change. Equity and Vulnerability in a Warming World. Edited by Robin Mearns and Andrew Norton. Washington, DC: The World Bank, pp. 173–98. [Google Scholar]
  5. Ali, Lule, N. M. Mangheni, Pascal C. Sanginga, Robert J. Delve, F. Mastiko, and R. Miiro. 2007. Social capital and adoption of soil fertility management technologies in Tororo district, Uganda. In Advances in Integrated Soil Fertility Management in Sub-Saharan Africa: Challenges and Opportunities. Dordrecht: Springer, pp. 947–54. [Google Scholar]
  6. Balew, Solomon, Jones Agwata, and Stephen Anyango. 2014. Determinants of Adoption Choices of Climate Change Adaptation Strategies in Crop Production by Small Scale Farmers in Some Regions of Central Ethiopia. Journal of Natural Sciences Research 4: 78–93. [Google Scholar]
  7. Bezabih, Mintewab, Zenebe Abe Damte Beyene, and Livousew Borga Gebreegziabher. 2013. Social Capital, Climate Change and Soil Conservation Investment: Panel Data Evidence from the Highlands of Ethiopia. London: Grantham Research Institute on Climate Change and the Environment. [Google Scholar]
  8. Boko, Michel, Isabelle Niang, Anthony Nyong, Coleen Vogel, Andrew Githeko, Mahmoud Medany, Balgis Osman-Elasha, Ramadjita Tabo, and Pius Yanda. 2007. Africa. Climate Change 2007: Impacts, Adaptation and Vulnerability. In Contribution of Working Group II to the Fourth Assessment Report of the Intergovernmental Panel on Climate Change. Edited by Martin L. Parry, Osvaldo F. Canziani, Jean P. Palutikof, Paul J. van der Linden and Clair E. Hanson. Cambridge: Cambridge University Press, pp. 433–67. [Google Scholar]
  9. Bourdieu, Pierre. 1983. Forms of capital. In Handbook of Theory and Research for the Sociology of Education. Edited by J. C. Richards. New York: Greenwood Press. [Google Scholar]
  10. Cameron, A. Colin, and Pravin K. Trivedi. 2005. Microeconometrics: Methods and Applications. Cambridge: Cambridge University Press. [Google Scholar]
  11. Carter, Michael R., and John A. Maluccio. 2003. Social capital and coping with economic shocks: An analysis of stunting of South African children. World Development 31: 1147–63. [Google Scholar] [CrossRef]
  12. Claridge, Tristan. 2004. Social Capital and Natural Resource Management: An important role for social capital? A Thesis Submitted in Partial Fulfillment of the Requirement for the Degree of Master of Natural Resource Studies. Master’s Thesis, School of Natural and Rural Systems Management, University of Queensland, St. Lucia, QLD, Australia, July. [Google Scholar]
  13. Coleman, James S. 1988. Social capital in the creation of human capital. American Journal of Sociology 94: S95–S120. [Google Scholar] [CrossRef]
  14. Consul, P. C., and Felix Famoye. 1992. Generalized Poisson regression model. Communications in Statistics-Theory and Methods 21: 89–109. [Google Scholar] [CrossRef]
  15. Dasgupta, Purnamita, John F. Morton, David Dodman, Barış Karapınar, Francisco Meza, Marta G. Rivera-Ferre, Aissa Toure Sarr, and Katharine E. Vincent. 2014. Rural areas. In Climate Change 2014: Impacts, Adaptation, and Vulnerability. Part A: Global and Sectoral Aspects. Contribution of Working Group II to the Fifth Assessment Report of the Intergovernmental Panel of Climate Change. Edited by Christopher B. Field, Vicente R. Barros, David J. Dokken, Katharine J. Mach, Michael D. Mastrandrea, Eren T. Bilir, Monalisa Chatterjee, Kristie L. Ebi, Yuka Otsuki Estrada, Robert C. Genova and et al. Cambridge: Cambridge University Press, New York: Cambridge University Press, pp. 613–57. [Google Scholar]
  16. Deressa, Temesgen Tadesse, Rashid M. Hassan, Claudia Ringler, Tekie Alemu, and Mahmud Yesuf. 2009. Determinants of farmers’ choice of adaptation methods to climate change in the Nile Basin of Ethiopia. Global Environmental Change 19: 248–55. [Google Scholar] [CrossRef]
  17. Di Falco, Salvatore, and Erwin Bulte. 2009. Social Capital and Weather Shocks in Ethiopia: Climate Change and Culturally-Induced Poverty Traps. Working paper. London: London School of Economics. [Google Scholar]
  18. Di Falco, Salvatore, and Erwin Bulte. 2013. The impact of kinship networks on the adoption of risk-mitigating strategies in Ethiopia. World Development 43: 100–10. [Google Scholar] [CrossRef]
  19. Dutilly-Diane, Céline, Elisabeth Sadoulet, and Alain De Janvry. 2003. Household behaviour under market failures: How natural resource management in agriculture promotes livestock production in the Sahel. Journal of African Economies 12: 343–70. [Google Scholar] [CrossRef]
  20. Famoye, Felix. 1993. Restricted generalized Poisson regression model. Communications in Statistics-Theory and Methods 22: 1335–54. [Google Scholar] [CrossRef]
  21. Francisco, Herminia A., Canesio D. Predo, Areeya Manasboonphempool, P. Tran, Rawadee Jarungrattanapong, Linda M. Penalba, N. P. Tuyen, Tran Huu Tuan, Dulce D. Elazegui, and Yueqin Shen. 2011. Determinants of Household Decisions on Adaptation to Extreme Climate Events in Southeast Asia. Economy and Environment Program for Southeast Asia (EEPSEA), Research Report Series/IDRC, No. 2011-RR5. Los Baños: Regional Office for Southeast and East Asia. [Google Scholar]
  22. Fu, Qianhong. 2004. Trust, Social Capital, and Organizational Effectiveness. Master’s thesis, Virginia Polytechnic Institute, State University, Blacksburg, VA, USA. [Google Scholar]
  23. Greene, William H. 2011. Econometric Analysis, 7th ed. Upper Saddle River: Prentice Hall. [Google Scholar]
  24. Hampel-Milagrosa, Aimee. 2007. Social Capital, Ethnicity and Decision-Making in the Philippine Vegetable Market. ZEF Discussion Papers on Development Policy No. 117. Bonn: Center for Development Research, September, p. 74. [Google Scholar]
  25. Hassan, Rashid M. 2010. Implications of climate change for agricultural sector performance in Africa: policy challenges and research agenda. Journal of African Economies 19: ii77–105. [Google Scholar] [CrossRef]
  26. Hummel, Diana, Martin Doevenspeck, and Cyrus Samimi. 2012. Climate change, environment and migration in the Sahel. In Selected Issues with a Focus on Senegal and Mali. Micle Working Paper 1. Frankfurt: ISOE, Available online: http://www.micle-project.net/fileadmin/redaktion/Download/micle-wp1-2012-en.pdf (accessed on 27 February 2018).
  27. Isham, Jonathan. 2002. The effect of social capital on fertiliser adoption: Evidence from rural Tanzania. Journal of African Economies 11: 39–60. [Google Scholar] [CrossRef]
  28. Katungi, Enid Mbabazi. 2007. Social Capital and Technology Adoption on Small Farms: The Case of Banana Production Technology in Uganda. Hatfield: University of Pretoria. [Google Scholar]
  29. Khanh Nam, Pham. 2010. Cooperative Behavior, Social Capital and Development: Evidence from the Mekong River Delta in Vietnam. Economy and Environment Program for Southeast Asia (EEPSEA). Singapore: IDRC Regional Office for Southeast and East Asia. [Google Scholar]
  30. Kurukulasuriya, Pradeep, Robert Mendelsohn, Rashid Hassan, James Benhin, Temesgen Deressa, Mbaye Diop, Helmy Mohamed Eid, K. Yerfi Fosu, Glwadys Gbetibouo, and Suman Jain. 2006. Will African agriculture survive climate change? The World Bank Economic Review 20: 367–88. [Google Scholar] [CrossRef]
  31. Maddison, David. 2007. The Perception of and Adaptation to Climate Change in Africa. Policy Research Working Paper, No. 4308. Washington, DC: World Bank. [Google Scholar]
  32. McCarthy, Nancy A., Céline Dutilly-Diané, and Boureima Drabo. 2002. Cooperation, Collective Action and Natural Resources Management in Burkina Faso: A Methodological Note. CGIAR Systemwide Program on Collective Action and Property Rights. Washington, DC: International Food Policy Research Institute. [Google Scholar]
  33. Moazami, Mitra. 2006. The impacts of social capital on land consolidation projects: A case of Arak County, Iran. In Potential of Social Capital for Community Development. Tokyo: Asian Productivity Organization. [Google Scholar]
  34. Muange, Elijah N., Stefan Schwarze, and Matin Qaim. 2014. Social Networks and Farmer Exposure to Improved Crop Varieties in Tanzania. Discussion Papers 183,635. Goettingen: Georg-August-Universitaet Goettingen, GlobalFood, Department of Agricultural Economics and Rural Development. [Google Scholar]
  35. Munasib, Abdul B. A., and Jeffrey L. Jordan. 2011. The effect of social capital on the choice to use sustainable agricultural practices. Journal of Agricultural and Applied Economics 43: 213–227. [Google Scholar] [CrossRef]
  36. Nath, Tapan Kumar, Makoto Inoue, and Jules Pretty. 2011. Formation and function of social capital for forest resource management and the improved livelihoods of indigenous people in Bangladesh. Journal of Rural and Community Development 5: 104–22. [Google Scholar]
  37. Ndambiri, Hilary K., Stephen G. Mbogoh, and Cecilia N. Ritho. 2013. An evaluation of farmers’ perceptions of and adaptation to the effects of climate change in Kenya. International Journal of Food and Agricultural Economics 1: 75–96. [Google Scholar]
  38. Nhemachena, Charles, and Rashid Hassan. 2007. Micro-Level Analysis of Farmers’ Adaptation to Climate Change in Southern Africa. IFPRI Discussion Paper 00714. Washington, DC: IFPRI. [Google Scholar]
  39. Niang, Isabelle, Oliver C. Ruppel, Mohamed A. Abdrabo, Ama Essel, Christopher Lennard, Jonathan Padgham, and Penny Urquhart. 2014. Africa. In Climate Change 2014: Impacts, Adaptation, and Vulnerability. Part B: Regional Aspects. Contribution of Working Group II to the Fifth Assessment Report of the Intergovernmental Panel on Climate Change. Edited by Christopher B. Field, Vicente R. Barros, David Jon Dokken, Katharine J. Mach, Michael D. Mastrandrea, T. Eren Bilir, Monalisa Chatterjee, Kristie L. Ebi, Yuka Otsuki Estrada and Robert C. Genova. Cambridge: Cambridge University Press, New York: Cambridge University Press, pp. 1199–265. [Google Scholar]
  40. Njuki, Jemimah M., Mariam A. T. J. Mapila, Shamie Zingore, and Robert Delve. 2008. The dynamics of social capital in influencing use of soil management options in the Chinyanja Triangle of Southern Africa. Ecology and Society 13: 9–25. [Google Scholar] [CrossRef]
  41. Nkegbe, Paul Kwame, and Bhavani Shankar. 2014. Adoption intensity of soil and water conservation practices by smallholders: evidence from Northern Ghana. Bio-Based and Applied Economics 3: 159–74. [Google Scholar]
  42. Nkegbe, Paul K., Bhavani Shankar, and Graziano Michele Ceddia. 2011. Smallholder Adoption of Soil and Water Conservation Practices in Northern Ghana. Journal of Agricultural Science and Technology 2: 595–605. [Google Scholar]
  43. Paul, Christopher J., Erika S. Weinthal, Marc F. Bellemare, and Marc A. Jeuland. 2016. Social Capital, Trust, and Adaptation to Climate Change: Evidence from Rural Ethiopia. Global Environmental Change 36: 124–38. [Google Scholar] [CrossRef]
  44. Pedzisa, Tarisayi, Lovemore Rugube, Alex Winter-Nelson, Kathy Baylis, and Kizito Mazvimavi. 2015. The Intensity of adoption of Conservation agriculture by smallholder farmers in Zimbabwe. Agrekon 54: 1–22. [Google Scholar] [CrossRef]
  45. Putnam, Robert. 1993. The prosperous community: Social capital and public life. The American Prospect 13: 35–42. [Google Scholar]
  46. Putnam, Robert. 2000. Bowling Alone: The Collapse and Revival of American Community. New York: Simon and Schuster, ISBN 0-7432-0304-3. [Google Scholar]
  47. Ramirez, Octavio A., and Steven D. Shultz. 2000. Poisson count models to explain the adoption of agricultural and natural resource management technologies by small farmers in Central American countries. Journal of Agricultural and Applied Economics 32: 21–33. [Google Scholar] [CrossRef]
  48. Silici, Laura. 2016. The Role of Social Capital in the Adoption and the Performance of Conservation Agriculture: The Practice of Likoti in Lesotho. Rome: FAO. [Google Scholar]
  49. SP/CONEDD. 2007. Programme National D’adaptation de la Variabilité et aux Changements Climatiques. Ministère de l’environnement et du cadre du vie, Burkina Faso. Available online: http://unfccc.int/resource/docs/napa/bfa01f.pdf (accessed on 8 August 2016).
  50. Tazeze, Aemro, Jemma Haji, and Mengistu Ketema. 2012. Climate change adaptation strategies of smallholder farmers: The case of Babilie District, East Harerghe Zone of Oromia Regional State of Ethiopia. Journal of Economics and Sustainable Development 3: 1–12. [Google Scholar]
  51. Uphoff, Norman. 2000. Understanding social capital: Learning from the analysis and experience of participation. In Social Capital: A Multifaceted Perspective. Edited by Partha Dasgupta and Ismail Serageldin. Washington, DC: World Bank, pp. 215–49. [Google Scholar]
  52. Van Rijn, Fédes, Erwin Bulte, and Adewale Adekunle. 2012. Social capital and agricultural innovation in Sub-Saharan Africa. Agricultural Systems 108: 112–22. [Google Scholar] [CrossRef]
  53. Velandia, Margarita, Roderick M. Rejesus, Thomas O. Knight, and Bruce J. Sherrick. 2009. Factors affecting farmers’ utilization of agricultural risk management tools: the case of crop insurance, forward contracting, and spreading sales. Journal of Agricultural and Applied Economics 41: 107–23. [Google Scholar] [CrossRef]
  54. Wambugu, Stella N., Julius J. Okello, and Rose A. Nyikal. 2010. Effect of Social Capital on Performance of Smallholder Farmer Organizations in Western Kenya. Journal of Agricultural Science and Technology 4: 10–19. [Google Scholar]
  55. West, Collin Thor, Carla Roncoli, and Frederic Ouattara. 2008. Local perceptions and regional climate trends on the central plateau of Burkina Faso. Land Degradation & Development 19: 289–304. [Google Scholar]
  56. Winkelmann, Rainer, and Klaus F. Zimmermann. 1993. Poisson-Logistic Regression. Discussion Paper No. 93-18. München: Ludwig-Maximilians-Universität, Volkswirtschaftliche Fakultät. [Google Scholar]
  57. Wolf, Johanna. 2011. Climate change adaptation as a social process. In Climate Change Adaptation in Developed Nations. Dordrecht: Springer, pp. 21–32. [Google Scholar]
  58. World Bank. 2005. Social Capital. Available online: http://www.worldbank.org/en/webarchives/archive?url=http%3A%2F%2Fweb.worldbank.org%2Farchive%2Fwebsite01360%2FWEB%2F0__MEN-2.HTM&mdk=23354653 (accessed on 2 May 2017).
1
Burkina Faso is divided into 13 administrative regions which are divided into 45 provinces and sub-divided into 301 communes.
2
The tropical livestock unit (TLU) according to the Food and Agriculture Organisation (FAO) definition is a common unit that allows a description and expression of livestock of various species and different sizes within the same unit. The TLU is commonly taken to be an animal of 250 kg liveweight. Camels = 1.0, cattle = 0.7, sheep/goats = 0.1, horses = 0.8, mules = 0.7, asses = 0.5, pigs = 0.2, chickens = 0.01.
Figure 1. Study areas.
Socsci 07 00033 g001
Table 1. Description of independent variables and their suggested sign.
VariablesMinMaxMeanStd. Dev.Expected Sign
Age (Age of the household head, in years)198746.3813.95+
Age2 (Age of the household head, squared)36175692345.071396.22±
Gender (1 = Male and 0 = Female)010.970.18+
Education (1 = Yes and 0 = No)010.360.48+
Working people (Number active in the household)0184.492.58-
Distance to markets (Km)0508.576.79+
Landownership (1 = Yes and 0 = No)010.890.31+
Livestock (Total livestock measured in TLU)0534.165.20+
Local agro-ecology Dano (1 = Yes and 0 = No)010.340.47
Local agro-ecology Gourcy (1 = Yes and 0 = No)010.330.47
Local agro-ecology Koumbia (1 = Yes and 0 = No)010.340.47
Cognitive Social Capital 010067.4521.25+
Structural Social Capital 010055.3021.67+
Table 2. Description of dependent variables.
VariablesMin.Max.MeanStd. Dev.
Adaptation measuresIntensity of use of adaptation strategies (Intensity of Adoption)163.251.35
Extent of adoption of adaptation measures (Extent of Adoption)042.651.14
Table 3. Description of Dependent Variables (Multivariate Probit Model).
VariablesMin.Max.MeanStd. Dev.
Level of adoptionUse of organic manure (OM) 010.620.49
Change of planting date (PD) 010.560.50
Improved crop variety/new varieties (NV) 010.530.50
Use of Soil and Water Conservation Techniques (SWCT)010.520.50
Use of conservation tillage (Tillage)010.450.50
Use of crops diversification (DC)010.170.38
Use of other techniques (OtherT)010.170.37
Table 4. Results of the generalized Poisson regression (GPR).
Extent of AdoptionIntensity of Adoption
Age0.002
(0.009)
0.007
(0.008)
Age20.000
(0.000)
0.000
(0.000)
Gender0.083
(0.105)
−0.066
(0.104)
Education0.077 *
(0.045)
0.037
(0.040)
Working people−0.008
(0.009)
0.018 **
(0.008)
Distance to market0.004
(0.003)
0.002
(0.003)
Land ownership0.104
(0.072)
0.163 **
(0.068)
Livestock0.000
(0.005)
0.005
(0.004)
Dano−0.128 ***
(0.052)
−0.354 ***
(0.048)
Koumbia−0.341 ***
(0.062)
−0.297 ***
(0.055)
Cognitive social capital 0.002 *
(0.001)
0.001
(0.001)
Structural social capital−0.001
(0.001)
0.001
(0.001)
Constant0.767 ***
(0.284)
0.867 ***
(0.255)
Delta (δ)−0.574−0.490
χ2 for H0:δ = 0−526.753−655.762
Log likelihood116.530111.180
Notes: ***, **, * showing significant at 1%, 5%, and 10% probability level, respectively; standard errors are in parenthesis.
Table 5. Multivariate probit model results.
VariableOMPDNVSWCTTillageDCOtherT
Age−0.001
(0.029)
0.032
(0.029)
0.011
(0.029)
0.016
(0.028)
−0.036
(0.030)
−0.010
(0.034)
0.064 *
(0.037)
Age20.000
(0.000)
0.000
(0.000)
0.000
(0.000)
0.000
(0.000)
0.000
(0.000)
0.000
(0.000)
−0.001 *
(0.000)
Gender−0.287
(0.374)
0.076
(0.358)
−0.458
(0.372)
0.455
(0.357)
−0.543
(0.404)
4.293
(169.989)
−0.276
(0.420)
Education0.158
(0.147)
−0.048
(0.143)
0.137
(0.147)
0.205
(0.147)
−0.202
(0.150)
0.190
(0.166)
0.437 ***
(0.168)
Working people0.032
(0.029)
0.040
(0.028)
0.093 ***
(0.030)
0.017
(0.028)
0.053 *
(0.029)
0.002
(0.032)
0.061 *
(0.032)
Distance to market0.002
(0.009)
0.005
(0.010)
0.032 ***
(0.011)
−0.014
(0.010)
−0.006
(0.010)
−0.004
(0.011)
0.004
(0.012)
Land ownership−0.002
(0.212)
0.722 ***
(0.219)
−0.112
(0.212)
−0.158
(0.216)
0.232
(0.222)
0.241
(0.261)
0.198
(0.283)
Livestock0.017
(0.014)
−0.023
(0.014)
−0.002
(0.014)
0.013
(0.014)
0.030 *
(0.016)
0.018
(0.014)
−0.046 *
(0.025)
Dano−0.576 ***
(0.178)
−0.368 **
(0.173)
−1.078 ***
(0.182)
−0.222
(0.173)
−1.233 ***
(0.184)
−0.042
(0.212)
−0.362 *
(0.196)
Koumbia−0.817 ***
(0.203)
−0.519 ***
(0.198)
−0.899 ***
(0.206)
−1.105 ***
(0.200)
−0.152
(0.197)
0.385 *
(0.225)
−0.468 **
(0.228)
Cognitive social capital 0.003
(0.004)
−0.002
(0.004)
0.003
(0.004)
0.007 **
(0.004)
−0.004
(0.004)
0.000
(0.004)
0.008 *
(0.004)
Structural social capital0.003
(0.003)
−0.003
(0.003)
0.007 **
(0.003)
0.001
(0.003)
0.010 ***
(0.003)
−0.007 **
(0.004)
0.005
(0.004)
Constant0.422
(0.881)
−0.768
(0.864)
−0.172
(0.894)
−0.861
(0.871)
1.186
(0.931)
−5.123
(169.992)
−3.119 ***
(1.096)
Notes: ***, **, * showing significant at 1%, 5%, and 10% probability level, respectively; standard errors are in parenthesis.

