Livelihood after Relocation—Evidences of Guchchagram Project in Bangladesh


1
Department of Political Science, Vanderbilt University, Nashville, TN 37203, USA
2
Institute of Regional Science (IfR), Karlsruhe Institute of Technology (KIT), 76131 Karlsruhe, Germany
3
Tropical Hydrogeology and Environmental Engineering at Institute of Applied Geosciences, Technical University of Darmstadt, 64287 Darmstadt, Germany
*
Author to whom correspondence should be addressed.
Soc. Sci. 2017, 6(3), 76; https://doi.org/10.3390/socsci6030076
Submission received: 13 February 2017
/
Revised: 30 June 2017
/
Accepted: 10 July 2017
/
Published: 13 July 2017
Abstract
:Due to climate change and its consequences to islands and coastal countries, the relocation of the people living in those vulnerable places has received a lot of attention from policy makers as well as academicians. There have been similar kinds of programs running in Bangladesh since the country’s independence in 1971, and people who are landless or victimized due to river bank erosion, cyclones, or floods have been relocated under the umbrella program called ‘Guchchagram’, i.e., cluster villages. Different ruling parties had used different names for the project due to the financial nature of the project, but none of them have significantly differed from the overall goals and objectives of relocated settlements and the betterment of the landless and extreme event victims. Particularly, this study asks how and to what extent the livelihood of relocated households has changed, and what the potentials and constraints of the relocated settlements are. Based on an empirical study at four Guchchagrams of Gopalganj Sadar Upazila, the study shows that there is a significant improvement in the livelihood conditions of the migrated people, but the locational disadvantages and access to agricultural production, the local employment market, and some of the targeted objectives of the project have not achieved. To some extent, the rehabilitated families have similar risks as they had before; however, available agricultural lands and proper allocation can reduce such livelihood risks.
1. Introduction
Resettlement of the poor and land reform is linked with poverty alleviation (Powelson 1987) and is one of the most important challenges facing governments all over the world. Notably, studies conducted in South Asia (Niroula and Thapa 2005), Africa (Toulmin 2009; Peters 2009; Kevane 1994), Nepal (Thapa and Niroula 2008), the Philippines (Otsuka 1991), India (Oldenburg 1990), China (Ding 2007), Thailand (Wannasai and Shrestha 2008), Scotland (Bryden and Geisler 2007), Mexico (Bouquet 2009; Bobrow-Strain 2004), and Vietnam (Nguyen et al. 2016) confirmed that land reform is a part of poverty alleviation and the human development program. Based on the consultation meetings with experts and a synthesis of existing literature, P. Narh and colleagues (Narh et al. 2016) describe the institutional and sociopolitical dynamics of the ways land reforms in Ghana, Kenya, and Vietnam. In this paper they found that compared to Ghana and Kenya’s land reform policy, Vietnam’s land reform program was successful. The reasons they claimed were that Vietnam’s land reform policies were based on financial incentives, which were aimed at lessening the poor who may have lacked resources to acquire land. The radical land reform approach in Ghana perceives the customary land tenure systems as ineffective and advocates for total state control (Nguyen et al. 2016; Narh et al. 2016), whereas land reform programs to redistribute land among Kenyans are based on market principles (Narh et al. 2016). Therefore, their implementation comes with several challenges in the local context.
This is not different for Bangladesh (Jansen 1983; Das et al. 2012; Sen and Ali 2015; USAID 2010). In a developing country like Bangladesh, which counts among the most densely populated countries on the earth’s surface, land is the scarcest commodity and its ownership implies social and economic power. The property regimes and land tenure system possess a long history. There is no customary land tenure; only statutory land tenure exists in Bangladesh (Jansen 1983; Hossain 2015). The dynamics of socio-economic class structure indicate an overall deteriorating situation of the poor and middle class and a concentration of land and other assets among a rich few. Out of 160 million people, 49.6 million (31%) are living under the national poverty line of US$ 2 per day (USAID 2010), but the share of landless households has increased from 19% in 1960 to 56% in 1996; and in 2016 a total of 4.5 million completely landless families in the country has been reported (USAID 2010). On the other hand, in 1960 1% of large, land-owning households had command of over 4.7% of the land; by 1996 it had gone up to 8.2% (Sen and Ali 2015). Again, UNDP (USAID 2010) reported that in Bangladesh 89% of the landowners have less than 2.5 acres of land, 10% between 2.5 to 7.5 acres and 1% have more than 7.5 acres of land. In spite of several land reform programs, 39% of the households own less than 0.5 acres of land in Bangladesh (Hossain 2015), and the farmland is in return declining as it is being converted to non-agricultural land (Guchchagram 2017; Momen 1996).
To eradicate poverty the government of Bangladesh, therefore, has been implementing different land reform projects. Despite the failure of decades-long land reform programs which resulted in a strengthening of informal local powers and a raising of doubts about the actual implementation of legally prescribed targets, the government of Bangladesh has continued its attempts to distribute homes to the landless in order to reduce social disparities and alleviate poverty (Das et al. 2012; Hossain 2015; Momen 1996; Barkat et al. 2001; Barkat et al. 2000; Rahman and Rahman 2015). The establishment of ‘cluster villages’ or ‘Guchchagram (GG)’ for the landless and for climate victims is one of the major programs that has been implemented since the independence of the country in 1971 (Guchchagram 2017; Momen 1996; Barkat et al. 2001; Barkat et al. 2000).
There is scope to study whether such projects address the needs of targeted people in the country. This project not only has a short-term implication of improving the livelihood quality of the poor and landless people, it also has long-term consequences to the overall societal development of the country. To date, there is no study that reveals the changes in the livelihoods of the relocated families in GG. Therefore, this study concentrates on GG and attempts to explore the livelihood risks in recently established GGs. In particular, it addresses the following research questions:
- How and to what extent has the livelihood of relocated households changed?
- What is the potential and what are the constraints of the relocated settlements?
Taking these questions into consideration, this research focuses on the social dimension of quality of life and the changes in the livelihood platforms. Strategies are defined by indicators that measure livelihood quality before and after relocation. Outcomes stand for the observed changes in livelihood. Finally, the descriptions of these components are presented. Therefore, a total of 130 households were surveyed from four GGs in coastal areas, specifically in the Gopalganj district of Bangladesh. Qualitative methods such as focus group discussions and in-depth interviews were used to further develop the results of household interviews. Data were collected on food and water security, income opportunity, housing, social network, security, utility and service facilities, and overall perceptions of the changes in livelihood. Results were then compared based on the information before and after the relocation period with the goal of assessing the nature of livelihoods risks. The goal is to unearth useful information to help plan future policy activities for these poverty alleviation and rehabilitation programs.
Brief History of Land Reform and Rehabilitation Projects in Bangladesh
Immediately before the independence of the country, the devastating tidal surges and cyclone of 1970 (Cyclone Bhola) displaced millions of people and made them homeless. After the liberation of Bangladesh in 1971, a lot of people needed housing rehabilitation. At that time, the government under the leadership of Sheikh Mujibur Rahman came forward with programs to rehabilitate those affected and other landless people by situating them on Khas1 land. He advised the Ministry of Land Administration and the Land Reforms Division to undertake an initiative to maximize the utilization of Khas land by establishing “Cluster Villages” in the Char area of the greater Noakhali District for the rehabilitation of landless families affected by the cyclone and by river erosion. He visited Ramgati Thana of the then-Noakhali district on 20th February 1972 and inaugurated “Poragacha Cluster Village” as a pilot project. Since then, all the ruling parties have tried to undertake initiatives for the rehabilitation of landless families; usually, the government used Khas land for these resettlement projects (Das et al. 2012; Guchchagram 2017; Momen 1996; Barkat et al. 2001; Barkat et al. 2000). The projects were named differently in different project regimes (Table 1). For example, Cluster Village was first started in 1972, Asrayon (which means ‘returning home’) in 1997 and Adarsha Gram (which means ‘ideal village’) in 1998. The Government of Bangladesh has already rehabilitated 71,032 families in 1507 Adarsha Gram projects that were jointly financed by the government of Bangladesh and the European Union. That program ended on 31 December 2008. The present government has been implementing a new project of a similar nature titled “Guchchagram (GG)” (which means ‘cluster village’). Under the first phase of this Guchchagram (CVRP) Project, 10706 families were rehabilitated in 254 GGs by 2015, and now under the second phase the government has targeted for rehabilitation of 50000 families in approx. 2550 Guchchagrams by June 2020 (Guchchagram 2017).
The key objectives of the GG project also include imparting training in skills development for income generation activities (Guchchagram 2017). The GG project is one of the Prime Minister’s priority programs and it focuses on the rehabilitation of climate victims. In order to emphasize this priority, the Prime Minister’s Office has become the sponsoring ministry for this project and renamed the project the Guchcha Gram for Climate Victims Rehabilitation Project (CVRP) (Guchchagram 2017).
Under the GG project, a landless family receives a minimum of 0.04 acres of land for a homestead, a 300 square foot house, a kitchen, and a sanitary latrine. There are no fees to apply for or even to obtain a house in the GGs. Adequate provision is made for safe drinking water through a suitable type of tube-well. For each village, a Multipurpose Hall is constructed for the purpose of recreation, training, and other socio-economic activities. Each family is provided with micro-credit and appropriate training for carrying on income generating activities through the Bangladesh Rural Development Board (BRDB). In addition, adequate facilities for primary health care, education, family planning, and building social awareness are provided to residents through different organizations.
The next section presents the methodology, followed by the results. The discussion session reflects on the research questions. The chapter concludes with ideas for further research and policy formulation.
2. Study Design
2.1. Studied GGs
About 3400 GGs have been constructed since 1971 in Bangladesh under different projects. It was not possible to conduct a field study at all of the GGs. As one of the main goals of the GG project is to ensure rehabilitation for the landless and for climate refugees, it is important to select the GGs that are established in the regions, which are less affected by sudden-onset environmental hazards. Accordingly, Gopalganj city is located in the southern part of the country, which is less affected by the cyclone, the flood, and even by salinity. Arsenic contamination in groundwater has been reported as one environmental problem (Rahman and Rahman 2015). Up to 2014, under different GG projects, a total 7 GGs had been established in Gopalganj district (Upazila Land Office 2014). Out of the 7 GGs, four have been chosen for this study (Figure 1).
Four GGs, namely Raghunathpur, Ichakhali, Haridaspur, and Char Manikdah, located in Gopalganj Sadar Upazila of the Gopalganj district, have been selected as study areas (Figure 1). In total, 200 families are settled in these four GGs. The Char Manikdah GG is about 5 km away from the town of Gopalganj Sadar. A total of 40 families is living in this GG. All of them are Muslim. Haridaspur GG is located near the Haridaspur Bridge. It is about 4–5 km away from Gopalganj Sadar, on the bank of the Modhumoti River. There are 67 Muslim and only 3 Hindu families living here. Ichkhali GG is located in a remote area about 20 km away from Gopalganj Sadar. There are 40 families in this GG. All are Muslim except one Hindu family. There is no electricity supply, paved road network, or drainage facilities in this GG. Raghunathpur GG is about 5 km from Gopalganj Sadar. There are 50 households present in this GG. Of them, 25 households are Muslim and 25 are Hindu.
2.2. Data Collection
The study deals with both primary and secondary data. Primary data have been collected in the field by conducting structured questionnaire surveys and interviews, along with observations and case studies. The list of names provided by the local administrative office (i.e., Union Parishad) showed that a total of 200 families were relocated in the four GG villages. Amongst these 200 families, 130 (65%) households were selected through random sampling and interviewed (see Table 2) using a structured questionnaire in the Bengali language.
Data related to the change in different aspects of livelihood was collected in both the pre- and post-relocated situation. Particularly, the household survey contains sections on food security, economic capability, housing condition, social network, utility and services, and infrastructural facilities. Besides, there were questions related to the reasons for their relocation. Upon taking the consent, the household questionnaire was given to the household head; in cases in which the household head was not available, his/her spouse or their eldest son/daughter (more than 18 years old) was interviewed.
To obtain an authentic picture of the livelihood change processes, firstly, informal talks were conducted with the relocated families. Later on, using personal and informal networks with the community, focus group discussion (FGD) sessions were conducted with two specific groups—one with the relocated families, and another one with the ordinary villagers. One FGD was administered by the rehabilitated people, in which they discussed three key questions: (i) how and why did they relocate in GGs? (ii) who had selected the beneficiaries, and how transparent was the process? (iii) what are the main problems in living in the respective GGs and how can these problems be solved? Another FGD was conducted with the ordinary villagers and discussions were confined to (i) the conflict between relocated settlers and ordinary villagers; (ii) the potential (economic and social) of GGs for the development of their locality; and (iii) problems they incurred due to GGs. Subsequently, all the FGDs were transcribed and kept anonymous to protect the participants’ privacy.
The data collection was conducted August–September 2014 by the second author with five enumerators. They all were trained intensively by the first author before the survey took place. The face-to-face household interview took an average of 30 min. After reviewing the survey by the second author at the end of the day, if any inconsistencies or missing data were found, then another visit to the respective household was performed.
2.3. Analytical Methods
Changes in livelihood quality have been explained in different approaches: the livelihood approach (Ashley and Carney 1999; De Sherbinin et al. 2008; Soltani et al. 2012), livelihood activity choices (Lambini and Nguyen 2014), production and consumption analysis (Ellis 2000), and sustainable livelihood’s approach (SLA) (DFID 1998). Identification of the diversity of livelihood strategies is very helpful for the improvement of the rural livelihoods, and thus is also helpful for the increment of the efficiency of the intervention programs that are targeted to improve the quality of rural livelihoods. In doing so, there are different methods: Nguyen and colleagues focus on the rural livelihood strategies and the determination process in Cambodia (Sultana and Mallick 2015). They have defined livelihood framework by three closely connected components: livelihood platforms, livelihood strategies, and livelihood outcomes. The livelihood platforms are defined by natural capital and household capital (physical, human, financial, and social). This contextualization of livelihood platforms is similar to the DFID’s SLA. In the DFID framework, these livelihood platforms are termed as ‘livelihood assets’ for the pursuit of positive livelihood outcomes (Lambini and Nguyen 2014; DFID 1998). As the main objective of this research is to assess the outcome of the relocated livelihoods in GGs, it considers the analysis of the ‘livelihood assets’ approach of the SLA framework of DFID.
A sustainable livelihood approach draws on the economic concept of livelihood; however, the integration of different types of livelihood capital and social aspects endows this method with multi-disciplinarity and makes it a holistic approach to understanding livelihood changes in a particular time frame. Five livelihood asset/capital categories are natural, financial, human, social, and physical capital. These different types of capital are the livelihood platforms for a household to choose the livelihood strategy as a combined choice of assets and activities (Sultana and Mallick 2015; Nguyen et al. 2015). Accordingly, this research considers the capitals under SLA as:
- Natural capital, which includes land ownership, proximity to rivers, and resilience to natural hazards, i.e., floods, erosion, tidal surges, etc;
- Financial capital, which includes food security and economic capability. Food security is defined by the productivity of rice, home gardening, livestock, poultry, food stocks, access to fresh water, and changes in the cost of daily food. Economic capability includes occupation, duration of work per day, monthly income, monthly expenditure, and location of employment;
- Human capital includes the age of household head, gender, the level of education, and the number of family members;
- Social capital includes social security and political connections, acquaintance with friends, relatives, and neighbors, and assistance from those sources;
- Physical capital includes housing conditions, access to electricity, solid waste management, sanitation facilities, access to education and health facilities, and access to information and communication technology (ICT).
All these capitals are the sources of livelihood strategies, which are termed as the indicators of changes in livelihood and have been analyzed in both the pre- and post- relocation situation. Table 3 presents these indicators.
Then, a composite weighted indexing method has been applied to calculate the changes at an individual household level. Finally, the results have been presented and interpreted across the sites, as well as based on the total sample population. The composite weighted index method is a valuable tool that helps to unify/average different factors into a single representative dataset that represents the overall characteristics of all applied factors. Table 3 represents the applied indicators, their direction, and assigned weighting values. Here, all the factors are treated equally and therefore an equal weighted indexing method is applied. Depending on the direction of effects (positive or negative for the improvement of livelihood condition), a value of negative or positive 1 is assigned to the factors. Then, all the assigned values are summed and divided by the number of factors. The scores obtained describe the improvement in the quality of livelihood. The output factor (quality of livelihood index) is in the range of −1 to 1. This method is applied before and after relocation. The difference in the livelihood quality index before and after relocation describes whether there was an improvement in livelihood at the individual level. A negative output shows that the livelihood quality has not improved.
3. Results
3.1. Basic Demographics of the Surveyed Households
In our sample, 83% of the respondents were Muslim and 17% were Hindu. The average household size before relocation was 5 and after relocation was 4. Comparing the before-relocation period, the family size has increased but the extended family has broken into nuclear family households in most of the families. Female respondents (80%) are more represented because males work outside the home; they go to work early in the morning and return after sunset. People who have small businesses have higher expenditures and income. In most of the families, expenditure is higher than income. How do they make up this difference? Someone said they have to take loans to meet their extra expenses. It was evident that some people rented their houses to tenants, and left the GGs. 60% of respondents identified himself/herself as the first person in the family to come to this GG. Another 34% replied that their spouse arrived first. Only 5% replied that their parents arrived first.
3.2. Causes of Relocation
Relocation does not occur in a vacuum when people move, it affects both the place they leave and the place the move into, and relocation also can be seen as temporary (short-term) or permanent (Brown et al. 2006; Black et al. 2013; Mallick and Siddiqui 2015). In this research, we are dealing with ‘relocated settlement’, which means the beneficiaries who relocated to GGs are ‘permanent migrants’. The process of GG establishment usually starts with an official announcement given by the Ministry of Land of the People’s Republic of Bangladesh to the respective local government authorities. Then the local assistant commissioner for land delivers the news of GG construction and asks local elected bodies (e.g., the local chairman) to make a list of eligible families. Local elected bodies then call for applications, usually from the landless or distressed families in their area of jurisdiction. In our study, we did not consider this process; rather, we focused on how the respondents described their reasons for relocation.
Our study shows that the main cause of relocation was landlessness. 76% of the respondents claimed that their relocation was due to landlessness (Das et al. 2012; Sen and Ali 2015; USAID 2010; Hossain 2015; Guchchagram 2017; Momen 1996; Barkat et al. 2001; Barkat et al. 2000) and only 19% said it was caused by environmental disruptions (Brown et al. 2006; Black et al. 2013; Mallick and Siddiqui 2015; Mallick and Etzold 2015). This response varies from GG to GG (Figure 2). Among those who relocated due to environmental disruptions, the largest number said it was due to river bank erosion, followed by floods and cyclones. A woman interviewed on Haridaspur GG stated, “We were living on the bank of the river Madhumoti, outside the embankment. Every year in the rainy season, our courtyard eroded. In 2009, it was a rainy night and we were sleeping. Suddenly we noticed that our house was hurriedly moving. Luckily, we came out from the house with our children and saw that our house was now under water. We stayed the whole night on the embankment; the next day, we went to our chairman. He sent us to this GG. This house was locked, the owner of this house was not living here. He lived in Dhaka. Then the chairman arranged so that we could rent this house. Since then we have been living here”.
The selection criteria show that landless people will be given priority. Most of the people who live in the GG are landless. Some had land but lost it due to a natural disaster (e.g., as described in the previous interview); a very few lost their house and land due to a man-made disaster. There is no specific reason to select the specific GGs for relocation, but the possibility of getting land free of cost entered into their decisions. Only 3% live temporarily in the studied GGs. They said if they have any opportunities to move to another place, they will leave their existing GG. A total of 79% of the migration was from village to village, whereas only 21% was from city to village. This shows that there were people living in slums that wanted to leave if they were given land and a house.
3.3. Changes in Livelihood Strategies—Before and After Relocation
Recent programs of different development organizations such as United Nations, World Food Program, World Bank, etc. have emphasized issues like food security, safe water and sanitation, housing conditions, income opportunities, and infrastructure and institutional supports to explain the livelihood quality and conditions of a nation. All these socio-economic indicators of livelihood quality ultimately indicate the quality of the life of the society (Maier et al. 2016). However, the case of the assessment of the changes of many of these indicators requires long-term observation. Therefore, by ignoring many of them and considering the respondents’ perceptions, this research focuses on the changes in the livelihood of the relocated settlers in GGs. The following sections describe different livelihood strategies and their situation before and after relocation.
3.3.1. Food Security
Rice is the staple food of the Bangladeshi, and its production is an important source of food security. The situation of rice production was better before relocation, and now there is a declining trend (in average 57.3%) in the quantity of rice production. They said that in the GG they do not find enough land to rent for cultivation. That’s why they can’t produce more rice in the GG. Only 8% of them who produced rice can sustain their entire year’s food consumption from their own crop production, and the average capacity of preserving food has been decreased for 53.5% respondents.
Table 4 shows that there was a statistically significant association between the before and after relocation livelihood in the context of home gardening, rice farming, livestock, and poultry rearing. That means the situation of rice farming is different from before relocation. In the group discussion session in Haridaspur GG, a participant explained this situation: ‘while I was living in Mollahat (my origin village), I did not own any land, but I had the opportunity of sharecropping. Through sharecropping, I could take rice my home; with that, I could run our family for at least 4 months. But here, I do not have any such kind of option’. But the situation of home gardening has been significantly improved as, under the GG program, the government provides a small amount of land for home gardening.
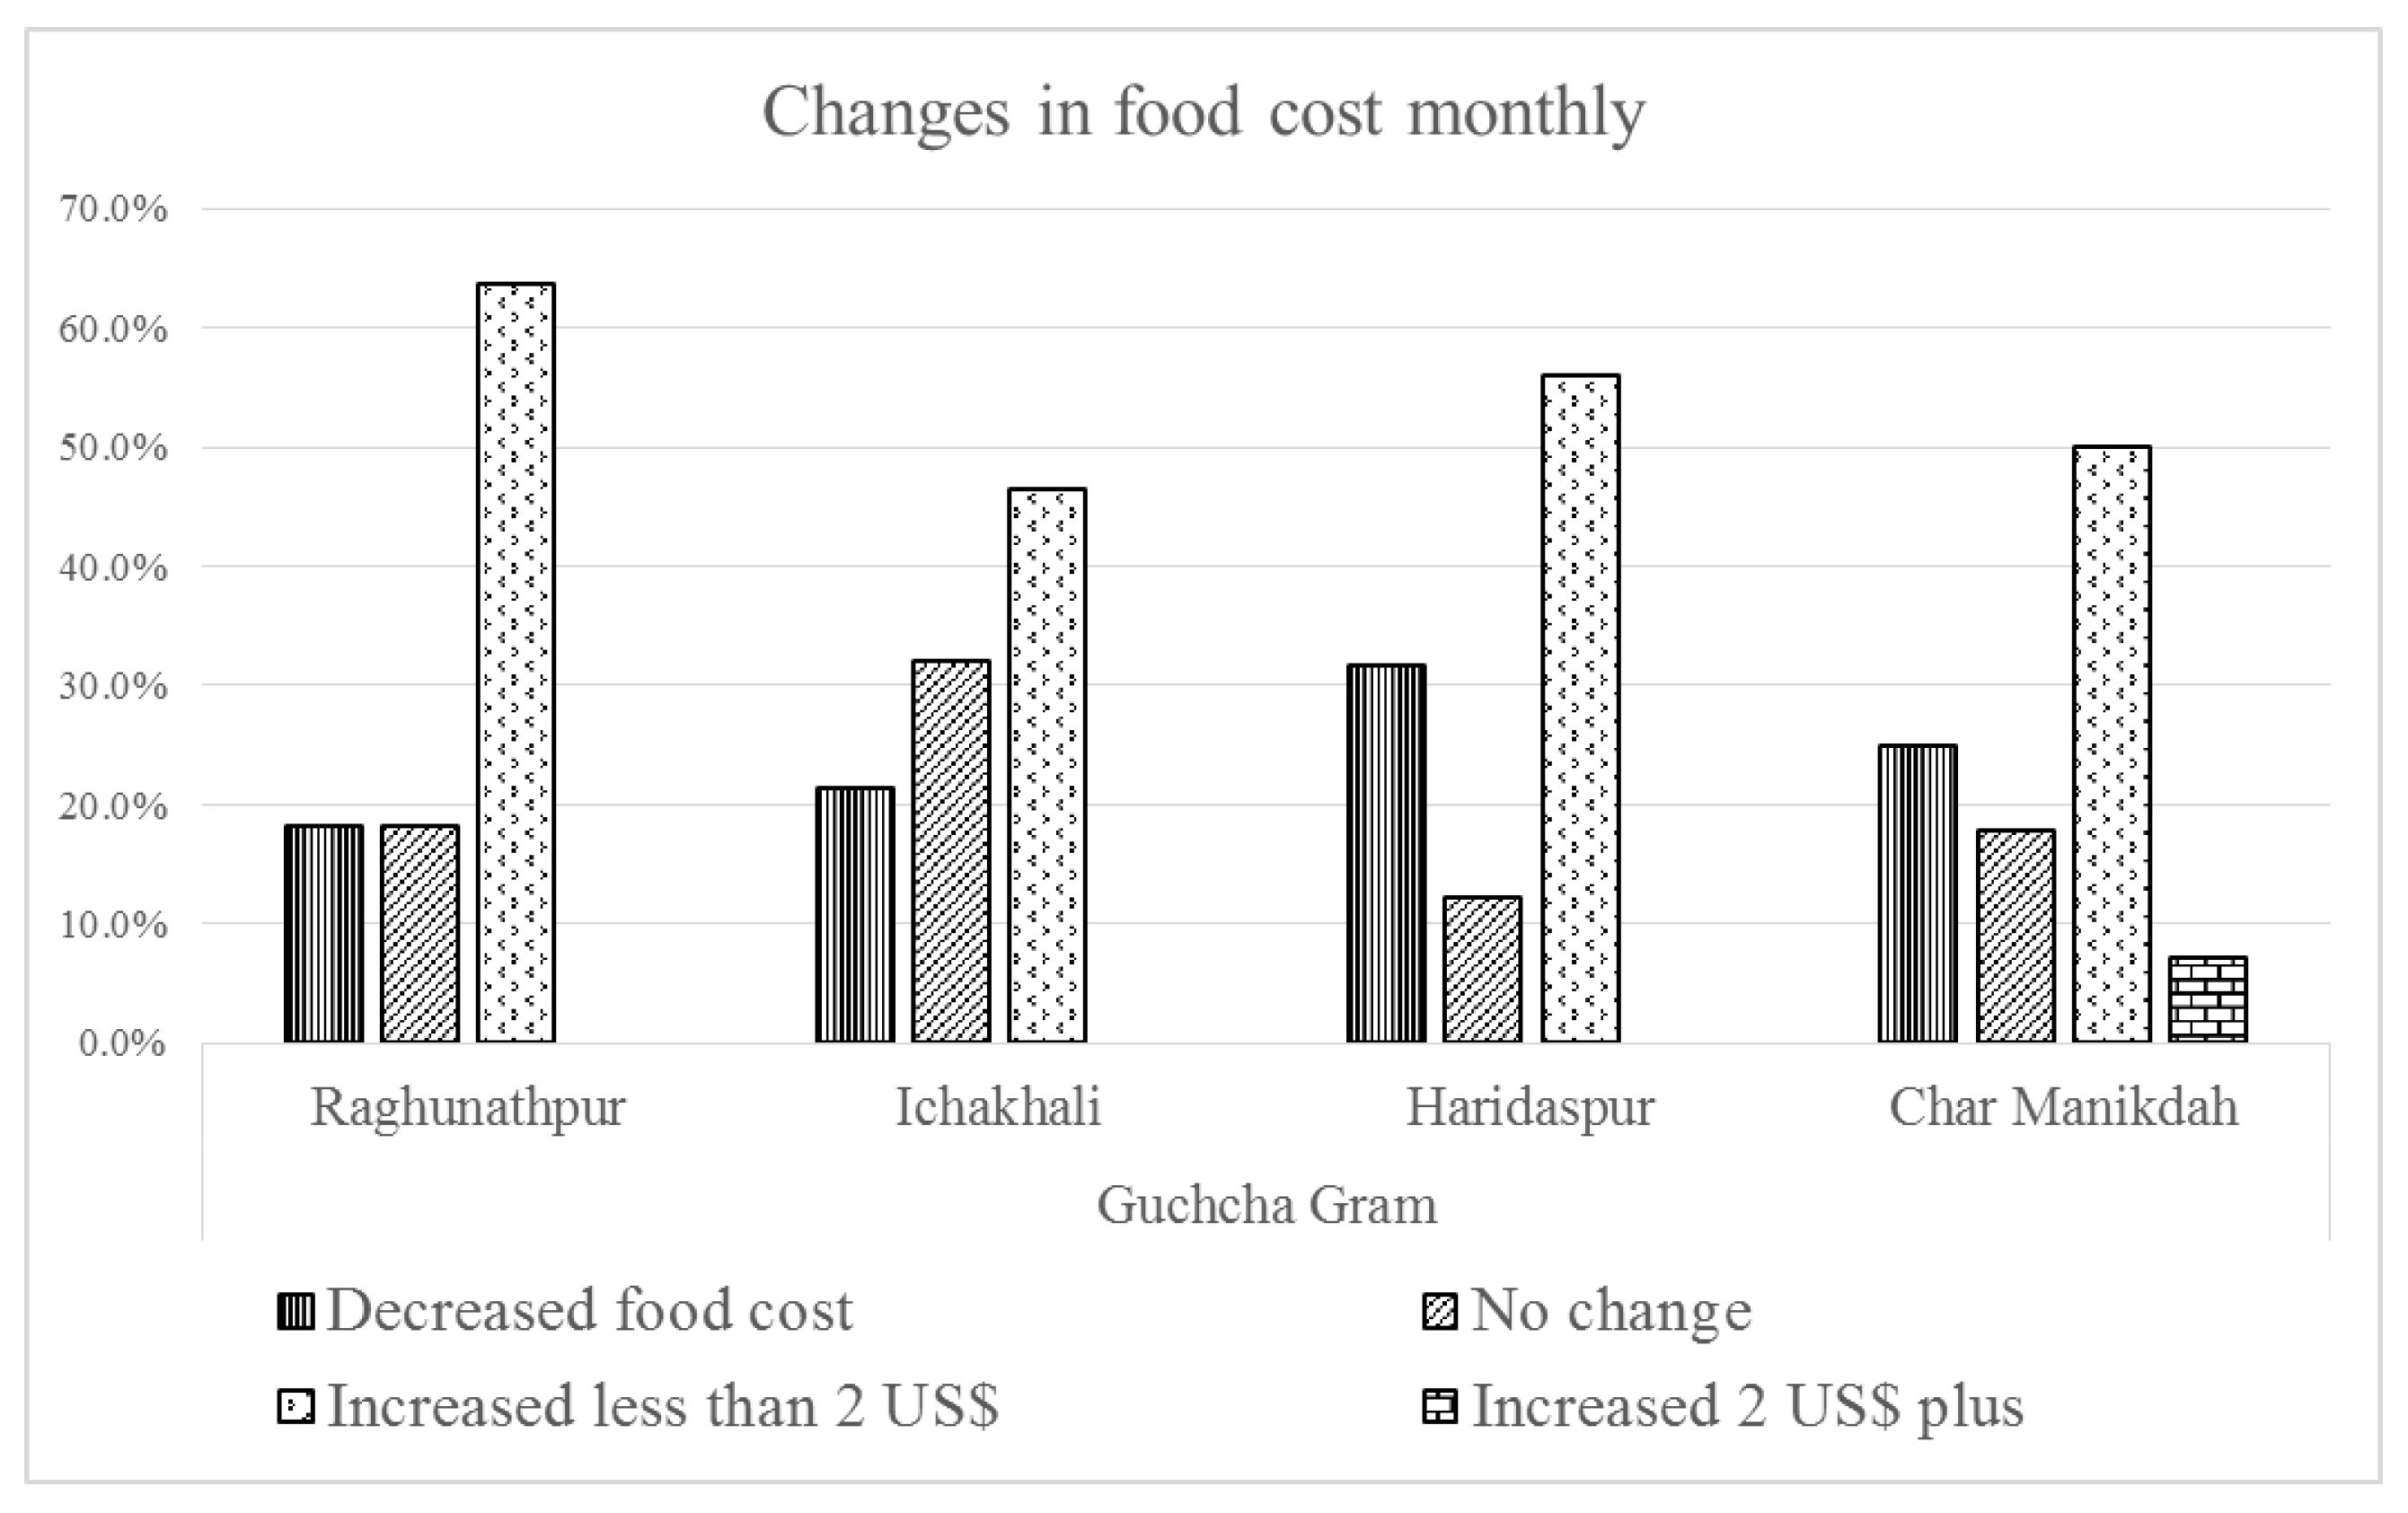
Before relocation, they had fewer home gardens, but now a majority (61%) have their own home garden and the average of having a home garden has been increased by 18.1% after relocation. This is because in the GG all families have separate land where they cultivate vegetables and fruit trees. In the Raghunathpur GG, people are in conflict with one another in cultivating vegetables, because they have no written documents specifying the portion of land each family can use. Livestock rearing is decreasing (on an average by 29.3%), as sometimes a duck or hen destroys someone’s cultivated vegetables or eats the food crops that the neighbor has planted. This is one of the major issues in quarrels. When someone’s duck or hen goes to another’s house, sometimes the person on whose land the livestock has trespassed eats the livestock. There is no significant improvement after relocation in preserving food; almost 80% of the respondents had to live hand-to-mouth. Data shows most of the families spent less than 120 USD per month before relocation, which also varies from GG to GG. For example, there are few families at Char Manikdah GG who spent more than 180 USD per month on their families after relocation. Changes in monthly food cost across GGs are presented in Figure 3, which shows that most families experienced increased food costs after relocation. This could be due to the increasing size of families or higher food prices in Bangladesh. The second cause is more prominent for them because frequent inflation in Bangladesh exacerbates food prices.
3.3.2. Drinking Water and Sanitation
However, there was no statistically significant association of having access to fresh water between before and after relocation, i.e., in both these periods the respondents had an equally similar kind of accessibility to fresh water (Table 4). In Raghunathpur and Ichakhali GG, very few people have problems with drinking water; the tube wells are working and the water is drinkable. However, in Haridaspur and Char Manikdah GG, most of the people have problems getting drinking water. There, some tube wells are not working and the water from some tube wells is not drinkable. They have to collect water from sources in a nearby community but the people in the nearby community do not want the people from these GGs using their water sources. People had the same problem before relocation. 40% of them had no access to fresh water before relocation and they were used to getting water from a pond or river. The households living in Haridaspur and Manikdah GGs were the majority of those who had no access to the improved water sources.
3.3.3. Occupation
There was a significant decrease in average monthly income (i.e., 588.46 BDT = 7.4 US$) after relocation, but there were also significant changes in daily food costs and working hours (Table 5). This was because some people had to change their occupation after relocation. The people who relocated from closer villages did not have to change their type of work for the most part. But the people who relocated from towns or other districts had to change their type of work in most cases. The working hours per day also changed for some people because of relocation. Some 25% had to increase their daily working hours after relocation. Increasing or decreasing family size is one possible cause of change in working hours; to support a large family, the household head has to work more hours, while the household head of a small family has to work fewer hours.
A change in the occupation because of relocation is another possible cause of the change in working hours, e.g., a day laborer who had to change his occupation to van or rickshaw driver. A third possible explanation for the change in working hours is that people found very few alternative employment possibilities, i.e., people had to do whatever work they could get after the relocation. It is found that the change in daily working hours depends on the pattern of occupation before and after relocation and there is a positive correlation between the changes in monthly income and changes in daily working hours (r = 0.180, p < 0.001).
Monthly income change due to relocation is presented in Table 5. The data show that the amount of monthly income significantly decreased after the relocation. The reason is that the relocated families could not find work in their communities; most of them reported that they had to travel some distance for their employment. They had to go other cities (69%) and even other districts (20%) for work.
3.3.4. Housing
As the program was designed to provide a house and land to the landless and climate-induced displaced families, almost everyone in our sample reported that they owned a house. Only two families in our sample reported that they rented the house from the owners, who lived in a neighboring village. Amongst our respondents, 23% had rented houses before relocation. Before relocation, 94% had kutcha houses4. After relocation, the situation did not change. This study also asked whether there was any change in the total floor area due to their relocation into the GG. It has been found that, after relocation, everyone got an identical structure and design of their houses from the government; therefore, all of them had the same floor area, whether they had a large or small family. A significant decrease in both the number of rooms and the floor area ratio after relocation period has therefore been found. The average per capita floor area was decreased by 3.9 square meters (Table 6); however, there were no significant changes in house rent if it was rented.
After relocation, only two cases were found of people who were renters rather than homeowners. In these two cases, the people were not given homes in the GG; they were not listed as beneficiaries and they arrived after the distribution of the houses. They rented living space from other people who have been given homes under the GG but have their own houses nearby. Those people got these houses by means of their power and connections with local politically influential persons.
3.3.5. Social Life
Relocation also changed family structure. Before relocation there were only 68% nuclear families, but after relocation this was reported at 91%. How were the family connections before and after the relocation? Relocated people were less likely to get help from their family members after relocation (Table 7). But a similar question was asked of the respondents: whether they were helpful to their family/relatives. At the same time, questions were also asked about the economic relationship with family/relatives before and after their relocation. Were any changes observed? What is their status regarding money lending with/from their relatives and friends? In the context of reciprocal supports from relatives and friends, Table 7 shows that there was a statistically significant association both before and after the relocation period, and even after relocation they have a strong connection with their families and relatives. Group discussion data show that they could not lend money from local landlords, as they were scattered and segregated from the traditional communities. Even the formal credit institutions like NGOs, banks, etc., did not include them in their regular credit programs.
Regarding the social life and harmony of their community, people reported more thefts from their homes after relocation. Table 7 shows around 59% of the respondents did not report security problems, whereas 41% reported that they were feeling insecure due to frequent disturbances from neighbors, quarreling, harassment of women, etc.
They think they have no social status living in their GG. A man, 70 years old, explained, “I am 70 years old, I do not have many years to live. While I was living in Kashiani village, I was respected my fellow villagers, though I was living on the embankment, living from hand to mouth. In 2005, my son came to know about this GG. He communicated with the chairman, and then in 2007, we moved here. But you know, I never feel any society here. We are living here, but we are not linked with neighboring societies. Those people treat us as ‘udbastu’ (i.e., refugees). We have no social status”.
Questions were asked about their connections to their local community leaders. Next, their connection with local political leaders was examined by asking whether the local political leaders helped them solve their problems. Data shows very few got assistance from either community leaders or local political leaders, but community leaders were more helpful than local political leaders.
3.3.6. Utilities and Services
Table 8 shows different types of services and facilities that were available for the respondents before and after their relocation. Before relocation, around half of the respondents had an electricity connection at their home, whereas the electricity connection was totally absent after relocation in the studied GG, except that a few families with high income have solar panels. Among 130 families, only 7 families have a solar panel on the roof of their house.
The difference between the situation of having a safe and sanitary latrine is not significant, whereas the association between the situations of the accessibility to primary health care, education, a telephone, and public transport facilities are significant (Table 8). That means that after relocation the relocated families had less access to public transport facilities, health services, and education in comparison to their livelihood location before relocation. The reasons are probably that the GGs are established in scattered places, for instance, outside traditional villages or on river banks. These places are not connected to the regular infrastructural development of the local government. Access to a telephone, in particular access to a cell phone, has improved a lot because the mobile telecommunication industry has grown at a fast pace in recent years.
3.4. Extent and Nature of Changes in Relocated Livelihoods
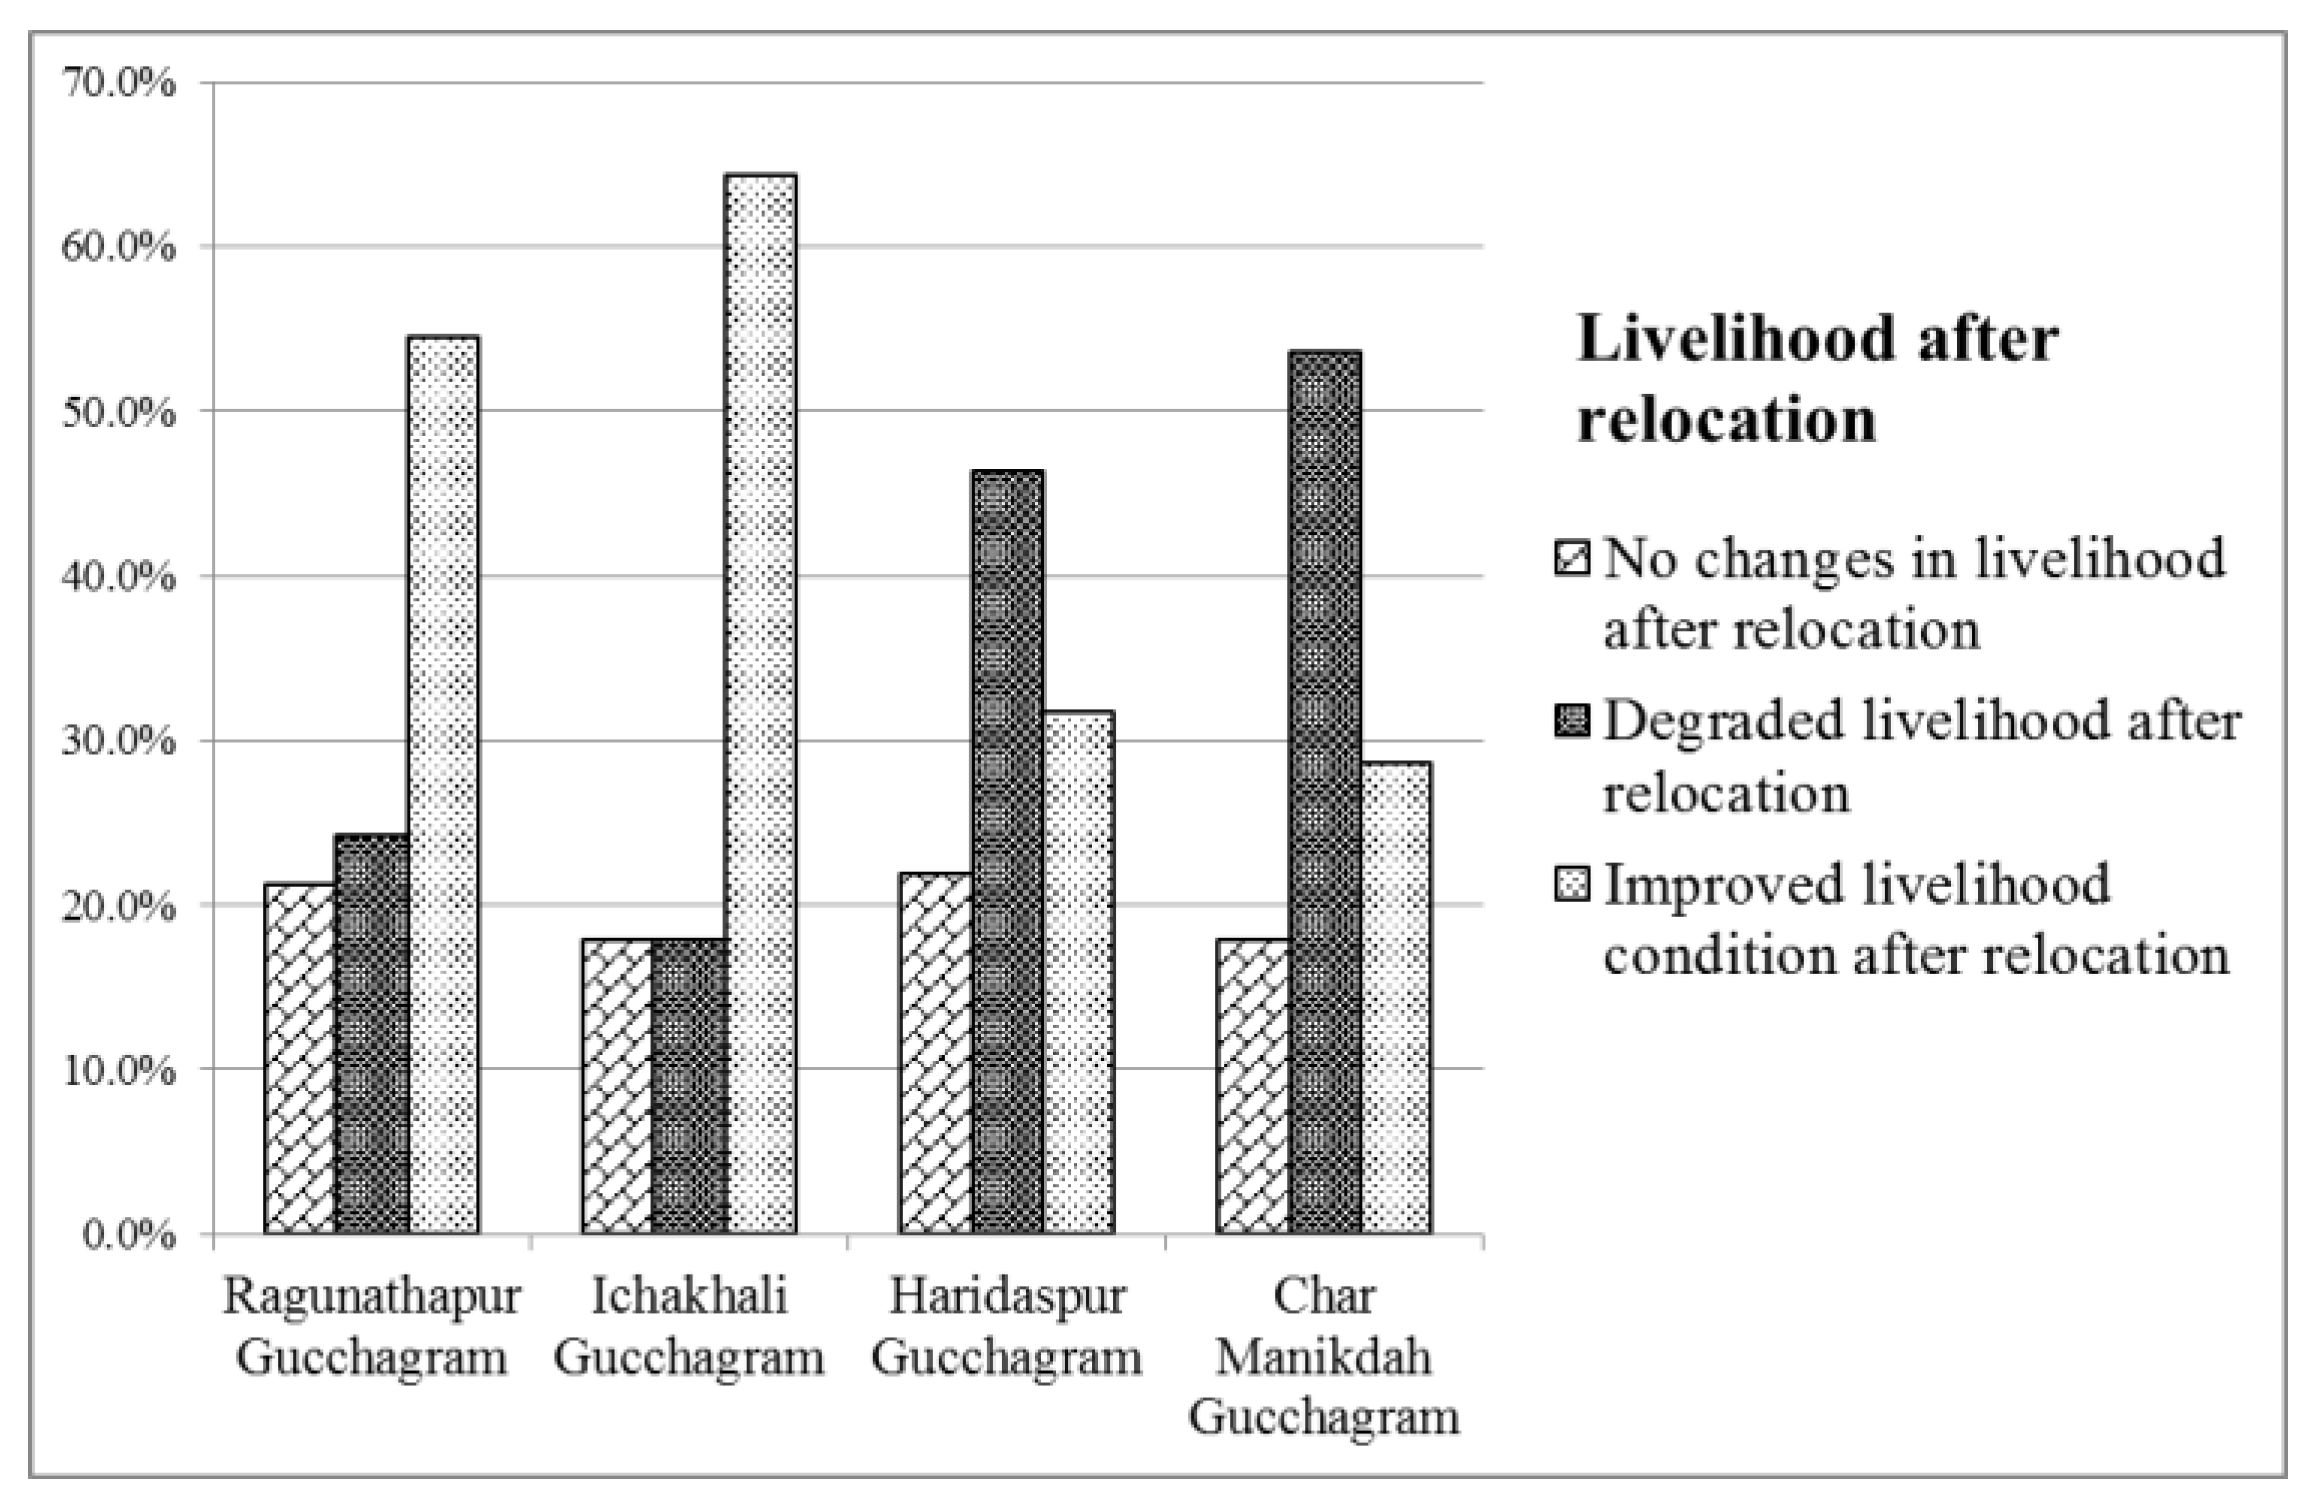
Analysis by the SLA framework employing the variables described in Table 3 shows that the livelihoods condition after relocation was improved for 44%, degraded for 36%, and unchanged for 20% of the respondents (Table 9), and the impact significantly varies across the GGs (Figure 4).
The analysis shows that the majority of relocated people at Raghunathpur and Ichakhali GG had an improved quality of livelihood after relocation, and a majority in Haridaspur and Char Manikdah had a degraded quality of livelihood after relocation.
3.5. Potentials and Constraints of the Relocated Settlements
This part of the analysis describes how the respondent households’ social and economic well-being were affected by relocation, including perceptions about the changes in their livelihoods, satisfaction with relocation, problems in relocated places, institutional support during the relocation phase, and suggestions for the betterment of the relocated settlements. Most of the respondents thought the relocated houses were just adequate for their family needs, whereas, in Raghunathpur and Char Manidah, respondents claimed that the housing provided was less than adequate for their family needs.
90% of the respondents at Ichakhali GG claimed that the schooling facilities for their children at their GG were less than adequate for their needs. At Haridaspur GG, around 60% of respondents claimed that presently available health care facilities were adequate for their family’s needs, whereas in other GGs most of the respondents claimed that the available health care facilities were not adequate for their family’s needs.
In sum, the data shows that 20% of the respondents faced problems during their relocation. However, 70% of the respondents were satisfied with their livelihoods in terms of social and economic well-being after relocation. Although most of them were satisfied with their livelihoods after relocation, they identified some problems in their GG, which are listed in Table 10. They indicated that ‘lack of electricity connection’ is the prime problem, followed by poor transportation and a lack of drinking water.
4. Discussion on Findings in Light of the Analytical Framework
The research questions were developed to understand how well the project goals were achieved, as measured by the changes in families’ lives following relocation. The questionnaire was developed in light of several independent variables of change. In the previous section, collected data and information have been presented and discussed. Still, it needs to be seen whether the interpretations of these data and the information are relevant to answer the following research questions.
4.1. How and to What Extent Has the Livelihood of Relocated Households Changed?
There was no baseline study conducted with the same interviewee about their livelihood before relocation, and it is not easy to recall all their past livelihood aspects. Hence, the measurement of changes between pre-and post-rehabilitation livelihood is done using cognitive dissonance analysis (Mallick and Etzold 2015). The analysis is therefore based on the respondent’s perception that also refers to their attitudes, beliefs, and behaviors to reduce their discomfort about their previous or present livelihood situation (Maier et al. 2016; Festinger 1957; Cernea and McDowell 2000). Analyzing their livelihood situation in two different time periods, this study implies that the GG project has contributed to the betterment of the livelihoods of landless people in general. In addition to the ownership of land and a house, there are some other reasons for the improvement of their livelihood condition. The landless people now have more access to home-gardening though the average capacity of preserving food has been decreased for 53.5% respondents.
Not all the beneficiaries at GG are disaster victims and their rehabilitation phases under GG are not similar to the disaster aftermath (Festinger 1957; Mallick et al. 2011; Martin et al. 2017) or even the traditional push-pull pattern of migration, where migration has been seen as an adaptation strategy to overcome shocks (Brown et al. 2006; Mallick et al. 2011; Islam et al. 2013). It is evident from the study that the main achievement of the GG program is to provide shelter to the landless and to give them dignity and a permanent address.
Analyzing the utility and implications of land, it has been observed that homesteads, vegetable gardens, and ponds provide the beneficiaries with the potential for earnings, as well as security and comfort for the relocated households. Despite the limitations and inadequacies, the beneficiaries rehabilitated through the above-mentioned GG projects have been able to engage in income generation, but they faced a declining trend to their income level, which reveals that the project implementation has not always had a significant relationship with the achievement of its goals.
There is no strong association between the causes of relocation and the improvement of livelihood quality. The study shows that there is hardly any association between the spatial pattern of relocation (e.g., rural to urban, urban to urban, urban to rural, or rural to rural) and impact of relocation on livelihood condition (this finding is similar to previous studies, in which the main reason for destination selection was reported as social connections (Cernea and McDowell 2000; Mallick et al. 2011; Martin et al. 2017; Mallick 2014)). It is evident from the analysis that the social status of the project people has decreased as they are not integrated into neighboring society; however, they appreciate the GG project for providing them with better housing facilities, and for giving them access to sanitation facilities and home-gardening facilities.
Usually, GG projects are set up in places other than the traditional locations of societies, i.e., outside the existing villages. Therefore, there is a problem of acceptance between the traditional and relocated settlements. Moreover, project location is found not to be convenient for economic activities, as people had limited employment access to the adjacent traditional communities. Therefore, allotment of more agricultural land would have helped the beneficiaries to improve their economic condition. The inadequacy of land is affecting the progress of the beneficiaries toward self-employment opportunities. However, findings show that the respondents had increased the cost of food consumption. Our study cannot determine whether it was due to inflation or a higher level of food consumption. We assume the latter, which is, of course, a praiseworthy outcome of the project.
4.2. What Are the Potentials and Constraints of the Relocated Settlements?
The findings from the data analysis show that allotted land provides the beneficiaries with potential for income generation, along with shelter. Still, inadequate land cannot contribute significantly to the creation of self-employment activities. In the study, it has been observed that all the respondents are involved in income generation activities, though there was a significant decreased in their level of income. Thus, it can be said that, apart from the cooperative formation, other provisions are contributing to the creation of self-employment. However, this relocated livelihood has raised similar kinds of risks to those associated with the previous livelihood—such as scarcity of health services and education facilities, and lack of public transport facilities. Newly added problems associated with lack of electricity facilities and employment opportunities in the locality, as well as security problems, have raised the question of revisiting risk at relocated settlements.
An integrated program that includes skill development training and economic components for the betterment of income generating activities is required; furthermore, a project related to the empowerment of women would be very significant to the success of the GG project. Community-level activities should be strengthened by integrating the GGs with the traditional societies during different festivals so that the relocated households contribute to enriching their social status as well as the quality of their lives. The new programs and projects should be planned in a way in which the priority setting should be based on acceptance instead of necessity of the community (Mallick 2011).
5. Conclusions
The GG project is contributing at a significant level to reducing the poverty level of the landless and rootless families of the study area. Still, there are provisions to increase the support base for the beneficiaries, which would reduce their vulnerability to poverty and increase their level of security and comfort. Some useful recommendations are presented here in order to strengthen financial stability and socio-economic betterment of poor landless residents of GG villages. The study shows that allotted land and housing play an important role in creating income opportunities. Still, inadequate agricultural land hinders economic prospects, with the result that the GG residents have to share-crop on others’ land. If additional agricultural land can be made available, it will reduce the level of poverty and enhance self-employment opportunities for these residents. So, it can be concluded that the studied GGs project has played an important role in improving the livelihood condition of the rehabilitated families and, in turn, is contributing to improving the quality of their lives. But the informal discussions with neighboring villagers, project officials, and the observations of various indicators of quality of life inform that the GGs are still suffering from numerous problems and shortcomings. Amongst them, lack of skill development training, the provision of a very small amount of land to each household, the lack of electricity facilities, the lack of transport facilities, and the lack of drinking water facilities have been listed as the salient problems. These issues need to be addressed and given the highest priority in order to ensure quality of life for the rehabilitated families.
Again, the relocation project has created new threats to livelihood. Before relocation, they faced major natural hazards, for which they had external recovery supports (Cernea and McDowell 2000; Mallick and Vogt 2012; Mallick et al. 2011; Martin et al. 2017; Mallick 2014). At the relocated settlements, they continue to have problems such as lack of electricity and water. Although 70% claimed that they were satisfied after relocation, they once again faced all kinds of risks that they moved to avoid; it is a problem of ‘creeping livelihood risks’ in a relocated settlement. This raises future research questions: why are the relocation projects not as effective as they could be? How can the identified livelihood risks in relocated settlements be minimized?
The results of this initiative increased social segregation and introduced new forms of poverty. The main reasons for these unwanted side effects are socially accepted and prevalent corruption (USAID 2010), which must be seen in the background of all public activities in Bangladesh. Corruption fueled doubts about the actual implementation of legal provisions of the rehabilitation project. Therefore, this situation led to the question of how the GG rehabilitation project in Bangladesh is actually functioning and which interests it addresses. Future research should not only focus on the individual livelihood of the relocated families but should also include the whole society in which this process is embedded. We assume that the findings on the functioning of such a central and important process are symptomatic of any public distribution processes in the society of Bangladesh.
Acknowledgments
This research is funded by Coastal Research Foundation (CRF), Khulna, Bangladesh. Both authors acknowledge the sincerity and hard-work of the enumerators Kazi Md. Zahir Sadi, Sadia Sultana Ani, Sumon Khan, Al-Amin and Md. Zahir Chowdhury. The authors are grateful to Ms. Brittany Berger for her copy-edit supports for the paper. The authors are also thankful to the anonymous reviewers for their valuable comments.
Author Contributions
Both authors have substantially contributed to this research Bishawjit Mallick and Zakia Sultana conceived and designed the research; Zakia Sultana led and conducted the field survey in Bangladesh, encoded the data into SPSS and presented the preliminary findings in conferences; Bishawjit Mallick analyzed the data; Zakia Sultana contributed discussion materials and drew the map; Bishawjit Mallick wrote the paper.
Conflicts of Interest
The authors declare no conflict of interest. The founding sponsors had no role in the design of the study; in the collection, analysis, or interpretation of data; in the writing of the manuscript, and in the decision to publish the results.
References
- Ashley, Caroline, and Diana Carney. 1999. Sustainable Livelihood: Lessons from Early Experiences. London: DFID. [Google Scholar]
- Barkat, Abul, Shafique uz Zaman, and Selim Raihan. 2000. Khas Land: A Study of Existing Law and Practice. Paper prepared for Research on Poverty Alleviation. Grameen Trust, Grameen Bank. Dhaka, Bangladesh: Human Development Research Centre. Available online: http://www.hdrc-bd.com/admin_panel/images/notice/1380013777.03.%20khas%20land_%20a%20study%20on%20existing%20law%20and%20practice.pdf (accessed on 15 May 2017).
- Barkat, Abul, Shafique uz Zaman, and Selim Raihan. Political Economy of Khas Land in Bangladesh. Dhaka: Association for Land Reform and Development (ALRD).
- Black, Richard, Nigel W. Arnell, W. Neil Adger, David Thomas, and Andrew Geddese. 2013. Migration, Immobility and displacement outcomes following extreme events. Environmental Science & Policy 27: S32–S43. [Google Scholar]
- Bobrow-Strain, Aaron. 2004. (Dis)Accords: The politics of market-assisted land reforms in Chiapas, Mexico. World Development 32: 887–903. [Google Scholar] [CrossRef]
- Bouquet, Emmanuelle. 2009. State-Led Land Reform and Local Institutional Change: Land Titles, Land Markets and Tenure Security in Mexican Communities. World Development 37: 1390–99. [Google Scholar] [CrossRef]
- Brown, Douglas R., Emma C. Stephens, James Okuro Ouma, Festus M. Murithi, and Christopher B. Barrett. 2006. Livelihood strategies in the rural Kenyan highlands. African Journal of Agricultural and Resource Economics 1: 21–36. [Google Scholar]
- Bryden, John, and Charles Geisler. 2007. Community-based land reform: Lessons from Scotland. Land Use Policy 24: 24–34. [Google Scholar] [CrossRef]
- Cernea, Michael M., and Chris McDowell. 2000. Risks and Reconstruction: The Experience of Resettlers and Refugees. Washington: The World Bank. [Google Scholar]
- Das, Dipika, Bishawjit Mallick, and Joachim Vog. 2012. Social Process Analysis in Poverty Alleviation Program: A Study of Khas-Land Distribution in Rural Bangladesh. Journal of Bangladesh Institute of Planners 5: 25–36. [Google Scholar]
- De Sherbinin, Alex, Leah K. VanWey, Kendra McSweeney, Rimjhim Aggarwal, Alisson Barbieri, Sabine Henry, Lori M. Hunter, and Wayne Twine. 2008. Rural Household demographics, livelihoods, and the environment. Global Environmental Change 18: 38–53. [Google Scholar] [CrossRef] [PubMed]
- DFID. 1998. Sustainable Livelihood Framework. Available online: http://atha.se/content/sustainable-livelihoods-framework (accessed on 12 September 2016).
- Ding, Chengri. 2007. Policy and praxis of land acquisition in China. Land Use Policy 24: 1–13. [Google Scholar] [CrossRef]
- Ellis, Frank. 2000. Rural Livelihoods and Diversity in Developing Countries. Oxford: Oxford University Press. [Google Scholar]
- Festinger, Leon. 1957. A Theory of Cognitive Dissonance. Standford: Stanford University Press. [Google Scholar]
- Guchchagram. 2017. Available online: https://www.guchhogram.gov.bd/about-guchcchogram/ (accessed on 15 May 2017).
- Hossain, Monzur. 2015. Improving Land Administration and Management in Bangladesh. Background paper for the Preparation of the Seventh Five Year Plan. Available online: http://www.plancomm.gov.bd/wp-content/uploads/2015/02/4_Improving-Land-Administration-and-Mangement.pdf (accessed on 15 June 2017).
- Household Income and Expenditure Survey 2010, Bangladesh Bureau of Statistics-Minsitry of Planning, World Bank. Available online: http://www.bbs.gov.bd/WebTestApplication/userfiles/Image/LatestReports/HIES-10.pdf (accessed on 12 July 2017).
- Islam, Md Monirul, Susannah Sallu, Klaus Hubacek, and Jouni Paavola. 2013. Migrating to tackle climate variability and change? Insights from coastal fishing communities in Bangladesh. Climatic Change 124: 724–33. [Google Scholar] [CrossRef]
- Jansen, Eirik G. 1983. Rural Bangladesh: Competition for Scarce Resources (p. xiii + 352). Bergen: Chr. Michelsen Institute, DERAP. [Google Scholar]
- Kevane, Michael. 1994. Land tenure and rental in western Sudan. Land Use Policy 14: 295–310. [Google Scholar] [CrossRef]
- Lambini, Cosmas Kombat, and Trung Thanh Nguyen. 2014. A comparative analysis of the effects of institutional property rights on forest livelihoods and forest conditions: Evidence from Ghana and Vietnam. Forest Policy and Economics 38: 178–90. [Google Scholar] [CrossRef]
- LGED. 2012. Digital Map Data, Local Government Engineering Department (LGED) of Bangladesh, Dhaka. Available online: http://www.lged.gov.bd/ViewMap.aspx (accessed on 12 July 2017).
- Maier, Stephanie D., Tabea Beck, Javier Francisco Vallejo, Rafael Horn, Jan-Hendrik Söhlemann, and Trung Thanh Nguyen. 2016. Methodological Approach for the Sustainability Assessment of Development Cooperation Projects for Built Innovations Based on the SDGs and Life Cycle Thinking. Sustainability 8: 1006. [Google Scholar] [CrossRef]
- Mallick, Bishawjit. 2011. Necessity of Acceptance—Searching for a Sustainable Community Based Disaster Mitigation Approach. In Proceedings of the 2011 Solutions to Coastal Disasters Conference. Edited by Louise A. Wallendorf, Chris Jones, Lesley Ewing and Bob Battalio. Anchorage: ASCE & COPRI, pp. 753–66. [Google Scholar]
- Mallick, Bishawjit. 2014. Cyclone Induced Migration in Southwest Coastal Bangladesh. ASIEN 130: 60–81. [Google Scholar]
- Mallick, Bishawjit, and Benjamin Etzold. 2015. Introduction, and State-of-the-Art. In Environment, Migration, and Adaptation-Evidence and Politics of Climate Change in Bangladesh. Edited by Bishawjit Mallick and Benjamin Etzold. Dhaka: AHDPH Publishing House, pp. 1–26. [Google Scholar]
- Mallick, Bishawjit, and Tamanna Siddiqui. 2015. Disaster-Induced Migration and Adaptation Discourse in Bangladesh. In Environmental Change, Adaptation and Migration—Bringing in the Region. Edited by Felicitas Hillmann, Marie Pahl, Birte Rafflenbeul and Harald Sterly. Basingstoke: Palgrave Macmillan, pp. 164–85. Available online: https://link.springer.com/chapter/10.1057%2F9781137538918_9 (accessed on 15 October 2016).
- Mallick, Bishawjit, and Joachim Vogt. 2012. Cyclone, Coastal Livelihood, and Migration—Empirical evidence from Bangladesh. International Development and Planning Review 34: 217–40. [Google Scholar] [CrossRef]
- Mallick, Bishawjit, Khan Rubayet Rahaman, and Joachim Vogt. 2011. Coastal Livelihood and Physical Infrastructure in Bangladesh after Cyclone Aila. Mitigation and Adaptation of Strategies for Global Change 16: 629–48. [Google Scholar] [CrossRef]
- Martin, Maxmillan, Motasim Billah, Tasneem Siddiqui, Richard Black, and Dominic Kniveton. 2017. Climate-influenced migration in Bangladesh: The need for a policy realignment. Development Policy Review. [Google Scholar] [CrossRef]
- Momen, Abdul. 1996. Land Reform and Landless in Bangladesh. Unpublished Ph.D. thesis, University of East London, London, UK. [Google Scholar]
- Narh, Peter, Cosmas Kombat Lambini, Matthew Sabbi, Van Dien Pham, and Trung Thanh Nguyen. 2016. Land Sector Reforms in Ghana, Kenya and Vietnam: A Comparative Analysis of Their Effectiveness. Land 5: 8. [Google Scholar] [CrossRef]
- Nguyen, Trung Thanh, Truong Lam Do, Dorothee Bühler, Rebecca Hartje, and Ulrike Grote. 2015. Rural livelihoods and environmental resource dependence in Cambodia. Ecological Economics 120: 282–95. [Google Scholar] [CrossRef]
- Nguyen, Trung Thanh, Siegfried Bauer, and Ulrike Grote. 2016. Does Land Tenure Security Promote Manure Use by Farm Households in Vietnam? Sustainability 8: 178. [Google Scholar] [CrossRef]
- Niroula, Gajendra S., and Gopal B. Thapa. 2005. Impacts and causes of land fragmentation, and lessons learned from land consolidation in South Asia. Land Use Policy 22: 358–72. [Google Scholar] [CrossRef]
- Oldenburg, Philip. 1990. Land Consolidation As Land-Reform, in India. World Development 18: 183–95. [Google Scholar] [CrossRef]
- Otsuka, Keijiro. 1991. Determinants and consequences of land reform implementation in the Philippines. Journal of Development Economics 35: 339–55. [Google Scholar] [CrossRef]
- Peters, P. E. 2009. Challenges in Land Tenure and Land Reform in Africa: Anthropological Contributions. World Development 37: 1317–25. [Google Scholar] [CrossRef]
- Powelson, John P. 1987. Land tenure and land reform: Past and present. Land Use Policy 4: 111–20. [Google Scholar] [CrossRef]
- Rahman, Sowmen, and Mohammed Ataur Rahman. 2015. Climate extreme and challenges to infrastructure in coastal cities in Bangladesh. Weather and Climate Extreme 7: 96–108. [Google Scholar] [CrossRef]
- Sen, Binayak, and Zulfiqar Ali. 2015. Ending Extreme Poverty in Bangladesh during the Seventh Five Year Plan: Trends, Drivers, and Policies. Background paper for the Preparation of the Seventh Five Year Plan. Available online: http://www.plancomm.gov.bd/wp-content/uploads/2015/02/25_Ending-Extreme-Poverty-in-Bangladesh.pdf (accessed on 15 June 2017).
- Soltani, Arezoo, Arild Angelsen, Tron Eid, Mohammad Saeid Noori Naieni, and Taghi Shamekhi. 2012. Poverty, sustainability, and household livelihood strategies in Zagros, Iran. Ecological Economics 79: 60–70. [Google Scholar] [CrossRef]
- Sultana, Zakia, and Bishawjit Mallick. 2015. Adaptation Strategies after Cyclone in Southwest Coastal Bangladesh–Pro-Poor Policy Choices. American Journal of Rural Development 3: 24–33. [Google Scholar] [CrossRef]
- Thapa, Gopal B., and Gajendra S. Niroula. 2008. Alternative options of land consolidation in the mountains of Nepal: An analysis based on stakeholders’ opinions. Land Use Policy 25: 338–50. [Google Scholar] [CrossRef]
- Toulmin, Camilla. 2009. Securing land and property rights in sub-Saharan Africa: The role of local institutions. Land Use Policy 26: 10–19. [Google Scholar] [CrossRef]
- Upazila Land Office. 2014. Information Booklet on Guchchagram. Gopalgonj Sadar Upazila. Gopalgonj District, Bangladesh. Available online: http://sadar.gopalganj.gov.bd/ (accessed on 12 July 2017).
- USAID. 2010. Property Rights and Resource Governance, Bangladesh. Available online: http://www.usaidlandtenure.net/sites/default/files/country-profiles/full-reports/USAID_Land_Tenure_Bangladesh_Profile.pdf (accessed on 17 June 2016).
- Wannasai, Nareeluck, and Rajendra P. Shrestha. 2008. Role of land tenure security and farm household characteristics on land use change in the Prasae Watershed, Thailand. Land Use Policy 25: 214–24. [Google Scholar] [CrossRef]
| 1 | Khas land means the land owned by government, not by any government department other than under direct control of the Ministry of Land. In practice, the government transforms ‘Khas land’ into public ownership through expropriation or land reclamation. This land should then be redistributed according to socio-economic criteria of poverty alleviation (Jansen 1983; Hossain 2015). |
| 2 | Bangladeshi Taka. |
| 3 | Pucca house means the floor and walls are made of concrete, but the roof can be made of either concrete or tin. |
| 4 | Kutcha house means the floor is made of mud; the walls are made of tin, wood, bamboo, mud, etc.; and the roof is made of tin, straw, etc. |
Figure 1.
Study area. Source: own representation based on LGED 2012 (LGED 2012).
Figure 1.
Study area. Source: own representation based on LGED 2012 (LGED 2012).
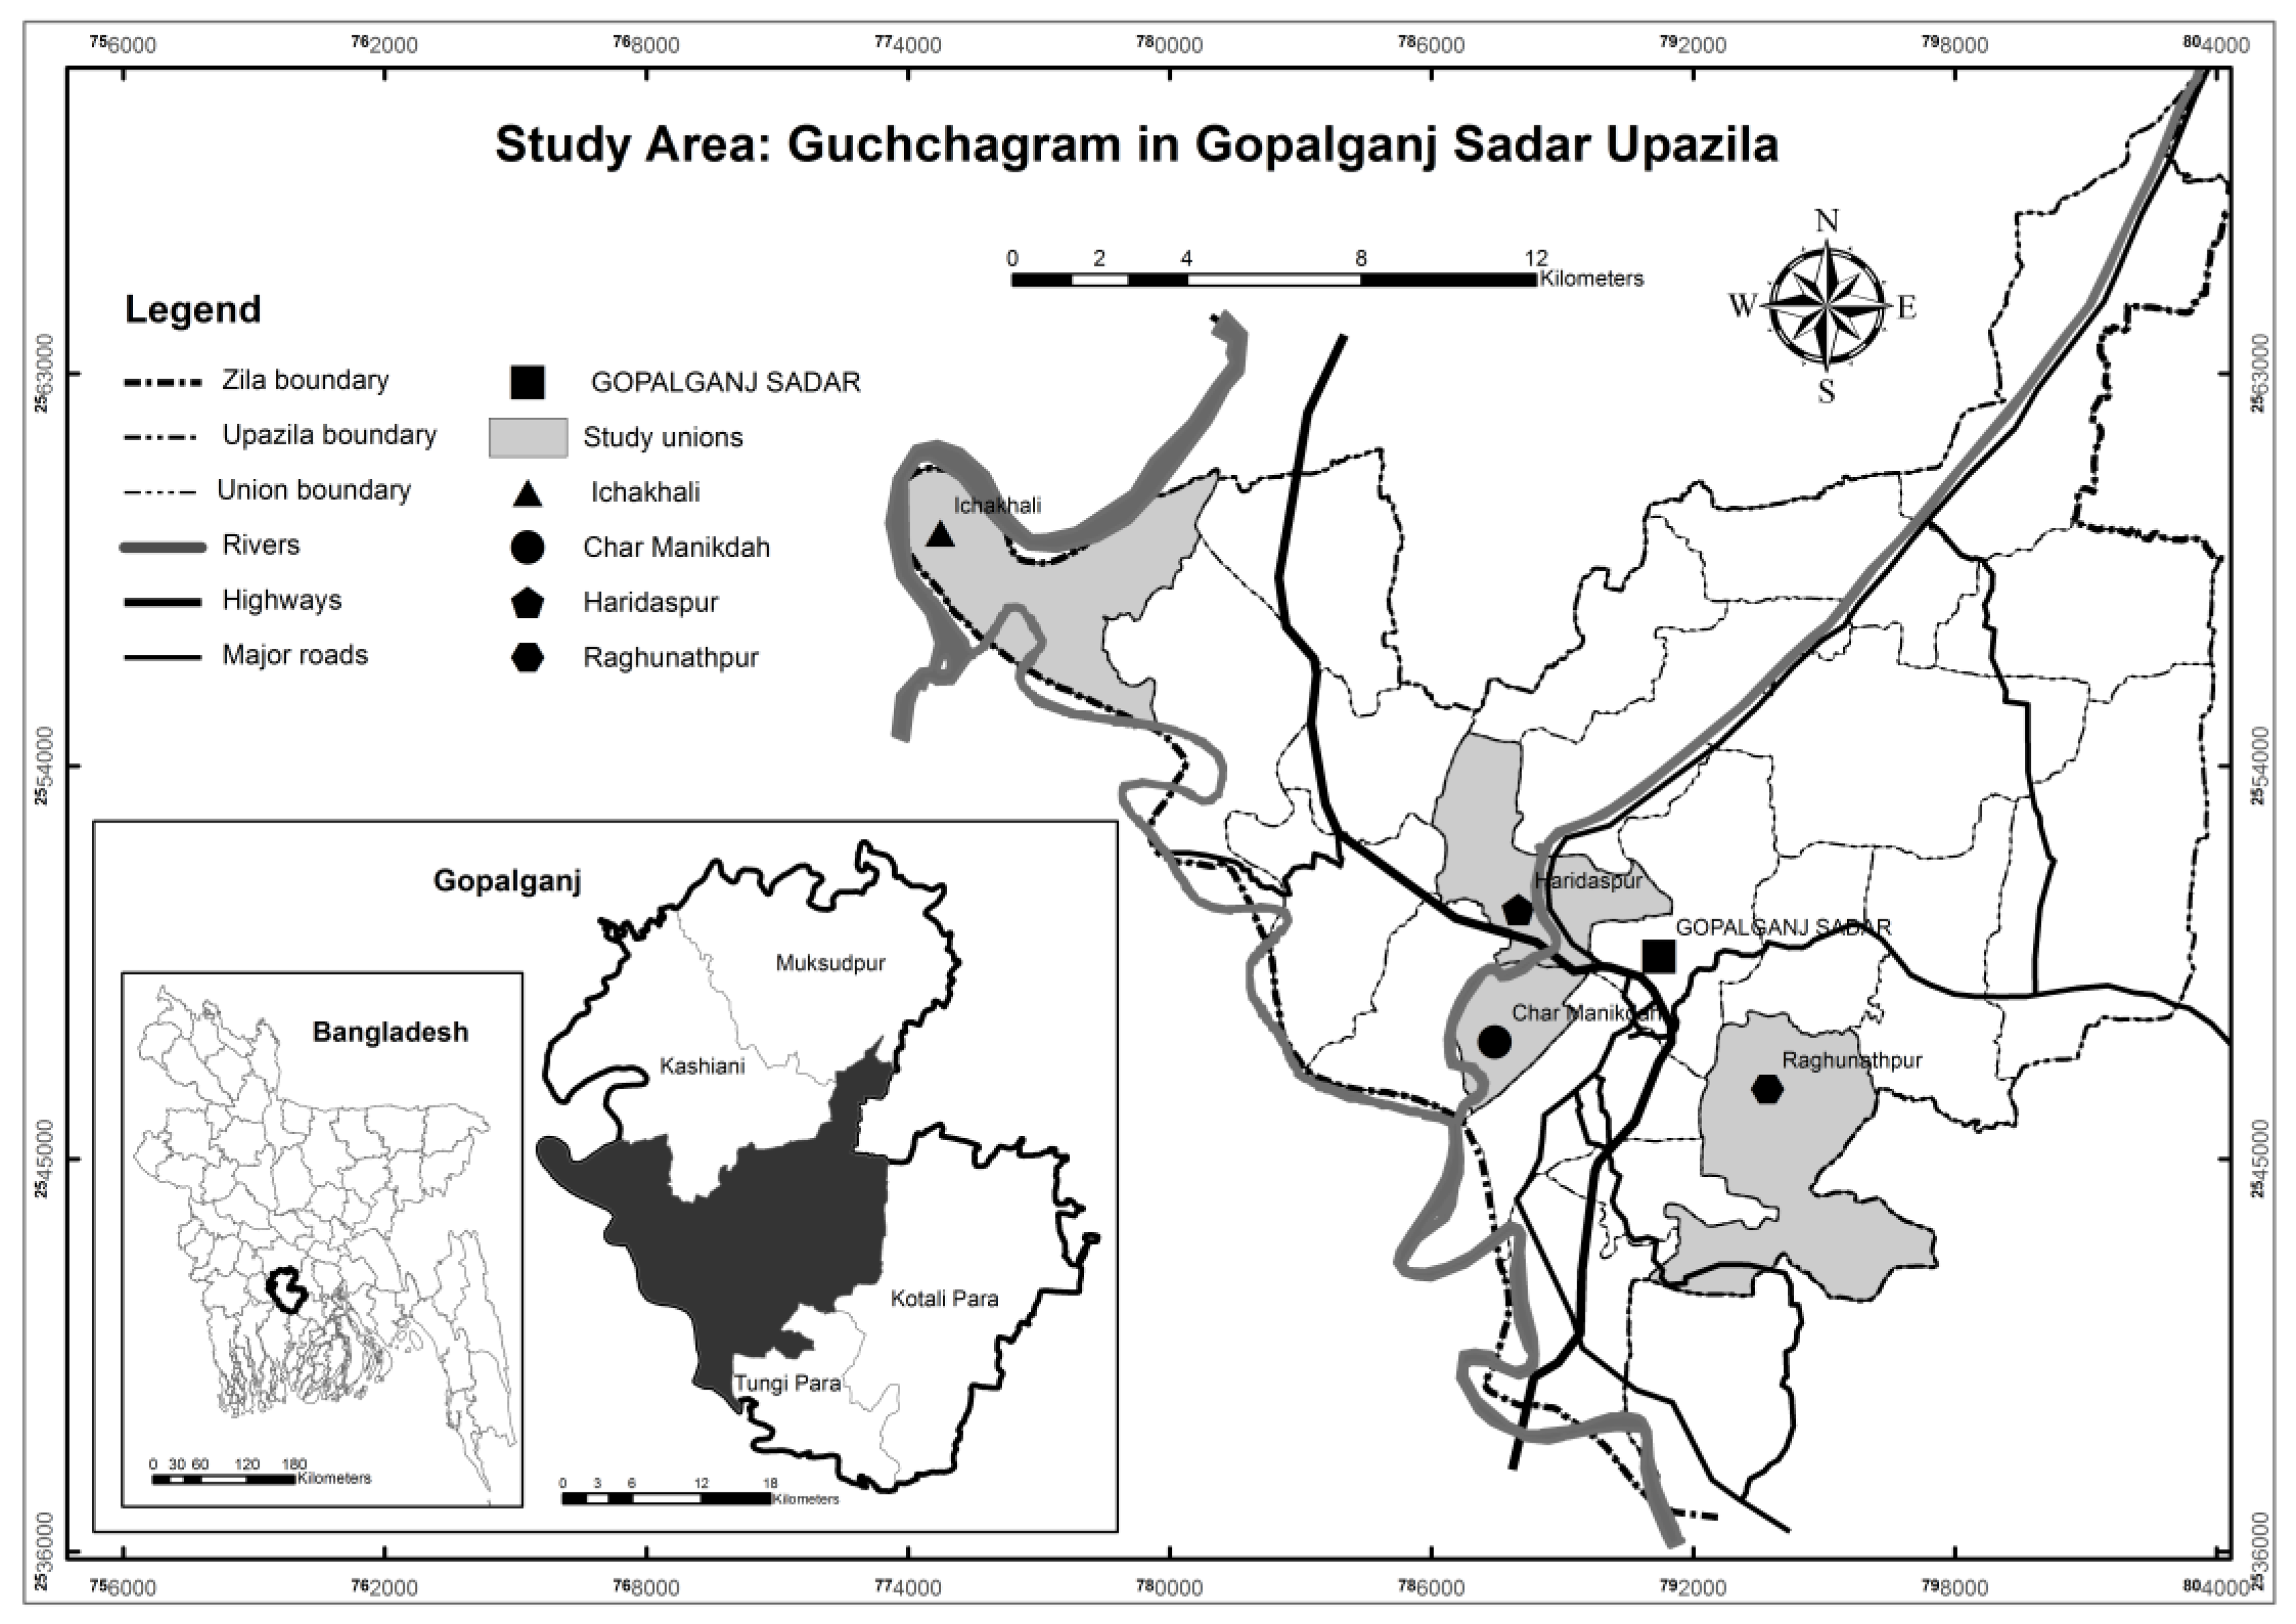
Figure 2.
Causes of relocation according to GG. Source: Field survey 2014.
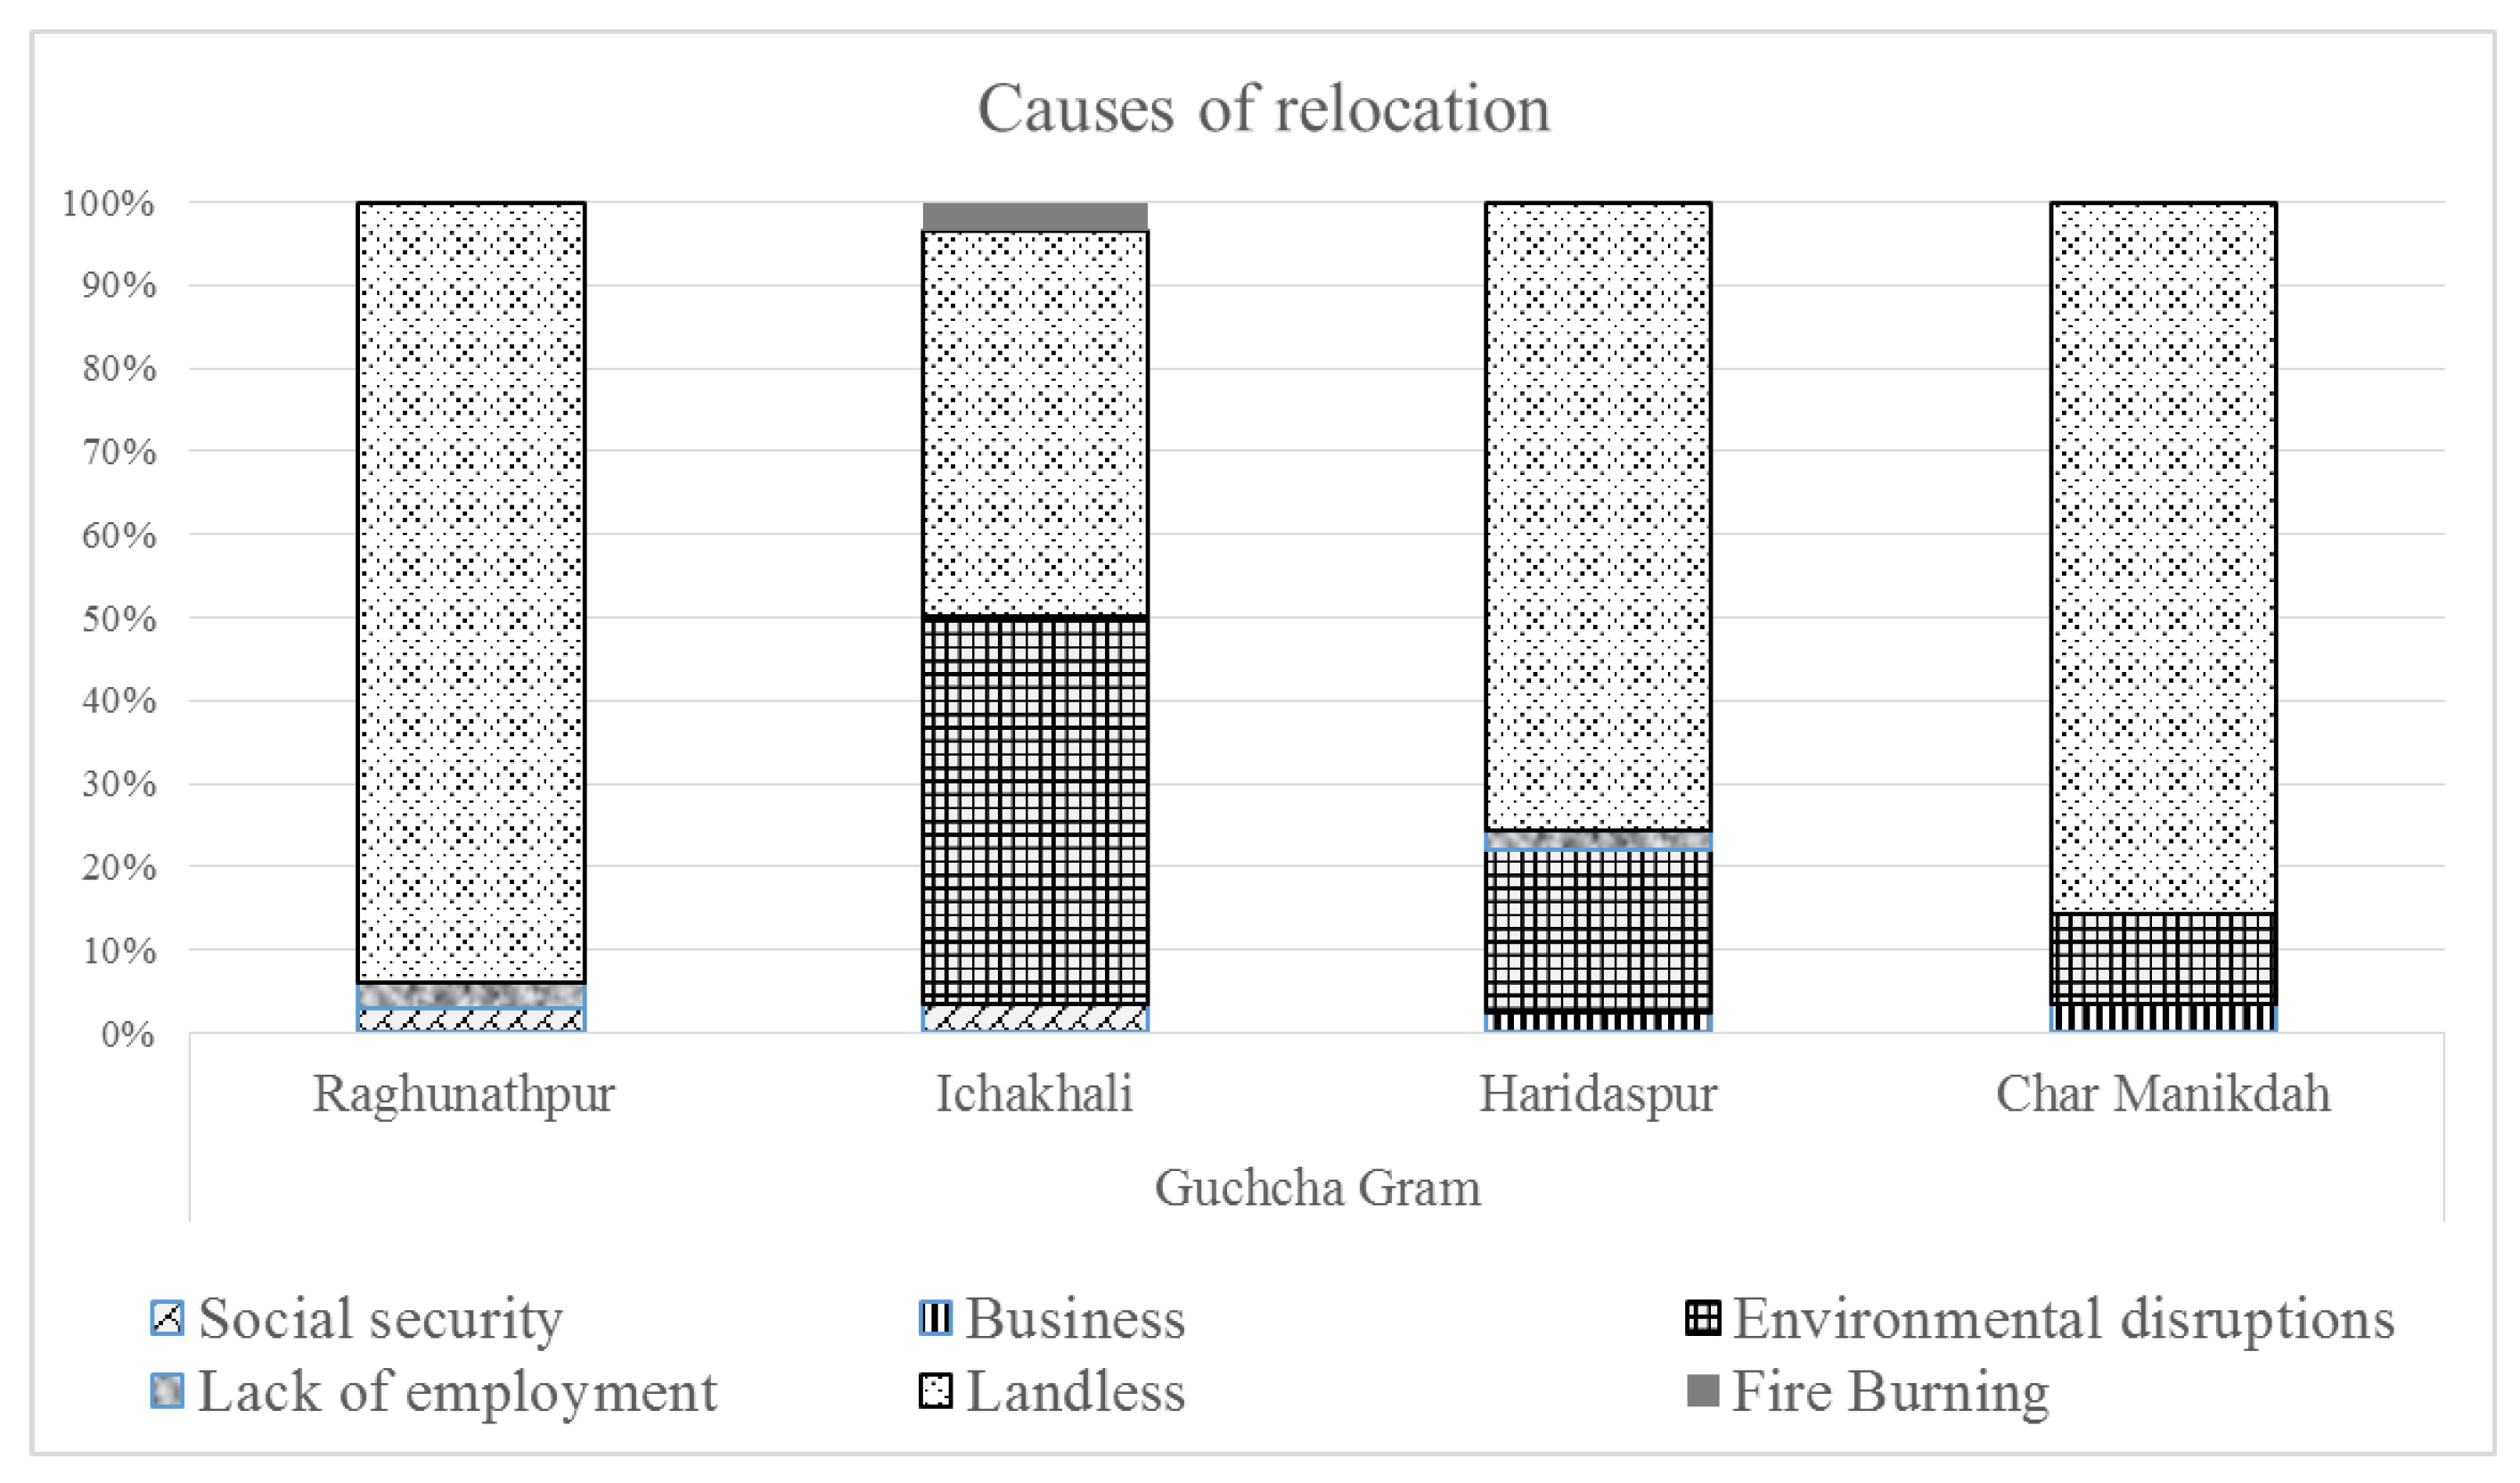
Figure 3.
Changes in monthly food cost; Source: Field survey 2014.

Figure 4.
The livelihood situation after relocation across the GGs; source: field survey 2014.


Table 1.
Different resettlement and rehabilitation projects undertaken by the government since 1971.
Table 1.
Different resettlement and rehabilitation projects undertaken by the government since 1971.
| Name | Starting Year | Total Number of Beneficiaries | Objectives of the Project |
|---|---|---|---|
| Cluster village | 1972 | Data is not available | To rehabilitate people affected by the liberation war and cyclone Bhola of 1970, as well as other landless people on Khas land. |
| Ashrayon | 1997 | 50,000 landless families | To alleviate the poverty of landless and homeless people by providing shelter and by imparting training in skills development for income generation activities. The project also seeks to improve basic education, primary health care, and family planning services. |
| Adarsha Gram | 1998 | 71,032 families | To alleviate poverty through the provision of land and shelter, and the promotion of self-employment opportunities for income generation activities. |
| Abashan | 2001 | 65,000 landless and rootless family | Same as Ashrayon project |
| Guchchagram (Climate Victims Rehabilitation Project-I) | 2009 | 10,706 landless families |
|
| Guchchagram (Climate Victims Rehabilitation Project-II) | 2015 | 50,000 landless | To rehabilitate 50,000 landless families in 2550 GGs by June 2020. |
Source: Guchchagram 2017.
Table 2.
Study area and sample size distribution.
| Guchchagram | Sample Size (Total Household in GG) | Percent of Total Sample |
|---|---|---|
| Raghunathpur | 33 (50) | 25.4 |
| Ichakhali | 28 (40) | 21.5 |
| Haridaspur | 41 (70) | 31.5 |
| Char Manikdah | 28 (40) | 21.5 |
| Total | 130 | 100.0 |
Source: Field survey 2014.
Table 3.
Factors included in indexing livelihood quality.
| Capital/Livelihood Platforms | Indicators/Livelihood Strategies | Description of Weighting |
|---|---|---|
| Natural | Proximity to river | If no, then 1, otherwise −1 |
| Embanked or protected from tidal surges | If yes, then 1, otherwise −1 | |
| Financial | Production of rice | If yes, then 1, otherwise −1 |
| Having a home garden | If yes, then 1, otherwise −1 | |
| Having livestock | If yes, then 1, otherwise −1 | |
| Having poultry | If yes, then 1, otherwise −1 | |
| Ability to store food | If yes, then 1, otherwise −1 | |
| Access to safe water | If yes, then 1, otherwise −1 | |
| The cost of daily food is equal to or lesser than the national average [National average is BDT2 83 = 1.05 US$. Source: Household Income Expenditure Survey 2010 (HIES 2010)] | If yes, then 1, otherwise −1 | |
| Having regular and fixed income (business or job) | If yes, then 1, otherwise −1 | |
| Daily income per capita is equal to or larger than the national average [National average is BDT 85.10 = 1.09 US$; Source: Household Income Expenditure Survey 2010 | If yes, then 1, otherwise −1 | |
| Social | Having relatives or friends help if there is a problem | If yes, then 1, otherwise −1 |
| Receiving credit or making loan to others | If no, then 1, otherwise −0 | |
| Received help from a community leader | If yes, then 1, otherwise −1 | |
| Received help from a political leader | If yes, then 1, otherwise −1 | |
| No conflicts with neighbors | If yes, then 1, otherwise −1 | |
| Human | Age of household head (not dependent, i.e., 25–60 years of old) [Source: UN definition of youth is less than 25 years old, and dependent definition of Bangladesh government is more than 60 years old] | If yes, then 1, otherwise −1 |
| Small family (less than 4 members) | If yes, then 1, otherwise −1 | |
| Household head is male * | If yes, then 1, otherwise −1 | |
| Household head has completed secondary education * | If yes, then 1, otherwise −1 | |
| Physical | Having a Pucca house, i.e., a building | If yes, then 1, otherwise −1 |
| Owning the house | If yes, then 1, otherwise −1 | |
| Per capita floor area ratio is equal to or larger than national average [national average of per capita FAR is 4.97 m2; Source: (Mallick 2014) | If yes,3 then 1, otherwise −1 | |
| Having access to electricity | If yes, then 1, otherwise −1 | |
| Having safe and sanitary latrine facilities | If yes, then 1, otherwise −1 | |
| Having access to telephone or mobile technologies | If yes, then 1, otherwise −1 | |
| Having access to primary health care facility | If yes, then 1, otherwise −1 | |
| Having access to an educational facility | If yes, then 1, otherwise −1 | |
| Having access to solid-waste management | If yes, then 1, otherwise −1 | |
| Having drainage facility | If yes, then 1, otherwise −1 |
Note: * This indicator is the same for both time periods; therefore, it is excluded from the calculation.
Table 4.
Strategies related to food security, before and after relocation.
| Livelihood Strategies | Before Relocation (%) | After Relocation (%) | Chi-Square Test (Х2) | Phi Value | Cramer’s V |
|---|---|---|---|---|---|
| Having the opportunity to produce rice | 29.2 | 19.2 | Х2 = 42.11 * | 0.569 * | 0.569 * |
| Having home gardening | 36.2 | 60.77 | Х2 = 4.134 ** | 0.178 ** | 0.178 ** |
| Having livestock | 43.9 | 28.46 | Х2 =3.501 *** | 0.164 *** | 0.164 *** |
| Having poultry | 66.9 | 59.23 | Х2 = 10.32 * | 0.282 * | 0.282 * |
| Having the capacity to preserve food | 19.2 | 20.77 | Х2 = 35.153 * | 0.520 * | 0.520 * |
| Having easy access to fresh water | 61.5 | 50.77 | Х2 = 1.700 *** | 0.114 *** | 0.114 *** |
Note: * Significant at 1%; ** Significant at 5%; *** Significant at 10%; Source: Field survey 2014.
Table 5.
Income, expenditure, and working hours before and after relocation.
| Paired Sample Variables | Paired Differences | T | df | Sig. (2-Tailed) | ||||
|---|---|---|---|---|---|---|---|---|
| Mean | Std. Deviation | Std. Error Mean | 95% Confidence Interval of the Difference | |||||
| Lower | Upper | |||||||
| Pair-1: Cost of daily food before and after relocation (in BDT) | −9.415 | 80.073 | 7.023 | −23.310 | 4.479 | −1.341 | 129 | 0.182 |
| Pair-2: Working hours per day before and after relocation (in hour) | 0.085 | 2.567 | 0.225 | −0.361 | 0.530 | 0.376 | 129 | 0.708 |
| Pair-3: Monthly income before and after relocation (in BDT) | −0.588.462 | 2951.012 | 258.821 | −1100.545 | −76.378 | −2.274 | 129 | 0.025 |
Source: Field survey 2014.
Table 6.
Housing condition before and after relocation.
| Paired Sample Variables | Paired Differences | t | df | Sig. (2-Tailed) | ||||
|---|---|---|---|---|---|---|---|---|
| Mean | Std. Deviation | Std. Error Mean | 95% Confidence Interval of the Difference | |||||
| Lower | Upper | |||||||
| Pair-4: Number of rooms in the house before and after relocation? | −0.346 | 0.954 | 0.084 | −0.512 | −0.181 | −4.137 | 129 | 0.000 |
| Pair-5: Floor area before relocation and after relocation? (in square meter) | −3.915 | 11.468 | 1.006 | −5.905 | −1.925 | −3.893 | 129 | 0.000 |
| Pair-6: Total house rent before and after relocation, if it was rented (in BDT) | 87.708 | 543.445 | 47.663 | −6.595 | 182.011 | 1.840 | 129 | 0.068 |
Source: Field survey 2014.
Table 7.
Strategies related to social life and security before and after relocation.
| Livelihood Strategies | Before Relocation (%) | After Relocation (%) | Chi-Square Test (Х2) | Phi Value | Cramer’s V |
|---|---|---|---|---|---|
| Having relatives/friends if there is a problem | 67.7 | 60.8 | Х2 = 74.844 * | 0.759 * | 0.759 * |
| Helping friends and relatives with their needs | 66.2 | 67.7 | Х2 = 94.49 * | 0.862 * | 0.862 * |
| Receiving credits and giving loans to friends and relatives | 66.9 | 70.0 | Х2 = 80.82 * | 0.788 * | 0.788 * |
| Lending money to friends and relatives | 70.0 | 67.7 | Х2 = 91.712 * | 0.840 * | 0.840 * |
| Evidence of stealing or thievery | 19.2 | 41.1 | Х2 = 2.650 *** | −0.143 ** | −0.143 ** |
| Neighbor involved in fighting with others | 32.3 | 46.2 | Х2 = 30.23 * | 0.482 * | 0.482 * |
| Having conflict with a neighbor | 33.8 | 41.0 | Х2 = 48.46 * | 0.611 * | 0.611 * |
| Have received help from a political leader | 33.1 | 17.7 | Х2 = 9.751 ** | 0.274 ** | 0.274 ** |
| Have received help from a community leader | 24.6 | 22.3 | Х2 = 148.637 * | 1.069 * | 1.069 * |
Note: * Significant at 1%; ** Significant at 5%; *** Significant at 10%; Source: Field survey 2014.
Table 8.
Strategies related to social life and security before and after relocation.
| Livelihoods Strategies | Before Relocation (%) | After Relocation (%) | Chi-Square Test (Х2) | Phi Value | Cramer’s V |
|---|---|---|---|---|---|
| Having access to electricity | 46.0 | 0 | – | – | – |
| Having safe and sanitary latrine facilities | 82.3 | 98.5 | Х2 = 0.661 **** | 0.071 **** | 0.071 **** |
| Having access to telephone facilities | 26.2 | 53.1 | Х2 = 12.82 * | 0.314 * | 0.314 * |
| Having access to primary health care facilities | 50.8 | 43.8 | Х2 = 28.356 * | 0.467 * | 0.467 * |
| Having access to education facilities | 70.0 | 60.8 | Х2 = 17.591 * | 0.368 * | 0.368 * |
| Having direct access to public transport facilities | 33.1 | 22.3 | Х2 = 36.044 * | 0.527 * | 0.527 * |
Note: * Significant at 1%; **** Not significant; Source: Field survey 2014.
Table 9.
Livelihoods after relocation.
| Changes in Livelihoods Quality | Percent |
|---|---|
| No changes in livelihood conditions after relocation | 20.0 |
| Degraded livelihood condition after relocation | 36.2 |
| Improved livelihood condition after relocation | 43.8 |
| Total | 100.0 |
Table 10.
Problems of the GG reported by respondents.
| Problems | Percent |
|---|---|
| Drinking water crisis | 10.0 |
| Food crisis | 4.6 |
| Lack of employment opportunities | 4.6 |
| Problems with waste management | 0.8 |
| No electricity connection | 51.5 |
| Poor transport system | 13.8 |
| Insufficient health care facilities | 2.3 |
| Lack of religious institute | 3.8 |
| Lack of educational facilities | 6.2 |
| Problems with social conflicts | 1.5 |
| Lack of safety | 0.8 |
| Total | 100.0 |
Source: Field survey 2014.
© 2017 by the authors. Licensee MDPI, Basel, Switzerland. This article is an open access article distributed under the terms and conditions of the Creative Commons Attribution (CC BY) license (http://creativecommons.org/licenses/by/4.0/).
Share and Cite
MDPI and ACS Style
Mallick, B.; Sultana, Z. Livelihood after Relocation—Evidences of Guchchagram Project in Bangladesh. Soc. Sci. 2017, 6, 76. https://doi.org/10.3390/socsci6030076
AMA Style
Mallick B, Sultana Z. Livelihood after Relocation—Evidences of Guchchagram Project in Bangladesh. Social Sciences. 2017; 6(3):76. https://doi.org/10.3390/socsci6030076
Chicago/Turabian StyleMallick, Bishawjit, and Zakia Sultana. 2017. "Livelihood after Relocation—Evidences of Guchchagram Project in Bangladesh" Social Sciences 6, no. 3: 76. https://doi.org/10.3390/socsci6030076
Note that from the first issue of 2016, this journal uses article numbers instead of page numbers. See further details here.