
The Strategies, Complexities, and Realities of Zero Prison Population Growth

Department of Sociology, Vanderbilt University, Nashville, 37235 TN, USA
Soc. Sci. 2017, 6(2), 60; https://doi.org/10.3390/socsci6020060
Submission received: 6 February 2017
/
Revised: 30 May 2017
/
Accepted: 5 June 2017
/
Published: 8 June 2017
(This article belongs to the Special Issue The Demography of Crime, Mass Incarceration, and Population Regulation)
Abstract
:Although there is general consensus that growth in the prison population should be reversed, there is little agreement on how to achieve this goal. In this paper, I apply classic demographic methods to answer questions that assess the strategies, complexities, and realities of routes to zero and negative prison population growth. Modified admissions policies have had the greatest impact on halting growth, whereas decreasing the length of sentences has had only a modest, short-term influence on the prison population size. As state and federal policy-makers consider reducing sentences for selective classes of nonviolent offenders, it is important that they have a holistic understanding of the implications of such policies. Traditionally, this type of modification has been coupled with more punitive policies for violent offenders, a pattern that reinforces the appearance of having “tough on crime” policies. Model estimates show that such strategies countervail the overall goal of decreasing the size of the prison population. Regardless of underlying reasons to halt growth of the prison populations, integration of the formal demography enable a means to assess the short- and long-term consequences of current and future policy.
1. Introduction
Incarceration has been the primary mode of punishment used in the United States. Yet since the 2008 economic crisis, the conversation has shifted to decreasing the size of the U.S. prison population via legislation. Ironically, both political parties had a hand in creating this state of mass incarceration. Both parties pushed policies to get “tough on crime” and wage the “War on Drugs”; beginning with Lyndon Johnson, each president has made crime a campaign issue, one they promised to tackle. A major shift is at last occurring, and there is widespread agreement that there is a need for change. While Democrats and Republicans agree that something must change, their stances differ, and the most effective way(s) to address the problems associated with mass incarceration remain unclear. As stated in the New York Times:
While one party argues to eliminate incarceration for some crimes and replace it with fines, warnings, drug treatment, etc., the other argues for more effective rehabilitation programs inside the prison walls, such as opportunities for inmates to advance their education. In this paper, I argue: (1) a methodological examination of punishment informed by population dynamics is necessary to understand how and why the U.S. leads the world in the size of its prison population, which will help illuminate the complexity of the punishment problem; (2) formal demography provides unique tools to evaluate the costs and effectiveness of policies proposed or in current use to slow, stop, and lower the size of the prison population.The debate over how to reverse this [problem] breaks down among those who favor broad changes to sentences, including the reduction of mandatory minimum sentences, those who want to address early release and services behind bars, and those who favor a blended approach.
1.1. The Case for Demography
Since the 2008 economic crisis, there has been a growing bipartisan trend to look for ways to decrease the size of the U.S. prison population without sacrificing the quality of criminal justice. The current overpopulation of the nation’s prisons and jails is forcing states to seek ways to slow, stop, or reduce the number of people behind bars. Generally, there are four fronts for categorizing current efforts to reduce the U.S. prison population (Porter 2015). First, many states have focused on sentencing reforms, often through the reclassification of offenses from a felony to a misdemeanor for some nonviolent crimes. Second, some states reroute those found guilty of low-level offenses from prison to rehabilitation programs, probation, community service, or some other alternative to incarceration. A third option has been to decriminalize certain offenses, rendering the associated punishments to fines. Finally, some efforts have gone towards addressing the consequences of having a criminal record in the hopes of reducing rates of recidivism such as “ban the box” efforts in some cities, which make it illegal for employers to ask about criminal records on job applications. Each of these four approaches are more or less time-bound with different consequences for the size, composition, and overall cost of imprisonment. We can think of them in terms of their focus: sentencing, alternatives to incarceration, decriminalization, and reducing reentry. However, if the goal is to reduce the U.S. prison population in the long-run, it means moving beyond study of the web of social problems created by current practices (Braman 2004; Bushway 2004; Patterson 2013; Patterson and Wildeman 2015; Travis et al. 2014; Visher and Travis 2003; Western 2002). It requires making population informed policies and legislation that integrate the complex population dynamics that characterize prison populations.
Demography, which is the study of how and why populations change, provides tools and techniques to assist in formulating viable plans. For example, a similar question has circulated for centuries regarding the world’s exploding population. Population changes are brought about by births, deaths, and migration. While changes in a population’s mortality tend to take time, women can control their fertility and decide what number of children they bear. China is one example where knowledge of how populations grow helped to stabilize the size of the population. In the mid-twentieth century, rapid population growth occurred in China because the death rate declined while fertility rates remained the same, which resulted in a 60 percent population increase in just 20 years (Hesketh et al. 2005). In 1979, China’s State Family Planning Bureau used demographic techniques including population projections and momentum to retard the population growth. Other nations have turned to demography to address other population issues. For instance, many West European countries have encouraged immigration from their former colonies to offset negative population growth (Lutz and Scherbov 2002).
As of 2015, the U.S. had the world’s highest number of people incarcerated (International Centre for Prison Studies 2017). Just as demography has shed light on country-level population dynamics, it also can offer insights into how various policies affect prison populations. In this paper, I explore the routes states could follow to reduce the United States’ massive prison population and rates of incarceration. Employing demography to advance understanding of the growth and decline of the country’s prison population adds a meaningful dimension to the assessment and implementation of policies. Using admission and release data from the Bureau of Justice Statistics, I apply two classic demographic questions to the prison population: Given a set of policies, how long will it take to reach zero population growth? What strategies will provide the shortest route to zero or negative growth?
1.2. Strategies to Zero Prison Population Growth
The demography literature establishes that even if a population holds its mortality schedule constant (age-specific death rates), altering the fertility schedule (age-specific fertility rates) will have a significant impact on the future size of the population (Demeny 1988; Pritchett 1994). Analogously, adjusting prison entrance rates should have an effect on the size of the prison population, yet few studies have incorporated knowledge about both entrance and exit dynamics. (Austin and Krisberg 1985) utilized national data to show that despite the projected national trend of the prison population leveling out, the population would continue to rise, due to momentum. Their paper established three options to curb the predicted growth in the prison population: change the entrance schedule (number of admissions each year), change the release schedule, or expand prison capacity. Their analyses suggested that policy reforms at that time were encouraging growth in the prison population, thereby making the third option, prison expansion, inevitable. Using Minnesota as an example, Knapp and Anderson (1981) proposed a similar use of simulations to determine the impact of policies, which resulted in similar conclusions.
These previous works have certainly been instrumental in developing a dialogue around how to address the growth of the U.S. prison population. Scholars and policymakers have continued the conversation, which has surfaced a series of questions: How should we model the prison population? What is the relationship between incarceration and sentencing policies? How do we create effective policies that do not compromise public safety? What is the route to zero (or negative) prison population growth?
Recent work has focused on the causes of massive growth in the U.S. prison population and proposed ways to deal with the issue. However, some make recommendations based on policies of the past, which may fall short due to changes in the overall context of the U.S. (Austin 2010) reminds us that we were once a nation with a rather stable rate of crime and incarceration. In fact, the current crime rate is approximately the same as it was in 1969, when the prison population experienced its last decline (Travis et al. 2014). Austin proposes returning to the sentencing regime that was in place at that turning point. Taking a historical view, other things going on at that time—for example, the civil rights movement and its opposition to Jim Crow laws—might lead one to think that today’s incarceration rates should be even lower. Returning to the earlier sentencing regime is a reasonable goal, but, navigating the path to reach that goal might be difficult. Tonry (2014) provided a ten-step blueprint for moving beyond our current state of mass incarceration. Each step involves amending or ending policies related to sentencing practices that some argue have led us to the current situation. This could be part of the solution, but other studies show that we cannot move past mass incarceration if our main punitive instrument is incarceration.
Other work has established that prison admissions matter (Pfaff 2008; Pfaff 2011; Raphael 2009) and, along with current policy initiatives, stresses the need for change in both admissions and sentencing policies. Similarly, this paper considers changes that impact admissions and/or exits via sentencing, but also provides a nuanced understanding of how long it takes to see changes in the prison population after implementation and the monetary costs associated with the change. Most importantly, in this paper I demonstrate the power cohort-component population projections bring to thinking through and understanding the impact of policy changes. A strength of this method is that it integrates knowledge of past and current policies and the resulting population structure of such policies. This enables one to not only ascertain if new policies will meet the goals of slowing or decreasing the prison population, but it also distinguishes how long the momentum of past policies will influence the growth. Finally, most current initiatives focus on the non-violent inmate population; however inmates sentenced for violent crimes must be considered even if the policies focus only on some non-violent offenses. Therefore, I demonstrate how demographic tools integrate this critical information to create population informed approaches to the path of zero, or even negative, growth in the prison population.
1.3. Examples of Recent Policy Reforms
Before describing the modeling procedures I used in this paper, it makes sense to provide more detail about some of the recent reforms states have proposed and/or implemented to address the size and growth of their prison populations. I specifically turn to a report published by The Sentencing Project, “The State of Sentencing 2014: Developments in Policy and Practice,” which provides timely examples (Porter 2015). Most reforms affecting adults can be grouped into four categories:
- (1)
- Reducing the length of sentence and/or reclassification (from felony to misdemeanor) for some nonviolent crimes. Many states have made changes to sentencing practices. Six offenses were reclassified in California, including shoplifting, from a felony to a misdemeanor. Other states, including New Hampshire and Tennessee, now offer additional opportunities for inmates to reduce the time served for certain offenses.
- (2)
- Rerouting people who commit low-level offenses and/or violate their probation or parole from prison to rehabilitation, probation, community service, or other alternatives to incarceration. In Missouri, for example, people who commit misdemeanors classified at the lowest level are no longer subject to incarceration.
- (3)
- Decriminalizing certain offenses. For example, Alaska and Oregon have decriminalized the possession of some quantity of marijuana for recreational purposes. In Maryland and the District of Columbia, the penalty for possessing a limited amount of marijuana has been reduced to a fine.
- (4)
- Addressing the consequences of having a criminal record, such as ineligibility for some types of financial aid and/or government assistance, difficulty finding legitimate employment, and difficulty finding appropriate housing. Several states—Delaware, Illinois, Nebraska, and New Jersey—and the District of Columbia have implemented “ban the box” policies to help end employment discrimination against people with a criminal record. In 2014, California and Missouri made great strides toward successful reintegration by removing restrictions on former inmates with a drug felony record, thus enabling them to receive financial aid and public assistance.
Each of these four broad approaches has different short- and long-term implications for the size, composition, and cost of the nation’s prison population. Based on the population and the policy literature reviewed above, the strategies with the most promise are those that include policies that reduce the number of new admissions and/or recidivism. Each strategy above tackles at least one of the fronts except the first strategy, which focuses on reducing the sentence length. In the next section, I describe the demographic tools necessary to assess the potential benefits and deficiencies of each of the strategies.
2. Data and Methodology
The prison population, like any population, can grow, decline, or remain the same size. A population that is growing or declining at a constant rate, r, is known as a stable population. When r = 0, it is a special case of the stable population, known as the stationary population. A stationary population meets three conditions: (1) it has a growth rate of zero; (2) it has the same number of yearly admissions and releases; (3) the rate of net migration is zero. Such characteristics occur when the same admissions rates and release rates have been in place for a sufficient amount of time. Because it takes time for the momentum of past policies to no longer influence the characteristics of the total population, implementation of policies that keep the yearly admissions the same and adhere to the same release schedule do not typically yield a stationary population immediately. For example, we can put into practice a set of policies such that all new admissions adhere to conditions that characterize a stationary population. However, the size of the current prison population is the result of years of admissions under a variety of policies. Thus, the total prison population is a combination of the current and past regimes. Until the inmates from the former regime exit, they will influence the underlying structure and release schedule of the prison population.
2.1. Data
In this paper, I utilized national-level data from 2004 to demonstrate the capacity for states and agencies to make informed sentencing decisions. Although a notable amount of time has passed since 2004, the timing of the data used in this paper is not relevant to its purpose—i.e., to show the short- and long-term consequences of policy reforms—or to the results. Correctional data from any time in the era of mass incarceration can be used to demonstrate the challenges and possibilities of different policies. Estimates from this data reflect a time when the incarceration population had not yet peaked; in comparison to current trends, the resulting simulations should roughly mirror changes for persons incarcerated for non-violent offenses and are conservative of the changes for persons incarcerated for violent offenses. Further, this year is prior to the economic crisis that prompted discussions and legislation with the goal of lowering the prison population.
Several steps were needed to move from the raw data to determine the short- and long-term consequences of policy changes. The first step was to calculate the 2004 duration-specific release rates, where the numerator was the number of releases and the denominator an estimate of person-years lived (or rather prison-years lived), for a duration category. The numerator for each duration-specific release rate came from National Corrections Reporting Program (NCRP) release files, which provide comprehensive records of releases from state correctional facilities for 2004 that include information such as age, sex, education, race, state, ethnicity, length of stay, and the offense that led to incarceration. These data are not comprehensive at the national level, as they are limited to the states that choose to report in any given year. For this analysis, I used data from 33 states that reported release information during the 2004 calendar year.1
The denominator of the duration-specific release rates required an estimate of prison years lived for each duration category; here, the mid-year population in 2004 was used as the estimate of prison years lived. I initially chose this year because it is the year of the last Survey of Inmates in State Correctional Facilities, which was the only way to estimate the denominator for the duration-specific release rates until recently. However, beginning with the 2005 data, the NCRP added a file that provides year-end counts of the correctional populations by state. Combining the year-end counts with the admissions and release files allowed an estimate to be made of the mid-year population for 2004 by duration, thereby allowing the computation of the duration-specific release rates. Although the data available eliminated the use of Survey of Inmates in State Correctional Facilities, performing this analysis using the year 2004 still provides the same insights because it represents the era of mass incarceration, and the majority of states had not experienced a decline in their prison population.
2.2. The Cohort Component Method and Simulating the Impact of Policies
I used the cohort-component method to determine the implications of policies on the future prison population (for more details, see (Preston et al. 2001)). This approach uses a discrete-time model and incorporates the current duration distribution and release schedule of the prison population in its projections (i.e., the influence of the past sentencing regimes). The projections are calculated at the duration level to incorporate the difference in the rates of release from prison by duration. This piece is important because the release rates are not uniform. Rather, the release rates are high initially. The release rates decline as the duration of stay increases because longer stays indicate the commission of more serious crimes, which are typically accompanied by harsher sentencing. For the prison population, an interval length of six months was sufficient to incorporate differences in release rates from prison by duration of stay. In sum, use of the cohort component projection allows integration of the underlying structure of the prison population and the release schedule. In addition, this method enables one the ability to impose changes to the future growth in admissions and release schedules without ignoring the past and current underlying structure of the prison population.
The simulation of changes resulting from policy involved several parameters: the number of annual admissions, the growth rate of admissions, the duration-specific release rates, and current prison population disaggregated by duration. Data from the Bureau of Justice Statistics that pertain to state-specific admissions allowed calculation of the admissions growth rate, where nine years of data were used to provide a reliable estimate. In addition to knowledge of the current conditions, I used hypothetical parameters to reflect some of the current strategies for slowing and lowering the size of the prison population. The cohort component projections provided a comparison between the volume of the prison population if conditions remained the same and the if there was an immediate change in the sentencing, number of admissions, and/or growth rate of admissions that lasted for fifty years. Thus, the projected population combines the sentencing regimes of the past and the population produced by the new policies to depict the influence of newly imposed conditions. Below I provide the main steps necessary to produce the needed output (for more information on this method, please see (Preston et al. 2001).
2.3. Input Variables
Current Population. This is the current population of the correctional population stratified by type of crime (violent vs. non-violent) and organized by the duration of time served for current stay. The length of the interval for each duration category is six months. For example, the first interval is zero to five months (where five months is considered the time up to the beginning of the sixth month), the second is 6 to 11 months, and so forth.
Current Duration-Specific Release Rates. The current duration-specific release rates requires partitioning the releases and current population by violent vs. non-violent. The number of releases in each duration category forms the numerator of the duration-specific release rate and excludes releases categorized as deaths, escapes, and transfers. The denominator makes use of the midyear population partitioned by type of offense and the appropriate duration category. The current duration-specific release rates are the quotients of the duration-specific releases and duration-specific mid-year population.
Current Growth Rate. The instantaneous growth rate, r, can be expressed as:
Through a series of equations, we can derive the following as an expression of the mean annualized growth rate:
In other words, the mean annualized growth rate used was the natural log of the quotient of the number of admissions in 2009 and the number of admissions in 2000 divided by the length of the interval, which was nine years. In the middle of the nine-year period is the point of interest in this analysis to capture an overall steady rate.
Only three states exhibited negative growth rates during the nine year period: New Jersey, New York, and Kansas between 2000 and 2009 (based on authors calculations of data from Bureau of Justice Statistics). All other states experienced positive growth rates, with growth rates as high as 0.06 (West Virginia), accompanied by a standard error of 0.027. Rhode Island had the highest level of standard error at 0.263, and a growth rate of 0.033. The range of growth rates and standard errors indicate the erratic nature of prison growth and reflect variations in state policies.
Changes. The last input variables allow changes to the growth rate in admissions, the initial number of admissions for the projections, and the sentencing via changes in the duration-specific release rates. The changes stay in place for 50 years.
2.4. Cohort-Component Mechanics
To determine the short and long term consequences of changes, at least two population processes had to occur. The current population continued to be subjected to the duration-specific release rates, and the incoming populations were subjected to the parameters detailed above. The summing of the two populations provided the total population. For most of the scenarios, changes were made to people committing non-violent offenses. To advance the populations, several calculations were necessary. The most important calculation was the survival ratio, based on the nLx column of the life table. Here, the subscript n indicates the length of the interval and the subscript, x, indicates the starting duration of the interval. Thus, we could change this to more accurately reflect the partitioning of the prison population by changing the n to a six. In the human population, this column tells us the total number of years contributed by people the age category depicted by the subscripts. The summation of this column divided by the radix of the life table (the number of people in the synthetic cohort) provides us life expectancy at birth, or the average number of years a newborn could expect to live if he/she was subjected to the current mortality schedule. In the prison population, the analogous measure to life expectancy is the mean length of stay.
The survivor ratio is the ratio of people who survive from one duration category to the next. The survivor ratio can be expressed, 6Lx/6Lx-6. Projecting the population forward, then, is simply the product of the population in duration x-6 and the survivorship ratio. The calculation is slightly different for the first duration interval, zero to five. Here, we utilize the number of admissions, b, (which can change yearly by some growth rate) and 6L0. The population size for that category can be expressed as b*(6L0/(0.5*l0)), where, l0, is the radix of the life table. Thus, for each of the simulations, there is an underlying assumption of a fixed growth rate in admissions and release schedule. Further, the release schedule of the current population remains in place for the population already imprisoned. Only new admissions are subjected to the changes. It would be relatively easy to insert variance into the growth rate in admissions and/or the change in the release schedule. However, this was not done for the sake of ease in understanding the short and long-term changes to the overall prison population by potential alterations to criminal policy.
2.5. Estimating the Costs of Zero Prison Population Growth
In this paper, I made use of other formal demographic concepts, primarily prison years lived, to estimate the costs of each of the policies explored. Most of the strategies required some time for zero prison population growth to occur. I estimated the costs once zero growth occurred, which is simply taking the total population at zero growth and multiplying it by the costs for each inmate. I also estimated the costs from the implementation of the policy through zero growth. Here is where the concept of prison years lived is especially helpful. The size of the prison population changes over time. Between two points in time, there are people who enter, people who leave, and people who are there the entire time. The estimation of prison-years lived allows one to take the entries and exits into account, such that people who enter or leave prison half-way through the year only contribute to the costs for half of that year (and any additional time from prior years). The product of the cost per year to house a person in a state correctional facility and the person-years lived in prison yielded the total cost of each intervention from implementation through zero population growth. The costs of the different policy interventions were compared to the cost if all parameters remained the same.
3. Results
3.1. Modeling Changes for Individuals Incarcerated for Nonviolent Offenses
Most policy initiatives directed at changing the prison population have focused on people found guilty of nonviolent offenses. The actions taken range from diversion programs to changes in sentencing structure. I demonstrate the implications of each of the four policy shifts discussed above and model how they affect the overall prison size over time. In other words, I model what one might expect to see, given the approaches laid out in the prior section. Let us first consider four possible changes in sentencing the nonviolent inmate population:
- (1)
- Examine the impact of lowering the average sentence by 20%. This translates into changing the length of sentence for people who commit nonviolent crimes.
- (2)
- Examine what happens if zero growth in admissions is achieved. This means admissions would be the same from year to year. Policy changes such as using alternatives to incarceration for some offenses might lead to this result. For example, if the year to year variation in admissions resulted from drug offenses, rerouting this group to drug courts where the penalties consisted of probation and/or some type of rehabilitation and life skills workshops would make the number of admissions to prison stationary year to year.
- (3)
- Implement an immediate 25% decrease in admissions and then hold that level constant. One way to achieve this is to decriminalize the possession/use of marijuana, within reason, and to provide alternatives to incarceration for some other nonviolent offenses.
- (4)
- Observe the results of a constant yearly decline in admissions. This could be achieved by reducing the barriers to former inmates’ reintegration into society. Many argue that these barriers are responsible for the high recidivism in the U.S. The prior section provided examples of how states are trying to ameliorate the impact of having a criminal record.
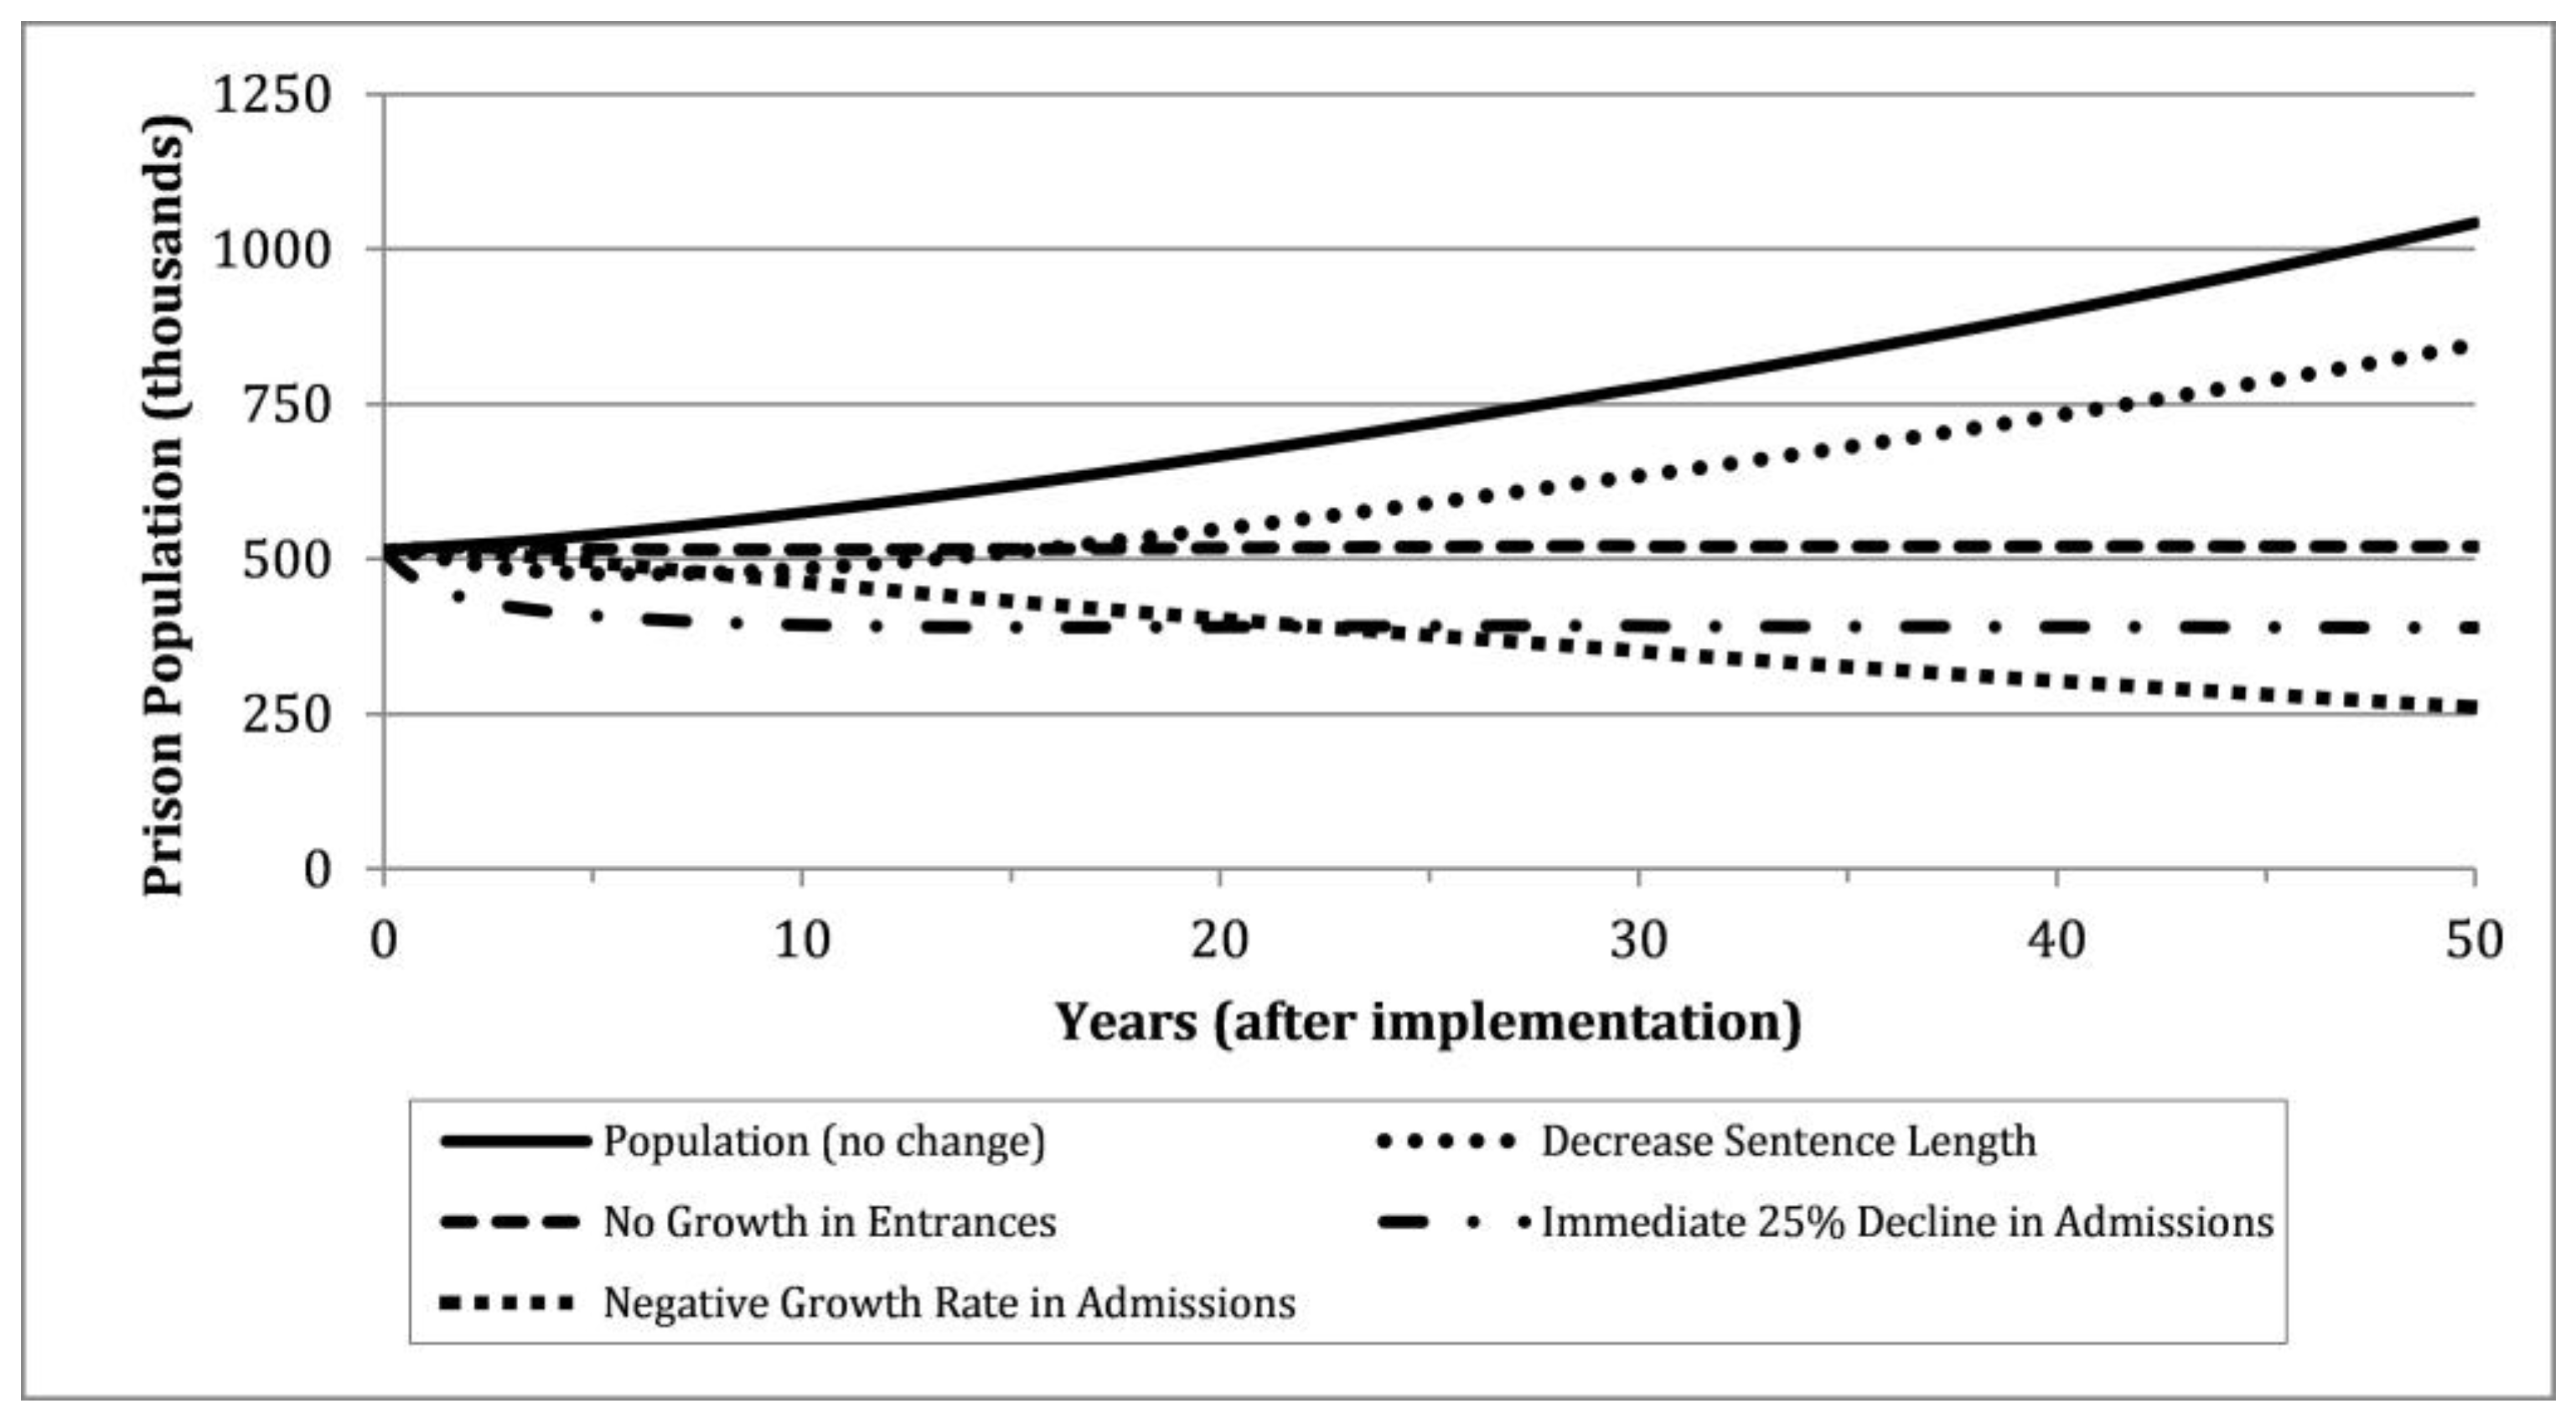
Figure 1 displays the size of the nonviolent population that results from implementing the four changes delimited above. The graph shows each of these changes, as well as what happens when the current regime remains constant, which is represented by the solid black line. The line with the circle-dash pattern represents the change resulting from reducing the length of sentences; it shows an initial decline, soon followed by growth. The policies with some promise are those that make changes in admissions policies. The line made of dashes shows what happens when there is zero growth in admissions. The line with the dash-dot sequence shows what happens when there is an immediate decline in admissions, followed by no growth in admissions. The last line, the square-dash pattern, shows a constant rate of decline in admissions.
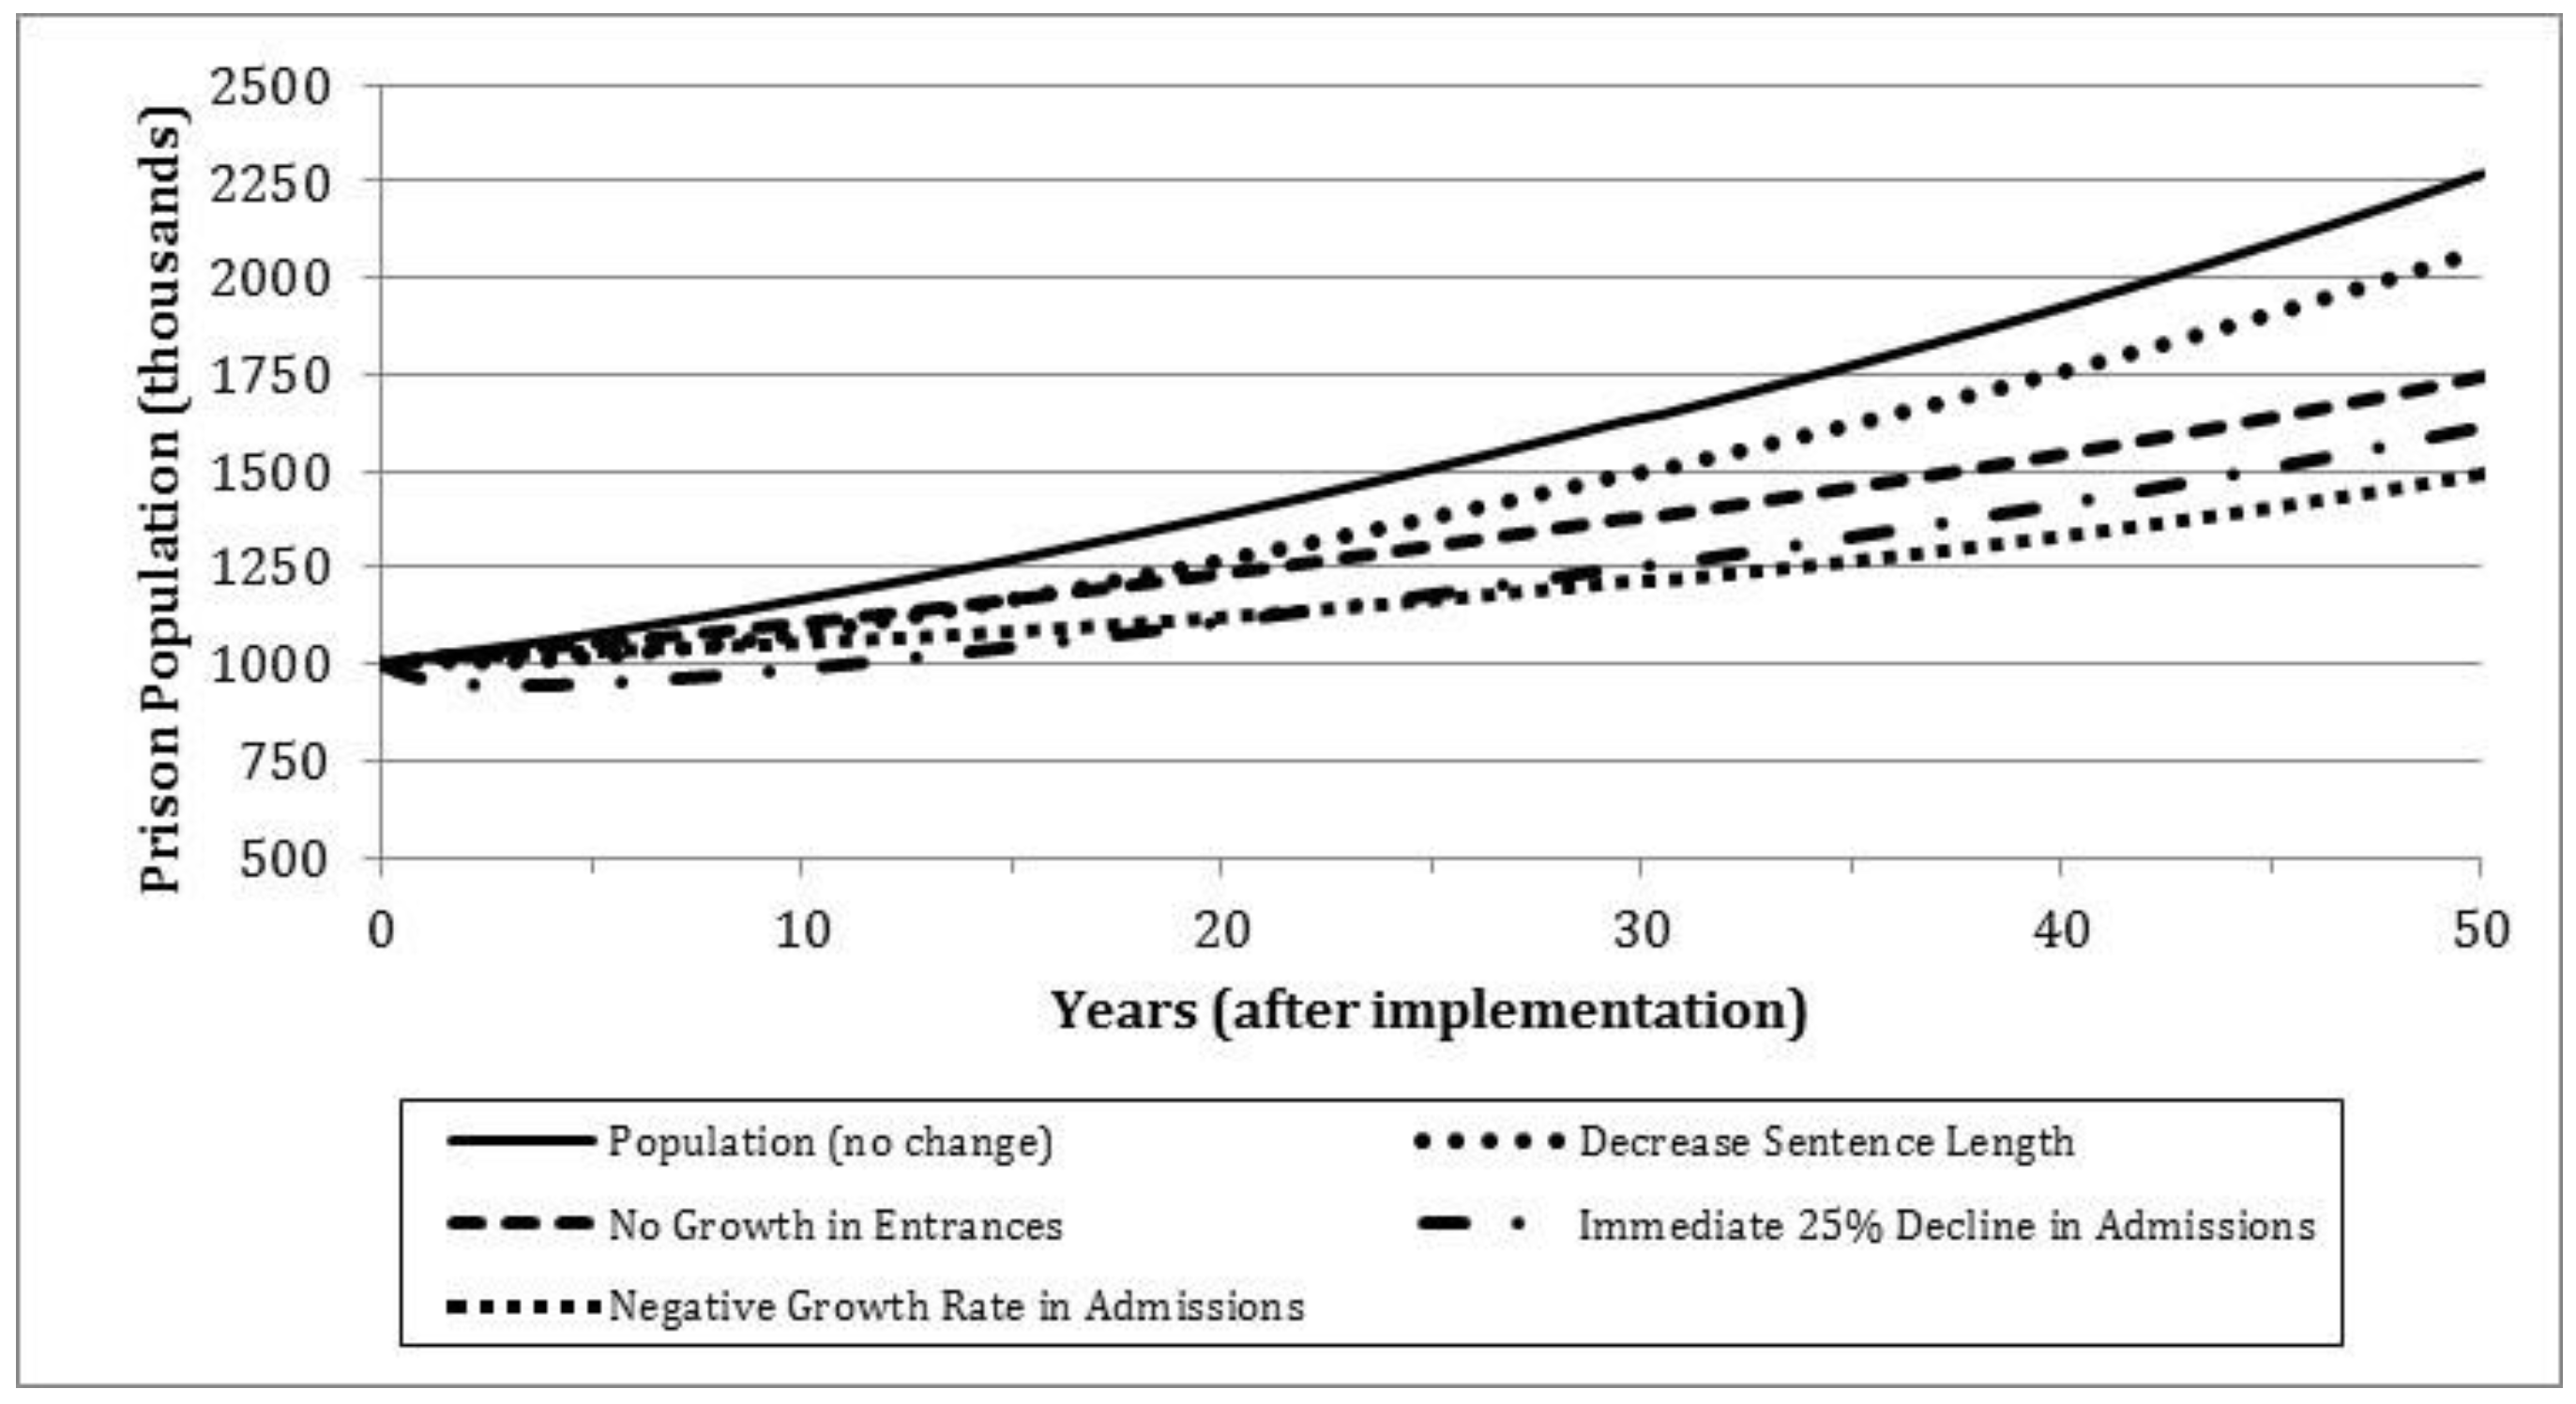
We also must also consider people incarcerated for violent offenses. Figure 2 shows what happens when people who are in correctional facilities because of violent crimes are included. Given that we typically do not see policy changes that reduce the population of violent offenders, Figure 2 presents a population projection that allows the current sentencing and growth patterns for violent offenders to continue. It shows that, even if zero and negative growth can be achieved for one portion of the prison population, it will not result in zero or negative growth overall. This is because, although people incarcerated for committing nonviolent crimes make up a higher percentage of prison admissions and releases, their very short stay makes their presence less influential. That is, those who are incarcerated longer maintain the size of the population.
Ultimately, we cannot escape the policies of the past, an idea known as population momentum. The sentencing practices of the past influence the size of the current prison population, and immediate change is not possible unless there is something to counteract the momentum. Based on this first exercise, which examined the impact of four changes to the current sentencing regime, several implications are possible. Policy changes for nonviolent offenses have little effect because of the low mean length of stay for these crimes. Compensating for less punishment for nonviolent offenses by giving harsher sentences for violent offenses increases growth of the prison population. Policymakers must consider the momentum of past policies, particularly the longer sentences attached to violent crimes.
3.2. The Costs of Momentum
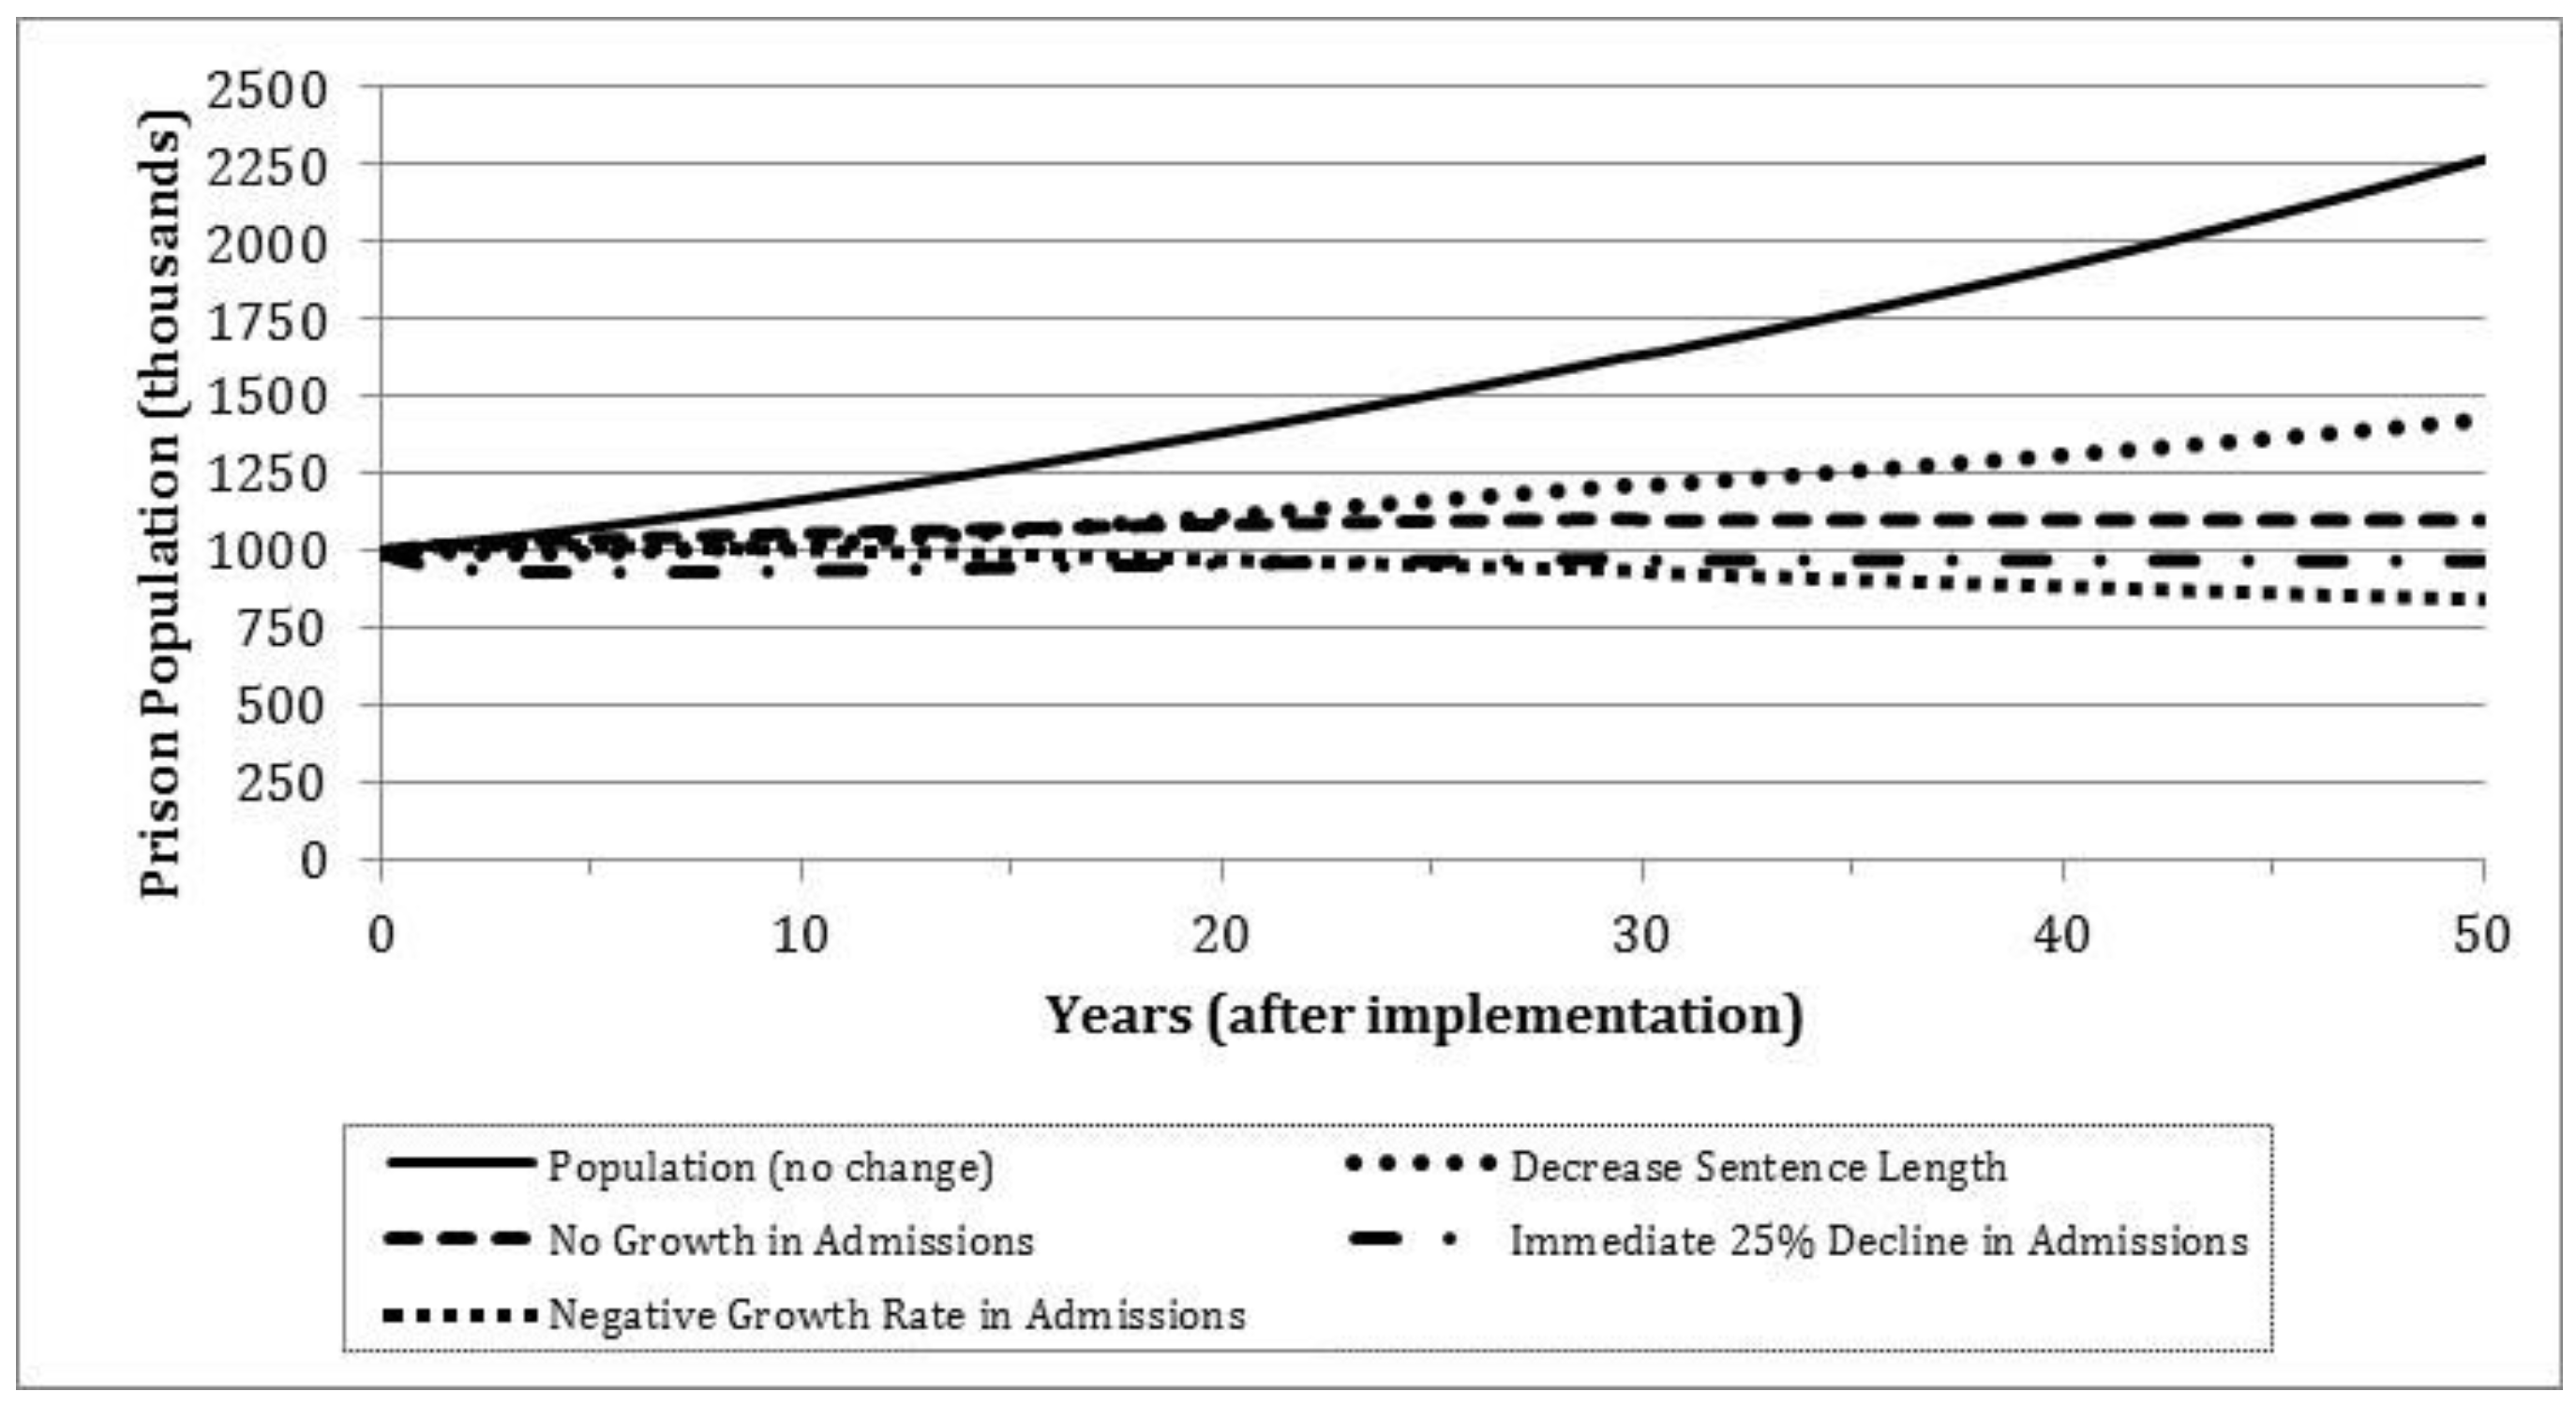
Reaching and maintaining zero population growth is heavily dependent on the movements of people charged with and sanctioned for violent offenses. Although public safety certainly cannot be ignored, this population is not part of this discussion of changes, unless a change involves more punitive policies. However, there is no reason to increase the current level of punishment for people committing violent crimes; I argue, rather, that the only way to sustain a lack of growth or negative growth in the prison population is to implement policies that continue to lower the rate of violent crimes committed. Figure 3 displays what happens to the total prison population when the same policies mentioned above are applied to the nonviolent offender population and the level of admissions for violent offenders remains constant over time.
The three policies that showed potential to lower the prison population by making changes on entry side to people committing non-violent offenses are the same policies that have potential to bring about zero and negative growth in state prison populations. Remember that each of the policies requires no increase in violent admissions from year to year. The first requires zero growth in admissions for both violent and nonviolent offenses. The second requires either that the level of admissions declines gradually over time, or that there is negative growth in the nonviolent offender population. The third requires an immediate 25% decrease in the level of nonviolent admissions, followed by zero growth in year-to-year admissions. Nonviolent admissions would remain at that level for the foreseeable future. Thus there could be zero and negative growth in the prison population.
These findings demonstrate the need to integrate population dynamics when considering new prison policies. Policymakers therefore need an accessible tool that allows them to evaluate the short- and long-term consequences of policies.2 This tool would enable them to gauge how long it takes to reach zero growth and the financial cost of getting there. In other words, another issue to tackle is the length of time it will take for past policies either to die out or be offset by new policies.
In 2012, approximately 1.5 million people were incarcerated in state correctional facilities. Based on the models, I provide the number of years until zero or negative growth can be achieved in this population, and estimate the additional cost of supporting the prison population in the year it reaches zero or negative growth. Table 1 displays the results of this exercise, assuming it costs around $30,000 a year to house an inmate. Without any changes in the current sentencing regime and admissions schedule at the 30-year mark, the cost would be up to $73.8 billion, or about $30 billion more than current costs of running prisons. Although the sentencing change does not achieve zero growth, costs for this scenario at the 30-year mark would be far less than if nothing were done. With zero admissions growth, the additional cost is far less, but still costly at $4.7 billion. The next situation, a decrease in the admission of nonviolent offenders, actually takes a relatively short time, although it, of course, depends on the rate of decline. In 2.5 years, the population reaches zero growth and the additional costs, given the ultimate population size, decreases to approximately $960 million.
Thus far I have only discussed the change in yearly costs at zero growth. This is important, but it is also important to consider what it would cost to get to zero growth. Implementing policies will slow growth, but growth will continue nonetheless, and the total cost to get to zero growth differs substantially, depending on the intervention. Estimating the total cost depends on the number of person-years lived in state correctional facilities. In other words, it takes into account the yearly cost (at $30,000 per person) as the population grows. For the two options that will never result in zero growth—decreasing sentence lengths and making no changes—the total costs at the 30-year mark are $1.5 trillion and $1.7 trillion, respectively. The total cost if there is no growth in nonviolent admissions is $1.42 trillion, and the negative growth in nonviolent admissions that will take 2.5 years comes in at $75.6 billion. No matter what approach a state chooses, the era of mass incarceration will continue, and will continue, and will be costly, for some time to come.
The last situation, an immediate decrease in nonviolent admissions and no growth in both violent and nonviolent admissions for the foreseeable future, would result in immediate negative growth. Could this happen? Remember, policies that decrease imprisonment for non-violent crimes are typically accompanied policies that call for an increase in the punishment for violent crimes. Furthermore, for negative growth to occur, there must be decrease over time in violent admissions. It will probably take a number of states much more time to reach negative growth because, while achieving zero or negative growth would be great, it would not be at all good to compromise public safety to do so.
In 2015, fewer than half of violent crimes reported were cleared by arrest or exceptional means (Federal Bureau of Investigation 2016), which conveys that at least 50% of violent crimes committed and reported that year had no resolution. It also means that, if all people who commit violent crimes were caught and punished, admissions for these crimes would rise considerably. We also know that many crimes go unreported. Thus, if we were able to increase reporting and clear a higher percentage of violent crimes, we would certainly expect to see growth in admissions for both violent and nonviolent crimes. These are two positive goals that should not be compromised by efforts to achieve negative growth.
4. Discussion
The U.S. currently leads the world’s nations in the absolute number of people incarcerated (International Centre for Prison Studies 2017). The decades of depending on incarceration as the main form of punishment have forced congressional action and led to greater transparency about the mistakes and transgressions that put the country in such a precarious position. Although conversations on this issue were certainly going on long before the 2008 economic crisis, the current national dialogue on ending mass incarceration is unprecedented. Accordingly, politicians are now being pushed to address how they will reduce the percentage of their budget spent on the criminal justice system.
However, awareness alone cannot solve the U.S. punishment problem. The U.S. justice system is intricate and composed of different units. In addition to the Federal Bureau of Prisons, which manages the federal prison system, each state makes its own prison policies and faces different obstacles. California, for example, enacted legislation in 2011 that dictated that the prison population must be less than 137.5% of the intended capacity (Golaszewski 2011). California has shown a decline in incarceration for several years now. Most credit this to the 2011 realignment legislation, which diverts a large class of lower-level nonviolent offenders and parole violators to county jails, rather than state correctional facilities. While this helps lower the prison population, it potentially shifts additional burdens to the jail systems in terms of financial costs and overcrowding in jails (Kubrin and Seron 2016; Verma 2016).
Most state prison populations continue to grow, despite efforts to lower the size and costs of mass imprisonment. Several states have opted for less punitive measures for nonviolent offenders, sometimes replacing prison with options such as community-based programs, fines, tickets, probation, or even much shorter sentences. Still we must ask, can such strategies meet and maintain the policies’ intended goals?
For centuries, demographers explored ways to encourage and discourage fertility rates that achieve the golden standard we call a stationary population. This is what China sought to do to avoid population explosion, and this is one of the central ideas explored in this paper as a means to reduce the size of the U.S. prison population. While China did meet its intended goal, it was left with many unintended consequences. As such, careful and dynamic action must be taken to understand the current prison situation, including the expected costs of prisons and how those costs can be alleviated without sacrificing public safety. For example, we must also consider how to reduce the cascading consequences that currently seem to ensure that people who are “marked” (Pager 2003) with a criminal record will eventually return to prison.
The findings of this paper demonstrated that policies related solely to the sentencing regime will do little, if anything, to lower the prison population. Policies that reduced admissions via decriminalization of crimes or rerouting people to alternatives that did not leave the mark of a criminal record showed the most promise. Additionally, removing legislation that inhibits former inmates’ ability to integrate into society could be helpful. However, all of this must be considered alongside the United States’ low clearance rate for crime in general and the current size of the violent offender population. If long-term reduction in the size of the prison population is the goal, the U.S. must attend to strategies to prevent violent crimes and consider reforming the current punishments associated with their commission.
Conflicts of Interest
The author declares no conflict of interest.
References
- Austin, James. 2010. Reducing America’s Correctional Populations: A Strategic Plan. Justice Research and Policy 12: 9–40. [Google Scholar] [CrossRef]
- Austin, James, and Barry Krisberg. 1985. Incarceration in the United States: The Extent and Future of the Problem. The Annals of the American Academy of Political and Social Science 478: 15–30. [Google Scholar] [CrossRef]
- Braman, Donald. 2004. Doing Time on the Outside: Incarceration and Family Life in Urban America. Ann Arbor: University of Michigan Press. [Google Scholar]
- Bushway, D. 2004. Labor Market Effects of Permitting Employer Access to Criminal History Records. Journal of Contemporary Criminal Justice 20: 276–91. [Google Scholar] [CrossRef]
- Demeny, Paul. 1988. Social science and population policy. The Population and Development Review 14: 451–79. [Google Scholar] [CrossRef]
- Golaszewski, Paul. 2011. A Status Report: Reducing Prison Overcrowding in California. Sacramento: Legislative Analyst’s Office. [Google Scholar]
- Federal Bureau of Investigation. 2016. Crime in the United States, 2015. In Offenses Cleared; Edited by Federal Bureau of Investiation. Washington: Department of Justice. [Google Scholar]
- Hesketh, Therese, Li Lu, and Zhu Wei Xing. 2005. The Effect of China’s One-Child Family Policy after 25 Years. The New England Journal of Medicine 353: 1171–76. [Google Scholar] [CrossRef] [PubMed]
- International Centre for Prison Studies. 2017. Entire world—Prison Population Rates per 100,000 of the national population. Available online: http://www.prisonstudies.org/ (accessed on 15 May 2017).
- Knapp, Kay A., and Ronald E. Anderson. 1981. Minnesota Sentencing Guidelines Population Projection Program User Manual. St. Paul: Minnesota Sentencing Guidelines Commission. [Google Scholar]
- Kubrin, Charis, and Carrol Seron. 2016. The Prospects and Perils of Ending Mass Incarceration in the United States. The Annals of the American Academy of Political and Social Science 664: 16–24. [Google Scholar] [CrossRef]
- Lutz, Wolfgang, and Sergei Scherbov. 2002. Can Immigration Compensate for Europe’s Low Fertility? Luxembourg: International Institute for Applied Systems Analysis. [Google Scholar]
- Pager, Devah Iwalani. 2003. The Mark of a Criminal Record. American Journal of Sociology 108: 937–75. [Google Scholar] [CrossRef]
- Patterson, Evelyn J. 2013. The Dose-Response of Time Served in Prison on Mortality: New York State, 1989–2003. American Journal of Public Health 103: 523–29. [Google Scholar] [CrossRef] [PubMed]
- Patterson, Evelyn J., and Chris Wildeman. 2015. Mass Imprisonment and the Life Course Revisited: Cumulative Years Lost to Incarceration for Working-Age White and Black Men. Social Science Research 661: 86–108. [Google Scholar]
- Pfaff, John F. 2008. The Empirics of Prison Growht: A Critical Review and Path Forward. The Journal of Criminal Law and Criminology 98: 547–619. [Google Scholar]
- Pfaff, John F. 2011. The Myths and Realities of Correctional Severity: Evidence from the National Corrections Reporting Program on Sentencing Practices. American Law and Economics Review 13: 491–531. [Google Scholar] [CrossRef]
- Porter, Nicole D. 2015. The State of Sentencing 2014: Developments in Policy and Practice. Washington: The Sentencing Project. [Google Scholar]
- Preston, Samuel, Patrick Heuveline, and Michel Guillot. 2001. Demography: Measuring and Modeling Population Processes. Malden: Blackwell Publishers Inc. [Google Scholar]
- Pritchett, Lant H. 1994. Desired fertility and the impact of population policies. Population and Development Review 20: 1–55. [Google Scholar] [CrossRef]
- Raphael, Steven. 2009. Explaining the rise in U.S. incarceration rates. Criminology and Public Policy 8: 87–95. [Google Scholar] [CrossRef]
- Steinhauer, Jennifer. 2015. Bipartisan Push Builds to Relax Sentencing Laws. Available online: https://www.nytimes.com/2015/07/29/us/push-to-scale-back-sentencing-laws-gains-momentum.html?_r=0 (accessed on 29 July 2015).
- Tonry, Michael. 2014. Remodeling American Sentencing: A Ten-Step Blueprint for Moving Past Mass Incarceration. Criminology and Public Policy 13: 503–33. [Google Scholar] [CrossRef]
- Travis, Jeremy, Bruce Western, and Steve Redburn. 2014. The Growth of Incarceration in The United States: Exploring Causes and Consequences. Washington: National Academy Press. [Google Scholar]
- Verma, Anjuli. 2016. A Turning Point in Mass Incarceration? Local Imprisonment Trajectories and Decarceration under California’s Realignment. The Annals of the American Academy of Political and Social Science 664: 108–35. [Google Scholar] [CrossRef]
- Visher, Christy A., and Jeremy Travis. 2003. Transitions from Prison to Community: Understanding Individual Pathways. Annual Review of Sociology 29: 89–113. [Google Scholar] [CrossRef]
- Western, Bruce. 2002. The Impact of Incarceration on Wage Mobility and Inequality. American Sociological Review 67: 526–46. [Google Scholar] [CrossRef]
| 1 | The 33 states used are Alabama, California, Colorado, Florida, Georgia, Hawaii, Iowa, Kentucky, Louisiana, Maryland, Michigan, Minnesota, Missouri, Nebraska, Nevada, New Hampshire, New Jersey, New York, North Carolina, Oklahoma, Oregon, Pennsylvania, Rhode Island, South Carolina, South Dakota, Tennessee, Texas, Utah, Virginia, Washington, West Virginia, and Wisconsin. |
| 2 | Please contact the author for access to a tool that calculates the short—and long—term consequences of policies on the size of the prison population. |
Figure 1.
Nonviolent Inmate Population, Changes in Policies for Nonviolent Offenders. Source: Calculations by author using Bureau of Justice Statistics data.
Figure 1.
Nonviolent Inmate Population, Changes in Policies for Nonviolent Offenders. Source: Calculations by author using Bureau of Justice Statistics data.

Figure 2.
Complete Inmate Population, Changes in Policies for Nonviolent Offenders. Source: Calculations by author using Bureau of Justice Statistics data.
Figure 2.
Complete Inmate Population, Changes in Policies for Nonviolent Offenders. Source: Calculations by author using Bureau of Justice Statistics data.

Figure 3.
Complete Inmate Population, Changes in Policies for Nonviolent Offenders and Violent Offenders. Source: Calculations by author using Bureau of Justice Statistics data.
Figure 3.
Complete Inmate Population, Changes in Policies for Nonviolent Offenders and Violent Offenders. Source: Calculations by author using Bureau of Justice Statistics data.


Table 1.
The Costs of Momentum: The Additional Costs of the Population at Zero Growth a.
| Strategy | Time to Reach Zero or Negative Growth in Prison Population | Current Costs (in dollars) | Additional Costs at Zero Growth b (in dollars) | Total Costs to Achieve Zero Growth c (in dollars) |
|---|---|---|---|---|
| No Growth in Nonviolent Admissions | 30 years | 45 billion | 4.7 billion | 1.42 trillion |
| Negative Growth in Nonviolent Admissions | 2.5 years | 960 million | 75.6 billion | |
| Immediate 25% Decline in Nonviolent Admissions, Followed by No Growth in Nonviolent Admissions | 0 years | - | - | |
| Decrease in Sentence Length | Will Not Occur | 54.8 billion | 1.5 trillion | |
| No Change | Will Not Occur | 73.8 billion | 1.7 trillion |
Source: Author’s calculations based on data from Bureau of Justice Statistics. a Each estimate assumes that violent admissions are constant from year to year. The additional costs assume that each inmate costs $30,000 per year. b “Additional costs” only looks at the additional costs in the final population for each year. For the two final options, where zero growth will not occur, the costs at 30 years was used. c “Total costs” calculates the cumulative costs (adds costs each year) from now to the time it takes to reach zero growth. For the two final options, where zero growth will not occur, the costs at 30 years was used.
© 2017 by the author. Licensee MDPI, Basel, Switzerland. This article is an open access article distributed under the terms and conditions of the Creative Commons Attribution (CC BY) license (http://creativecommons.org/licenses/by/4.0/).
Share and Cite
MDPI and ACS Style
Patterson, E.J. The Strategies, Complexities, and Realities of Zero Prison Population Growth. Soc. Sci. 2017, 6, 60. https://doi.org/10.3390/socsci6020060
AMA Style
Patterson EJ. The Strategies, Complexities, and Realities of Zero Prison Population Growth. Social Sciences. 2017; 6(2):60. https://doi.org/10.3390/socsci6020060
Chicago/Turabian StylePatterson, Evelyn J. 2017. "The Strategies, Complexities, and Realities of Zero Prison Population Growth" Social Sciences 6, no. 2: 60. https://doi.org/10.3390/socsci6020060
Note that from the first issue of 2016, this journal uses article numbers instead of page numbers. See further details here.