Delay Causes and Emerging Digital Tools: A Novel Model of Delay Analysis, Including Integrated Project Delivery and PMBOK

 ,
, 
 , ,
, ,
Abstract
:
1. Introduction
2. Review Method
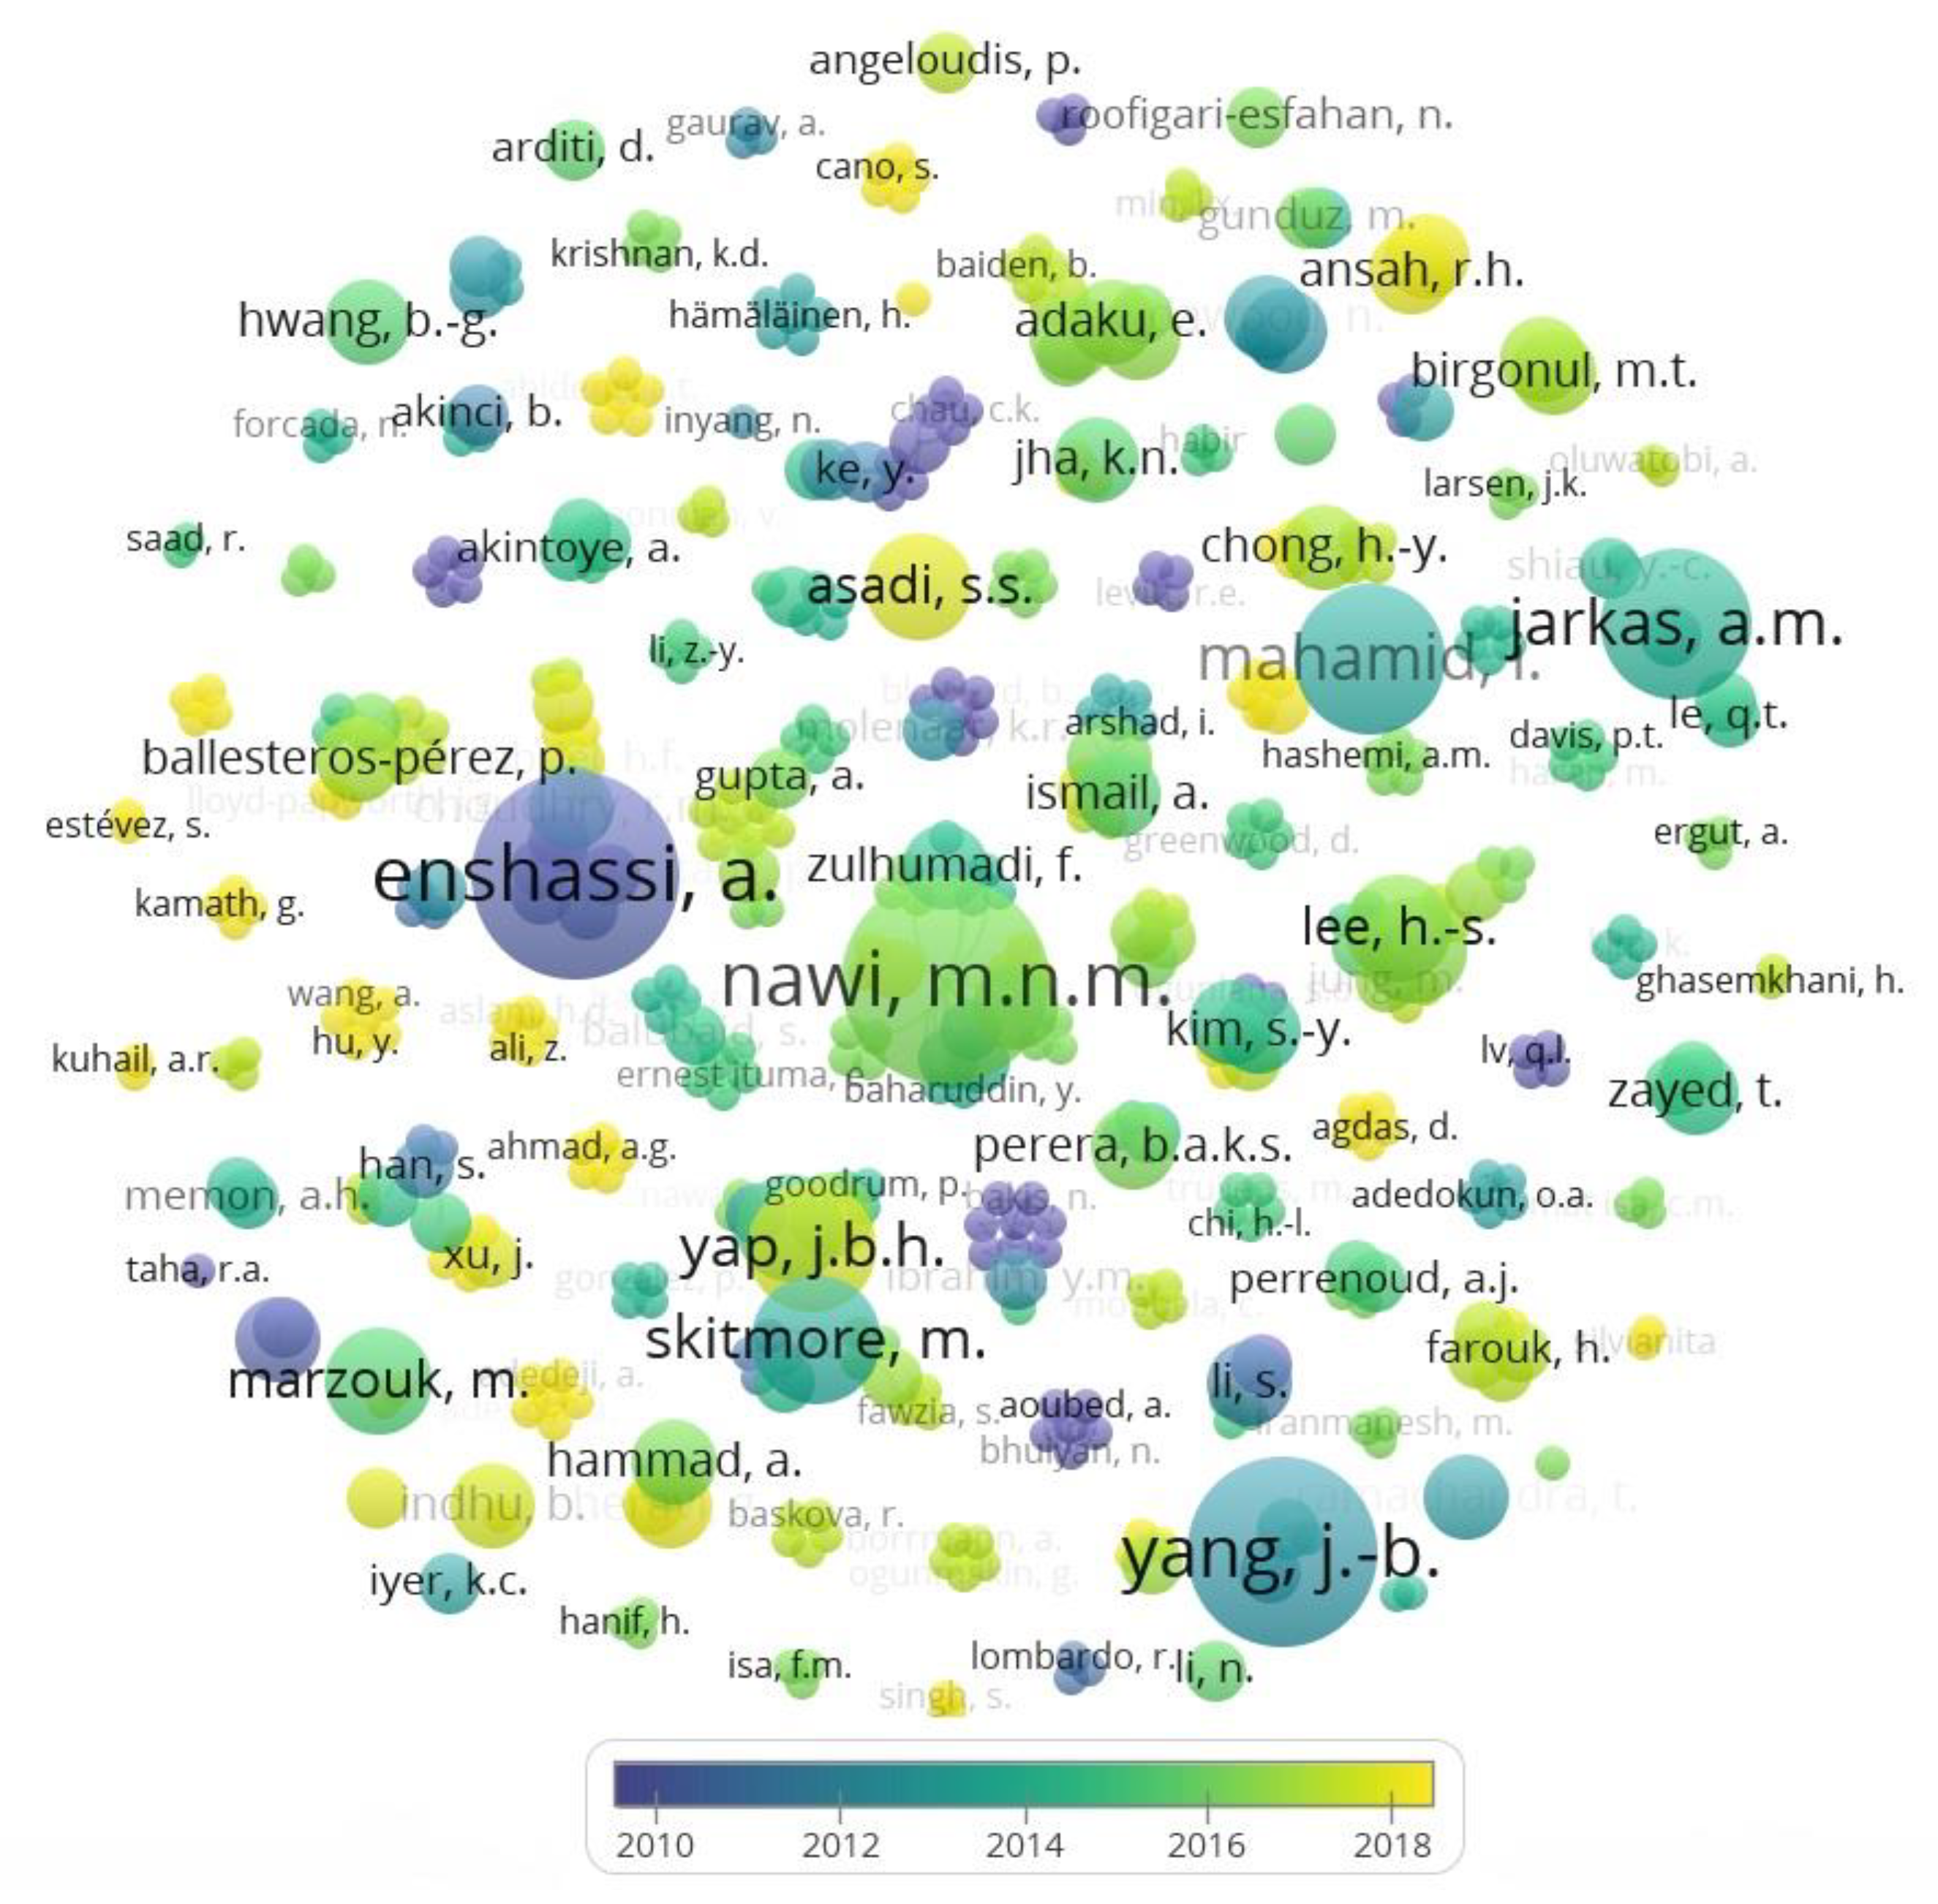
3. Bibliography Analysis
4. Content Analysis and Data Mining
5. Current Practices in Delay and Time Overrun Investigations
Key Factors Identified in the Delay Literature
6. Technology Applications for Time Control and Risk Management
- What data need to be assembled as inputs to record the delay events for the update, and what methods will be used to collect the data?
- How often should projects be updated?
- Are resources local or offsite?
- Which project teams are resources participating in?
- Who on each team will be gathering the information used for the project update, and with what frequency are the data updated within the schedule?
- Who needs to see the results of the update, and when do they need to see them?
- What types of information need to be generated after each update to communicate progress before the next update?
- Total float consuming status compared with the previous month schedule.
- Critical path schedule analysis.
- Based on the above analysis, if problem areas are found, these are identified and reported to the project manager. The project control manager implements suggested countermeasures in conjunction with the related managers and under the project managers’ instruction. Once the project manager approves the counter measures, they are incorporated in the schedule. Close monitoring is made to meet the corrective action plan. Until a decision on the countermeasures is made, the schedule is not changed.
- The updated schedule is issued to each project management office (PMO), project control department, or project manager as an updated project control for their work and for the next monthly update.
- When compared with the initial estimate, the updated information may indicate some variances in the scheduling basis. On the other hand, along with the project progress, schedule deviations may be detected from the initial scenario caused by various factors.
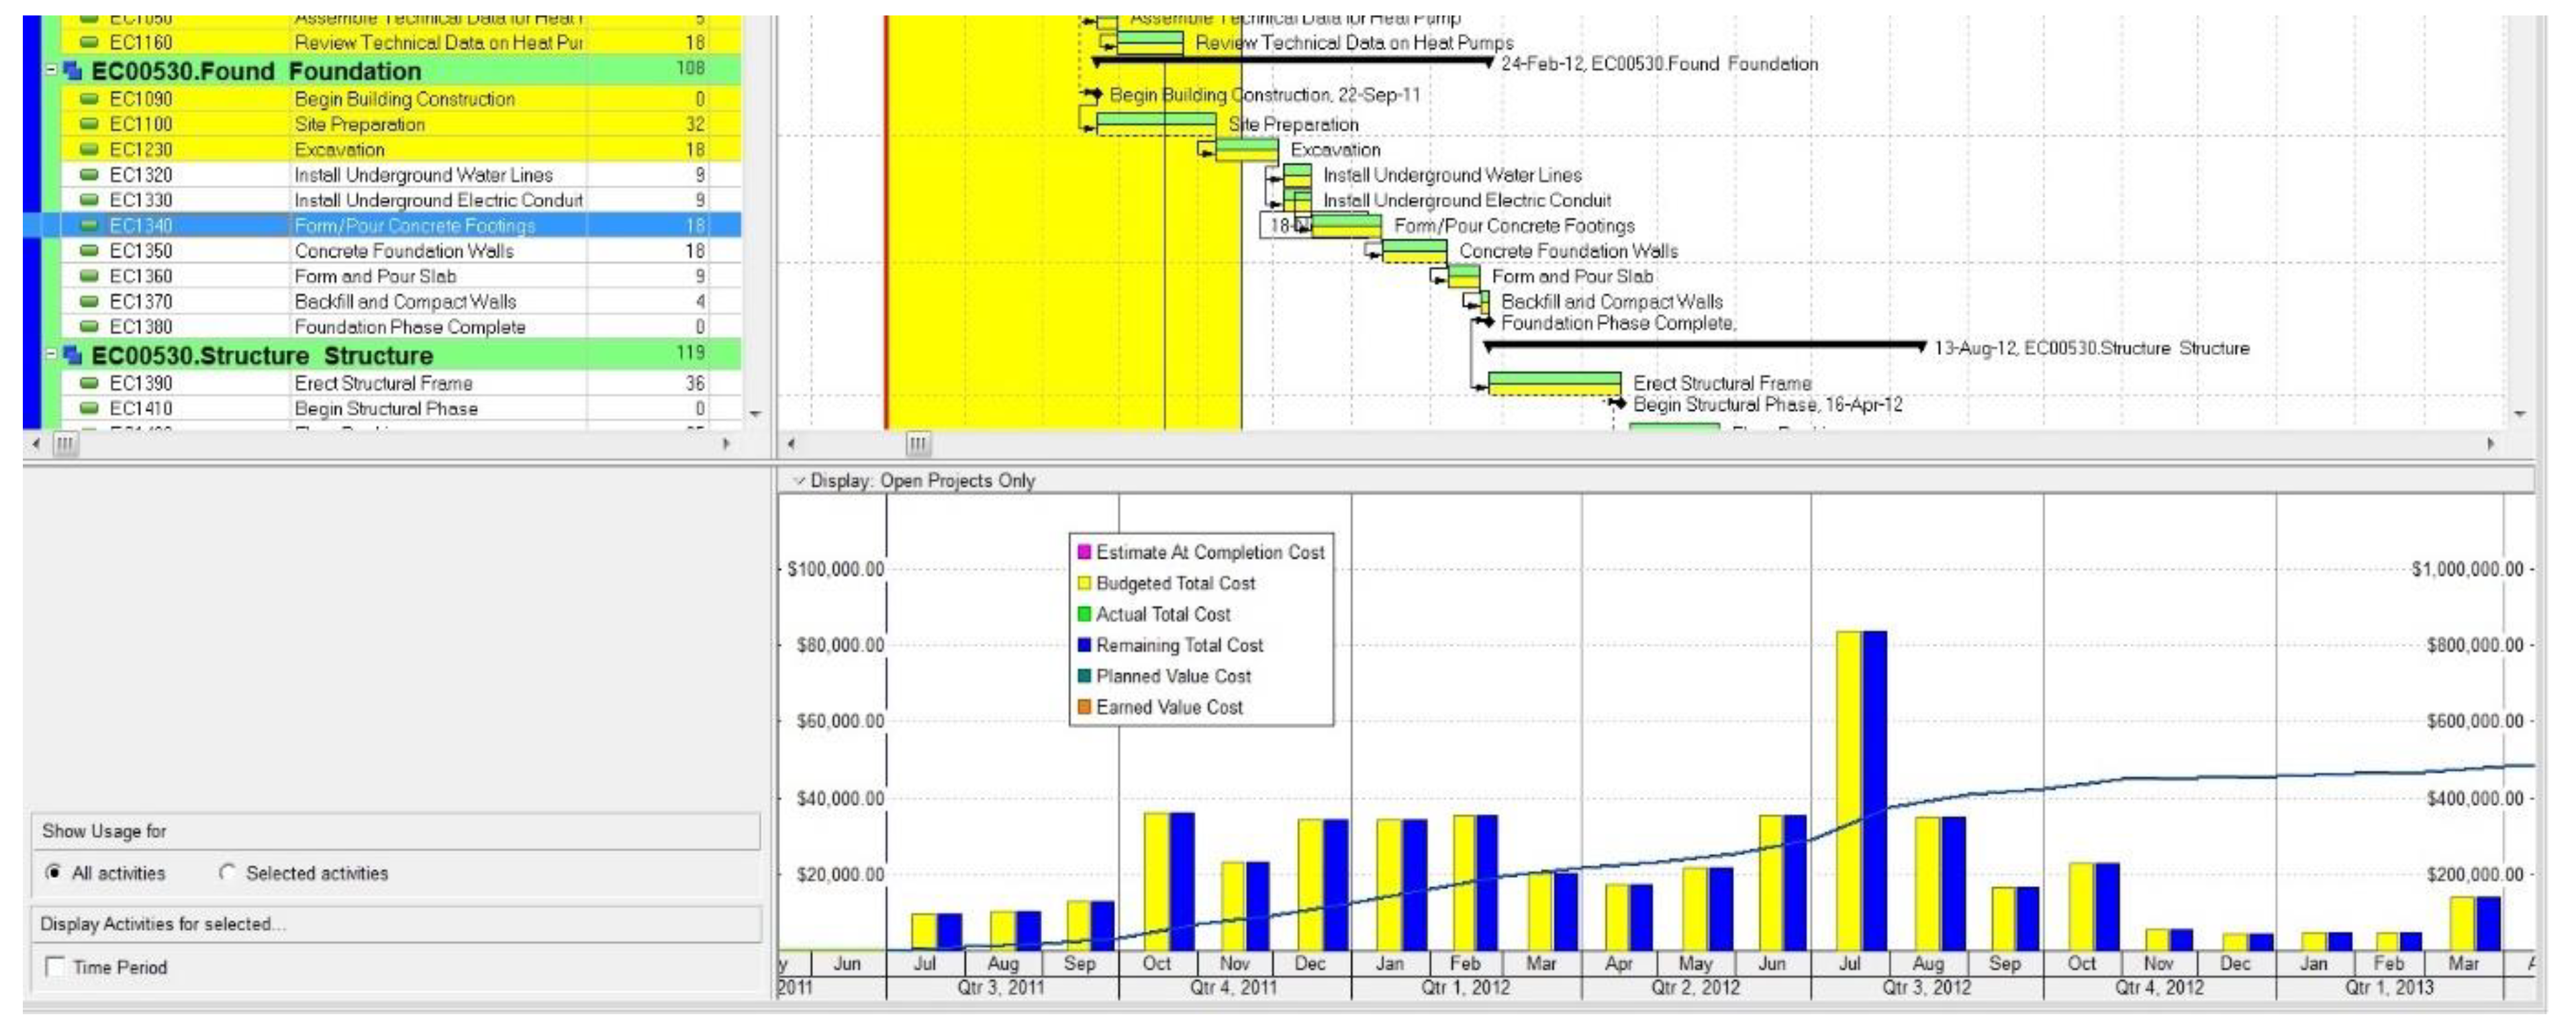
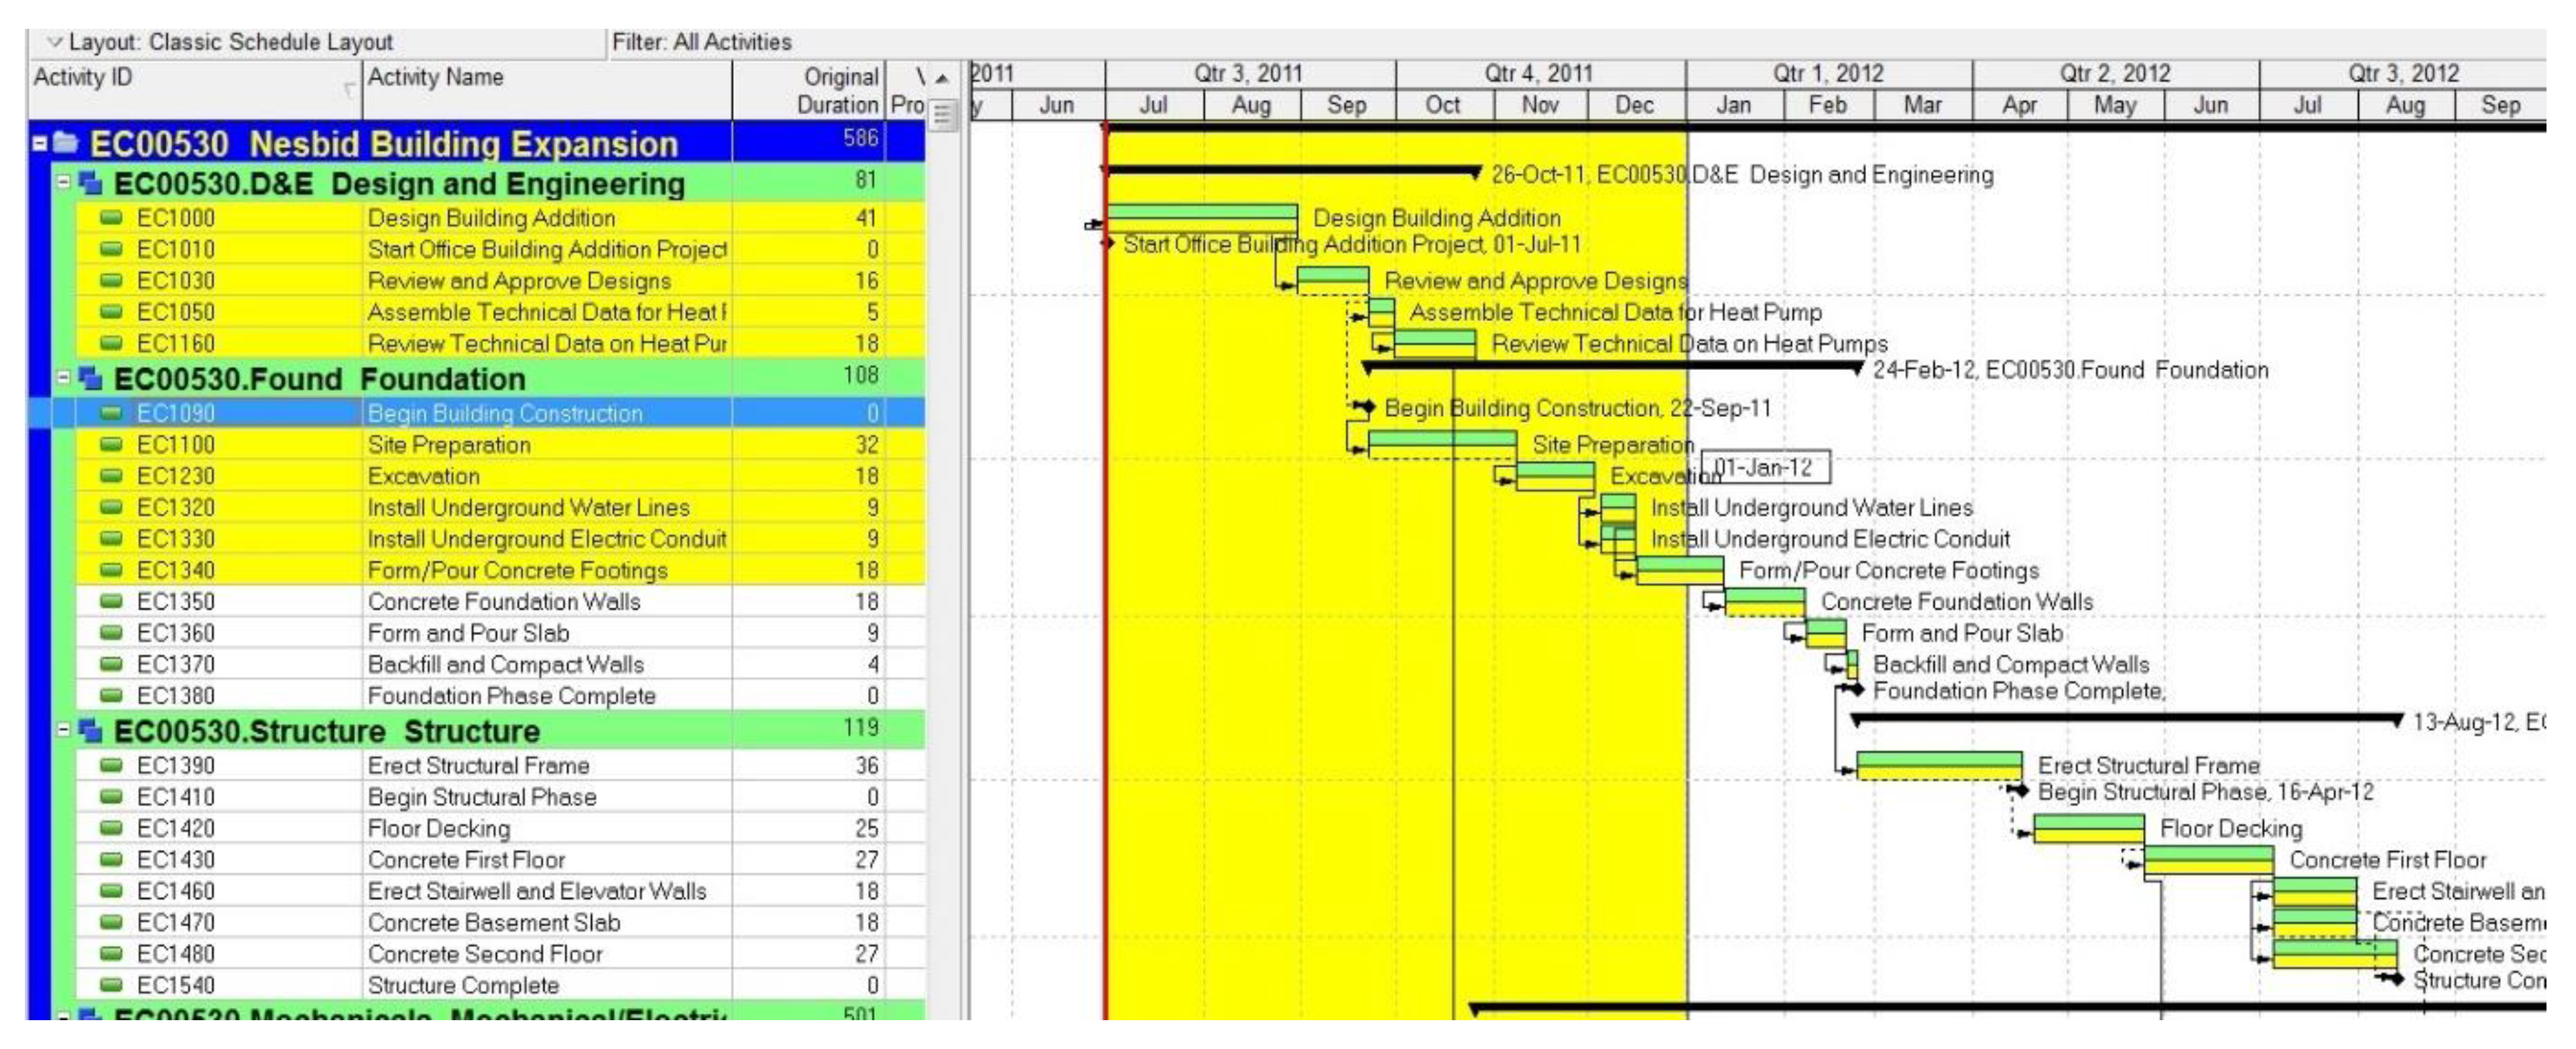
6.1. Progress Measurement Method in Scheduling Software
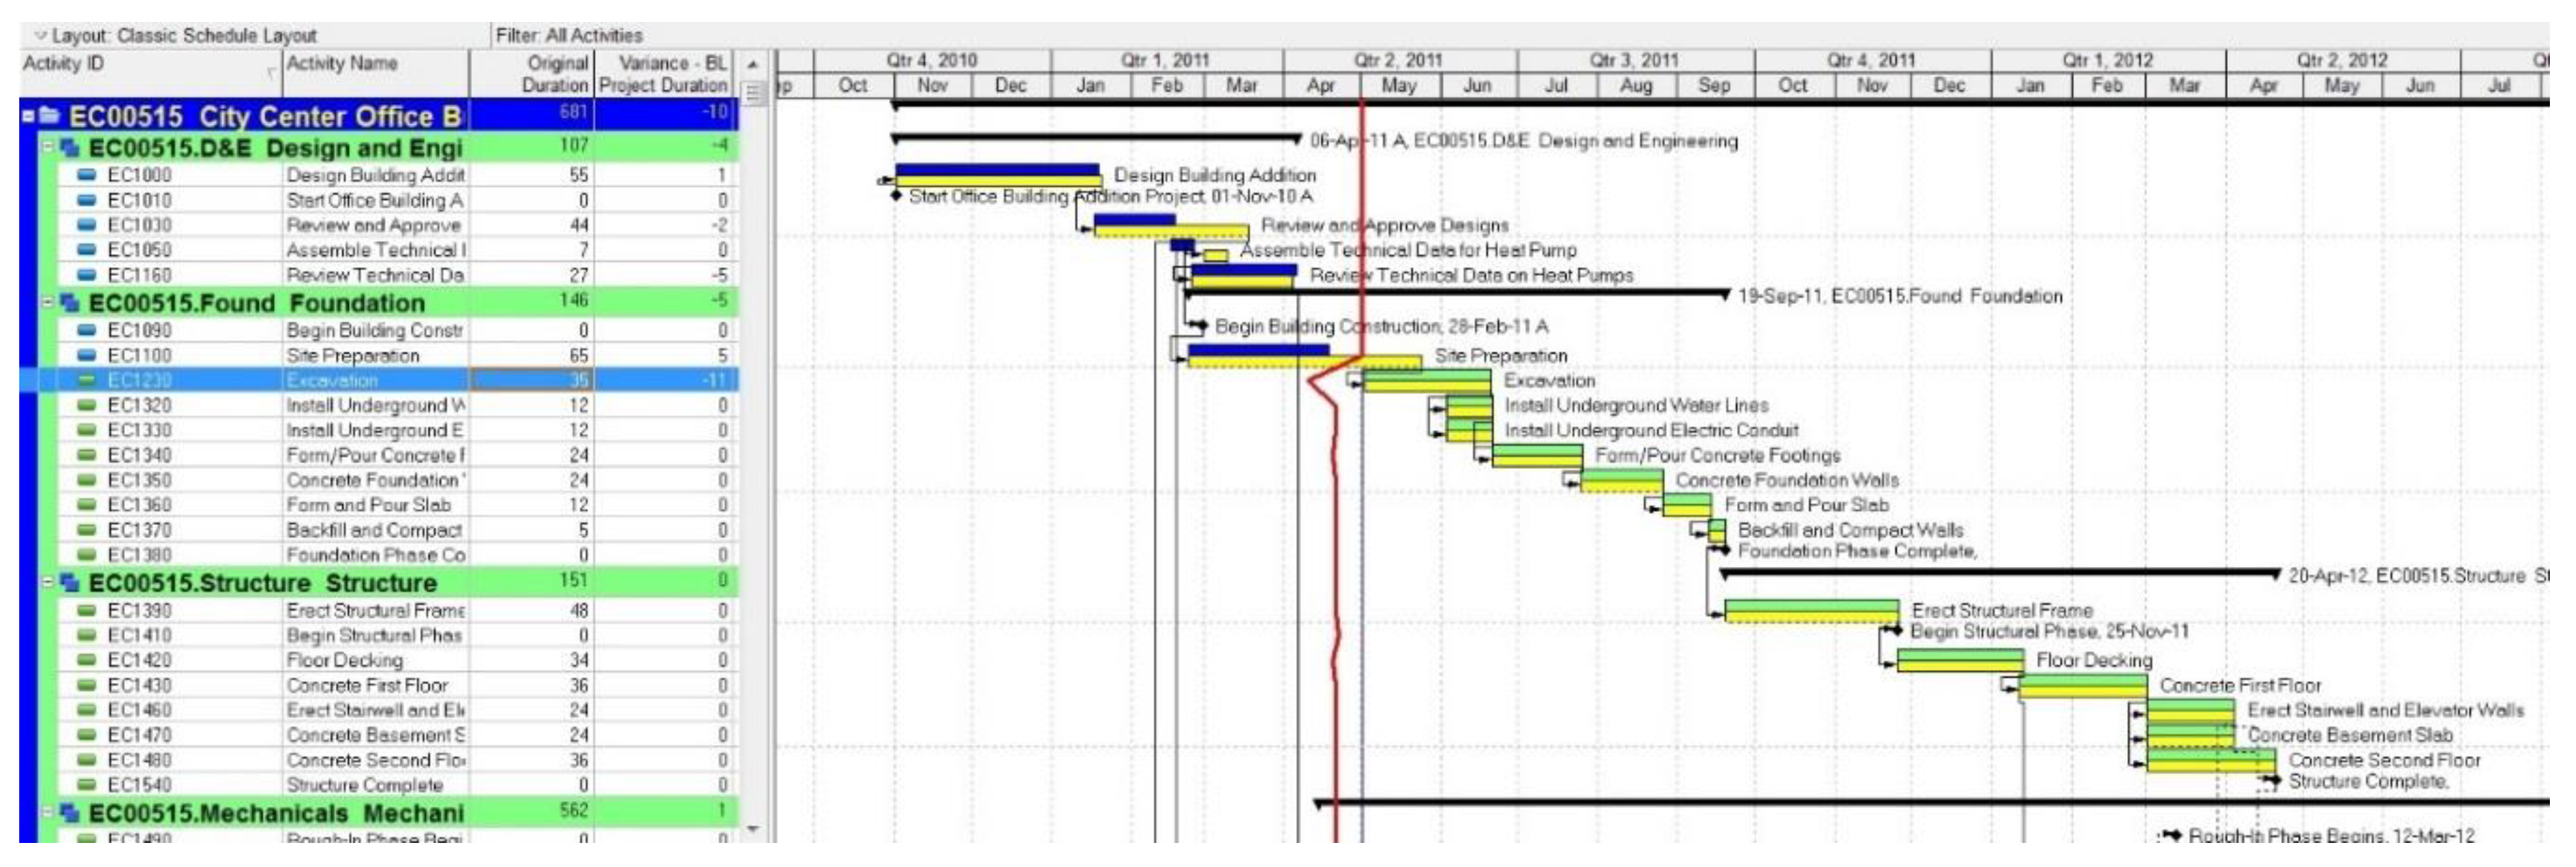
6.2. Primavera P6 and Delay Analysis
7. Project Schedule Delay Analysis from Project Management Methodology Perspectives
7.1. Project Management Body of Knowledge (PMBOK)
7.2. Practice Standard for Scheduling
7.3. Agile Practice Guide
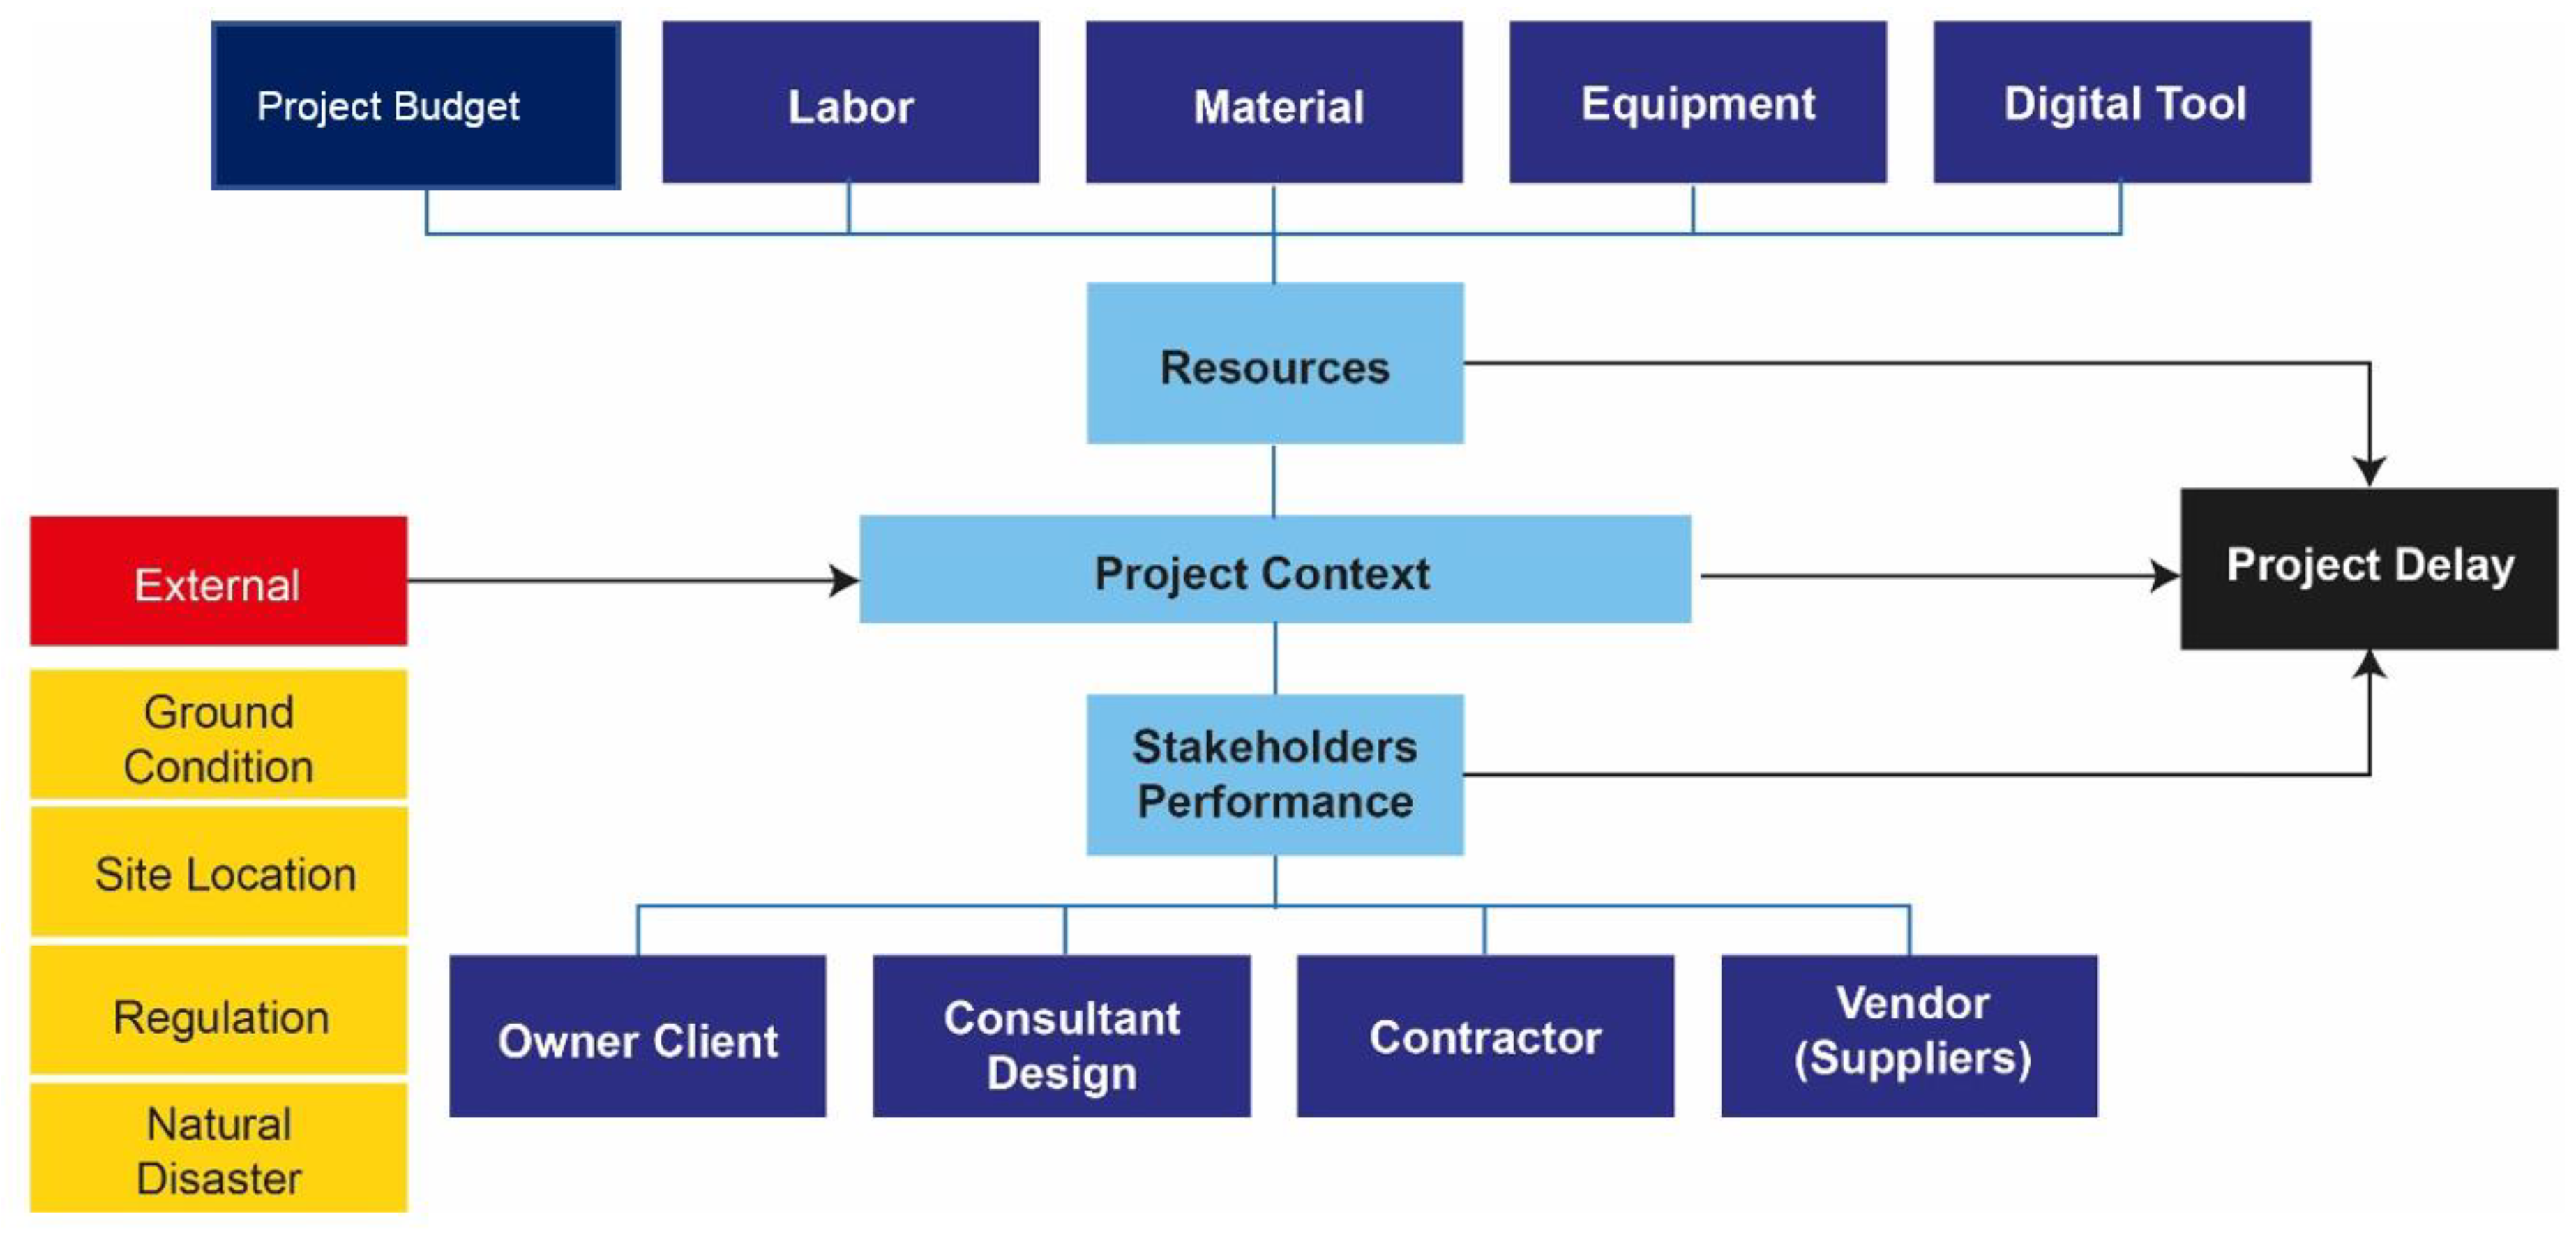
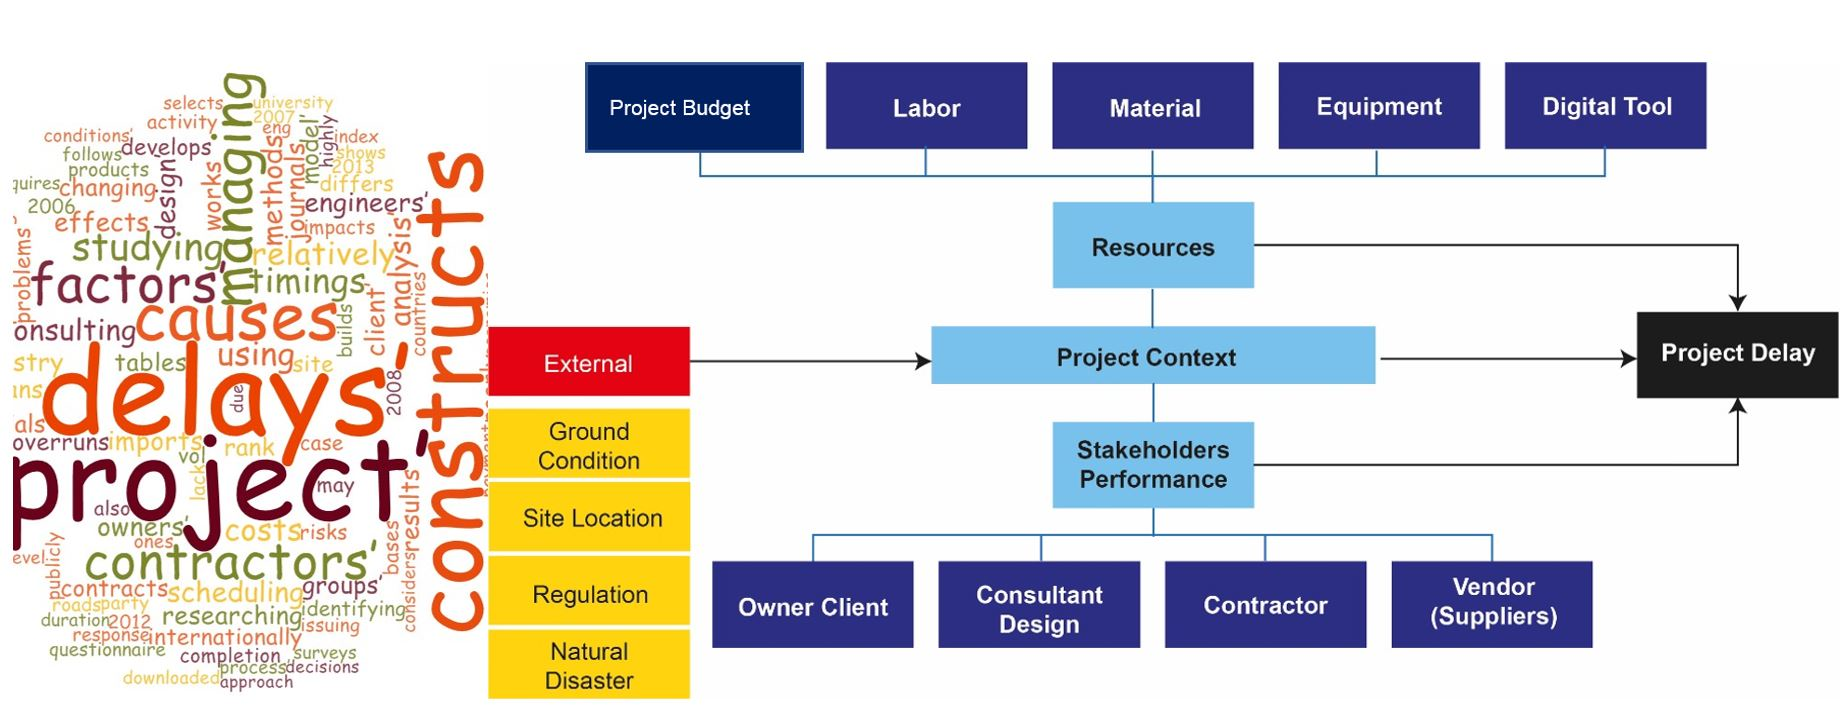
8. Discussion and the DEC conceptual model
- Digital design communication tools: Digital Twin, Building Information Systems (BIM) including Revit, ArchiCAD, Navisworks, BIMx, BricsCAD, Archibus, Constructor, IntelliCAD, VisualARQ, Revizto; Geographic Information Systems (GIS) including QGIS, ArcGIS, and ArcMap [17]. The literature frequently reports that design mistakes, errors, changing orders and scopes, later approvals, and late technical decision makings were the main causes of delay in different contexts [95,99,104].
- Digital scheduling and planning tools: Microsoft Project, Oracle Primavera P6, FastTrack Schedule, ZOHO Projects, @risk, Workfront, eResource Scheduler, ConceptDraw Project, Resource Guru, Open Plan by Deltek, Smartsheet, and other software, packages, and platforms.
- Digital contract management tools: intelligent or smart contracts. The literature shows that many projects suffer from weak administration of contracts [96].
- Digital devices to increase the productivity of heavy equipment: real-time locating systems, Global Positioning System (GPS), and radar.
- Digital production technologies: 3D printers [148].
9. Conclusions and an Agenda for Future
Author Contributions
Funding
Conflicts of Interest
Appendix A
References
- Magdy, M.; Georgy, M.; Osman, H.; Elsaid, M. Delay Analysis Methodologies Used by Engineering and Construction Firms in Egypt. J. Leg. Aff. Disput. Resolut. Eng. Constr. 2019, 11, 1–11. [Google Scholar] [CrossRef]
- Soomro, F.A.; Memon, M.J.; Chandio, A.F.; Sohu, S.; Soomro, R. Causes of Time Overrun in Construction of Building Projects in Pakistan. Eng. Technol. Appl. Sci. Res. 2019, 9, 3762–3764. [Google Scholar]
- Abdelmaguid, T.F.; Elrashidy, W. Halting decisions for gas pipeline construction projects using AHP: A case study. Oper. Res. 2019, 19, 179–199. [Google Scholar] [CrossRef]
- Harris, P.E. Planning and Control Using Oracle Primavera P6 Versions 8, 15 & 16 PPM Professional 2016; Eastwood Harris Pty Ltd: Melbourne, Australia, 2016. [Google Scholar]
- Chan, A.P. Time–cost relationship of public sector projects in Malaysia. Int. J. Proj. Manag. 2001, 19, 223–229. [Google Scholar] [CrossRef]
- Assaf, S.A.; Al-Hejji, S. Causes of delay in large construction projects. Int. J. Proj. Manag. 2006, 24, 349–357. [Google Scholar] [CrossRef]
- Bramble, B.B.; Callahan, M.T. Construction Delay Claims; Taylor & Francis US: Oxfordshire, UK, 2004. [Google Scholar]
- Aibinu, A.; Jagboro, G. The effects of construction delays on project delivery in Nigerian construction industry. Int. J. Proj. Manag. 2002, 20, 593–599. [Google Scholar] [CrossRef]
- Vaardini, S.; Karthiyayini, S.; Ezhilmathi, P. Study on cost overruns in construction projects: A review. Int. J. Appl. Eng. Res. 2016, 11, 356–363. [Google Scholar]
- McKay, K.N.; Wiers, V.C. Planning, Scheduling and Dispatching Tasks in Production Control; Cognition, Technology & Work: London, England, 2003; Volume 5, pp. 82–93. [Google Scholar]
- Gasik, S. An analysis of knowledge management in PMBOK® guide. PM World J. 2015, 4, 1–13. [Google Scholar]
- Marmel, E. Microsoft Project 2007 Bible; John Wiley & Sons: Hoboken, NJ, USA, 2011; Volume 767. [Google Scholar]
- Van Dorp, J.; Duffey, M. Statistical dependence in risk analysis for project networks using Monte Carlo methods. Int. J. Prod. Econ. 1999, 58, 17–29. [Google Scholar] [CrossRef]
- Irizarry, J.; Karan, E.P.; Jalaei, F. Integrating BIM and GIS to improve the visual monitoring of construction supply chain management. Autom. Constr. 2013, 31, 241–254. [Google Scholar] [CrossRef]
- Naamane, A.; Boukara, A. A Brief Introduction to Building Information Modelling (BIM) and its interoperability with TRNSYS. Renew. Energy Sustain. Dev. 2015, 1, 126–130. [Google Scholar]
- Maguire, D.J. An overview and definition of GIS. Geogr. Inf. Syst. Princ. Appl. 1991, 1, 9–20. [Google Scholar]
- Shirowzhan, S.; Sepasgozar, S.M. Spatial Analysis Using Temporal Point Clouds in Advanced GIS: Methods for Ground Elevation Extraction in Slant Areas and Building Classifications. Isprs Int. J. Geo-Inf. 2019, 8, 120. [Google Scholar] [CrossRef]
- Dziadosz, A.; Rejment, M. Risk analysis in construction project-chosen methods. Procedia Eng. 2015, 122, 258–265. [Google Scholar] [CrossRef]
- Ghassemi, R.; Becerik-Gerber, B. Transitioning to Integrated Project Delivery: Potential barriers and lessons learned. Lean Constr. J. 2011, 2011, 32–52. [Google Scholar]
- The chartered Institute of Procurement and Supply Chain. Delays in Construction Projects; IHS Markit/Chartered Institute of Purchasing and Supply Purchasing Managers Index: London, UK, 2017. [Google Scholar]
- Bordoli, D.W.; Baldwin, A.N. A methodology for assessing construction project delays. Constr. Manag. Econ. 1998, 16, 327–337. [Google Scholar] [CrossRef]
- Lowsley, S.; Linnett, C. About Time-: Delay Analysis in Construction; RICS: London, UK, 2006. [Google Scholar]
- KPMG. Climbing the Curve: 2015 Global Construction Project Owner’s Survey. In KPMG’s 2015 Global Construction Survey; Gilge, C., Ed.; KPMG International Cooperative: Switzerland Amstelveen, Netherlands, 2015. [Google Scholar]
- Industry Trend Analysis-PPP Failures Highlight Project Execution Risks. 2017. Available online: http://www.infrastructure-insight.com/industry-trend-analysis-ppp-failures-highlight-project-execution-risks-feb-2017 (accessed on 3 July 2019).
- Sambasivan, M.; Soon, Y.W. Causes and effects of delays in Malaysian construction industry. Int. J. Proj. Manag. 2007, 25, 517–526. [Google Scholar] [CrossRef]
- Beckers, F.; Chiara, N.; Flesch, A.; Maly, J.; Silva, E.; Stegemann, U. A Risk-management Approach to A Successful Infrastructure Project; Mckinsey Work. Pap. Risk: New York, NY, USA, 2013; Volume 52, p. 18. [Google Scholar]
- Ruqaishi, M.; Bashir, H.A. Causes of delay in construction projects in the oil and gas industry in the gulf cooperation council countries: A case study. J. Manag. Eng. 2013, 31, 05014017. [Google Scholar] [CrossRef]
- Amandin, M.M.; Kule, J.W. Project delays on cost overrun risks: A study of Gasabo district construction projects Kigali, Rwanda. Abc J. Adv. Res. 2016, 5, 21–34. [Google Scholar]
- Amoatey, C.T.; Ankrah, A.N.O. Exploring critical road project delay factors in Ghana. J. Facil. Manag. 2017, 15, 110–127. [Google Scholar] [CrossRef]
- Akogbe, R.-K.T.; Feng, X.; Zhou, J. Importance and ranking evaluation of delay factors for development construction projects in Benin. Ksce J. Civ. Eng. 2013, 17, 1213–1222. [Google Scholar] [CrossRef]
- IPMD. Infrastructure and Project Monitoring Division of Ministry of Statistics and Programme Implementation; Programme implementation division of the MOSPI: Delhi, India, 2012. [Google Scholar]
- Faridi, A.S.; El-Sayegh, S.M. Significant factors causing delay in the UAE construction industry. Constr. Manag. Econ. 2006, 24, 1167–1176. [Google Scholar] [CrossRef]
- Al-Khalil, M.I.; Al-Ghafly, M.A. Delay in public utility projects in Saudi Arabia. Int. J. Proj. Manag. 1999, 17, 101–106. [Google Scholar] [CrossRef]
- Falqi, I. Delays in project completion: A comparative study of construction delay factors in Saudi Arabia and the United Kingdom. Master’s Thesis, School of the Built Environment, Heriot-Watt University, December 2004. Unpublished. [Google Scholar]
- Khoshgoftar, M.; Bakar, A.H.A.; Osman, O. Causes of delays in Iranian construction projects. Int. J. Constr. Manag. 2014, 10, 53–69. [Google Scholar] [CrossRef]
- Saeb, S.; Khayat, N.; Telvari, A. Causes of delay in Khuzestan Steel Company construction projects. Ind. Eng. Manag. Syst. 2016, 15, 335–344. [Google Scholar] [CrossRef]
- Zack, J.G. Schedule delay analysis; is there agreement? In Proceedings of the PMI-CPM College of Performance Spring Conference, New Orleans, NY, USA, 7–9 May 2003. Project Management Institute—College of Performance Management. [Google Scholar]
- Ellis, R.D.; Thomas, H.R. The root causes of delays in highway construction. In Proceedings of the 82nd Annual Meeting of the Transportation Research Board, Citeseer, Washington DC, USA, 12–16 January 2003. [Google Scholar]
- Koushki, P.; Al-Rashid, K.; Kartam, N. Delays and cost increases in the construction of private residential projects in Kuwait. Constr. Manag. Econ. 2005, 23, 285–294. [Google Scholar] [CrossRef]
- Odeyinka, H.A.; Yusif, A. The causes and effects of construction delays on completion cost of housing projects in Nigeria. J. Financ. Manag. Prop. Constr. 1997, 2, 31–44. [Google Scholar]
- Iyer, K.; Jha, K. Critical factors affecting schedule performance: Evidence from Indian construction projects. J. Constr. Eng. Manag. 2006, 132, 871–881. [Google Scholar] [CrossRef]
- Sweis, G.J. Factors affecting time overruns in public construction projects: The case of Jordan. Int. J. Bus. Manag. 2013, 8, 120. [Google Scholar] [CrossRef]
- Chan, D.W.; Kumaraswamy, M.M. A study of the factors affecting construction durations in Hong Kong. Constr. Manag. Econ. 1995, 13, 319–333. [Google Scholar] [CrossRef]
- Semple, C.; Hartman, F.T.; Jergeas, G. Construction claims and disputes: Causes and cost/time overruns. J. Constr. Eng. Manag. 1994, 120, 785–795. [Google Scholar] [CrossRef]
- Flyvbjerg, B.; Holm, M.S.; Buhl, S. Underestimating costs in public works projects: Error or lie? J. Am. Plan. Assoc. 2002, 68, 279–295. [Google Scholar] [CrossRef]
- Flyvbjerg, B.; Skamris Holm, M.K.; Buhl, S.L. How common and how large are cost overruns in transport infrastructure projects? Transp. Rev. 2003, 23, 71–88. [Google Scholar] [CrossRef]
- Ansar, A.; Flyvbjerg, B.; Budzier, A.; Lunn, D. Does infrastructure investment lead to economic growth or economic fragility? Evidence from China. Oxf. Rev. Econ. Policy 2016, 32, 360–390. [Google Scholar] [CrossRef] [Green Version]
- Sepasgozar, S.M.; Li, H.; Shirowzhan, S.; Tam, V.W.Y. Methods for monitoring construction off-road vehicle emissions: A critical review for identifying deficiencies and directions. Environ. Sci. Pollut. Res. 2019, 26, 15779–15794. [Google Scholar] [CrossRef]
- Zhong, B.; Wu, H.; Li, H.; Sepasgozar, S.; Luo, H.; He, L. A scientometric analysis and critical review of construction related ontology research. Autom. Constr. 2019, 101, 17–31. [Google Scholar] [CrossRef]
- Kim, H.; Lee, H.S.; Park, M.; Ahn, C.R.; Hwang, S. Productivity forecasting of newly added workers based on time-series analysis and site learning. J. Constr. Eng. Manag. 2015, 141. [Google Scholar] [CrossRef]
- Jung, M.; Park, M.; Lee, H.S.; Kim, H. Weather-delay simulation model based on vertical weather profile for high-rise building construction. J. Constr. Eng. Manag. 2016, 142. [Google Scholar] [CrossRef]
- Kwon, N.; Park, M.; Lee, H.S.; Ahn, J.; Kim, S. Construction Noise Prediction Model Based on Case-Based Reasoning in the Preconstruction Phase. J. Constr. Eng. Manag. 2017, 143. [Google Scholar] [CrossRef]
- Lee, K.P.; Lee, H.S.; Park, M.; Kim, D.Y.; Jung, M. Management-Reserve Estimation for International Construction Projects Based on Risk-Informed k-NN. J. Manag. Eng. 2017, 33. [Google Scholar] [CrossRef]
- Yap, J.B.H.; Lock, A. Analysing the benefits, techniques, tools and challenges of knowledge management practices in the Malaysian construction SMEs. J. Eng. Des. Technol. 2017, 15, 803–825. [Google Scholar] [CrossRef]
- Yap, J.B.H.; Abdul-Rahman, H.; Chen, W. Collabourative model: Managing design changes with reusable project experiences through project learning and effective communication. Int. J. Proj. Manag. 2017, 35, 1253–1271. [Google Scholar] [CrossRef]
- Yap, J.B.H.; Skitmore, M. Investigating design changes in Malaysian building projects. Archit. Eng. Des. Manag. 2018, 14, 218–238. [Google Scholar] [CrossRef]
- Yap, J.B.H.; Abdul-Rahman, H.; Wang, C. Preventive Mitigation of Overruns with Project Communication Management and Continuous Learning: PLS-SEM Approach. J. Constr. Eng. Manag. 2018, 144. [Google Scholar] [CrossRef]
- Yap, J.B.H.; Low, P.L.; Wang, C. Rework in Malaysian building construction: Impacts, causes and potential solutions. J. Eng. Des. Technol. 2017, 15, 591–618. [Google Scholar] [CrossRef]
- Abdul-Rahman, H.; Berawi, M.A.; Berawi, A.R.; Mohamed, O.; Othman, M.; Yahya, I.A. Delay mitigation in the Malaysian construction industry. J. Constr. Eng. Manage. 2006, 132, 125–133. [Google Scholar] [CrossRef]
- Alashwal, A.M.; Abdul-Rahman, H.; Radzi, J. Knowledge utilization process in highway construction projects. J. Manag. Eng. 2016, 32. [Google Scholar] [CrossRef]
- Enshassi, A.; Abdul-Aziz, A.R.; Abushaban, S. Analysis of contractors performance in Gaza strip construction projects. Int. J. Constr. Manag. 2012, 12, 65–79. [Google Scholar] [CrossRef]
- Enshassi, A.; Arain, F.; Al-Raee, S. Causes of variation orders in construction projects in the Gaza Strip. J. Civ. Eng. Manag. 2010, 16, 540–551. [Google Scholar] [CrossRef]
- Enshassi, A.; Choudhry, R.M.; El-ghandour, S. Contractors' perception towards causes of claims in construction projects. Int. J. Constr. Manag. 2009, 9, 79–92. [Google Scholar] [CrossRef]
- Enshassi, A.; Mohamed, S.; Mustafa, Z.A.; Mayer, P.E. Factors affecting labour productivity in building projects in the Gaza strip. J. Civ. Eng. Manage. 2007, 13, 245–254. [Google Scholar] [CrossRef]
- Enshassi, A.; Mohamed, S.; Abushaban, S. Factors affecting the performance of Construction projects in the Gaza Strip. J. Civ. Eng. Manag. 2009, 15, 269–280. [Google Scholar] [CrossRef]
- Enshassi, A.; Arain, F.; Tayeh, B. Major causes of problems between contractors and subcontractors in the Gaza Strip. J. Financ. Manag. Prop. Constr. 2012, 17, 92–112. [Google Scholar] [CrossRef]
- Enshassi, A.; Mohamed, S.; El-Ghandour, S. Problems associated with the process of claim management in Palestine: Contractors’ perspective. Eng. Constr. Arch. Manag. 2009, 16, 61–72. [Google Scholar] [CrossRef]
- Enshassi, A.; Kumaraswamy, M.; Jomah, A.N. Significant factors causing time and cost overruns in construction projects in the gaza strip: Contractors’ perspective. Int. J. Constr. Manag. 2010, 10, 35–60. [Google Scholar] [CrossRef]
- Enshassi, A.; Kochendoerfer, B.; Abed, K. Trends in productivity improvement in construction projects in Palestine. Rev. Ing. Constr. 2013, 28, 173–206. [Google Scholar] [CrossRef]
- Budayan, C. Evaluation of Delay Causes for BOT Projects Based on Perceptions of Different Stakeholders in Turkey. J. Manag. Eng. 2018, 35, 04018057. [Google Scholar] [CrossRef]
- Alfakhri, A.Y.; Ismail, A.; Khoiry, M.A. The effects of delays in road construction projects in Tripoli, Libya. Int. J. Technol. 2018, 9, 766–774. [Google Scholar] [CrossRef]
- Shahsavand, P.; Marefat, A.; Parchamijalal, M. Causes of delays in construction industry and comparative delay analysis techniques with SCL protocol. Eng. Constr. Archit. Manag. 2018, 25, 497–533. [Google Scholar] [CrossRef]
- Khair, K.; Mohamed, Z.; Mohammad, R.; Farouk, H.; Ahmed, M.E. A Management Framework to Reduce Delays in Road Construction Projects in Sudan. Arab. J. Sci. Eng. 2018, 43, 1925–1940. [Google Scholar] [CrossRef]
- Arditi, D.; Nayak, S.; Damci, A. Effect of organisational culture on delay in construction. Int. J. Proj. Manag. 2017, 35, 136–147. [Google Scholar] [CrossRef]
- Perera, N.A.; Sutrisna, M.; Yiu, T.W. Decision-making model for selecting the optimum method of delay analysis in construction projects. J. Manag. Eng. 2016, 32, 04016009. [Google Scholar] [CrossRef]
- Ji, Y.; Qi, L.; Liu, Y.; Liu, X.; Li, H.; Li, Y. Assessing and Prioritising Delay Factors of Prefabricated Concrete Building Projects in China. Appl. Sci. 2018, 8, 2324. [Google Scholar] [CrossRef]
- Gunduz, M.; Nielsen, Y.; Ozdemir, M. Fuzzy assessment model to estimate the probability of delay in Turkish construction projects. J. Manag. Eng. 2015, 31, 04014055. [Google Scholar] [CrossRef]
- Edwards, D.J.; Owusu-Manu, D.-G.; Baiden, B.; Badu, E.; Love, P.E. Financial distress and highway infrastructure delays. J. Eng. Des. Technol. 2017, 15, 118–132. [Google Scholar] [CrossRef]
- Doloi, H.; Sawhney, A.; Iyer, K. Structural equation model for investigating factors affecting delay in Indian construction projects. Constr. Manag. Econ. 2012, 30, 869–884. [Google Scholar] [CrossRef]
- Hasan, M.F.; Mohammed, M.S. Time overrun model for construction projects in Iraq by using fuzzy logic. Int. J. Civ. Eng. Technol. 2018, 9, 2593–2607. [Google Scholar]
- Kamanga, M.; Steyn, W. Causes of delay in road construction projects in Malawi. J. S. Afr. Inst. Civ. Eng. 2013, 55, 79–85. [Google Scholar]
- Vu, H.A.; Cu, V.H.; Min, L.X.; Wang, J.Q. Risk analysis of schedule delays in international highway projects in Vietnam using a structural equation model. Eng. Constr. Archit. Manag. 2017, 24, 1018–1039. [Google Scholar] [CrossRef]
- Ballesteros-Pérez, P.; del Campo-Hitschfeld, M.L.; González-Naranjo, M.A.; González-Cruz, M.C. Climate and construction delays: Case study in Chile. Eng. Constr. Archit. Manag. 2015, 22, 596–621. [Google Scholar] [CrossRef]
- Mpofu, B.; Ochieng, E.G.; Moobela, C.; Pretorius, A. Profiling causative factors leading to construction project delays in the United Arab Emirates. Eng. Constr. Archit. Manag. 2017, 24, 346–376. [Google Scholar] [CrossRef] [Green Version]
- Sambasivan, M.; Deepak, T.; Salim, A.N.; Ponniah, V. Analysis of delays in Tanzanian construction industry: Transaction cost economics (TCE) and structural equation modelling (SEM) approach. Eng. Constr. Archit. Manag. 2017, 24, 308–325. [Google Scholar] [CrossRef]
- Wang, T.-K.; Ford, D.N.; Chong, H.-Y.; Zhang, W. Causes of delays in the construction phase of Chinese building projects. Eng. Constr. Archit. Manag. 2018, 25, 1534–1551. [Google Scholar] [CrossRef] [Green Version]
- Islam, M.S.; Suhariadi, B.T. Construction delays in privately funded large building projects in Bangladesh. Asian J. Civ. Eng. 2018, 19, 1–15. [Google Scholar] [CrossRef]
- Khatib, B.; Poh, Y.; El-Shafie, A. Delay Factors in Reconstruction Projects: A Case Study of Mataf Expansion Project. Sustainability 2018, 10, 4772. [Google Scholar] [CrossRef]
- Larsen, J.K.; Shen, G.Q.; Lindhard, S.M.; Brunoe, T.D. Factors affecting schedule delay, cost overrun, and quality level in public construction projects. J. Manag. Eng. 2015, 32, 04015032. [Google Scholar] [CrossRef]
- Zidane, Y.J.-T.; Andersen, B. The top 10 universal delay factors in construction projects. Int. J. Manag. Proj. Bus. 2018, 11, 650–672. [Google Scholar] [CrossRef]
- Alfakhri, A.Y.; Ismail, A.; Khoiry, M.A.; Arhad, I.; Irtema, H.I.M. A conceptual model of delay factors affecting road construction projects in Libya. J. Eng. Sci. Technol. 2017, 12, 3286–3298. [Google Scholar]
- Das, D.K.; Emuze, F. A Dynamic Model of Contractor-Induced Delays in India. J. Constr. Dev. Ctries. 2017, 22, 21–39. [Google Scholar] [CrossRef]
- Parchami Jalal, M.; Shoar, S. A hybrid SD-DEMATEL approach to develop a delay model for construction projects. Eng. Constr. Archit. Manag. 2017, 24, 629–651. [Google Scholar] [CrossRef]
- Renuka, S.; Kamal, S.; Umarani, C. A model to estimate the time overrun risk in construction projects. Empir. Res. Urban Manag. 2017, 12, 64–76. [Google Scholar]
- Adam, A.; Josephson, P.-E.B.; Lindahl, G. Aggregation of factors causing cost overruns and time delays in large public construction projects: Trends and implications. Eng. Constr. Archit. Manag. 2017, 24, 393–406. [Google Scholar] [CrossRef]
- Asiedu, R.O.; Adaku, E.; Owusu-Manu, D.-G. Beyond the causes: Rethinking mitigating measures to avert cost and time overruns in construction projects. Constr. Innov. 2017, 17, 363–380. [Google Scholar] [CrossRef]
- Durdyev, S.; Omarov, M.; Ismail, S. Causes of delay in residential construction projects in Cambodia. Cogent Eng. 2017, 4, 1291117. [Google Scholar] [CrossRef]
- Oyegoke, A.S.; Al Kiyumi, N. The causes, impacts and mitigations of delay in megaprojects in the Sultanate of Oman. J. Financ. Manag. Prop. Constr. 2017, 22, 286–302. [Google Scholar] [CrossRef]
- Agyekum-Mensah, G.; Knight, A.D. The professionals’ perspective on the causes of project delay in the construction industry. Eng. Constr. Archit. Manag. 2017, 24, 828–841. [Google Scholar] [CrossRef]
- Amoatey, C.T.; Ameyaw, Y.A.; Adaku, E.; Famiyeh, S. Analysing delay causes and effects in Ghanaian state housing construction projects. Int. J. Manag. Proj. Bus. 2015, 8, 198–214. [Google Scholar] [CrossRef]
- Bekr, G.A. Causes of delay in public construction projects in Iraq. Jordan J. Civ. Eng. 2015, 159, 1–14. [Google Scholar]
- Mahamid, I.; Al-Ghonamy, A.; Aichouni, M. Research Article Risk Matrix for Delay Causes in Construction Projects in Saudi Arabia. Res. J. Appl. Sci. Eng. Technol. 2015, 9, 665–670. [Google Scholar] [CrossRef]
- Santoso, D.S.; Soeng, S. Analyzing delays of road construction projects in Cambodia: Causes and effects. J. Manag. Eng. 2016, 32, 05016020. [Google Scholar] [CrossRef]
- Kadry, M.; Osman, H.; Georgy, M. Causes of construction delays in countries with high geopolitical risks. J. Constr. Eng. Manag. 2016, 143, 1–11. [Google Scholar]
- Kim, S.-Y.; Tuan, K.N. Delay factor analysis for hospital projects in Vietnam. KSCE J. Civ. Eng. 2016, 20, 519–529. [Google Scholar] [CrossRef]
- Bagaya, O.; Song, J. Empirical study of factors influencing schedule delays of public construction projects in Burkina Faso. J. Manag. Eng. 2016, 32, 05016014. [Google Scholar] [CrossRef]
- Aziz, R.F.; Abdel-Hakam, A.A. Exploring delay causes of road construction projects in Egypt. Alex. Eng. J. 2016, 55, 1515–1539. [Google Scholar] [CrossRef] [Green Version]
- Assbeihat, J.M. Factors Affecting Delays on Private Construction Projects. Technology 2016, 7, 22–33. [Google Scholar]
- Nawi, M.N.M.N.; Lee, A. Factors influencing project delay: A case study of the vale malaysia minerals project (VMMP). Int. J. Supply Chain Manag. 2016, 5, 178–184. [Google Scholar]
- Samarghandi, H.; Mousavi, S.; Taabayan, P.; Mir Hashemi, A.; Willoughby, K. Studying the Reasons for Delay and Cost Overrun in Construction Projects: The Case of Iran. J. Constr. Dev. Ctries. 2016, 21, 51–84. [Google Scholar] [CrossRef]
- Zailani, S.; Ariffin, H.A.M.; Iranmanesh, M.; Moeinzadeh, S.; Iranmanesh, M. The moderating effect of project risk mitigation strategies on the relationship between delay factors and construction project performance. J. Sci. Technol. Policy Manag. 2016, 7, 346–368. [Google Scholar] [CrossRef]
- Al-Kharashi, A.; Skitmore, M. Causes of delays in Saudi Arabian public sector construction projects. Constr. Manag. Econ. 2009, 27, 3–23. [Google Scholar] [CrossRef] [Green Version]
- Kaliba, C.; Muya, M.; Mumba, K. Cost escalation and schedule delays in road construction projects in Zambia. Int. J. Proj. Manag. 2009, 27, 522–531. [Google Scholar] [CrossRef]
- Enshassi, A.; Al-Najjar, J.; Kumaraswamy, M. Delays and cost overruns in the construction projects in the Gaza Strip. J. Financ. Manag. Prop. Constr. 2009, 14, 126–151. [Google Scholar] [CrossRef]
- Abdul-Rahman, H.; Takim, R.; Min, W.S. Financial-related causes contributing to project delays. J. Retail Leis. Prop. 2009, 8, 225–238. [Google Scholar] [CrossRef]
- Mahamid, I.; Bruland, A.; Dmaidi, N. Causes of delay in road construction projects. J. Manag. Eng. 2011, 28, 300–310. [Google Scholar] [CrossRef]
- Kazaz, A.; Ulubeyli, S.; Tuncbilekli, N.A. Causes of delays in construction projects in Turkey. J. Civ. Eng. Manag. 2012, 18, 426–435. [Google Scholar] [CrossRef]
- Chandramohan, A.; Narayanan, S.L.; Gaurav, A.; Krishna, N. Cost and time overrun analysis for green construction projects. Int. J. Green Econ. 2012, 6, 167–177. [Google Scholar] [CrossRef]
- Yang, J.-B.; Chu, M.-Y.; Huang, K.-M. An empirical study of schedule delay causes based on Taiwan’s litigation cases. Proj. Manag. J. 2013, 44, 21–31. [Google Scholar] [CrossRef]
- González, P.; González, V.; Molenaar, K.; Orozco, F. Analysis of causes of delay and time performance in construction projects. J. Constr. Eng. Manag. 2013, 140, 04013027. [Google Scholar] [CrossRef]
- Golob, K.; Bastič, M.; Pšunder, I. Influence of project and marketing management on delays, penalties, and project quality in slovene organisations in the construction industry. J. Manag. Eng. 2012, 29, 495–502. [Google Scholar] [CrossRef]
- Alinaitwe, H.; Apolot, R.; Tindiwensi, D. Investigation into the causes of delays and cost overruns in Uganda’s public sector construction projects. J. Constr. Dev. Ctries. 2013, 18, 33. [Google Scholar]
- Marzouk, M.M.; El-Rasas, T.I. Analyzing delay causes in Egyptian construction projects. J. Adv. Res. 2014, 5, 49–55. [Google Scholar] [CrossRef]
- Wang, W.-C.; Lin, C.-L.; Wang, S.-H.; Liu, J.-J.; Lee, M.-T. Application of importance-satisfaction analysis and influence-relations map to evaluate design delay factors. J. Civ. Eng. Manag. 2014, 20, 497–510. [Google Scholar] [CrossRef]
- Yang, J.-B.; Huang, K.-M.; Lee, C.-H.; Chiu, C.-T. Incorporating lost productivity calculation into delay analysis for construction projects. KSCE J. Civ. Eng. 2014, 18, 380–388. [Google Scholar] [CrossRef]
- Yang, J.-B.; Kao, C.-K. Critical path effect based delay analysis method for construction projects. Int. J. Proj. Manag. 2012, 30, 385–397. [Google Scholar] [CrossRef]
- Chaphalkar, N.B.; Iyer, K. Factors influencing decisions on delay claims in construction contracts for Indian scenario. Constr. Econ. Build. 2014, 14, 32–44. [Google Scholar] [CrossRef] [Green Version]
- Braimah, N. Understanding construction delay analysis and the role of preconstruction programming. J. Manag. Eng. 2013, 30, 04014023. [Google Scholar] [CrossRef]
- Abdelhadi, Y.; Dulaimi, M.F.; Bajracharya, A. Factors influencing the selection of delay analysis methods in construction projects in UAE. Int. J. Constr. Manag. 2018, 19, 329–340. [Google Scholar] [CrossRef]
- Guévremont, M.; Hammad, A. Visualisation of Delay Claim Analysis Using 4D Simulation. J. Leg. Aff. Disput. Resolut. Eng. Constr. 2018, 10, 05018002. [Google Scholar] [CrossRef]
- Yang, J.-B.; Teng, Y.-L. Theoretical development of stochastic delay analysis and forecast method. J. Chin. Inst. Eng. 2017, 40, 391–400. [Google Scholar] [CrossRef]
- Yang, J.-B.; Wei, P.-R. Causes of delay in the planning and design phases for construction projects. J. Archit. Eng. 2010, 16, 80–83. [Google Scholar] [CrossRef]
- Chen, G.-X.; Shan, M.; Chan, A.P.; Liu, X.; Zhao, Y.-Q. Investigating the causes of delay in grain bin construction projects: The case of China. Int. J. Constr. Manag. 2019, 19, 1–14. [Google Scholar] [CrossRef]
- Apipattanavis, S.; Sabol, K.; Molenaar, K.R.; Rajagopalan, B.; Xi, Y.; Blackard, B.; Patil, S. Integrated framework for quantifying and predicting weather-related highway construction delays. J. Constr. Eng. Manag. 2010, 136, 1160–1168. [Google Scholar] [CrossRef]
- Project Management Institute. A Guide to the Project Managemnet Body of Knowledge (PMBOK Guide), 6th ed.; Project Management Institute: Newtown Square, PA, USA, 2017. [Google Scholar]
- Project Management Institute. Construction Extension to the PMBOK, 2nd ed.; Project Management Institute: Newtown Square, PA, USA, 2016. [Google Scholar]
- PMI. Practice Standard for Scheduling, Project Management Institute, 3rd ed.; Project Management Institute: Newtown Square, PA, USA, 2019. [Google Scholar]
- Project Management Institute. Agile Practice Guide; Project Management Institute: Newtown Square, PA, USA, 2017. [Google Scholar]
- Sepasgozar, S.M.E.; Razkenari, M.A.; Barati, K. The Importance of New Technology for Delay Mitigation in Construction Projects. Am. J. Civ. Eng. Archit. 2015, 3, 15–20. [Google Scholar] [CrossRef]
- Sepasgozar, S.M.E.; Davis, S. Digital Construction Technology and Job-site Equipment Demonstration: Modelling Relationship Strategies for Technology Adoption. Buildings 2019, 9, 158. [Google Scholar] [CrossRef]
- Sepasgozar, S.M.; Lim, S.; Shirowzhan, S. Implementation of Rapid As-built Building Information Modelling Using Mobile LiDAR. In Proceedings of the ASCE Construction Research Congress 2014, Construction in a Global Network, Atlanta, Georgia, 19–21 May 2014. [Google Scholar]
- Shirowzhan, S.; Sepasgozar, S.M.; Li, H.; Trinder, J.; Tang, P. Comparative analysis of machine learning and point-based algorithms for detecting 3D changes in buildings over time using bi-temporal lidar data. Autom. Constr. 2019, 105, 102841. [Google Scholar] [CrossRef]
- Shirowzhan, S.; Sepasgozar, S.M.E.; Li, H.; Trinder, J. Spatial compactness metrics and Constrained Voxel Automata development for analyzing 3D densification and applying to point clouds: A synthetic review. Autom. Constr. 2018, 96, 236–249. [Google Scholar] [CrossRef]
- Shirowzhan, S.; Trinder, J. Building classification from lidar data for spatio-temporal assessment of 3D urban developments. Procedia Eng. 2017, 180, 1453–1461. [Google Scholar] [CrossRef]
- Shirowzhan, S.; Lim, S.; Trinder, J. Enhanced autocorrelation-based algorithms for filtering airborne lidar data over urban areas. J. Surv. Eng. 2016, 142, 04015008. [Google Scholar] [CrossRef]
- Shirowzhan, S.; Lim, S. Autocorrelation statistics-based algorithms for automatic ground and non-ground classification of Lidar data. In Proceedings of the ISARC. International Symposium on Automation and Robotics in Construction, Sydney, Australia, 9–11 July 2014; Vilnius Gediminas Technical University, Department of Construction Economics: Vilnius, Lithuania, 2014. [Google Scholar] [CrossRef]
- Sepasgozar, S.M.; Forsythe, P.J.; Shirowzhan, S. Scanners and Photography: A Combined Framework. In Proceedings of the 40th Australasian Universities Building Education Association (AUBEA) 2016 Conference, Cairns, Australia, 6–8 July 2016; Central Queensland University: Cairns, Australia, 2016. [Google Scholar]
- Tahmasebinia, F.; Niemelä, M.; Ebrahimzadeh Sepasgozar, S.; Lai, T.; Su, W.; Reddy, K.; Shirowzhan, S.; Sepasgozar, S.; Marroquin, F. Three-Dimensional Printing Using Recycled High-Density Polyethylene: Technological Challenges and Future Directions for Construction. Buildings 2018, 8, 165. [Google Scholar] [CrossRef]
- Sepasgozar, S.M.; Davis, S.R.; Li, H.; Luo, X. Modelling the Implementation Process for New Construction Technologies: Thematic Analysis Based on Australian and US Practices. J. Manag. Eng. 2018, 34, 05018005. [Google Scholar] [CrossRef]
- Sepasgozar, S.M.; Davis, S. Construction Technology Adoption Cube: An Investigation on Process, Factors, Barriers, Drivers and Decision Makers Using NVivo and AHP Analysis. Buildings 2018, 8, 74. [Google Scholar] [CrossRef]
- Sepasgozar, S.M.; Davis, S.R.; Loosemore, M. Dissemination Practices of Construction Sites’ Technology Vendors in Technology Exhibitions. J. Manag. Eng. 2018, 34, 04018038. [Google Scholar] [CrossRef]
- Sepasgozar, S.M.; Davis, S.; Loosemore, M.; Bernold, L. An investigation of modern building equipment technology adoption in the Australian construction industry. Eng. Constr. Archit. Manag. 2018, 25, 1075–1091. [Google Scholar] [CrossRef]
- Sepasgozar, S.M.E.; Loosemore, M. The role of customers and vendors in modern construction equipment technology diffusion. Eng. Constr. Archit. Manag. 2017, 24, 1203–1221. [Google Scholar] [CrossRef]


| Term/ Concept | Definition |
|---|---|
| Delay/Time Overruns | The difference between estimated and actual completion time [5], also known as time overrun [6] or extended time [7], mainly due to contractor, owner, or joint of all stakeholders tasks and actions [8]. |
| Cost Overruns | The difference between estimated and actual cost results in increasing the total project cost, also known as budget overrun, due to unforeseen costs or underestimation of task’s actual cost [9]. |
| Scheduling | A control structure based on planning and dispatching [10]. |
| PMBOK | Project Management Body of Knowledge (PMBOK) guide, including principals and knowledge required for project management [11]. |
| Construction Extension | Focuses on construction projects by providing supplemental knowledge about project health, safety, security, and environmental management and project financial management and good practices. |
| PMI Scheduling Standards | Project Management Institute (PMI) refers to good practice methods for scheduling. Good practices are based on a general agreement on appropriate use of skills, tools, and techniques for enhancing the success chances of different projects. |
| Microsoft (MS) Projects | A tool for project planning and control [12]. |
| Primavera | A tool for scheduling and project risk analysis [13]. |
| Building Information Model (BIM) | Both Building Information Modelling (BIM) and Geographic Information Systems (GIS) [14] are analytical and visualisation systems. BIM is used for designing and sharing collaboratively generated rich data [15]. |
| Geographic Information System (GIS) | Both Building Information Modelling (BIM) and Geographic Information Systems (GIS) [14] are analytical and visualisation systems. GIS is used for map processing, database visualisation, and spatial analysis and can be integrated with other systems [16,17]. |
| Risk Analysis | Analysis of adverse events at different stages, including planning and programming, to enrich decisions [18]. |
| Integrated Project Delivery (IPD) | Integrated Project Delivery (IPD) intends to increase the success of a project by addressing waste and inefficiency issues and adversarial relations in construction [19]. |
| Delay cases reported in the literature | Evidence of delay in percentage |
|---|---|
| UK: (1) 2017; construction projects in general [20]; (2) 1993-1994; government construction projects [21]; (3) 2001; government construction projects [22] | (1) About 30% of projects were delayed [20]; (2) the average time overrun was 23.2% [21]; (3) 70% of projects were delayed [22]. |
| 109 senior leaders of public and private organisations from across the globe, 26% from public bodies such as government agencies with the remainder represented by private enterprises [23] | (1) Just 25% of construction projects came within 10% of their original deadlines [23] |
| Philippines: 2010–2017; public–private partnership (PPP) projects | 92.8% of projects were delayed [24]. |
| Malaysia: (1) 2005; government contract projects [25]; (2) 2010–2014; Kuala Lumpur Airport Terminal 2 [26] | (1) 17.3% were delayed for over 3 months. [25]; (2) caused extra USD $2 billion to the final costs [26]. |
| Oman: 2010–2013; A major public organisation | 62% within their schedule [27]. |
| Africa: (1) 2009–2012; Rwanda; public [28]; (2) 2000–2011; Ghana; roads [29]; (3) 1999–2005; Benin [30]; (4) 1970– 1998; Ghana; groundwater construction [30] | (1) 65.7% of projects were delayed [28]; (2) 70% were delayed for average of 17 months [29]; (3) 22% of projects were delayed for more than 2 years [30]; (4) 70% of projects were delayed [30]. |
| India: 2012; central sector infrastructure projects | Approximately 57% of projects were delayed [31]. |
| UAE: 1995–2005; construction projects in general | 50% of projects were delayed [32]. |
| Saudi Arabia: (1) 2004; private and public projects [6]; (2) construction of water and sewage works [33] | (1) 70% of projects were delayed from 10% to 30% of estimated time [6]; (2) time overrun decreased from 59% in 1994 [33] to 40% in 2004 [34]. |
| Iran: (1) projects for government [35]; (2) Khuzestan steel company [36] | (1) The percentage of delay in 2001, 2002 and 2003 were respectively 30%, 74.5% and 75%. [35]; (2) the project duration is approximately 150% of project estimated duration [36]. |
| US: (1) general projects of US and England [37]; (2) 2001; highway projects [38] | (1) Projects were respectively delayed for 2.5 weeks and approximately a month [37]; (2) the time overrun of projects was 25% of their contract duration [38]. |
| Kuwait: 1990–2000; private residential housing projects [39] | 56% of projects were delayed, approximately 54% were delayed for four months or more, and 30% were delayed for more than six months [39]. |
| Nigeria: (1) 1991–1996; housing projects [40]; (2) 2000; most projects in Lagos city [41] | (1) 70% were delayed and caused 51.51% cost overrun [40]; (2) time overrun was in average 51% of the predicted duration [41]. |
| Jordan: 1990–1997; public construction projects [42] | 81.5% of projects were delayed [42]. |
| Hong Kong: (1) 1990–1993; government projects [43]; (2) 1990–1993; private sector projects | (1) Only 40% within schedule [43]; (2) only 23% within schedule [43]. |
| Western Canada: civil, institutional, high rise apartment building, and petrochemical | Several cases of 24 projects were delayed more than 100% of contract duration [44]. |
| Indonesia | 38% of projects were delayed [37]. |
| Projects of 20 nations (Europe, North America, and other); during last 70 years; rail, fixed link (bridges and tunnels), and road | Time and cost overruns were, on average, 70% and 28%, respectively [45,46]. |
| Rich democracies (Denmark, Germany, Japan, South Korea, Netherlands, Norway, Spain, Sweden, UK, and US); during last three decades; infrastructure projects | Average schedule overrun of projects was 42.7% [47]. |
| Focus of the Study, Location, and Sector | Method; Sample Size and Participants | Number of Examined Delay Factors and List of the Selected Factors Identified |
|---|---|---|
| Prioritize delay factors [76], China, prefabricated concrete building | Questionnaire; 30; academics, clients, contractors, and government. | 24, inexperienced workforce, shortage of structural connections for prefabricated components, poor communication among participants, and low productivity. |
| Comparative delay analysis techniques with the Society of Construction Law’s (SCL) protocol [72], Iran | Questionnaire; 175; clients, consultants, and contractors | 78, client-related causes, labour and equipment causes, contractor-related causes, material-related causes, design-related causes, external causes, and consultant-related causes. |
| Fuzzy assessment model to estimate the probability of delay [77], Turkey, public and private | Interviews questionnaire; 64; consultants, contractors employees, and designers | 83, inexperienced contractor, poor project planning and scheduling, weak supervision and site management, changes in design, unreliable subcontractors, inexperienced labour, changes in orders, slowness in site delivery, late design documents approval, delay in payment, material delivery, weak communication and coordination between parties, and unqualified team. |
| Finance and delays [78], Ghana, highway project | Questionnaire; 78 | Payment, project financing, cash flow, economic issues, project planning, and cost control. |
| Structural equation model for investigating factors affecting delay [79], India, public | Questionnaire; 77; clients, contractors and designers or architects | Delayed approval, design and scope changes, poor protocol and subcontractor changes, technical ability of head contractor, scheduling, labour productivity, weather conditions, proper planning and controlling of projects. |
| Time overrun model by using fuzzy logic [80], Iraq, private and government sectors | Questionnaire; 90, owners, consultants, supervising engineers and contractors | 73, problems in funding (75%); poor site management (66%); weak project planning (58%). Owner: values of contract (70%); late decision-making (63%); contract duration (61%). Consultant: design delays and design mistakes (46%); improper design management (45%). External: topographic characteristics of site (41%). |
| Causes of delay [81], Malawi, road | Questionnaire; 45; clients, contractors and consultants | 72, inadequate fuel, inadequate contractor cash-flow, inadequate foreign currency, payment, inadequate equipment, inadequate materials, inadequate technical workforce, and site mobilization slowness. |
| Prioritize delay factors [30], Benin, public projects: departmental hospital, school, administration office | Questionnaire; 175; contractor, owner, consultant and architect | 35, financial difficulties, subcontractor’s weak performance, material provision, drawing changes, scheduling by contractor, late inspections by the consultant, unavailability of equipment by contractor, and acceptance of improper design drawings. |
| Causes of delay [36], Khuzestan, Iran, steel company | Questionnaire; 35; owners, consultants and contractors | 89, financial issues are the major delay factors, as well as drilling allowance, long administrative cycle to renew, and steady production of steel. |
| Risk analysis of schedule delays using a structural equation model [82], Vietnam, highway projects | Questionnaire; 246; project managers, supervisors, from contractors and owners | 50, financial issues, policies and weakness of laws, competence of project management, financial ability and management of contractor, competence of design team, sub-contractor’s selection and management, economical changes, and competence of supervision team. |
| Delay causes for BOT Projects [70], Turkey, public–private partnership projects (PPP) | Workshop; 11; consultants, the private sector, and the public sector | Uncertainties and changes, regulation variation, budget shortage, changes in orders, changes in urban plan, changes in policy and regulations, lack of bidder, inadequate laws about usage of land, finance. |
| Climate and construction delays [83], Chile, bridge | Case study; 6; bridges | A method for risk managers to address climatic agents and required extra time to minimize adverse weather conditions and time delays. |
| Profiling causative factors leading to delays [84], UAE | Questionnaire; 208; clients, consultant and contractors | 180, unreal duration imposed by clients, unfinished design, change orders, scheduling, weak project control, slow permission process from authorities, low labour productivity, delays in decisions, poor site management. |
| Analysis of delays using transaction cost economics (TCE) approach [85], Tanzania | Questionnaire; 400; clients, contractors and consultants using Structural Equation Modelling | 36, finance shortage, weak planning, weak site management, unavailability of material, unpredicted site condition, delays in test approvals, preparation of drawings, communication between parties, skills shortage, availability of equipment. |
| Focus of the Study, Location, and Sector | Method; Sample Size and Participants | Number of Factors Measured and Findings |
|---|---|---|
| Delay analysis [86], China, Beijing, Shanghai, Chongqing and Shenzhen, Design-bid-build projects | Questionnaire; 115; clients, consultants, and contractors | 37, delayed payments, low bids, weak performance of subcontractors, and communication issues. Comparative analysis shows difficulty in claiming penalty and unreasonable upfront capital demanded by client. |
| Delays [87], Bangladesh, privately funded large building | Interviews; 70; stakeholders | Lack of experienced managers, lowest bidder, shortage of fund, scheduling, lack of skilled labour, site constraints, weak cost control, and contractor cash flow problem. |
| Delay Factors [88], Mataf, Mecca, Saudi Arabia, reconstruction project | Interviews; 14; project and construction managers and senior site engineers | Building material, rerouting electrical and mechanical utilities, safe access, conditions of site, taking down archaeological and antiquity elements, back-propping works, design changes, conflict between workforce. |
| Schedule delay [89], Denmark, public | Questionnaire; architects, surveyors | 26, improper funding cost, mistakes or negligence in consultant material quality, and mistakes. |
| A framework to reduce delays [73], Sudan, road | Questionnaire; 100; people engaged in construction | 66, using qualified and experienced managers, using suitable and enough tools and equipment, and suitable technical planning before starting the projects. |
| The effect of delays [71], Libya, Tripoli, road | Questionnaire; 256; stakeholders | Identified effects are time overrun, cost overrun, and blockage of economic and country development. |
| The top 10 universal delay factors [90], Norway, hospitals, schools, hotels, etc. | Questionnaire; 202; clients, contractors and consultants | Weak scheduling, poor decision process, internal administrative procedures and bureaucracy, poor resources, weak parties’ communication, slow inspection, changes, parties’ lack of commitment and goals. |
| A model of delay factors [91], Libya, road | Questionnaire; 256; stakeholders | 59, delays in utility services (such as power lines, water, etc.), project budget difficulties, short duration, delayed payments, and subsurface condition impacts conditions. |
| A dynamic model of contractor-induced delays [92], India, buildings, roads, bridges, railways, power plants, and industrial complex projects | Questionnaire; 100; Project managers, architects, engineers, designers, consultants, surveyors, contractors, and owners | Project financial difficulties, improper planning and scheduling, contractor’s poor communication and coordination, conflict between parties and use of improper methods for construction, providing enough project finances and cash flow, proper planning and scheduling, using proper methods for construction, and considering the reworks in the schedule. |
| A hybrid System Dynamics- Decision Making Trial and Evaluation Laboratory (SD-DEMATEL) approach to develop a delay model [93], Iran | Questionnaire; 63; consultants, contractors, and clients | 58, reworks, suspension of construction, delayed payment, poor project planning and scheduling, labour’s low productivity, changes in orders, and construction mistakes, costs of implementation, acceleration in conduction of biding, and notification of contract and schedule pressure. |
| Time overrun risks [94], India, residential, industrial, and commercial | Questionnaire; 112; project managers | 31, identified factors are manpower (21% of contribution), materials (18% of contribution), and scheduling and control related problems (18% of contribution). |
| Aggregation of factors causing cost overruns and time delays: trends and implications [95], large public projects | Analysis of a literature selection | Poor communication, late payment, weak controlling, delays in decisions, changes in order, reworks, weak labour and material planning, equipment shortage, project complexity, psychological positive interest, fraud, bad weather conditions, and ground conditions. |
| Beyond the causes: rethinking mitigating measures to avert cost and time overruns [96], Ghana, public | Check list; 7; quantity surveyors, architects, and engineers | 9, financial limitation by government, weak supervision and project planning, change orders, insufficient allowance of contingency, weak administration of contract, qualifies team of project, poor coordination, risk related to cultural and political issues. |
| Causes of delay [97], Cambodia, residential | Questionnaire | 31, materials shortage, unreal scheduling, late material delivery, labour shortage, project complexity, delayed payment, weak site management, delay by subcontractor, and accidents because of weak site safety. |
| Organisational culture in delay [74], US and India | Questionnaire; 84; contractors | 6, Indian: market culture, large delay due to contractors. US: clan culture, less delay due to owners. |
| Exploring critical delay factors [29], Ghana, road | Questionnaires; 123; stakeholders and site staff | Delayed payment, inexperienced contractor, scope changes, delayed furnish and site delivery to the contractor, and inflexible funding. |
| The causes, impacts and mitigations of delay [98], Oman, Sultanate, megaprojects | Questionnaire; 53; clients, consultants, and contractors | 75, low bid, main contractor’s financial condition, delays in making decisions by client, and weak planning by the main contractor. Effects are extra cost and time overrun. Mitigation: experienced contractors and consultant, proper planning, and suitable supervision. |
| The professionals’ perspectives on the causes of project delay [99], UK, all sectors | Interviews; 41; seniors of developers, consultants, clients, and contractors | 32, insufficient planning, poor information flow and communication, poor decisions, ineffective management, poor control, financial problems, unclear scopes, design problems, inappropriate risks transfer, lack of knowledge and competence, health and safety restrictions, poor resources and logistics management |
| Analyzing delay causes and effects [100], Ghana, state housing | Questionnaire; 31; architects, surveyors, engineers, managers, land economists | Delayed payment to contractor or supplier, inflation and price fluctuation, price growth in materials, insufficient funds of sponsors or clients, changes in orders, and weak financial or capital market. Identified effects are cost overrun, time overrun, litigation, discontinuity by client, and arbitration. |
| Causes of delay [27], Gulf cooperation council countries (Oman), oil and gas industry | Questionnaire; 59; clients, contractors, and consultants | 44, weak supervision, contractor’s insufficient planning and scheduling, delay in delivery of materials, poor communication among project parties, and weak interaction with vendors. Suggested to validate findings. |
| Causes of delay [101], Iraq, public | Questionnaire; 134; clients, contractors, and consultants | 65, safety measures, laws and bureaucracy variations by government, holidays, lowest bidder weak performance, changes in design by owner and consultants, delayed payments by the owner, problems with local community, inexperienced owner in construction and economic and local and global conditions. |
| Risk matrix for delay Causes [102], Saudi Arabia | Questionnaire; 51; consultants | 35, lower bid, changes in material, management of contract, contract duration, fluctuations in materials’ price, changes in design, weak planning, pressure of inflation. |
| Analyzing delays: causes and effects [103], Cambodia, road | Questionnaire; 153; contractor and consultant | 64, working during rainy season, flooding, effect on people’s land, lowest bidder selection, repeated breakdowns of equipment, weak site arrangement. |
| Causes of delays [104], countries with high geopolitical risks, power transmission lines, infrastructure (utilities) and roadway | Window delay analysis method (detailed review of 36 projects), interviews with 18 experts | Extreme weather, site blockage, corruption, war, labour’s low productivity, custom clearance issues, changing in route of supply chains, materials stealing; natural dangers, late approvals, change orders, design mistakes, obscure work scope, cash flow, rental equipment inadequacy, delays in site ownership, inadequate owner’s site utilities, changing in supply chains. |
| Delay factor analysis [105], Vietnam, hospital | Questionnaire; 197 | 35, financial difficulties, absence of responsibilities, changes in design, and inexperienced contractor. |
| Empirical study of factors influencing schedule delays [106], Burkina Faso, public | Questionnaire; 140; clients, contractors, and consultants | 27, contractor’s financial ability, owner’s financial difficulties, availability of equipment by contractor, delayed payment for finished work, and weak performance of subcontractor. |
| Exploring delay causes [107], Egypt, road | Questionnaire; 186; consultants, contractors, and engineers | 293, political situations, segmentation of the west bank and limited movements between areas, award project to lowest bid price, progress payment delay by owner, and shortage of equipment. |
| Factors affecting delays [108], Jordan, private | Questionnaire; 120; stakeholders | 45, manpower shortage, late approvals, materials shortage, and relation between different subcontractors. |
| Delay factors [109], Malaysia, Perak, Vale minerals project | Interviews; 10; contractor and client staff | Weak communication, slowness of material delivery, wrong selection of contractor, low productivity, weak management, and equipment mobilization. |
| Delay and cost overrun [110], Iran | Questionnaire; 86 | Regulation (31%), owners (27%), consultant (25%), and contractor (17%). |
| Risk and relationship between delay factors [111], Malaysia | Questionnaire; 212; stakeholders | Environmental issues, resource issues, and coordination issues. Suggests longitudinal study and specific infrastructure projects. |
| Causes of delays [112], Saudi Arabia, public | Questionnaire; 86; stakeholders | 112, finance issues, non-payment for contractor claims, inexperienced contractor, weak scheduling, delay in decisions and approvals, lack of material and labours. |
| Cost escalation and schedule delays [113], Zambia, road | Questionnaire; 60; stakeholders | Finance difficulties, economic and payments problems, materials preparation, contract and drawing changes, inadequate staffing and equipment, weak supervision. |
| Delays and cost overruns [114], Gaza Strip | Questionnaire; 114; stakeholders | 110, strikes and closures of border, shortages of materials in markets and in delivery to the site. |
| Financial-related causes contributing to project delays [115], Malaysia | Questionnaire and interviews; 110; stakeholders | Cash flow, inadequate financial resources, loan gaining difficulties, and inflation. |
| Causes of delay [116], Palestine, road | Questionnaire; 64; contractors and consultants | 52, political situation, lowest bidder, payment and inadequate equipment; improper ground condition, inadequate controllers, unsuitable design, natural hazards. |
| Causes of delays [117], Turkey | Questionnaire; 71; project managers and site managers | 34, changes in design and material, delayed payments, problems in cash flow, contractor’s problems in finance, and low labour productivity. |
| Cost and time overrun analysis [118], India, green construction projects | Questionnaire; 17; Leadership in Energy and Environmental Design (LEED) professionals and other green experts | 34, risks associated with reduced site disturbance, innovative waste water technologies, renewable energy, waste management, indoor chemical and pollutant source control, and LEED™ accredited professional. |
| Schedule delay causes [119], Taiwan | Case study; 79 litigation cases | Change in orders and scopes, late handover of site, and weather. |
| Time performance [120], Santiago, Chile | Residential case study; 2 | Planning, subcontract, materials, labour, design, execution, and weather. |
| Delays, penalties, and project quality [121], Slovenia | Phone interviews; 30; managers, questionnaire | Suggests connecting the function of marketing with project management, but it reports that marketing management does not minimize fines and delays. |
| Causes of delays and cost overruns [122], Uganda, public | Interview, case study; questionnaire; 247; stakeholders | Variations in work scope, delays in payments, weak control and monitoring, capital’s high cost, political fluctuation, and insecurity. |
| Analyzing delay causes [123], Egypt | Questionnaire; 33; stakeholders | 43, material, cost, and currency variations, financial, site condition, inexperienced consultants, financing, low productivity, incompetent workforce, and change orders. |
| Design [124], Taiwan, high-tech facility | Questionnaire; 36; engineers managers | 21, decision making and budget constraints, design duration. |
| Causes of delays [35], Iran | Questionnaire; 84; stakeholders | 28, financial issues, inappropriate planning, site and contract management, and poor communication |
| Focus of the Study, Location, and Sector | Method; Sample Size and Participants | Number of Factors Measured and Findings |
|---|---|---|
| Productivity and delay analysis [125] | A new method and a case study | This article proposes a method that is a tool for calculating the schedule impacts that happen when there is a problem in lost productivity. |
| Critical path effect based delay analysis method [126] | Hypothetical case studies | Analysis effects of delays on the critical path that performs delay analysis accurately and uses a process-based analysis approach to solve simultaneous delays. |
| Factors influencing delay claims [127], India | Arbitration awards, court cases, and professionals | Improper design and owner’s neglect, changes in orders, weather and site conditions, delayed delivery, economic conditions, and quantity growth. |
| Understanding construction delay analysis and the role of preconstruction programming [128], UK | In-depth interview; experienced construction planning engineers | Complexity, cost, and time. Emphasizes the importance of baseline programs for resolving delay claims. |
| Factors influencing the selection of delay analysis method [129], UAE, a hotel, an international school complex, a highway, sewage treatment plant, and a residential tower | Interviews; 8; experts; limited to case studies in the period of 2007–2012 | Client’s attitude, experience of the delay analyst, reputation and neutrality of the delay analyst, project complexity, and cost and timing of performing the analysis. Time Impact analysis (TIA) and Impacted as Planned (IAP) are two commonly used Delay Analyzing Methods DAMs. The ethnographical approach is suggested, since it provides the opportunity to capture real and live states of knowledge on the selection and the use of DAMs. |
| Visualisation of delay claim analysis using 4D simulation [130] | This article shows that 4D simulation is a reliable method for analyzing delay claim. | |
| Stochastic delay analysis and forecast method [131] | Shi’s method | This article proposes the Stochastic Delay Analysis and Forecast (SDAF) method, which is an informative analytical method and predicts the effect of a single activity’s delay with probability for overall project delay. |
| Decision-making model for selecting the optimum method of delay analysis [75], UAE, Dubai | Semi structured interviews and questionnaire; 74; contactors and consultants | This article proposes the Digital Multimeter (DMM) objective tool, which can reduce the potential for disputes and conflicts arising from delays in construction projects. |
| Factors | India | Bangladesh | Saudi Arabia | Iraq | Turkey | Iran | UAE | Oman | Jordan | Palestine | |||||||||||||
|---|---|---|---|---|---|---|---|---|---|---|---|---|---|---|---|---|---|---|---|---|---|---|---|
| 18 [92] | 20 [94] | 26 [74] | 66 [79] | 76 [127] | 6 [87] | 7 [88] | 41 [102] | 54 [112] | 13 [80] | 38 [101] | 15 [70] | 40 [77] | 63 [117] | 19 [93] | 51 [110] | 44 [36] | 30 [84] | 37 [27] | 32 [98] | 49 [108] | 56 [114] | 62 [116] | |
| Scheduling issues | + | 3 | 2 | 5 | + | + | 7 | 2 | 4 | 1 | 4&5 | 3 | 4 | 4 | |||||||||
| Payment delay | + | + | 6 | 6 | 2 | 3 | 4 | ||||||||||||||||
| Design changes | 1 | 1 | 1 | + | 5 | + | 4 | 1 | 8 | ||||||||||||||
| Manpower issues | 1 | 6 | + | + | 7 | 10 | 8 | 1 | |||||||||||||||
| Financing difficulties | + | 4 | + | 3 | 3 | 1 | |||||||||||||||||
| Poor supervision | 1&4 | + | 3 | 3 | 12 | 9 | 1 | ||||||||||||||||
| Lack of materials | 2 | 5 | 5 | 5 | 3 | 2 | |||||||||||||||||
| Contractor cash flow | 10 | + | 1 | 4 | 5 | 3 | 2 | ||||||||||||||||
| Poor communication | + | + | 6 | ||||||||||||||||||||
| Owner cash flow | 3 | + | |||||||||||||||||||||
| Subcontractors | 6 | 6 | 2 | 2 | 4 | ||||||||||||||||||
| Change orders | 4 | + | 9 | 6 | 3 | ||||||||||||||||||
| Equipment issues | 5 | 14 | 5 | ||||||||||||||||||||
| Natural risks | 5 | 2 | 8 | ||||||||||||||||||||
| Labour productivity | 2 | + | 5 | 5 | 6 | ||||||||||||||||||
| Culture and politics | + | 1 | 1&2 | ||||||||||||||||||||
| Approval delays | 1 | 4 | + | 7 | 4 | 6 | 2 | ||||||||||||||||
| Resources shortage | 3 | 1 | |||||||||||||||||||||
| Economic conditions | 9 | ||||||||||||||||||||||
| Lowest bidder | 2 | + | 1 | 3 | |||||||||||||||||||
| Design problems | 1 | ||||||||||||||||||||||
| Delay in site delivery | 1 | + | 10 | ||||||||||||||||||||
| Late change issues | 2 | 2 | |||||||||||||||||||||
| Contract issues | + | 2 | 4 | ||||||||||||||||||||
| Security | 2 | 1 | |||||||||||||||||||||
| Inflationary issues | + | 10 | |||||||||||||||||||||
| Lack of protocol | 1 | ||||||||||||||||||||||
| Inaccurate pricing | + | 4 | + | 6 | |||||||||||||||||||
| Cost control | 9 | 10 | |||||||||||||||||||||
| Estimation issues | 7 | 5 | 1 | ||||||||||||||||||||
| Factors | Cambodia | Malaysia | Taiwan | Palestine | China | Vietnam | ||||||||
|---|---|---|---|---|---|---|---|---|---|---|---|---|---|---|
| 24 [97] | 42 [103] | 50 [109] | 52 [111] | 57 [115] | 59 [132] | 67 [119] | 56 [114] | 62 [116] | 3 [76] | 5 [86] | 29 [133] | 31 [82] | 46 [105] | |
| Scheduling issues | 2 | 1 | ||||||||||||
| Payment delay | 7 | 10 | 2 | 4 | 1 | |||||||||
| Design changes | 2 | 2 | 5 | |||||||||||
| Manpower issues | 4 | 9 | 1 | 4 | ||||||||||
| Financing difficulties | 3&6 | + | ||||||||||||
| Poor supervision | 8 | 7 | 5 | 3 | 8 | |||||||||
| Lack of materials | 3&1 | 2 | 2 | |||||||||||
| Contractor cash flow | 4 | |||||||||||||
| Poor communication | 1 | 3 | 2 | 4 | 2 | |||||||||
| Owner cash flow | 5 | 1 | ||||||||||||
| Subcontractors | 9 | 3 | 3 | |||||||||||
| Change orders | 1&4 | 1 | ||||||||||||
| Equipment issues | 5 | 1 | ||||||||||||
| Natural risks | 2 | 1 | 4 | |||||||||||
| Labour productivity | 11 | 4 | 3 | |||||||||||
| Culture and politics | 1 | 1&2 | ||||||||||||
| Approval delays | ||||||||||||||
| Resources shortage | 6 | 2 | ||||||||||||
| Economic conditions | 7 | |||||||||||||
| Lowest bidder | 4 | 3 | 2 | |||||||||||
| Design problems | ||||||||||||||
| Delay in site delivery | 3 | |||||||||||||
| Late change issues | ||||||||||||||
| Contract issues | ||||||||||||||
| Security | 10 | |||||||||||||
| Inflationary issues | 7 | |||||||||||||
| Lack of protocol | 2 | |||||||||||||
| Inaccurate pricing | ||||||||||||||
| Cost control | ||||||||||||||
| Estimation issues | ||||||||||||||
| Factors | Sudan: 1 [73] | Libya; 17 [91] | Norway; 12 [90] | Tanzania; 22 [85] | Ghana | US | UK; 33 [99] | Chile [120] | Egypt | Burkina Faso; 47 [106] | Zambia; 55 [113] | Denmark; 8 [89] | Malawi; 69 [81] | Benin; 70 [30] | Uganda; 72 [122] | |||||
|---|---|---|---|---|---|---|---|---|---|---|---|---|---|---|---|---|---|---|---|---|
| 23 [96] | 27 [29] | 36 [100] | 28 [78] | 26 [74] | 61 [134] | 48 [107] | 73 [123] | |||||||||||||
| Scheduling issues | + | 2 | 2 | + | 1 | 1 | 6 | |||||||||||||
| Payment delay | 4 | 1 | 1 | + | 4 | 3 | 4 | 1 | 4 | 2 | ||||||||||
| Design changes | + | 3 | 5 | 10 | 9 | 5 | 1 | |||||||||||||
| Manpower issues | 3,5 | 9 | 6 | 4 | 9 | 7 | 9 | |||||||||||||
| Financing difficulties | 1 | 2 | 1,4 | 5 | 5 | + | 6 | 1 | 4 | |||||||||||
| Poor supervision | 2 | 3 | 2 | 4 | 9 | |||||||||||||||
| Material issues | 4 | 3 | 1 | 5 | 7 | 4 | ||||||||||||||
| Change orders | + | 3 | 8 | 5 | 2 | 9 | ||||||||||||||
| Contractor’s financial problems | 9 | + | 7 | 1 | 2 | 2 | 1 | |||||||||||||
| Poor communication | 4 | + | 8 | 7 | 2 | 11 | ||||||||||||||
| Owner’s financial problem | 1 | 4 | + | 3 | 2 | 2 | 2 | |||||||||||||
| Subcontractors | 2 | 5 | 3 | |||||||||||||||||
| Equipment issues | 10 | 5 | 3 | 8 | 5 | 8 | ||||||||||||||
| Approval delays | + | 6 | 7 | |||||||||||||||||
| Natural risks | 5 | + | 6 | |||||||||||||||||
| Labour productivity | 8 | |||||||||||||||||||
| Culture and politics | 8 | + | 5 | |||||||||||||||||
| Resources shortage | + | 5 | ||||||||||||||||||
| Economic conditions | + | 2 | 2 | 4 | 3 | |||||||||||||||
| Lowest bidder | 3 | |||||||||||||||||||
| Delay in site delivery | 4 | |||||||||||||||||||
| Drawing issues | + | 7 | 6 | |||||||||||||||||
| Contract issues | 5 | 3 | ||||||||||||||||||
| Security | ||||||||||||||||||||
| Inflationary issues | 2 | |||||||||||||||||||
| Lack of protocol | + | 10 | ||||||||||||||||||
| Inaccurate pricing | ||||||||||||||||||||
| Controlling | 5 | 3 | ||||||||||||||||||
| Estimation issues | 3 | |||||||||||||||||||
| Issue (Cause) | Description | Source (Article) | Reference | Frequency * | Median |
|---|---|---|---|---|---|
| Scheduling | Improper resource planning, inaccurate budgeting, procurement, unreal scheduling | 81 | 1769 | 25 | 2 |
| Payment delay | Delays in payment to labours/contractor | 58 | 764 | 21 | 3.5 |
| Design | Design and scope changes/lack of clarity (by owner, contractor, or architect) | 77 | 1697 | 20 | 3.5 |
| Manpower issues | Using unqualified personnel, lack of skilled workers/designers, poor qualification of the technical staff, staffing problems | 70 | 990 | 20 | 6 |
| Financing and cash flow | Cash flow problems, inflexible funding, insufficient contingency allowance, loan gaining problems, financial disputes, capital high costs, penalties | 60 | 466 | 19 | 3.5 |
| Supervision | Lack of experienced construction managers, poor supervisor | 53 | 281 | 18 | 4 |
| Material | Material change, late delivery, unavailability and lack of materials | 76 | 1358 | 16 | 3 |
| Change order | Design problems (by owner or others) | 18 | 54 | 16 | 3 |
| Contractor’s financial problems | Cash flow/funding problems | 15 | 4 | ||
| Communication | Poor coordination, poor team working | 59 | 357 | 15 | 2 |
| Owner’s financial problems | Cash flow/funding problems | 12 | 3 | ||
| Subcontractor | Unreliability, delays, being inexperienced | 56 | 361 | 11 | 4 |
| Equipment | Using inappropriate and inadequate tools and equipment, … | 69 | 888 | 11 | 5 |
| Approval | Approval delays in submission and inspection process of design, materials, completed work | 67 | 366 | 11 | 5 |
| Natural risks | Natural dangers (environmental related issues, extreme weather conditions, flooding, precipitation, temperature, soil temperature, and wind velocity) | 33 | 77 | 10 | 5 |
| Labour productivity | - | 41 | 124 | 10 | 2 |
| Culture and politics | Organisational culture, war, strikes and closures of border, political fluctuations, restricted movement between areas | 55 | 510 | 8 | 6 |
| Resources | Resources shortage, inadequacy/delays in human resources, material and equipment thefts | 75 | 617 | 7 | 3 |
| “Economic” conditions | Local or global economic, cost and currency variations, inadequate foreign currency to import materials and equipment | 75 | 634 | 7 | 3.5 |
| Lowest bid | Select lower bidder | 15 | 30 | 7 | 2.5 |
| Delay in site delivery | Late delivery/ handover of site | 3 | 8 | 5 | 3.5 |
| Drawing | Late/unfinished/changes issues of drawing | 58 | 292 | 5 | 4 |
| Contract management | Weak contract management, wrong duration of contract period, contract changes, contract values, old standards | 31 | 71 | 5 | 3.5 |
| Security | Weak site safety, health restriction, alternative safe access | 25 | 85 | 4 | 2 |
| Inflationary | Inflation pressure, lack of attention to inflation | 2 | 7 | 4 | 7 |
| Protocol | Lack of severe organisational protocol/policy directives/ strategies | 14 | 54 | 4 | 2 |
| Pricing | Wrong pricing and bidding, low performance of bidder, lack of bidder | 59 | 423 | 4 | 5 |
| Controlling | Improper monitoring and controlling/cost control | 71 | 471 | 4 | 7 |
| Estimation | Inaccurate time and cost estimation | 71 | 442 | 4 | 4 |
| Permits | Difficulties in obtaining work permits (drilling permits or tests) | 38 | 161 | 4 | 4 |
| Delay Analysis Feature | MS Project | Oracle Primavera P6 | Open Plan by Deltek |
|---|---|---|---|
| Updating and rescheduling for delay analysis | *** We can update the schedule project by updating individual task progress and then rescheduling all the uncompleted tasks to start after the status date. Auto schedule is also available. | ***** We can update project progress by applying actual data to activities directly in a project or by using timesheet updates from the Progress Reporter module | **** We can update the schedule the project by updating individual task progress. Open plan can integrate with excel Comma Separated Values (CSV) files to import project status data provided the correct table structure is created within Open Plan. |
| Resource levelling and delay analysis | *** Resource levelling is only available at a single project level, and MS Project is not able to handle levelling when interdependency with another project exists. | **** To handle scheduling conflicts that may occur during levelling, we can add priorities that specify which project or activity is levelled first. This module is only available at Oracle Primavera software. | ***** Ability to split, stretch, and re-profile activities for resource scheduling. Resources files are shared across projects assigned at the activity level and are levelling prioritise assigned at the activity level. |
| Risk and delay analysis | * MS Project only considers deterministic tasks duration, and it assumes the relationships among tasks are deterministic, thus uncertainty analysis is not available. | **** The integrated risk management feature identifies, categorizes, and prioritizes potential risks associated with specific work breakdown structure (WBS) elements and resources. Able to create risk control plans and assign a probability of occurrence and an organisational breakdown structure (OBS) element to risks. | *** Provides the ability to calculate three point estimates at the activity level, along with mean and standard deviations for early dates, late dates, and float. Risks are then able to be exported via spreadsheet risk views. |
| Earned value management (EVM) and delay analysis | *** Earned value analysis is available in MS Project; however, Oracle Primavera P6 can manage EVM. | ***** Earned value can be defined at both WBS and activity levels. Able to compute performance percent complete and estimate to complete (ETC). | * Not available and needs to be integrated with Deltek Cobra. |
| Overlooked Factors (OF) | Examples | Suggestions for Future Directions (FD) |
|---|---|---|
| OF1: faulty data analysis and interpretations |
|
|
| OF2: unmatched structure of the research questionnaires with new knowledge and standards (e.g., PMBOK) |
|
|
| OF3: overlooked effect of digital tools and technologies (e.g. Digital twin, Navisworks, BIM, GIS, and IPD) |
|
|
| OF4: ignored job-site technologies and equipment, |
|
|
© 2019 by the authors. Licensee MDPI, Basel, Switzerland. This article is an open access article distributed under the terms and conditions of the Creative Commons Attribution (CC BY) license (http://creativecommons.org/licenses/by/4.0/).
Share and Cite
Sepasgozar, S.M.E.; Karimi, R.; Shirowzhan, S.; Mojtahedi, M.; Ebrahimzadeh, S.; McCarthy, D. Delay Causes and Emerging Digital Tools: A Novel Model of Delay Analysis, Including Integrated Project Delivery and PMBOK. Buildings 2019, 9, 191. https://doi.org/10.3390/buildings9090191
Sepasgozar SME, Karimi R, Shirowzhan S, Mojtahedi M, Ebrahimzadeh S, McCarthy D. Delay Causes and Emerging Digital Tools: A Novel Model of Delay Analysis, Including Integrated Project Delivery and PMBOK. Buildings. 2019; 9(9):191. https://doi.org/10.3390/buildings9090191
Chicago/Turabian StyleSepasgozar, Samad M. E., Reyhaneh Karimi, Sara Shirowzhan, Mohammad Mojtahedi, Sabbar Ebrahimzadeh, and David McCarthy. 2019. "Delay Causes and Emerging Digital Tools: A Novel Model of Delay Analysis, Including Integrated Project Delivery and PMBOK" Buildings 9, no. 9: 191. https://doi.org/10.3390/buildings9090191