Economic-Environmental Indicators to Support Investment Decisions: A Focus on the Buildings’ End-of-Life Stage


Architecture and Design Department, Politecnico di Torino, 10125 Turin, Italy
*
Author to whom correspondence should be addressed.
Buildings 2017, 7(3), 65; https://doi.org/10.3390/buildings7030065
Submission received: 29 May 2017
/
Revised: 6 July 2017
/
Accepted: 18 July 2017
/
Published: 21 July 2017
(This article belongs to the Special Issue Real Estate Economics, Management and Investments)
Abstract
:The aim of this paper is to propose a methodology for supporting decision making in design activities; in case of new projects or retrofitting of existing buildings. A multidisciplinary approach is adopted; involving Real Estate Appraisal and Economic Evaluation of Project and Building Environmental Design. It is proposed a methodology for selecting the preferable solutions among technological options; considering both economic and environmental aspects; in terms of global performance. Assuming the principles of Life Cycle Thinking and Circular Economy focus is posed at the end-of-life stage. Attention is paid on disposal costs and residual value as relevant items enable to orient investment decisions. This is done through an approach for quantifying environmental indicators related to Life Cycle Assessment (Standard ISO 14040:2006); and economic indicators adopting the Life Cycle Costing (Standard ISO 15686:2008). The paper proposes a conjoint “economic-environmental indicator”. An application of Global Cost calculation is illustrated; including monetized environmental impacts (Embodied energy and Embodied carbon); disposal/dismantling costs and residual value. The result of the Global Cost calculation is expressed through a “synthetic economic-environmental indicator” in order to select; between two different technologies; the most viable solution for a multifunctional building glass façade project; in Northern Italy. The study demonstrates that the initial investment decisions depend on the design solutions; since the early stages; related to the whole building life cycle considering conjointly the construction-management phases and the end-of-life stage.
1. Introduction
Currently, one of the main environmental problems to face is the waste production and disposal. “Construction and demolition waste (C&DW) is one of the heaviest and most voluminous waste streams generated in the European Union (EU)” [1]. As pointed out by the JRC report on C&DW [2,3] the waste stream in construction sector accounts for approximately 25–30% of all waste generated in the EU and consists of numerous materials, including concrete, bricks, gypsum, wood, glass, metals, plastic, solvents, asbestos and excavated soil. Many of the mentioned might be recycled but now they are not. In literature, the issue is widely discussed, also in engineering research areas. Recently, the topic is under attention of architectural disciplines, particularly Real Estate Appraisal and Economic Evaluation of Project and Architectural Technology Design, according to a multidisciplinary approach [4]. The scientific contributions share the effort to exploit the potential of waste by transforming them into resources, able to create value. Circular Economy is assumed as the central theoretical approach, being founded on the self-generative economic system concept, according to which the waste generated in a process, becomes a resource for another one [5,6,7]. Furthermore, Circular Economy assumes the decoupling of economic development of a Country from the uncontrolled exploitation of natural resources.
This is in a full harmony with Life Cycle Thinking theory, which conceives the project as a process which develops along its whole life cycle, from the single technological component to the whole building, involving different activities: from the raw materials extraction, to the final disposal, reuse or recycle [8].
Assuming these premises, the aim of the research is to present a proposal based on Life Cycle Thinking principles. It is presented a methodological approach for calculating economic and environmental indicators, able to support the decision-making considering the buildings’ end-of-life phase. The proposed methodology presents practical implications for selecting the preferable solution among a set of technological options, considering both economic and environmental aspects, in terms of global performance: attention is paid on disposal costs and residual value as relevant items, able to orient investment decisions in alternative technological solutions.
The work represents, at least partially, an innovative application in relation to the Italian literature to date. In the last decades, the methodology presented is standardized and commonly used in European Countries, but limits of application can be found in relation to the end of life stage. Furthermore, the work represents a contribution to the growing literature on Life Cycle Thinking approaches, stimulating in the meanwhile the development of a common knowledge also in the Italian context.
Usefulness of the model proposed is expected in supporting design activities, since the early design stages, specifically orienting the decisions among different options and, consequently, investment alternatives, both in the case of new construction and in the case of retrofitting of existing assets.
The results expected from the work are twofold: on the one hand, to provide a contribution to overcoming the limits if the entire life cycle of the project is not taken into account; on the other hand, to provide an example of conjoint application of approaches able to quantify the environmental and economic effects of different project options.
Recipients of the proposal are assumed both private and public subjects. Private subjects, specifically investors and developers, are interested in the design choices implied by the use of alternative technologies/components/materials, in terms of economic sustainability. This last is expressed through financial impacts, such as the potential savings which each option is able to guarantee. Public subjects, specifically local administrators, planners or communities, are involved in the decision making taking into account not only the economic convenience of project options, but also in the environmental sustainability of project alternatives.
Specifically, the present study pays particular attention to architectural context and to the buildings construction sector. Focus is posed at the building end-of-life stage, conceived not in terms of final life cycle phase in the building sector according to a “cradle to grave” concept, but as the first phase of a regenerating process, according to a “cradle to cradle” concept [9,10].
About this, the study assumes a design approach that, since the early stages, tries to prevent waste production. This is done through easy to recoverable or reusable buildings, in the same sector or into different ones, according to the “closure of the loop” concept [11,12]. The disposal phase of buildings is faced starting from project strategies oriented to the recycle of production waste. In this sense, economic and environmental impacts and effects in the end of life stage are particularly important for the real estate market dynamics. This is demonstrated in studies devoted to the monetization of environmental and economic performances of buildings on real estate market demand and supply, on listing prices and selling prices, and on the quality of architecture [13,14,15,16].
Furthermore, as theoretical background are assumed the results of previous studies conducted with the aim to define a methodology able to harmonize the implementation of economic and environmental analysis through quantitative indicators. As a matter of criticality, emerges that the two approaches—environmental and economic analysis—may bring to different results [17].
Specifically, the research proposes the quantification, conjointly, of an economic-environmental indicator, adopting both the Life Cycle Assessment (LCA, ISO 14040:2006) and the Life Cycle Costing (LCC, ISO 15686-5:2008).
According to a multidisciplinary perspective, involving the contribution of Real Estate Appraisal and Economic Evaluation of Project, and Building Environmental Design, the methodology proposed is a three-phase approach:
- Phase 1—environmental indicators within LCA and LCT;
- Phase 2—economic indicators with LCC Analysis;
- Phase 3—economic-environmental synthetic indicator.
Firstly, the environmental analysis is implemented through the Life Cycle Assessment approach for the calculation of performance of the design solution expressed by environmental indicators (in terms of Embodied Energy and Embodied Carbon, level of disassembly of building systems, recycled materials quantity and waste production) [18]. The developed indicators are the outcome of an implementation of Design for Disassembly (DfD) principles [19,20]. During the design process a greater attention is now devoted to the management of the end-of-life of products. The construction’s stakeholders are aware about the pollutant impacts generated by C&DW as well as about the materials resources and energy lost embodied in wastes [21,22].
Secondly, the economic analysis is implemented, through the Life Cycle Costing approach for the calculation of performance of the design solution expressed by an economic indicator in terms of Global Cost [23,24].
Thirdly, a synthetic monetary indicator for calculating conjointly the environmental and economic performance of an option is proposed, with the aim to support the decisions. The approach proposed can be implemented in presence of different sets of options, and at different scales, such as systems, technologies, components, materials (please consider such as building as whole, building systems and building materials. These are usually the scales considered) [25].
In this paper, a simulation considering two alternative technologies is proposed. Two window systems are compared for a simulation of a multifunctional building design featured with glass façade envelope, sited in Turin (Northern Italy). A sensitivity analysis is conducted in order to include risk and uncertainty elements into the evaluation model [26].
The principal conclusions demonstrate the initial investment decisions depend deeply on the design solutions, since the early stages, related to the whole building life cycle, considering conjointly the construction-management phases and the end-of-life stage. Implicitly, it demonstrates the impossibility to assess the preference of alternatives without considering the whole project life cycle and without considering conjointly environmental and economic effects.
2. Literature Background and Regulatory Framework
Recent international studies on the main topics covered in this work lead to the definition of a wide regulatory framework, which involves economic-management aspects as well as technological-environmental ones. These international guidelines are a relevant operative support for designing this research.
During the 1970s, the European Community began to be interested on wastes issue due to their growing environmental impacts. The first measures to reduce the environmental impacts production focus at favoring the reuse and recycling of waste. Among the main reference documents on topic should be mentioned:
- Directive 75/442/EEC, which introduces for the first time the aim of waste production reduction, by using new recycling technologies and recycled materials [27].
- Directive 2008/98/EC on waste, which lays down some basic waste management principles: in particular it describes the European Waste Hierarchy, a waste treatment general approach that Member States are required to adopt to minimize the waste quantity produced and to maximize the materials and energy recovery, and to achieve the best environmental results [3].
The topic is under attention even of architectural disciplines because, as mentioned above, building sector is responsible for most of the problem. With this purpose, since the 1970s, some design strategies are defined, such as Design for Disassembly and Design for Reuse [28,29] These approaches are aimed at minimize waste production by their recycling and reuse, and at reduce environmental impacts avoiding use of non-renewable raw materials.
Simultaneously, new concepts of economic development derive from a greater awareness of environmental issues, with the aim to protect natural systems: among these, the circular economy concept, which can be traced back to the theoretical approach of Life Cycle Thinking. In the international context several associations promoting the transition to this new economic model are present. In Europe, the attention posed on the topic by different companies, as the British Ellen Mac Foundation, allows European Commission to promote the circular economy in its Community policies [6,12,30,31].
On this basis, some European countries try to start pilot programs directed to the transition toward this new economic model. Among these countries should be mentioned Denmark [32], Germany [33], France [34], and The Netherlands. In The Netherlands, the city of Amsterdam embodies the best example of circular economy in the building sector [35].
Studies on the environmental impacts of a product throughout its life cycle, already set up in 1990 at the Society of Environment Toxicology and Chemistry (SETAC), are initially successful only in the industrial sector. Recently, their importance is perceived in the building sector. The interest on the proposed evaluation methodology allows recognizing internationally the Life Cycle Assessment approach, specifically through the following documents:
- Standard ISO 14040:2006, Environmental Management—Life Cycle Assessment—Principles and Framework prepared by Technical Committee ISO/TC 207, Environmental Management, Subcommittee SC 5, Life Cycle Assessment [36]. The Standard represents the methodological foundation for Life Cycle Assessment Analysis, synthetically illustrated in Section 3.1;
- Standard EN 15643-2:2011, Sustainability of construction works—Assessment of buildings—Part 2: Framework for the assessment of environmental performance [37]. The Standard provides the specific principles and requirements for assessment of environmental performance of buildings, as synthetically mentioned in Section 3.1;
- Standard EN 15643-4:2011, Sustainability of construction works—Assessment of buildings—Part 4: Framework for the assessment of economic performance [38]. The document is part of the series of EU Standards mentioned above, in this case specifically devoted to the assessment of economic performances of buildings, deepened in Section 3.2;
- Standard EN 16627:2015—Sustainability of construction works. Assessment of economic performance of buildings—Calculation methods [39]. The Standard adapts the principles developed in ISO 15686-5—mentioned in Section 3.2—for sustainability assessment in the European context.
In parallel with the environmental sustainability and related analysis, in the 1980s a research debate is developed about economic sustainability, specifically focused at costs analysis referred to the whole building lifecycle. The importance of the Life Cycle Cost analysis, which basically resumes the concept of Global Cost, lies in the fact that it does not consider only initial costs (traditionally assumed as the main discriminating aspect in the real estate investment analysis) but also operational, maintenance and disposal costs.
In this direction are conceived the recent regulatory documents related to buildings’ energy performance and environmental policies, which imply economic-management aspects, as well as technological-environmental ones. Assuming the regulatory framework addresses, a relevant operative support to their implementation is included in the documents listed below:
- Standard ISO 15686:2008, Buildings and constructed assets—Service-life planning, particularly Part 5: Life Cycle Costing, prepared by Technical Committee ISO/TC 59, Building construction, Subcommittee SC 14, Design life [40]. The Standard represents the methodological foundation for Life Cycle Cost Analysis, synthetically illustrated in Section 3.2;
- Standard EN 15459:2007—Energy performance of buildings—Economic evaluation procedure for energy systems in buildings [41]. The Standard is the foundation of the Global Cost calculation methodology, as synthetically illustrated in Section 3.2.
The growing interest on the deriving methodology allows LCC analysis be recognized internationally by the research report produced by Davis Langdon Management Consulting, conceiving Life Cycle Costing in terms of a common methodology to share between European countries [24], as discussed in the methodological framework summarized in Section 3.2.
3. Methodological Background
The study proposes a “synthetic economic-environmental indicator”, calculated through the Global Cost method and expressed in a monetary measure, to support the decision among alternative technological solutions in new projects or in building retrofitting interventions. The analysis is implemented taking into consideration both the economic and the environmental impacts, through a three-phase analysis, implemented according the following steps.
3.1. Phase 1—Environmental Indicators within LCA and LCT
The calculation of environmental indicators related to technological options is conducted through the Life Cycle Assessment (LCA) approach. LCA, defined by ISO 14040/44:2006 [36], is a method that transposes Life Cycle Thinking (LCT) principles into a quantitative framework. LCA is the recommended method expected within the Standard EN 15643-2:2011 [37]. The latter forms one part of a series of EU standards and provides the specific principles and requirements for the assessment of environmental performance of buildings taking into account technical characteristics and functionality of a building.
LCA quantifies energy and environmental loads as well as potential effects of a product over its life cycle. In construction sector the environmental impacts, according to LCA standard, are usually calculated in terms of Embodied Energy [18] and Embodied Carbon [18]. The Embodied Energy (EE) can be assumed as the primary energy (MJ) contents obtained as sum of: (1) fuels production and delivery; (2) energy content of delivered fuels; (3) energy use in transport; (4) feedstock energy. The Embodied Carbon (EC) is a measure of CO2 equivalent emissions related to energy production and delivery (kg CO2 eq) over years‘ time-horizon (usually 100 years). Both can be calculated through the LCA standard.
The Embodied Energy (EE) encompasses:
- Initial EE i.e., the primary energy demand required for off-site and on-site building processes including raw materials extraction, components manufacturing, products final assembly and transportation.
- Recurring EE i.e., the primary energy demand required in refurbishing and maintaining the building over its life cycle.
- End-of-life EE i.e., the primary energy demand required for the building final disposal.
Similarly, the Embodied Carbon (EC) can be split-up into initial EC, recurring EC and end-of-life EC.
According to the selected tools (see Section 4.1) the paper deals with the whole EE (including the initial, the recurring and the end-of-life) and the end-of-life EC.
The EE accounts is obtained by 2 main phases.
In the first phase with regards to standard UNI 8290-1:1981: Residential building. Building elements [42]. Classification and Terminology, the methodological approach divides the building in the following classes: super-structures and frameworks, wall systems; window systems; roof systems; floor systems; partitioning. Every system is made up by materials and components.
The EE refers to one square meter of building system. The EE is calculated taking into account the quantity of materials (kg), the specific weight (kg/m3) and the thickness (m) necessary to fulfill the mandatory requirements provided by building codes, technical standards, etc.
In phase 2 the accounts are extended to total building systems surfaces (m2). The quantity can be different consistently to stages over the building life cycle envisaged in the analysis (design, construction, maintenance and final disposal) as follows:
where: EETOT,j is the Total Embodied Energy for the j-th building systems analyzed [MJ]; EETOT,i is the Embodied Energy (Initial + Recurring + End-of-life) for the i-th material or component used in the j-th building system [MJ/kg]; mi is the mass for the i-th material or component used in the j-th building system [kg/m2]; n is the number of material used for the j-th building systems.
Analogously the EC is assessed in two phases, starting from UNI 8290-1 standard and it refers initially to the calculation to one square meter of building system. The account is given by the following formula:
where: ECeol, j is the end-of-life Embodied Carbon for the j-th building system analyzed [kg CO2 eq]; ECeol, i is the end-of-life Embodied Carbon for the i-th material or component used in the j-th building system [kg CO2 eq/kg].
According to LCT approach, focusing at the end-of-life stage, other indicators of environmental impact are considered. Specifically: (1) level of disassembly of building systems (LD) [18] [points]; (2) recycled materials index (RM) [18] [%]; (3) wastes production [kg].
The calculation of Level of Disassembly (LD) assumes that—potentially—in the demolition stage, materials and components used in a building can be separated in order to maximize the amount of demolition wastes delivered to reuse or recycling.
According to mentioned standard UNI 8290-1 [42] the following classes are analyzed: super-structures and frameworks, wall systems; window systems; roof systems; floor systems; partitioning. Every system is made up of materials and components. Every material and component provides a physical performance (e.g., insulation materials, waterproof membranes, finish works, etc.). Finally, materials and components in a building system are connected each other through different kind of technological solutions in construction stage. Such solutions can be essentially split-up into two main categories: wet building systems (materials are connected basically with mortar and chemical glue); reverse assembling building systems (materials are connected mostly with bolts and rivets or they are simply overlapped).
The assessment procedure is carried out for every class mentioned above. The building system is analyzed, categorized and assessed with a score ranked between 0 and 5 as shown in Table 1.
The sum of the scores of each building system establishes the level of disassembly. The final average value calculated for the total amount of building systems analyzed provides the potential LD of the whole building in the disposal stage.
The recycled materials index (RM) is evaluated taking into account the number of recycled and/or reused materials and components envisaged in the building design and used in the construction stage. The methodology considers as recycled material a material at least 40% wastes based, calculated as it follows:
where: Wi is the amount of secondary raw materials used as input in the production process; Mi is the total amount of raw materials used as input in the production process.
Equally to LD calculation the reference standard for the analysis is the UNI 8290. The methodological approach accounts for the following classes: wall systems; window systems; roof systems; floor systems; partitioning. Superstructures and framework as well as the services are not included since the secondary raw materials allowed in the manufacturing and construction processes are usually less than 40% of the total input materials. They may instead be applied to materials used as secondary structural elements.
For every building system the number of reused or recycled materials is calculated. The percentage value between the number of recycled materials and the total amount of materials and components used for the selected building systems gives a value (RM) ranked in 5 classes (Table 2). The higher is the amount of recycled or reused materials, the better is the class, closely to the energy rating systems used for assessing the electricity and thermal primary energy need of a building. Thus, Class A means that the building—eventually a selected number of building systems—are featured with more, or at least, than 35% of recycled (reused) materials.
The wastes production [kg] is an indicator derived from the output values given by a simulation online software DoWT (see Section 4.1). The calculation method uses parametric data which came from values recorded in the database referred to real demolition process comparable to the building featuring under design or construction. The tool has its own database of construction wastes for each building system.
Finally, in order to correlate the environmental and the economic impact it is essential to state the service life of the product. The lifespan is defined taking into account both the expected lifespan of a single material, according to a reference database [18], and the type of connection among materials. Assessing the connection is a crucial issue for characterizing the above mentioned indicators. “Wet” construction, such as cast-in-place concrete, does not readily lend itself to separation. Thus, even if materials used for a building system have different lifespan, during a replacement process (e.g., in maintenance stage) the entire building system will be disposed. In addition, if the waste is based on a mixed use of materials and products, only the landfill can be considered as most frequent scenario. Reverse assembling systems, on the contrary, allow separating materials and replacing only those not more fit for being used in a building. The scraps can be separated and delivered to waste sorting center to be recycled or eventually reused.
3.2. Phase 2—Economic Indicators with LCC Analysis
The calculation of economic indicators to support the choice among a set of technological options is conducted through the Life Cycle Costing (LCC) approach, defined by ISO 15686-5:2008 [40]. LCC, is an approach for quantifying short/long term costs and benefits (these last usually represented by savings), along the whole life cycle of alternative design solutions. Efficiency and effective criteria are included. In this study, LCC represents a decision making support tool, applied to alternative products for new projects or retrofitting of existing buildings, by assessing the difference among life cycle costs of each option. In the standard ISO 15686—Part 5 for Life Cycle Costing, the Global Cost concept is the foundation for the Life Cycle Costing approach. Global Cost is defined in the Standard EN 15459:2007 [41]. The Standard represents the methodological base for the Global Cost economic calculation, using, alternatively, two approaches: the global cost method, and the annuity method. Usually, the Global Cost is used for different purposes, such as: comparing the energy need of alternative solutions in order to verify economic feasibility of energy-saving options, quantifying the economic performance of a building as a whole, etc. Notice that in this work the concepts Life Cycle Cost and Global Cost are considered synonyms.
Generally, to resolve the Global Cost method, the Net Present Value (in some cases the Net Present Cost) is calculated. NPV is the main indicator, representing the amount of discounted cash flows considering costs and incomes of a project solution. Other indicators are: Net Savings, which represents the difference between the NPVs of two alternative options; Simple or Discounted Pay Back Period, which represents the time necessary for the repayment of the initial investment costs (discounted or not discounted); Savings to Investment Ratio, representative of the ratio between the amount of savings in relation to the investment sustained to obtain it; Adjusted Internal Rate of Revenue, which permits to identify the preferable options in terms of rate of revenues.
In this study, the NPV is calculated, allowing to compare the Global Cost of alternative design solutions. Differently from the other indicators, NPV permits to consider the single cost items referred to the different life cycle stages, including the end-of-life stage. It permits to breakdown into detail and analyze the single amount of relevant cost items. For this reason, NPV is indicated to analyze not only the investment as a whole, but also each cost component impact on the overall financial result.
Generally, for a LCC application it is necessary to know the cost profile of each option considered: investment costs (e.g., price lists of a specific territorial context); periodic replacement costs (considering the mean lifespan of components); annual maintenance costs (as percentage on components cost); energy costs (e.g., heating, lighting, electricity, etc.); end-of-life and disposal costs (dismantling costs and disposal costs). The eventual residual value of an asset and/or residual values of each component can be included. Costs input data are defined through market analyses (e.g., comparison with similar projects, market-based databases, market prices defined by operators). Running costs and residual values of building elements are considered for the whole calculation period. The calculation period is determined with regard to the estimated life-cycle of a building and its technological components; as a reference are considered the guidelines provided in the Commission Delegated Regulation (EU) No. 244/2012 concerning the time period for the calculation [43], and the values set in European Standard EN 15459:2007 (Annex A) concerning the lifetime of the elements of the building envelope and systems. Furthermore, it is necessary to know financial input data, such as: inflation rate, real interest rate, market interest rate, energy costs inflation rate, etc. [44,45,46].
Formally, the Global Cost method considers the initial investment and the sum of annual and disposal costs. The residual value of the components with a life-cycle longer than the building lifetime are deducted, as shown in Equation (4):
where: CG(τ) = global cost (referred to starting year τ0) ; CI = initial investment costs; Ca,i(j) = annual cost during year i of component j, which includes annual running costs (energy costs, operational costs, maintenance costs) and periodic replacement costs; dismantling and disposal costs; Rd(i) = discount factor during year i; Vf,τ(j) = residual value of the component j at the end of the calculation period, referred to the starting year.
The costs over the calculation period are discounted, through the discount factor Rd:
where: p is the number of years starting from the initial time and r is the real discount rate. The initial investment costs are not discounted.
In this study, an LCC simplified application is implemented, considering the same energy performance for each option, and focusing on the differences in end-of-life stage costs. This application can be considered simplified in comparison to the general model for the following reasons:
- Focus is posed at the end of life stage, considering the dismantling costs and disposal costs as relevant cost items;
- Furthermore, it is considered the same energy performance for each design option, in order to concentrate the attention specifically towards the building components maintenance and towards the end of life stage.
Though, the LCC approach is resolved according to Equation (4):
where: CG is the Life Cycle Cost [€]; CI the investment costs; Cm the maintenance cost, Cr the replacement cost; Cdm the dismantling cost and Cdp the disposal cost; Vr the residual value; t the year in which the cost occurred and N the number of years of the entire period considered for the analysis; r the discount rate.
CG = CI + ∑ (Cm + Cr)/(1 + r)t + (Cdm + Cdp − Vr)/(1 + r)N
Cdm and Cdp are calculated as shown in the following section.
3.3. Phase 3—Economic-Environmental Synthetic Indicator
The recent literature is focusing on approaches for verifying, simultaneously, a project (or its parts) economic and environmental sustainability, through economic and environmental indicators able to quantify the “global performance” of the project [47].
Studies consider LCC and LCA conjoint approaches, implemented in different ways [24,47]. The synergetic use of LCC and LCA, as illustrated in previous studies [17,24], can support: the ranking of a set of alternative options, including LCC and LCA results in the set of evaluation criteria; the economic-financial evaluation produced through LCC of a set of options, previously selected thorough LCA to select the better environmental performances; environmental evaluation through LCA method and LCT approach, focusing only on cost-effective options selected with LCC; LCC applications for economic-financial evaluation of environmental impacts expressed, when possible, in monetary terms.
In this work, a synthetic economic-environmental indicator is proposed, calculated through the Global Cost method and expressed in monetary terms, able to represent environmental and economic impacts previously calculated through LCA and LCC. Specifically, the following environmental indices are monetized: dismantling connections performance, quantity of recycled materials, waste produced, as illustrated in Table 3.
Analogously, Embodied Energy and Embodied Carbon indices and related costs are summarized in the following Table 4.
All these costs items are summed to Global Cost, as in the following equation:
where: CGEnEc is the Life Cycle Cost including environmental and economic indicators [€]; CI the investment costs; CEE the costs related to Embodied Energy; CEC the costs related to the Embodied Carbon; Cm the maintenance cost, Cr the replacement cost; Cdm the dismantling cost and Cdp the disposal cost; Vr the residual value; t the year in which the cost occurred and N the number of years of the entire period considered for the analysis; r the discount rate.
CGEnEc = CI + CEE + CEC + ∑ (Cm + Cr)/(1 + r)t + (Cdm + Cdp − Vr)/(1 + r)N
4. Case Study
In order to apply the proposed methodology it is assumed a simulation project, named Red Ring Office; the project is an outcome of a design experience related to a memorandum of understanding undersigned between Politecnico di Torino and the city of Turin aimed at developing proposals to reclaiming neglected areas in several neighborhoods (Master’s degree in Sustainable Architecture, School of Architecture, Politecnico di Torino, Academic Year 2015–2016). The case-study consists of a multifunctional building, located in the Northern suburbs of the municipality of Turin (Northern Italy). Specifically, the project is located in a former industrial area under urban renovation.
The building is designed as four independent units. As show in Figure 1, the reference building has two floors for shopping mall uses and the above four floors as office. In order to reduce the solar incidence in summer time, as well as to optimize solar gain in winter time, a shading device covers the terraces facing the glass façade in office plans. In the study, only one unit of the whole building has been analyzed (see main features in Table 5).
With regards to glass façade, and considering the internal functions of the building, two different window systems are identified: one for the shops with the entire glazed surface (and sliding glazed doors for the main entrance to the mall), and the other for the offices with the glazed surface divided into several parts by doors opening on balconies.
Two different technological solutions are considered: in the first case the analysis is conducted on timber frame window, and in the second case the analysis is carried out on aluminum frame window. Both solutions have double selected low-emission glazing filled with argon.
4.1. Phase 1—Environmental Indicators within LCA and LCT
The environmental indicators are calculated according to the methodology described in Section 3.1. With regard to each indicator:
- Embodied Energy is calculated using the IREEA tool (Initial and Recurring Embodied Energy Assessment, Version 2.4, IREEA, Turin, Italy), software developed by the Department of Architecture and Design of the Politecnico di Torino [48]. In the case study the program is used to evaluate the Embodied Energy of window frames systems, but it is also possible evaluate the EE of each building system (e.g., floor and wall system, etc.), the simplified initial EE of building services and the total EE of a building. The software has its own database (that can be improved by users) that allows to estimate eventual important environmental impact in terms of Embodied Energy of specific materials or components, in order to make designers aware of their choices and to allow them to change technological solutions;
- Embodied Carbon is calculated using Designing out Waste Tool (DoWT, WRAP, Banbury, UK), a web interactive mode developed by WRAP [49], an English organization which helps governments, businesses and communities to implement their priorities on resource efficiency through circular economy. The software calculates the impact of design solutions in buildings projects, including savings in costs and embodied carbon of each building element (e.g., substructure, upper floors, external walls, glazing, etc.). The software suggests default solutions in the field of DfD, DfR to reduce negative environmental impacts during construction stage;
- Level of disassembly of building systems is evaluated using the method developed by the Department of Architecture and Design of the Politecnico di Torino [18]. The level of disassembly is defined just for few technological classes: structures, external wall, roof and internal partitions. For each class are defined the main layers which composes the system, and is determined the prevailing construction mode by assigning a score. The score point is calculated according to an assessment procedure ranked between 0 and 5. Where 0 means wet building system and 5 means a 100% reverse assembling system;
- Amount of recycled material is calculated using a simplified tool developed by Department of Architecture and Design of the Politecnico di Torino [18] in order to assess the percentage of C&D wastes potentially recycled in the end of life stage. The calculation is made on the basis of the aim quantity of materials used for the curtain wall system;
- Waste generated is calculated using Designing out Waste Tool (DoWT) [49], already mentioned above, that helps designers to assess the combined impact of their design solutions on wastage, providing a quick method for generating an indicative waste forecast and estimating their value.
4.2. Phase 2—Economic Indicators with LCC Analysis
The following set of input data is assumed (year 2016):
- Initial investment costs CI, assumed at the year 0, which include acquiring an installing cost calculated using the price lists of companies [50];
- Dismantling cost, calculated using Piedmont regional price list [55];
- Disposal cost, which include possible incomes from recycled materials (glass, timber and aluminum), calculated using price lists of disposal companies; in this case aluminum frames was considered partially recyclable, thus reducing respective disposal costs;
- Period of analysis, considered of 30 years, a time required to renew and retrofit the building for example due to new energy regulations in the construction sector. The timespan is longer than the lifespan of the assets analyzed (lifespan of window = 25 years), which allows to expect an asset residual value;
- Financial data, including the lifespan for the calculation, which corresponds to the economic life of the building subject of this study, and the discount rate, set as a function of the specific investment risk and the loan costs; as a consequence, the Net Present Value (NPV) is calculated with respect to the starting year τ0 considering the costs for a lifespan of 30 years, with a discount rate of 1.39% stated according to EURIRS 30th. The discount rate value is fixed assuming that the application is not strictly finalized to evaluate the financial profitability of the investment, and, for this reason, the market risk component is excluded. Similarly, the inflation rate component is assumed very low. Furthermore, as suggested in literature, high level discount rate are not suggested in feasibility evaluations in the energy context. Implicitly, the viewpoint is the decision-making with long term and economic objectives.
4.3. Phase 3—Economic-Environmental Synthetic Indicator
To define the preferable solution among the two technological alternatives of glass façade, a synthetic monetary indicator is defined: in order to do this, environmental indicators have been transformed into financial indicators as shown in Section 3.3.
To transform the EE, the main energy sources used for the production of window frames are identified: electric power, natural gas and other unspecified sources. The electric power is the main type of energy used for the production in both solutions. In particular, it is assumed that for the production of a timber frame the sources used are divided into: 45% electricity, 40% natural gas and 15% others; although, for aluminum frame, they are divided into: 80% electricity, 14% natural gas and 6% others [56]. The great difference between the two alternatives is due to Hall-Heroult process, the only method that allows the production of aluminum not derived from recycling, which is very expensive in terms of energy.
Therefore, only the EE related to the percentage of use of electricity in each process is considered for the monetization. In particular, for the conversion into a financial indicators the price of electricity for industrial/business consumers are used; these depends on several factors (e.g., geopolitical situation, the national energy mix, taxation, etc.) [57].
As regards EC, it is transformed into a financial indicator by using the average value of the Carbon Tax present in Europe [58]: this fee was already introduced in some European countries in the early 1990s in order to try to reduce the consumption of resources emitting carbon dioxide in the atmosphere.
Assumptions for Embodied Energy and Embodied Carbon are reported in Table 7.
5. Results
Following the three-phase methodology illustrated in Section 3 and Section 4, and assuming the case-study illustrated in the section above, the following results are obtained.
5.1. Phase 1—Environmental Indicators within LCA and LCT
Environmental indicators are calculated according to Section 4.1. Table 8 shows the values calculated.
5.2. Phase 2—Economic Indicators with LCC Analysis
The LCC is applied according to the methodology described in Section 4.2. Table 9 shows the values of the economic indicators calculated according to the previous assumptions.
5.3. Phase 3—Economic-Environmental Synthetic Indicator
The economic-environmental synthetic indicator is calculated through the Global Cost method, following the steps described in Section 3.3.
Economic-environmental global costs, calculated applying Equation (3), and assuming the assumptions illustrated in Table 7, are reported in Table 10.
According to these results, the solution with aluminum frames by far appears to be the preferable for his lowest global costs. These are due above all to the low level of annual maintenance costs, slightly more than half of those expected for the timber frames. Nevertheless these last present lower levels of Embodied Energy and Embodied Carbon and, therefore, preferable environmental performances.
5.4. Sensitivity Analysis
A Sensitivity Analysis is carried out in order to assess the outcomes in Global Cost calculations for both solutions. The Sensitivity Analysis is a traditional approach used to conduct the risk analysis, when in presence of few observed data. Sensitivity Analysis can be defined as a repetition of multiple estimates by adopting the same model, and by varying systematically input variables. These last are intended as the initial values associated to the different components of cost flows. According to a general definition, Sensitivity Analysis is directed to measure the “uncertainty propagation” produced by uncertain input on model output values.
In particular, in this case it is considered the sensitivity of outcomes to variability in specific economic input parameters related to end-of-life stage, such as residual value, dismantling costs and disposal costs, to environmental impacts, such as Embodied Energy and Embodied Carbon and to the discount rate.
In Table 11, Table 12, Table 13, Table 14, Table 15 and Table 16 the variations in Global Cost are reported, both in numerical and in percentage terms, related to the values calculated for the basic scenario, by applying a decrease (−60%, −40%, −20%) and an increase (+60%, +40%, +20%) in the above mentioned input elements.
In the following Table 11 are reported the Global Cost ranges of variation due to the increasing/decreasing of the residual value, expressed both numerically and in percentage of variation.
Similarly, Table 12 reports the Global Cost ranges of variation due to the increasing/decreasing of the dismantling cost, expressed both numerically and in percentage of variation.
Analogously, in Table 13 are reported the Global Cost ranges of variation due to the increasing/decreasing of the disposal cost, expressed both numerically and in percentage of variation.
In Table 14, are reported the Global Cost ranges of variation due to the increasing/decreasing of the Embodied Energy, expressed both numerically and in percentage of variation.
In Table 15 are reported the Global Cost ranges of variation due to the increasing/decreasing of the Embodied Carbon, expressed both numerically and in percentage of variation.
Finally, in Table 16 are reported the Global Cost ranges of variation due to the increasing/decreasing of the discount rate, expressed both numerically and in percentage of variation.
The residual value and, particularly, the discount rate appear to be the most sensitive among the variables considered (Table 11 and Table 16) for both solutions, whereas dismantling costs, disposal costs and Embodied Carbon are the least sensitive (Table 12, Table 13 and Table 15). Embodied Energy (Table 14) is peculiar being the only variable able to present opposite behavior in relation to the two technological options: significantly sensitive for the aluminum frame and much less sensitive for the timber frame, in this pointing out the only element, between those considered, that differentiate the behavior of the two frame solutions.
It is possible to reach a sensitivity function by interpolating the points resulting from the coordinates of the values assumed by the input variations, in function of Global Cost variations.
As synthetically illustrated in Figure 2, the steeper curves in spider graphs represent the more critical variables (for both solutions the variation of residual value and discount rate and, only for the solution with aluminum frames, the variation of the electric energy costs related to Embodied Energy monetization).
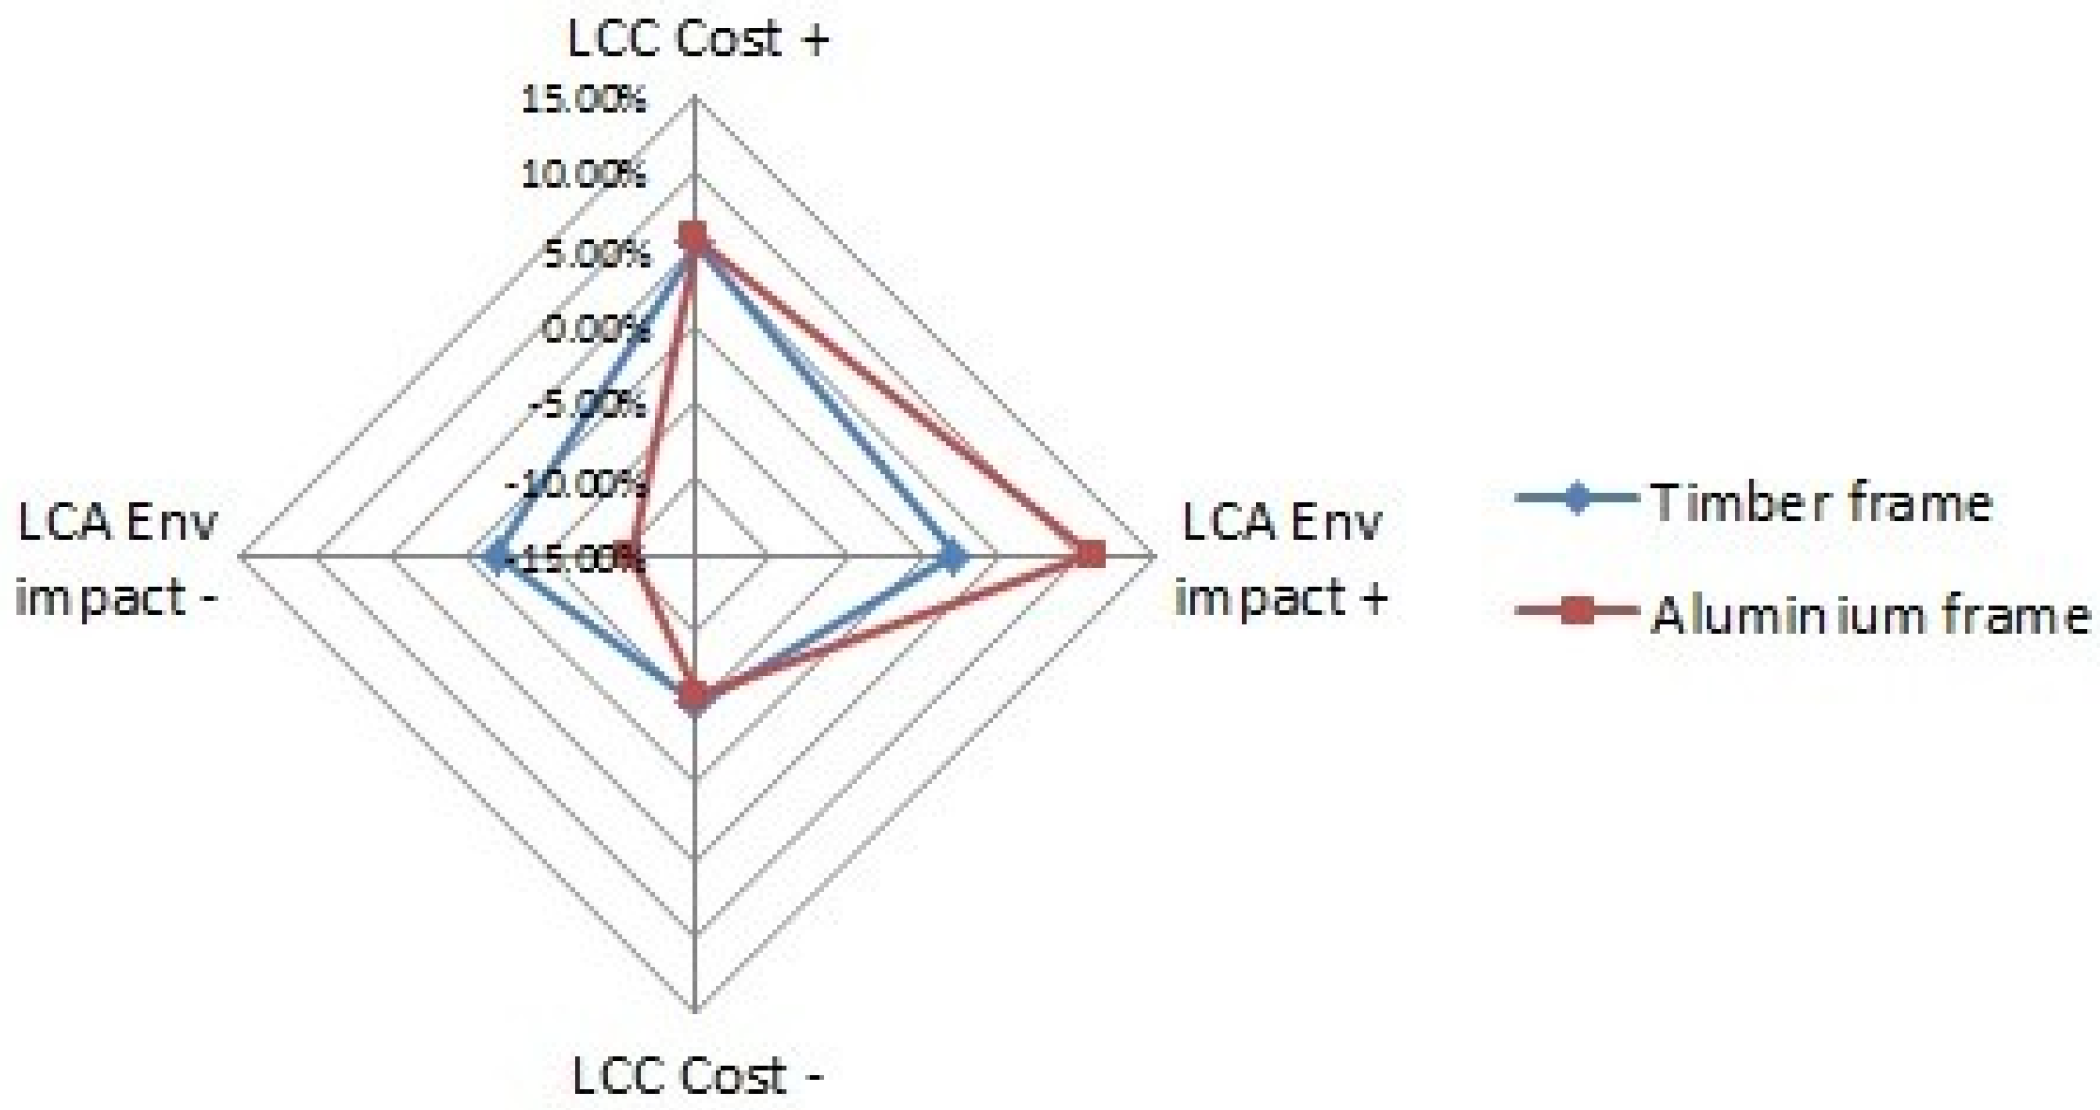
Considering separately the combined effects of economic parameters variations and environmental impacts variations, as illustrated in Figure 3, the aluminum frame solution appears more sensitive in relation to environmental impacts whereas the sensitivity on economic costs is almost the same for both solutions.
The choice between the two solutions will therefore depend as well on the operators’ propensity to balance the environmental performances with the economic performances.
6. Conclusions
In this paper, a methodology for supporting decision making in design activities, in the case of new projects or in the case of existing buildings retrofitting, was proposed. Adopting a multidisciplinary approach, a methodology for selecting the preferable solutions among technological options, considering both economic and environmental aspects, in terms of global performance of building, was presented. Attention was paid on disposal costs and residual value as relevant items enable to orient investment decisions.
A methodology was proposed for quantifying environmental indicators through Life Cycle Assessment, and economic indicators through the Life Cycle Cost Analysis, and, finally, for calculating a conjoint economic-environmental indicator. This last, through the application of Global Cost method, was calculated including, in monetary terms, the environmental impacts (calculated as Embodied Energy and Embodied Carbon), disposal/dismantling costs and residual value.
Specifically, the global performance of buildings calculation was conducted through a three-phase analysis: (1) environmental indicators calculation, according to LCA and LCT; (2) economic indicators calculation, according to LCC; (3) economic-environmental indicators calculation, through the Global Cost calculation method, including the monetization of environmental impacts. A sensitivity Analysis concluded.
The methodology was experimented on a simulated case-study, to select, between two different technologies, the most viable solution for a multifunctional building glass façade project, in Northern Italy.
The study assumes as a fundamental assumption that the initial investment decisions are strictly linked to the early design solutions. According to the principles of Life Cycle Thinking and Circular Economy, and focusing at the whole building life cycle—with special attention to the end-of-life stage—the study assumes that the construction-management phases and the end-of-life stage must be considered conjointly. Furthermore, it takes into account the potential limits in assessing the preference of alternatives without considering the whole project life cycle and without considering conjointly environmental and economic effects.
As shown, the methodology proposed in this paper tries to relate economic and environmental indicators into a single synthetic monetary index to support the decision among different options in case of new construction or in the case of retrofitting of existing ones. Starting from these premises, a possible future development of the research could extend the application of the economic-environmental analysis considering all building components (e.g., windows, services, etc.).
This future step of the study could contribute to the research on topic and, specifically, to deepen the residual value of the building calculation, supporting, in the meanwhile, the selection of the most cost-effective actions to implement in the end-of-life stage.
Acknowledgments
Acknowledgements going to anonymous reviewers who have contributed with their suggestions to improve the quality of paper, to Academic Editor and to all people of the MDPI structures for their valuable work.
Author Contributions
This paper is to be attributed in equal parts to the authors.
Conflicts of Interest
The authors declare no conflict of interest.
References
- EUROPA. Available online: http://ec.europa.eu/environment/waste/construction_demolition.htm (accessed on 22 May 2017).
- Joint Research Centre, Institute for Environment and Sustainability (IES). Supporting Environmentally Sound Decisions for Construction and Demolition (C&D) Waste Management: Practical Guide to Life Cycle Thinking (LCT) and Life Cycle Assessment (LCA). European Commission: Luxembourg City, Luxembourg, 2011. Available online: http://publications.jrc.ec.europa.eu/repository/bitstream/111111111/22585/2/d4b%20-%20guide%20to%20lctlca%20for%20c%26d%20waste%20management%20-%20final%20-%20on%20line.pdf (accessed on 22 May 2017).
- Directive 2008/98/EC of the European Parliament and of the Council of 19 November 2008 on Waste and Repealing Certain Directives. Official Journal of the European Union, 2008. Available online: http://eur-lex.europa.eu/legal-content/EN/TXT/?uri=CELEX:32008L0098 (accessed on 27 February 2017).
- Fregonara, E.; Curto, R.; Grosso, M.; Mellano, P.; Rolando, D.; Tulliani, J.M. Environmental Technology, Materials Science, Architectural Design, and Real Estate Market Evaluation: A Multidisciplinary Approach for Energy-Efficient Buildings. J. Urban Technol. 2013, 20, 57–80. [Google Scholar] [CrossRef]
- Cheshire, D. Building revolutions. In Applying the Circular Economy to the Built Environment; RIBA Publishing: London, UK, 2016. [Google Scholar]
- European Union: European Commission. Communication from the Commission to the European Parliament, the Council, the European Economic and Social Committee and the Committee of the Regions. Towards a Circular Economy: A Zero Waste Programme for Europethe Regions. 2 July 2014. COM (2014) 398 Final. Available online: http://eur-lex.europa.eu/legal-content/EN/TXT/?uri=celex%3A52014DC0398 (accessed on 5 September 2016).
- Calcott, P.; Walls, M. Waste, recycling and “Design for Environment”: Roles for markets and policy instruments. Resour. Energy Econ. 2005, 27, 287–305. [Google Scholar] [CrossRef]
- König, H.; Kohler, N.; Kreissig, J.; Lützkendorf, T. A Life Cycle Approach to Buildings. Principles, Calculations, Design Tools; Detail Green Books: Regensburg, Germany, 2010. [Google Scholar]
- Assefa, G.; Ambler, C. To demolish or not to demolish: Life cycle consideration of repurposing buildings. Sustain. Cities Soc. 2017, 28, 146–153. [Google Scholar] [CrossRef]
- Blengini, G.A. Life cycle of buildings, demolition and recycling potential: A case study in Turin, Italy. Build. Environ. 2009, 44, 319–330. [Google Scholar] [CrossRef]
- Commoner, B. The Closing Circle: Nature, Man & Technology; Alfred A. Knopf: New York, NY, USA, 1971. [Google Scholar]
- European Union: European Commission. Communication from the Commission to the European Parliament, the Council, the European Economic and Social Committee and the Committee of the Regions. Closing the Loop—An EU Action Plan for the Circular Economy. 2 December 2015. COM (2015) 614 Final. Available online: http://eur-lex.europa.eu/legal-content/EN/TXT/?uri=CELEX:52015DC0614 (accessed on 5 September 2016).
- Thiebat, F. Life-cycle design for sustainable architecture. TECHNE J. Technol. Archit. Environ. 2013, 5, 177–183. [Google Scholar]
- Del Giudice, V.; De Paola, P.; Manganelli, B.; Forte, F. The monetary valuation of environmental externalities through the analysis of real estate prices. Sustainability 2017, 9. [Google Scholar] [CrossRef]
- Tajani, F.; Morano, P.; Locurcio, M.; Torre, C.M. Data-driven techniques for mass appraisals. Applications to the residential market of the city of Bari (Italy). Int. J. Bus. Intell. Data Min. 2016, 11, 109–129. [Google Scholar] [CrossRef]
- Morano, P.; Tajani, F.; Locurcio, M. GIS application and econometric analysis for the verification of the financial feasibility of roof-top wind turbines in the city of Bari. Renew. Sustain. Energy Rev. 2017, 70, 999–1010. [Google Scholar] [CrossRef]
- Fregonara, E.; Giordano, R.; Rolando, D.; Tulliani, J.M. Integrating Environmental and Economic Sustainability in New Building Construction and Retrofits. J. Urban Technol. 2016, 23, 3–28. [Google Scholar] [CrossRef]
- Giordano, R. I Prodotti per l’Edilizia Sostenibile; Sistemi Editoriali Esselibri: Naples, Italy, 2010; pp. 231–237, 237–241, 134–140, 159–167, 242–243, 360–413. [Google Scholar]
- Riosa, F.C.; Chonga, W.K.; Grau, D. Design for Disassembly and Deconstruction. Challenges and Opportunities. Procedia Eng. 2015, 118, 1296–1304. [Google Scholar] [CrossRef]
- Ciarimboli, N.; Guy, B. Design for Disassembly in the Built Environment: A Guide to Cloosed-Loop Design and Building; Pennsylvania State University: State College, PA, USA, 2005; Available online: http://www.lifecyclebuilding.org/docs/DfDseattle.pdf (accessed on 16 July 2016).
- Durmisevic, E. Green Design and Assembly of Buildings and Systems: Design for Disassembly a Key to Life Cycle Design of Buildings and Building Products; VDM Verlag Dr. Müller: Saarbrüken, Germany, 2010. [Google Scholar]
- Chau, C.K.; Xu, J.M.; Leung, T.M.; Ng, W.Y. Evaluation of the impacts of end-of-life management strategies for deconstruction of a high-rise concrete framed office building. Appl. Energy 2017, 185, 1595–1603. [Google Scholar] [CrossRef]
- Flanagan, R.; Norman, G. Life Cycle Costing for Construction; Royal Institution of Chartered Surveyors: London, UK, 1983. [Google Scholar]
- Langdon, D. Life Cycle Costing (LCC) as a Contribution to Sustainable Construction: A Common Methodology—Final Methodology. 2007. Available online: http://ec.europa.eu/enterprise/sectors/construction/studies/life-cycle-costing_en.htm (accessed on 16 September 2016).
- Schmidt, W.P. Life Cycle Costing as Part of Design for Environment: Business Cases. Int. J. Life Cycle Assess. 2003, 8, 167–174. [Google Scholar] [CrossRef]
- Tajani, F.; Morano, P. Evaluation of vacant and redundant public properties and risk control: A model for the definition of the optimal mix of eligible functions. J. Prop. Invest. Financ. 2017, 35, 75–100. [Google Scholar] [CrossRef]
- Council Directive 75/442/EEC of 15 July 1975 on Waste. Available online: http://eur-lex.europa.eu/LexUriServ/LexUriServ.do?uri=CONSLEG:1975L0442:20031120:EN:PDF (accessed on 27 February 2017).
- Mackenzie, D. Design for the Environment; Rizzoli: New York, NY, USA, 1991. [Google Scholar]
- Brand, S. How Building Learn. What Happens after They’re Built; Penguin Book: New York, NY, USA, 1994. [Google Scholar]
- Ellen MacArthur Foundation. Towards the Circular Economy. Economic and Business Rationale for an Accelerated Transition; Ellen MacArthur Foundation: Cowes, UK, 2012; Available online: https://www.ellenmacarthurfoundation.org/publications (accessed on 27 February 2016).
- Ellen MacArthur Foundation. Growth within: A Circular Economy Vision for a Competitive Europe; Ellen MacArthur Foundation: Cowes, UK, 2015; Available online: https://www.ellenmacarthurfoundation.org/publications (accessed on 27 February 2016).
- Ellen MacArthur Foundation. Potential for Denmark as a Circular Economy. A Case Study from: Delivering the Circular Economy—A Toolkit for Policymaker; Ellen MacArthur Foundation: Cowes, UK, 2015. [Google Scholar]
- McKinsley Foundation. Welcome to the Volatile World—Challenges for the German Economy Emerging from Fundamental Market Changes; McKinsley Foundation: Frankfurt, Germany, 2010. [Google Scholar]
- Institut de l’Économie Circulaire. Available online: http://www.institut-economie-circulaire.fr/ (accessed on 5 September 2016).
- City of Amsterdam. Circular Amsterdam. A Vision and Action Agenda for the City and Metropolitan Area. 2016. Available online: https://www.amsterdam.nl/bestuur-organisatie/organisatie/ruimte-economie/ruimte-duurzaamheid/making-amsterdam/circular-economy/report-circular/ (accessed on 5 September 2016).
- International Organization for Standardization. ISO 14040:2006; Environmental Management—Life Cycle Assessment—Principles and Framework; ISO/TC 207/CS 5; International Organization for Standardization: Geneva, Switzerland, 2006. [Google Scholar]
- European Committee for Standardization (CEN). Standard EN ISO 15643-2: 2011. Sustainability of Construction Works—Assessment of Buildings—Part 2: Framework for the Assessment of Environmental Performance; European Committee for Standardization: Brussels, Belgium, 2011. [Google Scholar]
- European Committee for Standardization (CEN). Standard EN ISO 15643-4: 2011. Sustainability of Construction Works—Assessment of Buildings—Part 4: Framework for the Assessment of Economic Performance; European Committee for Standardization: Brussels, Belgium, 2011. [Google Scholar]
- European Committee for Standardization (CEN). Standard EN ISO 16627: 2015. Sustainability of Construction Works—Assessment of Economic Performance of Buildings—Calculation Methods; European Committee for Standardization: Brussels, Belgium, 2015. [Google Scholar]
- International Organization for Standardization. ISO 15686:2008; Buildings and Constructed Assets—Service-Life Planning—Part 5: Life Cycle Costing; ISO/TC 59/CS 14; International Organization for Standardization: Geneva, Switzerland, 2008. [Google Scholar]
- European Committee for Standardization (CEN). Standard EN ISO 15459:2007. Energy Performance of Buildings—Economic Evaluation Procedure for Energy Systems in Buildings; European Committee for Standardization: Brussels, Belgium, 2007. [Google Scholar]
- Italian Organization for Standardization. UNI 8290-1:1981—Residential Building. Building Elements. Classification and Terminology; Italian Organization for Standardization (UNI): Milan, Italy, 1981. [Google Scholar]
- European Parliament. Guidelines Accompanying Commission Delegated Regulation (EU) No 244/2012 of 16 January 2012 Supplementing Directive 2010/31/EU; European Parliament: Brussels, Belgium, 2012. [Google Scholar]
- Fregonara, E.; Lo Verso, V.R.M.; Lisa, M.; Callegari, G. Retrofit scenarios and economic sustainability. A case-study in the Italian context. Energy Procedia 2017, 111, 245–255. [Google Scholar] [CrossRef]
- Becchio, C.; Ferrando, D.G.; Fregonara, E.; Milani, N.; Quercia, C.; Serra, V. The cost-optimal methodology for the energy retrofit of an ex-industrial building located in Northern Italy. Energy Build. 2016, 127, 590–602. [Google Scholar] [CrossRef]
- Fabbri, K.; Tronchin, L.; Tarabusi, V. Energy retrofit and economic evaluation priorities applied at an Italian case Study. Energy Procedia 2014, 45, 379–384. [Google Scholar] [CrossRef]
- Fregonara, E. Methodologies for supporting sustainability in energy and buildings. The contribution of Project Economic Evaluation. Energy Procedia 2017, 111, 2–11. [Google Scholar] [CrossRef]
- Giordano, R.; Serra, V.; Demaria, E.; Duzel, A. Embodied Energy Versus Operational Energy in a Nearly Zero Energy Building Case Study. Energy Procedia 2017, 111, 367–376. [Google Scholar] [CrossRef]
- WRAP. Available online: http://dowtb.wrap.org.uk/Home.aspx (accessed on 16 July 2016).
- MODA EDILE. Available online: http://www.modaedile.com/listini.asp (accessed on 27 February 2017).
- Albano, J.-R. La Maintenance des Batiment; Editions Le Moniteur: Paris, France, 2005. [Google Scholar]
- Fan, H.; AbouRizk, S.; Kim, H.; Zaïane, O. Assessing Residual Value of Heavy Construction Equipment Using Predictive Data Mining Model. J. Comput. Civ. Eng. 2008, 22, 181–191. [Google Scholar] [CrossRef]
- Deakin, M. Valuation, Appraisal, Discounting, Obsolescence and Depreciation. Int. J. Life Cycle Assess. 1999, 4, 87–93. [Google Scholar] [CrossRef]
- Liapis, K.; Kantianis, D. Depreciation Methods and Life-Cycle-Costing (LCC) Methodology. Procedia Econ. Financ. 2015, 19, 314–324. [Google Scholar] [CrossRef]
- Piemonte, R. Prezzi di Riferimento per Opere e Lavori Pubblici Nella Regione Piemonte; Assessorato alla opere Pubbliche: Turin, Italy, 2016. [Google Scholar]
- Asif, M. Life Cycle Assessment of Aluminium-Clad Timber Windows; Edinburgh Napier University: Edinburgh, UK, 2002. [Google Scholar]
- EUROSTAT. Available online: http://ec.europa.eu/eurostat/statistics-explained/index.php/Electricity_price_statistics (accessed on 10 February 2017).
- CARBON TAX CENTER. Available online: https://www.carbontax.org/where-carbon-is-taxed/ (accessed on 10 February 2017).
Figure 1.
Case study: (a) isometric view of the building; (b) cross section of the building.
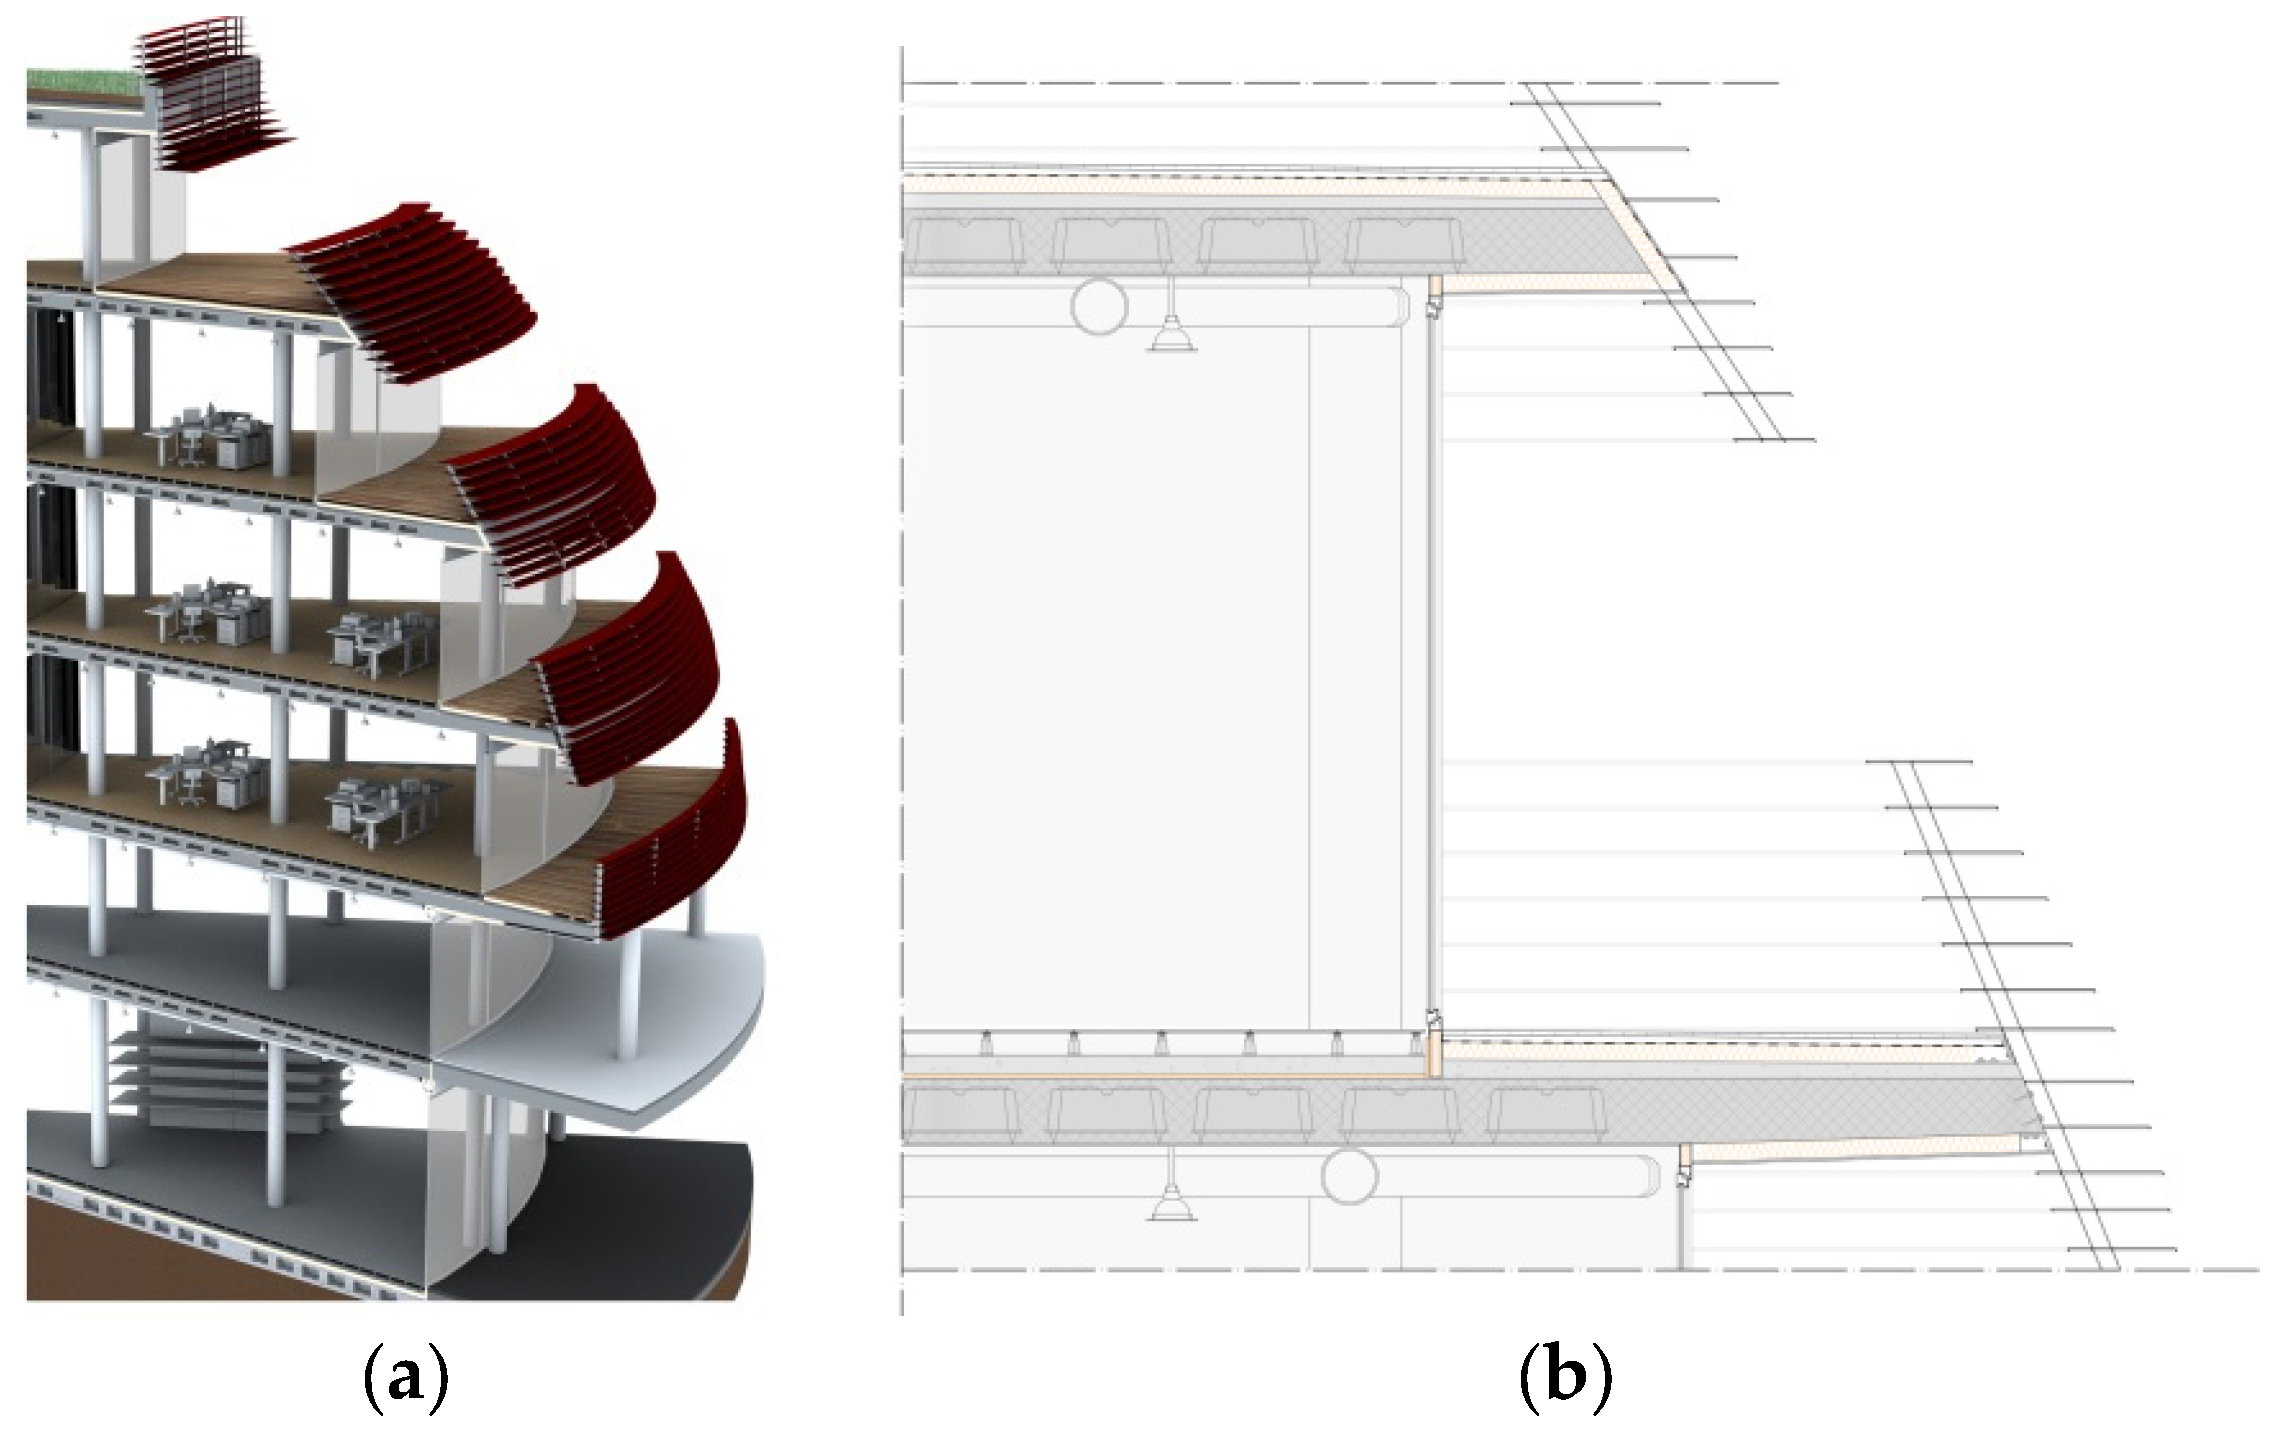
Figure 2.
Sensitivity analysis: spider graph: (a) Timber frame; (b) Aluminum frame.
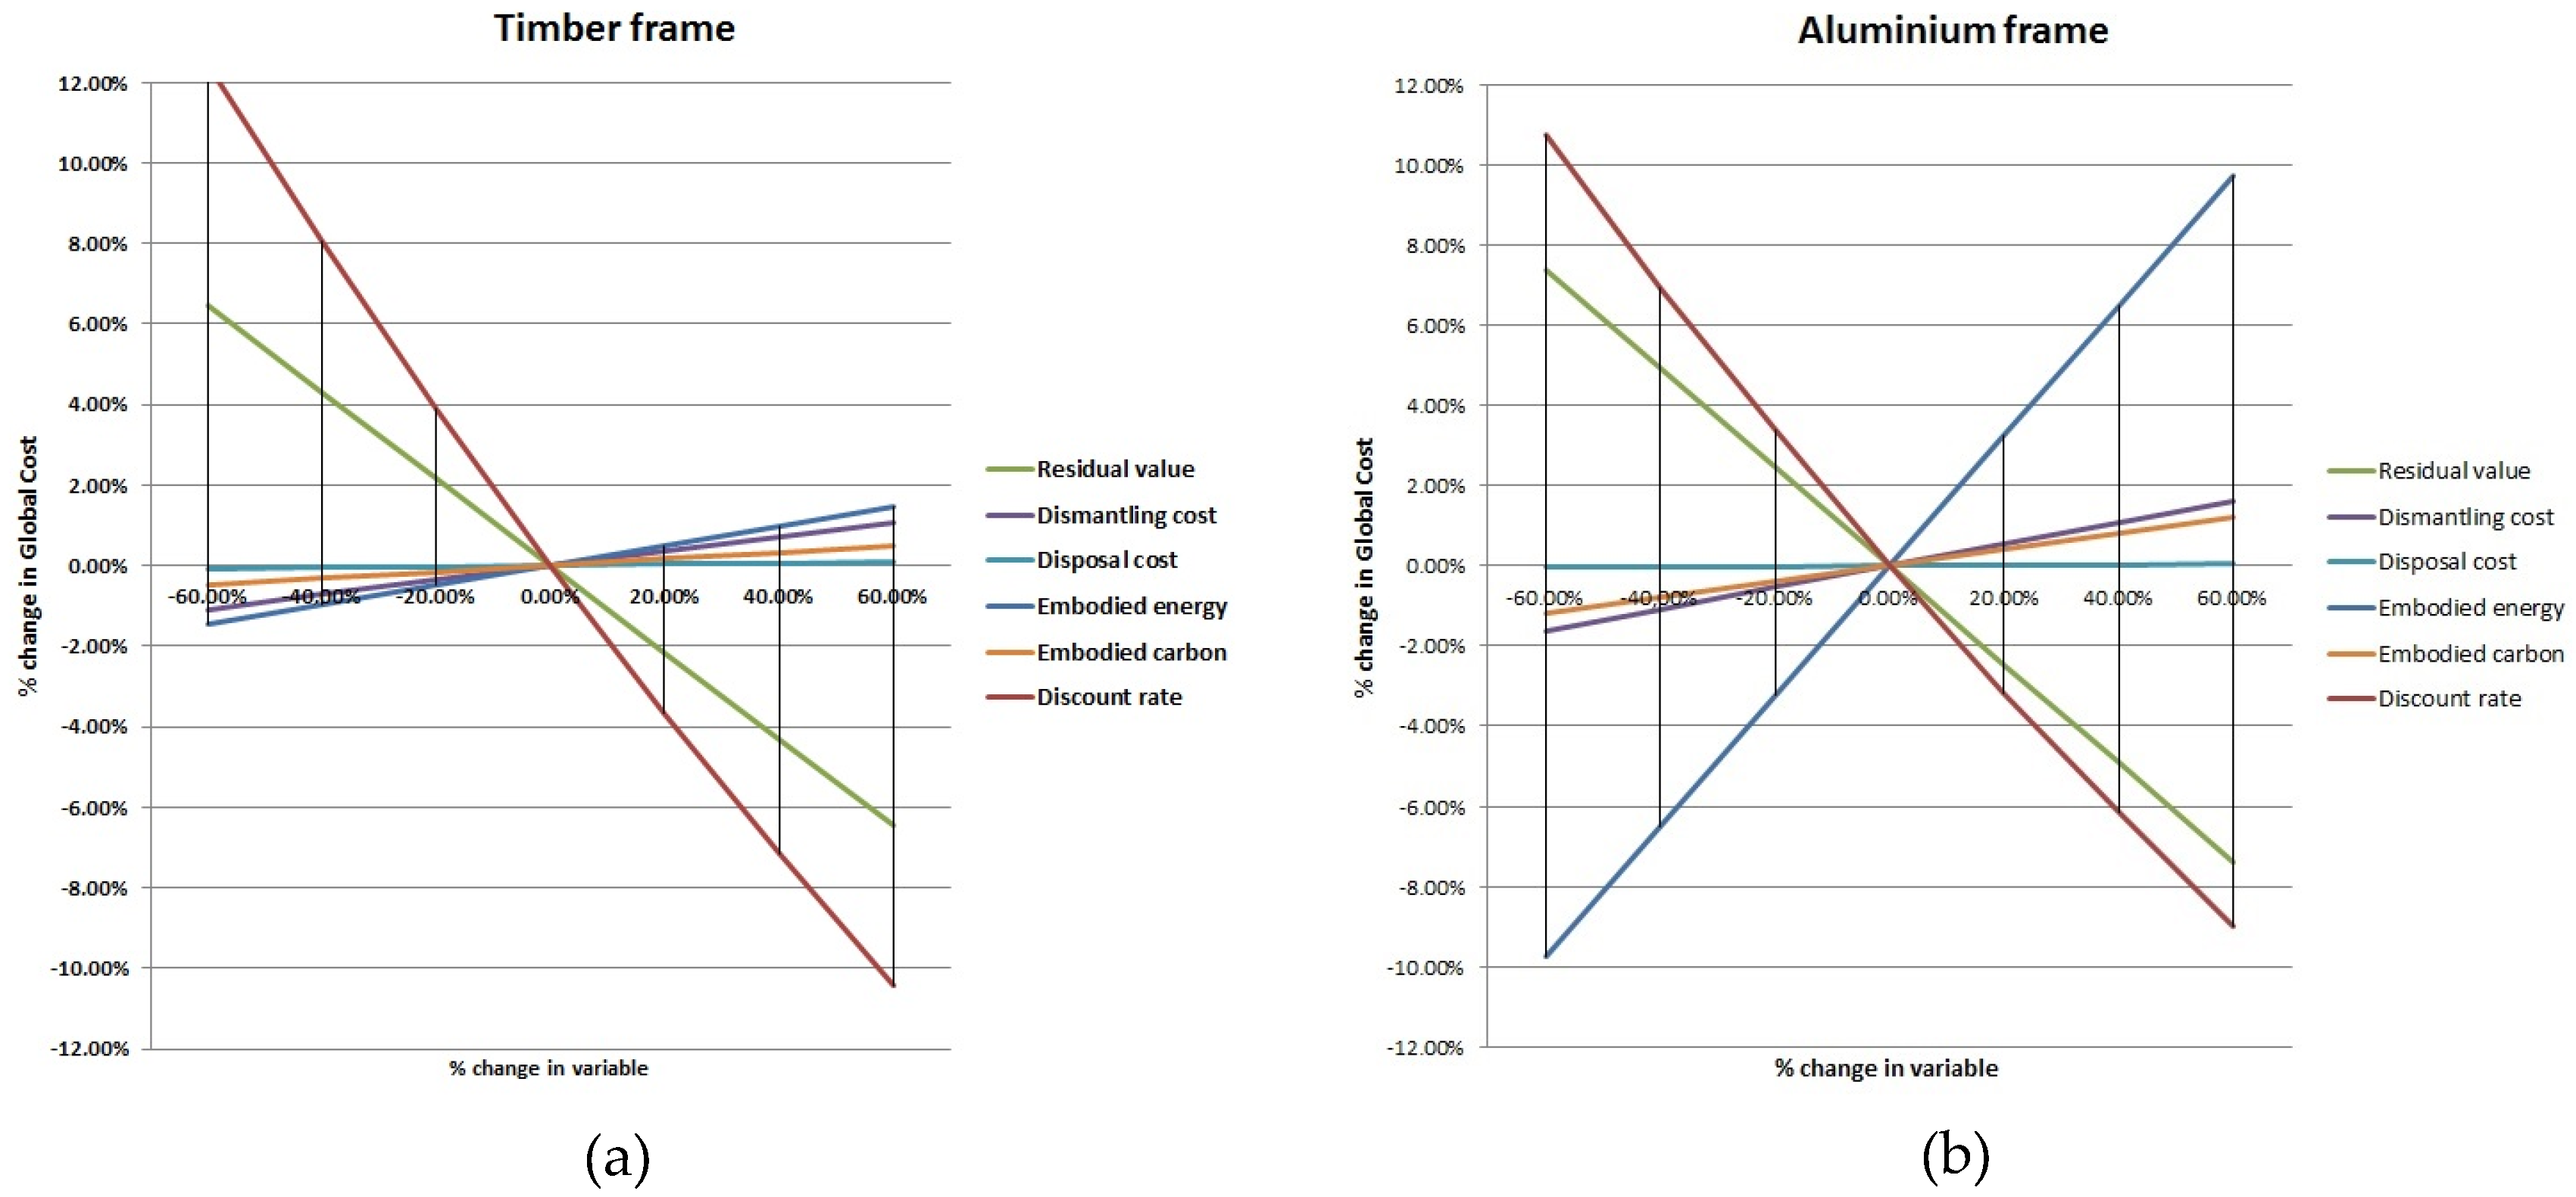
Figure 3.
Sensitivity analysis: economic and environmental impacts.

Table 1.
Level of Disassembling (LD) score for the building systems analyzed.
| Construction Category | Description | LD (Point) |
|---|---|---|
| Wet building systems | Building system mainly featured with mortar connections | 0 |
| Building systems mainly featured with glue connections | 0 | |
| Building systems mainly featured with jointed connections | 0 | |
| Reverse assembling building systems | Building systems mainly featured with bolted or riveted connections | 3 |
| Total reversible connections | 5 |
Table 2.
Rating systems for assessing the RM performance.
| Class | Recycled Materials [RM] |
|---|---|
| A | RM ≥ 35% |
| B | 35 % > RM ≥ 25% |
| C | 25 % > RM ≥ 15% |
| D | 15 % > RM ≥ 5% |
| G | RM ≥ 5% |
Table 3.
Summary table of environmental indicators in end-of-life stage and relative cost items.
| Environmental Indicators in End-Of-Life | Unit | Cost Items |
|---|---|---|
| Level of disassembly of building systems | points | Dismantling costs |
| Recycled materials quantity | % | Disposal costs (waste disposal costs—Value of recycled materials) |
| Wastes production quantity | kg |
Table 4.
Summary table of Embodied Energy and Embodied Carbon indices and relative cost items.
| Environmental Indicators | Unit | Cost Items |
|---|---|---|
| Embodied Energy | MJ | Cost of electric power |
| Embodied Carbon | kg CO2 eq (100 years) | Cost of Carbon tax in Europe |
Table 5.
Reference building features (one unit).
| Building Features (One Unit) | Measures for One Unit |
|---|---|
| Number of stories above ground | 6 |
| Average floor-to-floor height | 3.50 m |
| Gross Internal Floor Area (GIF) | 4166 m2 |
| Glazing Area for one unit (GA) | 1426 m2 |
| Glazing ratio to external walls (G/EW) | 90% |
Table 6.
Maintenance and replacement schedule.
| Activity | Frequency | % on Investment Cost | ||
|---|---|---|---|---|
| Timber | Aluminum | Timber | Aluminum | |
| Inspection | 6 months | 1 year | 1% | 1% |
| Preemptive maintenance | 1 year | 1 year | 5% | 5% |
| Maintenance work (light) | 3 years | 5 years | 20% | 20% |
| Maintenance work (main) | 7 years | 10 years | 40% | 35% |
| Replacement | 25 years | 25 years | 100% | 100% |
Table 7.
Assumptions and values for Embodied Energy and Embodied Carbon.
| Indicator | Timber Frame | Aluminum Frame |
|---|---|---|
| Embodied Energy | Electric power = 45% | Electric power = 80% |
| Natural gas = 40% | Natural gas = 14% | |
| Other = 15% | Other = 6% | |
| 45% EE = 1,050,092.9 MJ | 80% EE = 4,705,377.1 MJ | |
| = 291,692.47 kWh | = 1,307,049.19 kWh | |
| Cost of electricity = 0.153 €/kWh | Cost of electricity = 0.153 €/kWh | |
| Embodied Carbon | 665.48 ton CO2 | 1100.86 ton CO2 |
| Carbon Tax (mean Europe) = 22.25 €/ton | Carbon Tax (mean Europe) = 22.25 €/ton |
Table 8.
Summary of the value of environmental indicators.
| Indicator | Unit of Measurement | Timber Frame | Aluminum Frame |
|---|---|---|---|
| Embodied energy (EE) | MJ | 2,333,539.78 | 5,881,721.38 |
| Embodied carbon (EC) | kg CO2 eq (100 years) | 665,485 | 1,100,860 |
| Level of disassembly of building systems (LD) (1) | Points | 3 | 3 |
| Amount of Recycled material (MR) | % | 0 | 0.5 |
| Waste generated | kg | 43,730 | 38,820 |
Note 1: For the windows system analyzed is scored 3. It means that the building system is built up with bolted and/or tongue and groove connections.
Table 9.
Summary of the value of economic indicators.
| Costs | Timber Frame | Aluminum Frame |
|---|---|---|
| Initial investment costs (€) | 363,027.50 | 272,852.50 |
| Inspection * (€) | 148,627.15 | 53,843.77 |
| Preemptive maintenance * (€) | 371,567.88 | 269,218.84 |
| Maintenance work (light) * (€) | 481,180.83 | 191,512.23 |
| Maintenance work (main) * (€) | 324,818.48 | 135,304.63 |
| Replacement * (€) | 267,175.86 | 203,318.93 |
| Annual running and replacement costs * (€) | 1,593,370.21 | 853,198.40 |
| Residual value * (€) | 199,485.62 | 151,807.13 |
| Dismantling cost * (€) | 33,329.71 | 33,329.71 |
| Disposal cost * (€) | 2405.67 | 987.58 |
| CG (€) | 1,792,647.48 | 1,008,561.06 |
* total discounted value (discount rate = 1.39%).
Table 10.
Summary table of economic-environmental indicators.
| Costs | Timber Frame | Aluminum Frame |
|---|---|---|
| Global cost (€) | 1,792,647.48 | 1,008,561.06 |
| Embodied Energy (€) | 44,628.95 | 199,978.52 |
| Embodied Carbon (€) | 14,807.37 | 24,494.14 |
| CGEnEc (€) | 1,852,083.80 | 1,233,033.72 |
Table 11.
Sensitivity analysis with decreased/increased residual values.
| Variations | Timber Frame | Aluminum Frame | ||||
|---|---|---|---|---|---|---|
| % Variation in Residual Value | Residual Value (€) | CGEnEc (€) | % Variation in CGEnEc | Residual Value (€) | CGEnEc (€) | % Variation in CGEnEc |
| −60.00% | 79,794.25 | 1,.971,775.16 | +6.46% | 60,722.85 | 1,324,118.00 | +7.39% |
| −40.00% | 119,691.37 | 1,931,878.04 | +4.31% | 91,084.28 | 1,293,756.57 | +4.92% |
| −20.00% | 159,588.50 | 1,891,980.92 | +2.15% | 121,445.70 | 1,263,395.15 | +2.46% |
| Basic Scenario | 199,485.62 | 1,852,083.80 | 0.00% | 151,807.13 | 1,233,033.72 | 0.00% |
| +20.00% | 239,382.74 | 1,812,186.67 | −2.15% | 182,168.56 | 1,202,672.30 | −2.46% |
| +40.00% | 279,279.87 | 1,772,289.54 | −4.31% | 212,529.98 | 1,172,310.87 | −4.92% |
| +60.00% | 319,176.99 | 1,732,392.42 | −6.46% | 242,891.41 | 1,141,949.44 | −7.39% |
Table 12.
Sensitivity analysis with decreased/increased dismantling costs.
| Variations | Timber Frame | Aluminum Frame | ||||
|---|---|---|---|---|---|---|
| % Variation in Dismantling Cost | Dismantling Cost (€) | CGEnEc (€) | % Variation in CGEnEc | Dismantling Cost (€) | CGEnEc (€) | % Variation in CGEnEc |
| −60.00% | 13,331.88 | 1,832,085.97 | −1.08% | 13,331.88 | 1,213,035.90 | −1.62% |
| −40.00% | 19,997.83 | 1,838,751.91 | −0.72% | 19,997.83 | 1,219,701.84 | −1.08% |
| −20.00% | 26,663.77 | 1,845,417.85 | −0.36% | 26,663.77 | 1,226,367.78 | −0.54% |
| Basic Scenario | 33,329.71 | 1,852,083.80 | 0.00% | 33,329.71 | 1,233,033.72 | 0.00% |
| +20.00% | 39,995.65 | 1,858,749.73 | +0.36% | 39,995.65 | 1,239,699.66 | +0.54% |
| +40.00% | 46,661.59 | 1,865,415.68 | +0.72% | 46,661.59 | 1,246,365.61 | +1.08% |
| +60.00% | 53,327.54 | 1,872,081.62 | +1.08% | 53,327.54 | 1,253,031.55 | +1.62% |
Table 13.
Sensitivity analysis with decreased/increased disposal costs.
| Variations | Timber Frame | Aluminum Frame | ||||
|---|---|---|---|---|---|---|
| % Variation in Disposal Cost | Disposal Cost (€) | CGEnEc (€) | % Variation in CGEnEc | Disposal Cost (€) | CGEnEc (€) | % Variation in CGEnEc |
| −60.00% | 962.27 | 1,850,640.39 | −0.08% | 395.03 | 1,232,441.17 | −0.05% |
| −40.00% | 1443.40 | 1,851,121.52 | −0.05% | 592.55 | 1,232,638.69 | −0.03% |
| −20.00% | 1924.54 | 1,851,602.66 | −0.03% | 790.06 | 1,232,836.21 | −0.02% |
| Basic Scenario | 2405.67 | 1,852,083.80 | 0.00% | 987.58 | 1,233,033.72 | 0.00% |
| +20.00% | 2886.80 | 1,852,564.93 | +0.03% | 1185.10 | 1,233,231.24 | +0.02% |
| +40.00% | 3367.94 | 1,853,046.06 | +0.05% | 1382.61 | 1,233,428.75 | +0.03% |
| +60.00% | 3849.07 | 1,853,527.19 | +0.08% | 1580.13 | 1,233,626.27 | +0.05% |
Table 14.
Sensitivity analysis with decreased/increased Embodied Energy.
| Variations | Timber Frame | Aluminum Frame | ||||
|---|---|---|---|---|---|---|
| % Variation in Embodied Energy | Embodied Energy (€) | CGEnEc (€) | % Variation in CGEnEc | Embodied Energy (€) | CGEnEc (€) | % Variation in CGEnEc |
| −60.00% | 17,851.58 | 1,825,306.42 | −1.45% | 79,991.41 | 1,113,046.61 | −9.73% |
| −40.00% | 26,777.37 | 1,834,232.21 | −0.96% | 119,987.11 | 1,153,042.31 | −6.49% |
| −20.00% | 35,703.16 | 1,843,158.00 | −0.48% | 159,982.82 | 1,193,038.02 | −3.24% |
| Basic Scenario | 44,628.95 | 1,852,083.80 | 0.00% | 199,978.52 | 1,233,033.72 | 0.00% |
| +20.00% | 53,554.74 | 1,861,009.58 | +0.48% | 239,974.22 | 1,273,029.43 | +3.24% |
| +40.00% | 62,480.53 | 1,869,935.37 | +0.96% | 279,969.93 | 1,313,025.13 | +6.49% |
| +60.00% | 71,406.32 | 1,878,861.16 | +1.45% | 319,965.63 | 1,353,020.83 | +9.73% |
Table 15.
Sensitivity analysis with decreased/increased Embodied Carbon.
| Variations | Timber Frame | Aluminum Frame | ||||
|---|---|---|---|---|---|---|
| % Variation in Embodied Carbon | Embodied Carbon (€) | CGEnEc (€) | % variation in CGEnEc | Embodied Carbon (€) | CGEnEc (€) | % variation in CGEnEc |
| −60.00% | 5922.95 | 1,843,199.37 | −0.48% | 9797.66 | 1,218,337.24 | −1.19% |
| −40.00% | 8884.42 | 1,846,160.84 | −0.32% | 14,696.48 | 1,223,236.07 | −0.79% |
| −20.00% | 11,845.90 | 1,849,122.32 | −0.16% | 19,595.31 | 1,228,134.89 | −0.40% |
| Basic Scenario | 14,807.37 | 1,852,083.80 | 0.00% | 24,494.14 | 1,233,033.72 | 0.00% |
| +20.00% | 17,768.84 | 1,855,045.27 | +0.16% | 29,392.97 | 1,237,932.55 | +0.40% |
| +40.00% | 20,730.32 | 1,858,006.74 | +0.32% | 34,291.80 | 1,242,831.38 | +0.79% |
| +60.00% | 23,691.79 | 1,860,968.21 | +0.48% | 39,190.62 | 1,247,730.21 | +1.19% |
Table 16.
Sensitivity analysis with decreased/increased discount rate.
| Variations | Timber Frame | Aluminum Frame | ||||
|---|---|---|---|---|---|---|
| % Variation in Discount Rate | Discount Rate (%) | CGEnEc (€) | % Variation in CGEnEc | Discount Rate (%) | CGEnEc (€) | % Variation in CGEnEc |
| −60.00% | 0.56% | 2,082,138.12 | +12.42% | 0.56% | 1,365,639.59 | +10.75% |
| −40.00% | 0.83% | 2,000,924.25 | +8.04% | 0.83% | 1,318,712.45 | +6.95% |
| −20.00% | 1.11% | 1,924,339.24 | +3.90% | 1.11% | 1,274,572.52 | +3.37% |
| Basic Scenario | 1.39% | 1,852,083.80 | 0.00% | 1.39% | 1,233,033.72 | 0.00% |
| +20.00% | 1.67% | 1,783,879.57 | −3.68% | 1.67% | 1,193,923.39 | −3.17% |
| +40.00% | 1.95% | 1,719,467.65 | −7.16% | 1.95% | 1,157,081.26 | −6.16% |
| +60.00% | 2.22% | 1,658,607.11 | −10.45% | 2.22% | 1,122,358.49 | −8.98% |
© 2017 by the authors. Licensee MDPI, Basel, Switzerland. This article is an open access article distributed under the terms and conditions of the Creative Commons Attribution (CC BY) license (http://creativecommons.org/licenses/by/4.0/).
Share and Cite
MDPI and ACS Style
Fregonara, E.; Giordano, R.; Ferrando, D.G.; Pattono, S. Economic-Environmental Indicators to Support Investment Decisions: A Focus on the Buildings’ End-of-Life Stage. Buildings 2017, 7, 65. https://doi.org/10.3390/buildings7030065
AMA Style
Fregonara E, Giordano R, Ferrando DG, Pattono S. Economic-Environmental Indicators to Support Investment Decisions: A Focus on the Buildings’ End-of-Life Stage. Buildings. 2017; 7(3):65. https://doi.org/10.3390/buildings7030065
Chicago/Turabian StyleFregonara, Elena, Roberto Giordano, Diego Giuseppe Ferrando, and Sara Pattono. 2017. "Economic-Environmental Indicators to Support Investment Decisions: A Focus on the Buildings’ End-of-Life Stage" Buildings 7, no. 3: 65. https://doi.org/10.3390/buildings7030065
Note that from the first issue of 2016, this journal uses article numbers instead of page numbers. See further details here.