
Biomimetic Urban Design: Ecosystem Service Provision of Water and Energy


School of Architecture, Victoria University, P.O. Box 600, Wellington 6011, New Zealand
Buildings 2017, 7(1), 21; https://doi.org/10.3390/buildings7010021
Submission received: 2 December 2016
/
Revised: 16 February 2017
/
Accepted: 3 March 2017
/
Published: 8 March 2017
(This article belongs to the Special Issue Biomimetics in Sustainable Architectural and Urban Design)
Abstract
:This paper presents an ecosystem biomimicry methodology for urban design called ecosystem service analysis. Ecosystem services analysis can provide quantifiable goals for urban ecological regeneration that are determined by site specific ecology and climate of an urban area. This is important given the large negative environmental impact that most cities currently have on ecosystems. If cities can provide some of their own ecosystem services, pressure may be decreased on the surrounding ecosystems. This is crucial because healthier ecosystems enable humans to better adapt to the impacts that climate change is currently having on urban built environments and will continue to have in the future. A case study analyzing two ecosystem services (provision of energy and provision of water) for an existing urban environment (Wellington, New Zealand) is presented to demonstrate how the ecosystem services analysis concept can be applied to an existing urban context. The provision of energy in Wellington was found to be an example of an ecosystem service where humans could surpass the performance of pre-development ecosystem conditions. When analyzing the provision of water it was found that although total rainfall in the urban area is almost 200% higher than the water used in the city, if rainwater harvested from existing rooftops were to meet just the demands of domestic users, water use would need to be reduced by 20%. The paper concludes that although achieving ecological performance goals derived from ecosystem services analysis in urban areas is likely to be difficult, determining site and climate specific goals enable urban design professionals to know what a specific city should be aiming for if it is to move towards better sustainability outcomes.
1. Introduction
Biomimicry is the practice of human designers mimicking an organism, organism behaviour, or aspects of ecosystems in terms of form (what something looks like), material (what it is made of), construction (how it is made), process (how it works), or function (what it does) [1]. Although mimicking organisms is more common than mimicking how ecosystems work or what they actually do [2], it has been shown that the mimicry of ecosystems rather than individual organisms, particularly in the context of architectural or urban design, is likely to have better sustainability outcomes [3,4]. This research therefore explores the use of an ecosystem kind of biomimicry, based on an understanding of ecosystem services, to aid in the evolution of more sustainable urban environments.
Ecosystem services are the benefits that humans derive either directly or indirectly from ecosystems [5]. The Millennium Ecosystem Assessment estimates that 60% of global ecosystem services are currently degraded largely through human activities or are being managed unsustainably [6] despite the fact that people are entirely dependent on ecosystem services for their wellbeing, economies, and indeed survival [7]. Ecosystem services can be divided into provisioning services (such as the provision of food, water, and energy), regulation services (such as the regulation of climate, purification, and pollination), and supporting services (such as soil formation, provision of habitat, and fixation of solar energy). Many sources also list a fourth category named ‘cultural services’ which includes artistic inspiration, recreation, education, etc. [8,9].
It is well documented that most urban environments have significant negative effects on ecosystem services [10]. One way to reduce or to reverse this negative impact may be to create or re-design urban areas so that they more effectively provide, integrate with, or support ecosystem services, and therefore reduce pressure on local and distant ecosystems. Such a methodology also supports and works towards several of the United Nation’s Sustainable Development Goals devised in 2015 [11]. Healthier ecosystems more readily provide ecosystem services to humans that cannot be provided by the built environment itself or within urban environments, and can enable humans to better adapt to the impending impacts of climate change [12]. This is critical as cities continue to expand and as the climate continues to change [13], and is crucial given that more than half of all humans now reside in urban areas [14].
Ecosystems are the best known examples of the effective organisation of life on Earth [15]. Designing cities so that they emulate what ecosystems actually do, that is provide ecosystem services, enables design teams to know what the quantifiable site specific ecological goals should be for a development (either single building, neighbourhood, city section, or whole urban area) so it can potentially integrate with and contribute to existing ecosystems rather than deplete them. Rather than being conceived as stand-alone objects, buildings can be thought of as nodes in a connected system, enabling mutually beneficial interactions to occur between the built environment, ecosystems, and humans. This is the basis of ecosystem service analysis (ESA) [3]. ESA has been previously explained and justified by the author in more depth [1,3] and is used in this paper to practically demonstrate how it can be used to generate design goals for the redevelopment of an existing urban environment. Wellington, New Zealand has been used as the test case city as related to the two ecosystem services of provision of water and provision of energy.
2. Ecosystem Services in an Urban Context
All aspects of ecosystem functioning are important to a system as a whole, however given the large amount of ecosystem services that have been identified (often there are more than 26 [5,6,8]) and because of the limiting factor of the physical makeup of built environments, it was necessary to investigate which ecosystem services are most suitable for inclusion in ESA in an urban context. Seven ecosystem services or bundles of services were identified as applicable to a built environment context (see Table 1). For justifications and methodology used to determine the ranking of provisioning, supporting, and regulating ecosystem services for urban environments, see [16].
Basing sustainable urban design goals on the idea that a city could be designed to emulate the provision of this set of ecosystem services suggests that cities (and individual buildings as a part of it) could be designed with a deliberate focus on evolving a system that: provides habitats for species suitable for co-inhabitation with humans in the urban built environment; contributes to soil formation and fertility through careful cycling of bio-degradable wastes and recycling of non-biodegradable wastes; purifies air, water, and soil; contributes to regulating climate through mitigating greenhouse gas (GHG) emissions and the heat island effect, and by sequestering carbon; produces renewable energy; collects and distributes fresh water; and produces food for humans.
It should be noted that Table 1 does not include any ecosystem services related to human individual or community wellbeing. Typically these ecosystem services are called ‘cultural services’ [17]. This is not because it is assumed that the relationship between the living world and human emotional and mental wellbeing is not important. On the contrary, there is a rapidly growing body of evidence detailing the crucial importance of people developing and maintaining active relationships with the living world around them in terms of: socialisation [18]; managing stress, mood, and violence [19]; promoting recovery from trauma or illness [20]; and increasing concentration, learning outcomes, and productivity [21,22], for example. Ways to measure or examine these aspects of the benefits of ecosystem services and nature in general in cities, as well as ways to incorporate this knowledge into urban and architectural design (such as through biophilic design for example [23,24,25]), tend to be quite different in how provisioning, supporting, and regulating services might be dealt with and therefore fall outside of the ESA methodology discussed here. A thorough examination and planning process to increase ecosystem services in cities should take into account cultural services [26].
3. Applying the Ecosystem Services Analysis Methodology to Urban Contexts
Ecosystem services analysis investigates the measurable levels of ecosystem service provision that occurred on a particular site when it was an undisturbed ecosystem, and then compares this to the current provision of ecosystem services on the same site, which typically is now urban, to determine goals for sustainable development that are based on site specific ecological reality.
Information about the negative environmental impact of the built environment is often not relative to what level of use would be sustainable in a given place. A typical goal that fits into this way of thinking related to water consumption for a building might be 'to reduce water use by 10%’. This is based upon human defined goals related to economic, political, or convenience factors. It does not relate to what could be physically possible at a given site. A goal, again related to water consumption but based on understanding ecosystem services in an urban context, might be to ‘tailor water use within a given site to the amount of rainfall the site receives’. This second kind of target is based upon the physical possibilities a specific site affords, can be clearly measured, and enables a development to be understood in the wider context of its specific ecosystem.
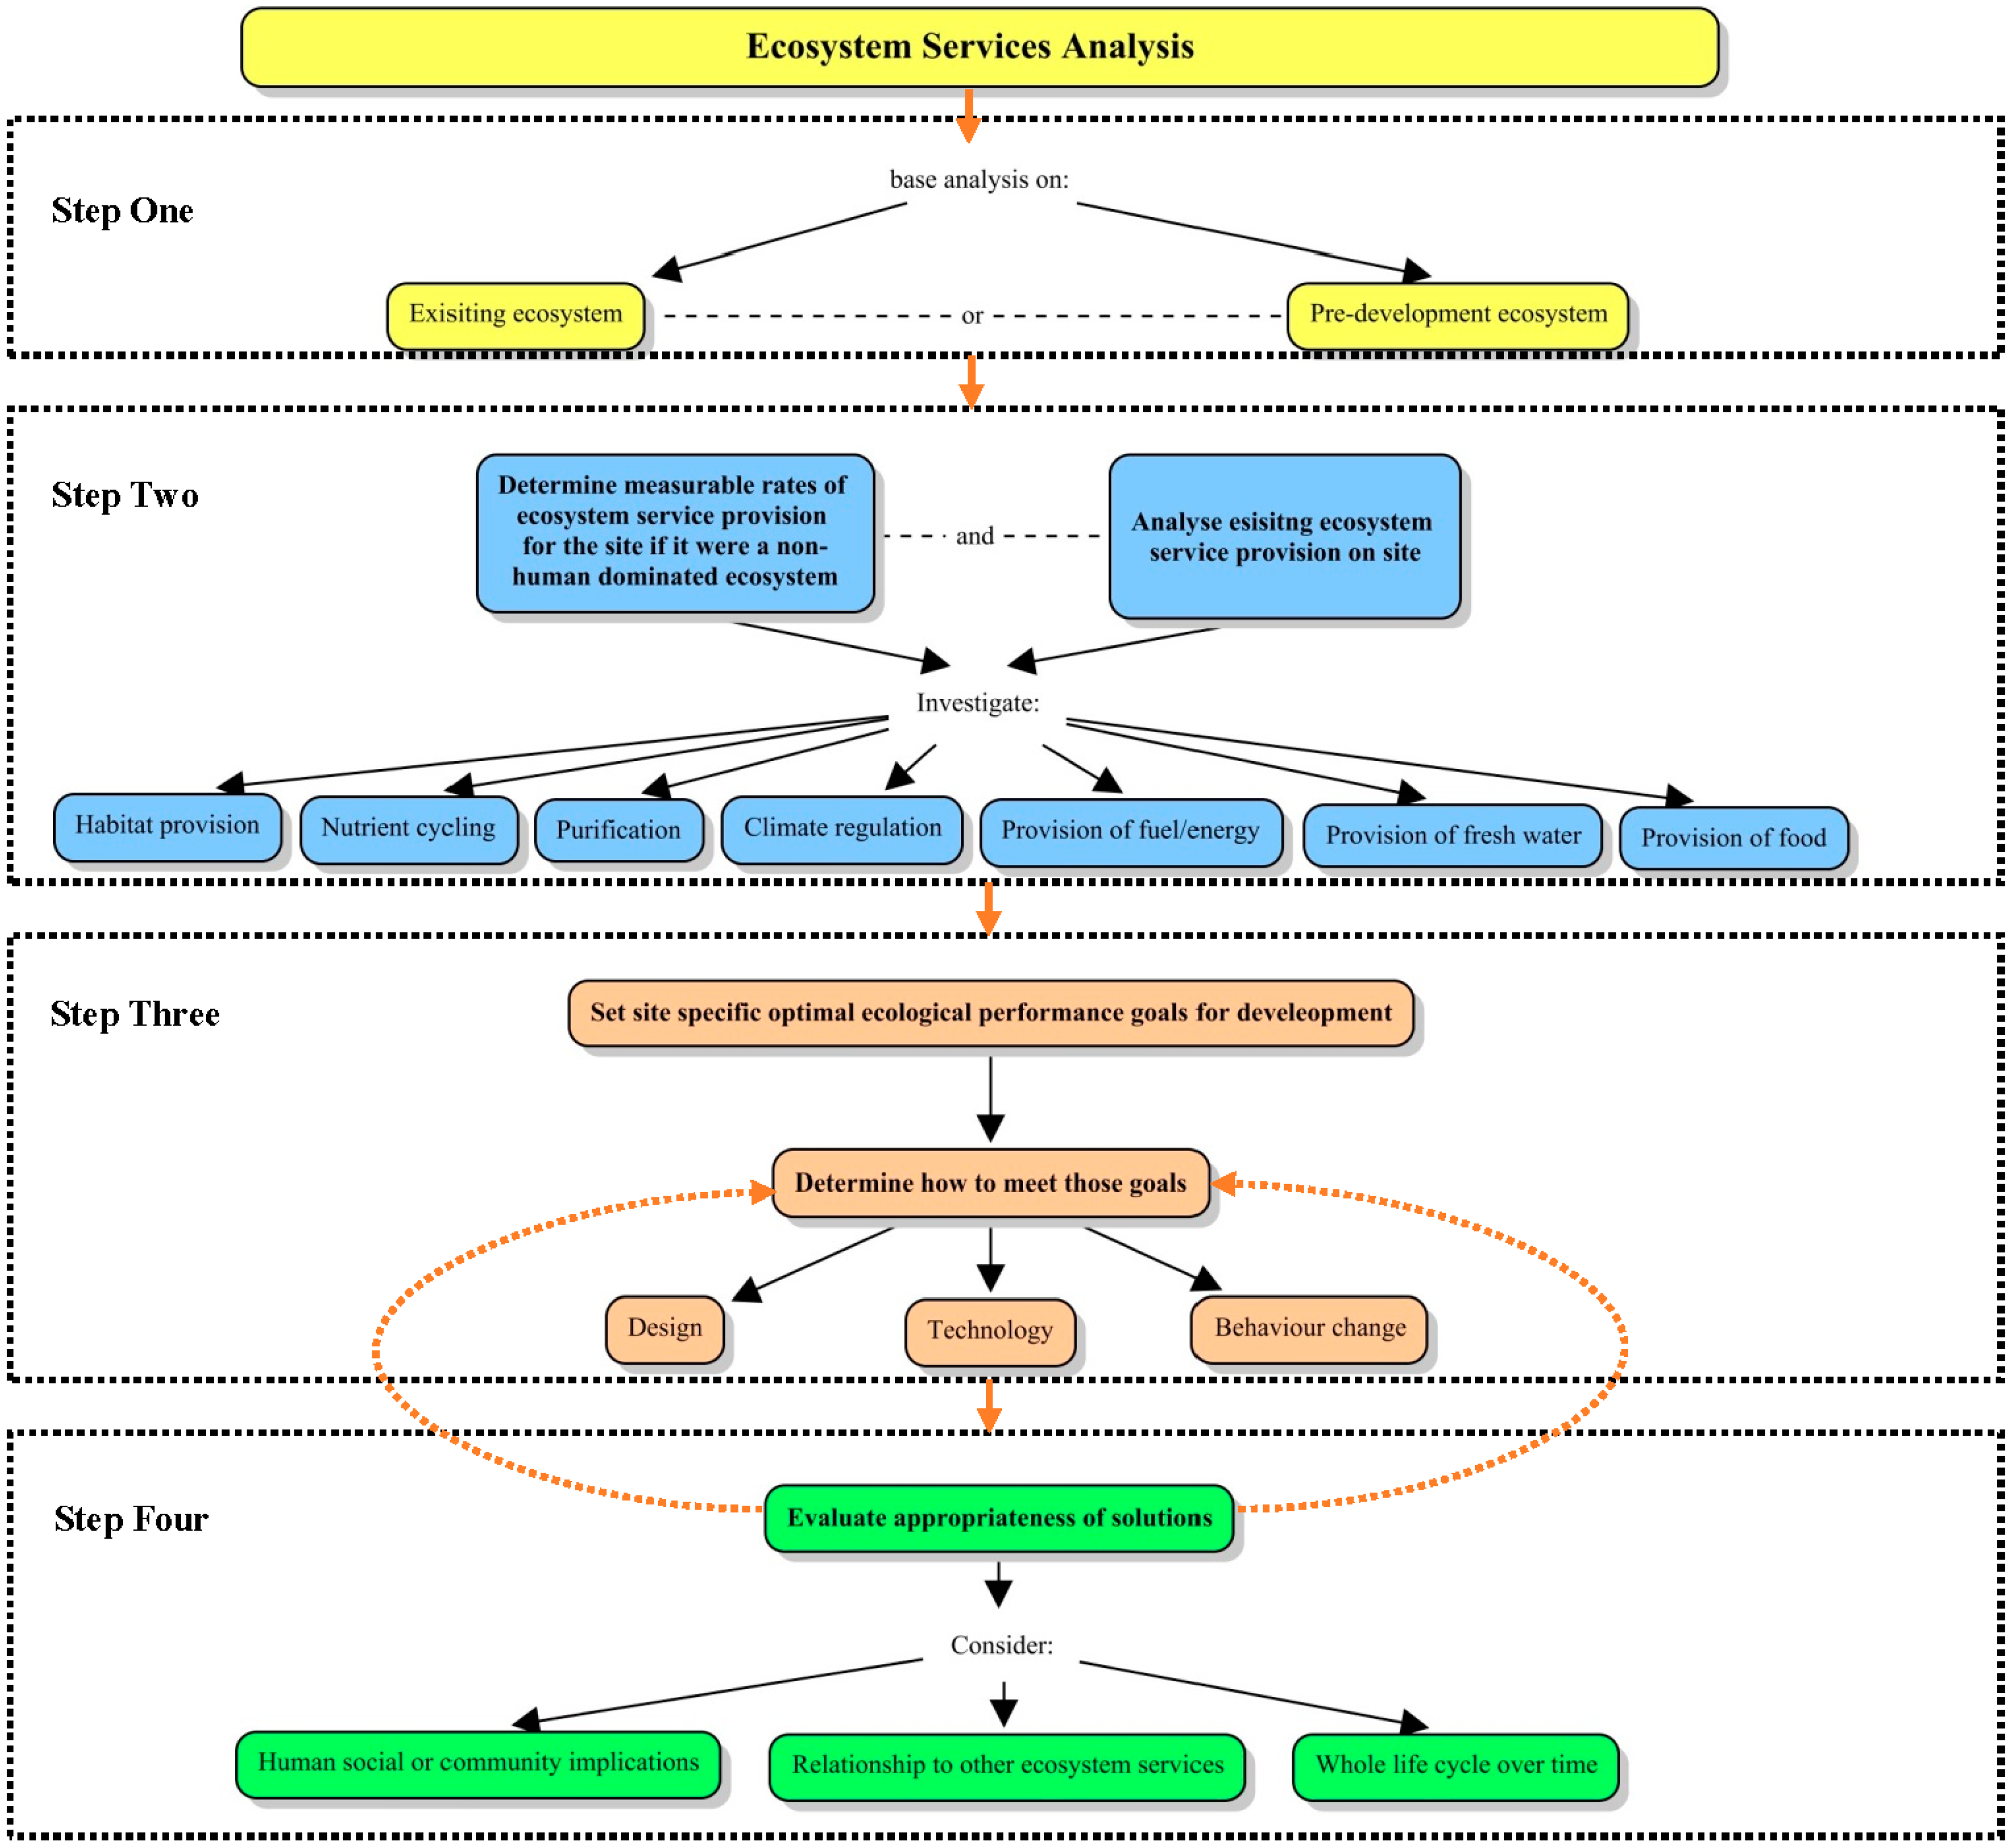
Figure 1 summarises the ESA methodology. Step one in applying ecosystem services analysis to urban design is to determine if there is a healthy existing ecosystem in the locality that can be studied. If not, basing design targets on an ecosystem that existed prior to development on the site could be adequate. Measurable rates of ecosystem service provision that existed on a site can then be determined. For example, specific figures such as annual rainfall and water retention in a particular place relate to the ecosystem service of provision of water, and can be calculated with accuracy.
The second step is to determine the levels of ecosystem provision that currently exist at the same site. Although there are knowledge gaps in the field of ecology related to measuring some ecosystem services [27], each ecosystem service has aspects that can be measured and are useful in setting initial site specific ecological targets for regenerative design.
Determining targets for the optimal environmental performance of the built environment that is (or will be) on the same site as the ecosystem studied is the third step of ESA. Once targets have been ascertained, a plan to meet these targets must be devised. Solutions may involve the design, re-design, or evolution of places, systems, and relationships. They may also involve the addition of certain technologies, or they may be more related to encouraging lasting behaviour change of city residents and businesses.
The final step of the ESA process is to evaluate the appropriateness of the solutions proposed in step three. It is crucial that any targets or suggested interventions are analysed from a life cycle perspective over time and also in relation to potential impacts on other ecosystem services. This is to make sure that actions to increase the provision of one ecosystem service do not impact negatively on another. The services of ecological footprint experts, lifecycle analysts, and ecologists with local knowledge may be required to ascertain this. It is also crucial to evaluate the possible impacts that solutions proposed in step three could have on human individuals or society.
4. Testing Ecosystem Services Analysis: A Case Study
A case study of how ESA could be applied to an existing urban context was conducted. The intention of this was to illustrate how ESA could be employed to evaluate existing built environments and help to devise ecological sustainability goals for their re-development or evolution, and to demonstrate, or disprove, the potential usefulness of ESA for urban design. The case study focused on New Zealand’s capital city of Wellington. The location was chosen because of the relatively young age of the city which is approximately 150 years. This refers to the beginning of the larger scale and permanent urban built environment in the region rather than human habitation itself, which began much earlier when successive Māori Tribes settled in the area. The second reason for choosing Wellington was because information and accounts about the conditions and makeup of the original ecosystem before European settler development were available. This complemented a sizeable amount of existing sustainability focused initiatives and data concerning the city available for analysis.
An examination of the pre-development ecosystems that existed on the site of Wellington was conducted to ascertain how a fully functioning and climatically appropriate system probably worked. The in-depth methodology followed to arrive at the figures and numbers determined for each of the seven ecosystem services cannot be reproduced in this paper. Instead, a condensed analysis of just the provision of energy and provision of water services is presented as an example of how to conduct an ecosystem services analysis for a particular ecosystem service in a specific place. For thorough details and results of the analysis of the other ecosystem services, refer to [16].
Wellington has a population of approximately 200,000 people. It is a coastal city of steep and varying terrain surrounding one side of a large harbour at the southern end of the North Island/Te Ika-a-Māui. Wellington is an expanding city that is becoming more densely populated [29]. Despite this, Wellingtonians typically live in stand-alone single or double storey detached dwellings [30] set on small parcels of land in suburbs surrounding a small central business district. The Wellington City Council (WCC) manages 2800 to 3600 hectares of publicly owned open space. At least 70% of this is set aside as reserves due to recreational or scenic value. This compares to 4200 hectares of built urban space including land reserved for roads [31]. Before widespread human settlement (mid 1800s), Wellington, like the rest of New Zealand, was almost exclusively covered by temperate rainforest. Currently almost 40% of the wider Wellington City area is built upon. Less than 24% is native vegetation, of which less than 1% is original native forest [32].
4.1. Provision of Water in Wellington
The hydrological cycle drives the provision of water. Water is stored in lakes, rivers, ice, snow, wetlands, in soil and biomass, and underground in aquifers which are typically recharged by rainfall or snow or glacial melt. Water provision is an important factor in future adaptation to climate change as weather patterns that bring increased or decreased rainfall change [33]. Continued potable water supply has been identified as being vulnerable due to climate change in Wellington [34].
4.1.1. The Provision of Water before Urban Development
It was assumed that the current rainfall is approximately the same as rainfall before urban development in Wellington. The average rainfall is 1270 mm per year, equating to 368 million m3 in total [35]. Approximately 58 million m3 of rain falls onto the urban area of the city (4200 hectares) annually. While major rivers still exist from pre-development times, several streams have disappeared, or are now piped underground in the urban environment. Hydrological flows are expected to have changed significantly from pre-development conditions due to extensive deforestation and the development of urban infrastructure. Catchment areas were likely to be similar to current ones.
4.1.2. Current Provision of Water
Water for human use in Wellington comes predominantly from the Waiwhetū Aquifer and the Hutt, Orongorongo, and Wainuiomata Rivers [34]. The headwaters of the Hutt River at Kaitoke supply about half of urban Wellington’s needs (predominantly the northern suburbs). A combination of Waterloo and the catchment east of Wainuiomata supply water flow to Wellington’s central business district and southern and eastern suburbs. On average, 40% of Wellington’s water comes from the aquifer and 60% is sourced from rivers [34]. The Greater Wellington Regional Council (GWRC) states that the purity of this water is an outcome of the ecosystem service of purification supplied by the surrounding forest [36].
WCC purchases approximately 30 million m3 of water per year from the GWRC and intends to stabilize consumption at this level. 7 million m3 is for commercial purposes and is metered [35]. Per capita daily domestic water use is approximately 165 L [29], totaling approximately 12 million m3 of water. The remainder of the water usage is leakage from both public and private pipes, flushing of hydrants, water for fire-fighting, watering of council owned parks and gardens, street cleaning, burst mains and reservoir overflow, and water removed without permission from hydrants [35].
4.1.3. Results and Discussion: Design Goals for the Provision of Water
A comparison was made between the current use of water and the potential of the pre-development ecosystem to provide this level of ecosystem service. Demand management through water efficiency technologies (if shown to be appropriate over a whole lifecycle) and through behavior change measures should be a first priority to reducing the amount of water used. In New Zealand, in areas served by rainwater tanks rather than reticulated supply systems, per capita water demand is reduced [37]. If combined with technological methods to reduce water consumption (such as low flow shower heads) reductions could be on the order of 25% [38]. This means that calculations in the following section may underestimate the ability of the built environment in Wellington to meet water demand by up to 25%.
Looking specifically at domestic water use in Wellington and assuming each household is made up of 2.6 people [39] consuming 165 L per day [29], each dwelling would need to capture and store 156,585 L of rainwater per year (157 m3). This assumes that suitable water capture surfaces and storage tank installations are available. It also assumes captured and stored rainwater is of a suitable quality for domestic needs. The average size of the 74,000 dwellings in Wellington City is 112 m2, with a corresponding roof area of 123 m2, suggesting that each dwelling could capture a maximum of 125 m3 of water per year (80% of the currently required 157 m3). This equates to 9.2 million m3 per year across all domestic dwellings, or 80% of domestic and 31% of the current total water use. Collecting more rainwater could also decrease stormwater discharge, and reduce some pollution entering the harbor [29,40].
In summary, the amount of rainwater falling onto Wellington City exceeds the water used by citizens by more than 1000% (Figure 2). In the urban area the total rainfall is almost 200% higher than the water used by residents domestically and commercially. This suggests that harvesting rainwater in the urban environment is plausible, but given calculations of roof size and domestic water use, if the rainwater harvested were to meet just the demands of domestic users, a reduction of 20% in water use would be necessary or additional rainwater harvesting, storage, and reticulation would need to occur.
If the built environment were to harvest rainwater even at levels below 100% of the current domestic usage, the water in aquifers and rivers may be better able to provide other ecosystem services and support regeneration of the habitat and biodiversity, potentially enabling riparian and marine ecosystems to regenerate. Additional benefits could include reduced impact of stormwater runoff, reduced demand for piped potable water, reduced energy use, and contributions to groundwater preservation [41].
Supplying all dwellings in Wellington with rainwater tanks would be a resource expensive undertaking, so it may be preferable to leave existing reticulated systems in place and stipulate rainwater collection requirements for new and retrofitted buildings [42]. If such dwellings in Wellington were required to harvest the maximum amount of rainwater relative to roof size to provide for their domestic needs, this would start to move towards the 12 million m3 total required to supply domestic water use. However, to cover 100% of the city’s water needs, commercial, institutional, and industrial sites would need to harvest an additional 21 million m3 of rainwater per year.
Designers of an individual development could calculate the capacity of the roof and site to harvest and store water and make sure that this was at least above the projected water consumption. Excess water could be used to substitute the city water supply to older neighboring developments or apartments that cannot collect sufficient rainwater. Further research is needed to ascertain whether this is plausible in a commercial context, how it could be done, and if there would be any negative ecological impact from such an initiative. Care should also be taken to ensure additional rainwater harvesting infrastructure does not have negative ecological impacts over its lifecycle that would degrade other ecosystem services, and that collection surfaces and methods do not impact negatively on human health.
The WCC has already determined a 30 million m3 cap for water use in Wellington (although this is not just rainwater), so this is an example of an ecosystem service where humans could potentially stay within the capacity of the local ecosystem to provide the service.
4.2. Provision of Energy in Wellington
The provision of biomass fuels and the conversion of wind, hydro, and solar energy to electricity and heat is an essential ecosystem service for human society. The following discussion will serve as an example of one way that the provision of energy can be analyzed for a built environment context to devise biomimetic ecosystem based design goals.
4.2.1. The Provision of Energy before Urban Development
Woody biomass in New Zealand produces approximately 8.22 MJ (green offcuts) per kilogram (2,285 kWh per tonne) [43]. Although this relates to exotic Pinus radiata plantations, so it may be an over estimate, it is possible to work out how much energy potential Wellington’s pre-development native forests would have had if their annual biomass growth was converted into energy. The author is not suggesting that forest biomass growth should be burned for energy, but understanding the energy potential inherent in pre-development forests enables site specific ecosystem based goals to be devised for the built environment.
Pre-development native forest in Wellington likely produced 8.4 tonnes per hectare per year of biomass through photosynthesis [44]. This means the pre-development ecosystem of Wellington would have produced 168,000 tonnes of biomass per year. This relates to ‘as harvested’ or wet weight, whereas biomass is normally burnt after drying.
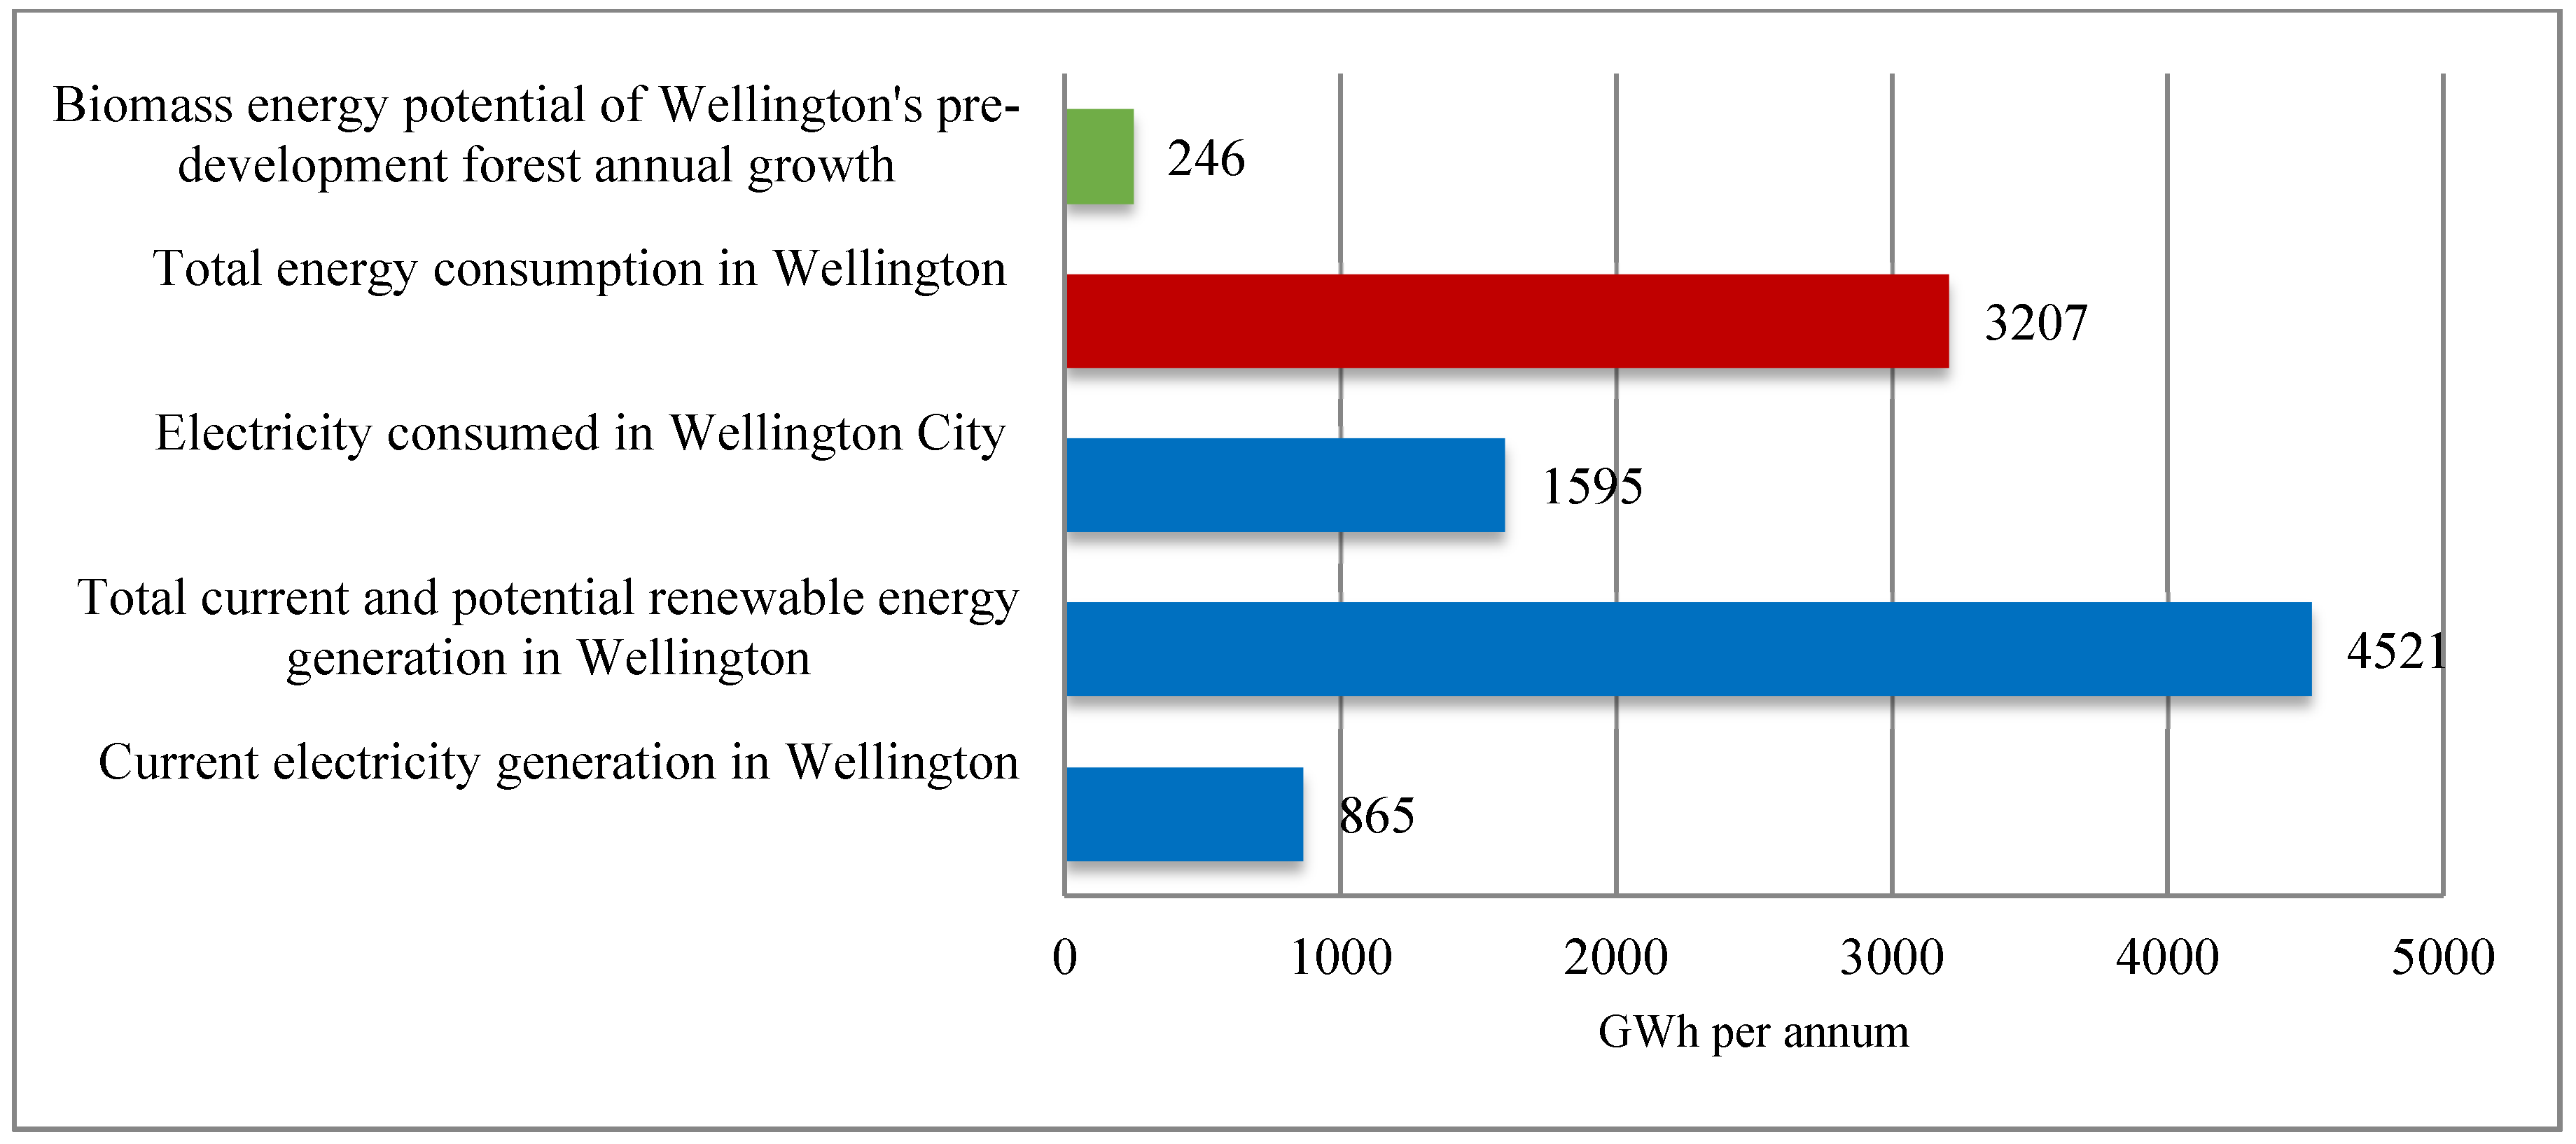
Conversion factors for the amount of energy recoverable from biomass vary depending on how the fuel is used. The efficiency of open fires can be as low as 10% while some wood burners reach 85% efficiency [45]. The New Zealand National Environmental Standards for Air Quality [46] state that wood burners must have a minimum efficiency of 65%. Using this figure, Wellington’s pre-development forest could have produced approximately 250 GWh of energy per year if the annual biomass increase was converted into energy.
4.2.2. The Current Provision of Energy
Electricity use for the Greater Wellington Region with a population of 389,700 was 3144 GWh in 2009 [47]. The Wellington City population of 197,700 would have therefore consumed 1595 GWh of electricity if the Greater Wellington Region figure was averaged out on a per capita basis.
Currently in Wellington there are four power generating operations (Table 2). Electricity generation within Wellington is almost exclusively from Meridian Energy’s Westwind project at almost 40%. This is unusual compared to national statistics for energy generation, where wind accounts for only 4% of the total electricity generation.
4.2.3. Results and Discussion: Design Goals for the Provision of Energy
Assuming that local power generation schemes could supply only local needs (currently they power a national grid), existing power generation schemes within Wellington could cover approximately 54% of Wellington City’s current annual electricity demand. This suggests that at least 46% of current electricity demand (734 GWh) needs to be generated locally in the future, which could be a goal for a rate of electricity generation for the local built environment.
If the 734 GWh shortfall were to be met by domestic building integrated systems, each household in Wellington would need to produce a little more than 9 MWh per annum. This would equate to an 8.5 kW photovoltaic system or approximately 60 solar panels per house, occupying an area of 60 m2 of the north facing roof. To install such a system would currently be very expensive. Mithraratne suggests micro wind turbines on houses or buildings would only contribute up to 30% of the domestic power supply in Wellington’s urban environment and that large scale centralized wind farms would generate up to 11 times more energy, therefore being more effective [50]. The wind around buildings tends to be more turbulent, erratic, and weak. Therefore, it may be most effective for additional large scale wind powered electricity generating schemes to be installed on the city fringes rather than using building integrated wind energy generators.
Concurrently, or before efforts to generate more local energy are made, energy efficiency initiatives (either behavior or technology based) should be used to lower energy demand. The use of solar hot water systems may be a feasible and effective addition to roof tops in Wellington and if employed on a large scale could lower the initial demand for grid sourced electricity. The annual saving for a single family household using a typical solar hot water system (likely to be electric in New Zealand) in Wellington is 2733 kWh [51]. This equates to a saving of 202 GWh (13% of the total electricity usage) for the city per annum if each of Wellington’s 74,000 dwellings had a typical solar hot water system installed. This would mean only 532 GWh of additional electricity would need to be generated to reach a 100% local electricity generation target. Even if only new dwellings in the Wellington region were required to have a solar hot water system, annual savings of 7.5 GWh may accrue [51].
Sinclair Knight Merz identifies additional potential wind (700 MW) and hydro (170 MW) energy sources in the Greater Wellington Region [52]. If these options were combined with current power generation in Wellington, this would provide 283% of the current electricity for Wellington City (Figure 3).
As part of future planning, it must be determined if increased energy production for humans would have a detrimental effect on biodiversity or other ecosystem services over the long term. Hydro power generation, for example, could have negative impacts for certain river and riparian ecosystems [53]. This illustrates that because focusing on one ecosystem service alone could impact negatively on others, it is important to consider the relationships between ecosystem services. What is clear is that it is feasible for existing electricity generation schemes in Wellington, combined with electricity efficiency adjustments made to the built environment, to achieve at least 100% of the current electricity from local renewable resources, predominantly wind.
In 2007, the total energy consumption per capita in the Greater Wellington Region was 58.4 GJ or 0.02 GWh [54]. This means that the total energy use in Wellington City is approximately 3207 GWh per annum. Considering just existing power generation schemes (Table 2), Wellington could provide for 27% of its total energy use if electricity were substituted for other fuels (gas, coal, and oil) where possible. Given the potential for more than 100% of electricity currently used in Wellington to be generated within Wellington (up to 283%), 141% of the total current energy needs could potentially be supplied.
At present, Wellington generates 351% of the energy that the pre-development ecosystem could produce on an annual basis. The provision of energy in Wellington was the only example of an ecosystem service where humans could surpass the performance of pre-development ecosystem conditions in a wider case study that examined all seven ecosystem services for urban contexts [16]. This is not surprising given humanity’s current ability to exploit the energy reserves of the planet. A different way of looking at these results would be to aim for a future maximum energy use cap for Wellington of 246 GWh per annum, based on the biomass energy potential of Wellington’s pre-development forest annual growth.
Solving environmental problems is not as simple as switching from a fossil fuel energy based economy to a renewable energy one. An examination of how energy is used and what it is used for must also occur, to challenge the current positive feedback loop created between the use of energy and ecosystem degradation [55]. Human use of energy degrades ecosystems in many direct and indirect ways, which leads to more energy use to try to artificially replace the ecosystem services lost, which then leads to more ecosystem degradation [55]. Until such issues are solved, or at least examined, ecosystem service derived energy use caps may act to initiate a kind of moratorium on human activities utilizing energy that at present often result in ecosystem degradation. It is acknowledged that such a low energy cap (7.6% of the current total energy use or 15.4% of current electricity use), or even a cap of current energy use, would be politically improbable, considering that the trend in Wellington, as in most other urban settings, is for both the overall population as well as per capita consumption of energy to increase. A cap that reduces energy use, even by smaller margins, would entail widespread and probably difficult to accept behavior change on the part of Wellington’s residents and businesses.
5. Conclusions: Findings and Implications of the Case Study
The ecosystem services analysis methodology presented and demonstrated in this paper is an evolution of the application of biomimicry to architectural and urban design that considers how humans can best emulate what ecosystems do. Using ESA enables the successes or failures of developments to be gauged from a perspective of site and climate specific ecological reality. It avoids anthropocentric centred development goals and unhelpful design metaphors that are difficult to quantify. ESA also enables tangible benchmarks to be devised over different time periods, and lends itself to long term planning.
Practically, a finding of the case studies presented in this paper was that the roof tops of buildings become important vehicles for potential energy and/or rainwater harvest. Although many ecosystem services can be provided on the same piece of land or building infrastructure with thoughtful design, where conflicts do exist between ecosystem services (such as using land or rooftops for energy generation or rainwater harvesting), comparative spatial analysis and mapping tools may be useful to determine which parts of the city, or even individual neighbourhoods or buildings, are best suited to the provision of each ecosystem service.
In an ideal situation, ecosystem services used in an urban context would be provided by the built environment or through local regeneration of ecosystems on site, and ecological performance targets would be specific to a particular site, or region [56]. The application of ESA to urban design has significant implications because it asks design teams to judge their environmental performance goals against the best an ecosystem could or did do on the same site and in the same climate, rather than on standards defined by humans. Employing ESA, particularly in the pursuit of regenerative built environments, may therefore require a rethinking of key performance indicators. The use of ESA in design processes will mean working much more closely with ecologists and other professionals not typically associated with urban design and allowing additional time for conducting research on local ecosystems.
New or retrofitted developments using an understanding of ecosystem services that become able to contribute to the health of ecosystems, even only in part, could act as filters (purifying air and water), providers (of food and water), and generators (of energy) for the rest of the surrounding existing built environment. Current existing urban areas are likely to endure for a considerable time, during which they will still be degrading ecosystems and climate. If individual developments within existing urban settings could start to contribute to ecosystem services beyond their own needs or boundaries, or produce them, the built environment causes of climate and ecosystem degradation may in part be mitigated.
The initial wider case study research [16] indicated that for some services, particularly the provision of habitat, the regulation of climate, and the provision of food, it is likely to be very difficult to meet such goals without a radically different way of creating and living in the built environment, at least in the context of Wellington, and probably most modern cities. The case studies presented in this paper show however that for other ecosystem services, namely the provision of energy and the provision of water, it is potentially feasible for a city to provide these services, or at least high proportions of them, through a combination of design and technological changes or additions, as well as realistic behavior change. Despite the difficulty in practically realising ecosystem service based urban design goals, such aims that are derived from ESA may enable urban design professionals to know what ecological performance targets should be for specific cities if they are ultimately to become agents of ecological regeneration rather than damage.
Acknowledgments
I would like to thank Routledge press who has agreed to publish an expanded discussion of ecosystem services analysis in an upcoming book entitled Regenerative Urban Design and Ecosystem Biomimicry, scheduled to be released in 2018. Thank you also to the anonymous reviewers of this article. Addressing their comments significantly improved the paper.
Conflicts of Interest
The author declares no conflict of interest.
References
- Pedersen Zari, M. Mimicking ecosystems for bio-inspired regenerative built environments. J. Intell. Build. Int. (IBI) 2016, 8, 57–77. [Google Scholar] [CrossRef]
- Pedersen Zari, M. Ecosystem processes for biomimetic architectural and urban design. Archit. Sci. Rev. 2015, 58, 106–119. [Google Scholar] [CrossRef]
- Pedersen Zari, M. Ecosystem services analysis for the design of regenerative built environments. Build. Res. Inf. 2012, 40, 54–64. [Google Scholar] [CrossRef]
- Reap, J.; Baumeister, D.; Bras, B. Holism, biomimicry and sustainable engineering. In Proceedings of the ASME International Mechanical Engineering Conference and Exposition, Orlando, FL, USA, 5–11 November 2005.
- De Groot, R.; Wilson, M.A.; Boumans, R.M.J. A typology for the classification, description and valuation of ecosystem function, goods and services. Ecol. Econ. 2002, 41, 393–408. [Google Scholar] [CrossRef]
- Millennium Ecosystem Assessment. Ecosystems and Human Well-Being: Current State and Trends; Island Press: Washington, DC, USA, 2005; Volume 1. [Google Scholar]
- Díaz, S.; Fargione, J.; Chapin, F.S., III; Tilman, D. Biodiversity loss threatens human well-being. PLoS Biol. 2006, 4, e277. [Google Scholar]
- Costanza, R.; d’Arge, R.; de Groot, R.; Farber, S.; Grasso, M.; Hannon, B.; Limburg, K.; Naeem, S.; O’Neil, R.V.; Paruelo, J.; et al. The value of the world's ecosystem services and natural capital. Nature 1997, 387, 253–260. [Google Scholar] [CrossRef]
- Costanza, R.; Folke, C. Valuing ecosystem services with efficiency, fairness, and sustainability as goals. In Nature Services; Daily, G., Ed.; Island Press: Washington, DC, USA, 1997; pp. 49–68. [Google Scholar]
- Rees, W. The built environment and the ecosphere: A global perspective. Build. Res. Inf. 1999, 27, 206–220. [Google Scholar] [CrossRef]
- UN General Assembly. Transforming Our World: The 2030 Agenda for Sustainable Development; United Nations: New York, NY, USA, 2015. [Google Scholar]
- Pedersen Zari, M. Biomimetic design for climate change adaptation and mitigation. Archit. Sci. Rev. 2010, 53, 172–183. [Google Scholar] [CrossRef]
- McKinney, M.L. Urbanization, biodiversity, and conservation. Bioscience 2002, 52, 883–890. [Google Scholar] [CrossRef]
- Eigenbrod, F.; Bell, V.A.; Davies, H.N.; Heinemeyer, A.; Armsworth, P.R.; Gaston, K.J. The impact of projected increases in urbanization on ecosystem services. Proc. R. Soc. B Biol. Sci. 2011, 278, 3201–3208. [Google Scholar] [CrossRef] [PubMed]
- Vincent, J. New materials and natural design. In Bulletproof Feathers; Allen, R., Ed.; University of Chicago Press: Chicago, IL, USA, 2010. [Google Scholar]
- Pedersen Zari, M. Ecosystem Services Analysis for the Design of Regenerative Urban Built Environments; Victoria University of Wellington: Wellington, New Zealand, 2012. [Google Scholar]
- Daniel, T.C.; Muhar, A.; Arnberger, A.; Aznar, O.; Boyd, J.W.; Chan, K.M.A.; Costanza, R.; Elmqvist, T.; Flint, C.G.; Gobster, P.H.; et al. Contributions of cultural services to the ecosystem services agenda. Proc. Natl. Acad. Sci. USA 2012, 109, 8812–8819. [Google Scholar] [CrossRef] [PubMed]
- Taylor, A.F.; Kuo, F.E.; Sullivan, W.C. Views of nature and self discipline: Evidence from inner city children. J. Environ. Psychol. 2002, 22, 49–63. [Google Scholar] [CrossRef]
- Kuo, F.E.; Sullivan, W.C. Environment and crime in the inner city: Does vegetation reduce crime? Environ. Behav. 2001, 33, 343–367. [Google Scholar] [CrossRef]
- Ulrich, R. View through a window may influence recovery from surgery. Science 1984, 224. [Google Scholar] [CrossRef]
- Tennessen, C.M.; Cimprich, B. Views to nature: Effects on attention. J. Environ. Psychol. 1995, 15, 77–85. [Google Scholar] [CrossRef]
- Keniger, L.; Gaston, K.; Irvine, K.; Fuller, R. What are the benefits of interacting with nature? Int. J. Environ. Res. Public Health 2013, 10, 913–935. [Google Scholar] [CrossRef] [PubMed]
- Kellert, S.R.; Heerwagen, J.H.; Mador, M.L. Biophilic Design; John Wiley & Sons: Hoboken, NJ, USA, 2008. [Google Scholar]
- Kellert, S.R. Building for Life; Island Press: Washington, DC, USA, 2005. [Google Scholar]
- Browning, W.; Ryan, C.; Clancy, J. 14 Patterns of Biophilic Design; Terrapin Bright Green: New York, NY, USA, 2014. [Google Scholar]
- Coutts, C.; Hahn, M. Green infrastructure, ecosystem services, and human health. Int. J. Environ. Res. Public Health 2015, 12, 9768–9798. [Google Scholar] [CrossRef] [PubMed]
- Ten Brink, P.; Berghöfer, A.; Neuville, A.; Schröter-Schlaack, C.; Vakrou, A.; White, S.; Wittmer, H. Chapter 10: Responding to the value of nature. In The Economics of Ecosystems and Biodiversity for National and International Policy Makers; ten Brink, P., Ed.; Earthscan: London, UK, 2011. [Google Scholar]
- Pedersen Zari, M. Ecosystem services analysis: Mimicking ecosystem services for regenerative urban design. Int. J. Sustain. Built Environ. (IJSBE) 2015, 4, 145–157. [Google Scholar] [CrossRef]
- Quality of Life Research Team. Quality of Life in Twelve of New Zealand’s Cities; Qualty of Life Project, New Zealand Government: Wellington, New Zealand, 2007.
- Mithraratne, N.; Vale, B. Life cycle analysis model for New Nealand houses. Build. Environ. 2004, 39, 483–492. [Google Scholar] [CrossRef]
- Wellington City Council. Biodiversity Action Plan; Wellington City Council: Wellington, New Zealand, 2007.
- Rastandeh, A.; Pedersen Zari, M.; Vale, R.; Brown, D.K. Utilising exotic flora in support of urban indigenous biodiversity: Lessons for landscape architecture. J. Landsc. Res. 2017, in press. [Google Scholar]
- Taptiklis, N. Tool 2.5.3: Sym approach to present-day and future potable water supply and demand. In Impacts of Climate Change on Urban Infrastructure and the Built Environment Toolbox; The National Institute of Water and Atmospheric Research (NIWA): Auckland, New Zealand, 2011. [Google Scholar]
- The National Institute of Water and Atmospheric Research (NIWA); MWH New Zealand; GNS Science; Building Research Association of New Zealand (BRANZ). Potable water supply and demand modelling, Wellington. Case study. In Impacts of Climate Change on Urban Infrastructure & the Built Environment Toolbox; The National Institute of Water and Atmospheric Research (NIWA): Auckland, New Zealand, 2011. [Google Scholar]
- Wellington City Council. Water Usage 2017. Available online: http://wellington.govt.nz/services/environment-and-waste/water/wellingtons-water-supply/water-usage (accessed on 8 March 2017).
- Greater Wellington Regional Council. Proposed Regional Policy Statement for the Wellington Region; Wellington Regional Council: Wellington, New Zealand, 2010.
- Mistry, D.; Gabe, J.; Trowsdale, S. Transforming values and behaviours for sustainable futures: The role of rainwater tanks and the importance of experience. In Proceedings of the Sustainable Building Conference (SB10), Wellington, New Zealand, 26–28 May 2010.
- Mithraratne, N.; Vale, R. Rain tanks or reticulated water supply? In Proceedings of the Rainwater and Urban Design 2007, Sydney, Australia, 21–23 August 2007.
- Statistics New Zealand. 2006 Census: Quickstats; Statistics New Zealand: Wellington, New Zealand, 2006.
- Greater Wellington Regional Council. Stormwater Management. Issues and Options for the Wellington Region; Greater Wellington Regional Council: Wellington, New Zealand, 2005.
- Younos, T. Paradigm shift: Holistic approach for water management in urban environments. Front. Earth Sci. 2011, 5, 421–427. [Google Scholar] [CrossRef]
- Vale, R.J.D.; Ghosh, S. Water, water, everywhere…. Quantifying possible domestic water demand savings through the use of rainwater collection from residential roofs in Auckland, New Zealand. In Presented at the Urban Drainage Modeling and Water Sensitive Urban Design Conference, Melbourne, Australia, 2–7 April 2006.
- New Zealand Forest Research Institute. Biomass Calorific Value Calculator; EECA: Wellington, New Zealand, 2012. [Google Scholar]
- Egunjobi, J.K. Primary productivity and nutrient cycling in terrestrial ecosystems—A review with particular reference to New Zealand. Tuatara 1969, 17, 49–66. [Google Scholar]
- NZ Wood. Bioenergy and Timber. 2016. Available online: http://www.nzwood.co.nz/learning-centre/forests-and-wood-science-and-innovation/ (acessed on 16 November 2016).
- Ministry for the Environment. Resource Management (National Environmental Standards Relating to Certain Air Pollutants, Dioxins, and Other Toxics) Regulations 2004; New Zealand Government: Wellington, New Zealand, 2004.
- Electricity Authority. Electricity Demand by Region. 2009. Available online: http://www.ea.govt.nz/industry/modelling/cds/centralised-dataset-web-interface/electricity-demand-by-region/ (acessed on 20 December 2010). [Google Scholar]
- New Zealand Wind Energy Association. Project West Wind. 2011. Available online: http://www.windenergy.org.nz/nz-wind-farms/operating-wind-farms/project-west-wind (acessed on 23 February 2011).
- Eastern Research Group; MGM International Group. Landfill Biogas Recovery and Utilization at the Santo André Municipal Sanitary Landfill, Santo André, Brazil; US Environmental Protection Agency and Landfill Methane Outreach Programme: Santo André, Brazil, 2008.
- Mithraratne, N. Roof-top wind turbines for microgeneration in urban houses in New Zealand. Energy Build. 2009, 41, 1013–1018. [Google Scholar] [CrossRef]
- Gillingham, K. Economic efficiency of solar hot water policy in New Zealand. Energy Policy 2009, 37, 3336–3347. [Google Scholar] [CrossRef]
- Sinclair Knight Merz. Renewable Energy Assessment. Greater Wellington Region; Energy Efficiency and Conservation Authority: Wellington, New Zealand, 2006.
- Sternberg, R. Hydropower: Dimensions of social and environmental coexistence. Renew. Sustain. Energy Rev. 2008, 12, 1588–1621. [Google Scholar] [CrossRef]
- Landcare Research New Zealand. Regional Greenhouse Gas Inventory Tool; Landcare Research New Zealand; Greater Wellington Regional Council: Wellington, New Zealand, 2007.
- Bormann, F.H. An inseparable linkage: Conservation of natural ecosystems and the conservation of fossil energy. Bioscience 1976, 26, 754–760. [Google Scholar] [CrossRef]
- The Economics of Ecosystems and Biodiversity (TEEB). The Economics of Ecosystems and Biodiversity in National and International Policy Making; ten Brink, P., Ed.; Earthscan: London, UK, 2011. [Google Scholar]
Figure 1.
Ecosystem Services Analysis Process (adapted from: [28]).
Figure 1.
Ecosystem Services Analysis Process (adapted from: [28]).

Figure 2.
Water in Wellington.
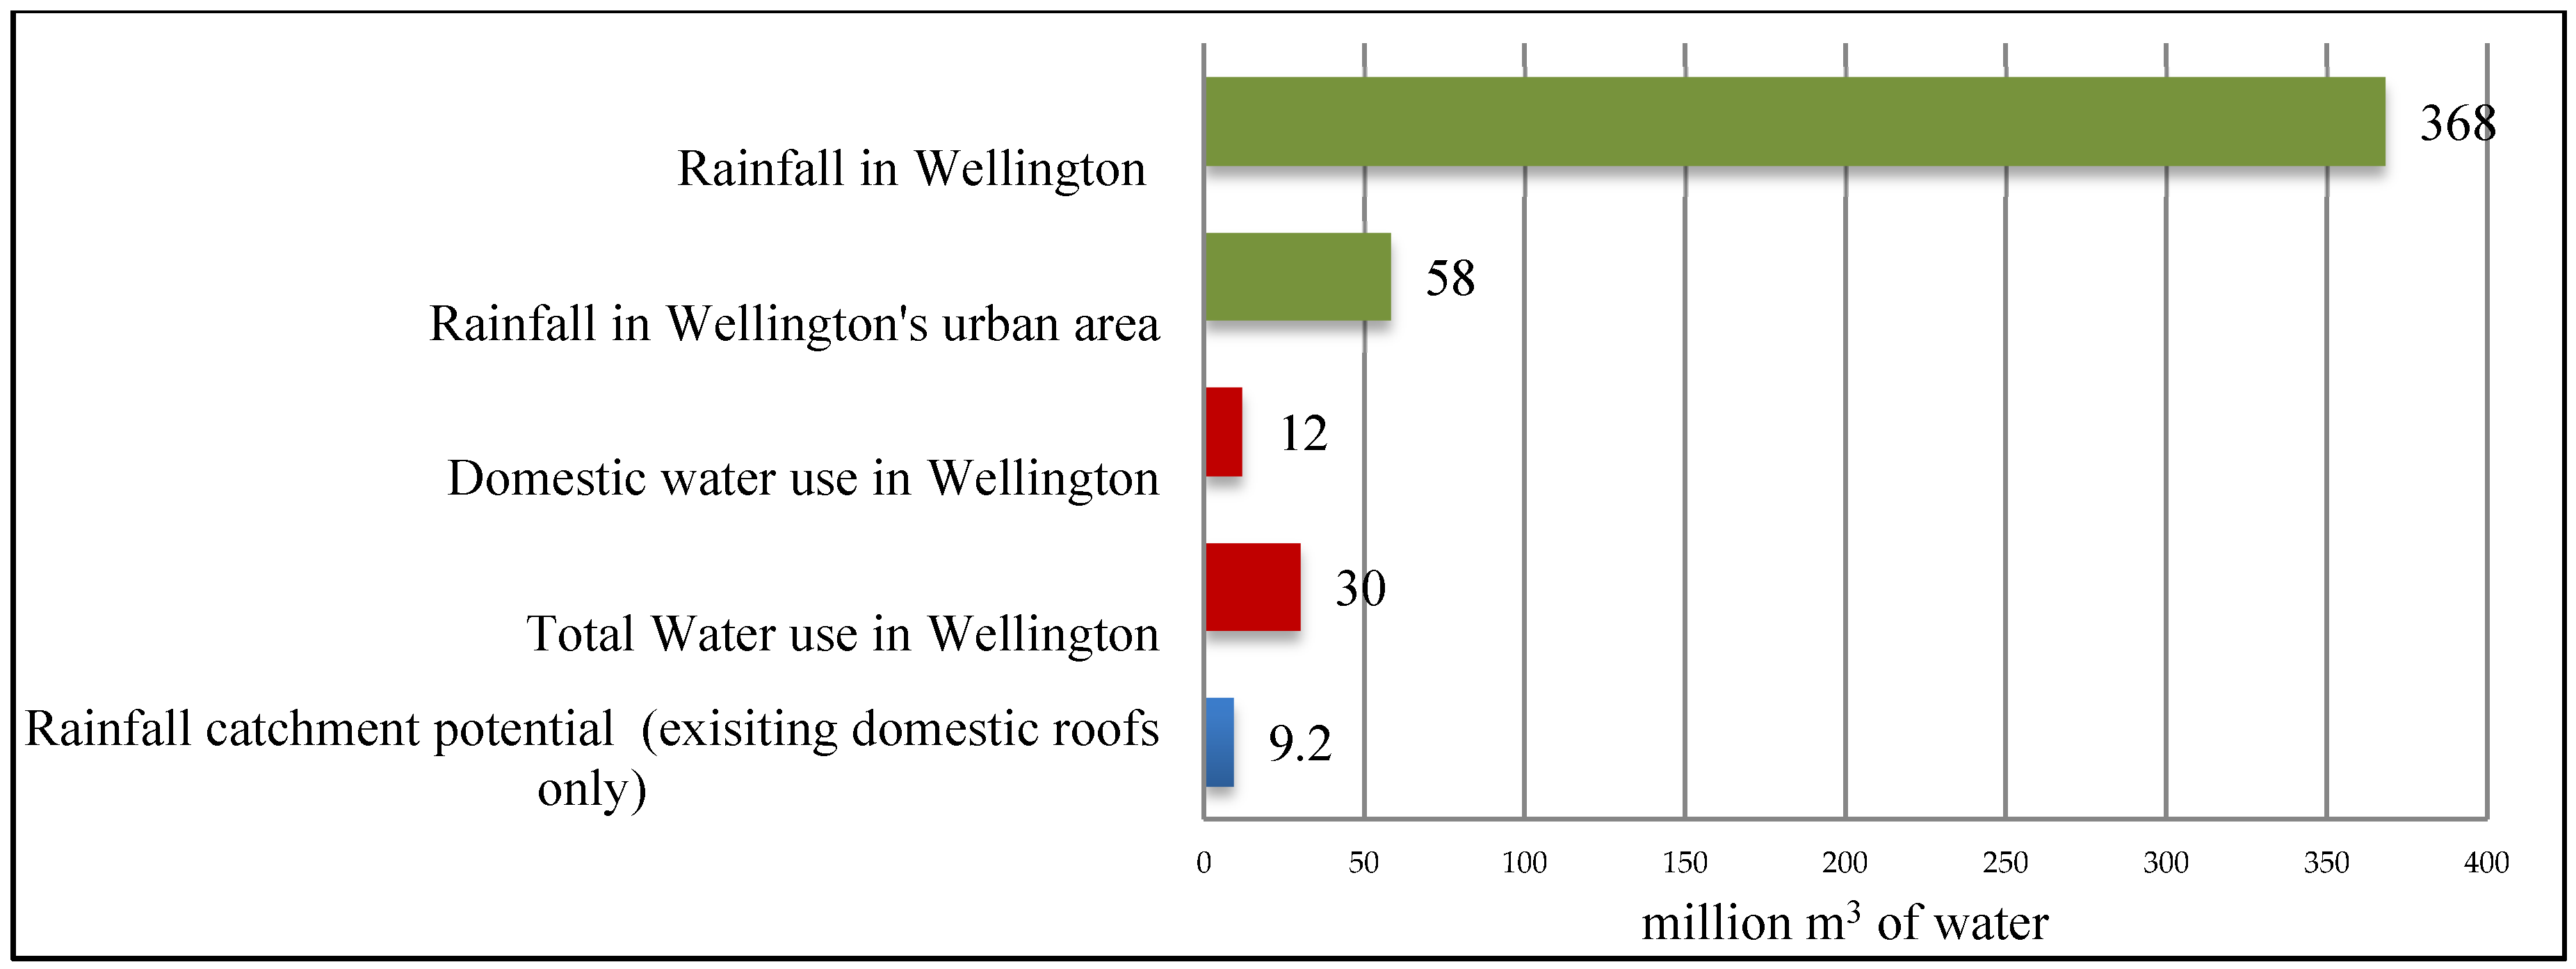
Figure 3.
Energy and electricity in Wellington.


| Ecosystem Services for Built Environment Contexts |
|---|
| 1. Habitat provision (including: genetic information, biological control, fixation of solar energy, and species maintenance) |
| 2. Nutrient cycling (including: decomposition, soil building, and raw materials) |
| 3. Purification |
| 4. Climate regulation |
| 5. Provision of energy |
| 6. Provision of water |
| 7. Provision of food |
| Name of Project | Company | Capacity (MW) | Capacity Factor (%) | GwH per Annum | Energy Source | % of Wgtn’s Annual Electricity Use |
|---|---|---|---|---|---|---|
| Westwind | Meridian | 143 | 47 * | 588.8 | Wind | 36.9 |
| Silver-stream (landfill) | Mighty River | 2.7 | 90 † | 21.3 | Biogas | 1.3 |
| Southern Landfill | Todd Energy | 1.1 | 90 | 8.7 | Biogas | 0.5 |
| Mill Creek | Meridian | 59.8 | 47 | 246.2 | Wind | 15.4 |
| Total Existing | 206.6 | 865 | 54.1 | |||
© 2017 by the author. Licensee MDPI, Basel, Switzerland. This article is an open access article distributed under the terms and conditions of the Creative Commons Attribution (CC BY) license ( http://creativecommons.org/licenses/by/4.0/).
Share and Cite
MDPI and ACS Style
Pedersen Zari, M. Biomimetic Urban Design: Ecosystem Service Provision of Water and Energy. Buildings 2017, 7, 21. https://doi.org/10.3390/buildings7010021
AMA Style
Pedersen Zari M. Biomimetic Urban Design: Ecosystem Service Provision of Water and Energy. Buildings. 2017; 7(1):21. https://doi.org/10.3390/buildings7010021
Chicago/Turabian StylePedersen Zari, Maibritt. 2017. "Biomimetic Urban Design: Ecosystem Service Provision of Water and Energy" Buildings 7, no. 1: 21. https://doi.org/10.3390/buildings7010021
Note that from the first issue of 2016, this journal uses article numbers instead of page numbers. See further details here.