Article

Evaluating Thermal Comfort in a Naturally Conditioned Office in a Temperate Climate Zone

1
Instituto Nacional de Eficiencia Energética y Energías Renovables, Quito 170507, Ecuador
2
Universidad Católica del Norte, Angamos 0610, Antofagasta, Chile
3
Universidad Regional Amazónica IKIAM, Km 7 Vía Muyuna, Tena, Ecuador
*
Author to whom correspondence should be addressed.
Buildings 2016, 6(3), 27; https://doi.org/10.3390/buildings6030027
Submission received: 25 April 2016 / Revised: 7 July 2016 / Accepted: 14 July 2016 / Published: 20 July 2016

Abstract

:
This study aims to determine the optimal approach for evaluating thermal comfort in an office that uses natural ventilation as the main conditioning strategy; the office is located in Quito-Ecuador. The performance of the adaptive model included in CEN Standard EN15251 and the traditional PMV model are compared with reports of thermal environment satisfaction surveys presented simultaneously to all occupants of the office to determine which of the two comfort models is most suitable to evaluate the thermal environment. The results indicate that office occupants have developed some degree of adaptation to the climatic conditions of the city where the office is located (which only demands heating operation), and tend to accept and even prefer lower operative temperatures than those considered optimum by applying the PMV model. This is an indication that occupants of naturally conditioned buildings are usually able to match their comfort temperature to their normal environment. Therefore, the application of the adaptive model included in CEN Standard EN15251 seems like the optimal approach for evaluating thermal comfort in naturally conditioned buildings, because it takes into consideration the adaptive principle that indicates that if a change occurs such as to produce discomfort, people tend to react in ways which restore their comfort.

1. Introduction

The main function of a building is to provide and maintain a comfortable indoor environment with the lowest energy consumption. In order to ensure the thermal comfort of the occupants of a building, usually mechanical heating, ventilating and air conditioning (HVAC) systems are installed. However, in temperate climates, such as in Quito-Ecuador, the vast majority of buildings do not have such systems, so it is not possible to guarantee interior thermal neutrality conditions throughout the occupation period.
Several studies indicate that assuring adequate thermal comfort conditions inside buildings is essential not only for the health of the occupants, but also in terms of productivity and efficiency [1,2,3]. However, comfort issues do not yet play a major role in the design stage and in the day-to-day operation of buildings in the construction sector in Ecuador, mostly due to a lack of knowledge and understanding of human thermal comfort and the related in situ assessment and a lack of thermal comfort standards applicable to the buildings in the country.
On the other hand, the scientific community has been developing studies and accumulating knowledge on comfort in indoor environments for decades, since the seminal study “Thermal Comfort” of Fanger [4]. The results and the most important findings are now the basis of the main international standards related to the interior thermal environment, such as ISO 7730 (2005) [5], ASHRAE 55 (2010) [6], and CEN Standard EN15251 (2007) [7]. The most widely used thermal comfort index in these standards is obtained by the PMV equation (Predicted Mean Vote) proposed by Fanger [4], which predicts the thermal perception of the occupants of an indoor environment according to the seven point thermal sensation scale proposed by ASHRAE.
Although models based on the PMV as an index of thermal comfort are the most commonly used and accepted worldwide, several field studies indicate that these models are not accurate for predicting the thermal sensation of occupants of buildings with natural ventilation, and they tend to underestimate or overestimate the actual conditions of comfort [8,9,10,11,12,13]. Many researchers consider that this mainly happens because the PMV model was developed based on studies conducted in climatic chambers (laboratory conditions) where the indoor operative temperatures are generally stable, unlike what happens in naturally ventilated buildings where the operative temperatures are generally variable. For this reason, new adaptive thermal comfort models and modifications to the traditional PMV model have been developed in recent years to evaluate the internal thermal environment or to improve the accuracy of prediction of human thermal sensation in naturally conditioned buildings. The most widely used models are the adaptive models proposed by Dear and Brager [14] and Nicol and Humphreys [15], the modified PMV models proposed by Fanger and Toftum [16] (PMV extended model), and Yao’s PMV adaptive model [8].
The adaptive comfort model proposed by Nicol and Humphreys [17] is based on experimental studies conducted in 26 European offices in France, Greece, Portugal, Sweden, and the UK. Studies showed that occupants in the naturally ventilated buildings accept, and actually prefer, a significantly wider range of temperatures compared to occupants of the HVAC buildings. In addition, it was noted that these comfortable indoor temperatures vary according to changes in the outside temperature and often fell outside of the ISO Standard 7730 comfort zones. The results of the adaptive model proposed by Nicol and Humphreys have been considered as the basis for a standard proposal applicable to naturally conditioned buildings, which is included in CEN Standard EN15251.
There is no information related to thermal comfort in buildings located in Ecuador, which is the reason why the authors decided to undertake a comfort research in this region, and observe the complexities of the comfort system they themselves inhabit. Because context, culture, buildings and climate are unique to any particular place, so also are the comfort needs and expectations of its inhabitants. A field study, such as the one performed in this research, can tell us a lot about the best way to design buildings that are appropriate to the climate and culture of people in this specific location of the world. By comparing the adaptive model included in CEN Standard EN15251 and the so-called static model (PMV model) with reports of thermal environment satisfaction surveys presented simultaneously to all occupants of the office, this study aims to determine which of the two comfort models is most suitable to evaluate the thermal environment of the office. Unlike other studies, the present work analyzes the interior thermal environment of the office in actual operating conditions and evaluates the thermal perception of each of its occupants simultaneously depending on their location within the office.
By applying the methodology for field studies proposed by the adaptive model, the authors seek to contribute to the worldwide effort, started by Humphreys and Nicol in the 1970s and continued around the world by Auliciems, de Dear, Brager, Baker, Oseland, and a growing band of researchers, in an attempt to map comfort conditions in every major climatic zone. We hope that local researchers will use the contents of this article to help them in the conduct and analysis of their own field surveys and that they will in their turn make their own findings available to others interested in the development of a better understanding of thermal comfort in buildings.
Thermal comfort research is a global endeavor, and many of the most important findings rest on the results of a large body of studies. The adaptive models developed by de Dear and Brager and Nicol and Humphreys were based on the results of many thermal comfort studies that are included in two different databases. From this point of view, the field study presented in this article is a valuable record of particular people, in a particular building, in a particular climate. This work can add to a global database of results of thermal comfort studies, which is required to establish an adequate and accurate adaptive standard that applies to “naturally conditioned” buildings in every climatic zone.

2. Case Study and Methodology of Investigation

2.1. Climate in Quito

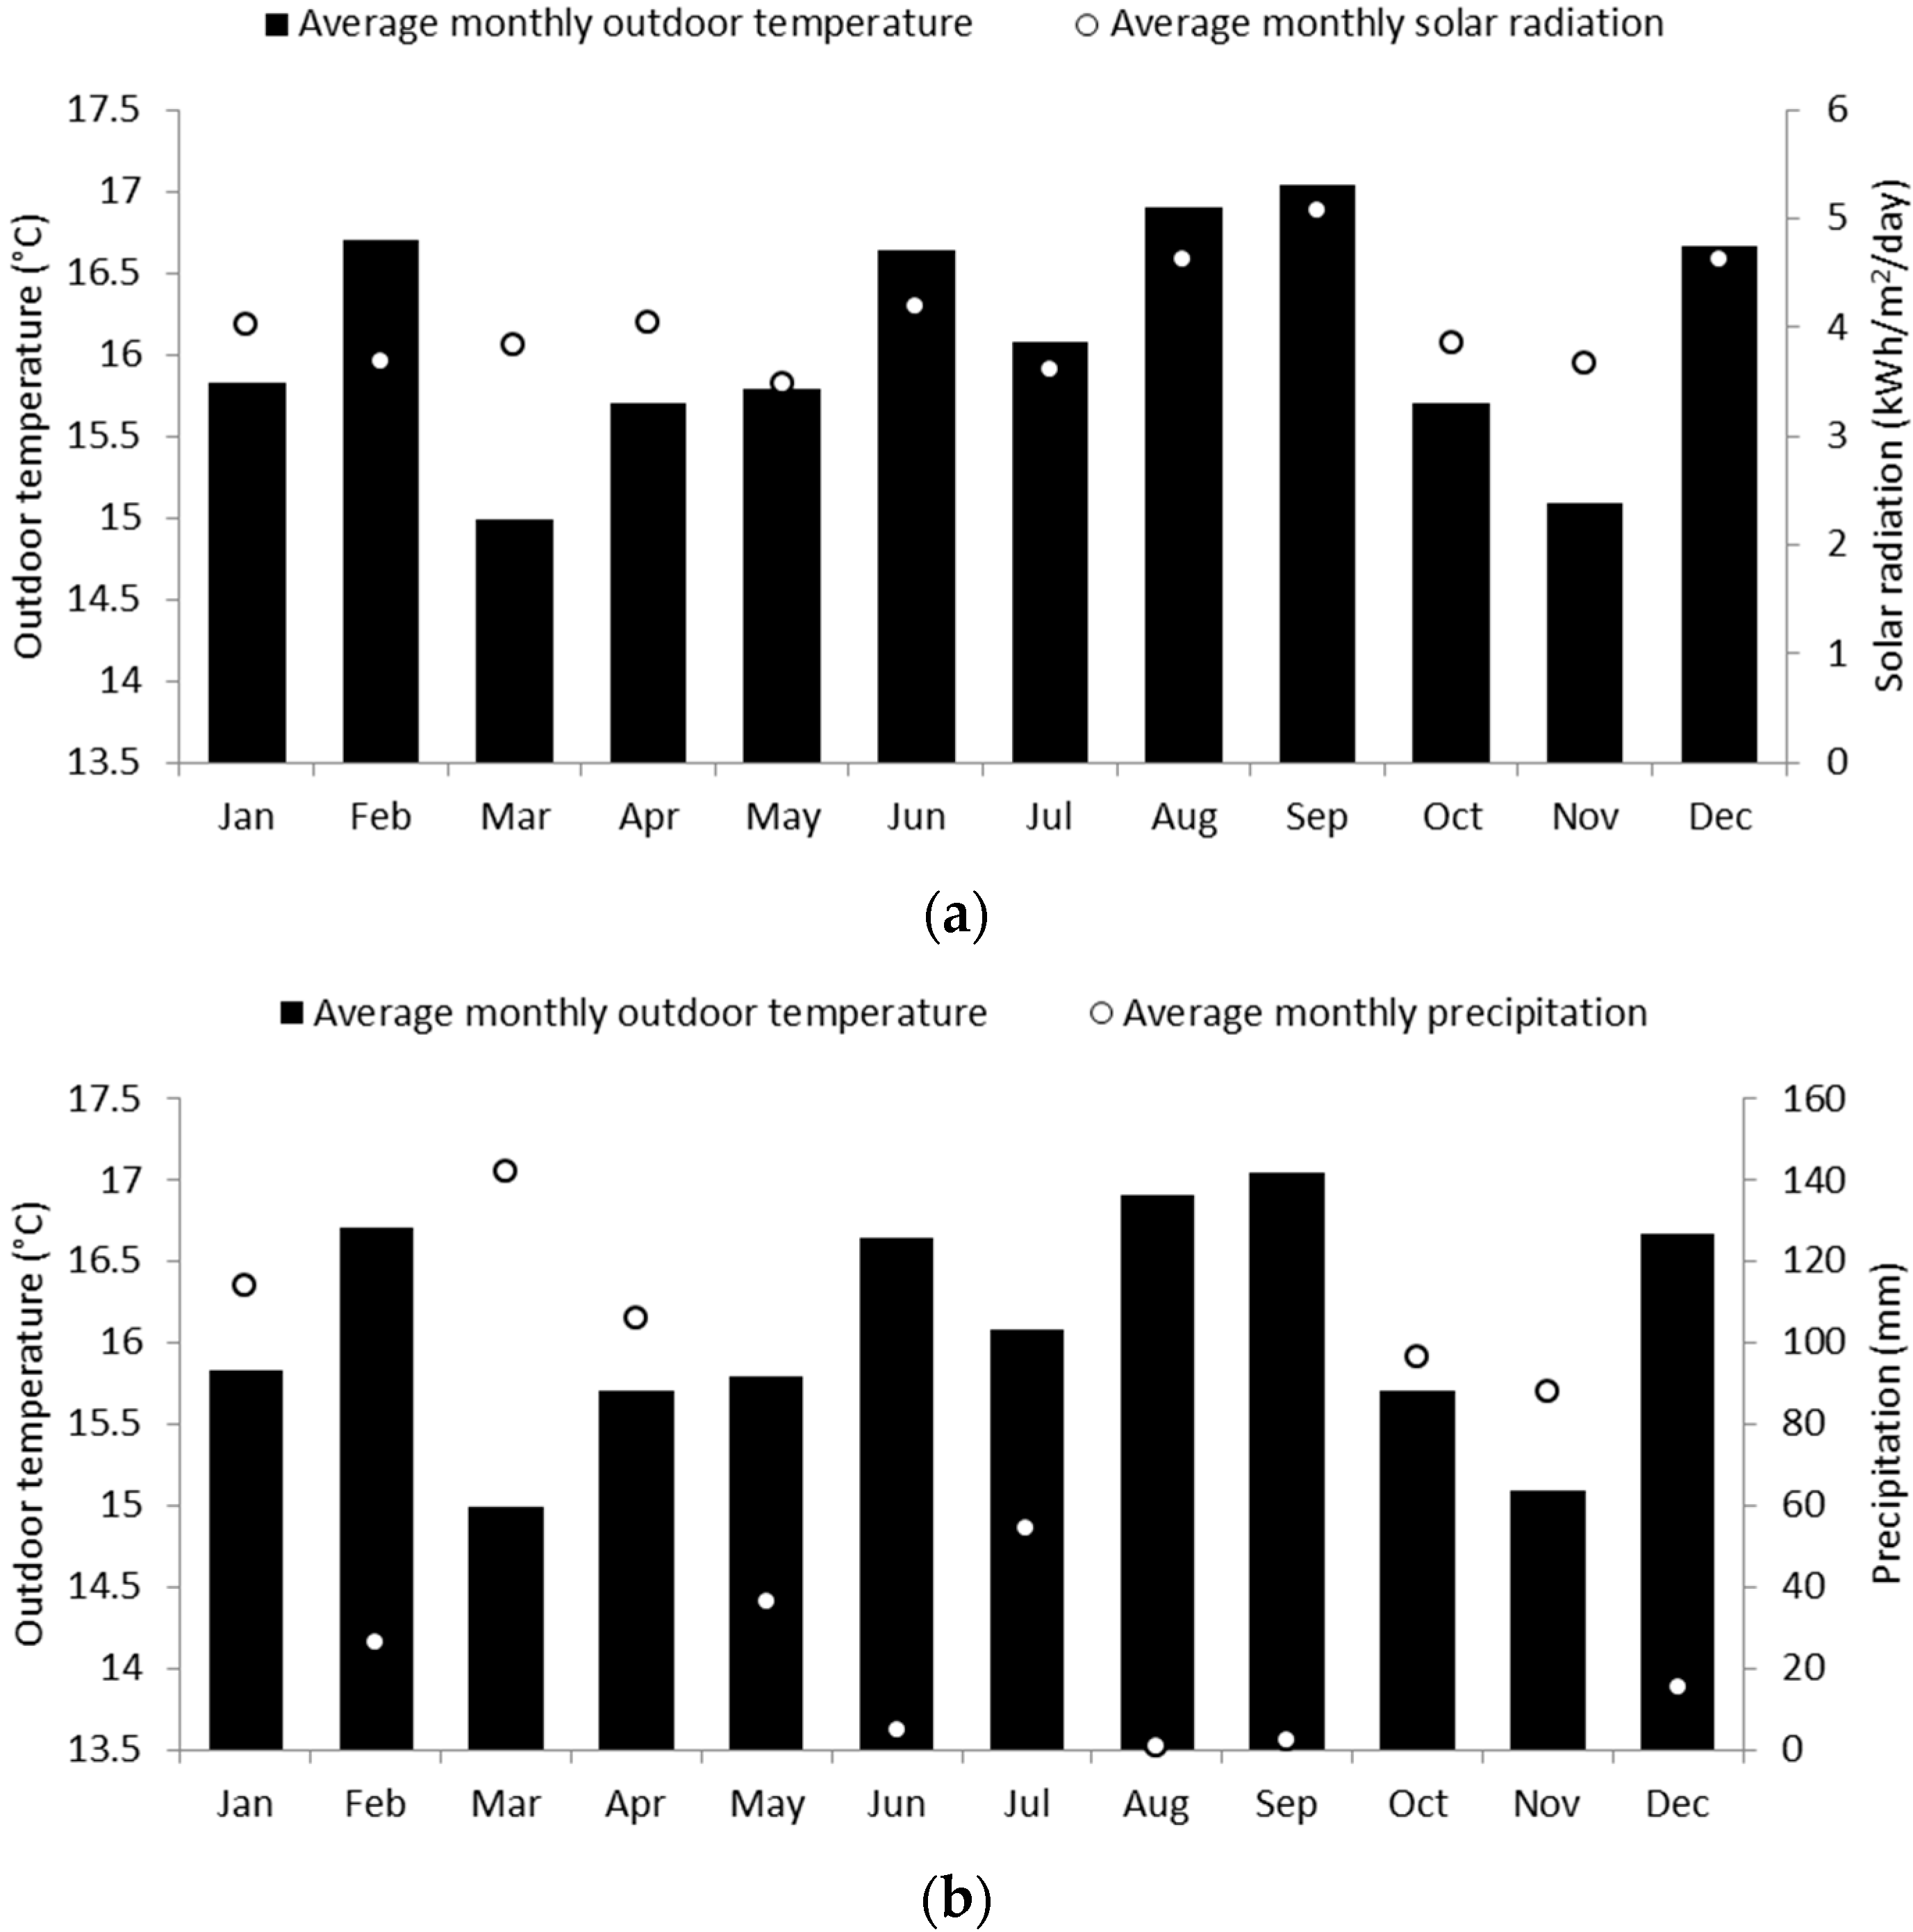
Under the Köppen climate classification, Quito has a subtropical highland climate (Cfb) [
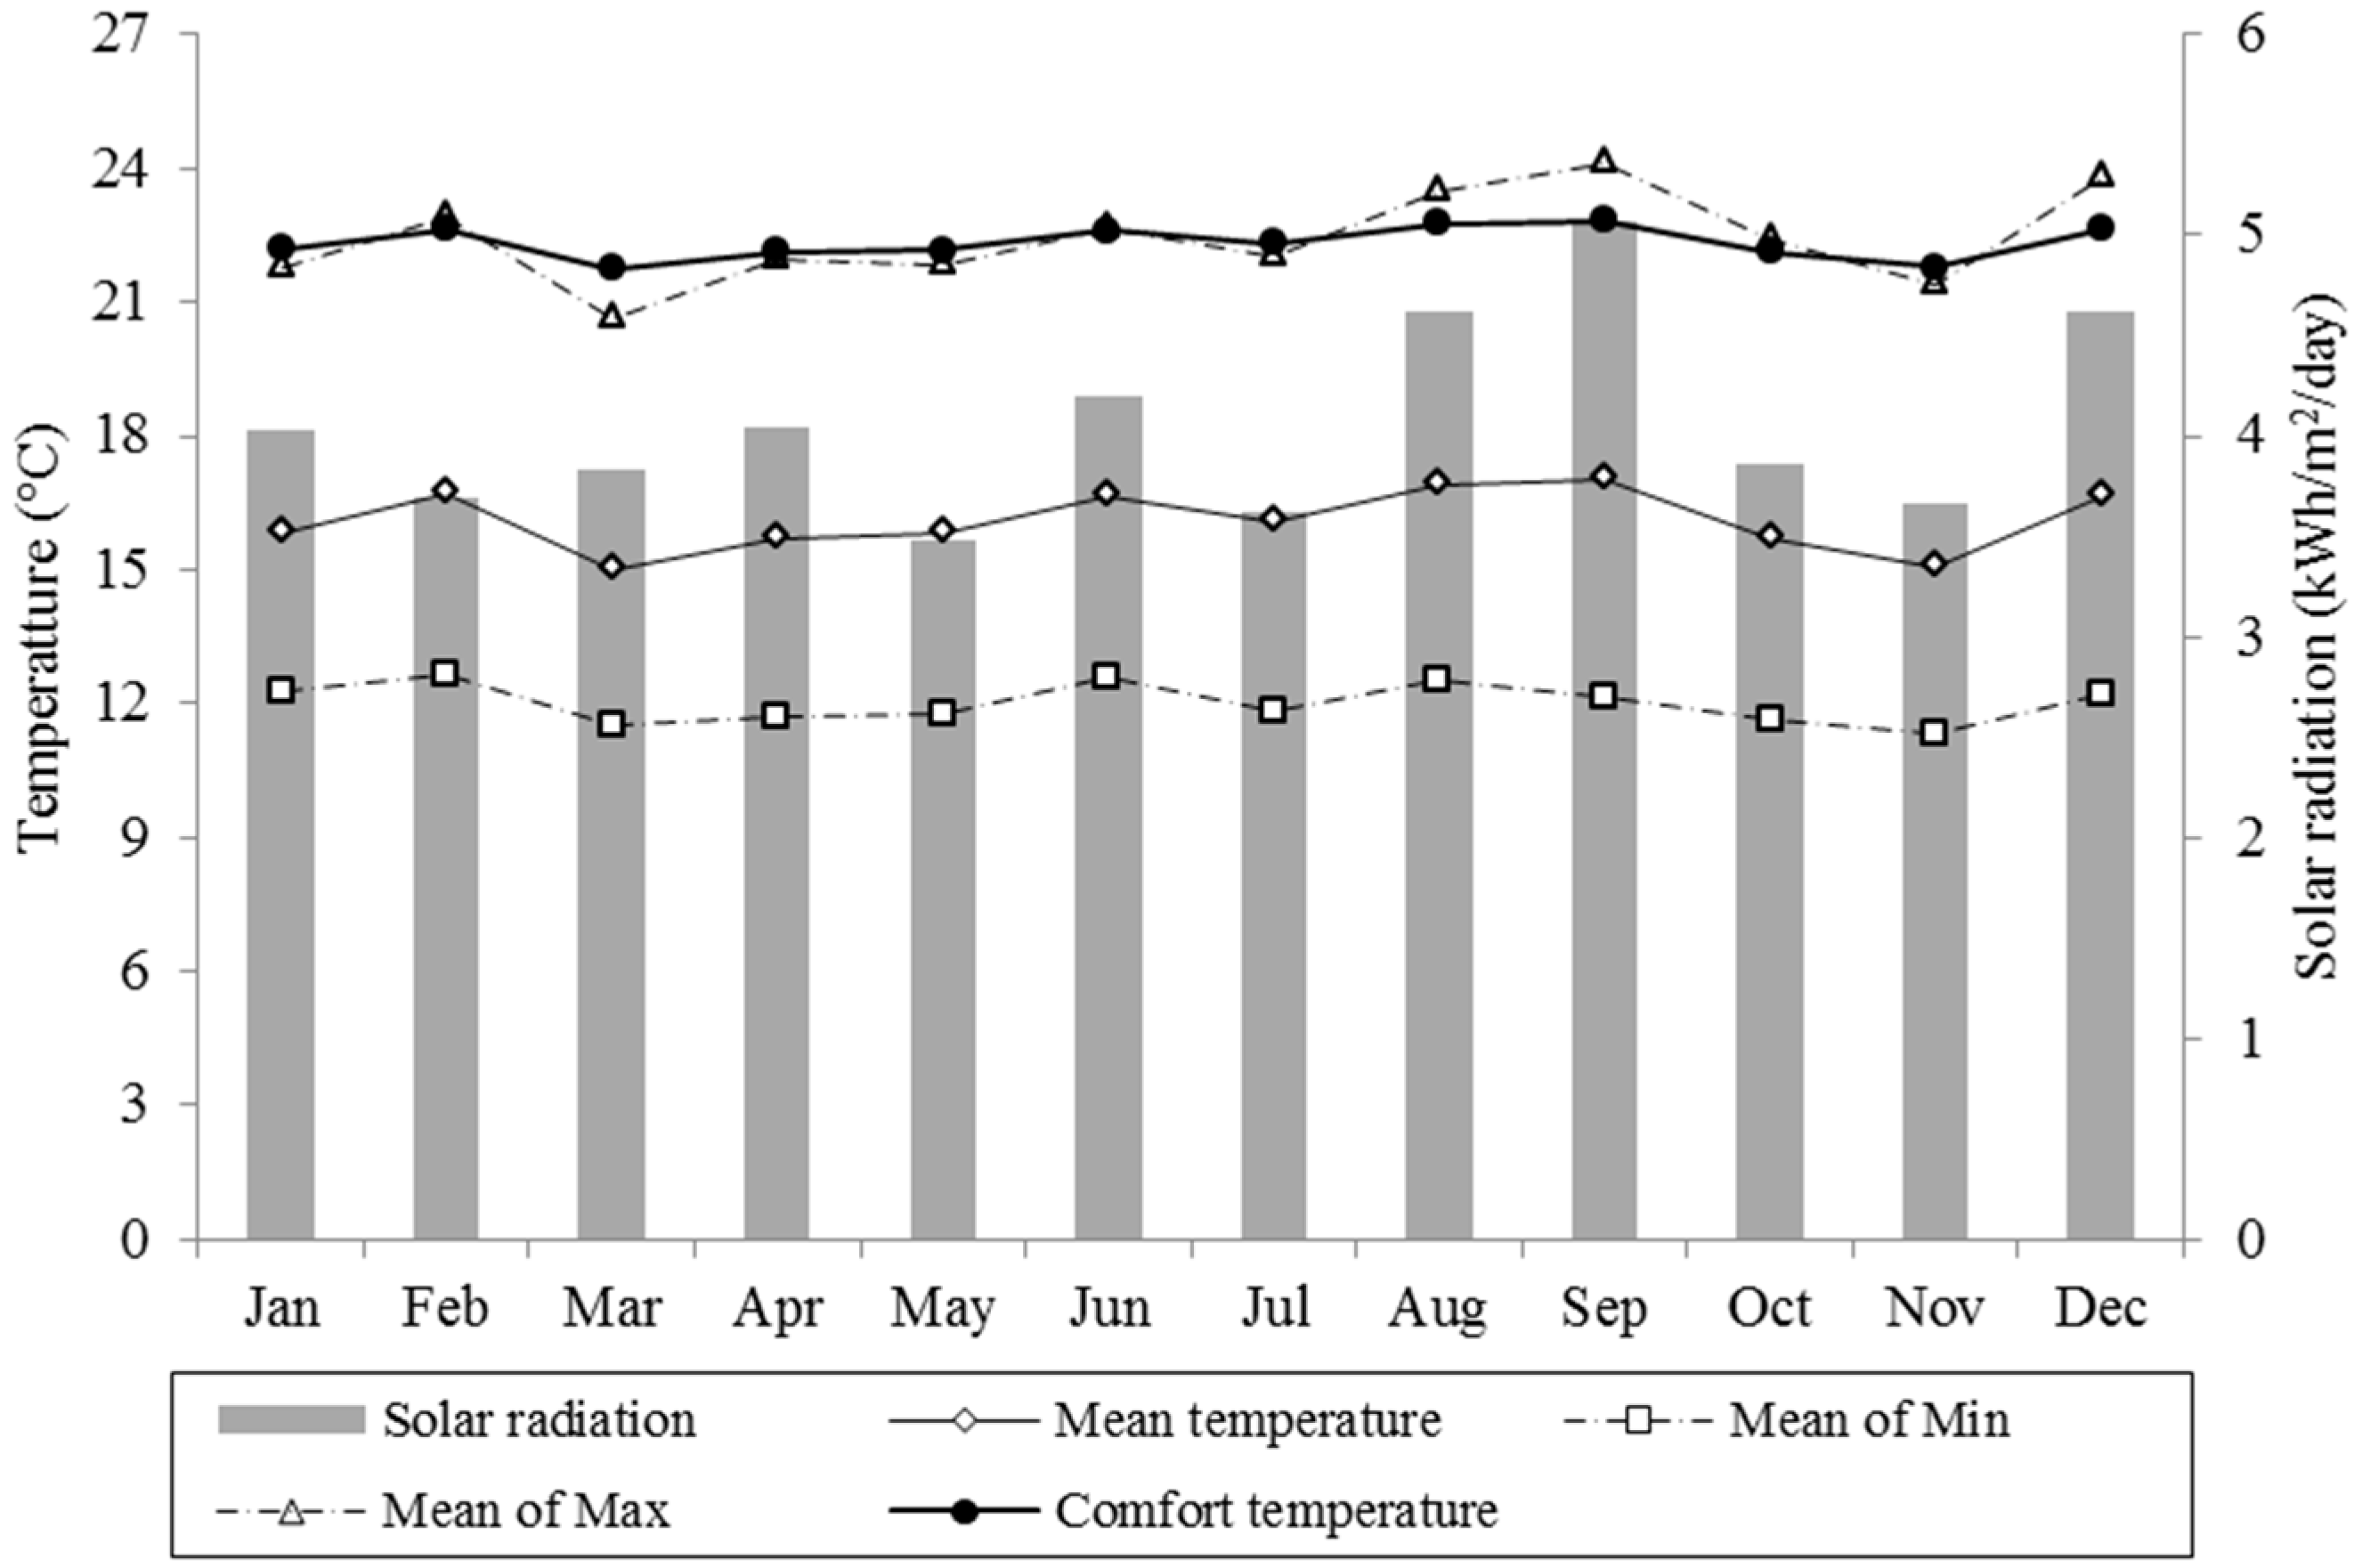
18]. Because of its elevation (2850 meters above sea level) and its closeness to the equator, Quito has a fairly constant cool climate and receives some of the greatest solar radiation in the world (Figure 1a). The annual average temperature in the year in which this field study was performed was 16.1 °C. As shown in Figure 1b, the city has only two seasons: dry and wet. The dry season (June through September) is referred to as summer because it coincides with high temperatures; the wet season (October through May) is referred to as winter. The average daily outdoor temperature ranges from 12 to 19 °C.

2.2. Characteristics of the Selected Office

The field study is conducted in an office located in an urban area of Quito-Ecuador (latitude 0°13′ S, longitude 78°31′ W) in a temperate climatic zone. For this reason, the office and the majority of the buildings located in this city are naturally conditioned and ventilated, which means that there are no HVAC systems installed to ensure interior thermal comfort conditions. The occupants of the office employ adaptive mechanisms such as manual operation of windows, clothing changes and drinking hot drinks to maintain thermal comfort conditions.
The office has a surface area of 36.5 m
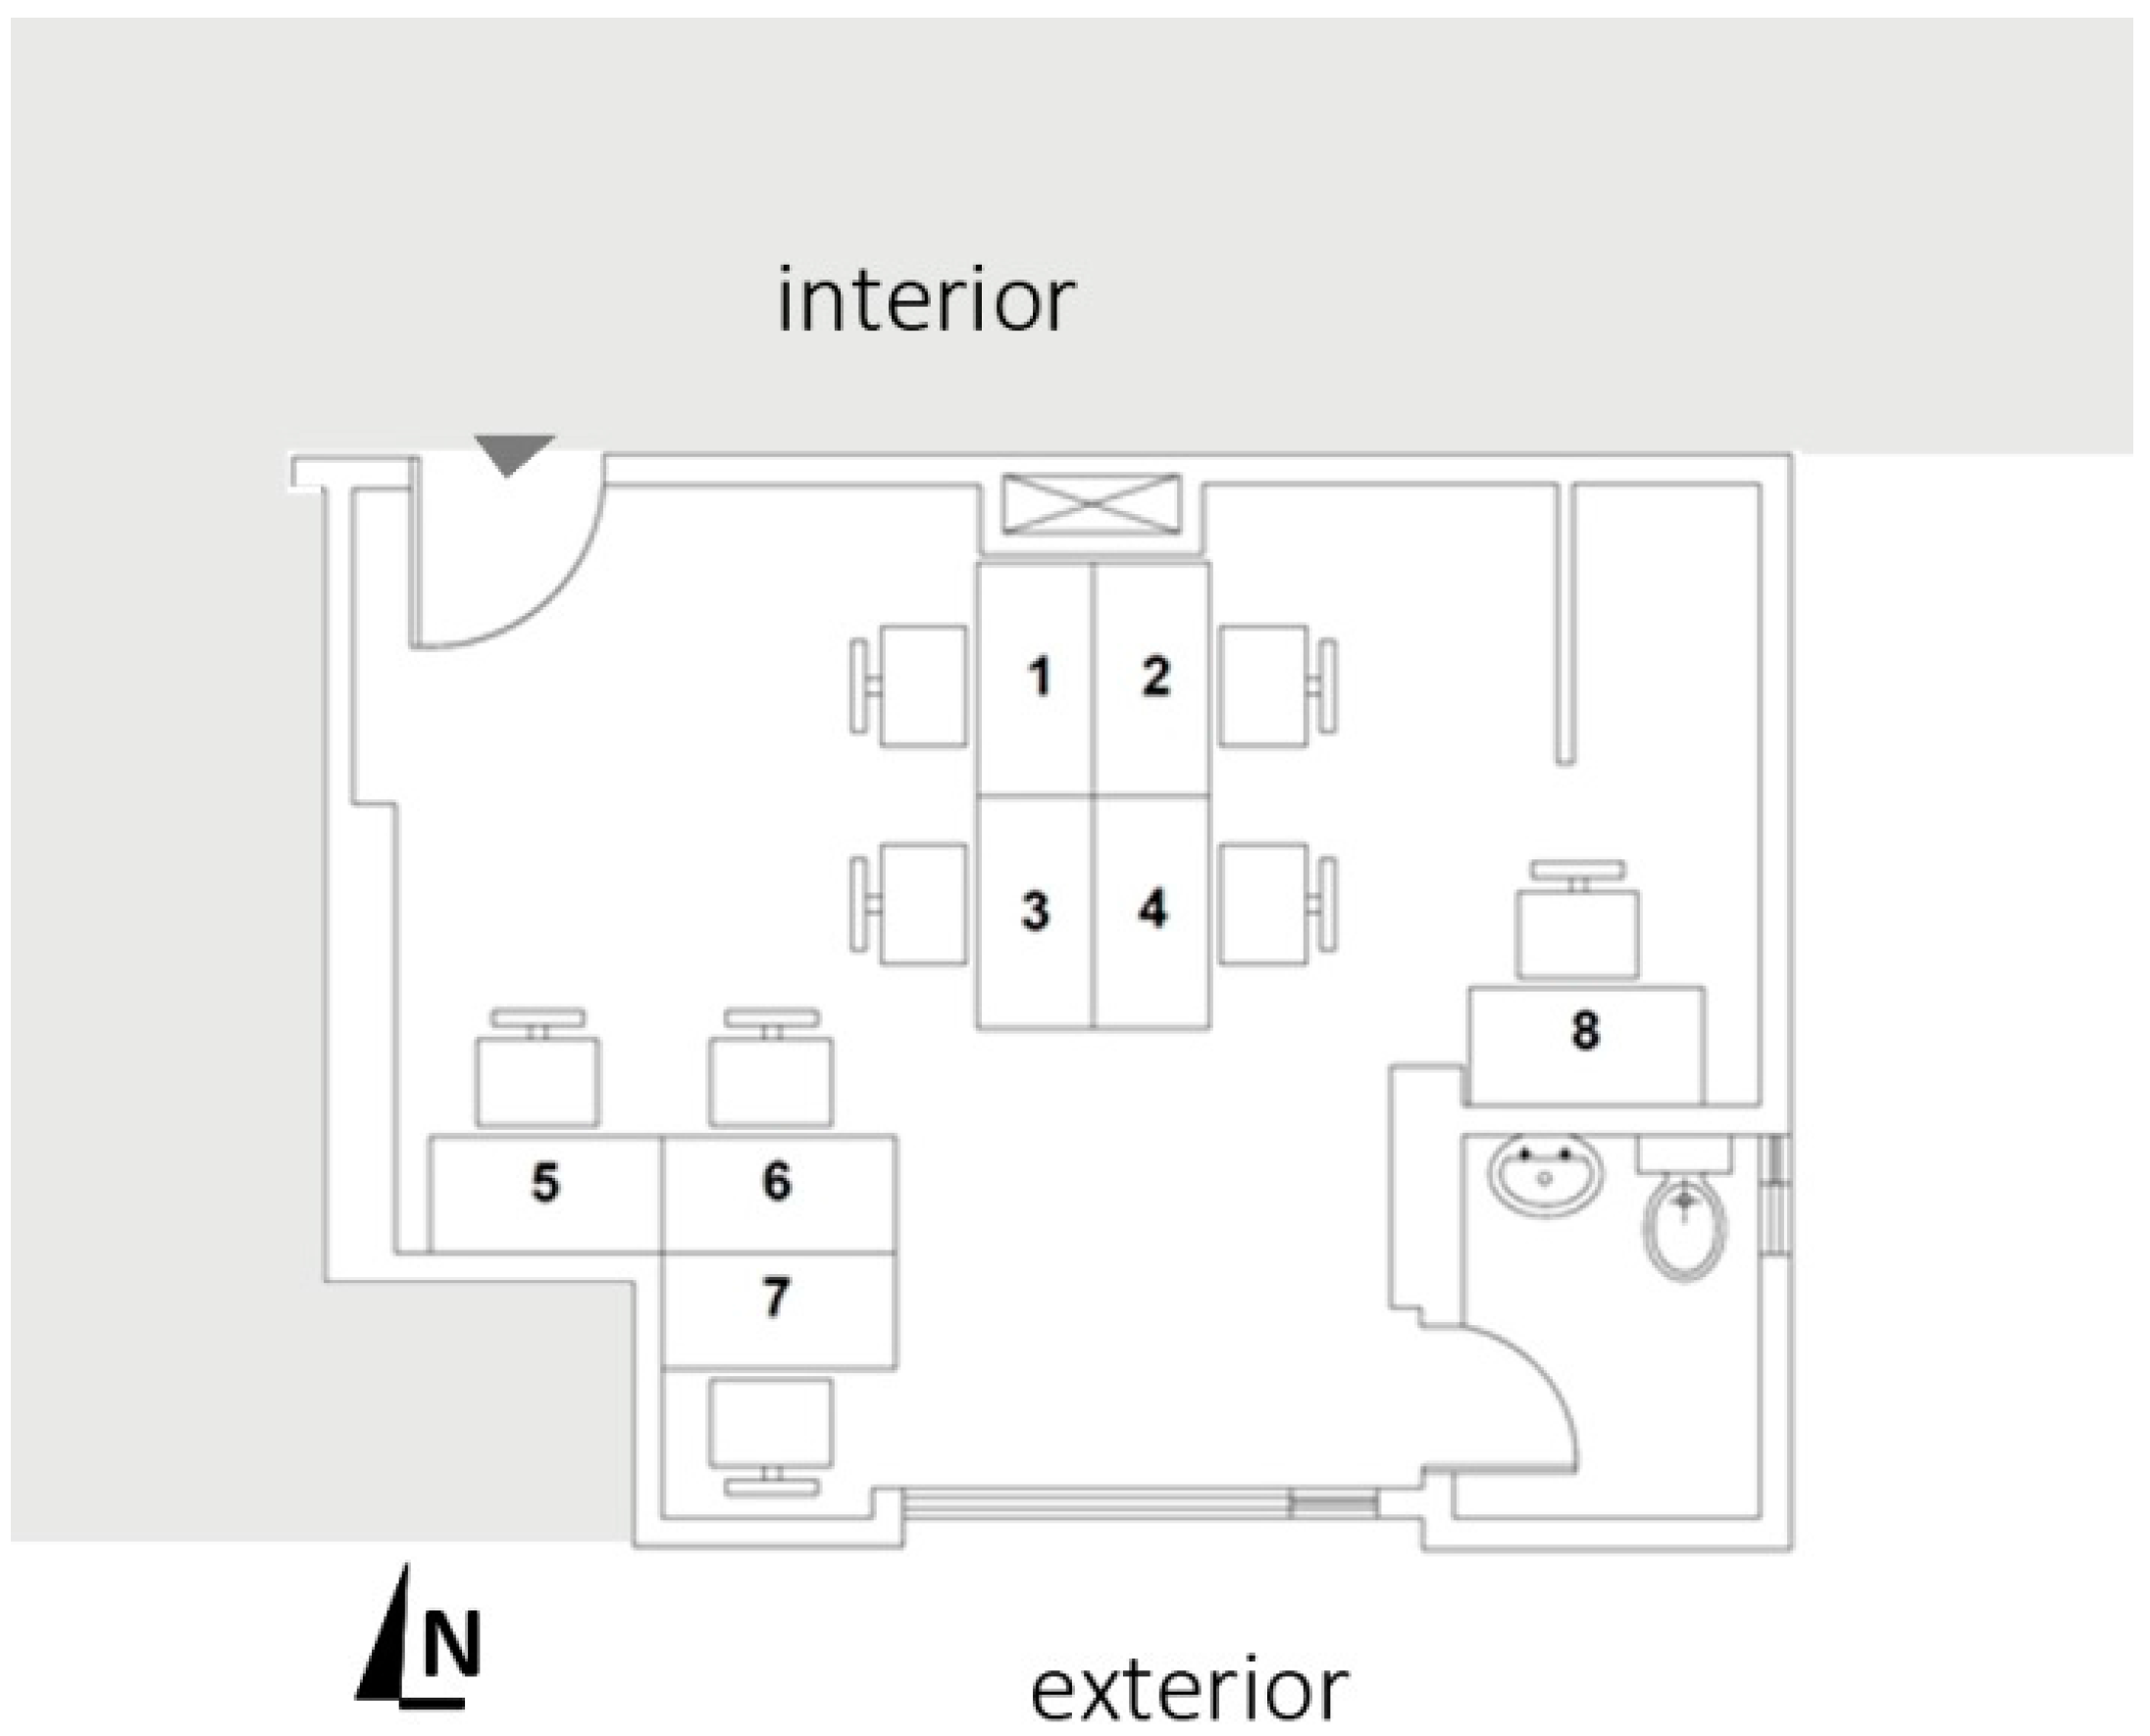
2, including bathroom area, a height of 2.3 m, and is located on the sixth floor of the building “Torres Bossano”. Natural ventilation is the main conditioning strategy inside the office, which is induced by manual operation of the only window in the office located in the south facing wall. There are seven researchers working in this office distributed in workstations without vertical divisions between them, as shown in Figure 2. During the experimental study, workstation number 1 was unoccupied, so it was not considered.
Each workstation has a desk, a standard office chair, and a computer. Other equipment includes a coffee maker, a telephone, an electric heater, and a copier/printer. The lighting system includes four luminaries with three T8 fluorescent lamps of 17W each, and a compact fluorescent bulb. The schedule of occupation of the office is Monday to Friday from 08:00 to 16:30, including half an hour for lunch.
The office consists of four vertical opaque walls facing north (back wall where the entrance is located and overlooks the hallway of the sixth floor), south (front wall which includes the main office window, with a window-wall ratio of 35% and exposed to the outside), west (partition wall between offices), and east (wall exposed to the outside). The construction materials of the office are shown in Table 1. It is noteworthy that the use of thermal insulation is unusual.

2.3. Experimental Campaign and Surveys

Thermal comfort theory suggests that the most important variables that influence human thermal comfort and that are considered in the calculation of the PMV index are: physical variables (air temperature, mean radiant temperature, air velocity, and relative humidity in the interior environment) and personal variables (activity levels and thermal resistance of clothing).
To experimentally evaluate the thermal comfort by the traditional PMV method and the adaptive model, interior physical variables were measured and calculated. In addition, the thermal resistance of clothing, the metabolic rate, and the actual thermal sensation of the occupants of the office were reported by means of survey questionnaires for comparison with the predicted thermal sensation using the PMV model.

2.3.1. Measured Physical Parameters

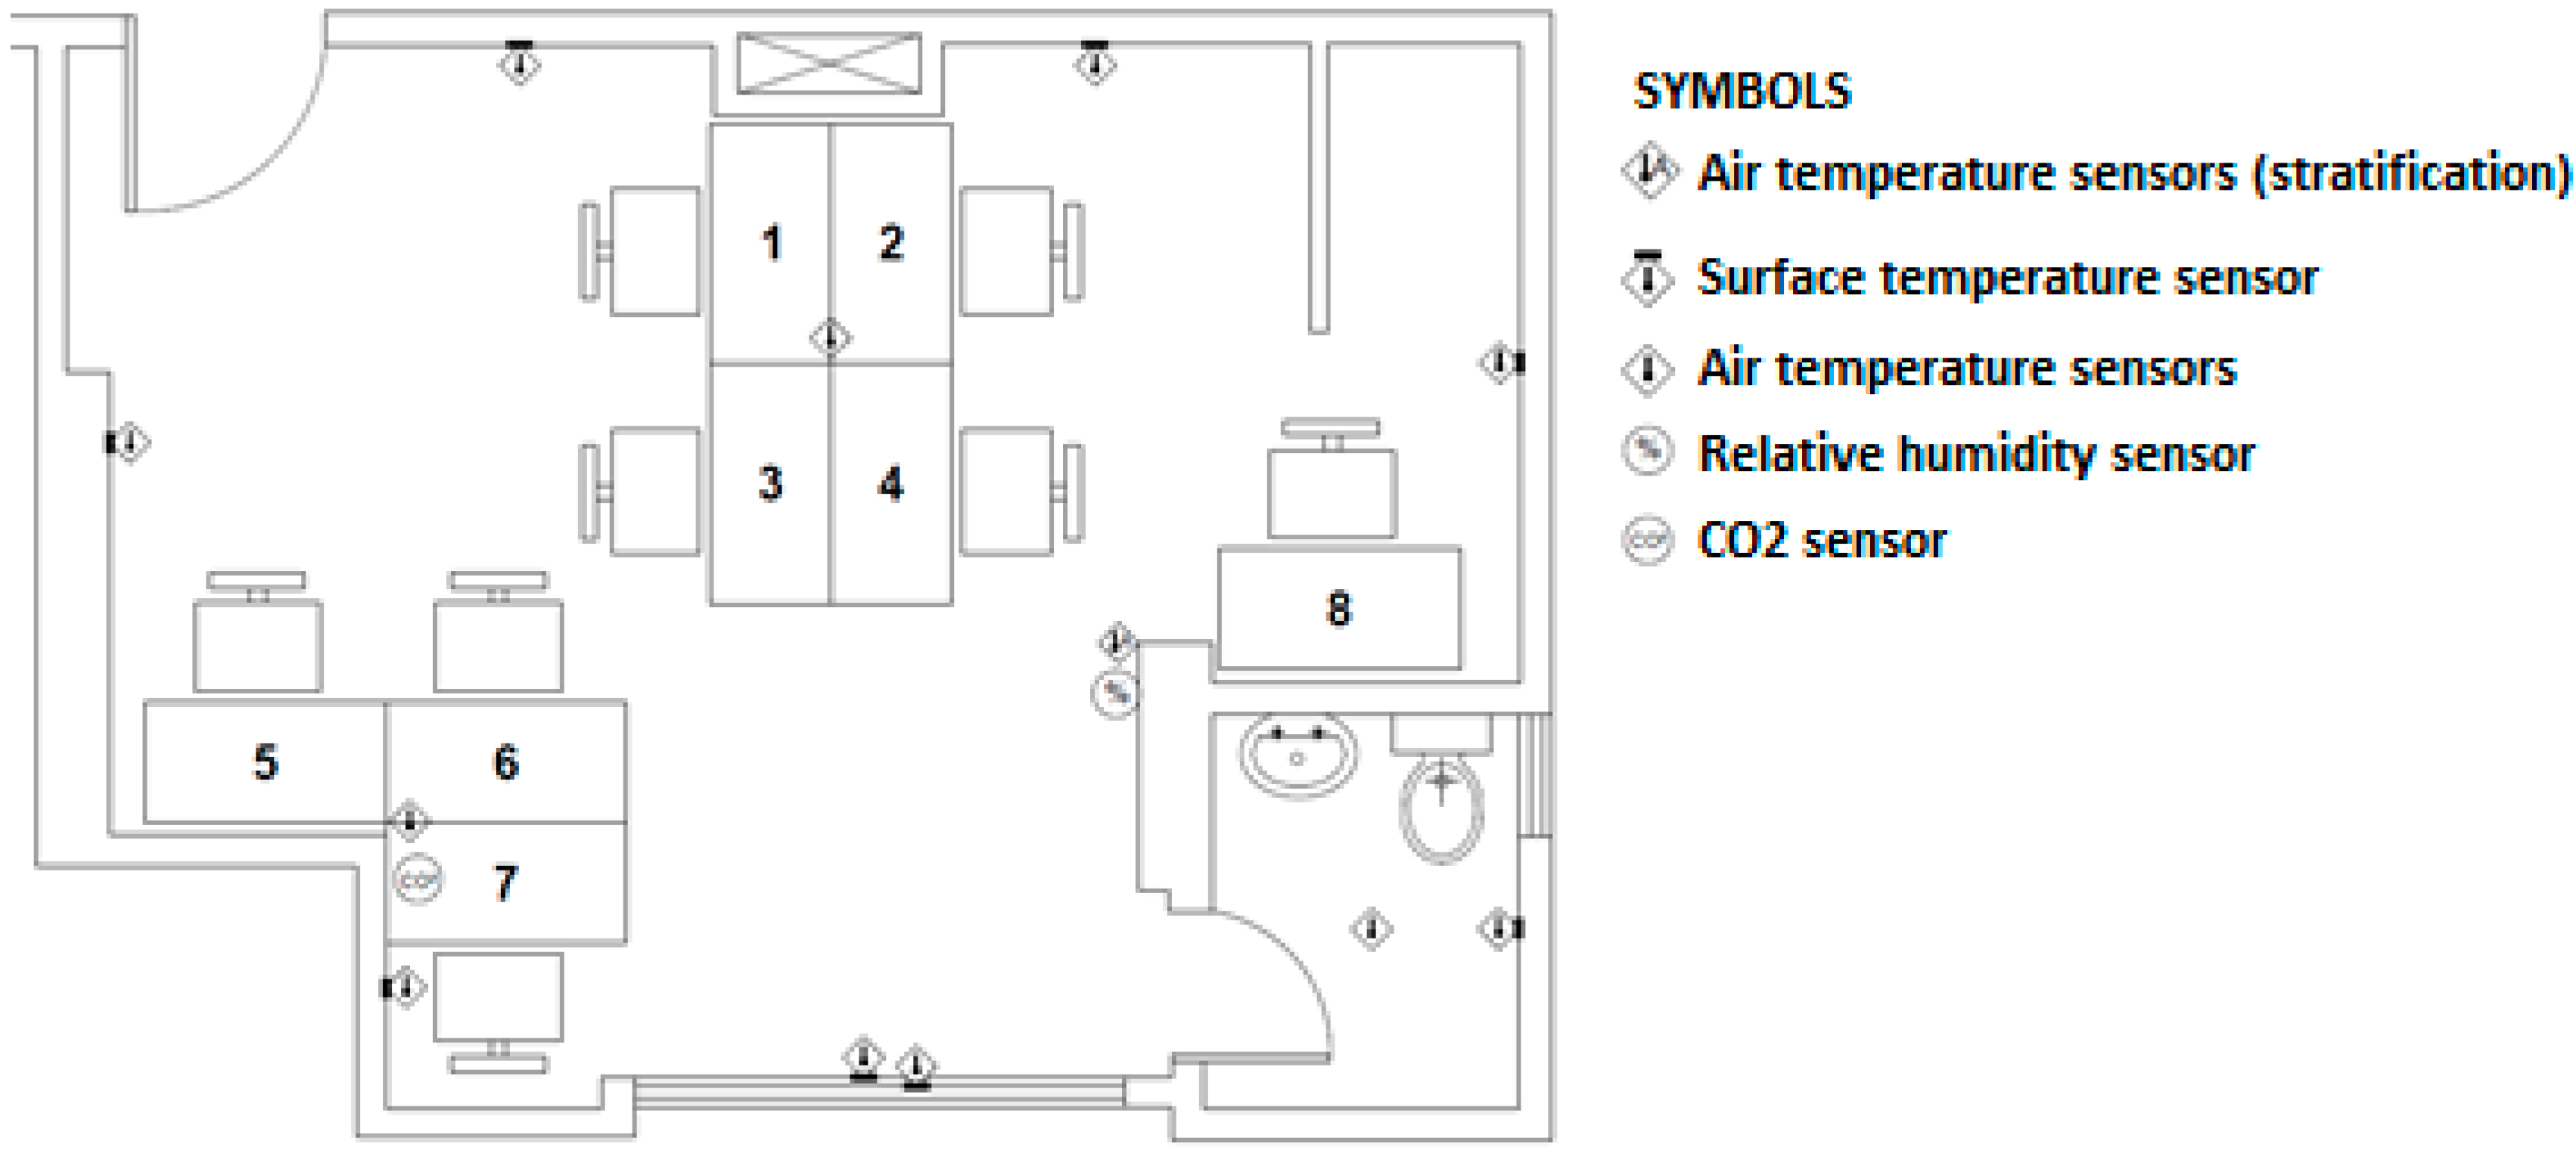
A monitoring system was installed inside the analyzed office to measure interior physical parameters such as: air temperature, surface temperatures of opaque walls and windows, and relative humidity. To measure air and surface temperatures, thermocouples type K were installed, as shown in Figure 3. The measurements were carried out for the period of 17 August to 20 October 2015 because it is the period for which survey results are available. The measured physical parameters and accuracy of the instruments are presented in Table 2.
The measuring points inside the office were selected primarily based on workstation positions. Three indoor air temperature sensors were placed at a height of 1.1 m from the floor, in accordance with the requirements of the standards ISO 7730 (2005) [5] and ASHRAE 55 (2010) [6]. To measure the surface temperature of the opaque walls and the main window of the office, sensors were placed at a height of approximately 1.5 m from the ground, or so that the sensor was placed at the center point of each surface. Only one relative humidity sensor was installed at a height of 1.5 m from the ground, considering that the surface area of the office is relatively small, so there will be no considerable variations in humidity on the inside. For all variables, measurements at one-minute intervals were taken 24 h a day. Figure 3 shows the location of all sensors within the office, as well as the appropriate symbols to identify them.
Because the office is a closed room located in a temperate climate, air movement is very slight, particularly away from the walls. Such low air velocities were very difficult to measure. For this reason, air velocity was not recorded continuously, but it was calibrated several times during questionnaire session to ensure that the measured physical parameters were sufficient to calculate the PMV as a comparative index. By means of thermal environment satisfaction surveys, it was determined if the main office window was open or closed at the time when people filled out the survey. In this way, a relationship between the operation of the window and the air velocity was developed, and then, simply, we kept a record of the operation of the window to estimate the air velocity. The recorded air velocities when the window was open were always below 0.2 m/s. When the window was closed, air velocities below 0.1 m/s were recorded. Nicol, Humphreys and Roaf in their book “Adaptive thermal comfort: Principles and Practice” [3] indicate that accurate measurement of air velocities below 0.1 m/s is unnecessary and could be misleading. For this reason, we established an air velocity of 0.2 m/s when the window was open, and an air velocity of 0.1 m/s when the window was closed.
Additionally, outside air temperature was measured at a weather station located near the office building. The outside air temperature was measured over the same period in which the experimental study was conducted in order to evaluate thermal comfort with the adaptive model proposed by Nicol and Humphreys [3]. The weather station that was installed (Davis model Vantage Pro 2 Plus Wireless) has the advantage of a wireless connection to the data logger. The station has the following sensors of environmental monitoring: temperature and humidity sensors (thermo-hygrometer), anemometer with wind vane, pluviometer, solar radiation sensors, and ultraviolet radiation.
From the records of outside air temperature, the running mean outdoor temperatures were calculated using the equations (Equations (1) and (2)) included in CEN Standard EN 15251 (2007) [7]:
T r m = ( 1 α ) T e d 1 + α T r m 1
T r m = ( T e d 1 + 0.8   T e d 2 + 0.6   T e d 3 + 0.5   T e d 4 + 0.4   T e d 5 + 0.3   T e d 6 + 0.2   T e d 7 ) / 3.8
where T r m is the running mean temperature for today, T r m 1 is the running mean temperature for the previous day, T e d 1 is the daily mean external temperature for the previous day, T e d 2 is the daily mean external temperature for the day before and so on, and α is a constant between 0 and 1 (recommended to use 0.8) [3].

2.3.2. Calculated Physical Parameters

The mean radiant temperature in each workstation of the office is obtained from measurements of surface temperatures and the angle factors calculated with the methodology proposed by Fanger [4] and the equations included in the standard ISO 7726 [19]. To simplify the calculation of angle factors, the office was considered as a single rectangular volume, and it is assumed that the occupants are sitting in their workstations. Considering that most building materials have high emittance ε, the mean radiant temperature is calculated using Equation (3):
T ¯ r 4 = T 1 4 F p 1 + T 2 4 F p 2 + + T N 4 F p N
where T ¯ r is the mean radiant temperature, T N is the Surface temperature of the Surface N, and F p N is the angle or view factor between a person and the surface N. The sum of all the angle factors is unity.
In addition, the operative temperature was calculated in each workstation position using Equation (4) according to ASHRAE 55 (2010) [6].
T o p = A T a + ( 1 A ) T ¯ r
where T o p is the operative temperature, T a is the interior air temperature, and T ¯ r is the mean radiant temperature. The value of A can be found in Appendix C of ASHRAE (2010) as a function of the relative air speed.
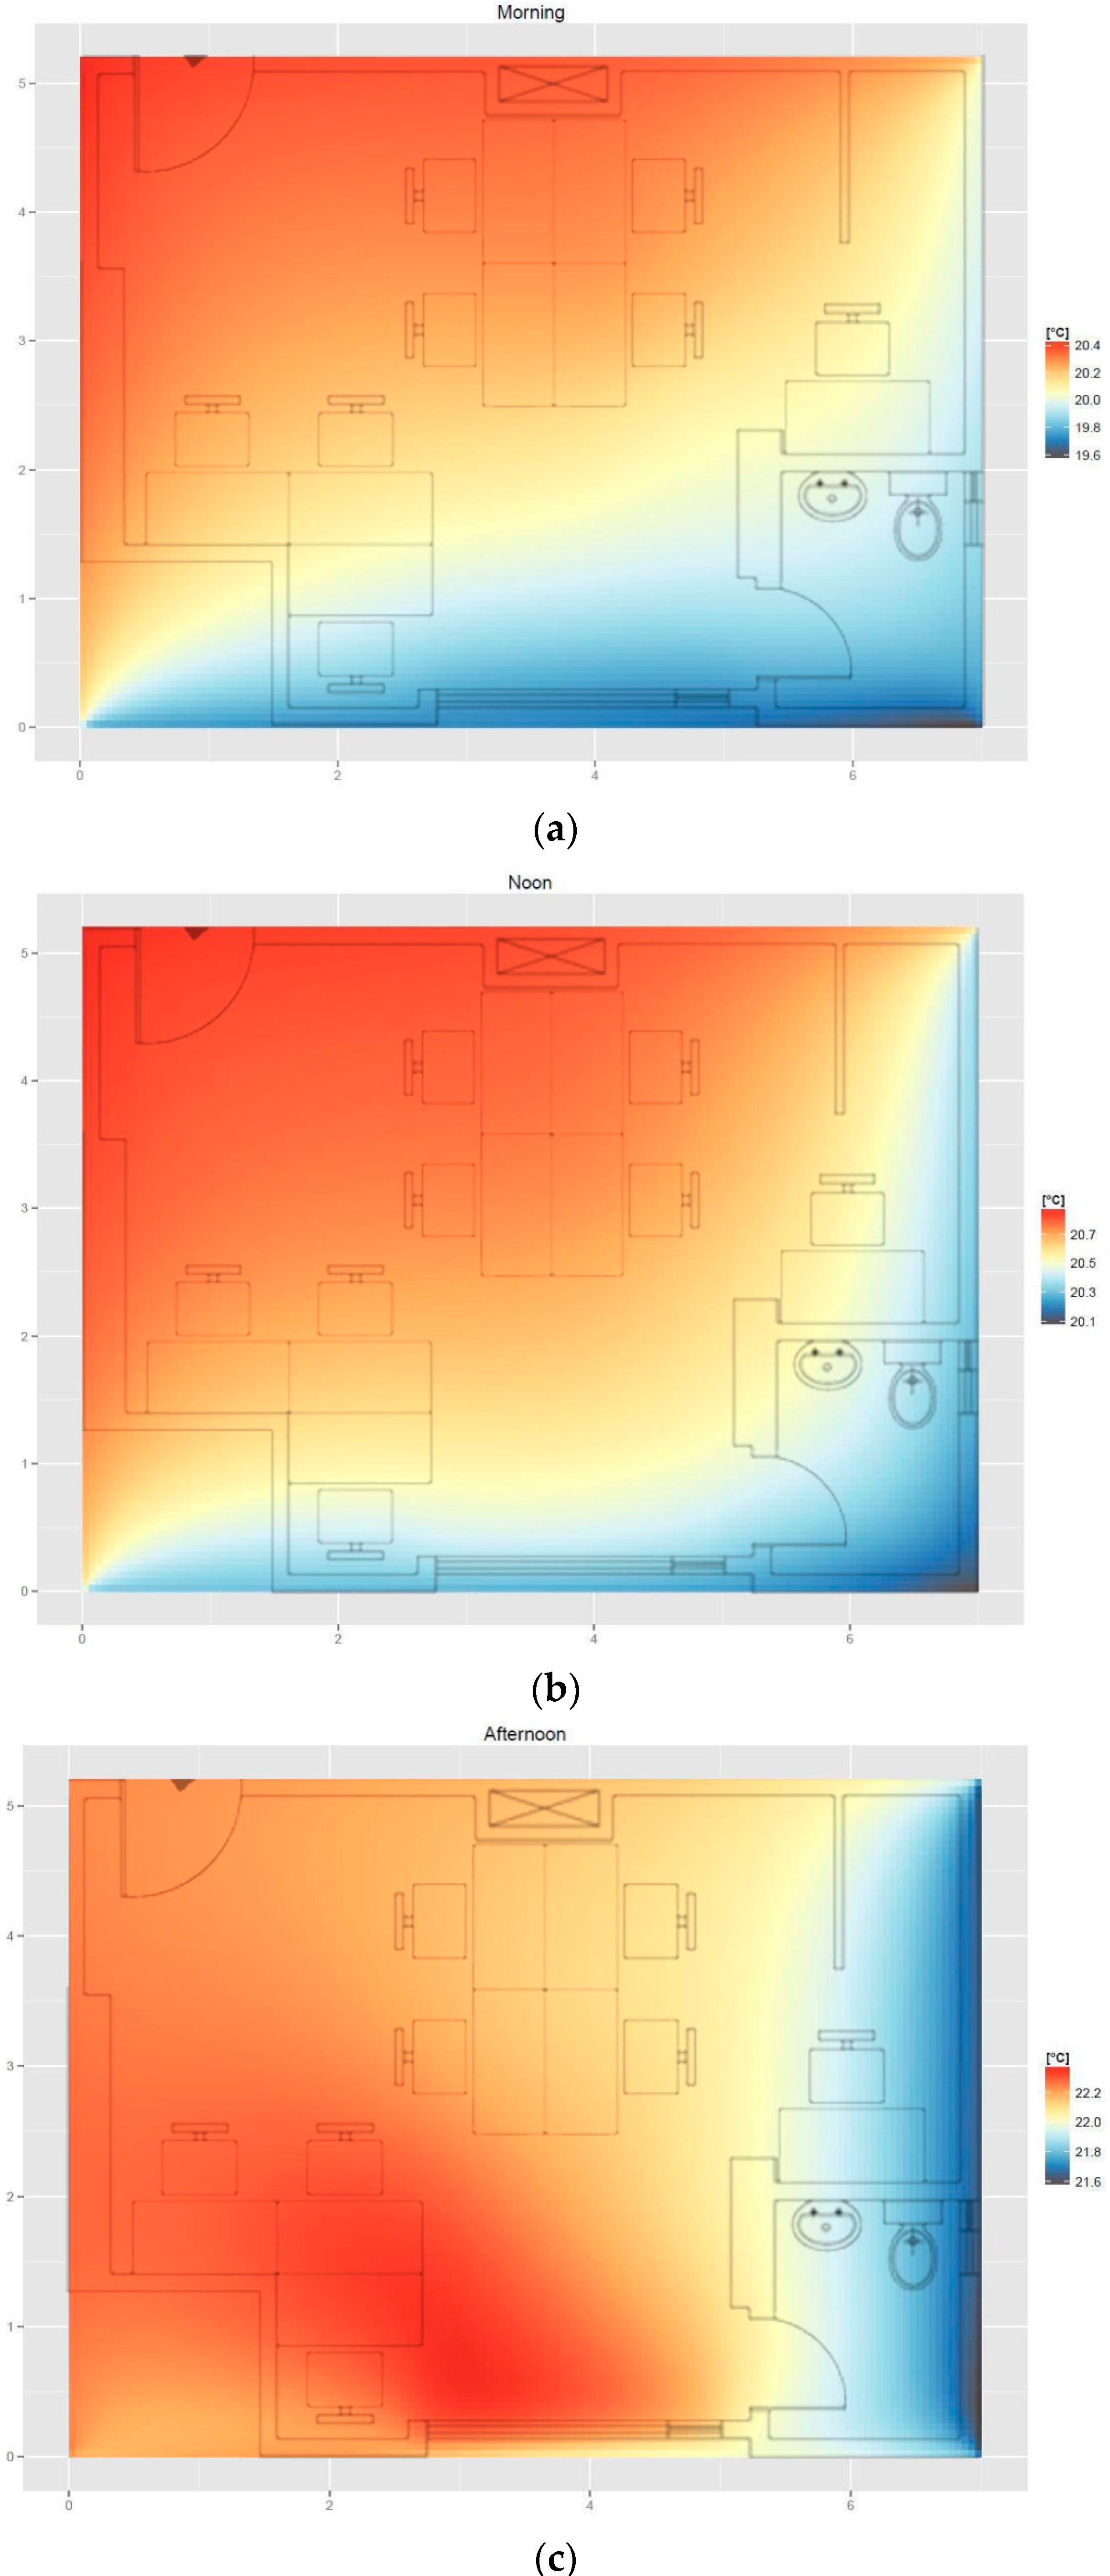
From Equations (3) and (4), a spatial distribution of operative temperature inside the office was obtained. This allows analyzing and comparing the thermal sensation of each occupant, according to the operative temperature in their workstation position within the office. It is important to mention that the method to calculate mean radiant temperature has not considered other interior surfaces, such as table surfaces, the computer surfaces, etc.

2.3.3. Thermal Environment Surveys

To perform a subjective analysis of the internal thermal environment of the office, the use of occupant thermal environment surveys was considered. The survey questionnaire is an integration of the one proposed in the Informative Appendix E “thermal environment survey” of ASHRAE 55 (2010) [
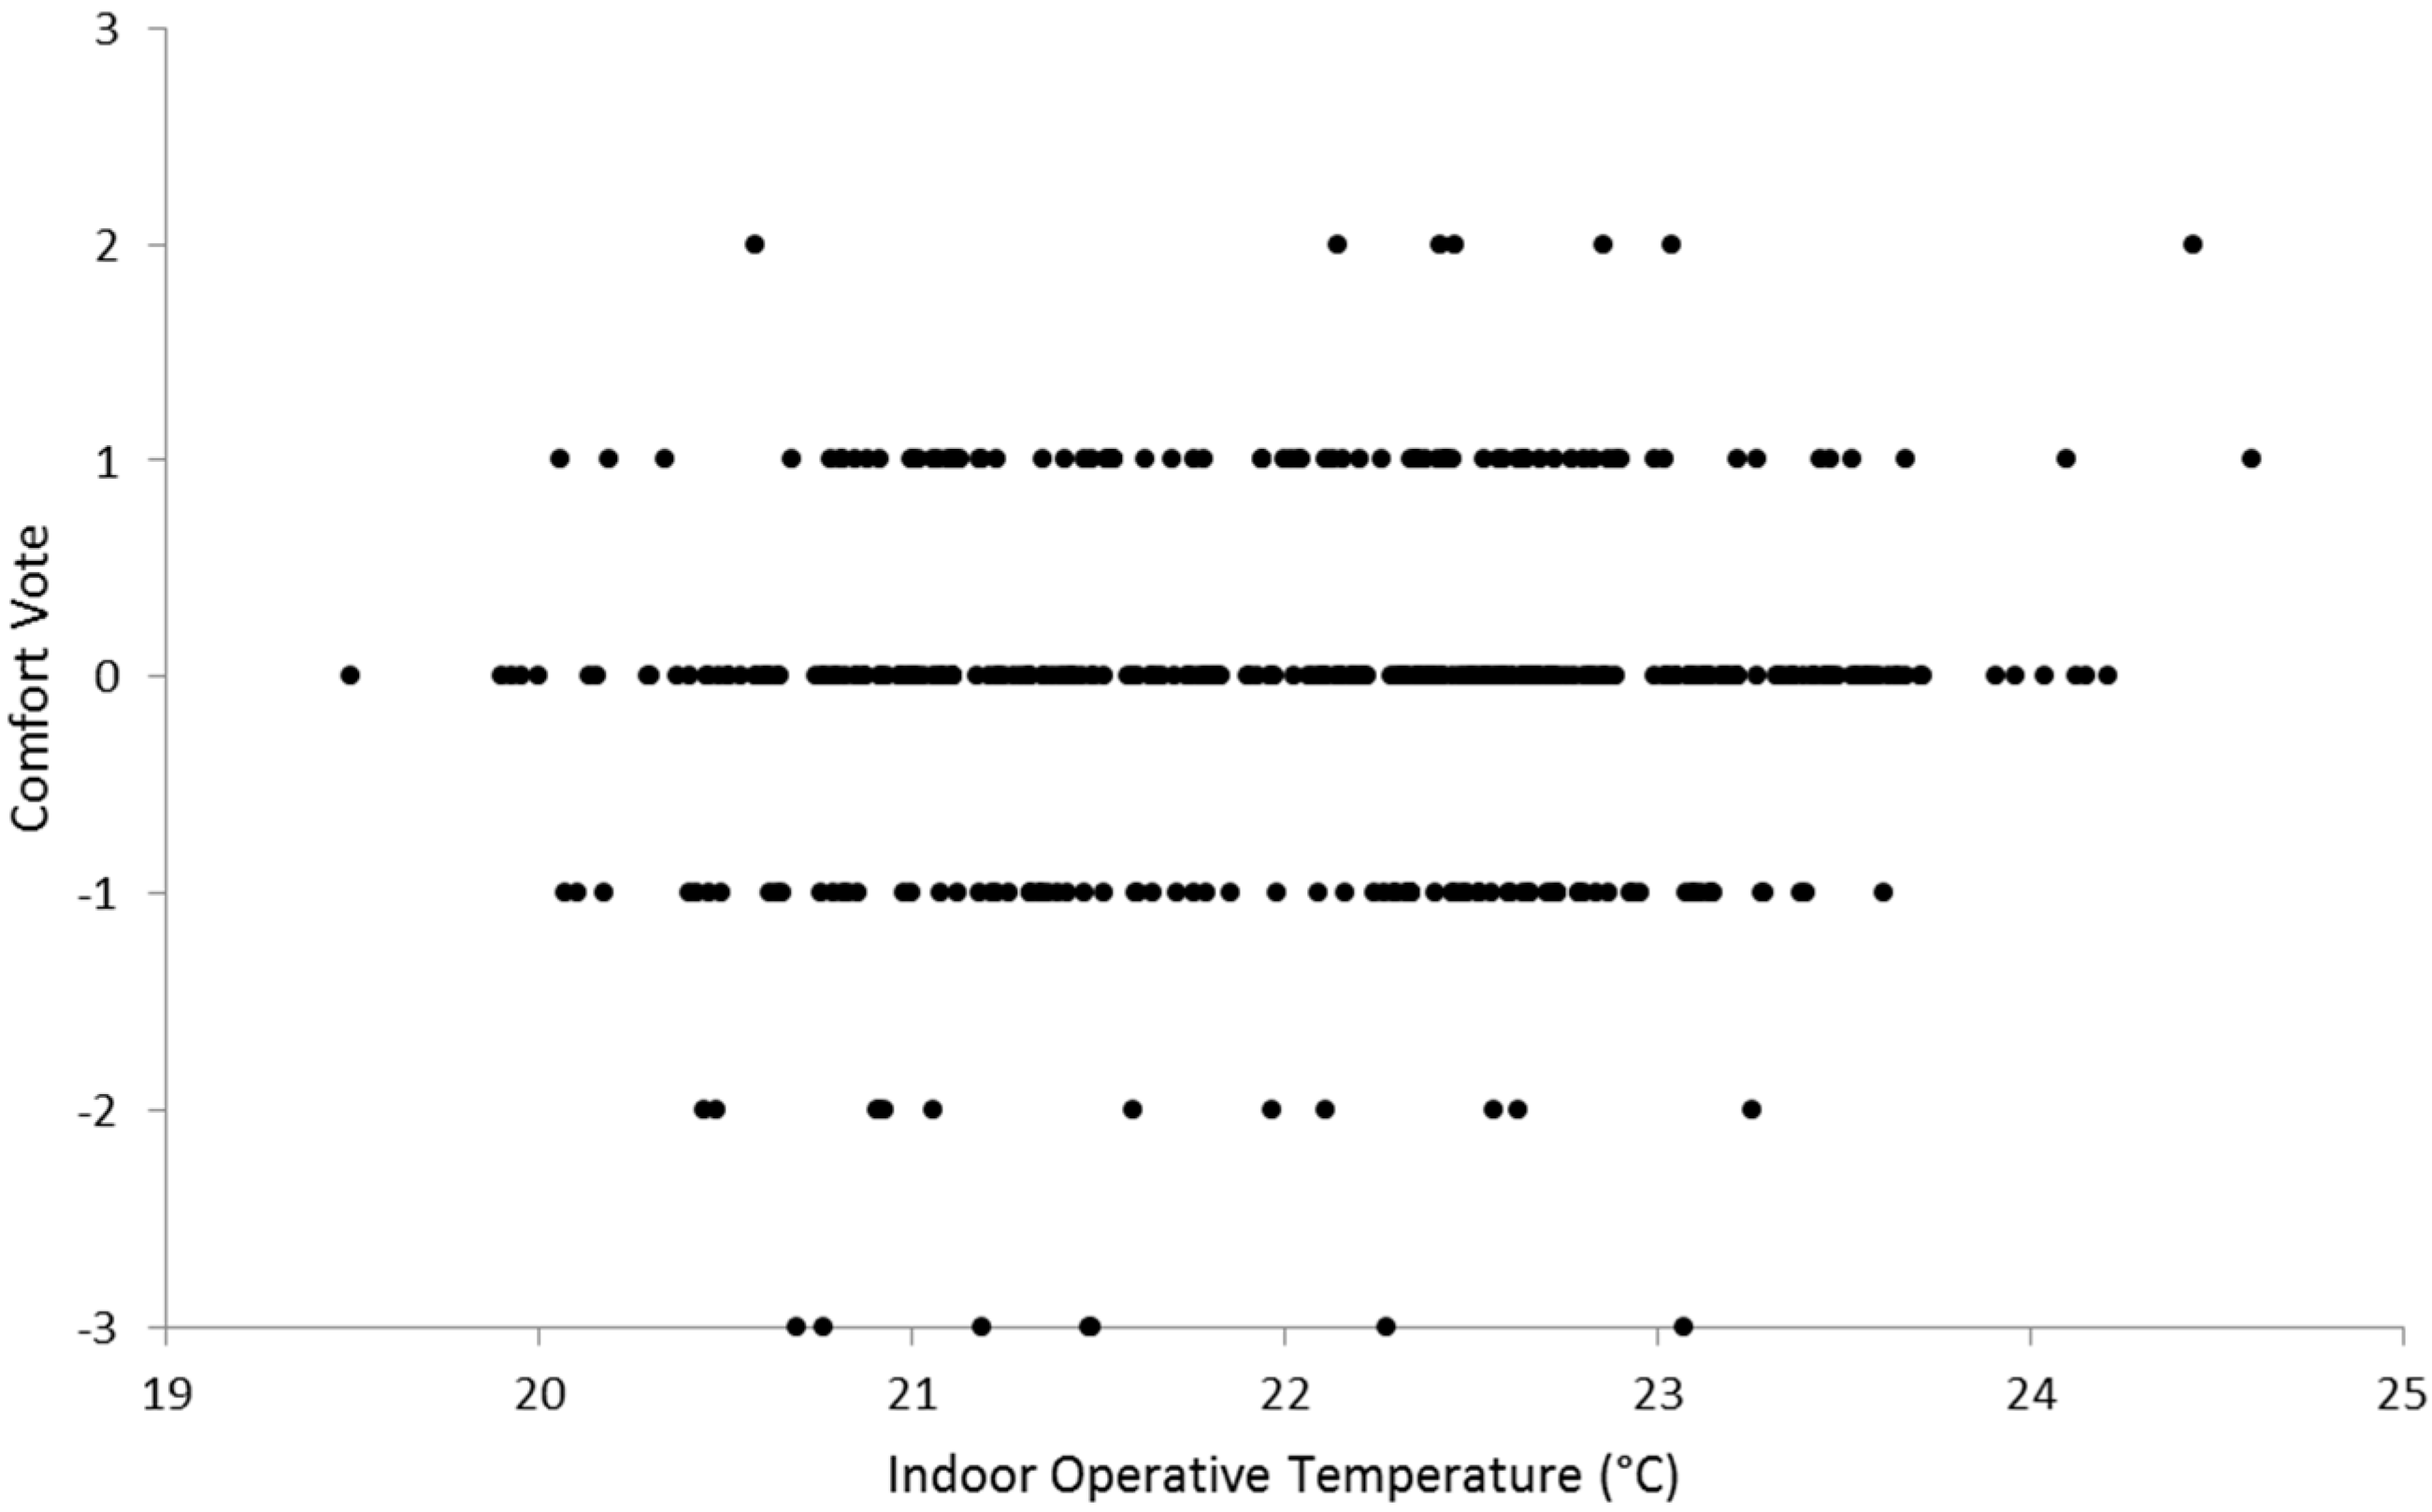
6]. It includes basic information from respondents such as their clothing and activity levels, which allows estimating the values of clothing insulation and metabolic rates respectively. In addition, the ASHRAE seven-point scale of thermal sensation (−3 cold, −2 cool, −1 slightly cool, 0 neutral, +1 slightly warm, +2 warm, +3 hot) was included, so the occupants of the office could express their thermal sensation through the actual mean vote (AMV), which is compared to predicted thermal sensation using the PMV model.
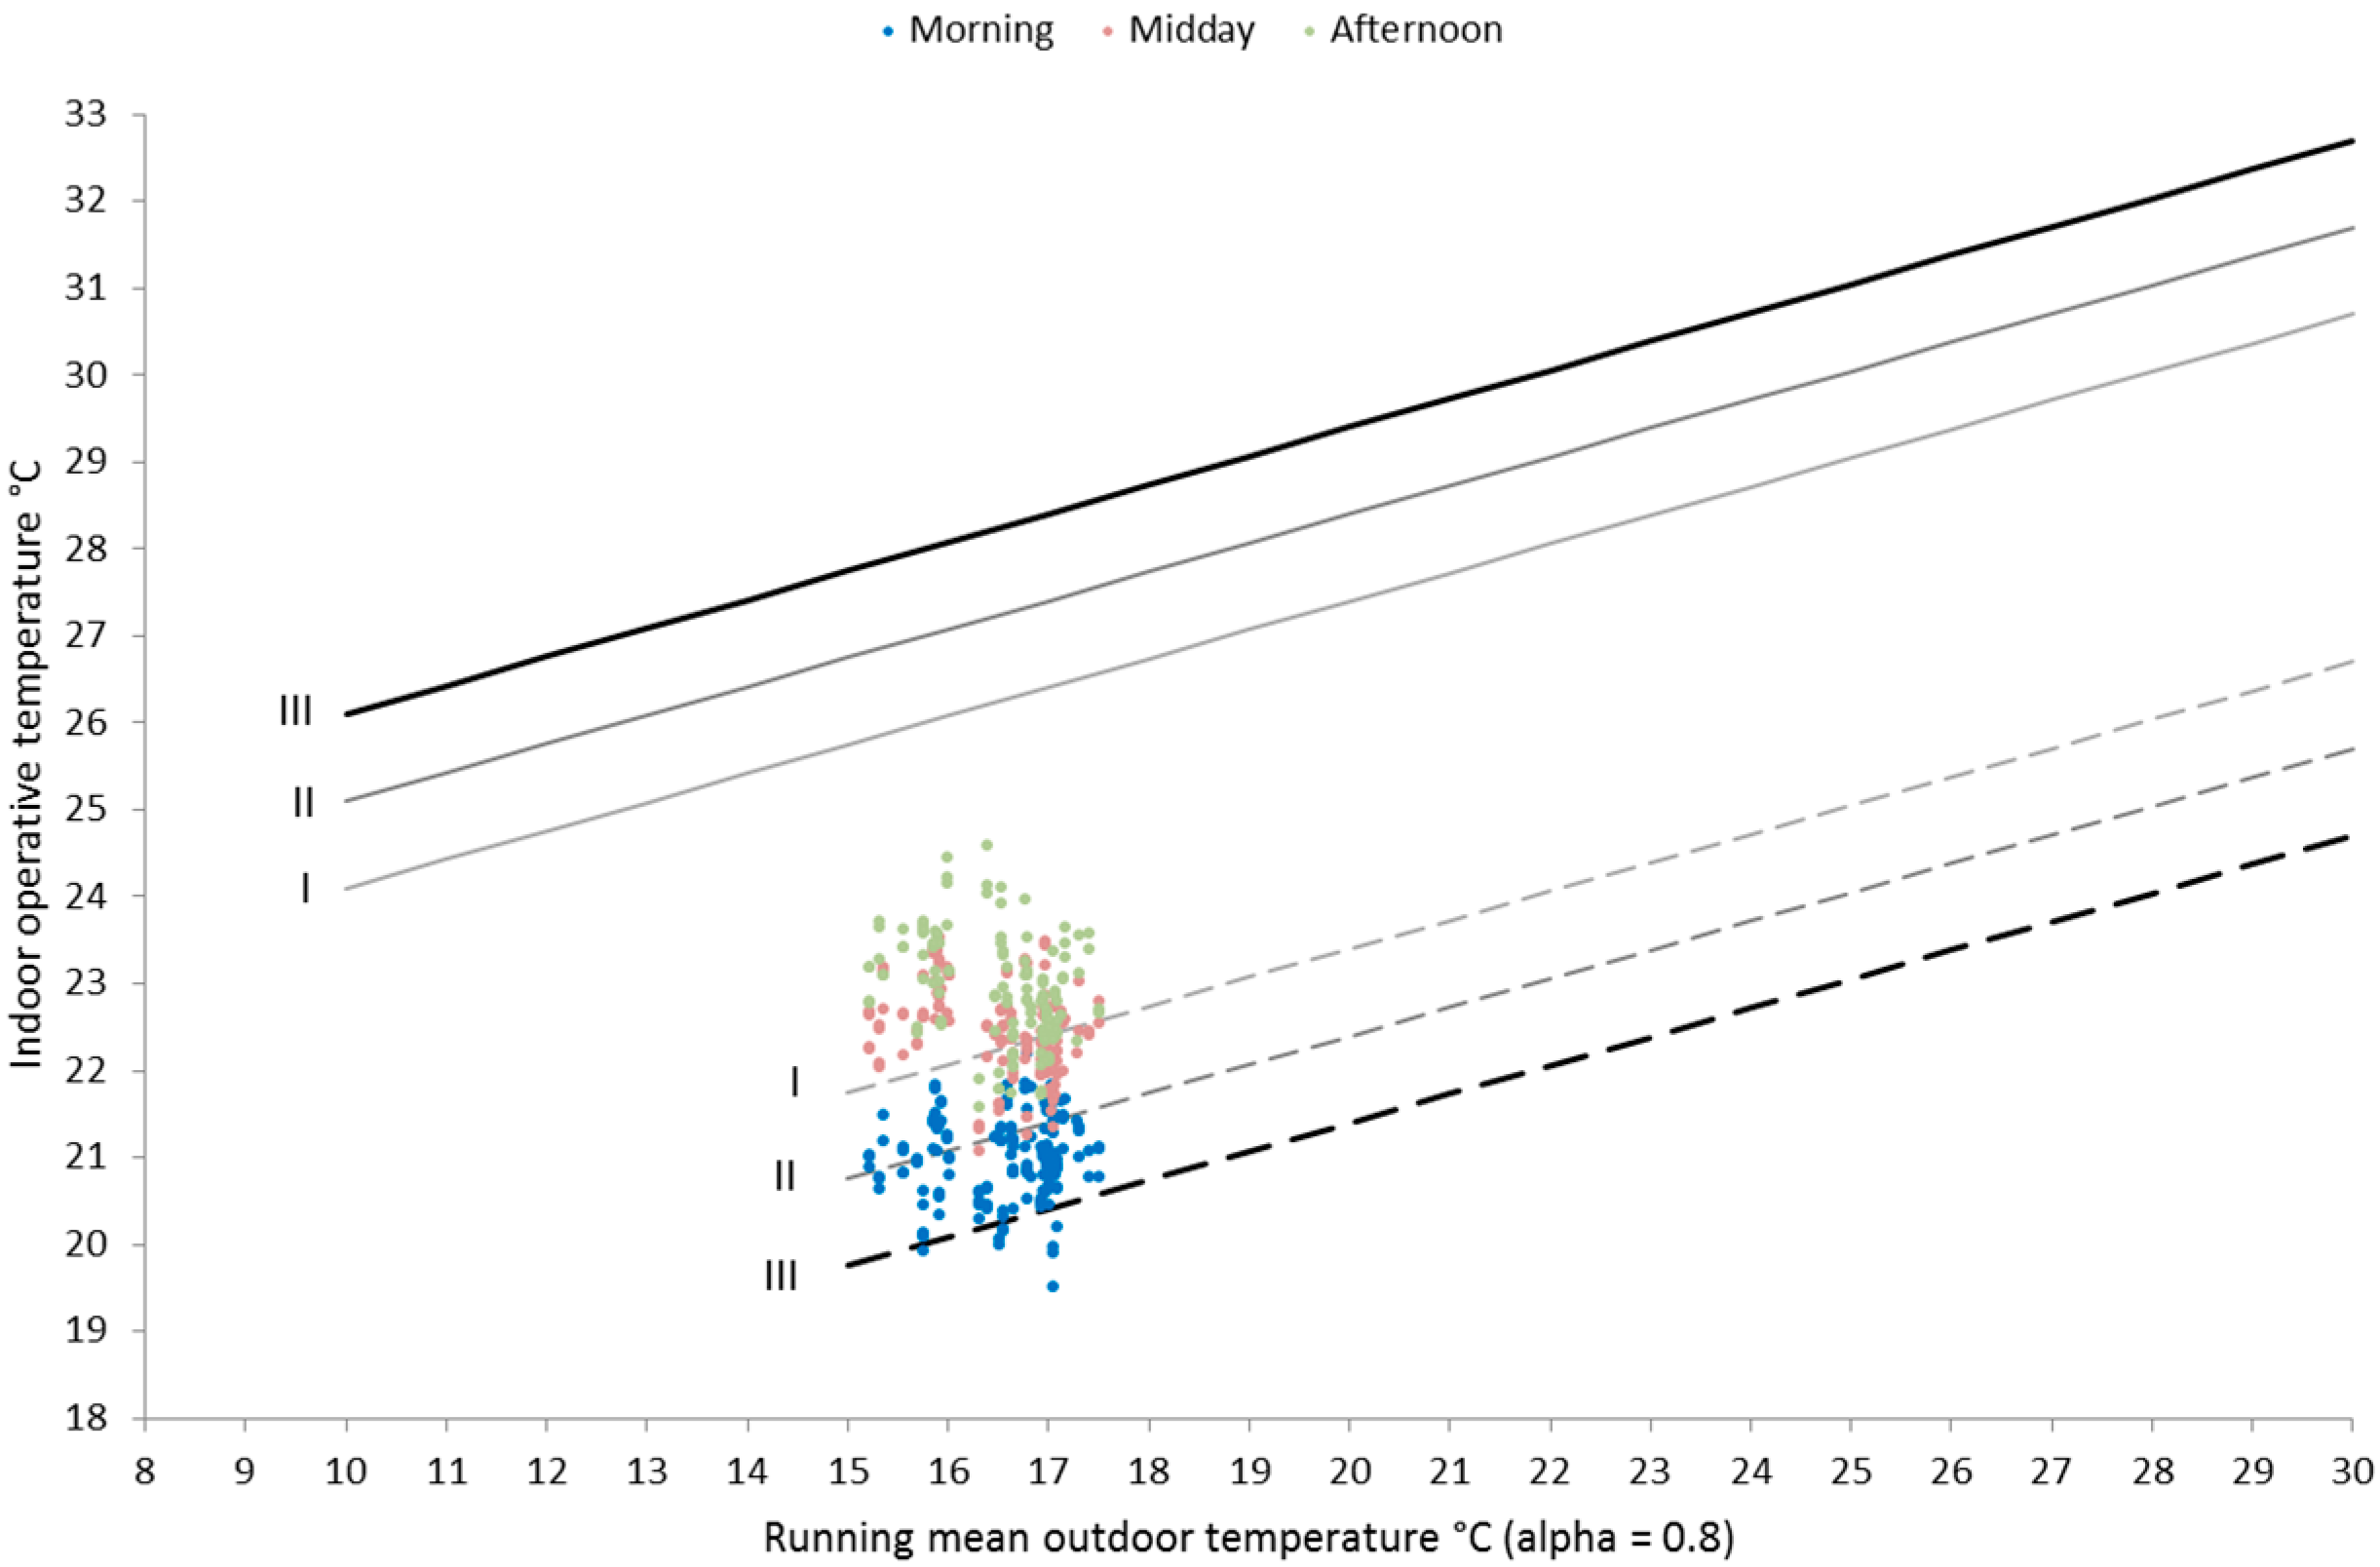
In order to compare the values of AMV and PMV for the same conditions, the survey also included questions related to the day and the time in which the survey was answered (morning, midday, afternoon) and the workstation position of the respondent.
Finally, the questionnaire included a question related to the adaptive mechanisms used by occupants of the office to regulate internal thermal comfort conditions. This question was useful to obtain information of the window operation, and thus estimate the relative air speed inside the office. The web-based comfort questionnaires were sent directly to the personal computer of each participant. All subjects were quite familiar with the reply procedures, ensuring that their responses were consistent with their actual feelings. The thermal environment surveys were conducted from 17 August to 30 October 2015, from Monday to Friday. During this period, the occupants of the office, as far as possible, responded to the survey three times a day (morning, midday and afternoon). A total of 441 questionnaires were collected.

2.4. Evaluating Thermal Comfort

Based on the measured environmental parameters, the calculated mean radiant temperature, and the estimated values of relative air speed, metabolic rate and clothing insulation, the thermal comfort index PMV was calculated using the algorithm included in ISO 7730 (2005) [5] and ASHRAE 55 (2010) [6]. To determine the influence of both the window position and the position of each occupant within the office in its thermal sensation, the PMV index was calculated for each occupant in their respective workstation. The calculated PMV values are compared with the values of actual mean vote (AMV) reported in the thermal environment surveys and that indicate the actual thermal sensation of occupants.
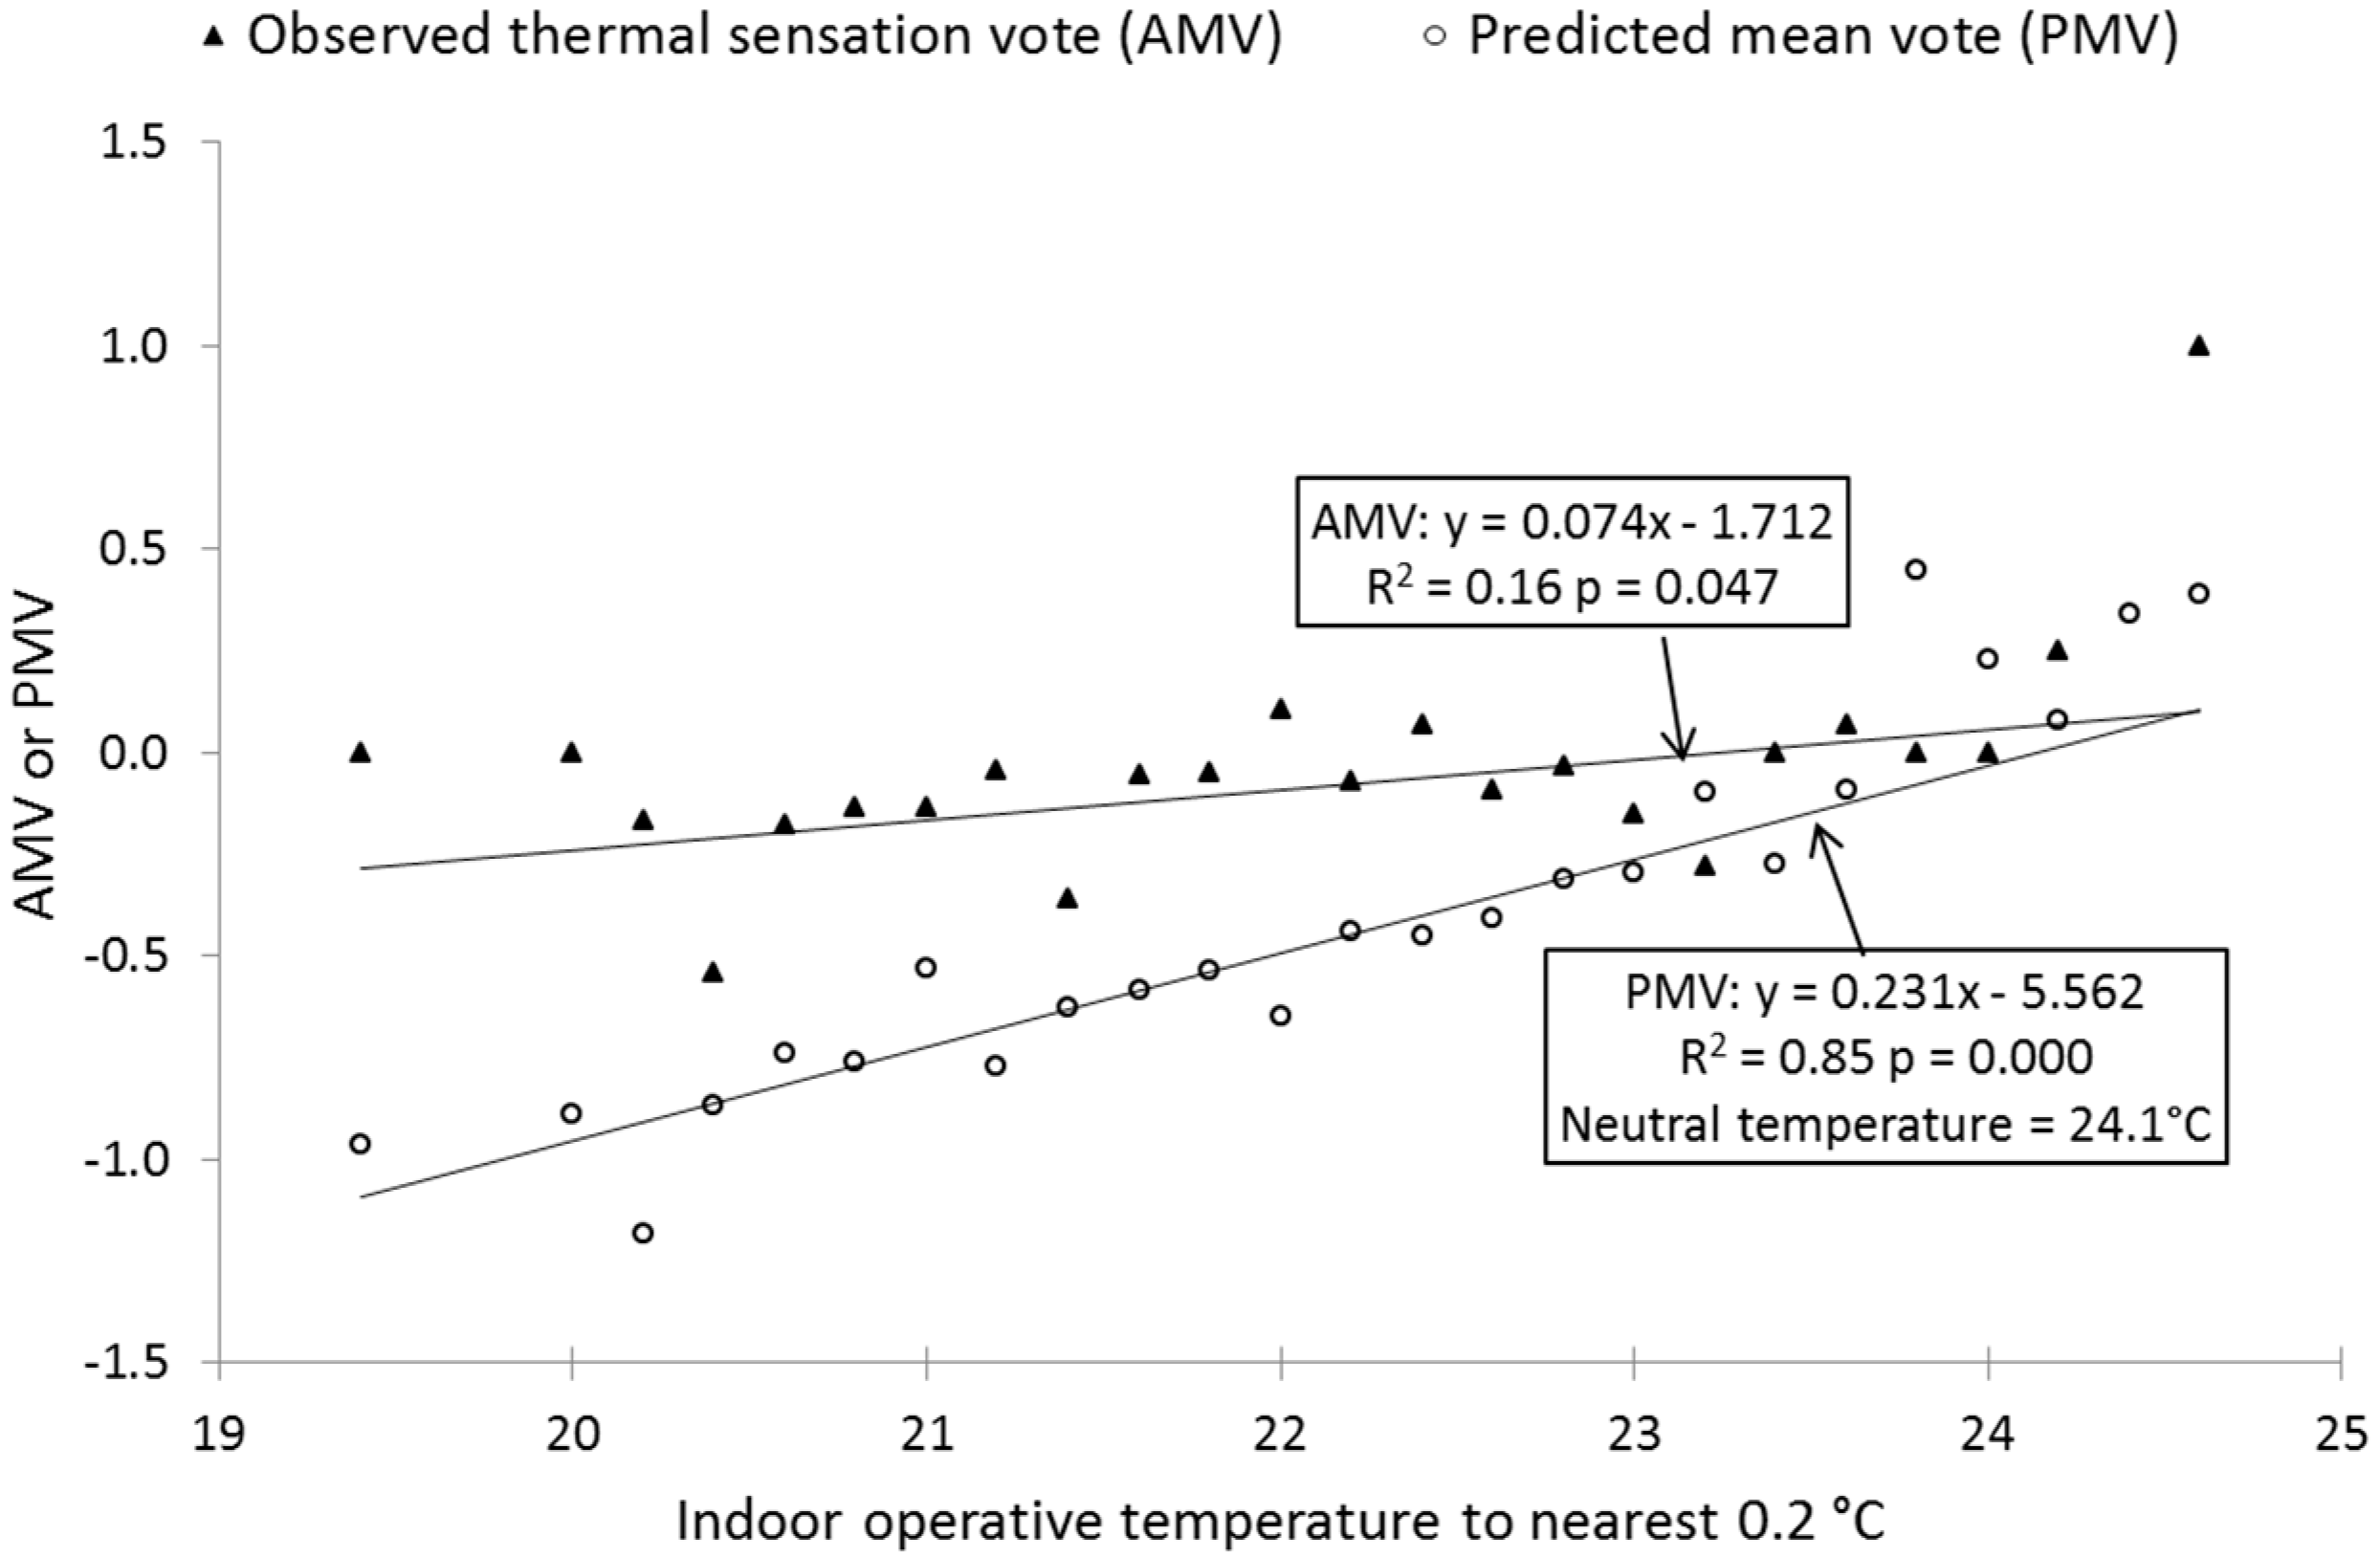
As in other studies [9,10,20,
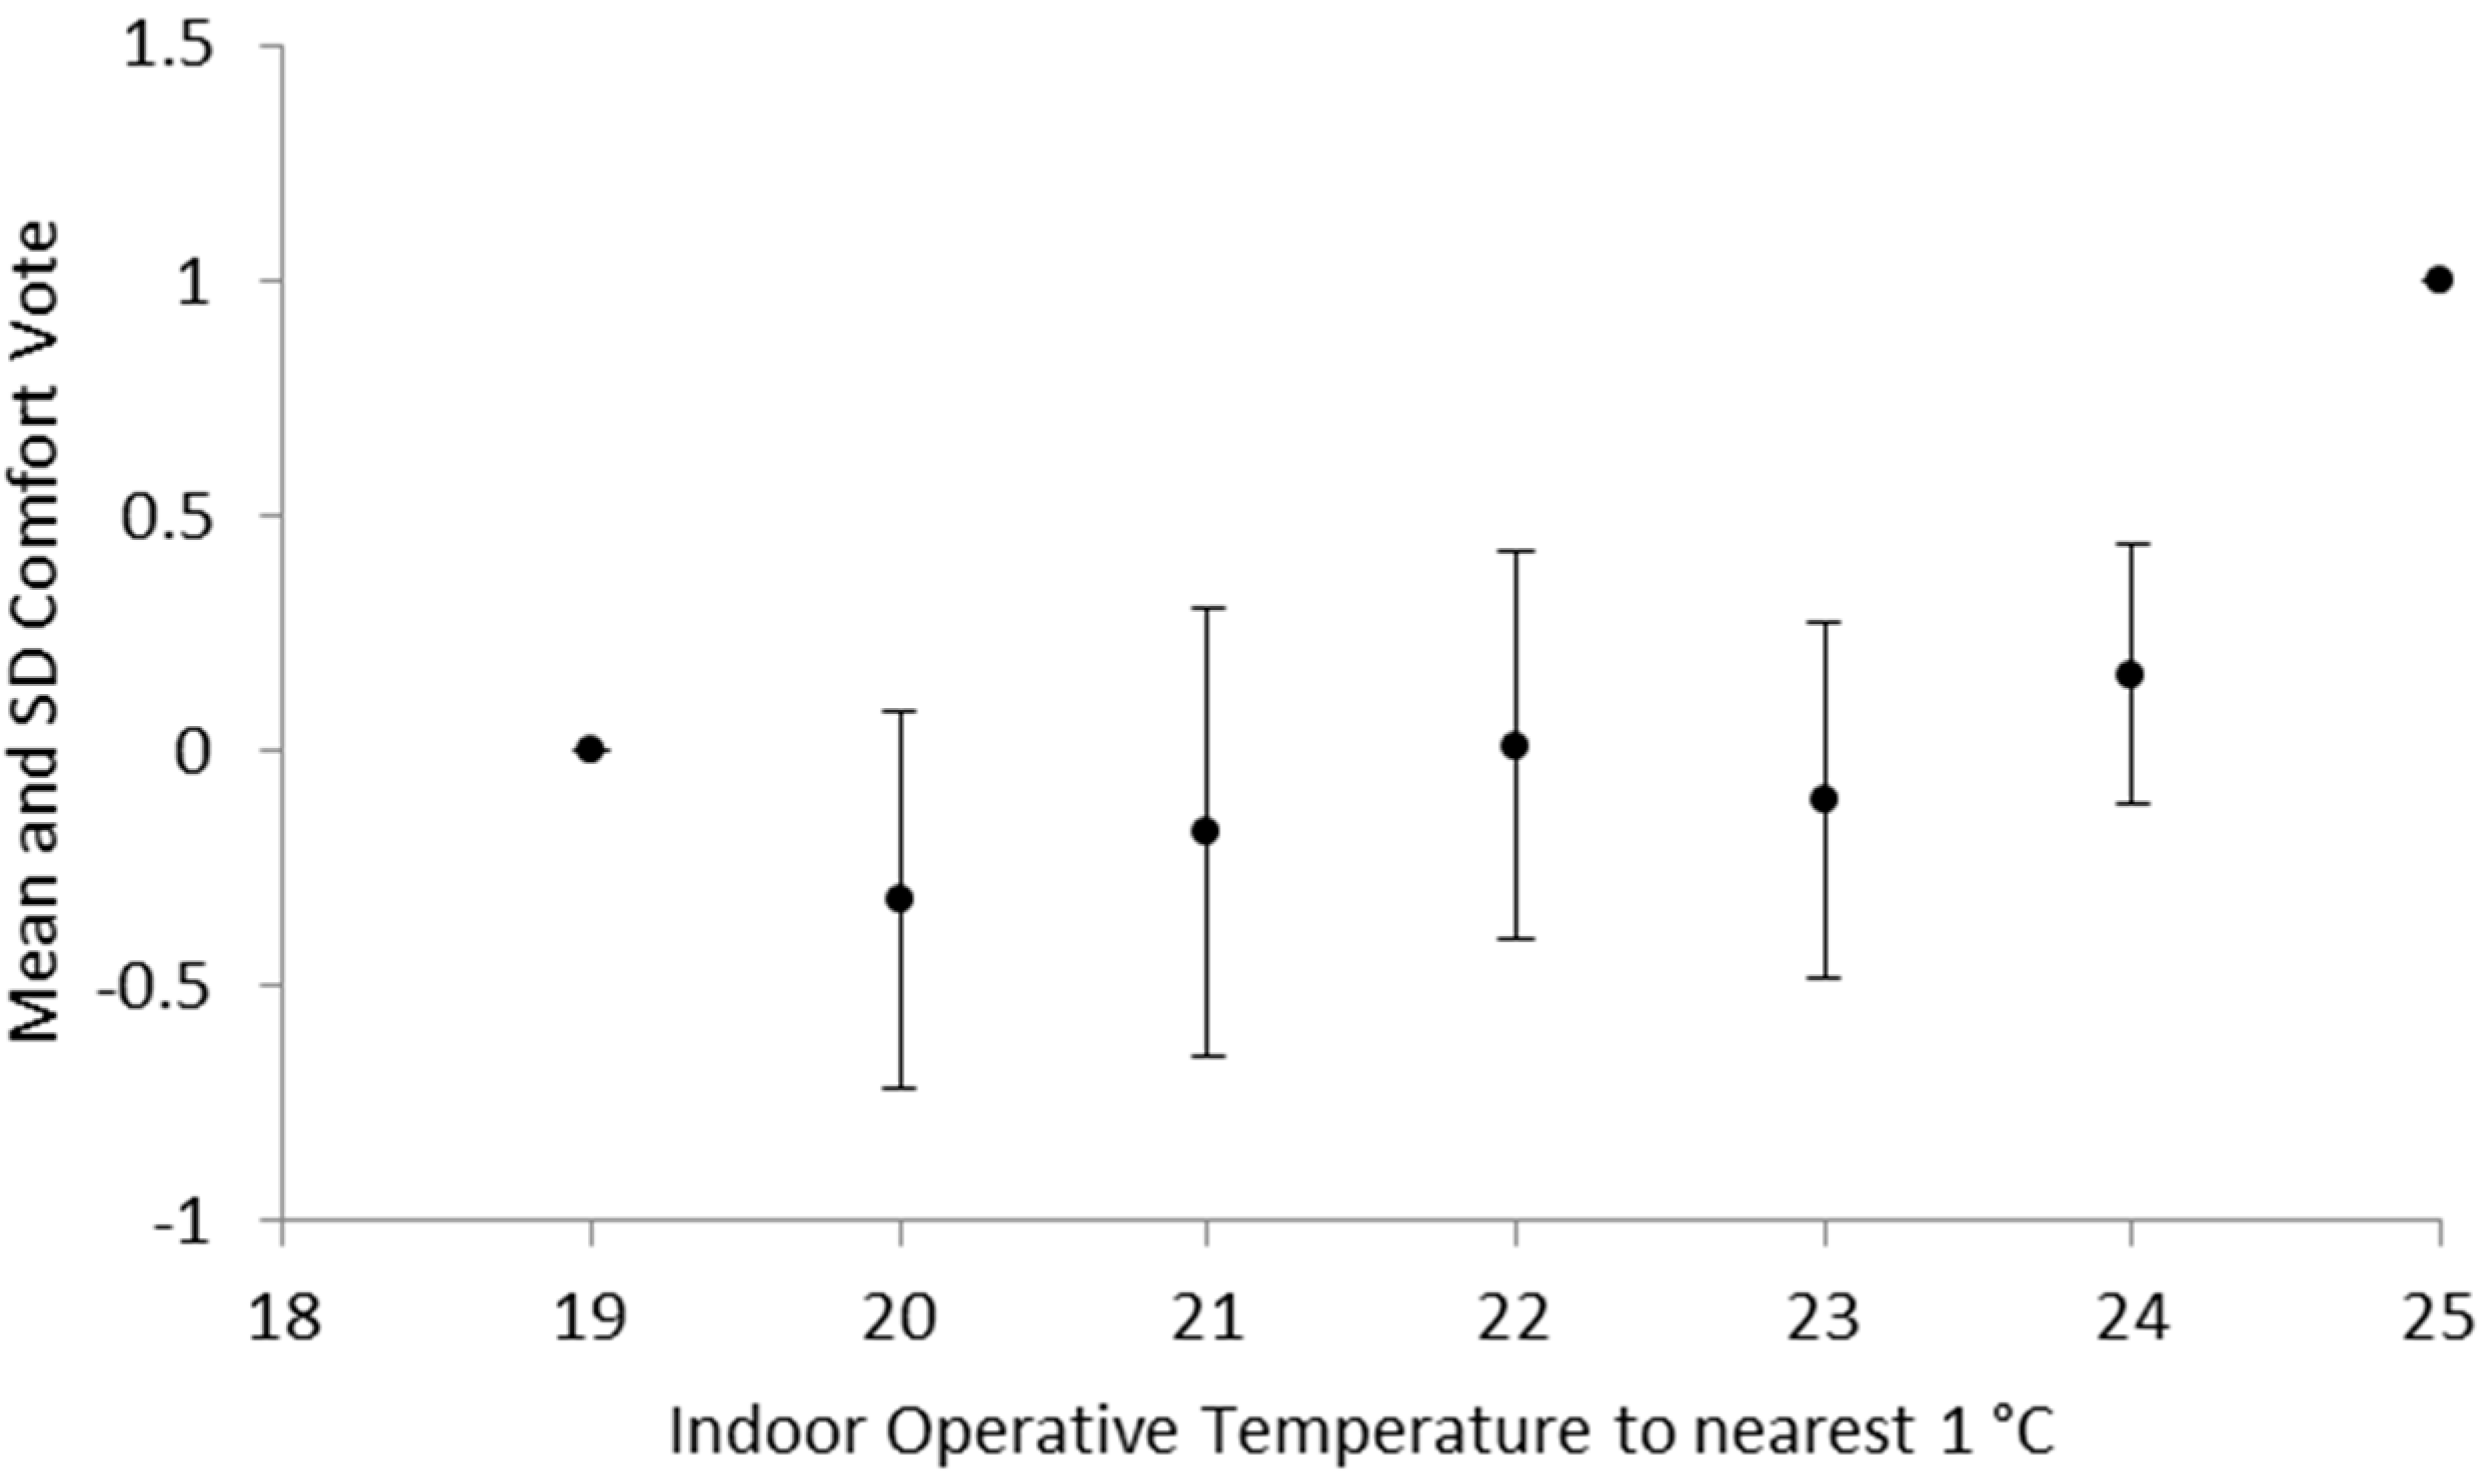
21], a weighted linear regression between PMV and AMV and the operative temperature is performed. Considering that data was insufficient to produce a reliable regression estimate of the comfort temperature, the Griffiths’ method was used for assessing the mean comfort temperature. The comfort temperature was calculated from comfort votes by assuming that a comfort vote of neutral will represent an estimate of “comfort”. If the comfort vote C for neutral is C N (the numerical value of C for neutrality) then the comfort temperature T c o m f can be calculated from the actual operative temperature T o p using the following relationship (Equation (5)) [15]:
T c o m f = T o p ( C C N ) / G
where G is the “Griffiths slope” ( K 1 ) . A study developed by Humphreys [17] and other surveys found that the most likely value for the Griffiths’ slope is about 0.5 K 1 , so this value was used.

3. Results

3.1. Climatic Design Challenge

In order to get an early understanding of the scale of the climatic design challenge and a feel for what is the right building and technology type for the climate in Quito-Ecuador, the Nicol graph was used [3]. The Nicol graph presented in Figure 4 combines the monthly outdoor temperatures in Quito with the temperature that is predicted to be comfortable indoors using the Humphreys formula (Equation (6)) [3]. The graph shows that in this type of climate, heating might be required at some periods to provide a pleasant indoor climate. Based on the results shown in Figures 12 and 13, it is evident that heating is especially required in the morning and in the evening. Considering that this study was performed during the hottest months of the year, we can assure that the climatic design challenge in Quito is related to heating operation, without considering cooling operation. For this reason, buildings in this location should implement passive solar heating strategies and strategies focused on minimizing heat losses, such as the ones presented in Table 3.
T c o m f = 0.53   T o m + 13.8
where T o m is the mean outdoor temperature for each month.

3.2. Field Study Data

The number of respondents to the survey was irregular, getting from 4 to 14 responses in one day. In total, 441 surveys were collected with information of thermal sensation, metabolic rate, and clothing insulation of all occupants of the office. Table 4 shows the average, maximum, minimum, and standard deviation values of the main physical and personal variables that influence human thermal comfort. It also includes descriptive statistics of the thermal comfort votes obtained from survey responses (AMV), the predicted thermal sensation (PMV), and the outdoor running mean temperature.
The metabolic rate of the occupants of the office varied between 0.9 met and 1.7 met with an average of 1.1 ± 0.1 met, indicating that the occupants who participated in the survey have levels of physical activity that are almost sedentary, which is common in office activities.
Considering that adding and taking off clothing is the main adaptive mechanisms used by occupants to regulate thermal comfort conditions inside the office, the average clothing insulation was analyzed at different times of the day. The average clothing insulation value in the morning is 0.90 clo, 0.88 clo at noon, and 0.84 clo in the afternoon, including the thermal insulation provided by a standard office chair (0.10 clo) [6]. The corresponding values of thermal sensation obtained from surveys (AMV) are −0.2 in the morning (PPD equal to 5.9%), −0.1 at noon (PPD equal to 5.1%), and 0.1 in the afternoon (PPD equal to 5.1%). This result demonstrates that there is a difference in clothing over the day.
Figure 5 shows a spatial distribution of average operative temperature inside the office obtained from the measured air temperatures and the calculated mean radiant temperatures. The air temperature was interpolated by applying the inverse distance weighted (IDW) interpolation method. The interpolation area is 5.2 m × 7 m (area of the office) and is divided into 100 rows and 140 columns (14,000 cells). The assigned values of air temperature to unknown points are calculated with a weighted average of the values available at the known points (values of air temperature at measurement points indicated in Figure 3). The mean radiant temperature was calculated in each point where air temperature was interpolated using the methodology proposed by Fanger [4], which includes calculating the angle or view factors. The graphs show that at different times of the day, operative temperature varies up to 1 °C at different positions in the office, which is evidenced by the differences in thermal sensation expressed by the occupants of the office depending on the location of their workstation. It is important to note that people placed in positions 6 and 7 are those that are exposed to large temperature fluctuations during a normal working day, with a range of variation up to 4.7 °C. These results demonstrate that usually building occupants in perimeter zones are affected by outdoor influences such as temperature and solar radiation and by their ability to control these influences. The results presented in Figure 5 have not considered interior surfaces, such as table surfaces, the computer surfaces, etc.
Figure 6 shows a histogram of the frequency of indoor operative temperatures inside the analyzed office. The temperature was divided into groups of 0.5 °C. A normal distribution based on the mean value and standard deviation of the sample is superimposed for comparison. The histogram of operative temperatures (Figure 6) clearly shows the range of conditions the subjects have experienced and the distribution comfort votes (Figure 7) shows how they felt about them. The histograms show that operative temperature and thermal comfort votes (AMV from surveys) have a similar distribution. Based on these results, we can estimate that the neutral or comfort temperatures would be around the operative temperatures with the highest frequency (between 21 to 23 °C).
In general, more than 50% of the observed responses indicate a neutral thermal sensation, and almost 40% of the responses indicate a slightly cool or warm sensation. In the morning and in the midday a considerable percentage of the occupants reported that the thermal environment tends to be slightly cool or slightly warm depending on the position of the occupants within the office and also on their clothing insulation. On the other hand, in the afternoon the occupants of the office have a generally neutral thermal sensation, with a significant percentage of people who consider the environment to be slightly warm, which is reflected in the clothing insulation levels of occupants which is generally the lowest. These results are consistent with the observed responses of clothing values that clearly show that people wear more clothes in the morning, when the interior environment is colder, than in the midday or in the afternoon.
It is important to note that Figure 5 and Figure 6 do not have the same information, as Figure 6 only shows the operative temperatures registered at the time when people responded to surveys (441 observations of operative temperatures associated with the 441 survey responses only at the 7 workstation positions), while Figure 5 presents the mean operative temperatures in every position inside the office (14,000 cells) for the whole field study period (17 August to 30 October). The mean indoor operative temperature presented in each graph of Figure 6 is highly influenced by simultaneous survey responses with very similar operative temperature observations.

3.3. Thermal Sensation and Environment

Comfort votes from survey responses are plotted against indoor operative temperature. These kinds of plots are characteristically dispersed as shown in Figure 8. This is because the comfort vote is not a precise and immediate response to indoor operative temperature but is affected by all the changing environmental and social circumstances. It also differs between subjects—not everyone responds the same way. If everyone responded the same, and if comfort vote were simply a response to the environment, as it might be in a climate chamber experiment, then a closer relationship between comfort and temperature might be expected.
To have a better understanding of how the comfort vote changes with the indoor operative temperature, the mean value of comfort vote for one degree “bins” of operative temperature was calculated and plotted using the error bar format (Figure 9). The mean for each bin of operative temperature is given by the center points of the bands. The rise of the comfort vote with temperature is partially demonstrated.
Figure 10 presents weighted linear regressions of both observed thermal sensation votes (AMV) and those predicted using Fangers’ PMV index on indoor operative temperature. It is not uncommon to find that the regression equation for observed thermal sensation vote (AMV) has a slow slope as shown in Figure 10. Compared with PMV, the gentle gradient of actual AMV suggests occupants were less sensitive to environments that departed from neutral conditions and were able to adapt themselves to their current thermal environment. A similar “scissors difference” (different slopes of the PMV and AMV regression lines) between PMV and AMV was also found in other field studies [22,23,24,25].
Generally, the calculated PMV underestimates the actual thermal sensation of the occupants of the office, and, thus, overestimates the comfortable operative temperature or neutral temperature. These results are consistent with the studies that confirm that the PMV model tends to underestimate or overestimate the thermal sensation of people in buildings with natural ventilation [2,26,27,28,29]. Additionally, it is evident that occupants in the naturally ventilated buildings are tolerant of a wider range of operative temperatures than in the centralized HVAC buildings and find conditions well outside the comfort zones published in ISO Standard 7730 to be acceptable.
The regression analysis of the weighted linear regressions (Figure 10) is presented in Table 5. As can be seen from the table, the regression equation of actual mean vote (AMV) on indoor operative temperature has a low correlation (R2 = 0.16). Additionally, the p-value shows that the relationship does not give a significant result (p = 0.05). The estimate of the regression coefficient is of low precision, either because of the limited number of observations or because of the narrow range of operative temperature. For this reason it is advisable to use a standard regression gradient, rather than the empirical value from surveys, because the estimate of the latter is prone to much uncertainty. An appropriate value is 0.5/K according to the “Griffiths’ Method” that was implemented. This method is useful where the range of temperature is so small that regression is unreliable like in this case. In this study, 441 total observations were collected, which include values of operative temperature ( T o p ) and their respective thermal comfort vote (AMV). Using the Griffiths’ formula (Equation (5)), a comfort temperature T c o m f was calculated for each observation (there are 441 calculated comfort temperatures). It is worth mentioning that the minimum comfort temperature does not necessarily correspond to the minimum operative temperature, as the comfort temperature is also a function of comfort vote according to the Griffiths’ method. The calculated comfort temperatures using the Griffiths’ method are presented in Table 6.
To compare, the mean comfort temperature from predicted mean votes (PMV) was also calculated. As opposed to the relationship of AMV on indoor operative temperature, there is a strong positive relationship for PMV (R2 = 0.85) responses against the indoor operative temperature (p = 0.000). For this reason, the mean comfort temperature from PMV votes was calculated from the regression equation in Table 5, as in other studies [10,11,12,13]. The mean comfort temperature calculated from the regression equation of predicted mean vote (PMV) on indoor operative temperature is 24.1 °C.
The calculated comfort temperatures confirm that the PMV model overestimates the comfortable operative temperature as shown in Figure 10. The results showed in Table 6 are consistent with Figure 6 and Figure 7, which shows that people feel comfortable at the operative temperatures with the highest frequency, which in this case are closely related to the obtained comfort temperatures using the Griffiths’ method.
Figure 11 shows that the comfort or neutral temperature calculated from the field survey is highly correlated with the mean operative temperature measured during the survey. The central line shows the mean neutral temperature for any given mean operative temperature and 95 percent of all the results lie between the two outer lines. This is an indication that the occupants of the office are usually able to match their comfort temperature to their normal environment.

3.4. Thermal Neutrality and Outside Temperature

As shown in Figure 12, for the adaptive comfort model, the evaluation results were quite good, as most dots lay in the range of Category III (moderate expectation—used for existing buildings). The evaluation results obtained from the adaptive comfort model are consistent with the subjective results reflected in Figure 7, which shows that occupants’ thermal responses were mainly concentrated among the “neutral” and “slightly acceptable” options. In addition, Figure 12 shows that most dots are within the lower limits for operative temperature, which is consistent with the Nicol graph presented in Figure 4, which shows that the climatic design challenge in Quito is related to heating requirements. Additionally, it is evident that heating might be required, especially in the morning.
In order to visualize the average conditions that occupants of the office have experienced during the field study, operative temperature against time of day was plotted in Figure 13. The dashed lines show the upper and lower limits of the adaptive comfort model included in CEN Standard EN15251 (Category III), obtained from the average outdoor running mean temperature during the field study. This figure is consistent with all the obtained results that indicate that there might be some temperatures below the recommended range, especially in the morning.

4. Discussion

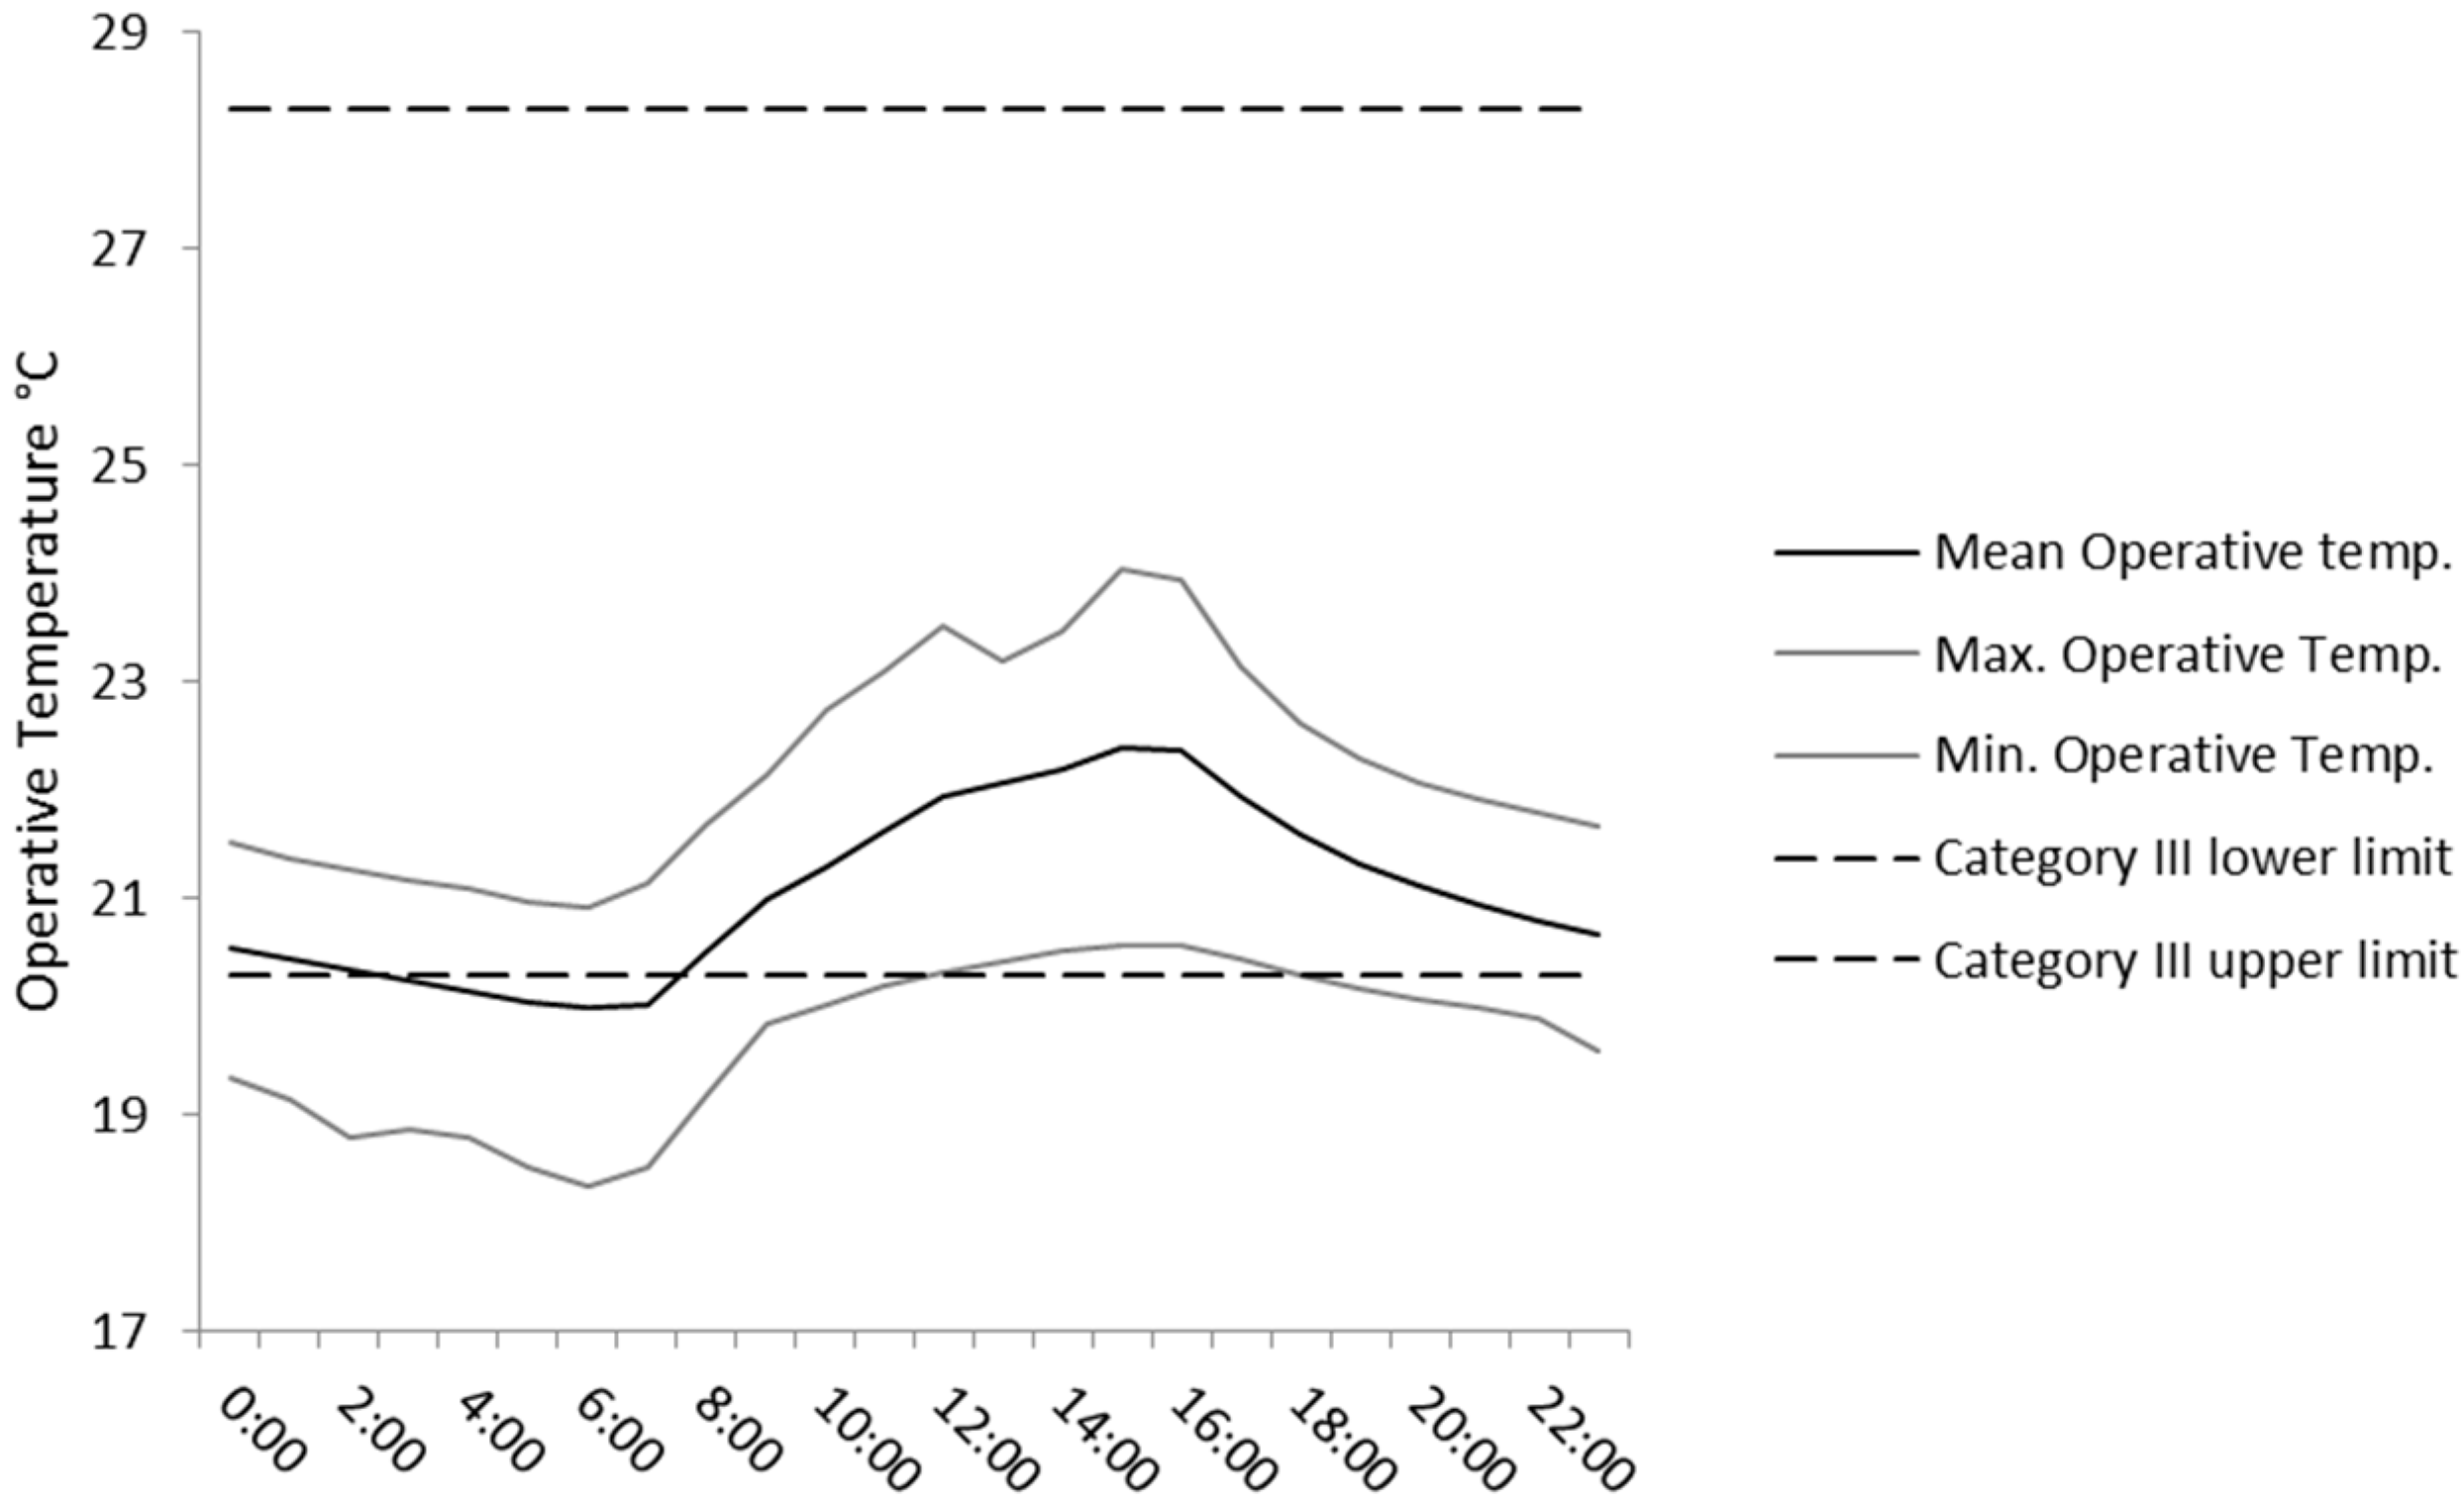
Based on the results of the thermal environment surveys, buildings located in Quito-Ecuador may have, in general, an acceptable thermal environment. However, it is important to note that the indoor environment may require a heating system to maintain comfort conditions especially in the morning. In this regard, we must bear in mind that this study was conducted in the warmer months of the year, so the period of discomfort that occurs in the morning may be more critical in the coldest months of the year.
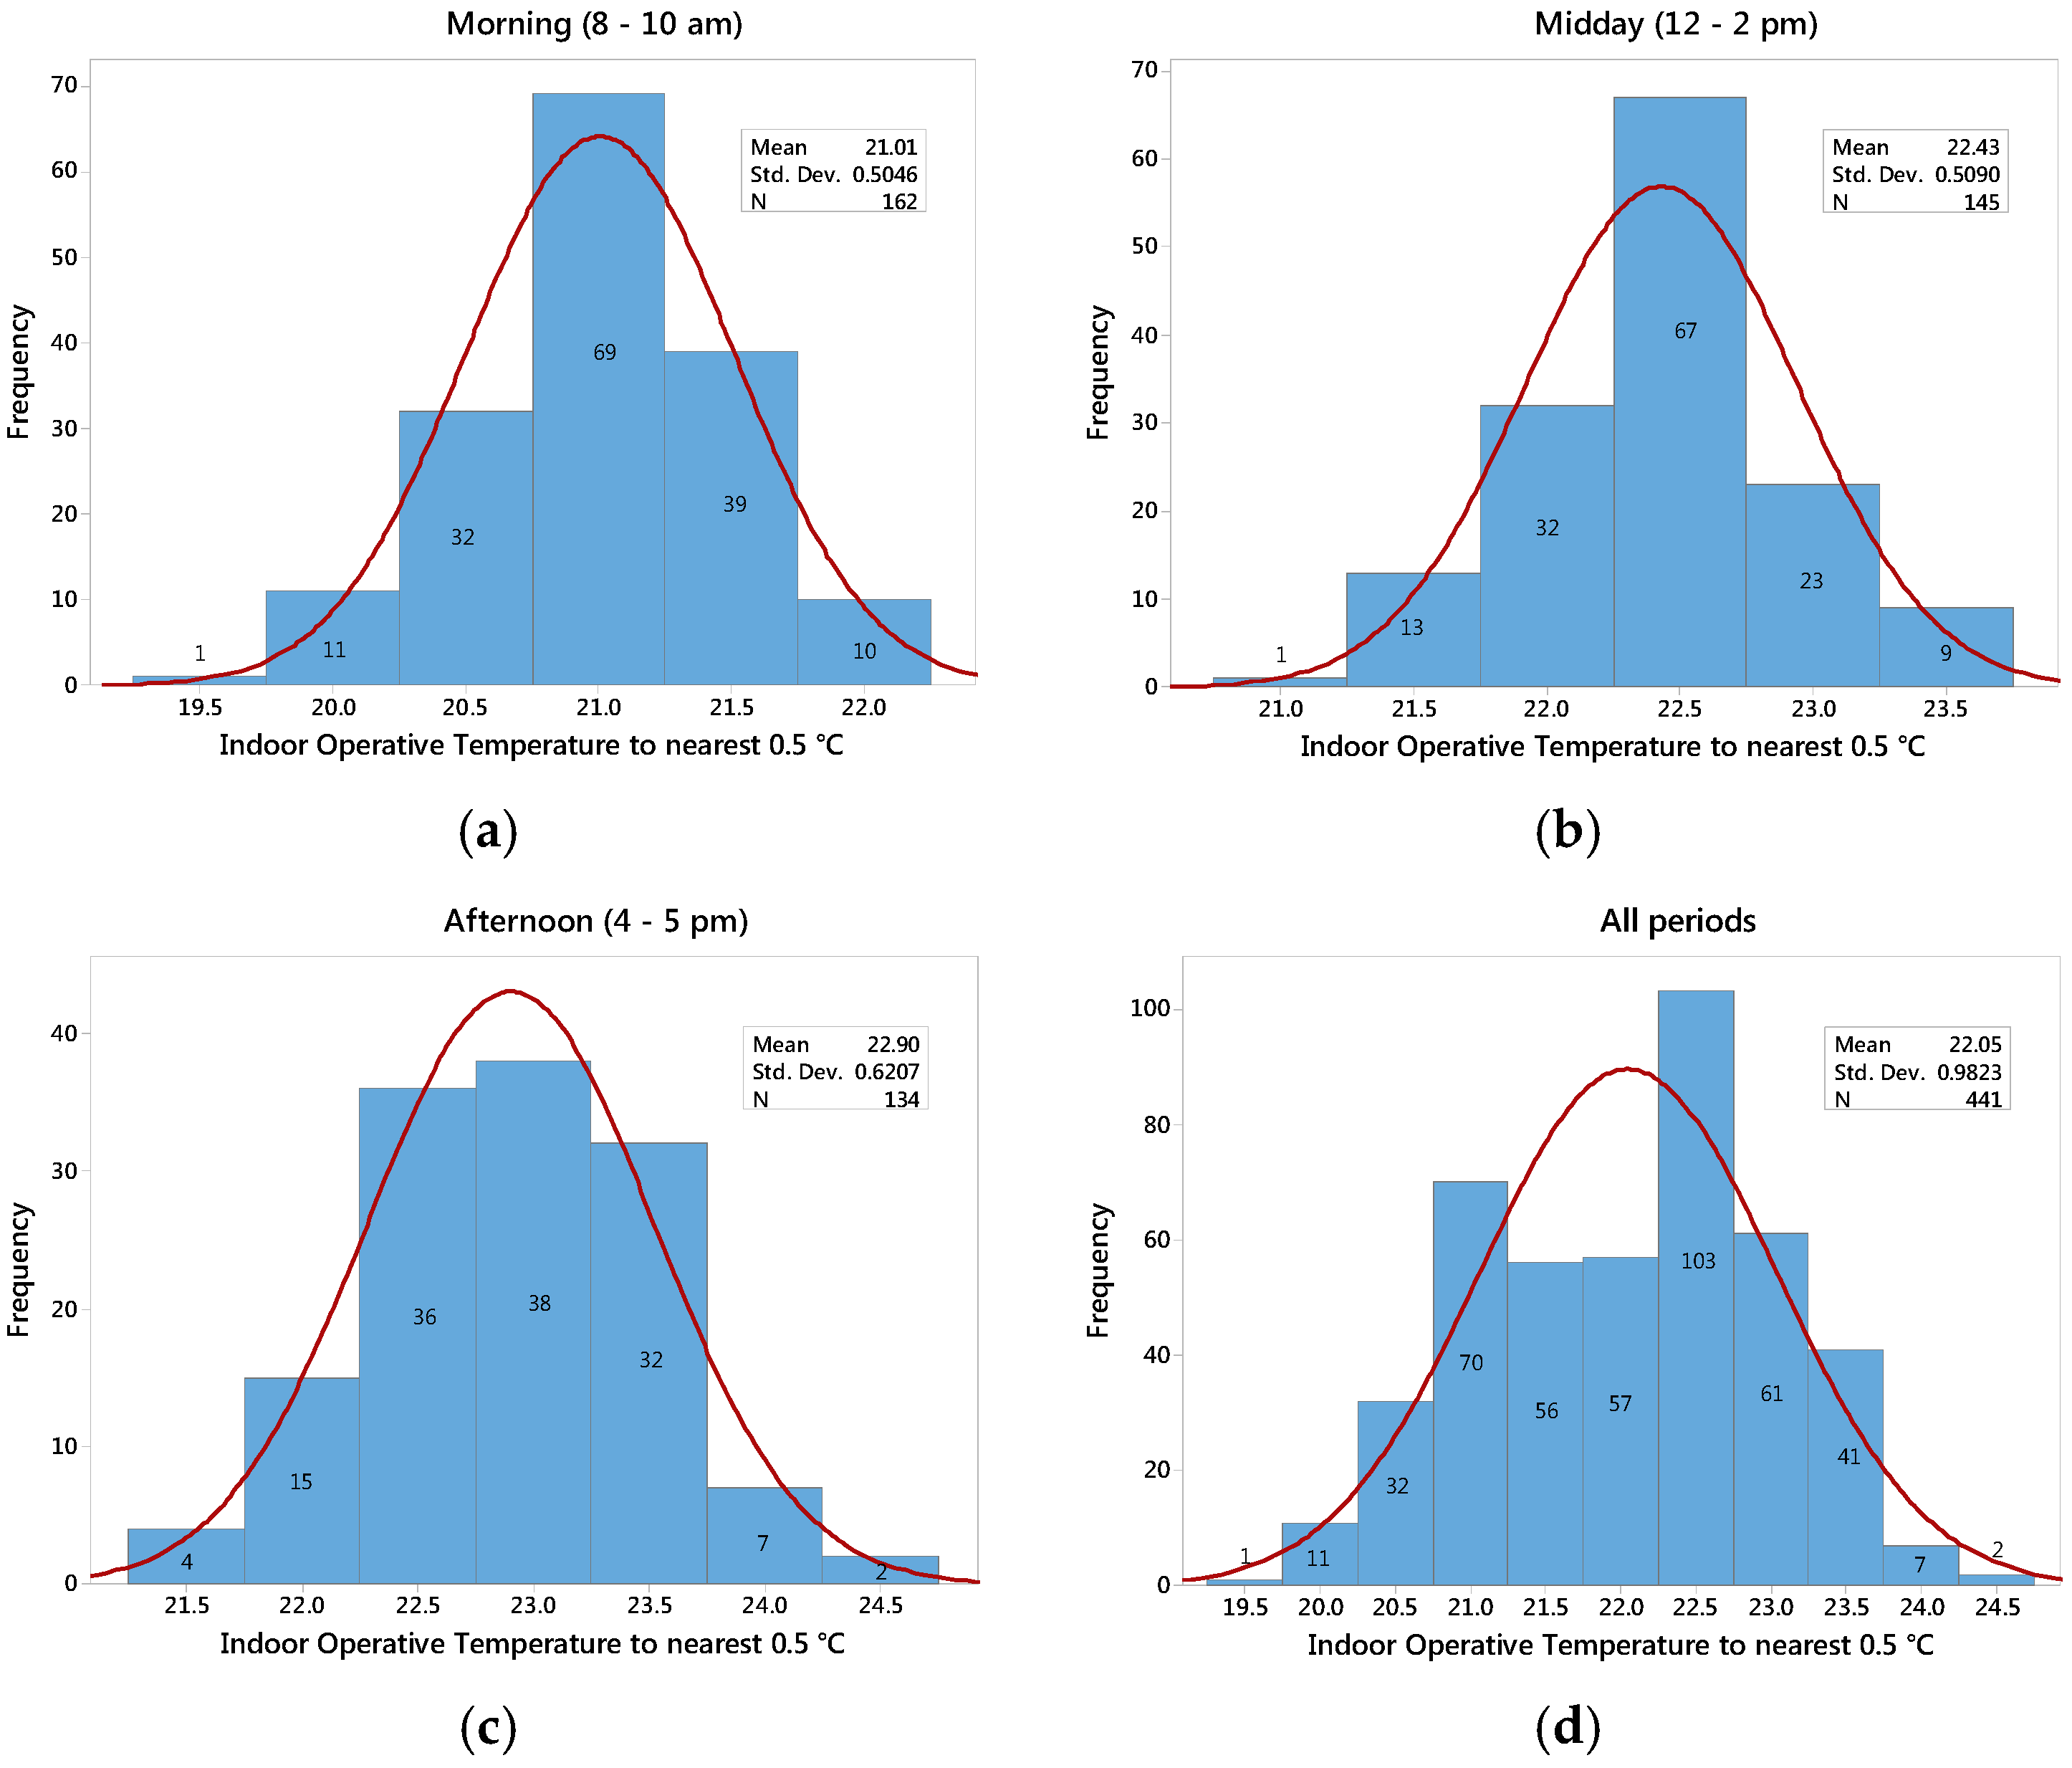
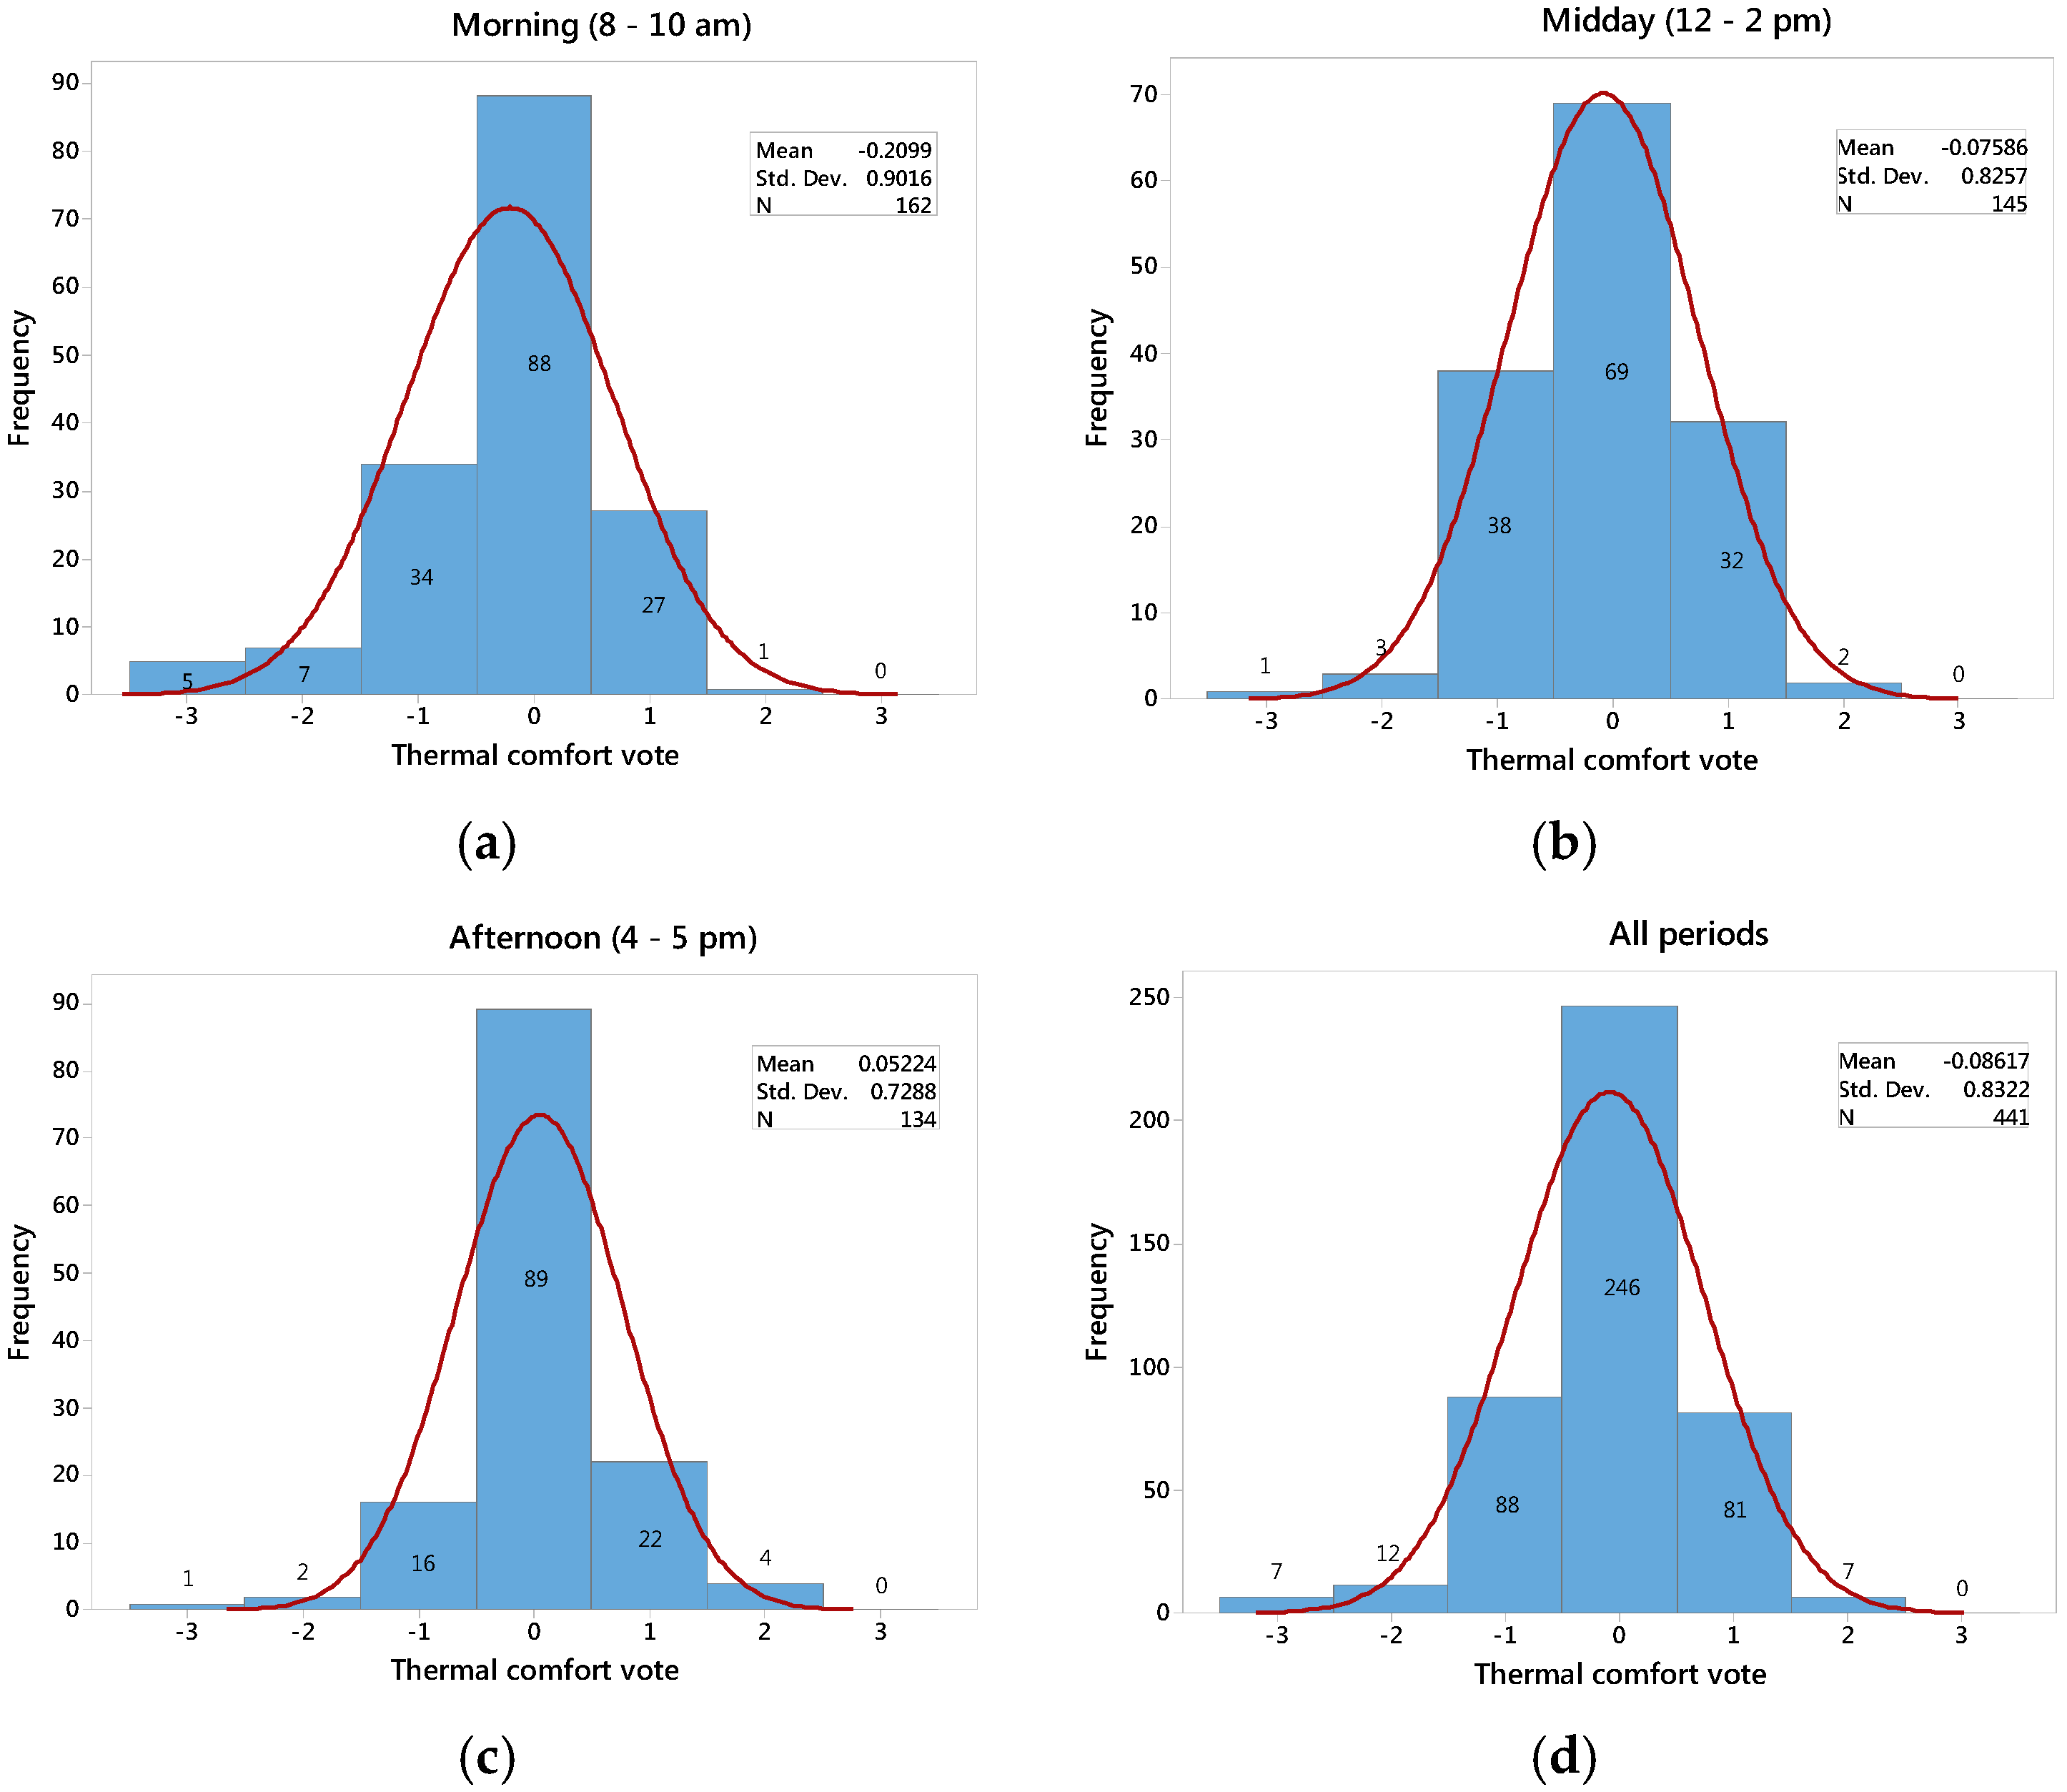
Both PMV and AMV values indicate that the thermal environment inside the office during the field study tends to be slightly cool in the morning and, as the day goes by, the environment gradually becomes more comfortable thanks to the internal heat gains due to the occupation, the use of electric equipment, and solar heat gains through the main window. This is also evidenced in the clothing level variations of the occupants of the office, which have the highest level of clothing insulation in the morning and the lowest in the afternoon.
The evaluation results obtained suggest that although the PMV model predicts to some extent the thermal sensation of occupants, it fails in estimating the temperature at which occupants feel comfortable. This study has verified that the PMV index underestimates the actual thermal sensation of occupants of a naturally ventilated building and, therefore, overestimates the neutral comfort temperature. According to the PMV model, the neutral comfort temperature inside the office is 24.1 °C, while the neutral comfort temperature as reported by the surveys is 22.1 °C. This situation can be explained by the adaptive principle that indicates that if a change occurs such as to produce discomfort, people react in ways which tend to restore their comfort. In this case, the occupants of the office have developed some degree of adaptation to the climatic conditions of the city where the office is located, and tend to accept and even prefer lower operative temperatures than those considered optimum by applying the traditional PMV model.
It is also important to note that there is a considerable difference between the thermal sensations expressed by each of the occupants of the office, even when they are exposed to relatively the same environmental conditions. This study attempted to relate this difference to the change in operative temperature within the office using a spatial distribution from which the operative temperature in each workstation position was obtained. The results indicate that there are indeed workstation positions, such as positions 6 and 7, which by being close to the main window of the office have variations of operative temperature of up to 4–5 °C in the same day. Due to the variation in these workstations, people generally report a slightly cool thermal environment in the morning and a slightly warm thermal environment in the afternoon when solar heat enters the office through the window. Taking this into consideration, as future work it could be interesting to model façade interior surface temperatures and solar gain in more detail to enable the analysis of their impact on thermal comfort and provide more information for façade design decisions.

5. Conclusions

The results show that the adaptive model provides a more reliable evaluation of thermal comfort consistent with measured data. Survey responses show that occupants’ thermal sensations were mainly concentrated among the “neutral” and “slightly acceptable” options. This might be because the majority of indoor temperatures during office hours fluctuated from 21 to 23 °C, which is in the range of the calculated comfort temperatures using the Griffiths’ method. In this regard, it can be concluded that this method is suitable for assessing the mean comfort temperature for a small sample of comfort votes. With this evidence, we believe the adaptive comfort model is applicable to naturally conditioned buildings located in a temperate climate zone.
Considering that most buildings located in Quito-Ecuador do not have HVAC systems installed, we recommend implementing an adaptive comfort model like the one included in CEN Standard EN15251 to evaluate human thermal comfort in buildings. If building professionals decide to adopt an international standard based on the traditional PMV model to evaluate thermal comfort in buildings, it is very likely that the use of HVAC systems will be required to meet the standard’s narrow definition of thermal comfort. This will represent an unnecessary increase in energy consumption to maintain a temperature that is different to the actual comfort temperature of the people living in this city. In a relatively mild climatic zone like in Quito-Ecuador, buildings can reduce the energy required to provide a constant supply of uniformly conditioned air if building occupants employ adaptive mechanisms like adding clothes and consuming hot drinks/food to match their comfort temperature to their normal environment, just like the people who participated in this study.

Acknowledgments

This work was fully supported by the National Planning and Development Secretariat of the Republic of Ecuador (SENPLADES) through the research project “Low energy buildings for Yachay”, which was carried out by the National Institute of Energy Efficiency and Renewable Energy of the Republic of Ecuador (INER).

Author Contributions

Andrés Lobato-Cordero and Massimo Palme conceived and designed the experiments; R. David Beltrán performed the experiments; Andrés Gallardo and Gabriel Gaona analyzed the data; Andrés Gallardo wrote the paper.

Conflicts of Interest

The authors declare no conflict of interest. The founding sponsors had no role in the design of the study; in the collection, analyses, or interpretation of data; in the writing of the manuscript, and in the decision to publish the results.

Nomenclature

T r m running mean temperature (°C)
T r m 1 running mean temperature for the previous day (°C)
T e d 1 daily mean external temperature for the previous day (°C)
α constant between 0 and 1. Recommended to use 0.8
T ¯ r mean radiant temperature (°C)
T N surface temperature of the Surface N (°C)
F p N angle or view factor between a person and the Surface N
T o p operative temperature (°C)
T a interior air temperature (°C)
T c o m f comfort temperature (°C)
G Griffiths’ slope
C N comfort vote for neutral
T o m mean outdoor temperature
N number of observations
S . E . standard error of mean
R c u a d correlation coefficient
p   v a l u e significance
S t d .   D e v standard deviation

Abbreviations

The following abbreviations are used in this manuscript:
PMVPredicted Mean Vote
AMVActual Mean Vote
ISOInternational Organization for Standardization
CENCommission for European Normalization
HVACHeating, Ventilating, and Air Conditioning
ASHRAEAmerican Society of Heating, Refrigerating, and Air-Conditioning Engineers
MRTMean radiant temperature
IDWInverse distance weighted interpolation

References

  1. Leaman, A.; Bordass, B. Productivity in buildings: The “killer” variables. Build. Res. Inf. 1999, 27, 4–19. [Google Scholar] [CrossRef]
  2. Wagner, A.; Gossauer, E.; Moosmann, C.; Gropp, T.; Leonhart, R. Thermal comfort and workplace occupant satisfaction-Results of field studies in German low energy office buildings. Energy Build. 2007, 39, 758–769. [Google Scholar] [CrossRef]
  3. Roaf, S.; Nicol, F.; Humphreys, M. Adaptive Thermal Comfort: Principles and Practice; Earthscan: London, UK, 2012. [Google Scholar]
  4. Fanger, P.O. Thermal Comfort. Analysis and Applications in Environmental Engineering; Danish Technology Press: Copenhagen, Danmark, 1970. [Google Scholar]
  5. ISO. ISO 7730: Ergonomics of the thermal environment—Analytical determination and interpretation of thermal comfort using calculation of the PMV and PPD indices and local thermal comfort criteria. Management 2005, 3, 605–615. [Google Scholar]
  6. ASHRAE Standard 55–2010 Thermal Environmental Conditions for Human Occupancy; American Society of Heating, Refrigerating and Air-Conditioning Engineers: Atlanta, GA, USA, 2010; p. 30.
  7. CEN Standard EN15251 Indoor Environmental Input Parameters for Design and Assessment of Energy Performance of Buildings: Addressing Indoor Air Quality, Thermal Environment, Lighting and Acoustics; Comité Européen de Normalisation: Brussels, Belqium, 2007.
  8. Yao, R.; Li, B.; Liu, J. A theoretical adaptive model of thermal comfort—Adaptive Predicted Mean Vote (aPMV). Build. Environ. 2009, 44, 2089–2096. [Google Scholar] [CrossRef]
  9. De Dear, R.J.; Brager, G.S. Thermal comfort in naturally ventilated buildings: Revisions to ASHRAE Standard 55. Energy Build. 2002, 34, 549–561. [Google Scholar] [CrossRef]
  10. Ricciardi, P.; Buratti, C. Thermal comfort in open plan offices in northern Italy: An adaptive approach. Build. Environ. 2012, 56, 314–320. [Google Scholar] [CrossRef]
  11. Nematchoua, M.K.; Tchinda, R.; Ricciardi, P.; Djongyang, N. A field study on thermal comfort in naturally-ventilated buildings located in the equatorial climatic region of Cameroon. Renew. Sustain. Energy Rev. 2014, 39, 381–393. [Google Scholar] [CrossRef]
  12. Dhaka, S.; Mathur, J.; Brager, G.; Honnekeri, A. Assessment of thermal environmental conditions and quantification of thermal adaptation in naturally ventilated buildings in composite climate of India. Build. Environ. 2015, 86, 17–28. [Google Scholar] [CrossRef]
  13. Deuble, M.P.; de Dear, R.J. Mixed-mode buildings: A double standard in occupants’ comfort expectations. Build. Environ. 2012, 54, 53–60. [Google Scholar] [CrossRef]
  14. De Dear, R.; Brager, G. Developing an adaptive model of thermal comfort and preference. ASHRAE Trans. 1998, 104, 1–18. [Google Scholar]
  15. Nicol, F.; Humphreys, M. Derivation of the adaptive equations for thermal comfort in free-running buildings in European standard EN15251. Build. Environ. 2010, 45, 11–17. [Google Scholar] [CrossRef]
  16. Fanger, P.O.; Toftum, J. Extension of the PMV model to non-air-conditioned buildings in warm climates. Energy Build. 2002, 34, 533–536. [Google Scholar] [CrossRef]
  17. Humphreys, M.A.; Rijal, H.B.; Nicol, J.F. Examining and developing the adaptive relation between climate and thermal comfort indoors. In Proceeding of the Conference Adapting Change New Thinking on Comfort Cumberland lodge, Windsor, UK, 9–11 April 2010.
  18. Peel, M.C.; Finlayson, B.L.; McMahon, T.A. Updated world map of the K ̈oppen-Geiger climate classification. Meteorol. Z. 2006, 15, 259–263. [Google Scholar]
  19. ISO. ISO 7726 Ergonomics of the thermal environment—Instruments for measuring physical quantities. ISO Stand. 1998, 1998, 1–56. [Google Scholar]
  20. Kuchen, E.; Fisch, M.N. Spot Monitoring: Thermal comfort evaluation in 25 office buildings in winter. Build. Environ. 2009, 44, 839–847. [Google Scholar] [CrossRef]
  21. Zhang, Y.; Wang, J.; Chen, H.; Zhang, J.; Meng, Q. Thermal comfort in naturally ventilated buildings in hot-humid area of China. Build. Environ. 2010, 45, 2562–2570. [Google Scholar] [CrossRef]
  22. Dedear, R.J.; Auliciems, A. Validation of the predicted mean vote model of thermal comfort in six Australian field studies. ASHRAE Trans. 1985, 91, 452–468. [Google Scholar]
  23. Fanger, P.O.; Toftum, J. Thermal comfort in the Future—Excellence and expectation. In Proceedings of the Moving Comfort Standards into the 21st Century, Cumberland Lodge, UK, 5–8 April 2001.
  24. Schiller, G.E. A comparison of measured and predicted comfort in office buildings. ASHRAE Trans. 1990, 96, 609–622. [Google Scholar]
  25. Luo, M.; Cao, B.; Damiens, J.; Lin, B.; Zhu, Y. Evaluating thermal comfort in mixed-mode buildings: A field study in a subtropical climate. Build. Environ. 2014, 88, 46–54. [Google Scholar] [CrossRef]
  26. Feriadi, H.; Wong, N.H. Thermal comfort for naturally ventilated houses in Indonesia. Energy Build. 2004, 36, 614–626. [Google Scholar] [CrossRef]
  27. Hwang, R.L.; Lin, T.P.; Kuo, N.J. Field experiments on thermal comfort in campus classrooms in Taiwan. Energy Build. 2006, 38, 53–62. [Google Scholar] [CrossRef]
  28. Corgnati, S.P.; Ansaldi, R.; Filippi, M. Thermal comfort in Italian classrooms under free running conditions during mid seasons: Assessment through objective and subjective approaches. Build. Environ. 2009, 44, 785–792. [Google Scholar] [CrossRef]
  29. Corgnati, S.P.; Filippi, M.; Viazzo, S. Perception of the thermal environment in high school and university classrooms: Subjective preferences and thermal comfort. Build. Environ. 2007, 42, 951–959. [Google Scholar] [CrossRef]
Figure 1. Quito climatic context (year 2015—information obtained from a weather station installed near the office building, see Section 2.3.1): (a) Outdoor temperature and solar radiation and (b) Outdoor temperature and precipitation.
Buildings 06 00027 g001
Figure 2. Plan of office and measurement points (1–8).
Buildings 06 00027 g002
Figure 3. Sensor locations in the office.
Buildings 06 00027 g003
Figure 4. Nicol graph: Combines the monthly outdoor temperatures in Quito with the temperature that is predicted to be comfortable indoors. The figure also includes the mean daily maximum of the outdoor air temperature, the mean daily minimum of the outdoor air temperature, and the mean daily solar radiation on the horizontal (year 2015—information obtained from a weather station installed near the office building, see Section 2.3.1).
Buildings 06 00027 g004
Figure 5. Spatial distribution of average indoor operative temperature (a) in the morning; (b) midday; and (c) afternoon.
Buildings 06 00027 g005
Figure 6. Histograms of indoor operative temperatures in the analyzed office: (a) indoor operative temperatures in the morning; (b) indoor operative temperatures in the midday; (c) indoor operative temperatures in the afternoon; (d) indoor operative temperatures during the experimental campaign.
Buildings 06 00027 g006
Figure 7. Histograms of thermal sensation votes on ASHRAE’S seven-point scale (AMV from surveys): (a) Thermal sensation votes in the morning; (b) thermal sensation votes in the midday; (c) thermal sensation votes in the afternoon; (d) thermal sensation votes during the experimental campaign.
Buildings 06 00027 g007
Figure 8. Scatter of comfort votes and indoor operative temperature.
Buildings 06 00027 g008
Figure 9. Error bars showing the variation of mean comfort vote with one degree “bins” of operative temperature. The circles are the mean comfort vote and the lines indicate the variation around them. There is no variation at 19 °C and 25 °C because there is only one comfort vote reported at those temperatures.
Buildings 06 00027 g009
Figure 10. Weighted linear regressions of thermal sensation votes (PMV and AMV) vs. operative temperature (the regression model was weighted by the number of votes falling into 0.2 degree “bins” of operative temperature on the x-axis).
Buildings 06 00027 g010
Figure 11. Variation of comfort or neutral temperature with the mean operative temperature. Recorded operative temperatures were grouped in bins of 0.2 °C. The neutral temperatures were obtained from the Griffiths’ equation, using a Griffiths’ constant of 0.5. The binned operative temperatures and their corresponding comfort votes from surveys were used to calculate the neutral temperatures.
Buildings 06 00027 g011
Figure 12. Acceptable operative temperature ranges from the adaptive comfort model included in CEN Standard EN15251. The colored dots represent indoor operative temperatures registered during office hours (morning: 8:00–10:00 a.m.; midday: 12:00–2:00 p.m.; afternoon: 4:00–5:00 p.m.).
Buildings 06 00027 g012
Figure 13. Plot of operative temperature against time of day.
Buildings 06 00027 g013
Table 1. Construction materials of the selected office.
Type of WallsType of WindowsFloorCeiling
Concrete blocks with cement/plaster/mortar as external and internal coveringAluminum single glassConcrete with ceramic coatingGypsum board
Table 2. Monitoring parameters and specification of monitoring equipment.
ParameterMonitoring InstrumentValid RangeAccuracy
Outdoor temperatureWeather station(−40 to 65 °C)(±0.5 °C)
Indoor air temperatureThermocouple type K0–260 °C(±0.5 °C)
Surface temperatureThermocouple type K0–260 °C(±0.5 °C)
Relative humidity (RH)Relative humidity sensor0 to 100%(±3%)
Air velocityPortable anemometer0.05 to 1 m/s(±0.02 m/s)
Table 3. Design strategies for the clime in Quito-Ecuador.
StrategyMeasures
Passive solar heatingFace most of the glass area in the east and west façade (receives solar radiation all year round for passive solar heating in the morning and in the afternoon)
Use high mass interior surfaces to store passive heat
Unshaded windows for passive solar gain (little danger of overheating)
Do not plant trees or vegetation in front of passive solar windows
Minimize heat lossesKeep home tight and well insulated to retain heat gains from lights, people, and equipment
Install insulating blinds, heavy draperies, or operable window shutters to reduce night heat losses
Carefully seal building to minimize infiltration and eliminate drafts (house wrap, weather stripping, tight windows)
Minimize conductive heat loss through glazing (minimize U-factor)
Use low mass, tightly sealed, and well insulated construction to provide rapid heat buildup in morning
Table 4. Descriptive statistics for the analyzed office.
VariableNMinimumMaximumMeanStd. Deviation
Indoor operative temperature °C44119.524.622.11.0
Relative humidity %44123%52%37%6%
Metabolic rate (met)4410.91.71.10.1
Clothing insulation (clo)4410.61.10.90.2
Outdoor running mean temperature °C (α = 0.8)7615.117.516.60.6
Actual mean vote (AMV)441−3.02.0−0.10.8
Predicted mean vote (PMV)441−1.70.7−0.50.5
Table 5. Regression analysis of thermal comfort votes.
Thermal Comfort VoteRegression EquationNS.E.R2p Value
Actual mean voteAMV = −1.712 + 0.074 Top250.03516.1%0.047
Predicted mean votePMV = −5.562 + 0.231 Top250.02084.7%0.000
N—number of observations, S.E.—standard error of mean, R2—coefficient of determination, p value—significance
Table 6. Indoor operative temperature and comfort temperatures calculated using the Griffiths’ method.
Time of DayVariableNMinimumMaximumMeanStd. Dev.
MorningComfort temperature with Griffiths’ constant 0.5 (°C)16216.627.521.41.9
Indoor operative temperature (°C)16219.522.221.00.5
MiddayComfort temperature with Griffiths’ constant 0.5 (°C)14518.428.322.61.8
Indoor operative temperature (°C)14521.123.522.40.5
AfternoonComfort temperature with Griffiths’ constant 0.5 (°C)13418.129.122.81.6
Indoor operative temperature (°C)13421.624.622.90.6
All periodsComfort temperature with Griffiths’ constant 0.5 (°C)44116.629.122.21.9
Indoor operative temperature (°C)44119.524.622.11.0

