Article

Perceived Thermal Discomfort and Stress Behaviours Affecting Students’ Learning in Lecture Theatres in the Humid Tropics

by
Tamaraukuro Tammy Amasuomo
1 and
Japo Oweikeye Amasuomo
2,*
1
School of Architecture and Design, Victoria University of Wellington, Wellington 6140, New Zealand
2
Department of Vocational and Technology Education, Niger Delta University, Wilberforce Island, Amassoma, P.O. Box 1237 Yenagoa, Bayelsa State, Nigeria
*
Author to whom correspondence should be addressed.
Buildings 2016, 6(2), 18; https://doi.org/10.3390/buildings6020018
Submission received: 15 February 2016 / Revised: 1 April 2016 / Accepted: 21 April 2016 / Published: 28 April 2016

Abstract

:
The study investigated the relationship between students’ perceived thermal discomfort and stress behaviours affecting their learning in lecture theatres in the humid tropics. Two lecture theatres, LTH-2 and 3, at the Niger Delta University, Nigeria, were used for the study. Two groups of students from the Faculties of Agriculture and Engineering and the Department of Technology Education constituted the population. The sample size selected through random sampling for Groups A and B was 210 and 370 students, respectively. Objective and self-report instruments were used for data collection. The objective instrument involved physical measurement of the two lecture theatres and of the indoor temperature, relative humidity and air movement. The self-report instrument was a questionnaire that asked for the students perceived indoor thermal discomfort levels and the effect of indoor thermal comfort level on perceived stress behaviours affecting their learning. The objective indoor environmental data indicated thermal discomfort with an average temperature of 29–32 °C and relative humidity of 78% exceeding the ASHARE [1] and Olgyay [2].The students’ experienced a considerable level of thermal discomfort and also perceived that stress behaviours due to thermal discomfort affected their learning. Further, there were no significant differences in the perceived thermal discomfort levels of the two groups of students in LTH-2 and 3. Furthermore, stress behaviours affecting learning as perceived by the two groups of students did not differ significantly. In addition, no correlation existed between the perceived indoor thermal discomfort levels and stress behaviour levels affecting learning for students in LTH-2, because the arousal level of the students in the thermal environment was likely higher than the arousal level for optimal performance [3,4]. However, a correlation existed in the case of students in LTH-3, which was expected because it only confirmed the widely-accepted view that stress behaviours exhibited by students in any learning can have a profound effect on learning. It was recommended that teaching-learning indoor environment should be thermally comfortable by providing adequate window openings with proper orientation and also by ensuring that the learning space only accommodated the required student capacity to reduce the stress behaviours that affect learning.

1. Introduction

In the humid tropics, the teaching-learning environment is often faced with the problem of reducing heat gain in the building space. This is as a result of the fact that the building space is always warm due to high temperature, relative humidity and low air movement. The inability of the building space to keep out heat usually leads to occupants’ feeling of thermal discomfort. Thermal discomfort can also induce various stress behaviours that can affect the learning of occupants in any teaching-learning indoor space.
Though there are various definitions of thermal comfort, ASHRAE, ANSI/ASHRAE Standard 55 [1] defined thermal comfort as being that condition of mind that expresses satisfaction with the thermal environment. It is a state in which a person will judge the environment to be neither too warm nor too cold or thermally neutral, and in this condition, the strain on the body’s thermoregulatory mechanism is minimal. That is, a neutral point defined by the absence of any feeling of discomfort [3]. Givoni [5] defined thermal comfort as the absence of irritations and discomfort due to heat or cold, or in a positive sense, as a state involving pleasantness. Further, Dagostino [6] defined thermal comfort as being able to carry on any desired activity without being either chilly or too hot. Though these definitions are universally agreed upon by researchers, they are also not easily converted into a physical parameter [7] because human perceptions about the environment differ between individuals.
Various models, such as the predictive mean votes (PMV-model), actual mean votes (AMV-model) and the adaptive thermal comfort (ATC-model), have been developed to predict thermal comfort in an environment. Fanger [8] developed the PMV model and defined PMV as the index that predicts the mean thermal sensation vote on a standard scale for large group of persons for a given combination of the thermal environmental variables, activities and clothing levels. The model is expressed on the seven-point ASHRAE scale of thermal sensation. The central three categories of this scale are labelled “slightly cool”, “neutral” and “slightly warm”, which is within the acceptable sensation level [9]. The upper two categories of cool and cold and the lower categories of warm and hot are discomfort indications of cold and hot sensation, respectively. The PMV model includes all of the major variables influencing thermal sensation and quantifies the absolute and relative impact of six factors, of which air temperature, mean radiant temperature, air velocity and relative humidity are measured and activity level and clothing insulation are estimated with the use of tables [9].
However, other researchers have compared the outcome of the PMV model to AMV, which indicates the actual thermal sensation of subjects. The results of the AMV have shown some differences as much as 1.3 ASHRAE-scale for climate chamber studies [10]. The ATC-model predicts that contextual factors and past thermal history modifies the occupant’s thermal expectations and preferences. Thus, people in warm climate zone would prefer higher indoor temperatures than people living in cold climate zones, which contrast with the assumptions underlying comfort standards based on the PMV-model [11]. Adaptation thermal comfort is therefore defined as the gradual lessening of human response to repeated environmental stimulations and can be both behavioural (clothing, windows, ventilators), physiological (acclimatization), as well as psychological (expectations) [11,12,13]. These models are all developed in order to evaluate the thermal comfort or heat sensation levels of individual in an environmental space. They can also be applied in the humid tropics, as well.
Learning according to the Merriam-Webster Dictionary [14] is an activity or process of gaining knowledge or skill by studying, practicing, being taught or experiencing something. Most activities of learning in a school environment take place within building enclosures. These learning activities can take place better when the environmental conditions are favourable. Inside a building, people are affected either positively or negatively because of the physiological reactions and psychological responses to the thermal environment [15].In the same vein, the activities in a lecture theatre are primarily to accommodate small and large groups of learners and the teacher for the purpose of the teaching and learning. Therefore, such room spaces are also expected to provide an environment with relative thermal comfort for the learners to benefit from the lecture room activities. In this regard, Hussein and Rahman [16] opined that, since the learning environment is a place where learners and educators congregate for extended periods of time to participate in the activity of learning, the environment created during this activity is regarded as an important component in the teaching and learning process. Thus, the sole reason a building is constructed for human habitation is to provide a comfortable and healthy place for people to work [17]. The learning lecture theatre should also be seen to provide such an environment.
The thermal comfort condition of a teaching-learning environment therefore depends on the perception of individuals on whether the indoors has relative thermal comfort or not for the type of classroom activities. Previous studies have also corroborated the fact that the classroom environment is a determinant of students’ outcomes [18]. Thus, thermal comfort affects productivity and learning. Students’ achievement is also higher in those environments that students find to be relatively comfortable [19]. Tom [17] also reported that studies on school classrooms show similar links between thermal comfort and student learning, although perhaps at temperatures somewhat lower than those that are optimal for office workers. Many studies have also analysed the elements of comfortable environments to improve educational environments under the expectation that comfortable learning classrooms would enhance the performance of the students studying in those environments [20,21,22,23,24]. However, it is not in all cases that individuals perform better in a thermally-comfortable indoor environment. That is, even when students perceived that the indoor thermal comfort level has increased, their learning task performance may still decrease. This finding is inconsistent with previous results that showed that a comfortable learning environment had a positive impact on students’ task performance [17]. The answer given was that the arousal level of each participant was higher than the arousal level for optimal performance [4].
Further, in the teaching-learning environment, students’ perception of thermal comfort is affected by air temperature, air movement or velocity and humidity in the classroom, as well as the clothing they wore to the lecture, the amount of physical work activity done, the mean radiant temperature, the radiant temperature of the walls, floor, windows, etc. Adunola and Ajibola [25] also reported that, in an indoor space, the thermal environment is constituted by the interaction of different factors of the climatic conditions, and the interaction of these conditions within the building spaces provides an indication of the level of indoor thermal comfort. Many researchers according to Hussein and Rahman [16] and Wafi and Ismail [26] also indicated that thermal comfort does affect its occupancy.
Further, environmental factors, such as climatic conditions, crowding and inadequate and inappropriate location of openings can affect thermal comfort. Three main climatic conditions, namely temperature, relative humidity and air movement, as well as heat production and regulation in the human body, cold and hot surfaces and air stratification [3,27] can cause thermal or cold sensation in the individual’s body when the organ of touch is stimulated as the body is exposed to the medium that causes heat or cold. Temperatures at high levels beyond an individual’s tolerable limit can aggravate body heat, which may lead to muscular weakness, dizziness, as well as mental and physical fatigue [28,29]. In addition, high relative humidity combined with high temperature may also reduce the frequency of evaporation of vapour liberated through perspiring occupants carrying out various human activities. Discomfort is therefore experienced because of the inability of the occupants to dissipate metabolic moisture [30]. At high humidity, the undesirable side effects are dampness or wettedness sensation and sometimes difficulty in breathing [3]. Further, air movement causes the feeling of freshness and the comfort of individuals, but low wind movement causes inadequate ventilation. Air movement plays an important role in increasing the rate of evaporation, especially at high humidity, where evaporative cooling is the main source of heat loss from the body [3]. Wind therefore reduces the adverse effects of thermal discomfort resulting from high temperature and humidity. If the air is calm, the air layer close to the body becomes saturated, and little evaporation will take place. However, where there is considerable air flow, the constant replenishment of air around the body ensures that the evaporation process is maintained [31]. Therefore, the availability of fresh air in a room space will help to supply an adequate level of oxygen for breathing, to dilute odours arising from bodies and to dilute air vitiated with bacteria [3]. Where the three purposes of air are not met, people will feel thermal discomfort.
Crowding refers to the way we feel when there are too many people or not having enough space [32]. Crowding occurs in a space for teaching-learning when it accommodates far more students than the requisite capacity. In a crowded room space without adequate ventilation, people give off carbon-dioxide, water vapour, dead skin cells and unpleasant odours. The observable thermal discomfort stresses in a crowded space are restlessness, inattentiveness and sometimes respiratory irritation, such as coughing and sneezing. In this regard, overcrowding can cause arousal conditions that can stimulate skin conductance, leading to palmar sweat [32,33].
Inadequate and inappropriate location of openings in the external walls of buildings is another source of thermal discomfort. Window and door openings when adequate and appropriately located along the external walls of buildings provide ventilation into the room space. Ventilation is a determinant of thermal comfort and generally gives satisfaction within the indoor environment. The main purpose of ventilation is to provide fresh air to cool the body, to remove accumulated noxious gases and contaminants and to remove heat generated in a working area by convection. The benefits of windows are also to allow the passage of air through the envelope as ventilation and exhaust for removing the polluted air. Therefore, airflow through a building should not be hindered as much as possible [34]. In the humid tropics characterized by high temperature and relative humidity with low wind velocity, one strategy for buildings in providing relatively satisfactory indoor space is the use of natural ventilation to enhance evaporative and convective cooling of occupants. However, there are no absolute standards of thermal comfort, as people have adjusted to live in various environments with varying conditions.
The literature has established that thermal discomfort affects learning. However, for thermal discomfort to affect learning, students must exhibit some stress behaviours that are physiological in nature. Stress is the reaction of individuals to any external stimulus that impinges and threatens their well-being. When individuals are unable to withstand the effect of thermal discomfort, they exhibit stress behaviours [32]. Physiological stress according to Markus and Morris [3] is caused when the organs of the body, its chemical processes and the functions of its physiological mechanisms, such as the nervous, muscular, circulatory and breathing systems, are affected when there is a deviation from the narrow optimal temperature range where the organs of the body are expected to operate optimally. When the effects of environmental conditions on an individual’s body are beyond the acceptable threshold of either too high or too low, it creates environmental discomfort. Prolonged exposure to environmental discomfort conditions where the zone of optimum is exceeded creates physiological stress. The evidence of physiological stress is fatigue, restlessness, boredom, inattentiveness and a decreased level of vigilance, and that physiological stress depresses arousal [3,32]. A depressed arousal level also depresses performance. These stress behaviours to a large extent affect learning in a school environment.
However, the judgement of whether an individual feels thermally comfortable or not varies from one individual to another just as the effect of climatic indicators on individual’s thermal comfort varies. Furthermore, no two individuals in the same teaching-learning space will have the same feeling of thermal comfort, even when they are exposed to the same indoor environmental conditions. This is due to variations in age, state of health, physical activities, type and amount of clothing, the physique of the individual and the degree of acclimatization [33,35]. The degree to which thermal discomfort affects the individuals’ stress behaviours also varies according to the intensity and ability of the individual to withstand such stresses. Thus, it is difficult to establish a condition that will satisfy everyone because of human physiological variance. Rather, the internal environment should create conditions that can satisfy the largest number in the group of probable occupants. That is, the building should modify the natural or external environment to produce a satisfactory internal environment for human activities for the majority of the users [36]. Where the thermal comfort of an individual is affected, the health, energy and comfort, as well as the physical and mental vigour of the individual is also affected [30,34].
The likely effect of indoor thermal environment on students’ thermal comfort and stress behaviours of students that affect learning in lecture theatres in the humid tropical climate are very important because a thermal discomfort environment will not actively stimulate human development socially, intellectually, physically and emotionally. Thus, it is expected that the learning-teaching environment should be able to actively and attractively suit the functions of the education it serves, which will not only accommodate, but contribute to a very special environment for teaching and learning [37].
The PMV, AMV and ATC models are the basis for determining whether an individual perceives thermal comfort or discomfort in any indoor environment. However, this study is based on the fact that in the humid tropics characterized by high temperature, relative humidity and low wind velocity, the perception of the majority of people is that there is always thermal discomfort in the indoor environment [38,39,40]. From the foregoing, the objective of this study is therefore to establish whether the perceived reactions of individuals to strains on their body’s thermoregulatory mechanism in any indoor thermal environment will lead to the feeling of heat sensation, sweat liberation, slow sweat evaporation, wettedness, low indoor air-movement and the slow cooling effect of indoor breeze vis-à-vis thermal discomfort. In addition, the study is also concerned with whether the perceived thermal discomfort in any indoor space will lead to stress behaviours, such as concentration (mental fatigue), tiredness (physical fatigue), vigilance, restlessness, attentive and irritation levels that will affect learning.

2. Methodology

2.1. Study Area

The Niger Delta University, Wilberforce Island, Amassoma, Bayelsa State, Nigeria, located in the Tropical Humid Climate between latitude 4.5 north and longitude 6.07 east [41] was used for the study. Two main seasonal patterns were noticed, namely dry season, from late November to March, and wet season, extending from March to November. The wet season was dominated by the south-westerly winds, which cause dampness all over the place, while the dry season was dominated by the north-easterly winds, called the Harmattan winds, which originate in the Sahara Desert with a dehydrating influence. The climate in this area was characterized by high temperature, high relative humidity and rainfall [42].
The relative humidity was between 78% and 89% with the highest of 89% occurring in July, while the lowest of 78% occurred in August. Mean annual rainfall ranges from 2500 to over 4000 mm. Temperatures were generally high in the region and fairly constant throughout the year, with average monthly minimum and maximum temperatures varying from 28–33 °C and 21–23 °C, respectively. The winds in this area were generally of medium strength, and the highest was experienced in the months of April, July and August; the lowest occurred in October and November. The wind velocity varies from 1.5–3.3 m/s, blowing primarily from southwest during the rainy season and northeast during the dry season around December [43].

2.2. Choice of Buildings

Three lecture theatres (LTH-1, LTH-2 and LTH-3) of the same design as shown in Figure 1 and Figure 2 were chosen for the study. These buildings accommodate large classes for groups of students from various disciplines offering common courses. However, LTH-2 and LTH-3 was used for the study because LTH-1 is presently used for other purposes.

2.3. Population of the Study and Sampling

The population was comprised of two groups of students who were in the 100 Level. Group A had a combined population of 307 students from the Faculty of Agriculture and Department of Technology Education taking chemistry classes in LTH-2. Group B with 519 students had a combined population from the Faculty of Engineering and Department of Technology Education taking Mathematics in the LTH-3. The classes in these lecture theatres take place on different days. The two groups of students were used in order to have a wider representation of opinions of the students on their perception of the question items in the questionnaire used for data collection. The sample size for Group A was 210 students, and Group B was 370 students, representing 68.40% and 71.30%, respectively, of the two populations.

2.4. Instrument for Data Collection

The objective and self-report instruments were used for data collection. The objective data involved physical measurements of the lecture theatres and taking readings of indoor air temperature, relative humidity and air movement. The self-report data were the questionnaire seeking the perception of the students on various assessed items.
The objective data included the reproduction of the plans and the cross-section of the lecture theatres (Figure 1 and Figure 2). It had a floor area of 290 m2 measuring 22.73 m long and 13.50 m wide with a seating capacity for 325 students. The floor was racked and slopes from the back-row seats to the front row seats. The floor-ceiling height at the back was 3.00 m and 4.50 m at the front. There were eight windows measuring 1.20 m wide and 2.40 m high. Each window was divided into two equal parts longitudinally. The upper part of the window measuring 1.20 m wide and 1.20 m high had a glazed fixed light, while the lower part of the same dimension, had two sliding shutters used for ventilation. The area of the external wall of each lecture theatre was 265 m2. Apart from the windows for ventilation, the space was also mechanically ventilated by 14 pieces of ceiling fans that had three blades. These fans were not effectively utilized because of the epileptic electricity supply situation and lack of maintenance. In addition, the readings of the indoor temperature, relative humidity and air movement (wind velocity) was taken 5 consecutive times for five weeks in September 2015 whenever any of the groups were holding lectures. Two sets of measurements were taken: one at the back where the floor ceiling height was 3.00 m and the other at the front where the floor ceiling height was 4.50 m. The measurements were taken at a 1.20 m height from the floor. The indoor air temperature readings were taken with the dry and wet bulb mercury thermometer. The relative humidity was measurement with the hygrometer, which consisted of a dry and wet bulb. The dry and wet bulb readings were read off on a humidity table [44] in order to get the relative humidities. In measuring the wind velocity, the AVM-305 Anemometer manufactured by TES Electrical Electronic Corp. of China with an accuracy level of ±0.3 was used for the measurement.
The self-report data collection was two questionnaires designed by the researchers. This method was most appropriate because it can be used to measure moods, thoughts, attitudes and behaviour by asking the subjects how they feel, what they think, etc. [32]. The first questionnaire was the students’ perceived thermal discomfort questionnaire (SPTDQ). It tried to seek the perception of students on the thermal discomfort condition of the lecture theatres. The second was the students’ perceived stress behaviour questionnaire (SPSBQ). It sought the perception of students on the stress behaviours affecting learning in the lecture theatres. The response options for the two questionnaires were very high extent (VHE), high extent (HE), moderate extent (ME) and low extent (LE) and were also rated 4, 3, 2 and 1, respectively, on a 4-point thermal environment scale. The questionnaires were administered to the students during lectures by the course teacher. Since the submission of the completed questionnaire formed part of attendance, there was 100% retrieval of the administered questionnaires.

2.5. Reliability of the Instrument

The reliability of the self-report instrument for data collection was tested by using the 30 Teacher Education students in 200 Level having Educational Research Method and Statistics classes in LTH-2 who were not part of the study. The results of the internal consistency test for SPTDQ and SPSBQ using the Cronbach alpha coefficient test was 0.75 and 0.86, respectively, indicating that the two instruments were reliable.

2.6. Data Analysis

The objective data were analysed by comparing the measurements taken in the indoor spaces of LTH-2 and LTH-3 with required thermal comfort standards in order to establish whether the indoor space provided thermal comfort. Any measured item that does not meet the requirements for thermal comfort was high thermal discomfort and assigned −1. Conversely, any measured item that met the requirements for thermal comfort was low thermal discomfort and assigned +1. If the grand total of all of the assessed thermal comfort indices was positive, then the indoor space indicated low thermal discomfort, while a negative grand total indicated high thermal discomfort.
The self-report data were analysed using arithmetic mean, Z-test and the Pearson product moment correlation coefficient (r). In the mean perception scores categories using a 4-point scale, the decision rule was: 3.50–4.00, very high extent; 3.00–3.49, high extent; 2.50–2.99, moderate extent; and 1.00–2.49, low extents. In the case of the Z-test, any Z-calculated greater than Z-critical at 0.05 degrees of freedom indicated that a significant difference existed between the two groups of students on the perceived thermal discomfort in the two lecture theatres. However, where the calculated Z-value was less than Z-critical, a significant difference did not exist between the two groups of students. In the correlation category, r-calculated greater than r-critical indicated that a correlation existed between the perceived students’ thermal discomfort and the perceived stress behaviours affecting students’ learning in the lecture theatres. However, if the r-calculated was less than the r-critical, then a correlation did not exist.

3. Results

3.1. Results of Measurements of the Existing Indoor Thermal Environment of the Lectures

The results in Table 1 revealed that the student capacity of 307 in LTH-2 was more than the recommended seating capacity of 290 m2/263 students for a 1.10-m2 floor area/student ratio [45,46]. This was an indication that room space was overcrowded. However, the 1150-m3 room volume met the required minimum of the 3.50 m3/occupant ratio [47] while the existing room volume/307 student was 3.75 m3/occupant ratio. Further, the doors and windows coverage area of 28 m2 representing 11% of the total external wall area was far below the recommended value of 40%–80% (103–206 m2) for external wall openings [42]. The heat and vapour input of 42,980 watts/307 students/h and 61.40 kg/307 students/h was greater than the required minimum values 36,820 watts/263 students/h and 52.60 kg/263 students/h, respectively [47].
In addition, the area of doors and window openings of 28 m2 representing 11% of the total external wall area was far below the recommended external wall openings of 40%–80% (103–206 m2) [42]. Furthermore, the average minimum and maximum indoor air temperature of 29 and 32 °C with an average relative humidity reading of 78% for the two lecture theatres was above the recommended thermal comfort limits of 22–27 °C for relative humidities between 70%–100 % [1,2,42,48]. The total thermal discomfort score of −7 revealed that there was a high level of thermal discomfort in the indoor space of LTH-2. This meant that the LTH-2 space did not provide the required thermal comfort.
The results in Table 2 also revealed that the existing student capacity of 519 in LTH-3 was more than the recommended seating capacity of 290 m2/263 students (1.10 m2 floor area/student ratio), indicating an overcrowded lecture theatre [45,46]. The lecture theatre space was also overcrowded with the existing volume/student of 1150 m3/519 students (2.21 m3 /student ratio). In the same vein, the heat and vapour input of 72,660 watts/519 students/h and 103.80 kg/519 students/h student was also more than the recommended minimum values of 36,820 watts/263 students/h and 52.60 kg/263 students/h, respectively. However, the results of the external walls covered by doors and windows, as well as the average minimum and maximum indoor air temperature and the indoor wind velocity were the same as LTH-2. The total thermal discomfort score of −8 showed a thermal discomfort level in the existing indoor environment in of LTH-3. Therefore, the LTH-3 space did not provide the required thermal comfort.

3.2. Students’ Perceived Thermal Discomfort Levels in the Lecture Theatres

The results of the students’ perceived thermal discomfort levels from the effect of indoor environmental conditions in LTH-2 as shown in Figure 3 and Table A1 had a grand mean perception score of 3.31. The students therefore perceived the thermal discomfort level in the room space to a high extent as a result of the indoor environmental thermal conditions (seating capacity, heat and vapour input, temperature, relative humidity and air movement).
In addition, the results of the perceived students’ thermal discomfort level in LTH-3 had a grand mean perception score of 3.39, as shown in Figure 4 and presented in Table A1. This result also indicated that the students perceived the thermal discomfort level in the indoor environment to a high extent.

3.3. Test of the Significant Difference in Mean Students’ Perceived Thermal Discomfort Scores in LTH-2 and LTH-3

From the results in Table 3, the Z-calculated of 1.14 was less than the Z-critical of 1.65. At a probability level of p ≤ 0.05, a significant difference did not exist between the students in LTH-2 and the students in LTH-3 in their perception of thermal discomfort levels. That is, they all perceived the indoor thermal discomfort conditions as almost the same.

3.4. Students’ Perceived Stress Behaviour Levels Affecting Their Learning in the Lecture Theatres

The results on students’ perceived stress behaviours affecting learning in LTH-2 as presented in Figure 5 and Table A2 had a grand mean perception score of 3.13. The students therefore perceived the stress behaviour levels affecting students’ learning in LTH-2 to a high extent.
Further, the results of the students’ perceived stress behaviours affecting students’ learning in LTH-3 as indicated in Figure 6 and Table A2 had a grand mean perception score of 2.91.This result also revealed that the students’ perception of stress behaviour levels affecting their learning in the lecture theatre was to a moderate extent.

3.5. Test of the Significant Difference in Mean Students’ Perceived Stress Behaviour Scores Affecting Learning in LTH-2 and LTH-3

The results in Table 4 revealed that the Z-calculated of 0.42 was less than the Z-critical of 1.65. Therefore, at p ≤ 0.05, a significant difference did not exist in the mean students’ perceived stress behaviour levels affecting learning for the two groups of students in LTH-2 and LTH-3, respectively.

3.6. Test of the Correlation between Students’ Perceived Thermal Discomfort Levels and Students’ Perceived Stress Behaviour Levels Affecting Learning in LTH-2

The Pearson product moment correlation test results in Table 5 for students in LTH-2 showed an r-calculated of 0.738 less than r-critical of 0.811. This indicated that a significant correlation did not exist between the mean students’ perceived indoor thermal discomfort levels and the mean students’ perceived stress behaviour levels affecting learning at p ≤ 0.05. Therefore, the environmental conditions that brought about students’ perceived indoor thermal discomfort in LTH-2 did not significantly affect their stress behaviour (concentration, tiredness (mental and physical fatigue), vigilance, restlessness, attentiveness and irritation) levels affecting learning in the lecture theatre.
In the case of students in LTH-3, the results in Table 6 revealed that r-calculated of 0.833 was greater than r-critical of 0.811, indicating that a significant correlation existed between the mean students’ perceived indoor thermal discomfort levels and the students’ perceived stress behaviour levels affecting their learning. Thus, the students in LTH-3 perceived that the environmental conditions that brought about indoor thermal discomfort significantly affected the stress behaviours (concentration, tiredness (mental and physical fatigue), vigilance, restlessness, attentiveness and irritation) levels affecting their learning.

4. Discussions

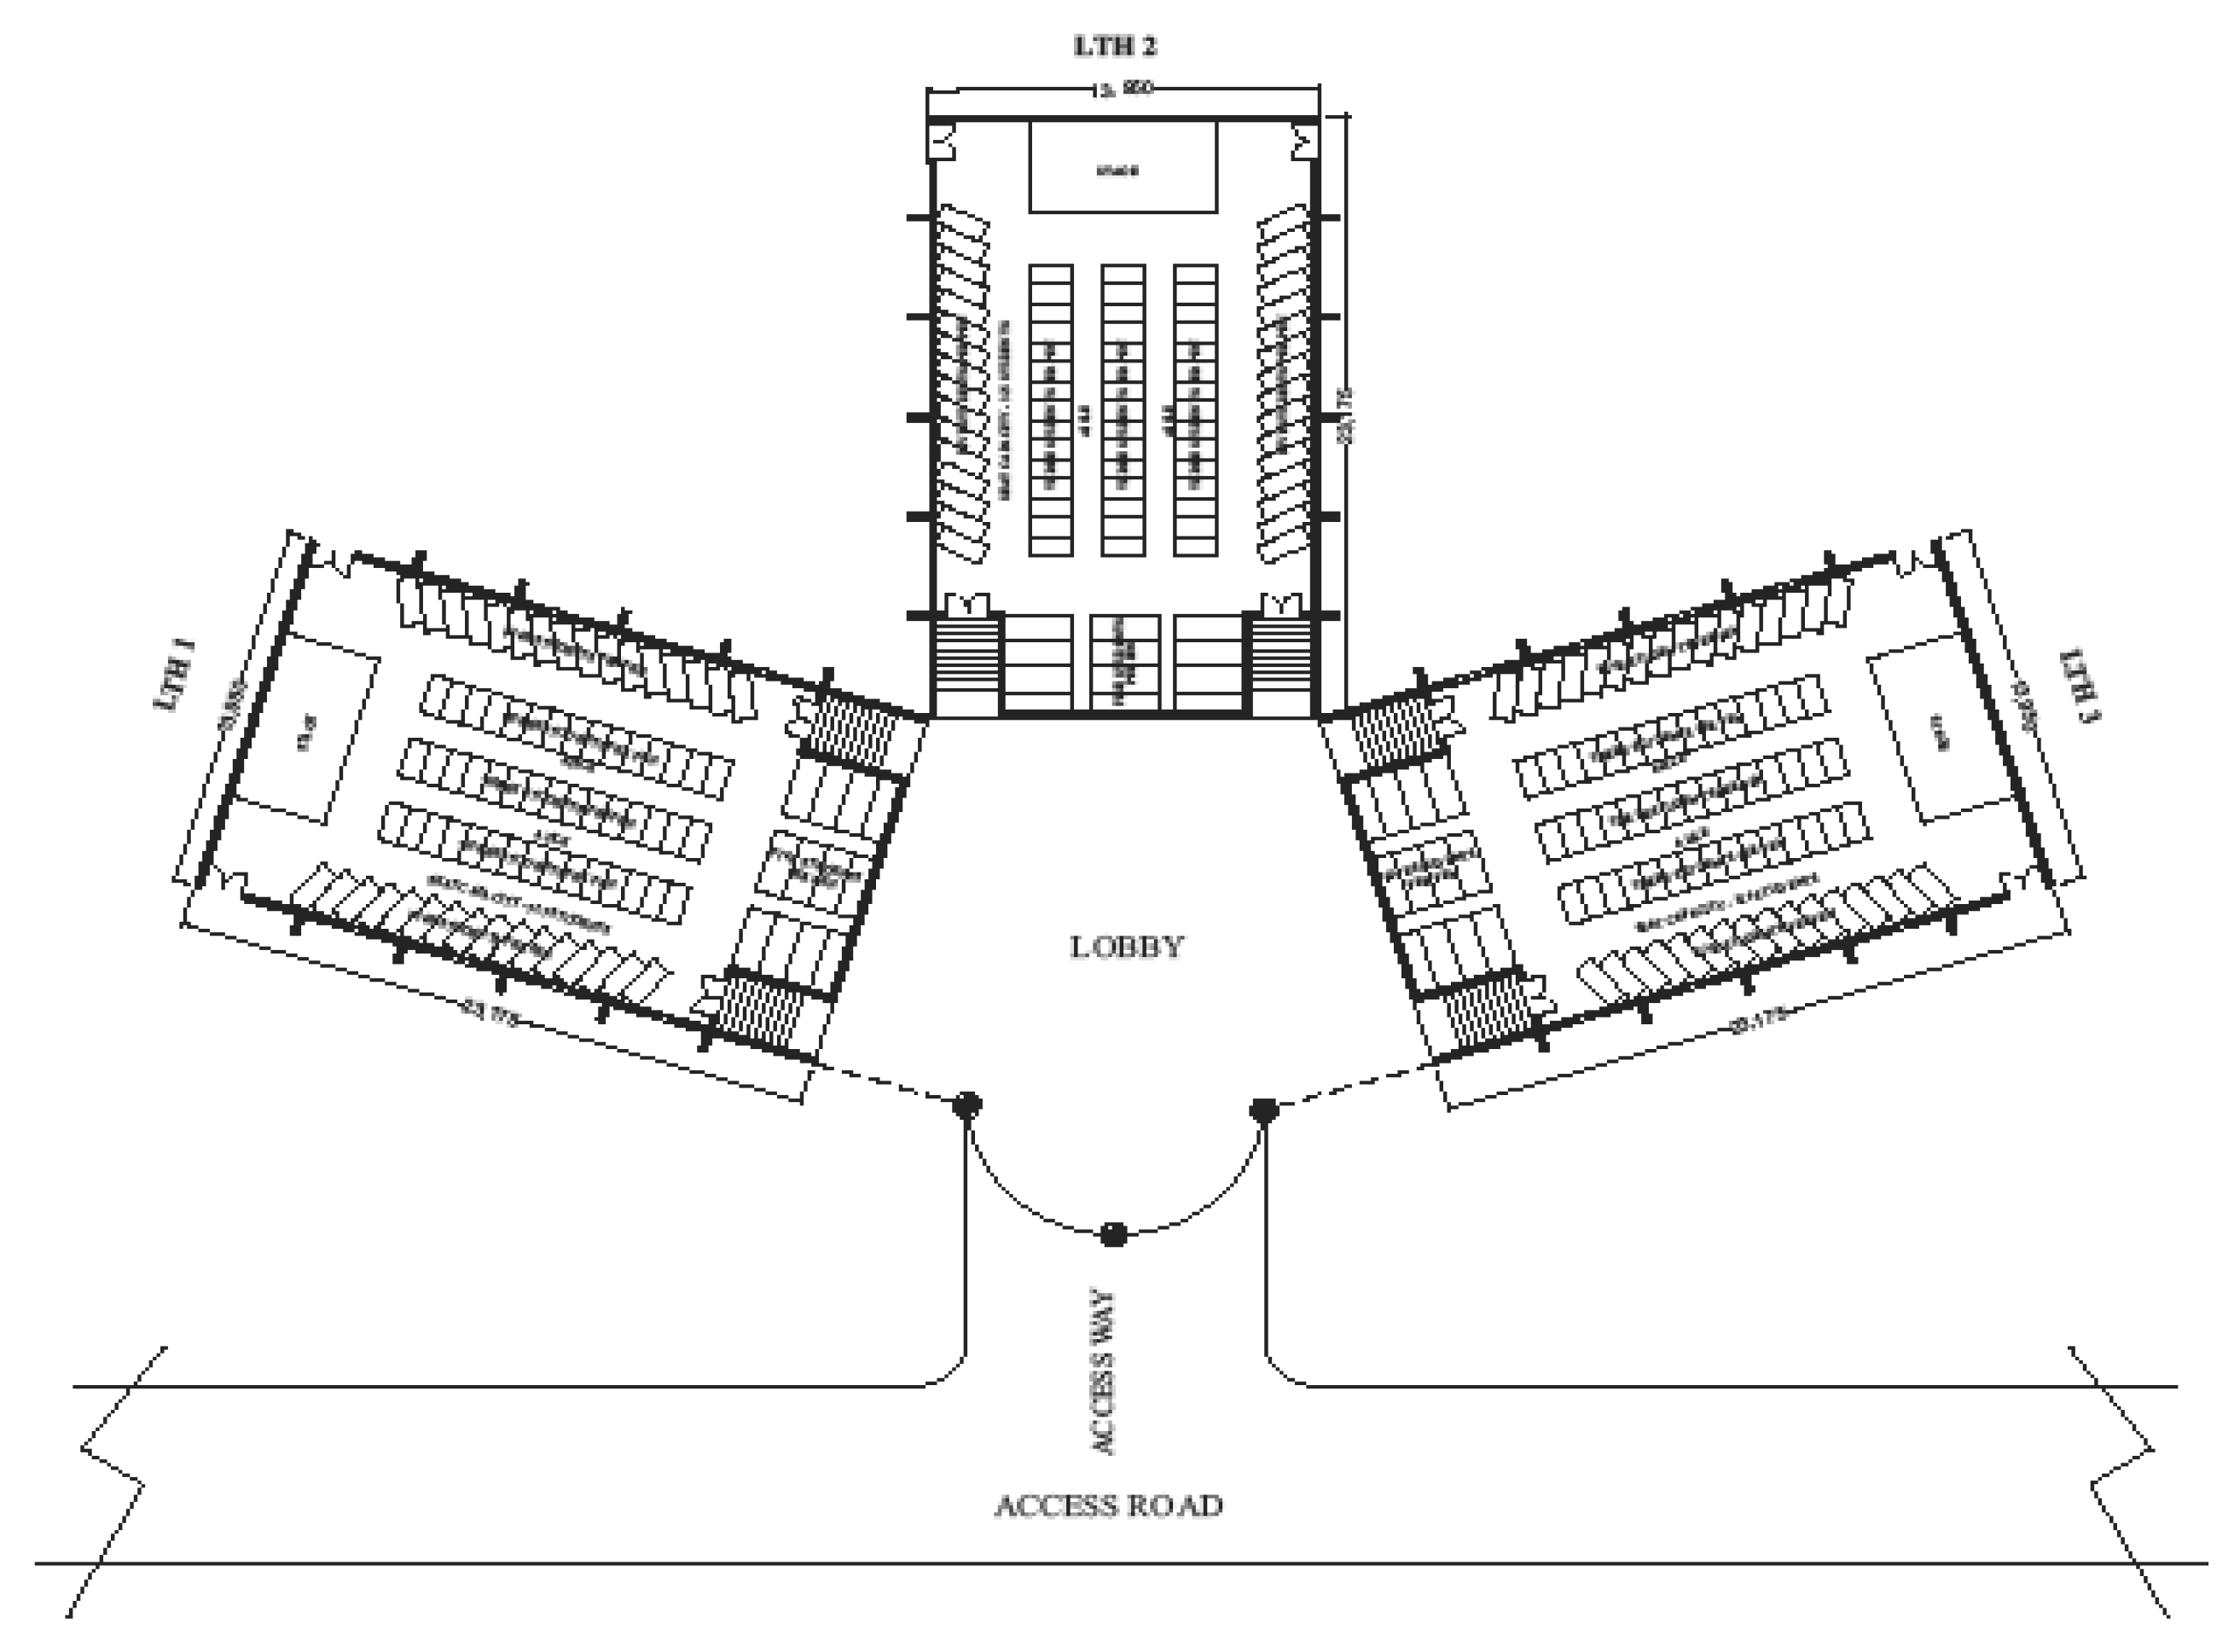
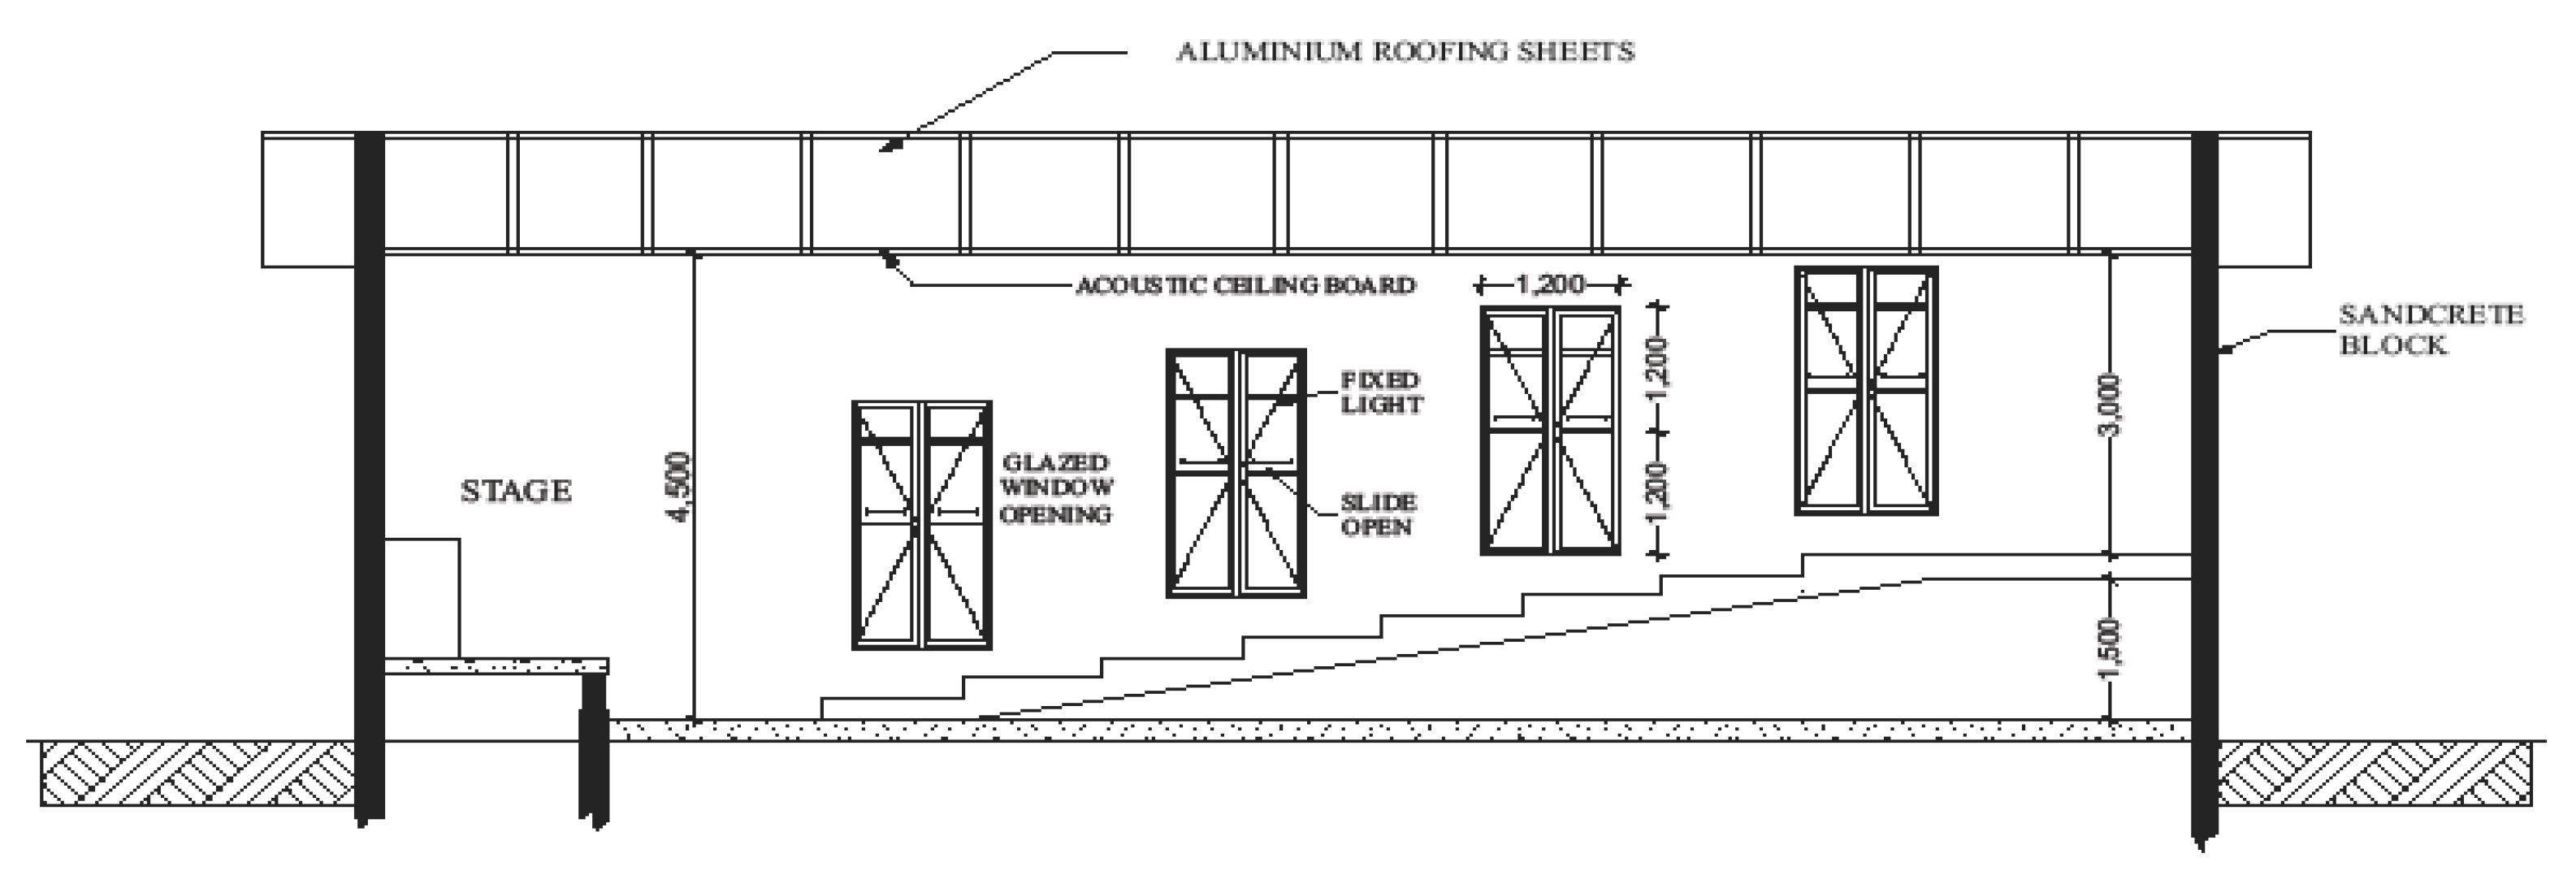
The findings of the study revealed that the lecture theatres were overcrowded at full capacity; the door and window openings where inadequate; the heat and vapour input, average indoor temperature and relative humidity were high, while the indoor wind velocity was low. Overcrowding occurred because the space accommodated more than the required seating capacity. The implication was that the occupants will give off carbon dioxide, water vapour, dead skin cells, as well as unpleasant odours if the space was not adequately ventilated [33]. Overcrowding can cause arousal conditions that will stimulate skin conductance, leading to palmar sweat, restlessness, inattentiveness and sometimes respiratory irritation, such as coughing and sneezing [32]. This will invariably create thermal comfort problems in the lecture theatres. Ventilation determines thermal comfort and provides satisfaction in the indoor environment. Ventilation also helps to remove heat generated in a working area by convection and cools the body, provides fresh air and removes accumulated noxious gases and contaminants [33]. Thus, when door and window openings on the external walls were inadequate for ventilation, a given room space will be hot and uncomfortable. This was because the occupants generate heat and liberate sweat (vapour) into the indoor environment, which was already characterized by high external and internal temperature and relative humidity. For a building to provide ventilation, it should not impose as much resistance as possible to airflow through it [34].
The average minimum and maximum temperatures and relative humidity readings of 29–32 °C and 78%, respectively, were above the thermal comfort limits of 22–27 °C for relative humidities between 70%–100% [1,2,30].High temperature and relative humidity beyond individual’s tolerable limit can generate heat and activate the sweat glands that produce moisture in the body of individuals. The feeling of the increase in sweat production creates body heat and a wettedness sensation and sometimes breathing difficulties at high relative humidity when vapour liberated through perspiring occupants carrying out various human activities was not evaporated as frequently as possible [3,49,50]. Thus, when the air is humid, evaporation of perspiration from the body will be limited; and a feeling of oppression so common in the humid tropic is created. Therefore, extreme conditions of humidity should be avoided [31].
In addition, the measured average indoor wind velocity of 0.32 m/s was also below the required wind velocity of 0.5–1.0 m/s required for a feeling of a pleasant cooling effect [39,46,47,48,49]. The available air in the room space will be utilized quickly without any corresponding replenishment as a result of the low wind velocity. Therefore, high temperature and relative humidity combined with low wind velocity in room space indicated that the ventilation of that space can never be assured, except with the use of artificial ventilation; that is, the lecture theatre space did not provide the required thermal comfort. The effect is a stuffy room environment with body odour from the sweat of the occupants, which will lead to a contaminated room space. Since the common denomination of lecture theatres was for a large number of people to be assembled in an enclosed space for an appreciable period of time, the primary problem was to furnish sufficient air and to distribute it properly [50,51,52].
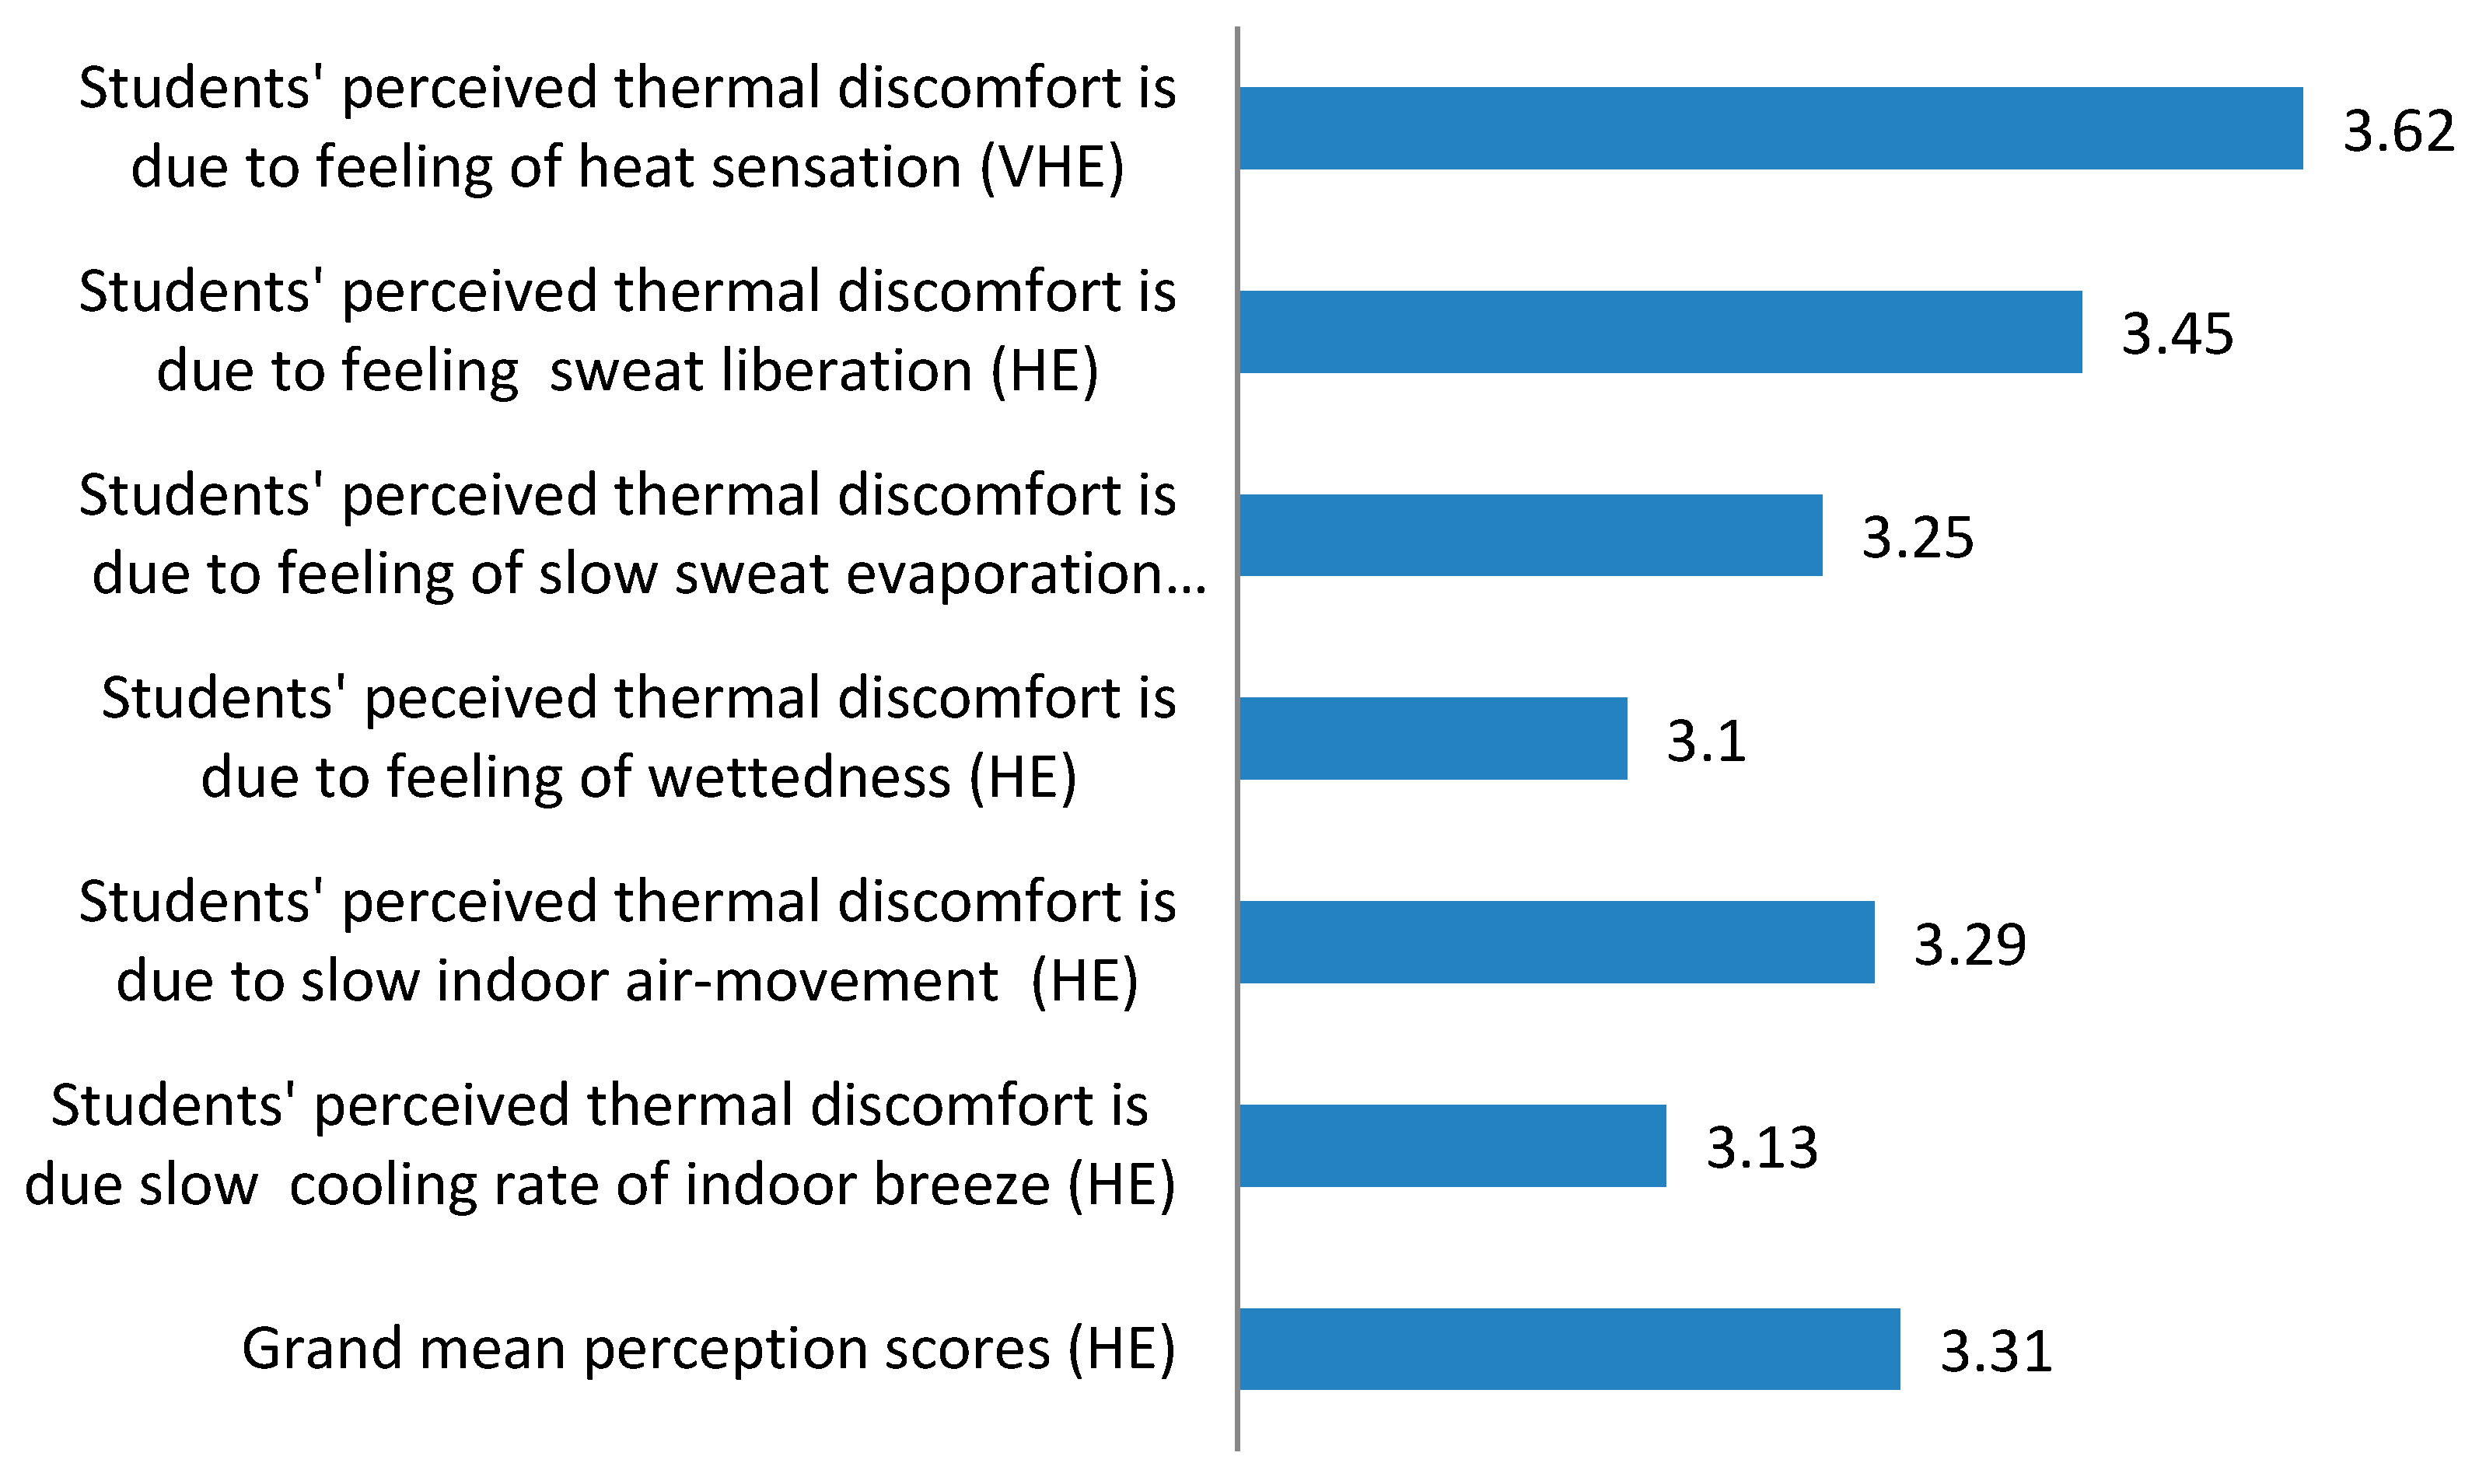
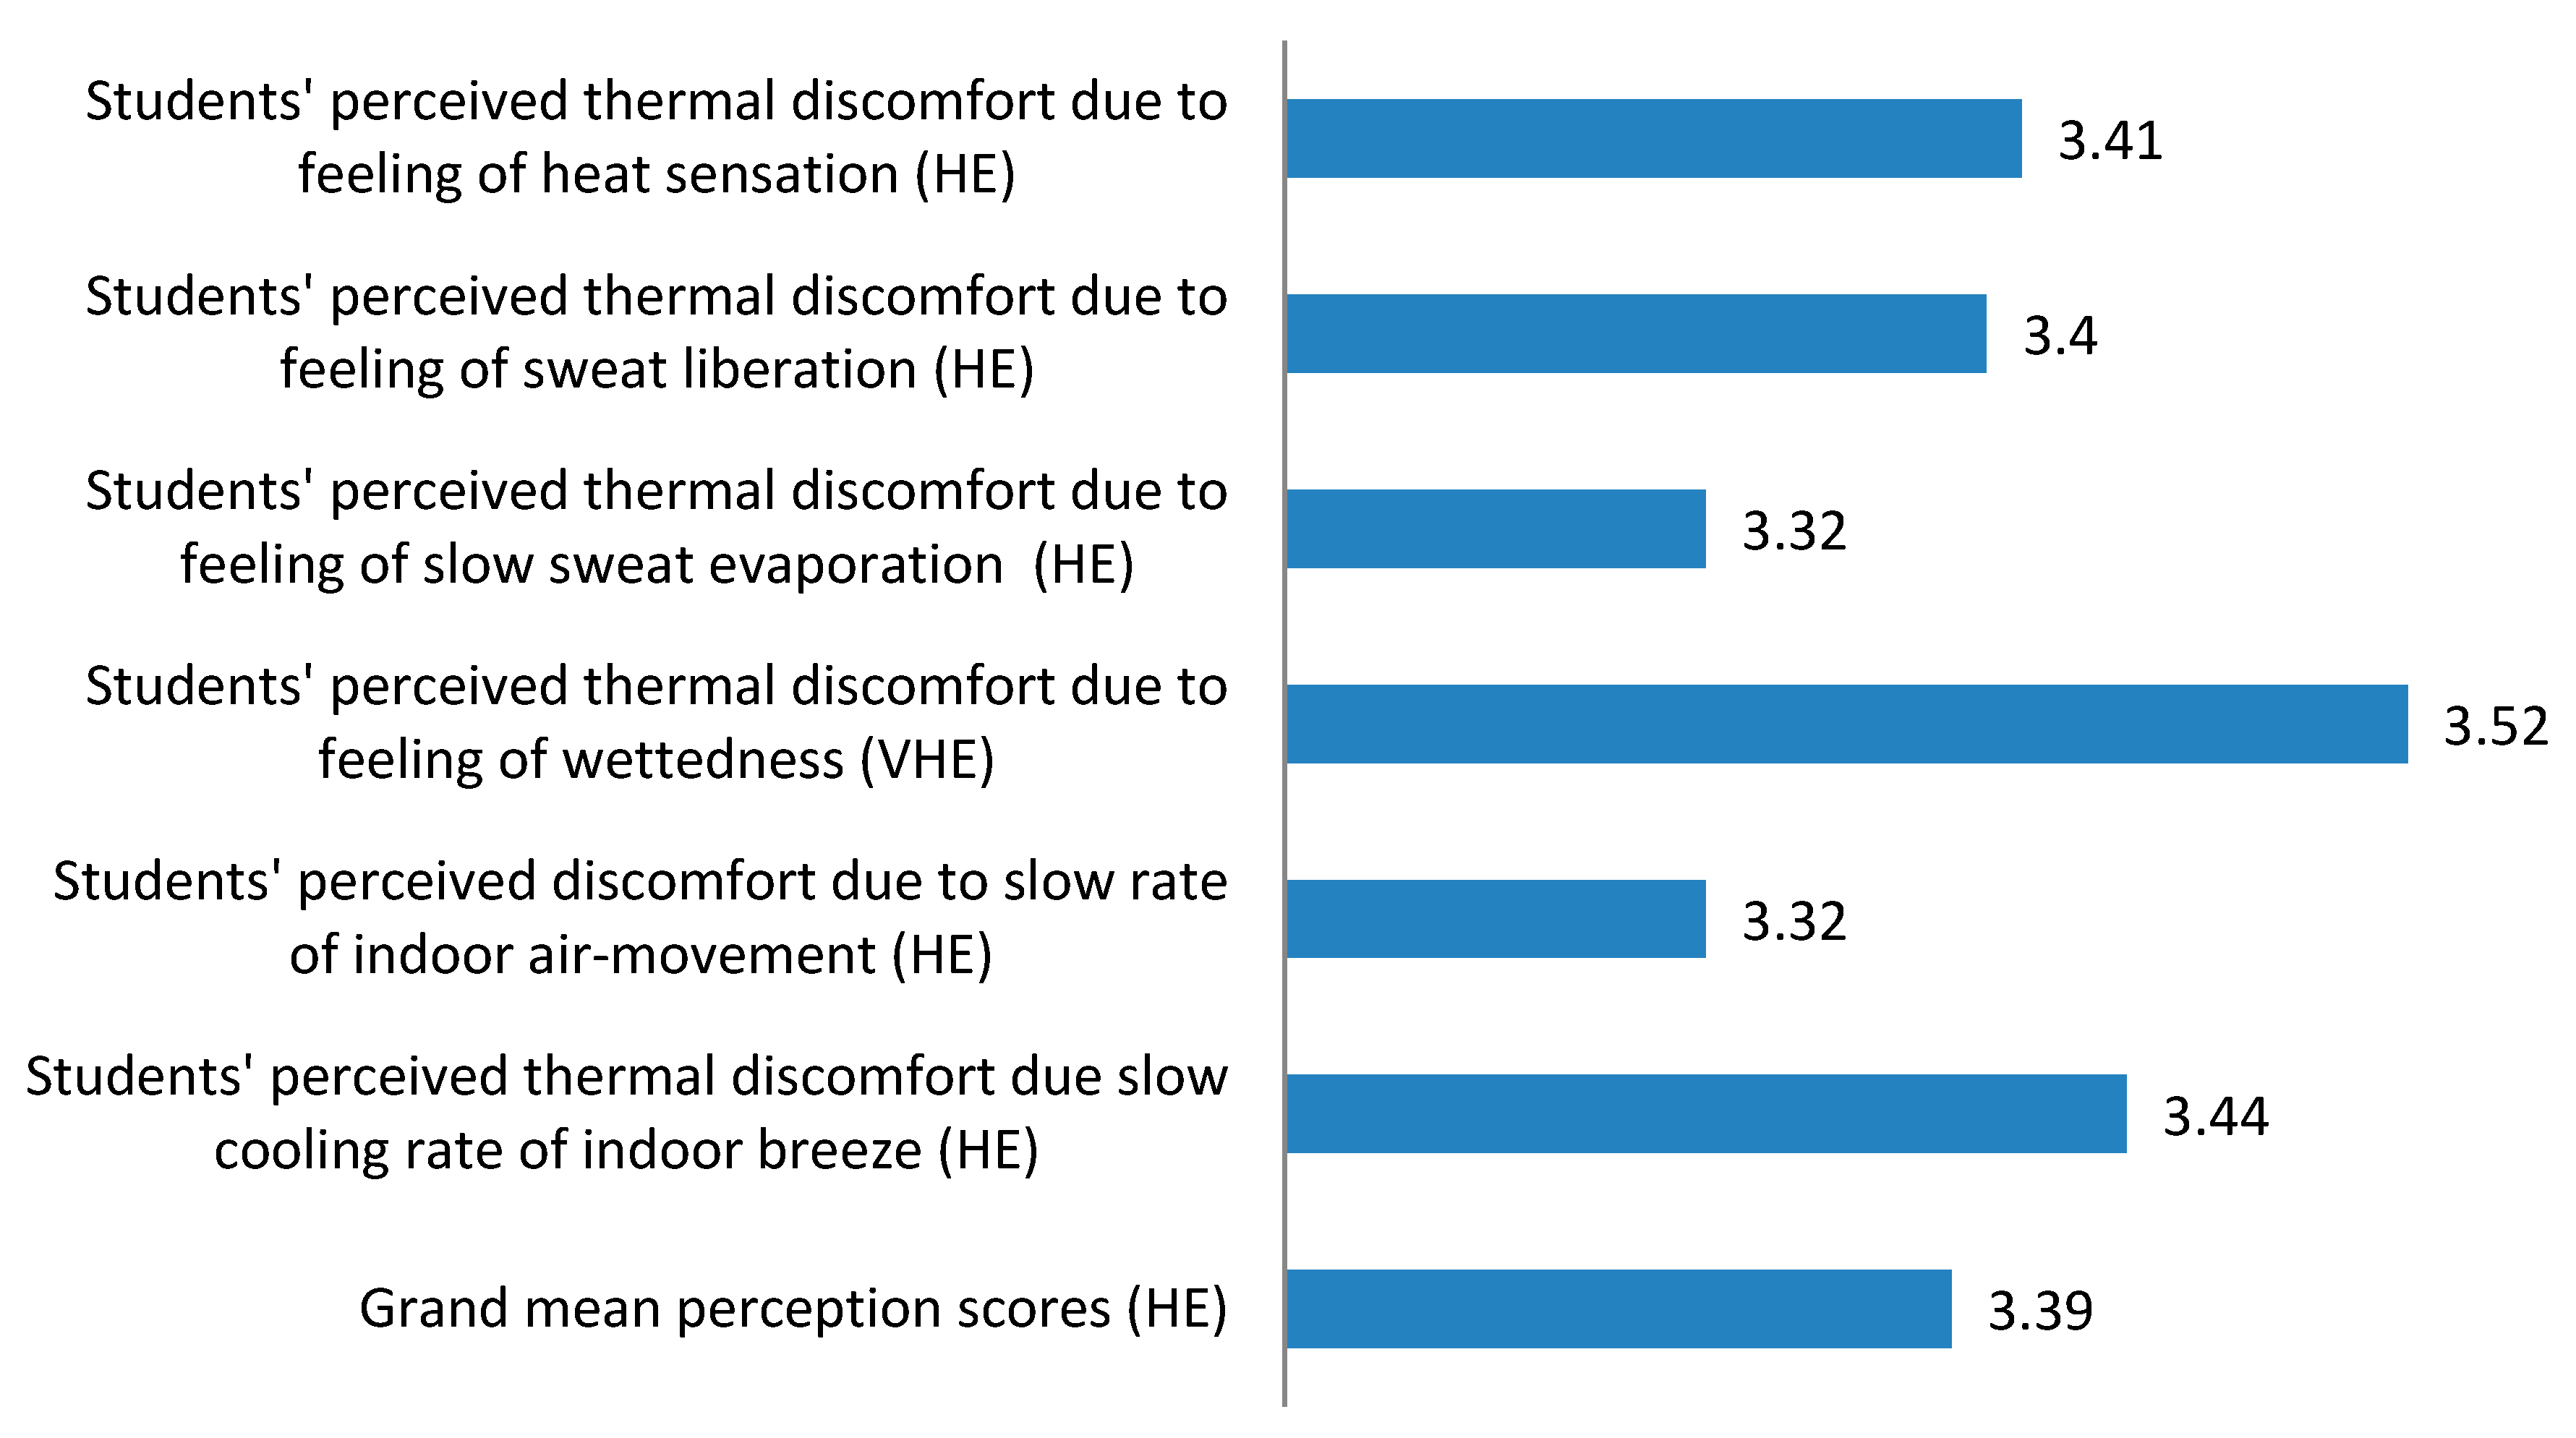
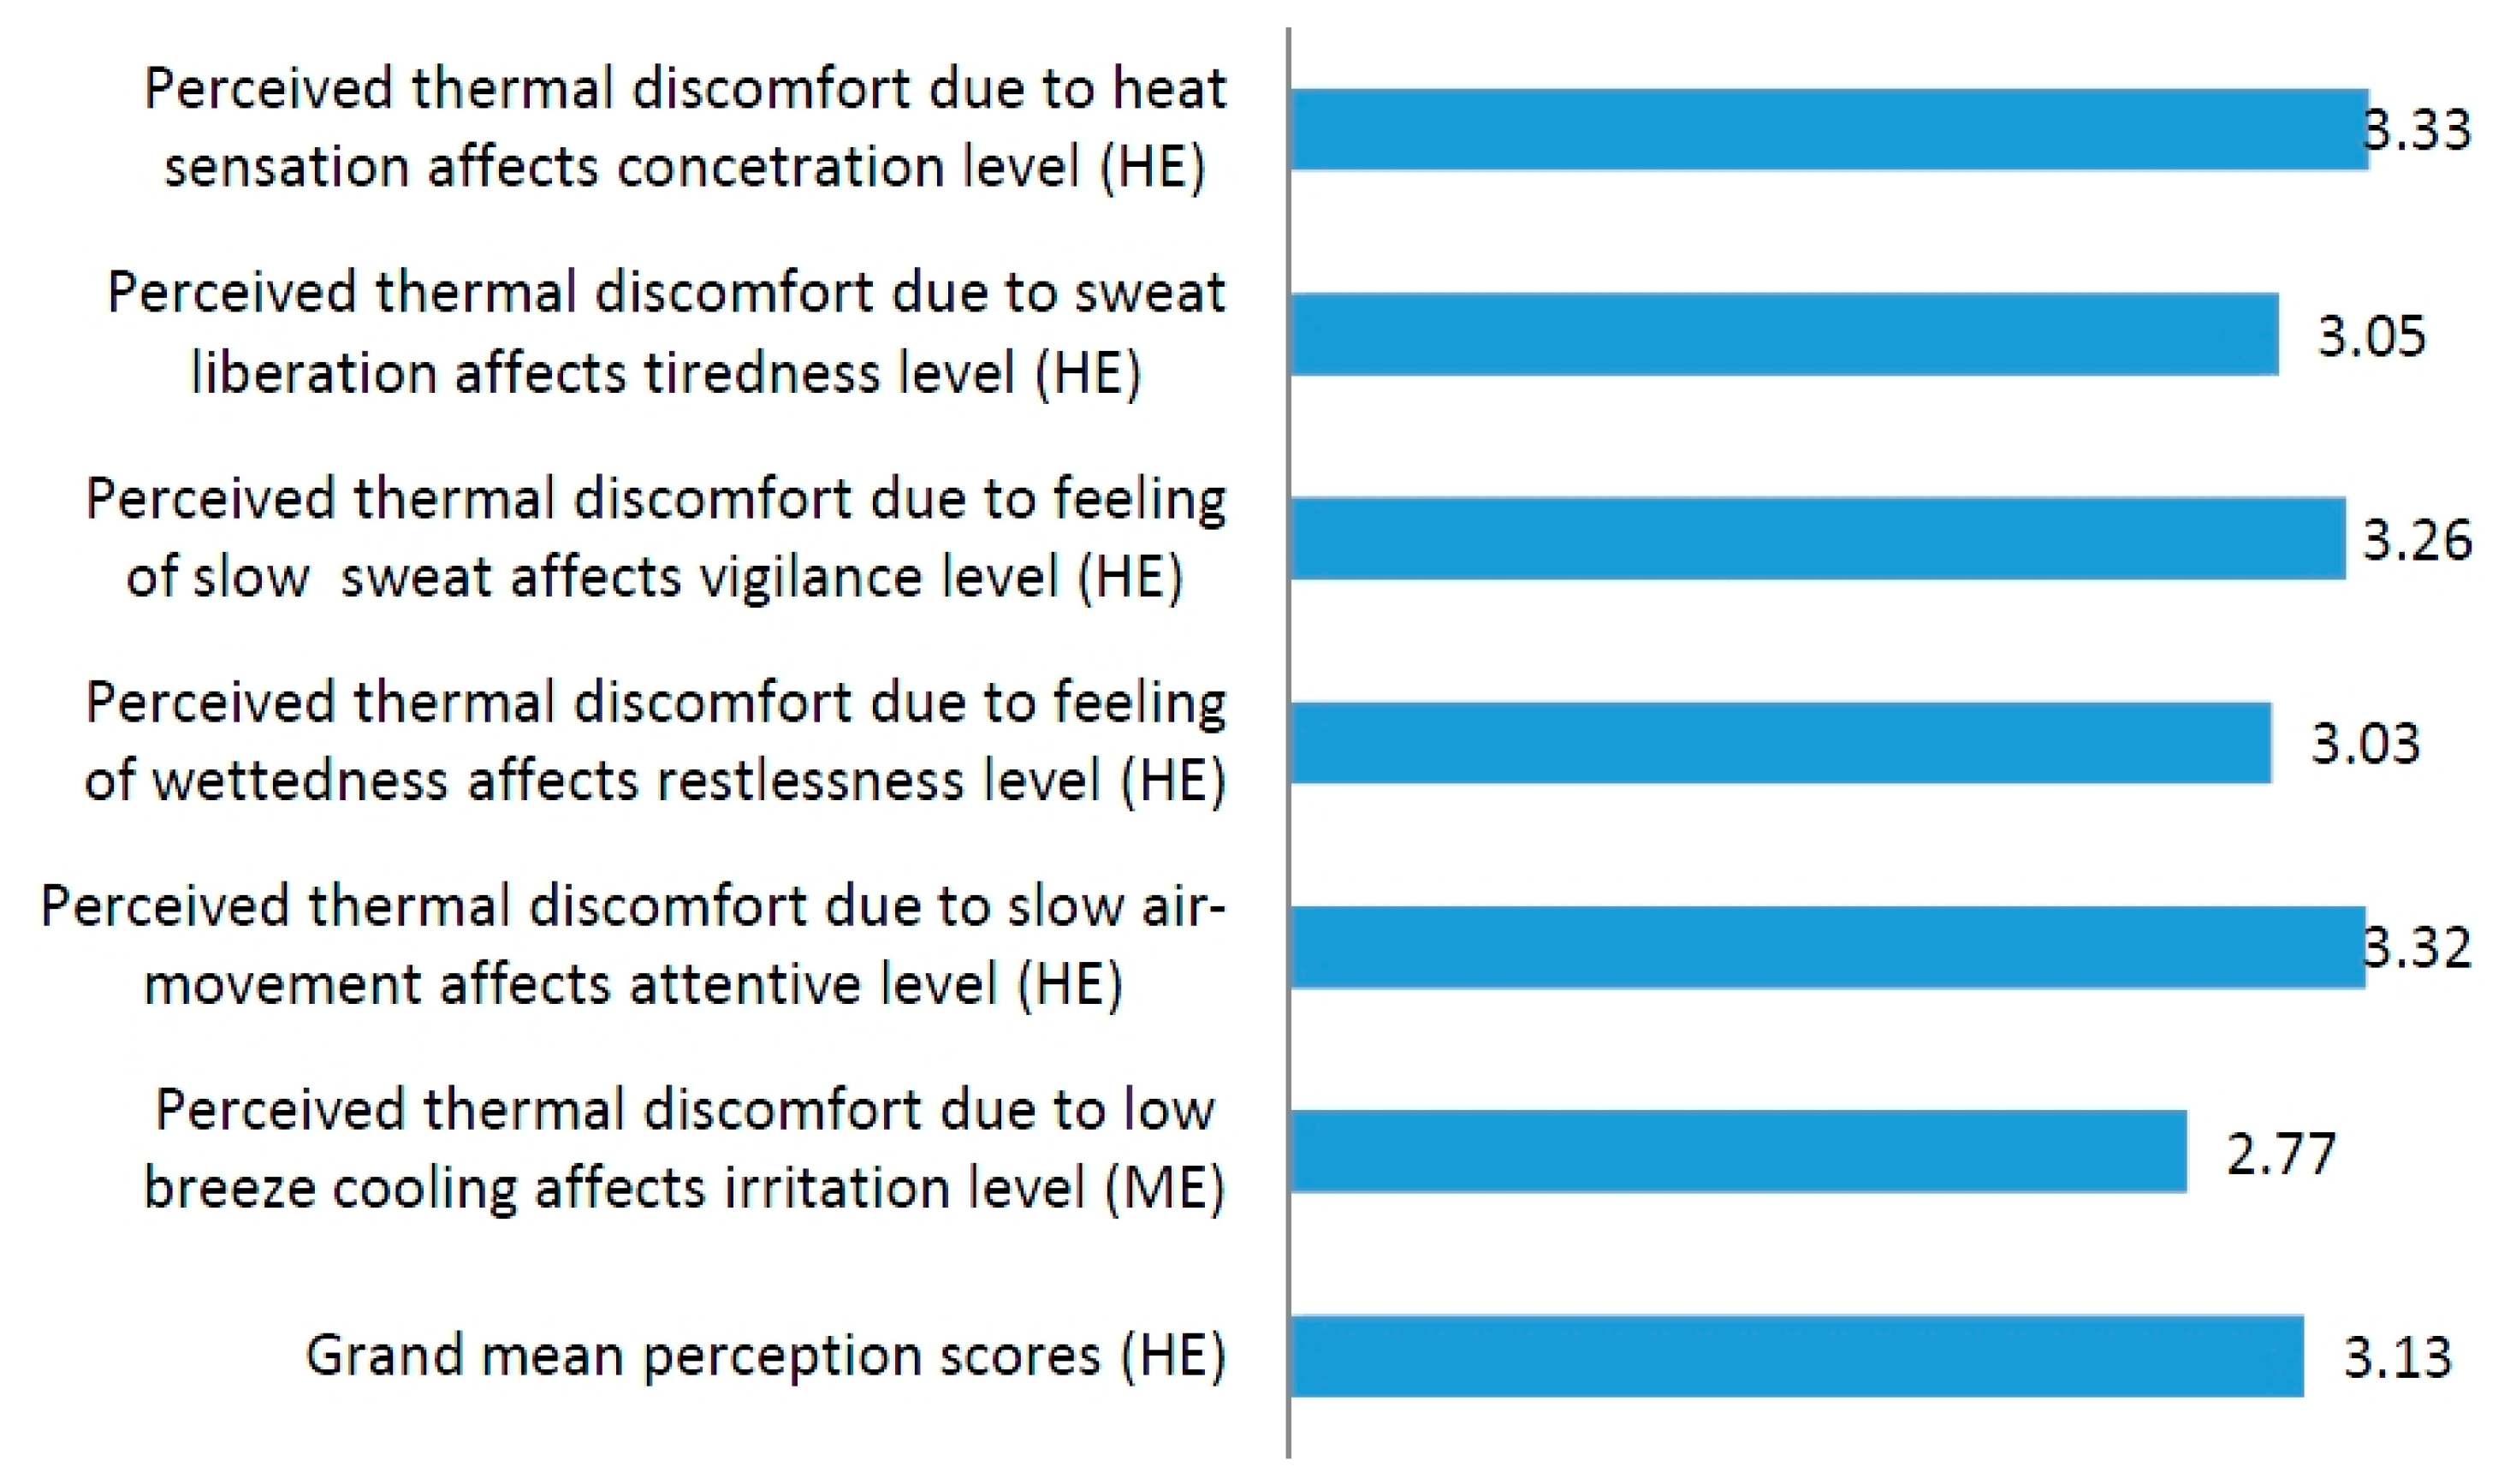
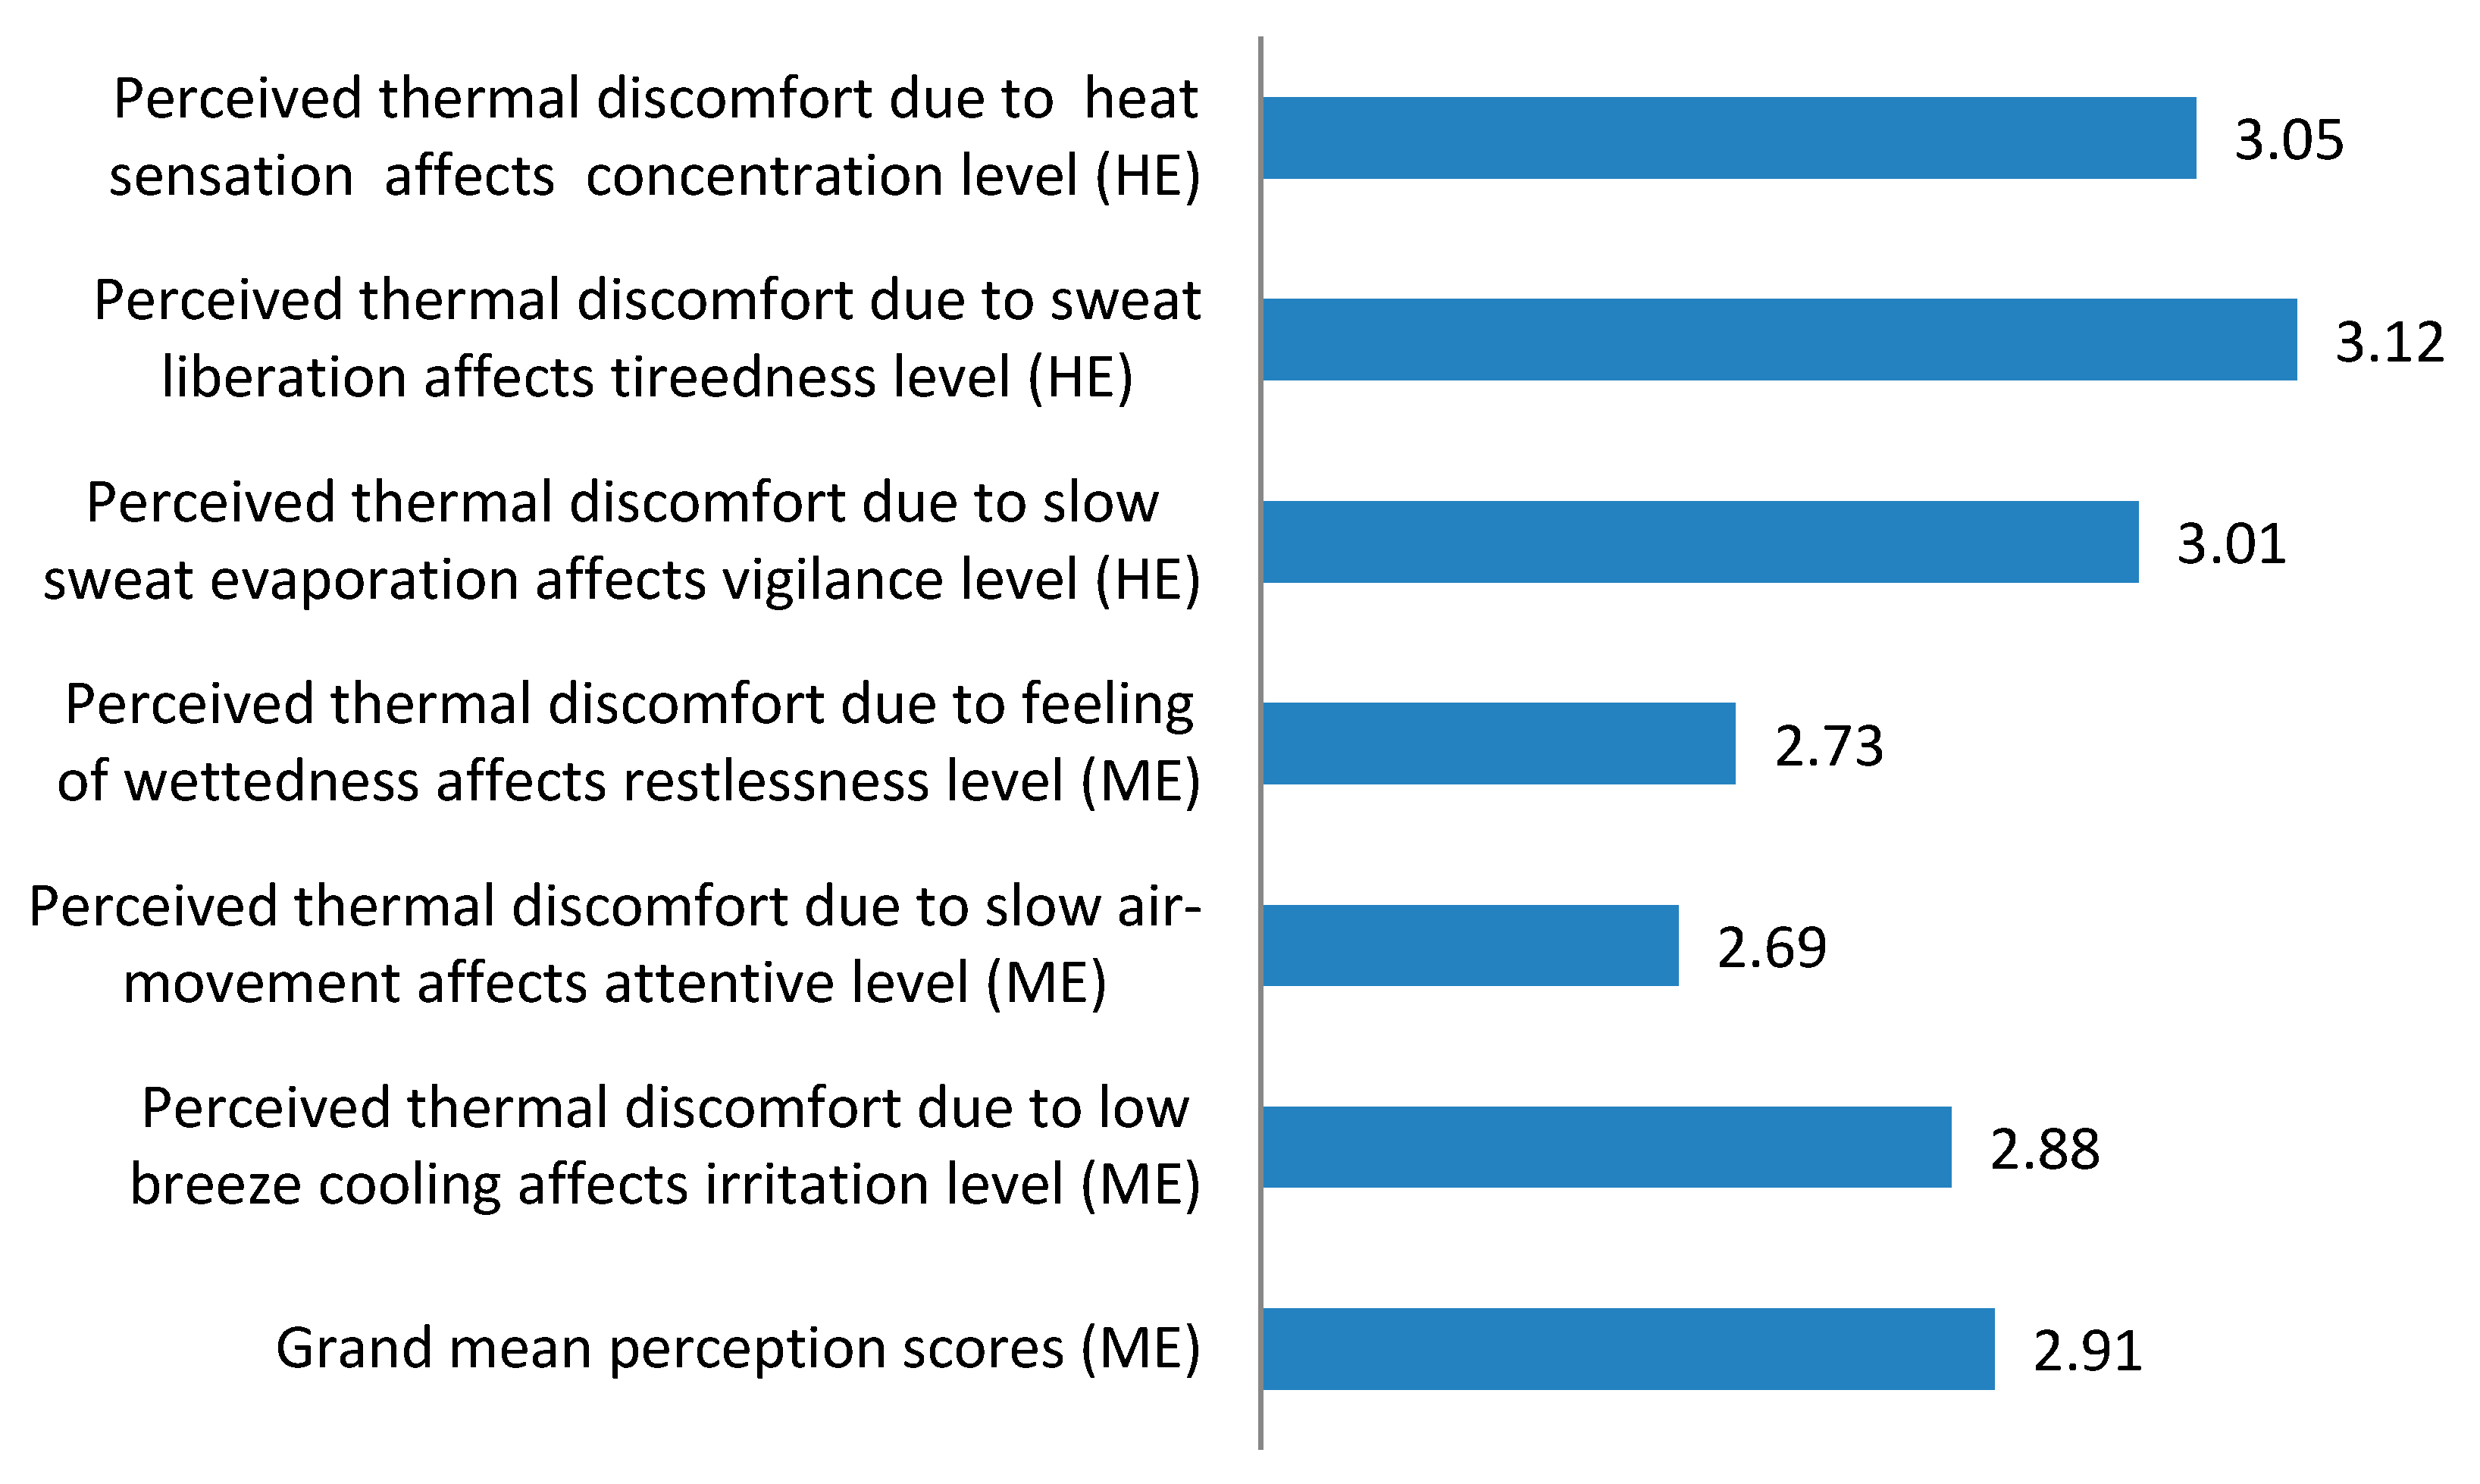
In addition, it was the perception of the students that there was thermal discomfort in the two lecture theatres due to the indoor environmental conditions. A significant difference did not exist between the students in LTH-2 and LTH-3, respectively, in their perception of thermal discomfort due to the indoor environmental conditions. This was because the students in the two lecture theatres perceived that the feeling of heat sensation, liberation of sweat, slow evaporation of sweat, wettedness, a slow rate of indoor air movement and a slow cooling effect of the indoor breeze were the cause of thermal discomfort. This perception can be explained by the climate in Bayelsa State in Niger Delta region being hot and humid. The average outdoor relative humidity is between 78% and 89%, with monthly minimum and maximum temperatures of 21–23 °C and 28–33 °C, respectively, wind velocity between 1.5 and 3.3 m/s [43], while the observed average minimum and maximum indoor air temperature was 29–32 °C, relative humidity, 78% and wind velocity, 0.32 m/s, making it inevitable that there was thermal discomfort in the indoor space. This finding is consistent with Puteha, Ibrahimb, Adnana, Che’Ahmada and Noh [27], who reported that outdoor average temperatures of 23.7–36.9 °C and relative humidity of 67%–95% have an adverse impact on occupant’s comfort indoors. In this regard, Tom [17] opined that a reasonable indication of comfort, even if it is not perfect, is better than having no indicator at all.
The findings further revealed that the thermal discomfort in the indoor space had an effect on stress behaviours affecting learning, as perceived by the students. There was no significant difference in the mean students’ perceived stress behaviours affecting learning for the two groups of students in LTH-2 and LTH-3; that is, the thermal discomfort conditions in the lecture theatres affected the stress behaviours of students’ vis-à-vis their learning. The stress behaviours exhibited as perceived by the students were mental fatigue (lack of concentration), physical fatigue (tiredness), restlessness, inattention, non-vigilance and irritation. These stress behaviours were common indicators of thermal discomfort that affected learning. With a temperature range of between 22 and 32 °C, average relative humidity between 62% and 87% and an overcrowded indoor space, which decreases thermal comfort, it is therefore expected that the indoor thermal comfort conditions in the lecture theatre will affect learning. Tom [17] observed that a range of temperatures exist between roughly 22 and 25 °C at which people are most productive. However, their productivity decreases rapidly when the temperatures are above or below this range. In agreement, Choi and Chun [53] while examining attention level at 20 and 23 °C, found that, in general, an indoor temperature of 23 °C provides an environment more conducive for concentration. Further, the knowledge that a reasonable and constant temperature can positively impact students’ health and learning is still relatively firm [54].
Furthermore, there was no correlation between the students’ perceived indoor thermal discomfort and the students’ perceived stress behaviours affecting their learning in LTH-2. This meant that the indoor thermal environment created thermal discomfort for the students’, as well as the stress behaviours affecting learning; the effect was not significant enough to have a correlation. Markus and Morris [3], therefore, opined that although the perception of stress behaviours in a thermal environment can coincide with effective learning-teaching, there were some evidence that such perceptions may not necessarily coincide with those for comfort, but due in part to the arousal level of the students in the thermal environment. Another reason is that the arousal level of the students was higher than the arousal level for optimal performance [24]. However, there was a correlation between the students’ perceived indoor thermal discomfort and the students’ perceived stress behaviours affecting learning in LTH-3. This finding was not unexpected, but only confirmed that stress behaviours exhibited in a learning environment can have a profound effect on learning. From case studies in actual workplaces, Romm and Browning [55] also confirmed that there was a link between comfort and productivity, especially at temperatures between 20 and 25 °C.

5. Conclusions and Recommendations

The study revealed that the seating capacity, inadequacy of window openings on the external walls of the lecture theatre, as well as high temperature and relative humidity combined with low air movement in the indoor environment created thermal discomfort in the lecture theatres. The result of thermal discomfort in the lecture theatre space also had an effect on stress behaviours affecting learning in terms of concentration, attentiveness and non-vigilance, tiredness, restlessness and irritation during lectures. It was therefore pertinent that the indoor space should create relative thermal comfort conditions that can satisfy the majority of the users in a given teaching-learning environment. With this, the teaching and learning will stimulate human development and become attractive in order to serve the purpose of teaching and learning. In order to improve effective teaching-learning environment in the humid tropical climate, the researchers recommend the following:
  • The teaching-learning indoor environment should be assessed for thermal comfort.
  • Window openings on the external walls of the teaching-learning room space should be adequate and properly located.
  • The appropriate floor area/student ratio should be adhered to in order to avoid the overcrowding of the teaching-learning room space.
  • The room volume/student ratio should meet the required standard in conjunction with the floor area/student ratio to also avoid overcrowding the room space.

Acknowledgments

We wish to acknowledge the contributions of the following departments at Niger Delta University, Wilberforce Island, Amassoma, Nigeria: Department of Works, for allowing us to reproduce the drawings of the lecture theatres; the Director of Academic Planning for providing data of the students’ enrolment; and the Department of Meteorological Services, Federal Ministry of Aviation, Port-Harcourt, for providing climatic data.

Author Contributions

Tamaraukuro Tammy Amasuomo conceived the topic; Japo Oweikeye Amasuomo carried out the objective and self-report data collection; Tamaraukuro Tammy Amasuomo and Japo Oweikeye Amasuomo analyzed the data and wrote the paper.

Conflicts of interest

The authors declare no conflict of interest.

Appendix

Table A1. Students’ Perceived Thermal Discomfort Levels in Lecture Theatres.
Question Items on Thermal Comfort IndicatorsGroup AGroup B
Answer OptionsµSDAnswer OptionsµSD
VHEHEMELEVHEHEMELE
The perceived thermal discomfort in the lecture theatre is due to feeling of:
heat sensation in my body14456733.620.6221811114273.410.70
sweat liberation in my body11778873.450.7319414517143.400.75
slow sweat evaporation from my body1096712223.250.9615616036183.230.81
wettedness in my body867534153.100.922241192253.520.67
slow rate of indoor air movement1116322143.290.911801354783.320.77
slow cooling effect of indoor breeze956533173.130.9622410421213.440.84
Grand mean perception score3.310.85 3.390.76
Group A: 210 students; Group B: 370 students.
Table A2. Students’ Perceived Stress Behaviour Levels Affecting Learning in the Lecture Theatres.
Question Items on Stress BehavioursGroup AGroup B
Answer optionsµSDAnswer optionsµSD
VHEHEMELEVHEHEMELE
The perceived thermal discomfort in the lecture theatre due to feeling of:
heat sensation affected my concentration level1353219253.330.812093267623.051.19
sweat liberation affected my tiredness (mental and physical fatigue) level1181938353.051.192124559543.121.14
slow sweat evaporation affected my vigilance level1283619273.261.071738161553.011.11
wettedness affected my restlessness level975035283.031.081347979782.731.16
slow rate of indoor air movement affected my attentive level1323424203.321.011268381802.691.15
slow cooling effect of indoor breeze affected my irritation level784645412.771.101518278592.881.12
Grand mean perception score3.131.08 2.911.15
Group A: 210 students; Group B: 370 students.

References

  1. ANSI/ASHRAE Standard 55-2004 Thermal Environmental Conditions for Human Occupancy; American Society of Heating, Refrigerating and Air-Conditioning Engineers: Atlanta, GA, USA, 2004.
  2. Olgyay, V. Bioclimatic Approach to Architecture; National Research Council: Washington, DC, USA, 1953. [Google Scholar]
  3. Markus, T.A.; Morris, E.N. Buildings, Climate and Energy; Pitman Ltd: London, UK, 1980. [Google Scholar]
  4. Choi, M.H.; Min, Y.K.; Kim, H.S.; Kim, J.H.; Yeon, H.W.; Choi, J.S.; Kim, B.; Min, J.Y.; Park, B.C.; Jun, J.H.; et al. Effects of three levels of arousal on 3-back working memory task performance. Cogn. Neurosci. 2013, 4, 1–6. [Google Scholar] [CrossRef] [PubMed]
  5. Givoni, B. Man, Climate and Architecture; Applied Science Publishers Ltd.: London, UK, 1981. [Google Scholar]
  6. Dagostino, F.R. Mechanical and Electrical Systems in Construction and Architecture; Reston Publishing Company Inc.: Reston, VA, USA, 2004. [Google Scholar]
  7. Olesen, B.W. Guidelines for comfort. ASHRAE J. 2000, 42, 41–47. [Google Scholar]
  8. Fanger, P.O. Thermal Comfort; Danish Technical Press: Copenhagen, Denmark, 1970. [Google Scholar]
  9. Van Hoof, J.; Mazej, M.; Hensen, J.L. Thermal comfort: Research and practice. Front. Biosci. 2010, 15, 765–788. [Google Scholar]
  10. Van Hoof, J. Forty years of Fanger’s model of thermal comfort: Comfort for all? Indoor Air 2008, 18, 182–201. [Google Scholar] [CrossRef] [PubMed]
  11. De Dear, R.J.; Bragger, G.S.; Cooper, D. Developing an Adaptive Model of Thermal Comfort and Preferences, FINAL Report ASHRAE RP-884; American Society of Heating, Refrigerating and Air-Conditioning Engineers: Atlanta, GA, USA, 1997. [Google Scholar]
  12. De Dear, R.J.; Bragger, G.S. Thermal comfort in naturally ventilated buildings, revisions to ASHRAE Standard 55. Energy Build. 2002, 34, 549–561. [Google Scholar] [CrossRef]
  13. De Dear, R.J.; Bragger, G.S. Developing an adaptive model of thermal comfort an preferences. ASHRAE Trans. 1989, 104, 145–167. [Google Scholar]
  14. Merriam-Webster Dictionaries. Learning-Definition. Available online: http://www.merriam-webster.com/namethatthing/index.htm (assessed on 22 April 2016).
  15. Lawal, A.F.; Ojo, O.J. Assessment of thermal performance of residential buildings in Ibadan land, Nigeria. J. Emerg. Trends Eng. Appl. Sci. 2011, 2, 581–586. [Google Scholar]
  16. Hussein, I.; Rahman, M.H.A. Field study on thermal comfort in Malaysia. Eur. J. Sci. Res. 2009, 37, 127–145. [Google Scholar]
  17. Tom, S. Managing energy and comfort: Don’t Sacrifice comfort when managing energy. ASHRAE J. 2008, 50, 18–26. [Google Scholar]
  18. Fraser, B.J. Research on classroom and school climate. In Handbook of Research on Science Teaching and Learning; Gabel, G., Ed.; Macmillan: Washington, DC, USA, 1994; pp. 493–541. [Google Scholar]
  19. Kamaruzzaman, K.; Tazilan, A.S.B.M. Thermal comfort assessment of a classroom in tropical climate conditions. In Recent Advances in Energy, Environment and Development; SEAS Press: Rhodes Island, Greece, 2013; pp. 88–91. [Google Scholar]
  20. Waldrip, B.; Fisher, D. Identifying exemplary science teachers through their classroom interactions with students. Learn. Environ. Res. Int. J. 2003, 6, 157–174. [Google Scholar] [CrossRef]
  21. Ahn, C.L.; Kim, J.J.; Shin, B.H.; Kum, J.S. Characteristics of thermal environments and evaluation of thermal comfort in classrooms in winter. Korean Soc. Living Environ. Syst. 2003, 10, 251–256. [Google Scholar]
  22. Lee, J.Y.; Lee, K.H. A study on the model setting of thermal comfort zone in the elementary school classroom. Proc. Archit. Inst. Korea 1986, 6, 279–282. [Google Scholar]
  23. Cheong, S.; Sheng, N.; Kim, D.; Lee, J.; Hwang, Y.; Park, J.; Seo, S.-J. Analysis of comfortable environments in the classroom with humidification and ventilation in winter. Korea J. Air Cond. Refrig. Eng. 2009, 21, 402–408. [Google Scholar]
  24. Chung, S.L.; Park, J.L.; Kim, K.H. A study on the evaluation for comfort of indoor thermal environment in the summer season by relative humidity. Kyung Hee J. Inst. Environ. Stud. 1997, 7, 11–19. [Google Scholar]
  25. Adunola, A.O.; Ajibola, K. Thermal comfort considerations and space use within residential buildings in Ibadan, Nigeria. In Proceedings of the 7th Windsor Conference on the Changing Context of Comfort in an Unpredictable World, Cumberland Lodge, Windsor, UK, 12–15 April 2012.
  26. Wafi, S.R.S.; Ismail, M.R. Occupant’s thermal satisfaction. A case study in Universiti Sains Malaysia (USM) Hostels Penang, Malaysia. Eur. J. Sci. Res. 2010, 46, 309–416. [Google Scholar]
  27. Puteha, M.; Ibrahimb, M.H.; Adnana, M.; Che’Ahmada, C.N.; Noh, N.M. Thermal comfort in classroom: Constraints and issues. Procedia Soc. Behav. Sci. 2012, 46, 1834–1838. [Google Scholar]
  28. Kavianian, H.R.; Wentz, C.A. Occupational and Environmental Safety Engineering and Management; Van Nostrand Reinhold: New York, NY, USA, 1996. [Google Scholar]
  29. Hammer, W.; Price, D. Occupational Safety Management and Engineering; Prentice Hall Inc.: Upper Saddle River, NJ, USA, 2002. [Google Scholar]
  30. Yellot, J.I. Thermal comfort design. In Ramsey/Sleeper Architectural Graphics Standards; John Wiley & Sons Inc.: New York, NY, USA, 2008. [Google Scholar]
  31. Ayoade, J.O. Introduction to Climatology for the Tropics; Spectrum Books Ltd: Ibadan, Nigeria, 2004. [Google Scholar]
  32. Bell, P.A.; Greene, T.C.; Fisher, J.D.; Baum, A. Environmental Psychology, 5th ed.; Taylor and Francis Group: New York, NY, USA, 2005. [Google Scholar]
  33. Bridger, R.S. Introduction to ergonomics, 3rd ed.; Taylor and Francis Group: New York, NY, USA, 2008. [Google Scholar]
  34. Heerwagen, D. Passive and Active Environmental Control-Informing the Schematic Designing of Buildings; McGraw-Hill Co. Inc.: New York, NY, USA, 2004. [Google Scholar]
  35. Critchfield, H.J. General Climatology; Prentice Hall Inc.: Upper Saddle River, NJ, USA, 1998. [Google Scholar]
  36. Foster, J.S.; Greeno, R. Structure and Fabric Part 1; Taylor and Francis Group: New York, NY, USA, 2006. [Google Scholar]
  37. Will, P.; Ovresat, R.C. Educational—Elementary and secondary school. In Time Saver Standard for Building Types; De-Chiara, J., Crosbie, M.J., Eds.; McGraw-Hill Book Company: New York, NY, USA, 1980; pp. 169–172. [Google Scholar]
  38. Thirakomen, K. Humidity control for tropical climate. Available online: http://www.ashraethailand.org/download/ashraethailand_org/pub_20010908humidity_control.pdf (assessed on 29 April 2016).
  39. Yau, Y.H.; Chew, B.T.; Saifullah, A. Thermal comfort in lecture halls in the tropics. Topic 2. Indoor environment. In Proceedings of the ISHVAC 2011: The 7th International Symposium on Heating, Ventilating and Air Conditioning, Shanghai, China, 6–9 November 2011.
  40. Adegbie, M.O.; Ayeni, D.A. Soft landscape elements: Importance and implications on thermal control in tropical buildings. Int. J. Dev. Res. 2013, 3, 55–60. [Google Scholar]
  41. Balogun, O.Y. Senior Secondary School Atlas, 2nd ed.; Longman Nigeria Plc: Ikeja, Nigeria, 2003. [Google Scholar]
  42. Evans, M. Tropical design. In New Metric Handbook: Planning and Design Data; Littlefield, D., Ed.; Taylor and Francis Group: New York, NY, USA, 2012; pp. 402–511. [Google Scholar]
  43. Niger Delta Region Land and People-Niger Delta Regional Master Plan; Niger Delta Development Commission: Port Harcourt, Nigeria, 2015. Available online: http://www.nddc.gov.ng/NDRMP%20Chapter%201.pdf (assessed on 22 April 2016).
  44. Bunnett, R.B.; Okunrotifa, P.O. General Geography in Diagrams for West Africa; Longman Group Ltd: Essex, UK, 2003. [Google Scholar]
  45. Jordan, J. Higher Education. In New Metric Handbook: Planning and Design Data; Littlefield, D., Ed.; Taylor and Francis Group: New York, NY, USA, 2012; pp. 204–273. [Google Scholar]
  46. Neufert, E.; Neufert, P. Architects’ Data, 4th ed.; Wiley-Blackwell: London, UK, 2012. [Google Scholar]
  47. Burberry, P. Environment and Services; Longman Ltd: London, UK, 1997. [Google Scholar]
  48. Adler, D. Thermal comfort. In New metric handbook: planning and design data; Littlefield, D., Ed.; Taylor and Francis Group: New York, NY, USA, 2012; pp. 38–401. [Google Scholar]
  49. Roberts, W.F. Natural ventilation. In Ramsey/Sleeper architectural graphic standards; Hoke, W.F., Ed.; John Willey & Sons Inc.: New York, NY, USA, 2008; p. 713. [Google Scholar]
  50. Sander, M.S.; McCormick, E.J. Human Factors in Engineering and Design, 7th ed.; McGraw-Hill Book Company: Singapore, 1993. [Google Scholar]
  51. Anyakoha, M.W. New School Physics Senior Secondary Schools; Africana First Publishers Ltd: Onitsha, Nigeria, 2008. [Google Scholar]
  52. Greenberg, A. Heating, ventilation and air conditioning. In Time Saver Standard for Architectural Design: Technical Data for Professional Practice, 8th ed.; Crosbie, M., Watson, D., Eds.; McGraw-Hill Professional: New York, NY, USA, 1993; pp. 106–194. [Google Scholar]
  53. Choi, Y.R.; Chun, C.Y. The effect of indoor temperature on occupants’ attention abilities. J. Archit. Inst. Korea Plan. Des. 2009, 25, 411–418. [Google Scholar]
  54. Baker, L.; Bernstein, H. The Impact of School Buildings on Student Health and Performance:A Call for Research; McGraw-Hill Research Foundation: New York, NY, USA, 2012. [Google Scholar]
  55. Romm, J.J.; Browning, W.D. Greening the Building and the Bottom Line; Rocky Mountain Institute: Boulder, CO, USA, 2004. [Google Scholar]
Figure 1. Floor plan of the lecture theatre (LHT).
Buildings 06 00018 g001
Figure 2. Cross-section of the lecture theatre.
Buildings 06 00018 g002
Figure 3. Students’ perceived thermal discomfort levels in LTH-2. VHE: very high extent; HE: high extent; ME: moderate extent; LE: low extent.
Buildings 06 00018 g003
Figure 4. Students’ perceived thermal discomfort levels in LTH-3.
Buildings 06 00018 g004
Figure 5. Students’ perceived stress behaviour levels affecting learning in LTH-2.
Buildings 06 00018 g005
Figure 6. Students’ perceived stress behaviour level affecting learning in LTH-3.
Buildings 06 00018 g006
Table 1. Measurement of indoor space and environmental conditions in LTH-2.
Items MeasuredExisting DataRecommendedRemarksRef.ScoreDecision
Seating capacity290 m 2/307 students (0.94 m2/student)290 m 2/263 students (1.10 m2/student)Overcrowded[45,46]−1HTD
Room volume1150 m3/307 students (3.75 m3/student)1,075 m3/307 seats at (3.50 m3/student)Not overcrowded[47]+1LTD
Heat input (140 watts/person/h42,980 watts/307 students/h36,820 watts/263 students/hHigh heat input−1HTD
Vapour input (0.2 kg/person/h)61.40 kg/307 students/h52.60 kg/263 students/hHigh vapour input−1
Windows and doors28 m2 (11% of 258 m2 external walls)103–206 m2 (40%–80% of external walls)Inadequate[42]−1HTD
Average room air temperature29–32 °C22–27 °C for 75 % relative humidityHigh temperature[1,2,30,48]−1HTD
Average room relative humidity78%High relative humidity−1
Average room wind velocity0.5–1.0 m/sLow−1
Total thermal discomfort scores−7HTD
HTD = high thermal discomfort; LTD= low thermal discomfort.
Table 2. Measurement of indoor space and environmental conditions in LTH-3.
Items measuredExisting DataRecommendedRemarksRef.ScoreDecision
Seating capacity290 m 2/519 students290 m2/263 seats (1.10 m2/student)Overcrowded[45,46]−1HTD
Room volume1150 m3/519 students1817 m3 for 519 seats at 3.50 m3/studentOvercrowded[47]−1
Heat input(140 watts/person/h)72,660 watts/519 students/h36,820 watts/263 students/hHigh heat input−1
Vapour input (0.2 kg/person/h)103.80 kg/519 students/h52.60 kg/263 students/hHigh vapour input−1
Windows and doors28 m2 (11% of 258 m2 external walls)103–206 m2 (40%–80% of external walls)Inadequate[42]−1HTD
Average room air temperature29–32 °C22–27 °C for 75% relative humidityHigh temperature[1,2,30,48]−1HTD
Average room relative humidity78%High relative humidity−1
Average room wind velocity0.32 m/s0.5–1.0 m/sLow−1
Total thermal discomfort scores−8HTD
Researcher’s field work; HTD = high thermal discomfort; LTD = low thermal discomfort.
Table 3. Test of the significant difference in the mean students’ perceived thermal discomfort scores in LTH-2 and LTH-3.
GroupsNMean (µ)SDdfZ-CalculatedZ-CriticalDecision
Group A2103.318.855781.141.65No significant difference at p ≤ 0.05
Group B3703.390.76
Table 4. Test of significant difference in mean students’ perceived stress behaviour scores affecting learning in LTH-2 and LTH-3.
GroupsNMean (µ)SDdfZ-CalculatedZ-CriticalDecision
Group A2103.311.085780.421.65No significant difference at p ≤ 0.05
Group B3702.911.15
Table 5. Test of correlation between students’ perceived thermal discomfort level and students’ perceived stress behaviour levels affecting learning in LTH-2.
Mean Students’ Perceived Thermal Discomfort ScoresMean Students’ Perceived Stress Behaviour Scores(X − µx)(Y − µy)
X(X − µx)2Y(Y − µy)2
3.620.0963.330.0400.062
3.450.0203.050.0060.011
3.250.0043.260.0170.008
3.100.0443.030.0100.021
3.290.0013.320.0360.004
3.130.0322.770.1300.054
µ = 3.31SSX = 0.197µ = 3.13SSY = 0.239SP = 0.160
Mean = µ; df = 4; p ≤ 0.05; critical value (r) = 0.811; calculated value (r) = 0.738; decision = there was no correlation.
Table 6. Test of correlation between students’ perceived thermal discomfort level and students’ perceived stress behaviour level affecting learning in LTH-3.
Mean Students’ Perceived Thermal Discomfort ScoresMean Students’ Perceived Stress Behaviour Scores(X − µx)(Y − µy)
X(X − µx)2Y(Y − µy)2
3.410.0783.050.0200.039
3.400.0733.120.0440.057
3.230.0103.010.0100.010
3.520.1522.730.0320.070
3.320.0362.690.0480.042
3.440.0962.880.0010.001
µ = 3.13SSX = 0.445µ = 2.91SSY = 0.155SP = 0.219
Mean = µ; df = 4; p ≤ 0.05; critical value (r) = 0.811; calculated value (r) = 0.833; decision = there is correlation.

