
Envelope Thermal Design Optimization for Urban Residential Buildings in Malawi

Department of Land Management, Mzuzu University, Private Bag 201, Luwinga, Mzuzu 2, Malawi
Buildings 2016, 6(2), 13; https://doi.org/10.3390/buildings6020013
Submission received: 2 December 2015
/
Revised: 23 March 2016
/
Accepted: 28 March 2016
/
Published: 13 April 2016
Abstract
:This study sought to optimize the envelope thermal design of free-running urban residential buildings in Malawi. It specifically set out to improve the urban residential buildings’ thermal comfort and suggest optimal envelope thermal design features for these buildings. The research study was primarily dependent on computer simulations in EnergyPlus to replicate the typical Malawian urban residential building’s thermal behaviour and then study the impacts of various envelope configurations on the thermal comfort conditions registered in the building. The simulation model was experimentally validated to check its appropriateness to the climatic design conditions prevalent in Malawi and out of the three major cities that were considered, the model was found to be appropriate for use in the two cities of Mzuzu and Lilongwe leaving out the city of Blantyre. The optimization methodology that was employed involved the use of orthogonal arrays, statistical analyses and the listing method. It was found that the optimal envelope thermal design, which registered up to 18% lower discomfort hours than that of the typical urban residential building, consists of a 50 mm concrete floor slab, 230 mm burnt brick walls with an external layer of 19 mm EPS, tiled roof with an internal layer of sarking and 50 mm EPS, double Low-E Glazing with a transparency ratio of 45% and 0.2408 m2 of adaptable operational surface area for the air bricks. Out of all the envelope features that were studied, air infiltration registered the most significant contribution towards the ultimate residential building thermal performance. It was demonstrated that controlled air infiltration through the use of operable air bricks whose operational surface area is adaptable can be very effective in enhancing the building’s comfort levels. It was further observed that excessive insulation of the building envelope generally has a detrimental effect on the indoor space thermal comfort levels.
1. Introduction
Buildings provide human beings with a means of keeping away elements of the weather from interrupting in their daily livelihoods. Modern technology has significantly enhanced buildings’ capabilities in this respect. Over the years, economic transformation in certain parts of the world has made these technological innovations to become increasingly affordable to many building users [1]. It has also raised the building users’ comfort requirements of their buildings [1]. Consequently, building energy consumption now tops 20% of all the globally available energy supplies [1]. Against a backdrop of rising anthropogenic Green House Gas (GHG) emissions and rising energy costs, it has become imperative that building designs be optimized for both comfort in use and energy consumption.
In the lowly industrialized countries south of the Sahara, the economic dynamics have not been at the same scale as seen in the developing and developed countries such as China, India, Brazil and others. The uptake of building comfort enhancing technological innovations has been there, but it remains very low and elitist. This is compounded by the limited access to the requisite energy, electricity, which is needed to run these technological innovations. In Malawi, for instance, only about 8% of the entire population have access to the national electricity supply [2]. Nonetheless, the building user living in a lowly industrialized country such as Malawi still needs comfort in a building in much the same way as does a building user living in a developing country such as China. In this context, the building design optimization ought to enhance comfort in the natural climatic conditions through passive design approaches.
The fundamental objective of this study was to optimize the envelope thermal design of free-running urban residential buildings in Malawi. It specifically sought to improve urban residential buildings thermal comfort and suggest optimal envelope thermal design features for free-running urban residential buildings
Malawi Demographics
Malawi is a country located in South Eastern Africa, bordered by Tanzania, Mozambique and Zambia to the north-east, east-south-west and west respectively. It lies between longitudes 32°51′ E and 35°91′ E and latitudes 9°31′ S and 17°11′ S [2]. Figure 1 shows the geographical location of the country.
The proportion of the urbanized population is presently very low at about 16% [5]. However, the country has one of the highest urbanization rates in Africa pegged at 4.2% per annum for the period 2010–2015 [5]. It is projected that by the year 2050, Malawi’s urban population will reach up to 32% of the country’s population [5].
The rapid urbanization provides fertile ground for the growth of the building industry with both commercial and residential building construction projects set to be actualized. Commercial building establishments may, almost always, have access to active building environment control, residential buildings on the other hand may not and may thus have to run freely in natural mode. This research work is dedicated to the latter.
2. Literature Review
2.1. Building Envelope Thermal Design Optimization in Warm Climates
The global climatic zones are summarized in six categories, namely: Polar, Temperate, Arid, Tropical, Mediterranean and Mountains [6]. For the purposes of this work, warm climates include the Arid and the Tropical climatic zones which may also alternatively be classified as Hot-Dry and Warm-Humid respectively. Malawi and most of the lowly industrialized countries south of the Sahara fall under the warm climatic characterization. Hot-Dry climates are characterised by a severe overheating problem, dry air and a large diurnal temperature variation [7]. Warm-Humid climates register smaller diurnal temperature variations and a milder overheating problem which is aggravated by high humidities [7]. A significant amount of research has been undertaken to optimize buildings’ envelope thermal design in the warm climates.
Moffiet et al. [8] used a statistical analysis of real data to empirically study the collective effect of wall thermal mass, thermal resistance, building design, season and external air temperature on indoor air temperature. It was found that for moderate climates, the best performing construction/design is one in which insulation and thermal mass arrangements can be dynamically altered to suit weather and season.
Al-Homoud [9] studied the impact of building envelope thermal design, especially the thermal insulation, on the thermal performance of buildings in hot climates. This work was dependent on simulations conducted using EnerWin simulation program and it was observed that proper envelope design can help in reducing air-conditioning system size and energy consumption and also extending the periods of thermal comfort while the building is in free running mode.
Romani et al. [10] developed and validated meta models of residential buildings in Moroccan climatic zones to study the heating and cooling energy needs and perform the building envelope design optimization for purposes of minimizing energy consumption.
Alaidroos and Krarti [11] sought to minimize residential building energy consumption in the Kingdom of Saudi Arabia through the optimization of the building envelope including wall insulation, roof insulation, window area, glazing, shading, and thermal mass. The study used sequential search optimization and genetic algorithms and showed that through the envelope design optimization, substantial energy savings could be achieved.
Lenoir et al. [12] proposed a simulation based methodology using energy flow simulation and GenOpt software to help in optimizing solar shading for thermal and visual comfort constrained on energy consumption in the context of tropical climates.
Ihm and Krarti [13] used a sequential search technique to optimize various aspects of Tunisian residential buildings, including envelope design and HVAC system design to minimize the buildings’ life cycle cost and their energy consumption, while maintaining occupants’ thermal comfort.
Arumugam et al. [14] studied the optimization of roof insulation for roofs with high albedo coating and radiant barriers in India. Their study showed that the use of cool roofs and radiant barriers diminishes the need for roof insulation.
It is important to note at this point that most of this work has been aimed at maximizing thermal comfort while minimizing building energy consumption in the context of actively controlled thermal environments. There has been very little research in the direction of optimizing the building envelope for thermal comfort in strictly passively controlled building thermal environments. At best, passive design strategies have only been called upon to reduce the thermal loads on the active control systems.
2.2. Building Envelope Thermal Design Optimization in Industrialized Countries of the Warm Climatic Zone
The advent of rising environmental awareness, energy costs and building thermal comfort requirements in the industrialized countries has led to the development of a wide range of building codes aimed at regulating various aspects of building construction such as envelope design and HVAC system design with the primary objective of achieving the building thermal comfort in an energy efficient manner. These codes have been promulgated at both a regional and country-specific levels. In the industrialized countries located in the warm climatic zone, much of the building energy consumption is attributed to space cooling. The Cooling Degree Days for temperatures above 18 °C are in excess of 1000 annually. The IEA [15] notes that energy efficiency requirements in building codes can help to ensure that concern is taken for energy efficiency at the design phase, where there is a huge potential for massive energy saving in new buildings.
As a general pattern, envelope thermal design codes are set based on resistance to heat transmittance through a unit of the construction known as the R-Value or the heat transmittance through the same unit known as the U-Value. In cold climates, low U-values or high R-values prevent heat from escaping from the building while in hot climates, they prevent the heat from entering [15].
In Singapore, the envelope thermal design is addressed in the code for environmental sustainability of buildings whose general objective is to achieve broader environmental sustainability through the moderation of buildings’ impact on the environment [16]. The thermal performance of a residential building envelope is evaluated on the basis of the Residential Envelope Transmittance Value (RETV) which is constrained to a maximum value of 25 W/m2 to minimize heat gain and thus reduce the overall cooling load. The code also specifies suitable orientation for buildings and window openings, amounts of sun shading, minimum U-values for building components and accordingly distributes the responsibilities to the requisite professionals.
The New Zealand Building Code regulates the envelope thermal design in New Zealand [17]. It seeks to facilitate energy efficient use in buildings and thus requires all building envelopes to be constructed in a way that provides adequate thermal resistance and limits uncontrollable airflow. It specifically addresses the thermal mass of building elements, the building orientation and shape, the airtightness of the envelope, local climate, heat gains from services, processes and occupants, heat gains from solar radiation and sets the minimum thermal properties for building components such as R-Values.
In the ARAB countries, envelope thermal design is guided by the building energy efficiency regulations which take either form of being mandatory or voluntary [18,19]. Their scope of application is wide covering several building types [18]. The building envelope thermal resistance values are set to a minimum prescription. In the United Arab Emirates for instance, the code specifies minimum Envelope Performance Requirements evaluated based on thermal transmittance and shading coefficients [20].
2.3. Envelope Thermal Design Optimization in Lowly Industrialized Countries of the Warm Climatic Zone
Lowly industrialized countries form the bulk of the countries located in the warm climatic zone. In stark contrast with the industrialized countries, here, the environmental awareness and building energy consumption remain relatively low [26]. The weaker economic structures mean that the building users’ expectations of their indoor environments may not be as high as those in the industrialized countries. Most residential buildings are free-running and the users must put up with discomfort conditions for the better part of the occupied time.
Envelope thermal design is hardly ever addressed in the building standards used in most of these countries. These standards are, to a large extent, obsolete pieces of legislation which were in use during the colonial occupation of these countries, way before the impetus for proper building envelope thermal design emerged. This is true for Zimbabwe, where Chirisa [27] notes the heavy reliance of the planning practice on the outdated building standards set by the British. This also holds true for Malawi where it is reported that for purposes of guiding building construction, the urban authorities rely on rudimentary guidelines which were in use during the British colonial era [28]. Even so, much, if not all, emphasis is given to the buildings’ structural safety as seen in the enforceable standards in the construction industry prepared by the Malawi Bureau of Standards [29]. Other equally more important building aspects such as thermal design and thermal comfort are hardly ever addressed at all. The same could also be said for Zambia, where the Energy Regulation Board only superficially recommends the insulation of the building envelope and the enhancement of the envelope transparency ratio for harnessing natural light [30].
Thus despite the significant advances made in Building Science, buildings are still constructed using archaic technologies which do not have any substantial research basis, and especially in the countries’ contexts.
In East Africa, there have been positive strides towards the optimization of the buildings envelope thermal designs. The United Nations through the UN-HABITAT spearheaded a project on promoting energy efficiency in buildings in East Africa including Kenya, Uganda and Rwanda with an aim to produce The Resources Efficiency and Conservation Measures (RECM) Standard which sets an energy efficiency baseline for the building envelope, systems and equipment for purposes of moderating the environmental impact of buildings [31].
In the standard, it is noted that existing building codes and standards have limited scope on issues of resource efficiency such as energy efficiency and water efficiency, optimal use of light and natural ventilation amongst others. The standard provides for three compliance paths namely prescriptive, trade-off and performance measurement. The first two rely on specified values of building component thermal transmittance and resistance, shading amounts and window-wall ratio. The performance measurement path is simulation based and the amount of energy to be consumed by a proposed building ought not to exceed a specified value.
The scope of the standard is essentially limited to commercial buildings and large air-conditioned buildings exceeding 500 m2 of floor area. This remotely suggests that the standard’s approach holds energy efficiency in isolated pre-eminence above other equally important aspects such as building thermal comfort and life cycle costs, much to the detriment of other building users, especially the less privileged ones and ironically, are the ones who constitute the bulk of the urban population.
It is not very clear how far the East African RECM standard has been adopted in the East African nations. In Rwanda, the Utilities Regulatory Agency only provides some rudimentary tips on how the building establishments can cut on their energy consumption through amongst others, enhancing the airtightness and transparency ratio of the building envelope [32].
In Nigeria, [33] notes that the national building code does not have any direct provision with regard to building energy use much as it emphasizes on the importance of occupants’ thermal comfort. In particular reference to building envelope construction, the code does not specify any U-values for the building components.
The Global Environment Fund in partnership with the Nigerian government embarked on a project very similar to the one which was later to follow in East Africa, aimed at improving the energy efficiency of equipment used in residential and public buildings through the introduction of energy efficiency policies and measures [34]. This project did not make any reference to the building envelope construction. The project was adopted by ECOWAS and extended to three other West African countries namely Benin, Sierra Leone and Liberia. Basing on the project’s objective, it is very unlikely if in the other countries the scope was extended to cover building envelope design.
In Sierra Leone, the energy policy prepares the ground work for the introduction of an energy efficiency and Conservation Act that would spell out mandatory energy management practices and building codes amongst others [35]. However, it remains to be seen how this has been followed through, especially with regard to building envelope construction.
The research body on building envelope thermal design optimization in the lowly industrialized countries remains very shallow. The sparsely available literature in this regard is credited to [36,37,38,39].
It is very clear at this point that building envelope thermal design has not inspired as much interest in the lowly industrialized countries as it has done in the industrialized ones. The issue remains elusively addressed in the building codes and there is very little research work which has been undertaken in this respect. A number of reasons could be put forward to explain the current status quo. To begin with, there seems to be very little political will to radically modernize the building regulations in many lowly industrialized countries. Most of these countries still rely on standards which predate the current body of knowledge on building thermal performance. These standards fare very well in ensuring structural integrity and safety amongst others, so much that any aspirations beyond this are regarded as luxurious and thus not worthy of priority attention in the face of other competing issues. This makes it very difficult for building control authorities to source funds which can facilitate the development of updated building codes.
Further to the above, high poverty levels could be another reason. Perez-Lombard et al. [1] attributes the rising comfort requirements in buildings in developed countries to the rising economic status of the building users. In the lowly industrialized countries, the weaker economic standing forces the building users to settle for less and thus lower their comfort requirements in buildings.
It can also be pointed out that the penetration of building science research has been very low in the lowly industrialized countries. There are very few institutions that are actively involved in building science research. Even for the few institutions, much of their efforts are only superficial and limited to theoretical approaches such that they lack the compelling confidence of robust research.
In this day and age, building thermal performance control can no longer be regarded as a luxury. There is need to raise the awareness levels on issues to do with building thermal comfort, building energy consumption and the environmental connection. The building codes need to be modernized accordingly and in this pursuit, the lowly industrialized countries could benefit a lot from regional integration for purposes of macro level benchmarking, sharing good practices and lobbying for funds. The potential for regional integration can be demonstrated by the RECM in East Africa [31], the ARAB Union [18,19] and the European Directive on Building energy performance [15].
3. Methodology
The research study was primarily dependent on computer simulations in EnergyPlus Version 8 to replicate the typical Malawian urban residential building’s thermal behaviour and then study the impacts of various envelope configurations on the thermal comfort conditions registered in the building. A total of seven building envelope features were identified including Floor Thickness (FT), Wall R-value (WR), Roof R-value (RR), Glazing Insulation (GL), Ventilation Bricks Infiltration (BI), Wall Transparency Ratio (TR) and Window Overhang (WO). These features were studied at four levels in their order of diminishing R-values.
3.1. Construction of Simulation Model
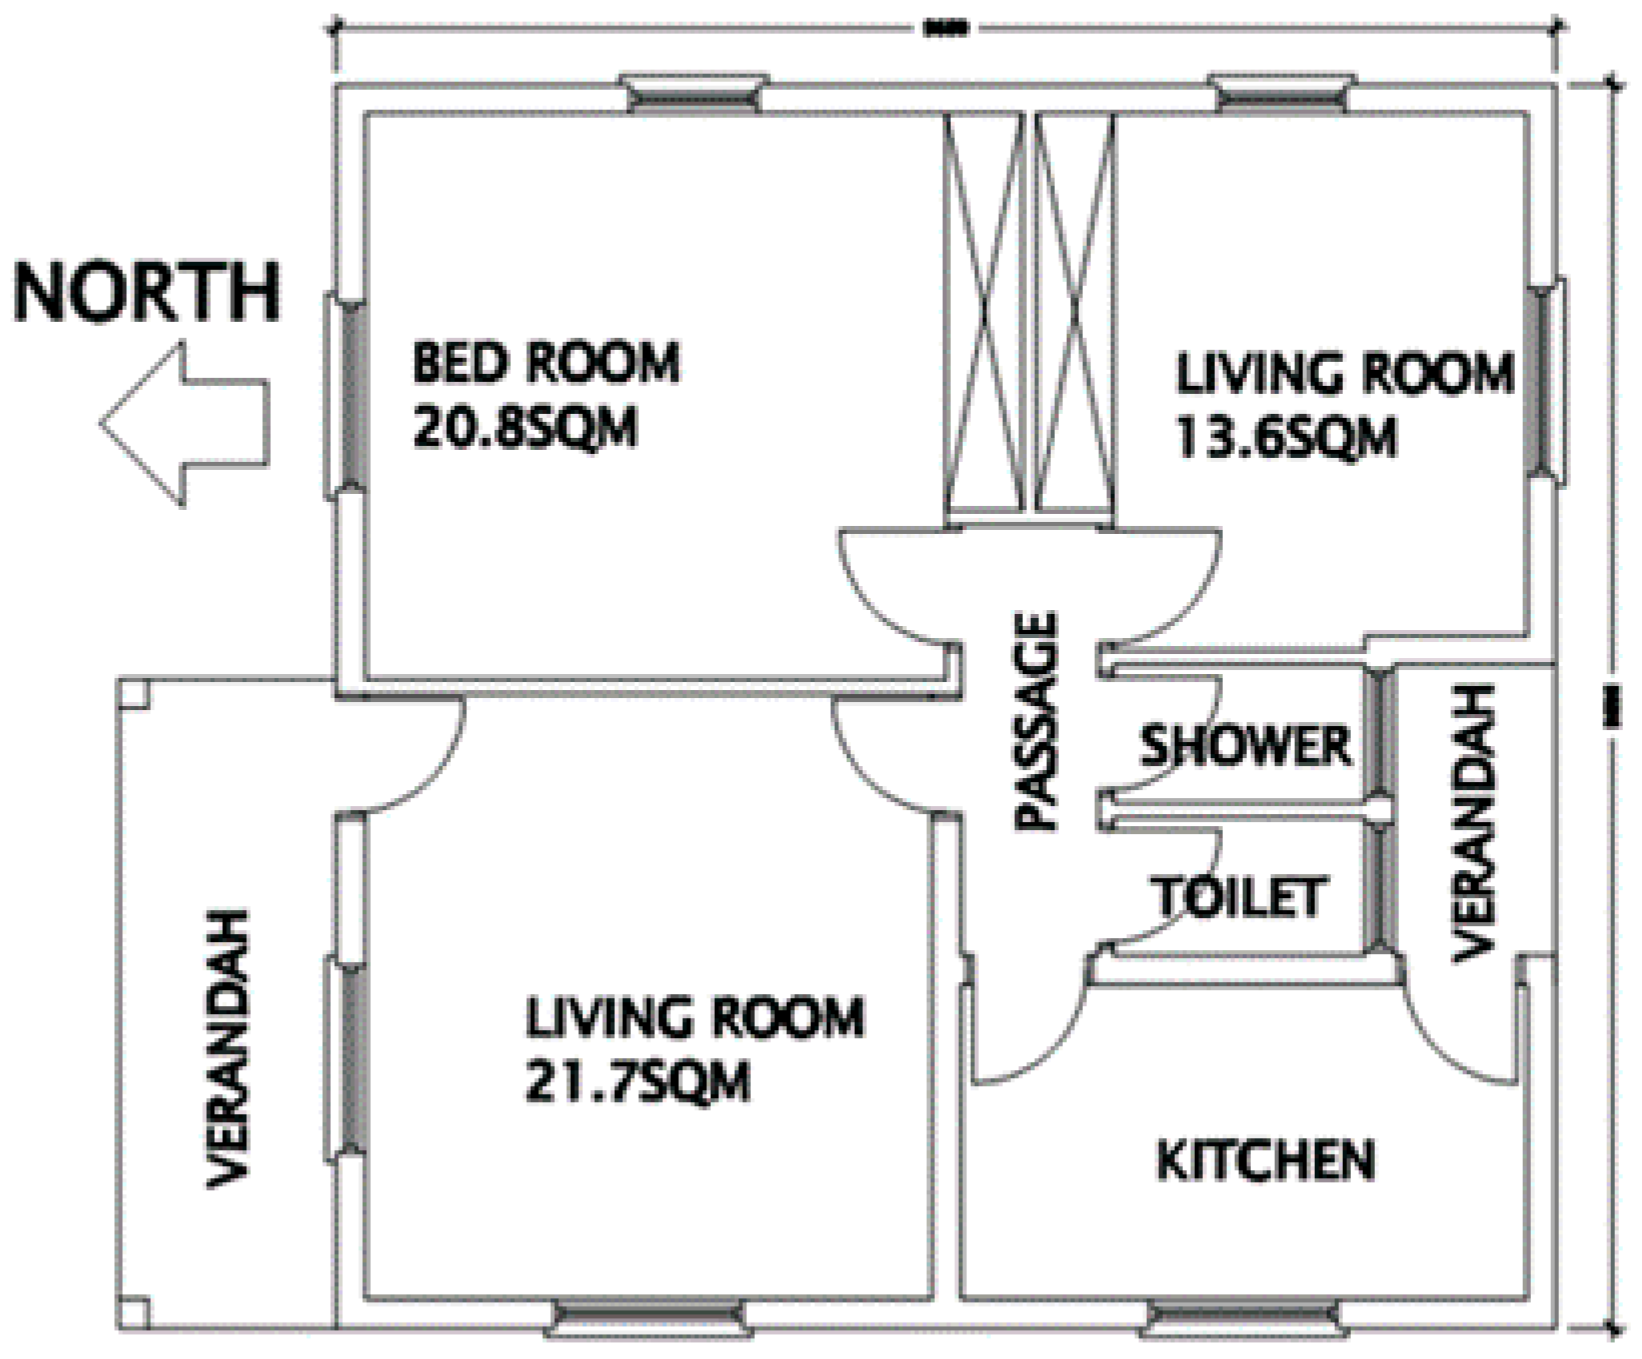
Basing on statistics regarding the size of urban households in Malawi, a building model was developed for this study to represent the typical urban residential building in Malawi as closely as possible. The model spread over a total floor area of 95.8 m2 including two bed rooms, one living room, one shower room, one toilet and one kitchen.
The typical urban residential building in Malawi is a single family dwelling unit having an average size of about five persons with two rooms for sleeping [40].
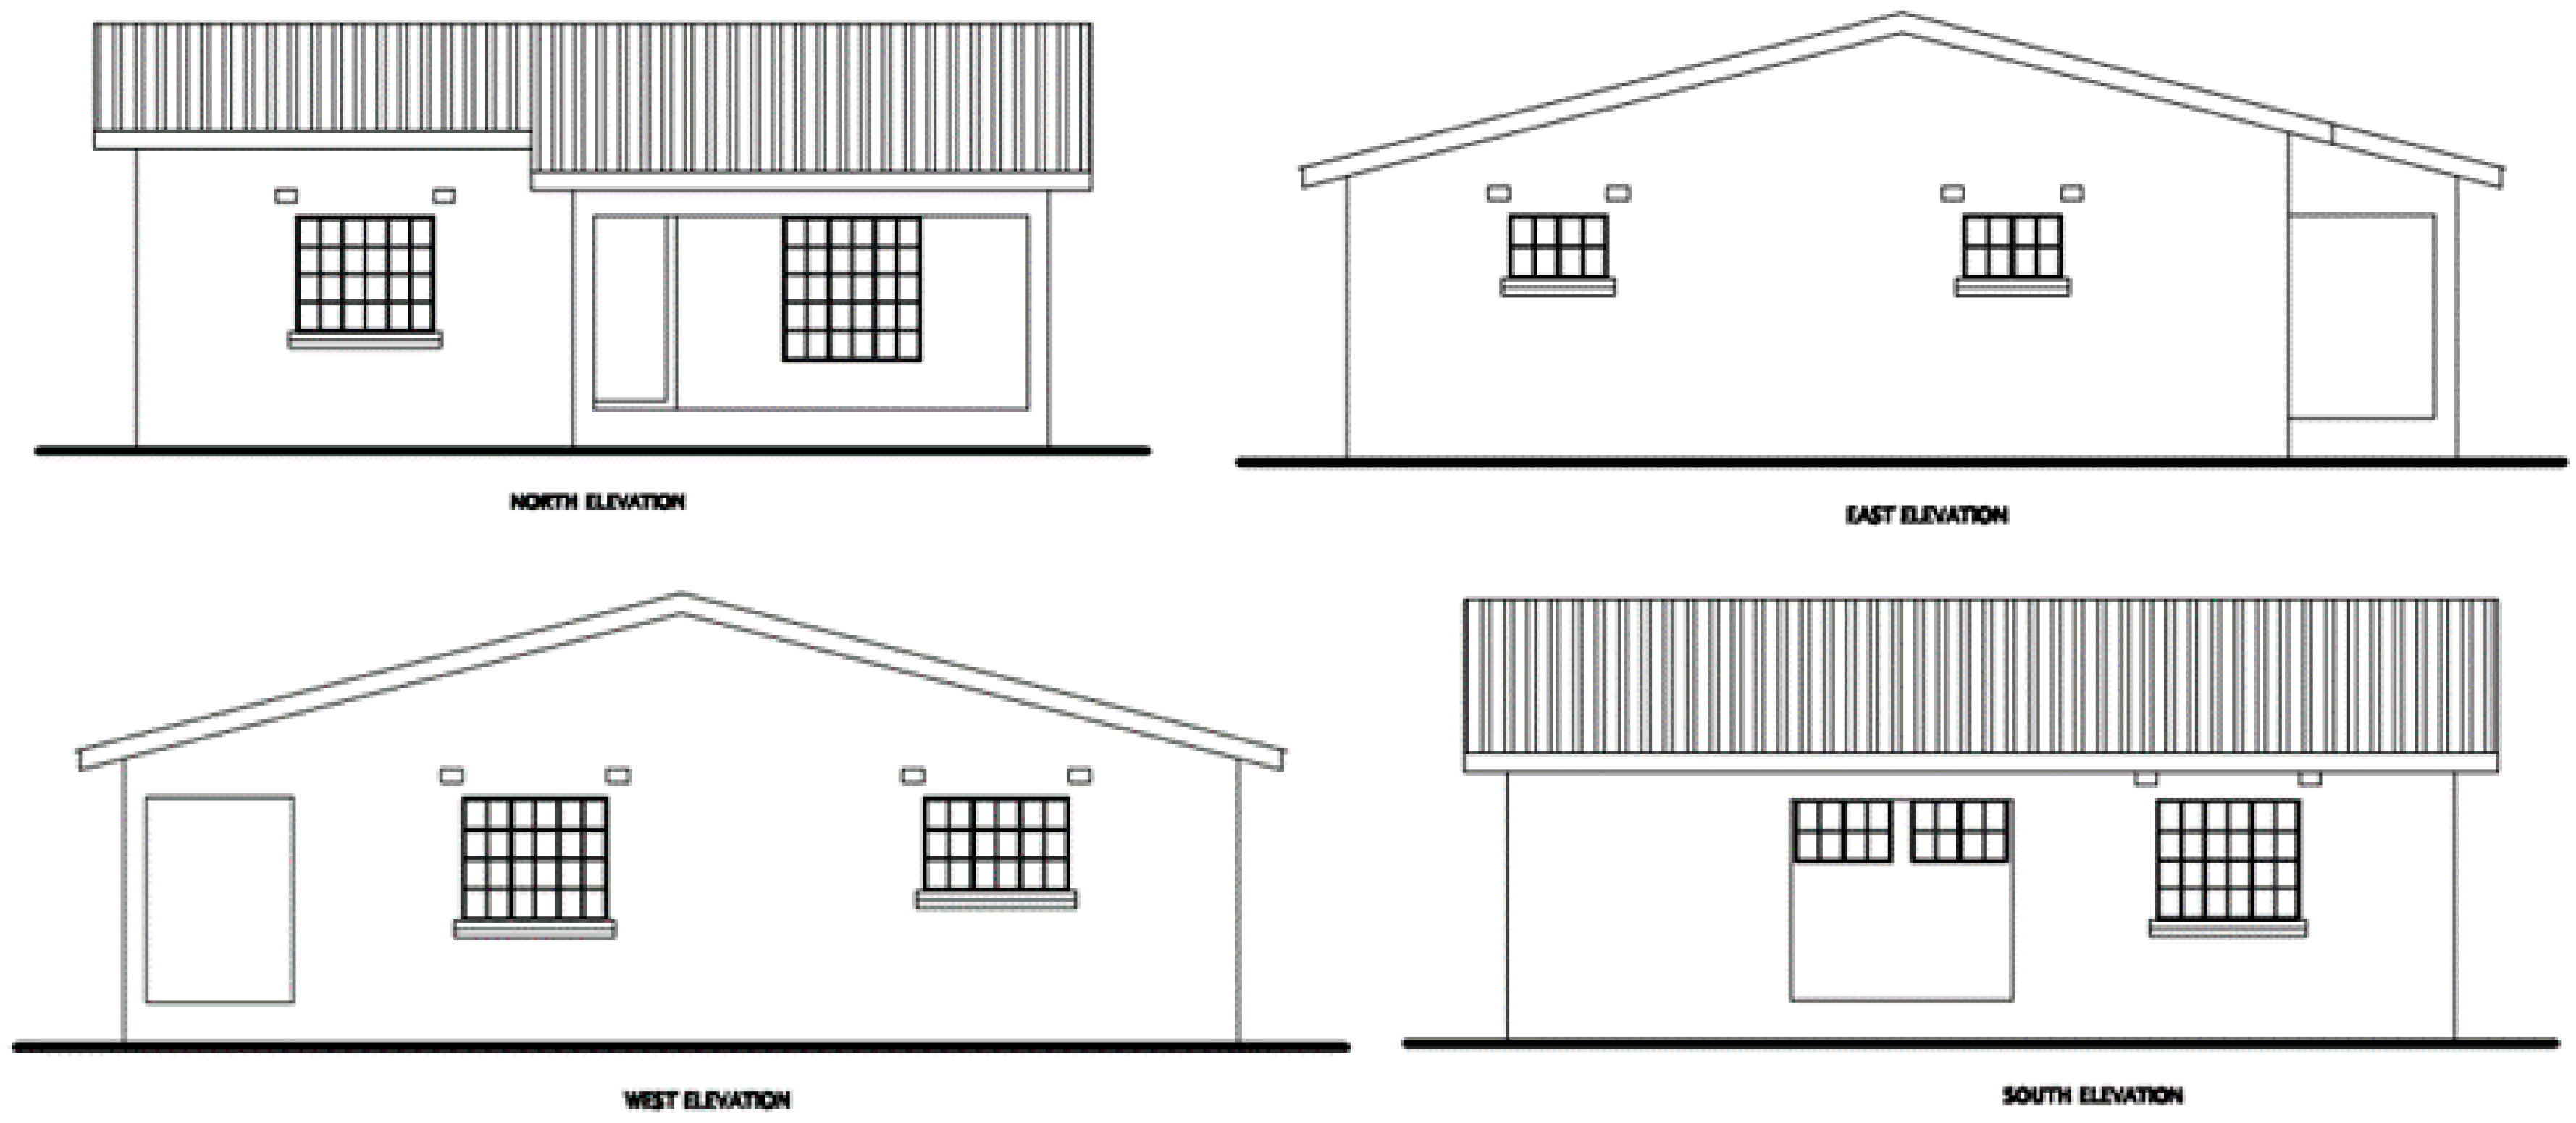
The Figure 2 below show the floor plan and elevations of the building model:
Urban residential building construction uses relatively simple materials and technologies. According to the NSO [40], the widely used construction materials are cement, unburnt bricks and iron sheets for building floors, walls and roofs respectively. Table 1 below shows the urban residential buildings’ construction materials by proportion of the urban residential building stock.
For purposes of this study, the typical urban residential building is made of mass concrete floor slabs with a thickness of 150 mm. The Walls are made of burnt bricks. Typically, the walls are solid with thicknesses of 230 mm and 115 mm for external and internal walls respectively. A 13 mm layer of sand and cement plaster is applied on the internal side of the walls. The walls are punctuated with glazed steel framed windows. Three-millimetre clear glass is used for the glazing. Two air bricks of size 215 mm × 140 mm are fixed above every window on the opposite top ends. Ceilings are made of Nulite ceiling boards. The roofs, which are mostly either gable or hipped, are made of a timber framework and covered with Iron Sheets having 0.3 mm thickness and pitches ranging from 7°–45°.
Despite the fact that unburnt bricks feature prominently in urban residential building construction, this study’s characterization of a typical residential building opts for burnt bricks on account of their superior structural capabilities. Table 2 below shows the thermal properties of the materials.
A total of seven envelope features were systematically manipulated and the impacts on the thermal performance of the buildings observed. These features included Floor Thickness, Wall R-value, Roof R-value, Window Glazing Insulation, Air Infiltration through air bricks, Wall Transparency Ratio and Window Overhang depth.
During the systematic manipulation, four levels of each of the envelope design features were studied to understand their impact on the thermal comfort conditions registered in the building models. Table 3 below shows the envelope design features and their values at each of their levels of study.
3.2. Simulation Procedures
The urban residential building under consideration in this study is a naturally ventilated building. There was not going to be any use of mechanical equipment to control the indoor thermal environment. For this reason, in the simulation control, it was expressly specified that the simulation runs were to only cater for the weather file run periods. The other calculations such as zone sizing, system sizing, plant sizing and sizing periods were not going to be necessary.
The building model was developed in the context of an urban environment. In EnergyPlus, its terrain was thus classified as being in the City.
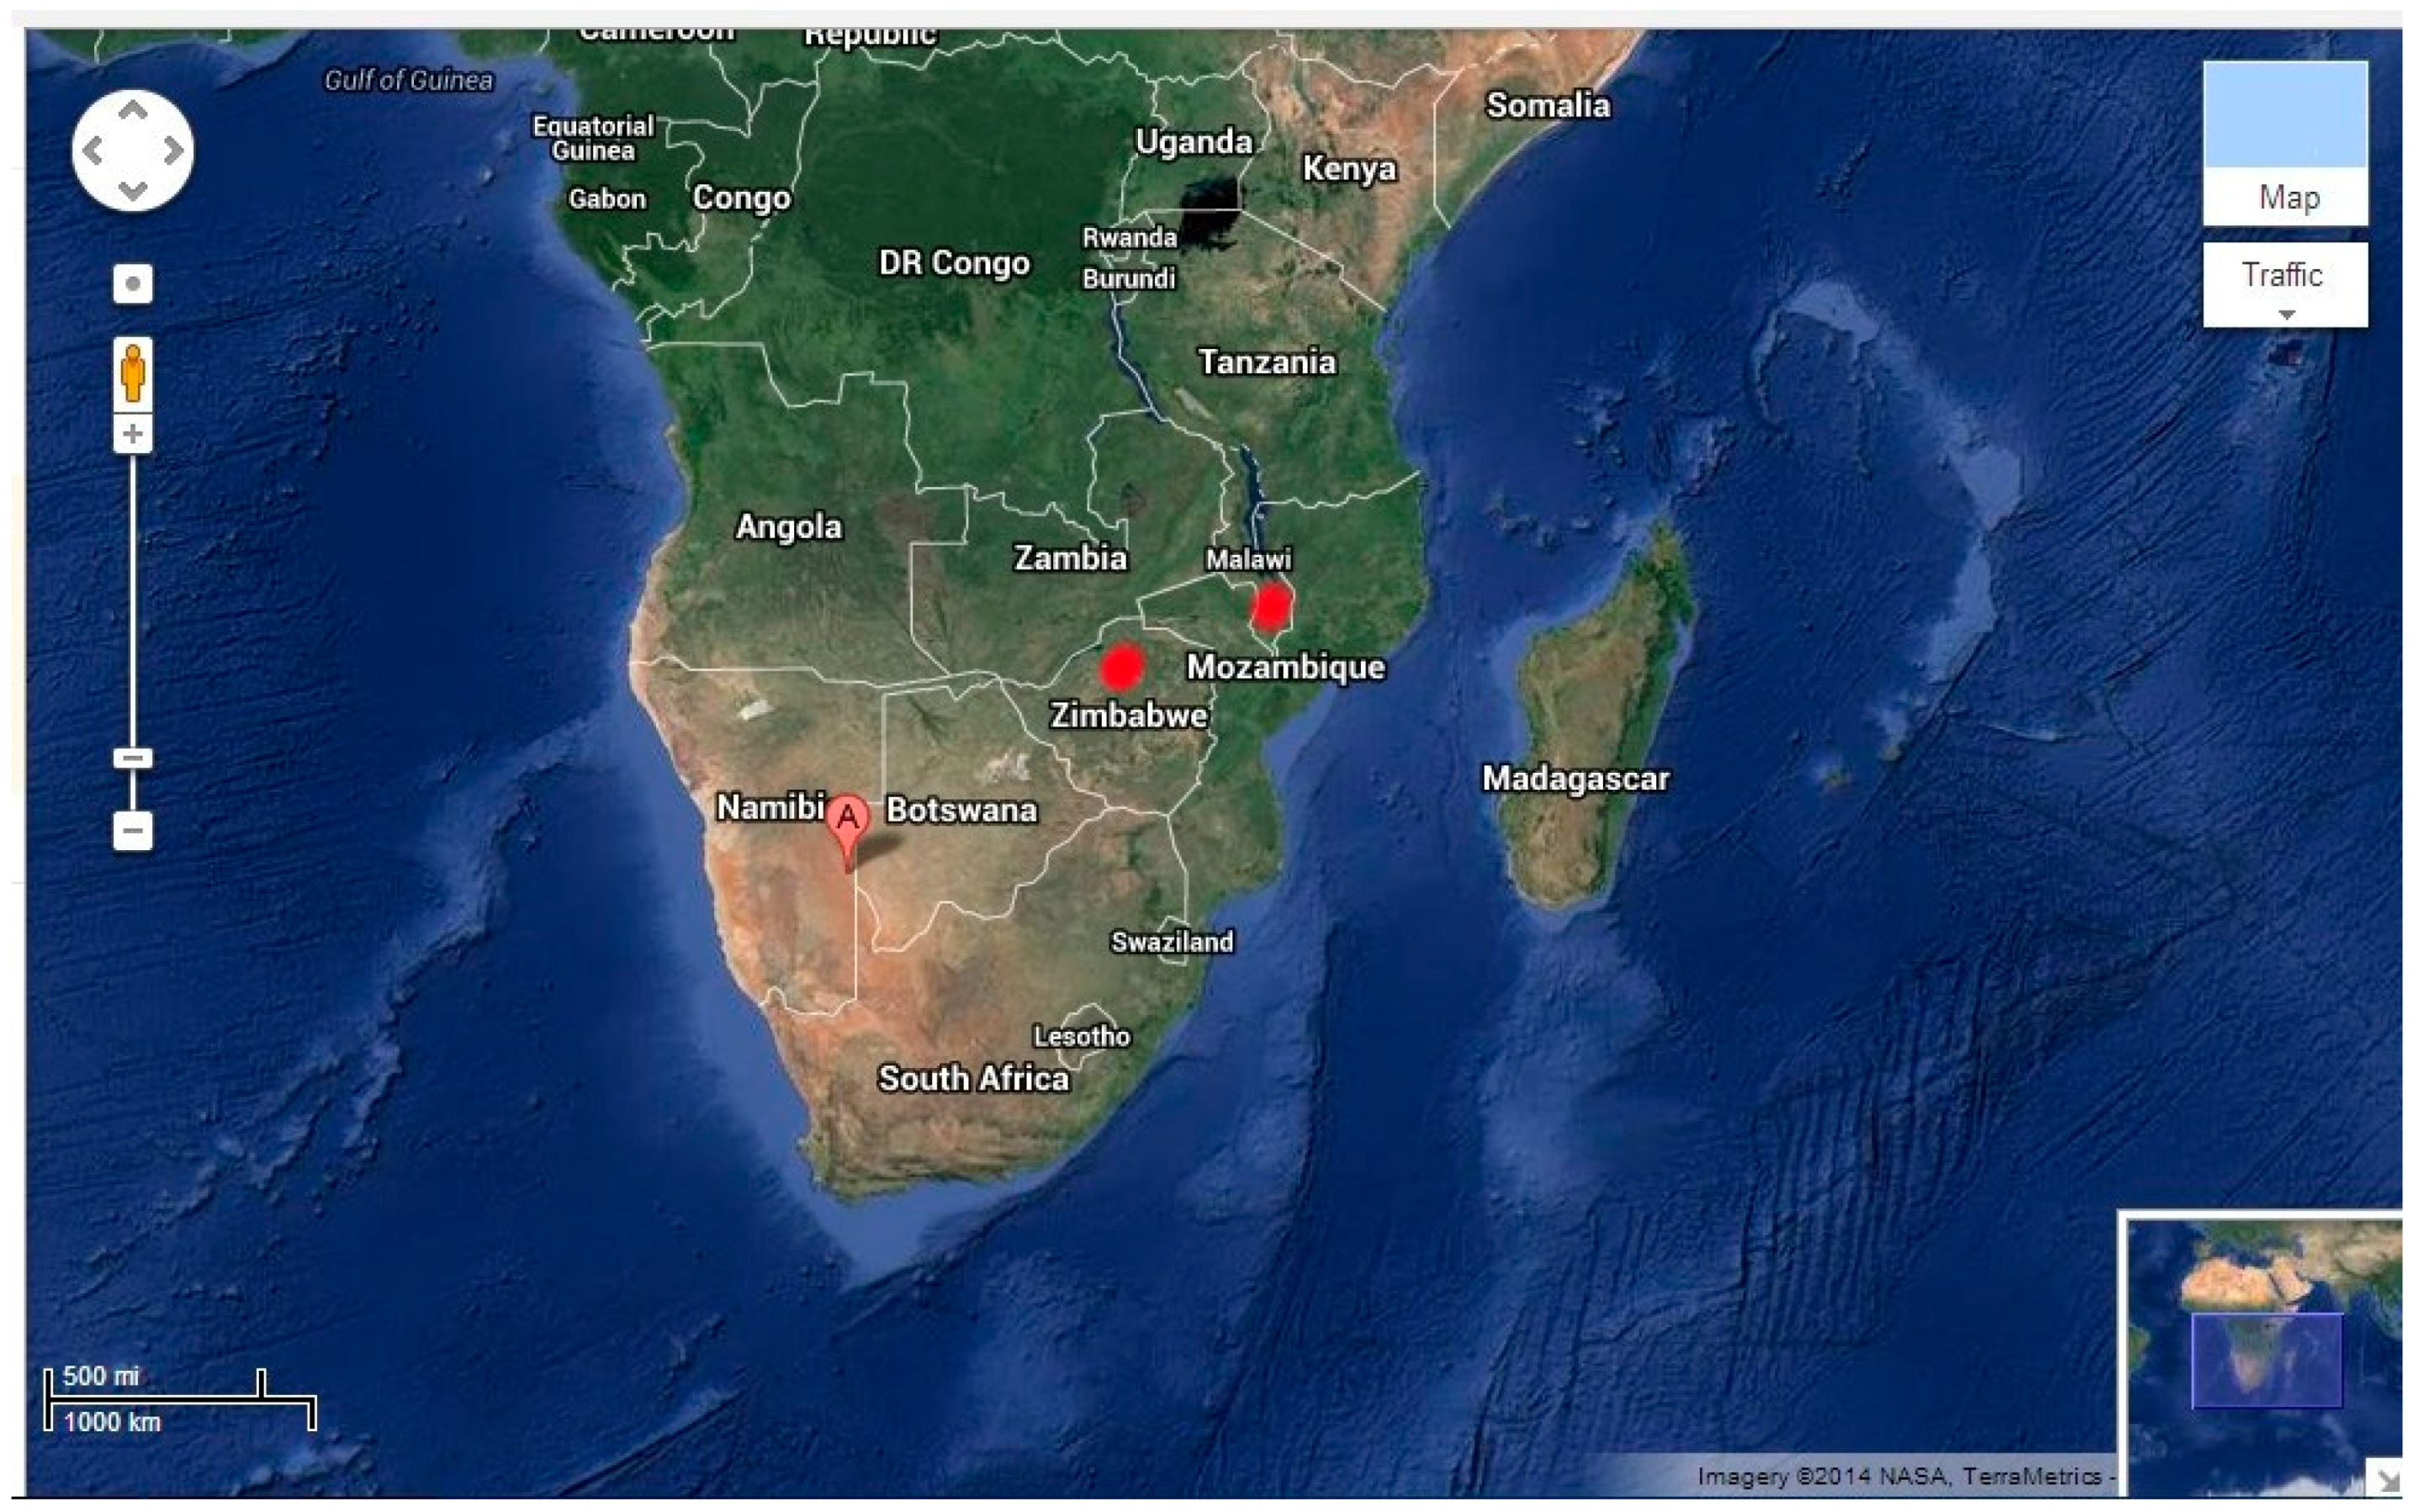
EnergyPlus requires the input of the geographical location of the model before a simulation can run. Ideally, this study’s models’ location should have been specified as being in Malawi seeing that it is grounded in that context. However, presently, there does not exist a geographical location accompanied with an EnergyPlus readable weather file from any Malawian City. Alternatively, a closer location to Malawi was then identified, one whose climatic design data is not very different from that of Malawian urban areas. This location is Harare City in Zimbabwe.
Zimbabwe is located along longitude 20°00′ S and latitude 30°00′ E. Malawi on the other hand is located along longitude 13°30′ S and latitude 34°00′ E. Figure 3 shows the geographical location of Zimbabwe in relation to Malawi.
Malawi has a sub-tropical climate characterised by a warm-wet season stretching from November to April. A relatively cold, dry season spans across May and August with temperatures falling to between 4 °C and 10 °C. A hot season stretches from September to October with average temperatures scaling up to 37 °C [42].
The climatic conditions in Zimbabwe are very similar to those of Malawi owing to the two countries’ geographical location. The ASHRAE Handbook [43] provides the consolidated climatic design information for Zimbabwe as shown in the Table 4, Table 5 and Table 6 below.
Where DB—Dry Bulb Temperature, °C, DP—Dew Point temperature, °C, WB—Wet Bulb Temperature, °C, WS—Wind Speed, m/s, Enth—Enthalpy, kJ/kg, HR—Humidity Ratio, grams of moisture per kilogram of dry air, MCDB—Mean Coincident Dry Bulb Temperature, °C, MCWB—Mean Coincident Wet Bulb Temperature, °C, MCWS—Mean Coincident Wind Speed, m/s, PCWD—Prevailing Coincident Wind Direction, °, 0 = North, 90 = East. The percentages denote annual cumulative frequency of occurrence.
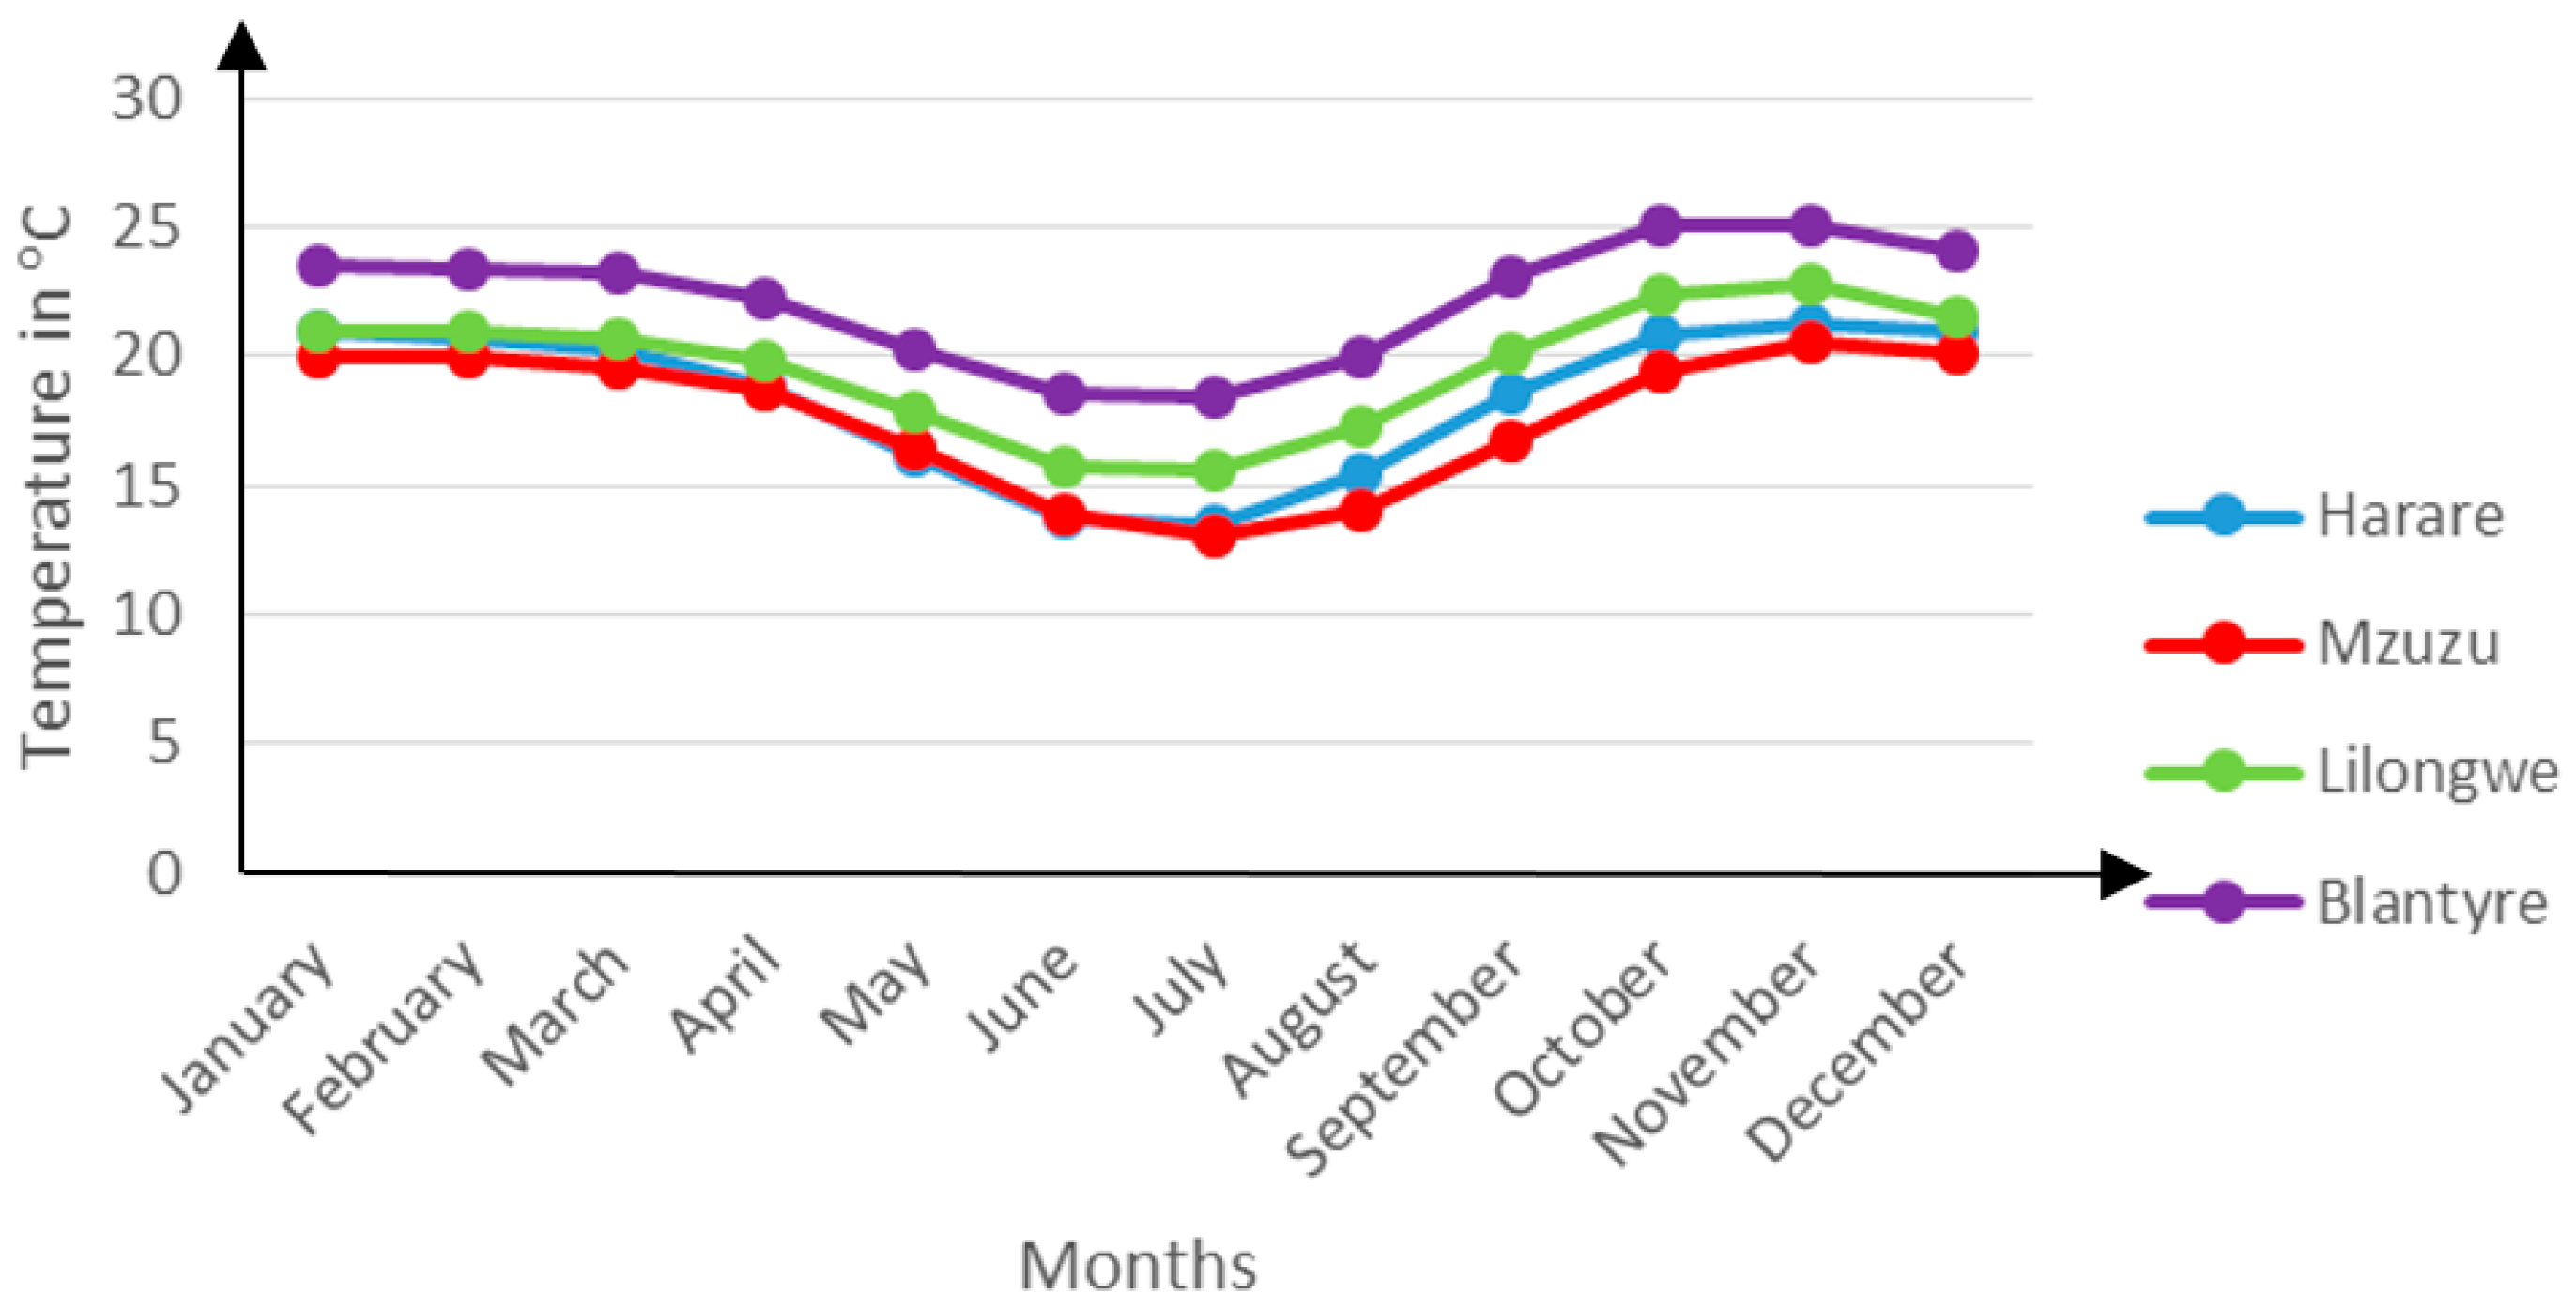
A comparison of mean monthly temperatures for Harare City in Zimbabwe and the three Malawian Cities of Mzuzu, Lilongwe and Blantyre shows of the similarity in these countries’ climatic conditions as presented in Figure 4 below.
It can be seen from the figure that the temperatures of Mzuzu and Lilongwe Cities are very close to those of Harare City in Zimbabwe. A statistical validation exercise later on in the study proved the applicability of the Harare EnergyPlus weather file for use in relation to the Malawian Cities of Mzuzu and Lilongwe.
The simulation was run across the year from 1 January through to 31 December.
In the schedule types and limits, five data types were used namely occupancy, occupant activity level, availability of facilities, temperature and finally, humidity.
The Malawi National Statistics Office [40] reports that the average household size in Malawi is 5. Basing on the household size, this study makes some key assumptions that such a household comprises of two spouses and three dependents, both the spouses belong to the working class, the three dependents are all school-attending individuals and that the entire household goes to worship on Sundays.
In Malawi, a typical working day spans across 8 h, from 08:00–17:00 or 7:30–16:30, with a break at midday. School starts at 7:30 and runs up to 15:00. Thus, during the week, the building occupancy is intermittent. Weekends are mostly for resting at home. However, many households spend the entire Saturday or Sunday mornings at places of worship. Worship services usually run from 08:00 –12:00.
The occupant activity levels were obtained from ASHRAE [44]. The activity levels that were used in this study are shown in the Table 7 below:
Compact schedules were used to describe the operation of each of the key elements in the building model including the intermittency in occupancy, occupant activity levels, equipment use, operation of window openings, lighting requirements and several other dynamics.
Choice of the model materials was based on the data gathered about the typical residential building construction in Malawi. A number of materials were used in the variations of the typical residential building model including burnt Bricks, Sand and Cement Plaster, Iron sheets, Concrete, Nulite ceiling boards, Cement Screed and others. These materials had to be changed with varying model construction requirements.
A total of seven thermal zones were created in the typical urban residential building model. They included Living Room, Bedroom 1 and 2, Kitchen, Passage, Shower and Toilet. Figure 5 below shows these thermal zones.
The green colour indicates internal boundary conditions and the blue indicates external boundary conditions.
For purposes of ensuring ease of management of the simulation environment and enhancing accuracy of results, this study zeroed in on a singly zoned model. This model had one thermal zone, the living room, which was extracted from the full model of the typical residential building. The singly zoned model is shown in Figure 6 below:
Seeing that it was a singly zoned model, all its walls took on external boundary conditions unlike the case in the full model.
However, for purposes of validating the simulation results, it was the full model that was used. This was done so as to replicate the thermal conditions in the typical residential building as closely as possible.
The internal gains in the thermal zones were attributed to the building occupants, lights and electric equipment. This model catered for a family of 4. Each room had a compact fluorescent lamp. The kitchen had an electric cooking stove, a microwave and a refrigerator. The living room had a TV screen and a mini hi-fi. The internal gains can be summarized as shown in the Table 8 below:
Using the Zone Air Flow model, it was possible to specify the various amounts of infiltration and natural ventilation flow rates through the air bricks and windows. For purposes of this study, the air flow through the air bricks was considered as infiltration. This was because the air bricks’ operational surface areas were very small in comparison to those of the windows such that it was only appropriate to consider them together with unintended openings in the building envelope through which infiltration primarily occurs. According to ASHRAE [44] the flow rate of air forced through ventilation inlet openings by wind is given by the following expression:
where: Q = Air Flow rate in m3·s−1, Cv = Effectiveness of opening, assumed to be 0.5 to 0.6 for perpendicular winds and 0.25 to 0.35 for diagonal winds, A = Free Area of inlet in m2, U = Wind Speed in m·s−1.
Q = CvAU
3.3. Experimental Validation of Simulation Model
The simulation model was experimentally validated to check its appropriateness to the climatic design conditions prevalent in Malawi. To do this, hourly temperatures were recorded from typical residential buildings selected in the three major cities in Malawi namely Mzuzu, Lilongwe and Blantyre with Köppen-Geiger climate classifications of Csb, Csa and Cwa respectively.
The recorded results were then compared to the simulated results. The ASHRAE Handbook [44], provides statistical tools for evaluating the accuracy of Indoor Air Quality predictions such that the correlation coefficient, r, of predictions and measurements should be 0.9 or greater.
In each of the three cities, an urban residential building with a characterization similar to the study’s model as described in Section 3.1, was identified. Fundamentally, the selected buildings shared four similar aspects with the study’s building model namely the envelope construction details including the element composition and materials, the occupant family size and occupancy intermittency, internal loading factors and finally, the location within the urban fabric. It is important to note that these buildings were strictly naturally ventilated.
Data loggers were then placed in four different thermal zones within the residential buildings including the Living Room, two Bedrooms, and the Kitchen. The Data loggers were placed in a generally central location within the thermal zones on raised platforms above the floor and away from direct solar insolation. These Data loggers possessed an ability to measure and store up to 32,000 temperature readings. Their temperature measurement range was −35 °C~80 °C, with an accuracy of ±0.3 °C, a resolution of 0.1 °C and a negligible long term drift.
For purposes of the validation exercise, this study was only interested in the ambient temperatures during the course of the day over a period of 15 h from 05:00 to 20:00.
The data collected from each City was then compared to the simulation results obtained for a corresponding day in EnergyPlus simulations using the model and simulation procedures described in Section 3.2. According to ASHRAE, such simulation results can only be valid if the correlation coefficient, r, is equal to or greater than 0.9.
Owing to the resource constraints, the validation exercise was only limited to readings obtained from a single zone, the Living Room zone. A more elaborate validation exercise encompassing all the readings from all the building zones may provide the subject for further research. Nonetheless, it can be said that a validation of readings from a single zone alone can inspire confidence in the results. Several studies in the past have used a single zone only for validation of results [24,45,46,47].
The correlation coefficients of results for the three cities show that the simulation model is valid for the two cities of Mzuzu and Lilongwe while that for Blantyre fails to pass the validation test. Table 9 shows the validation results.
The failure of the Blantyre City results in the validation test derives from the notable differences that exist in the climatic conditions between the City and Harare City in Zimbabwe, whose weather file was adopted for use in the simulation process. Figure 4 provided insight into this discrepancy.
3.4. Optimization Methodology
A comprehensive review of the literature showed that there are three methods that have been widely employed in building thermal design optimization research. They include Fuzzy Sets [46], Algorithms [48,49] and Orthogonal Arrays [47,50].
The present study adopted the optimization method used by [47,50] involving the use of orthogonal arrays, statistical analyses and the listing method. This optimization method was chosen on account of its affordable computational requirement as opposed to the other methodologies which despite having higher efficiencies, come with a very high computational cost.
Orthogonal arrays provide a method for designing experiments to investigate how different parameters affect the mean and variance of a process performance characteristic that defines how well the process is functioning [51]. The flow of work when using orthogonal arrays is presented in Figure 7 below:
The first task was to identify the building envelope features to be studied in the course of the research work and then set the levels at which they would be studied. Seven features were identified including Floor Thickness (FT), Wall R-value (WR), Roof R-value (RR), Glazing Insulation (GL), Ventilation Bricks Infiltration (BI), Wall Transparency Ratio (TR) and Window Overhang (WO). These features were studied at four levels in the order of diminishing R-values as presented in the Table 3.
Prior to conducting a comprehensive run of simulations to determine the optimal features, it is important to study the significance of each of the parameters towards the building’s thermal comfort performance. In order to do this, the first round of simulation runs is limited to only the highest and lowest values of the parameters. An understanding of the significance helps in determining the control levels at a later stage.
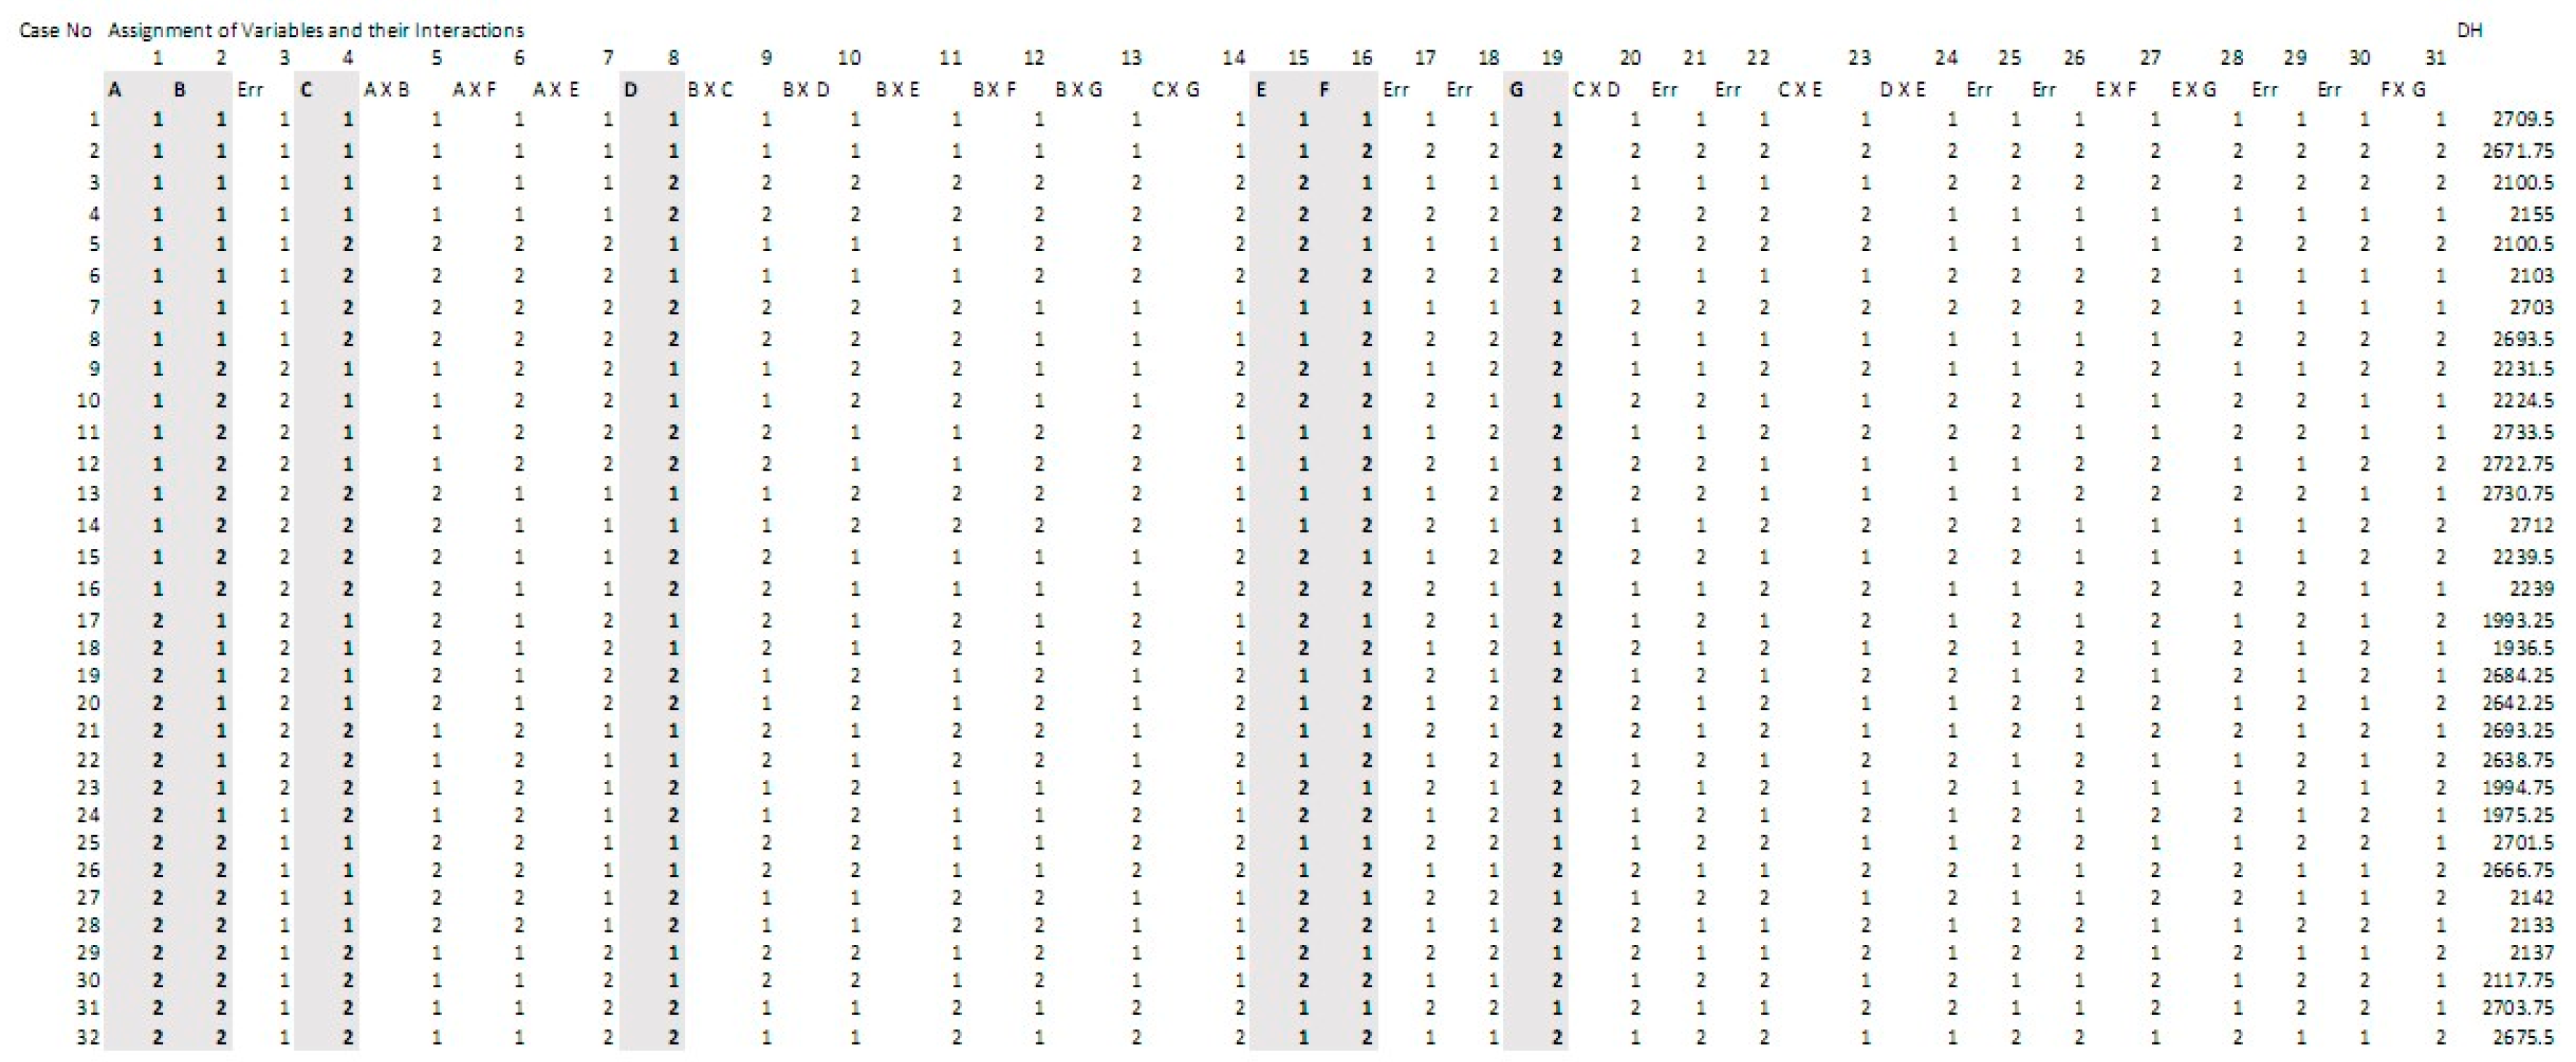
For the present study, a suitable orthogonal array was found to be the L32 array. The array was completed using the seven parameters and then simulations in EnergyPlus were conducted accordingly. The Figure A1 shows the completed L32 array.
For the purposes of this study, the optimal combination of features would be the one that yielded the least amount of discomfort hours on the building users.
Using the results from this round of simulations, an Analysis of Variance was conducted to ascertain the significance of each of the parameters and their interactions. The levels of the parameters with the least amount of registered discomfort hours were then used as the control levels for a final round of simulations where each parameter had all its four levels studied while all the others parameter values remained constrained to the control values. The combination of parameters in Case 18 registered the least amount of discomfort hours. Therefore, these values would provide the control values during the final comprehensive simulation runs.
Finally, the annual thermal behaviour registered by the optimal combination was then closely analysed to see if there could be any further improvements to it.
Analysis of Variance
The results from the first round of simulations at the highest and lowest levels were subjected to an Analysis of Variance (ANOVA). The analysis showed that of the parameters that were studied, the air infiltration through the ventilation bricks constituted the most significant parameter registering a variance ratio of 526.36. The analysis of results for the all the parameters are presented in the Table 10 below.
A summary of the discomfort hours registered at each of the two levels of the seven parameters is provided in Table 11 below.
The parameter levels registering the minimum amount of discomfort hours were then adopted as control levels for the next round of simulations which were planned using the listing method. These levels can be seen where the discomfort hours are in bold face in the table above. Using the listing method, the next round of simulations was then planned as presented in the Table 12 below.
The simulation results showed that the combination of features in Case 5 yielded the least amount of discomfort hours. For the purpose of this study, this combination would be the optimal set of envelope design features. This combination was singled out and then closely analysed to examine any potential for further development which could yield even lesser discomfort hours.
4. Results and Analysis
The study was particularly interested in two sets of data namely the monthly mean zonal temperatures and the total annual zonal discomfort hours. This section provides an analysis of each of the 22 simulation cases which were planned using the listing method.
4.1. Monthly Mean Zonal Temperature
Each zone in the building model is characterized by different thermal environmental conditions depending on a number of parameters including the building envelope configuration and composition and the zonal thermal loads. The EnergyPlus simulation engine works out the monthly mean temperatures for each of the building model zones. For purposes of thermal comfort research, it is very important to understand the impact of varying envelope compositions on the indoor temperature values.
4.2. Annual Zonal Discomfort Hours
This set of data provides the sum of hours during which building occupants report discomfort with the internal environment. During this time, the internal thermal environment falls short of the adaptive comfort acceptability requirements as set by ASHRAE Standard 55 [52]. The ASHRAE Standard 55 defines thermal comfort as a condition of mind which expresses satisfaction with the thermal environment being dependent primarily on six factors namely metabolic rate, clothing insulation, air temperature, radiant temperature, air speed and humidity.
This study aimed at optimizing the building envelope composition to achieve lower annual discomfort hours.
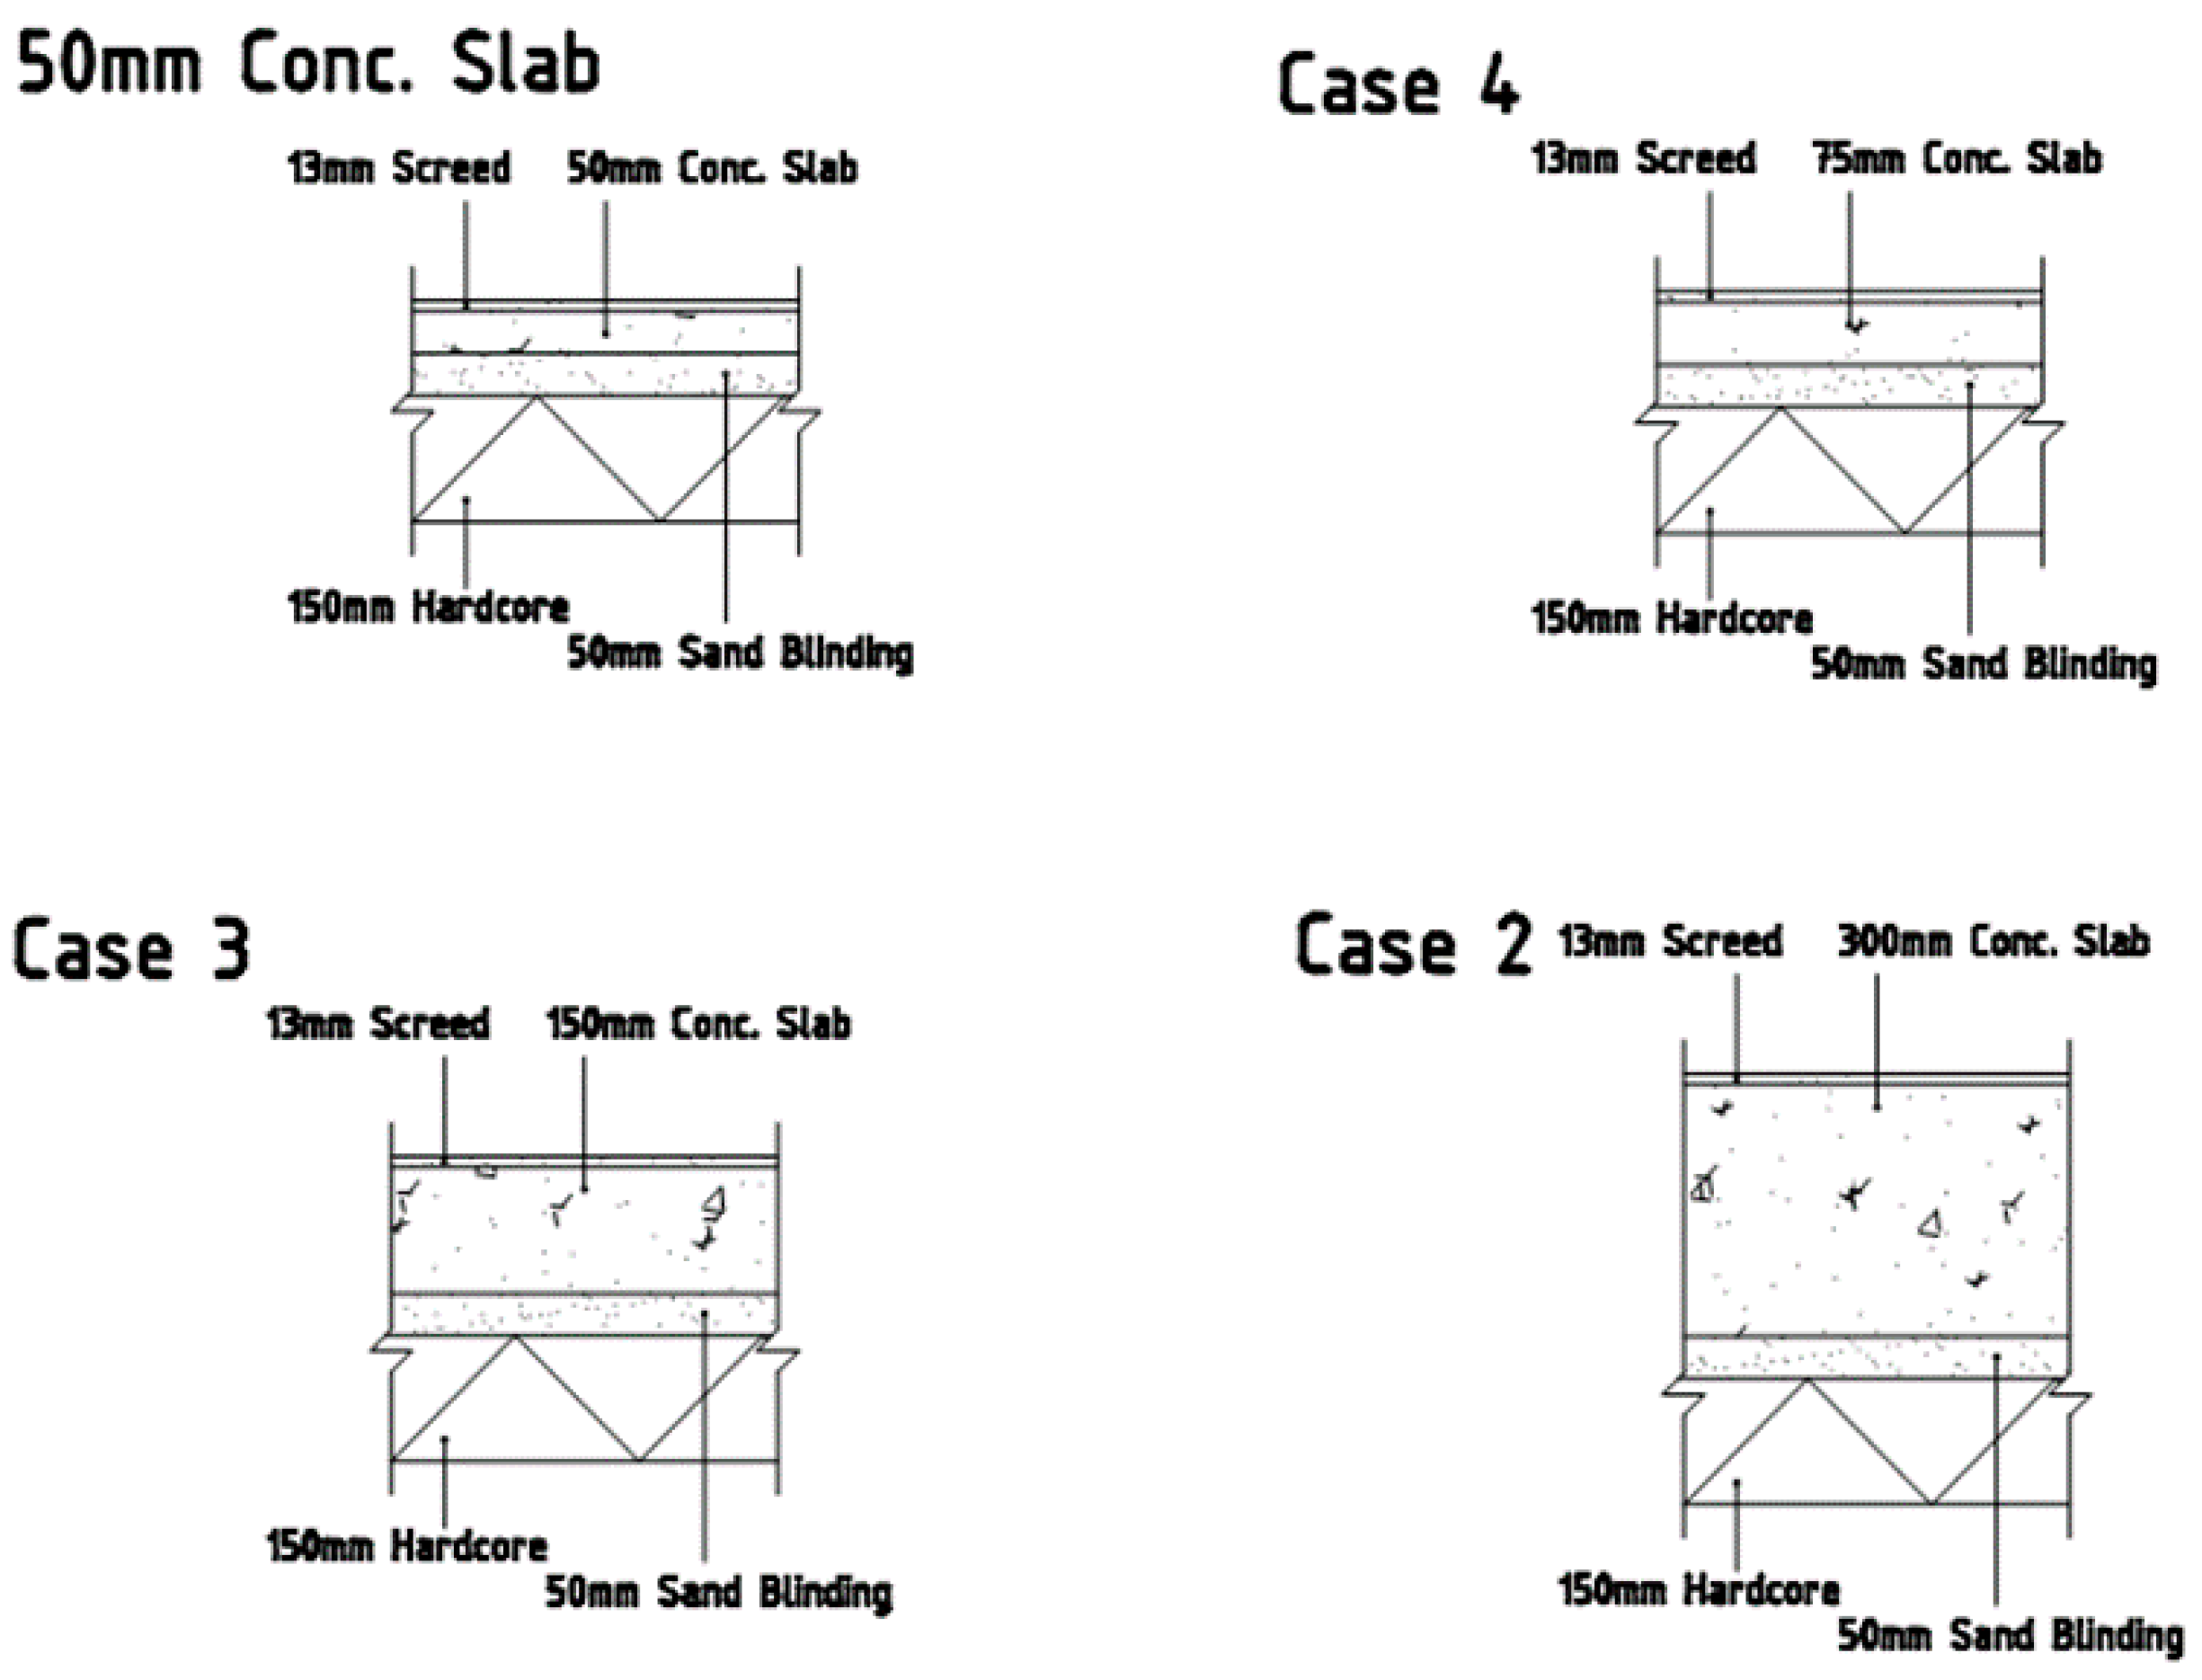
4.3. Impact of Varying Floor Thickness
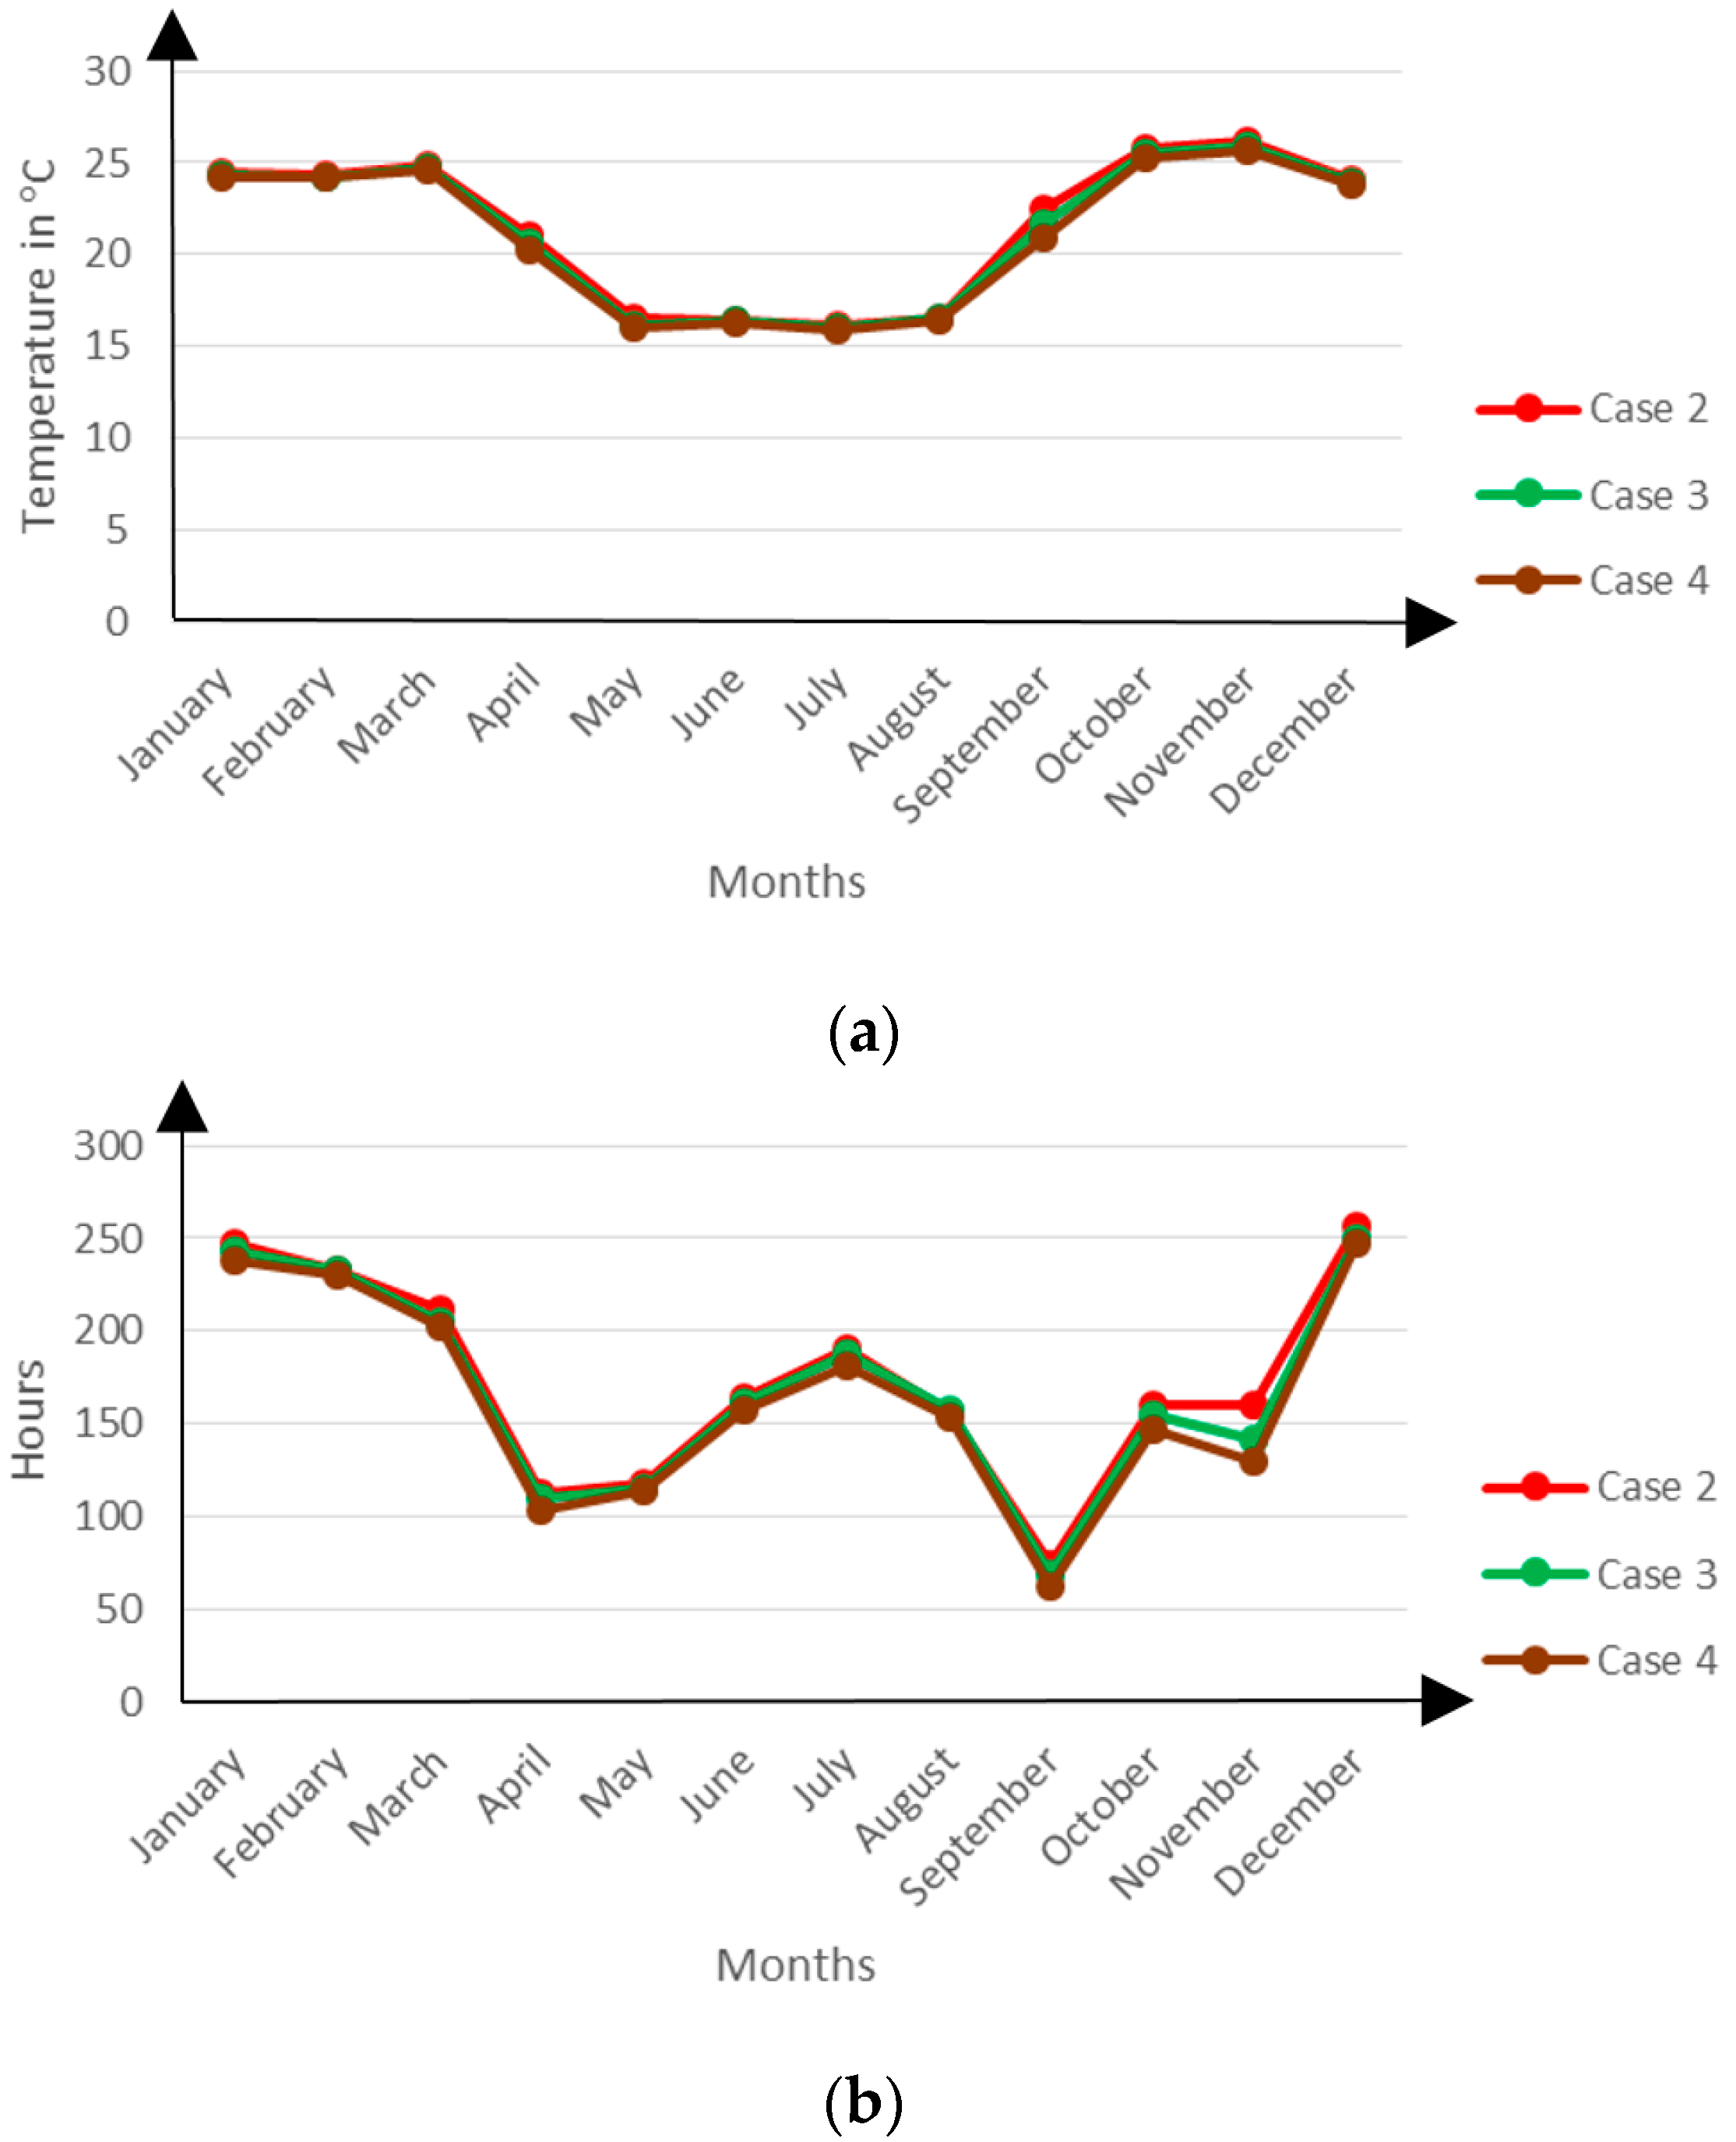
Cases 2, 3 and 4 model the impact of varying the floor thickness between 300 mm, 150 mm and 75 mm respectively. In all of these instances, the floor material is mass concrete which is in contact with the ground. The envelope configuration for these cases is provided in Figure A2.
The simulation results show that Case 4 having a floor thickness of 75 mm registers the lowest monthly mean zonal temperatures and the least amount of discomfort hours while Case 2 registers the highest values of all the three model variations as presented in Figure 8 below:
The results seem to suggest that the substantial thermal mass of the concrete floor in Case 2 works to the disadvantage of the building’s thermal performance. For the most part of the year, the ground is at a lower temperature than the building’s indoor space, hovering at about 18 °C. This means that there exists a temperature gradient towards the ground.
As outdoor temperatures begin to drop in March with the onset of the winter season, it can be seen that Case 4 begins to register markedly lower indoor temperatures than the other two Cases. This can be attributed to its lower thermal mass which renders it very susceptible to temperature variations between the indoor space and the ground. Around this time, as the indoor environment remains warmer than the ground, Case 4 readily loses much of the indoor heat to the ground. On the other hand, Cases 2 and 3 on account of their substantial thermal mass, can only lose this heat very slowly.
Between the months of May and August, the indoor temperatures for all the Cases remain almost constantly the same. This period is the height of the winter season. The indoor temperatures are so low that they are almost in equilibrium with the ground temperature thus effectively levelling out the temperature gradient.
Between August and March, the temperature gradient develops yet again and the thermal mass effect continues to characterize Case 4 with the lower indoor temperatures.
In Malawi where the winter season is only brief, lower indoor temperatures are almost synonymous with comfort conditions. This explains the diminishing discomfort hours in the periods around the winter season. At the height of the winter season however, the lower temperatures are perceived as being too cold and thus uncomfortable.
In general, Case 4 registers the least amount of discomfort hours because it maintains lower temperatures for much of the warmer time during the year.
4.4. Impact of Varying Wall R-Value
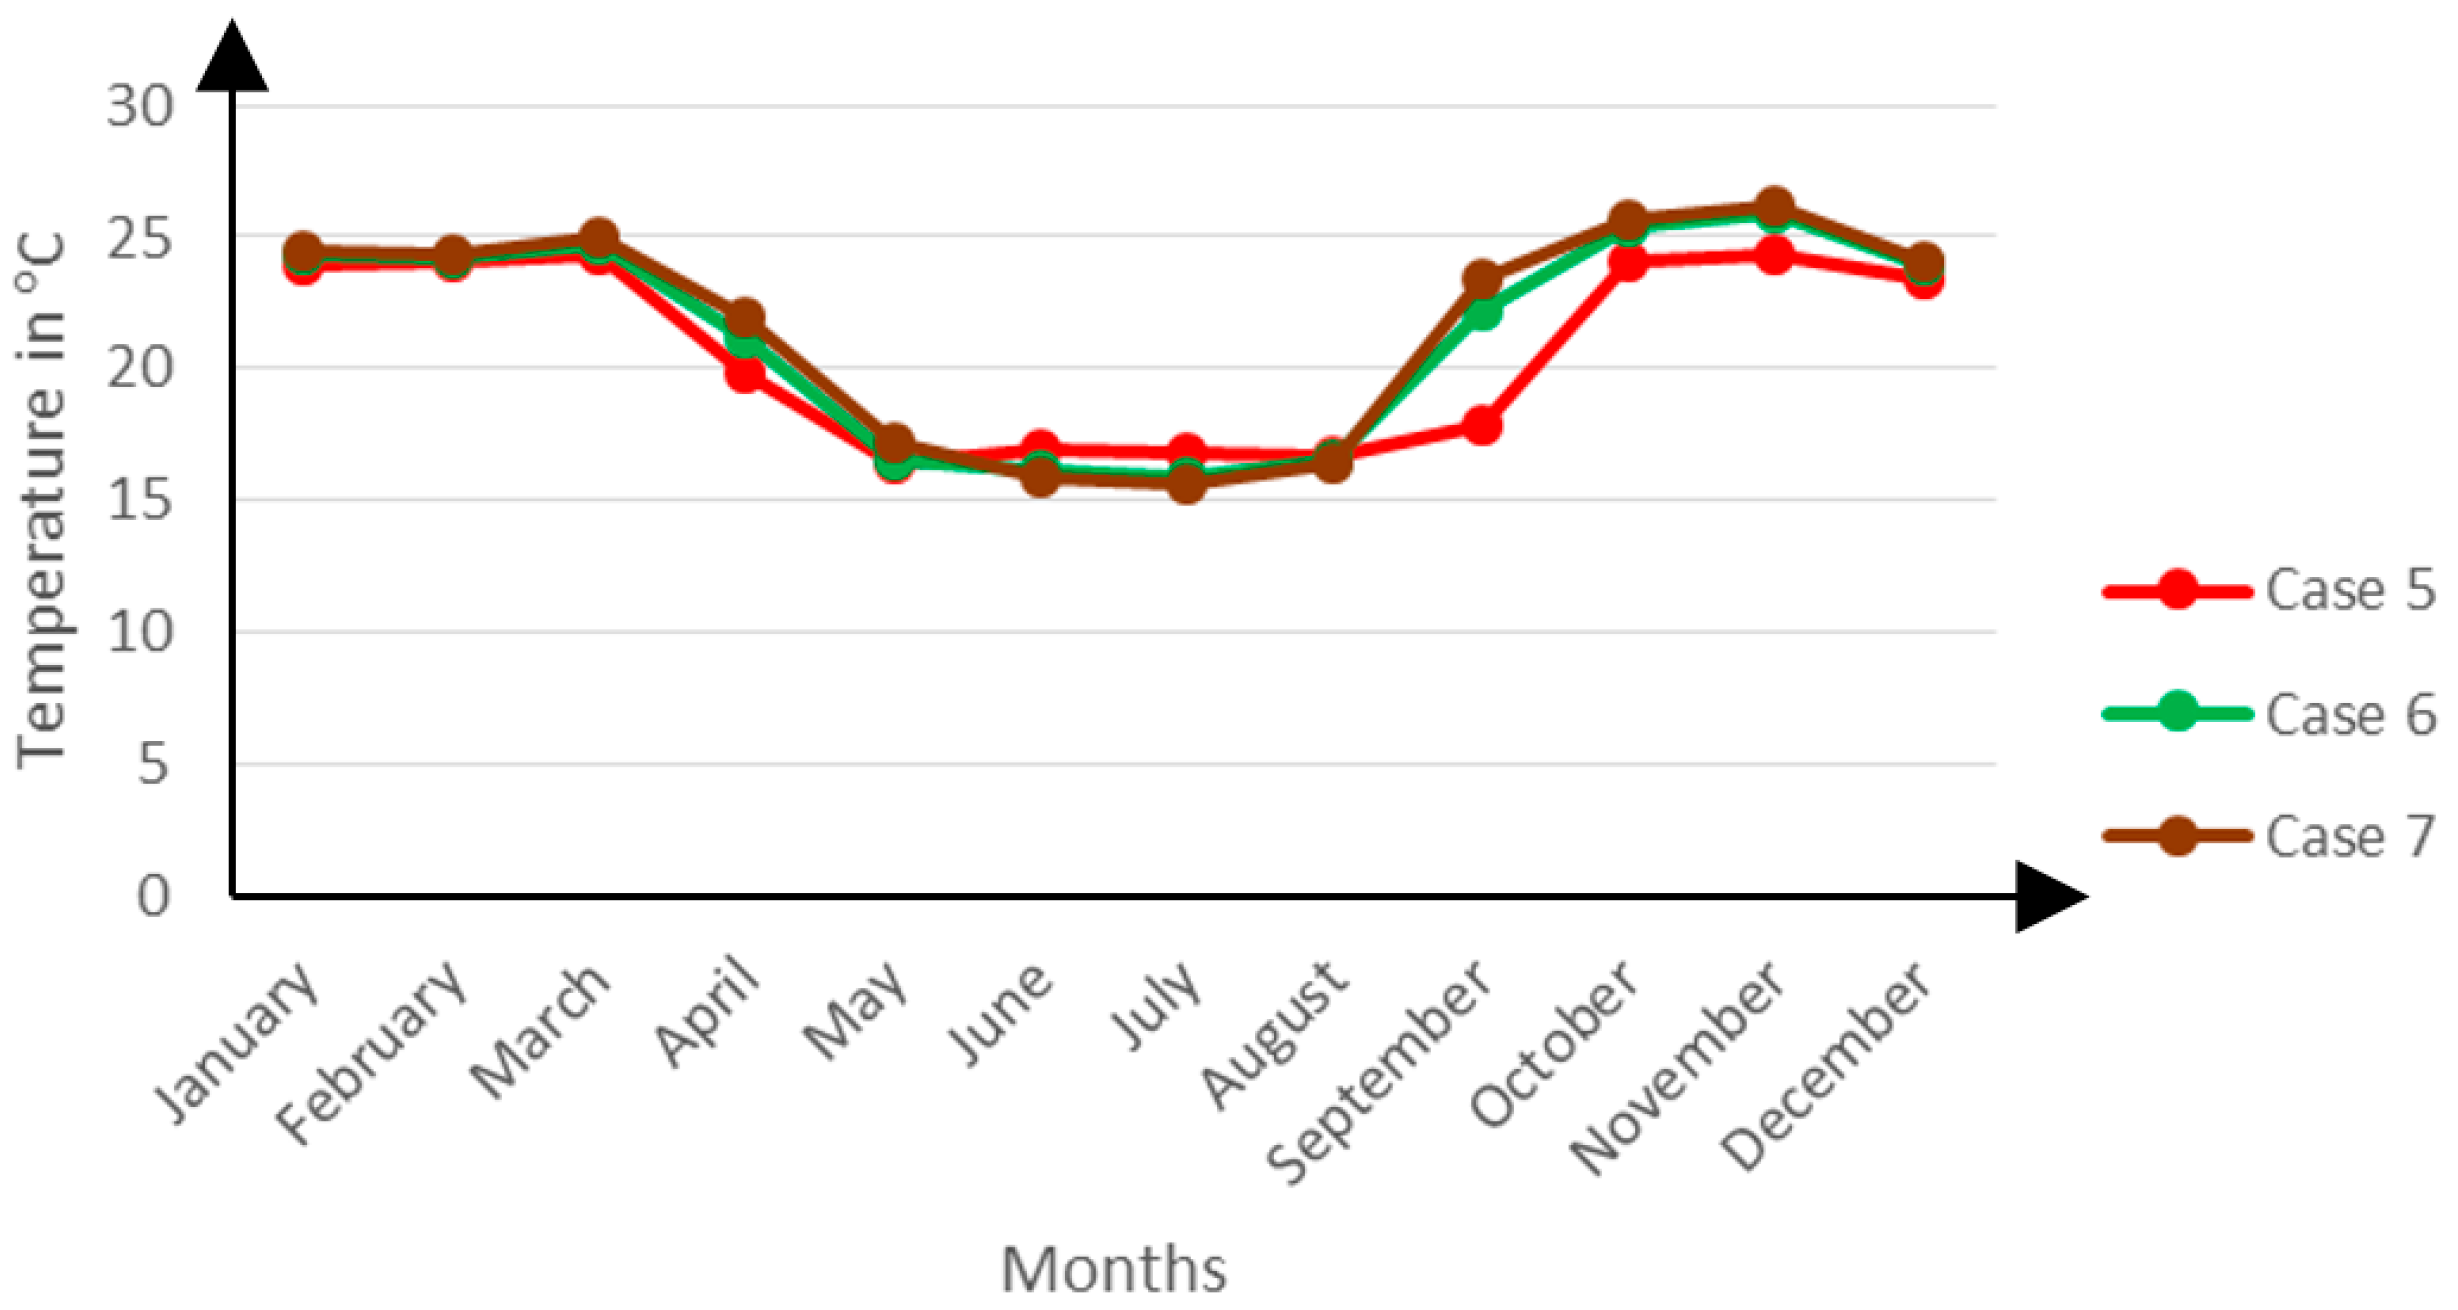
The impact of varying the wall R-value is modelled in Cases 5, 6 and 7 where different envelope material combinations yield different insulation capacities. The envelope of Case 5 is made of a double brick wall with external EPS insulation. Case 6 is fitted with a single brick wall envelope and Case 7 has a concrete wall. The construction details of these envelopes are presented in Figure A3.
Results from the simulations show that Case 5 generally registers the lowest mean zonal temperatures during the warmer months and highest temperatures during the colder months as shown in Figure 9 below:
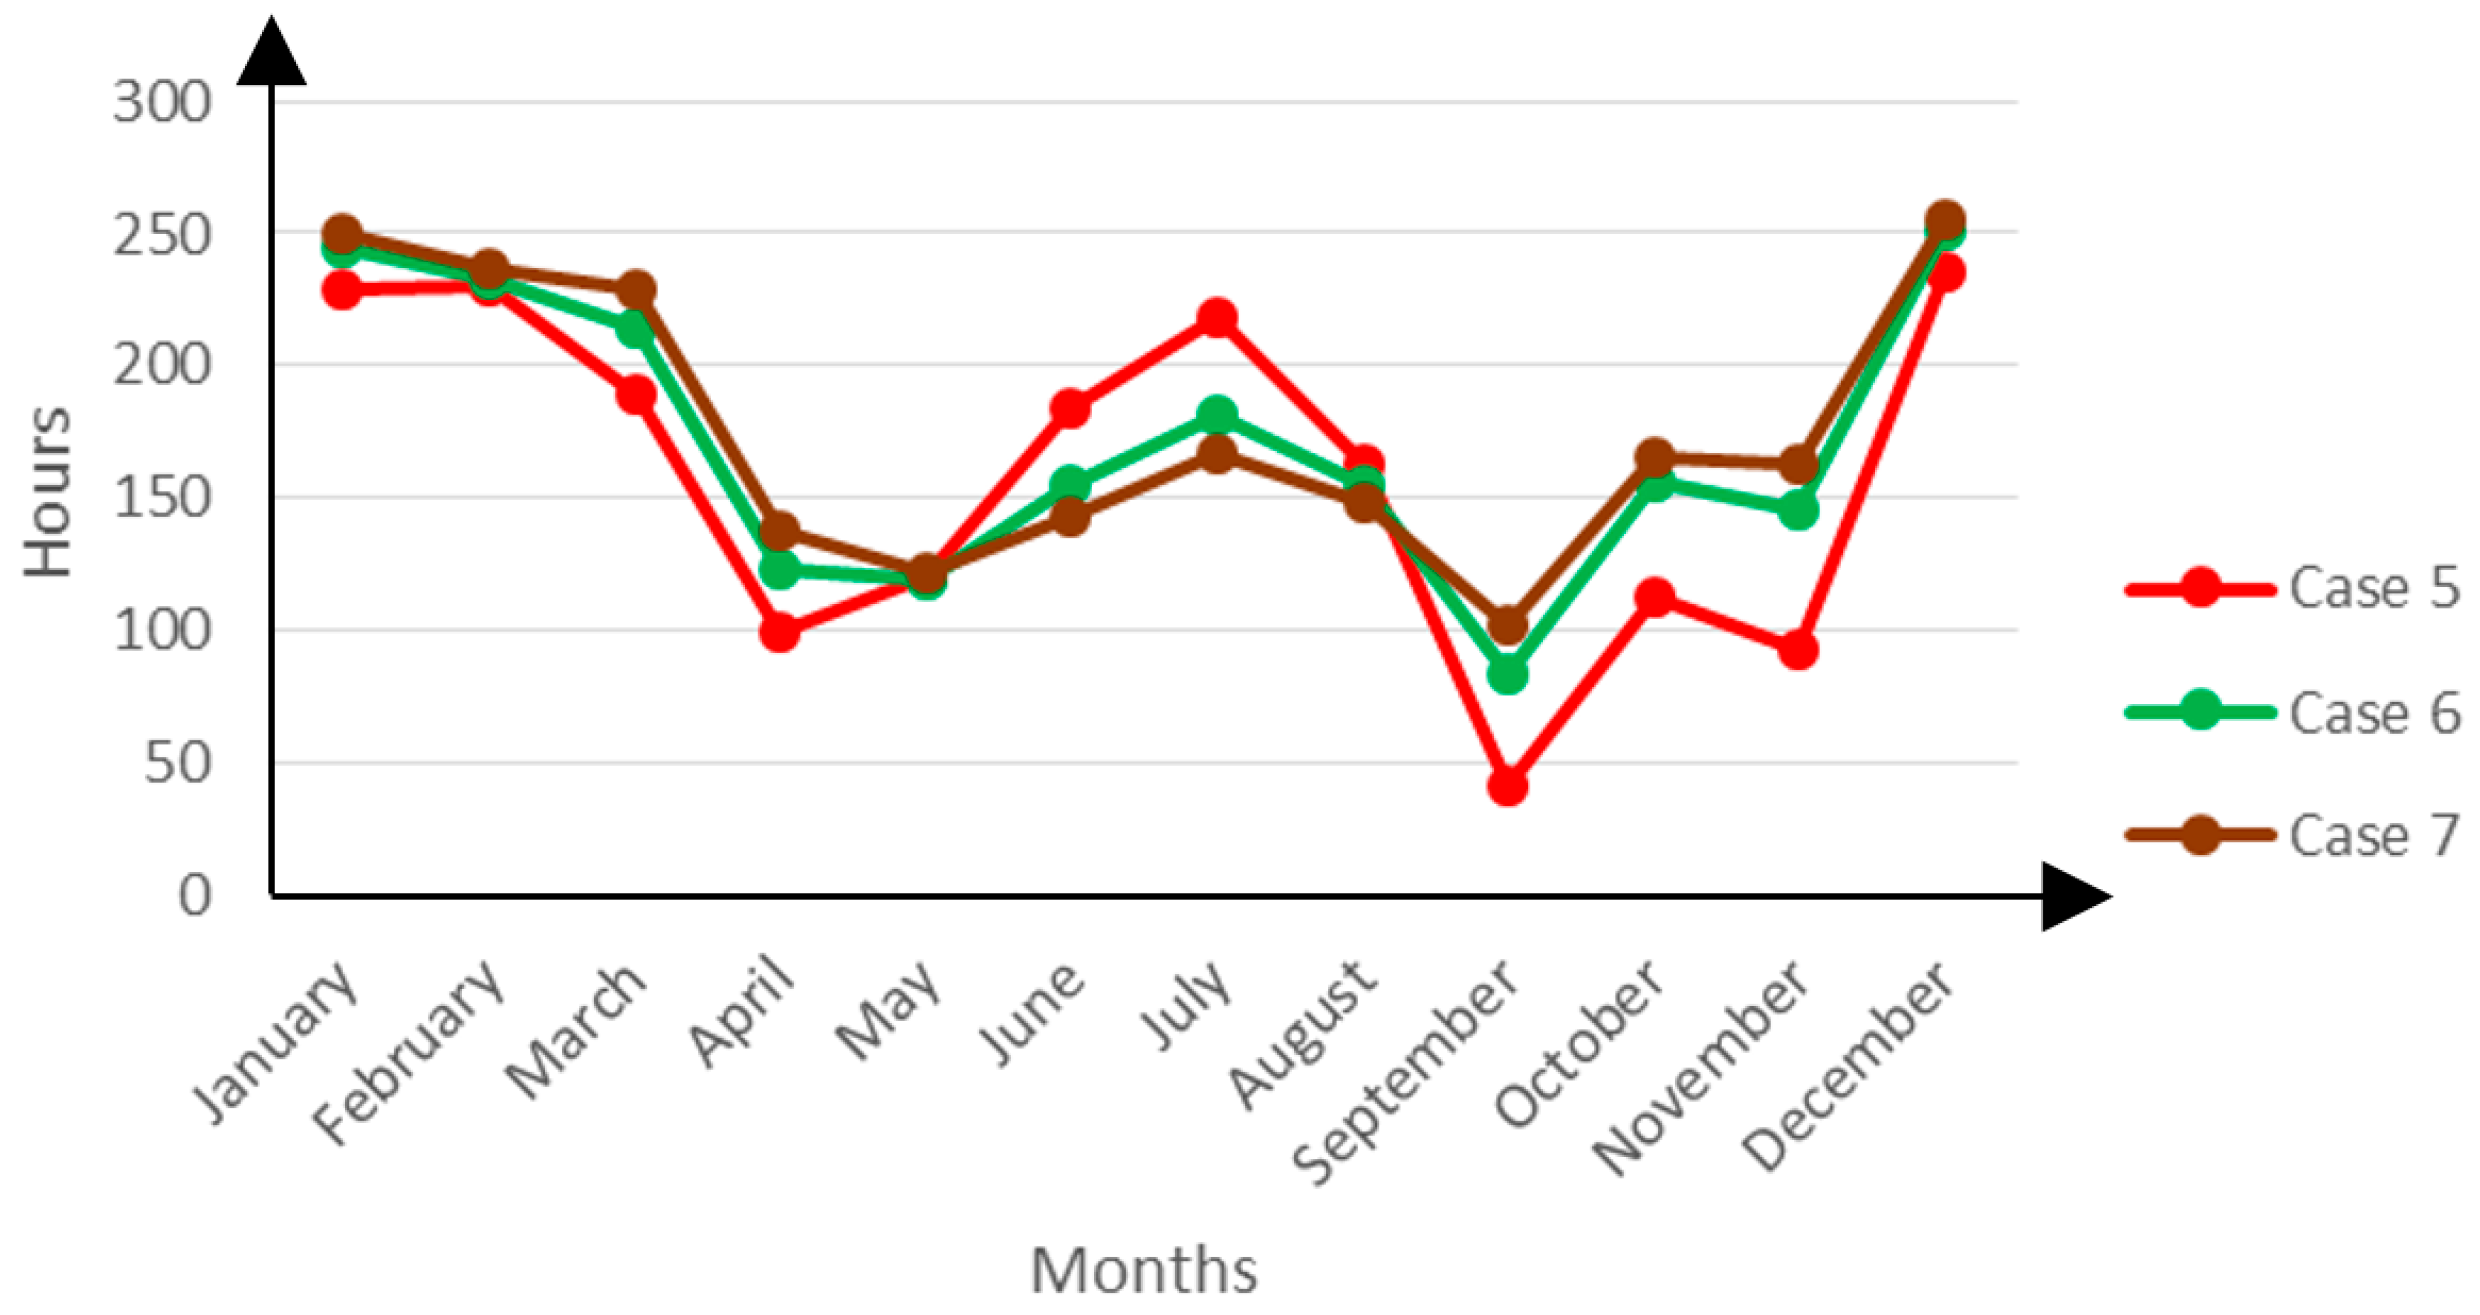
The EPS insulation and higher thermal mass prevent the passage of heat into the indoor environment during the warmer periods. In winter, when the outdoor environment is warmer during the day time and colder during night time, this works to prevent both the passage of outdoor heat into the indoor space and the escape of indoor generated heat towards the outdoor environment. This explains the lowest discomfort hours for the summer periods, which ironically peak above those of the other two Cases in winter as shown in Figure 10 below:
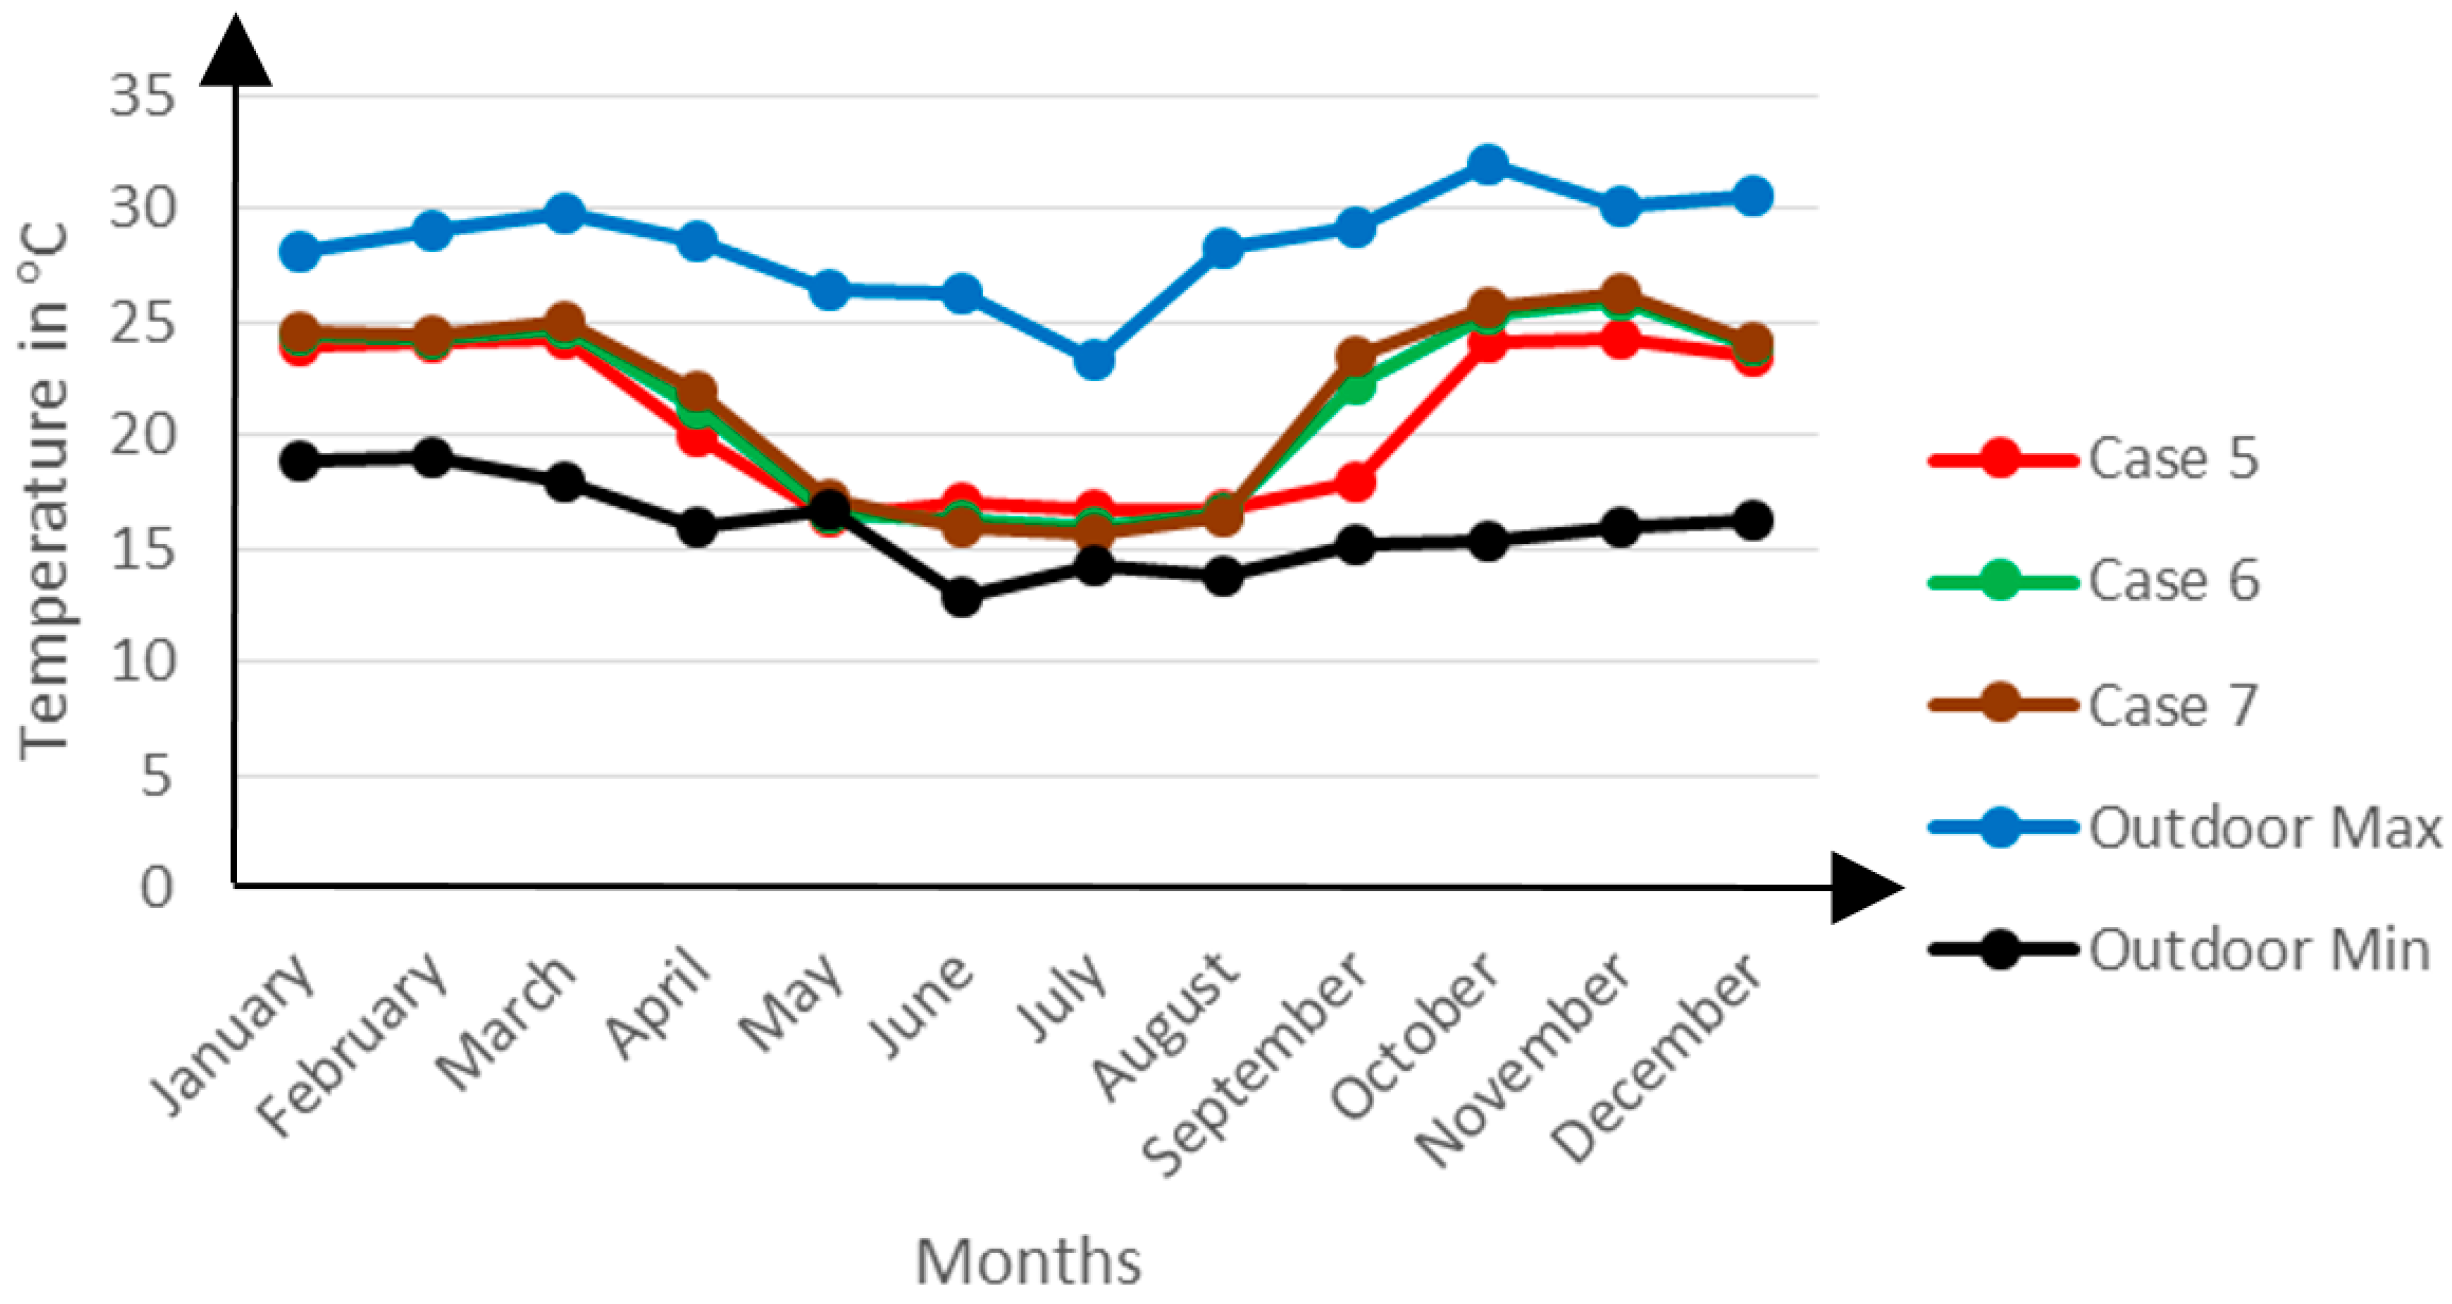
During the daytime, the outdoor temperature rises above the indoor temperature and thus a temperature gradient exists towards the indoor environment. A comparison of the indoor and outdoor temperatures is shown in Figure 11 below:
However, the insulation and high thermal mass in Case 5 ensures that no such gradient exists. Consequently, as the other Cases warm up as a result of this temperature gradient, Case 5 continues to remain colder than the outdoor environment and registers higher discomfort hours, relying only on the heat generated indoors, which during night time, it prevents from escaping outwards, a thing which might cumulatively explain the higher mean temperatures for this Case. This internally generated heat is not sufficient to moderate the discomfort hours in Case 5 during the winter season.
On the other hand, much as the day time constitutes a smaller fraction of the total occupied time, the other cases make good use of the day time warmer outdoor environmental conditions to moderate their discomfort hours.
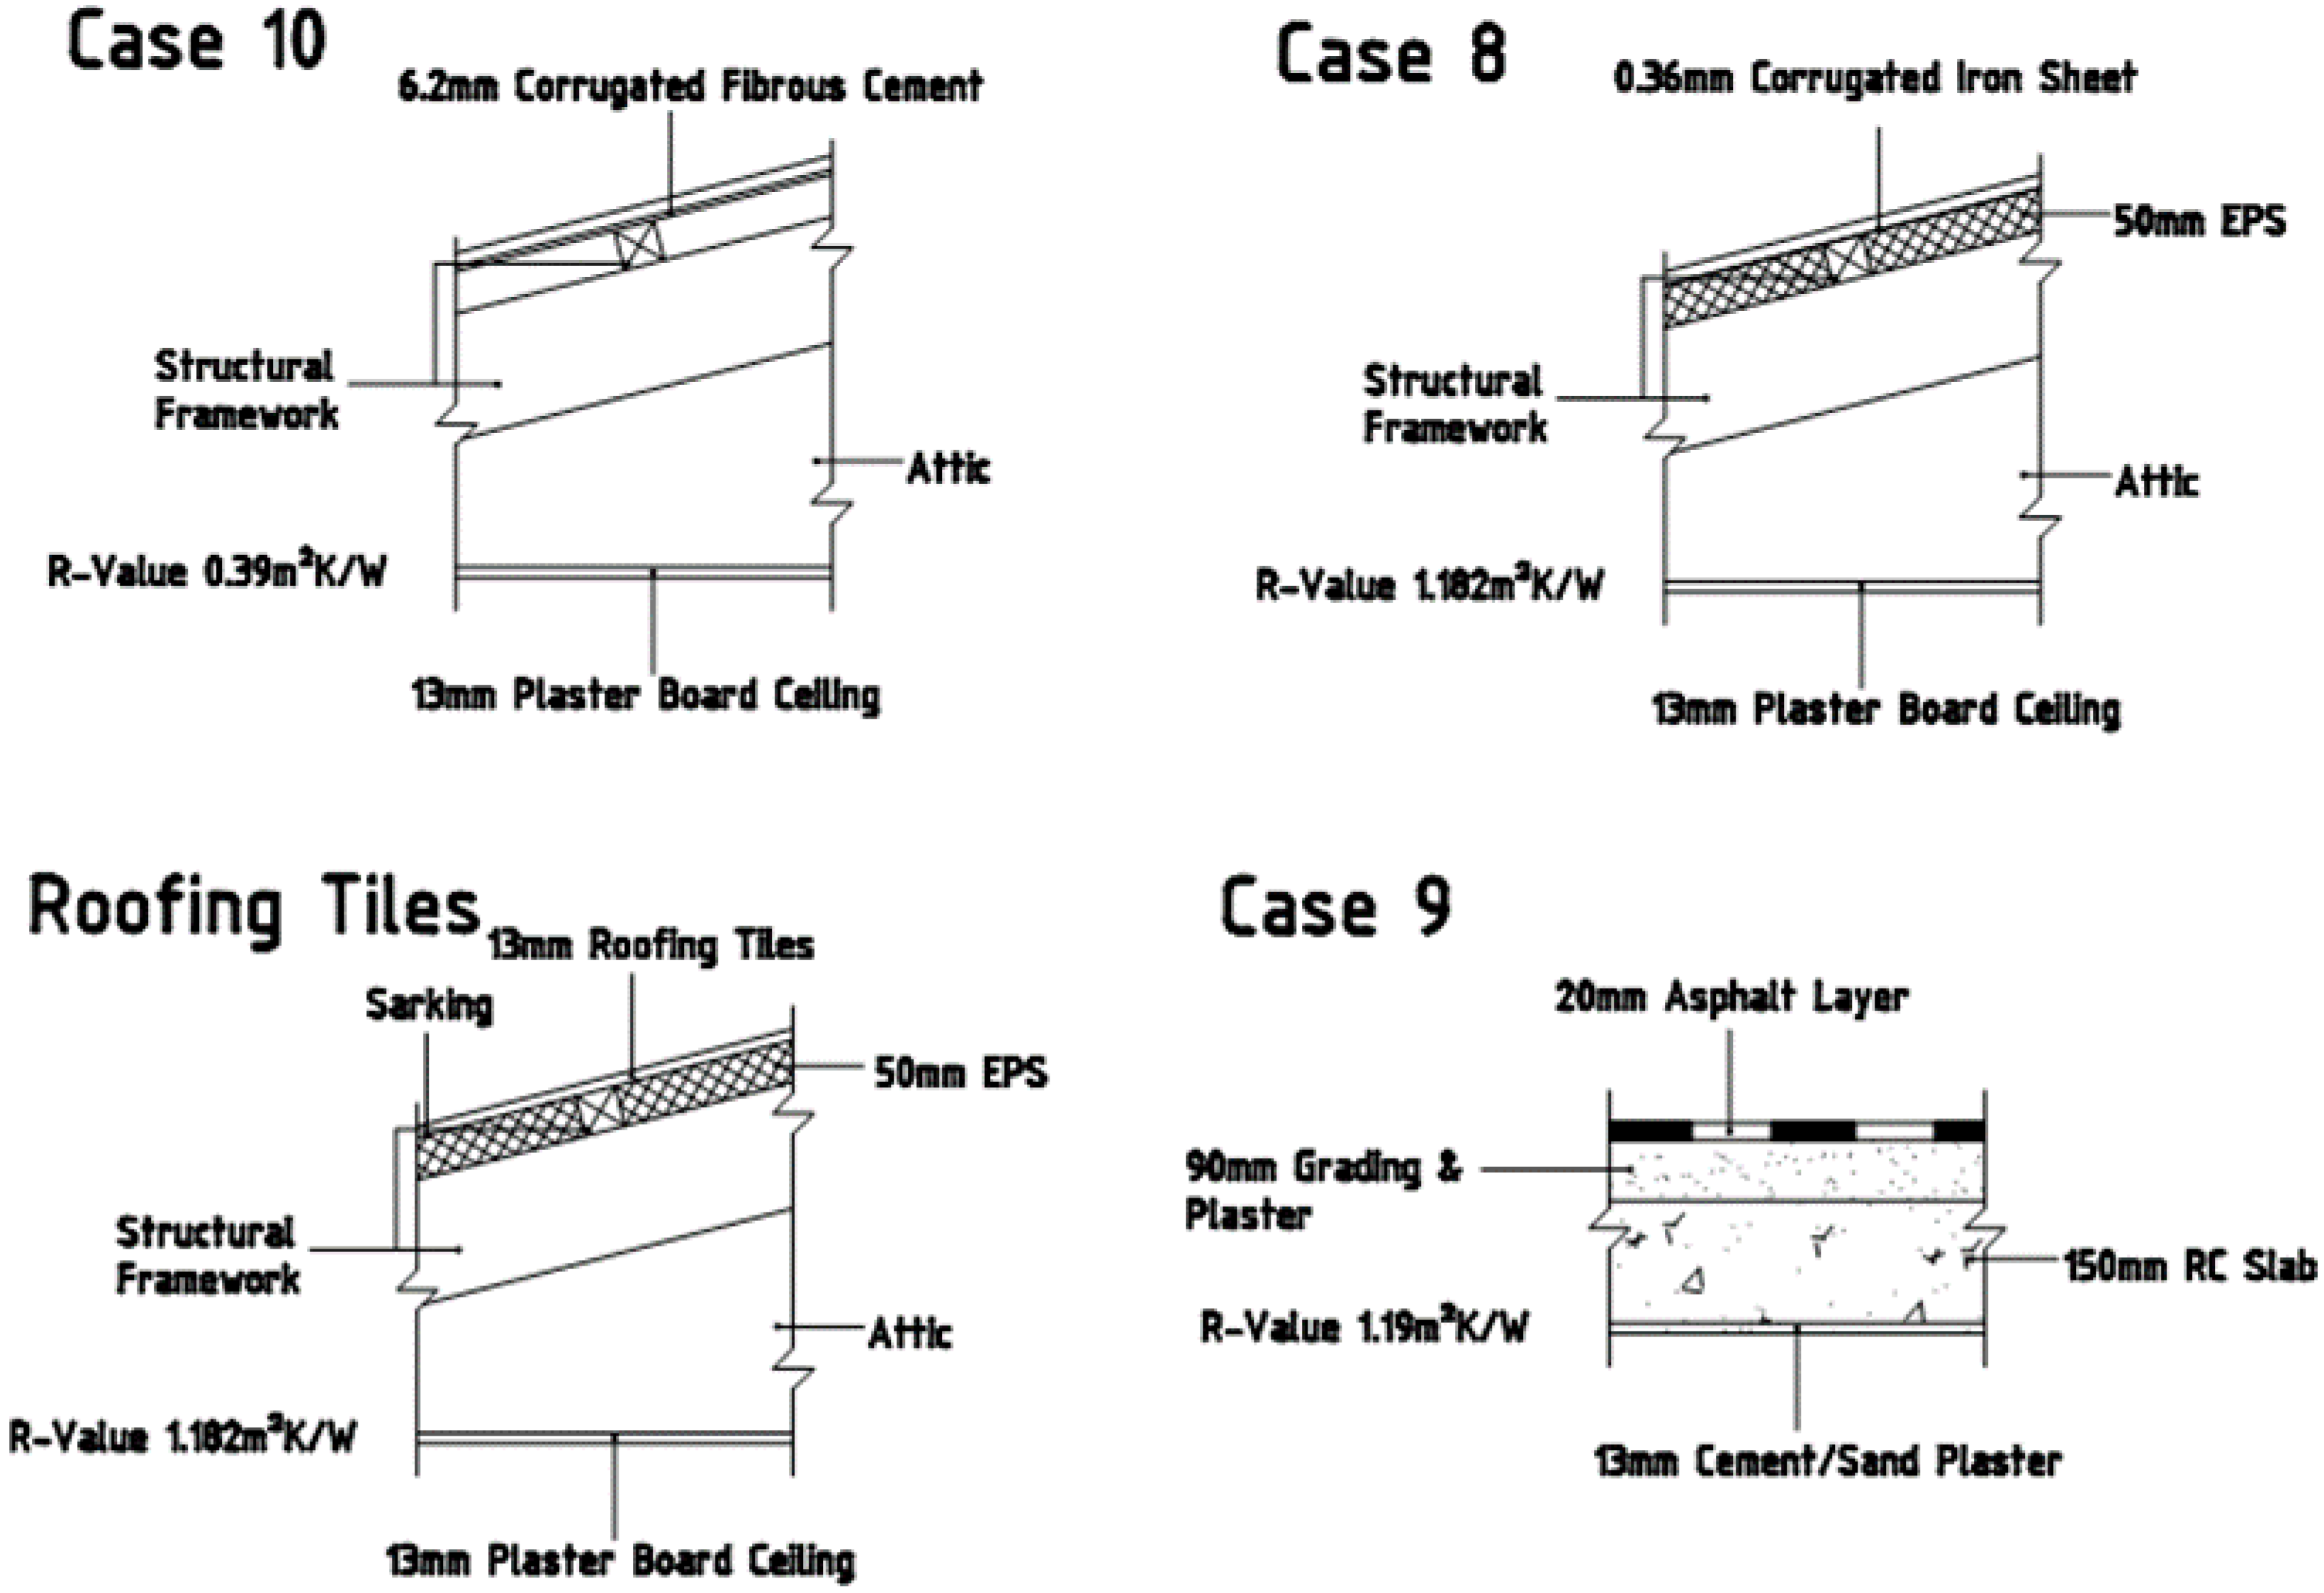
4.5. Impact of Varying Roof R-Value
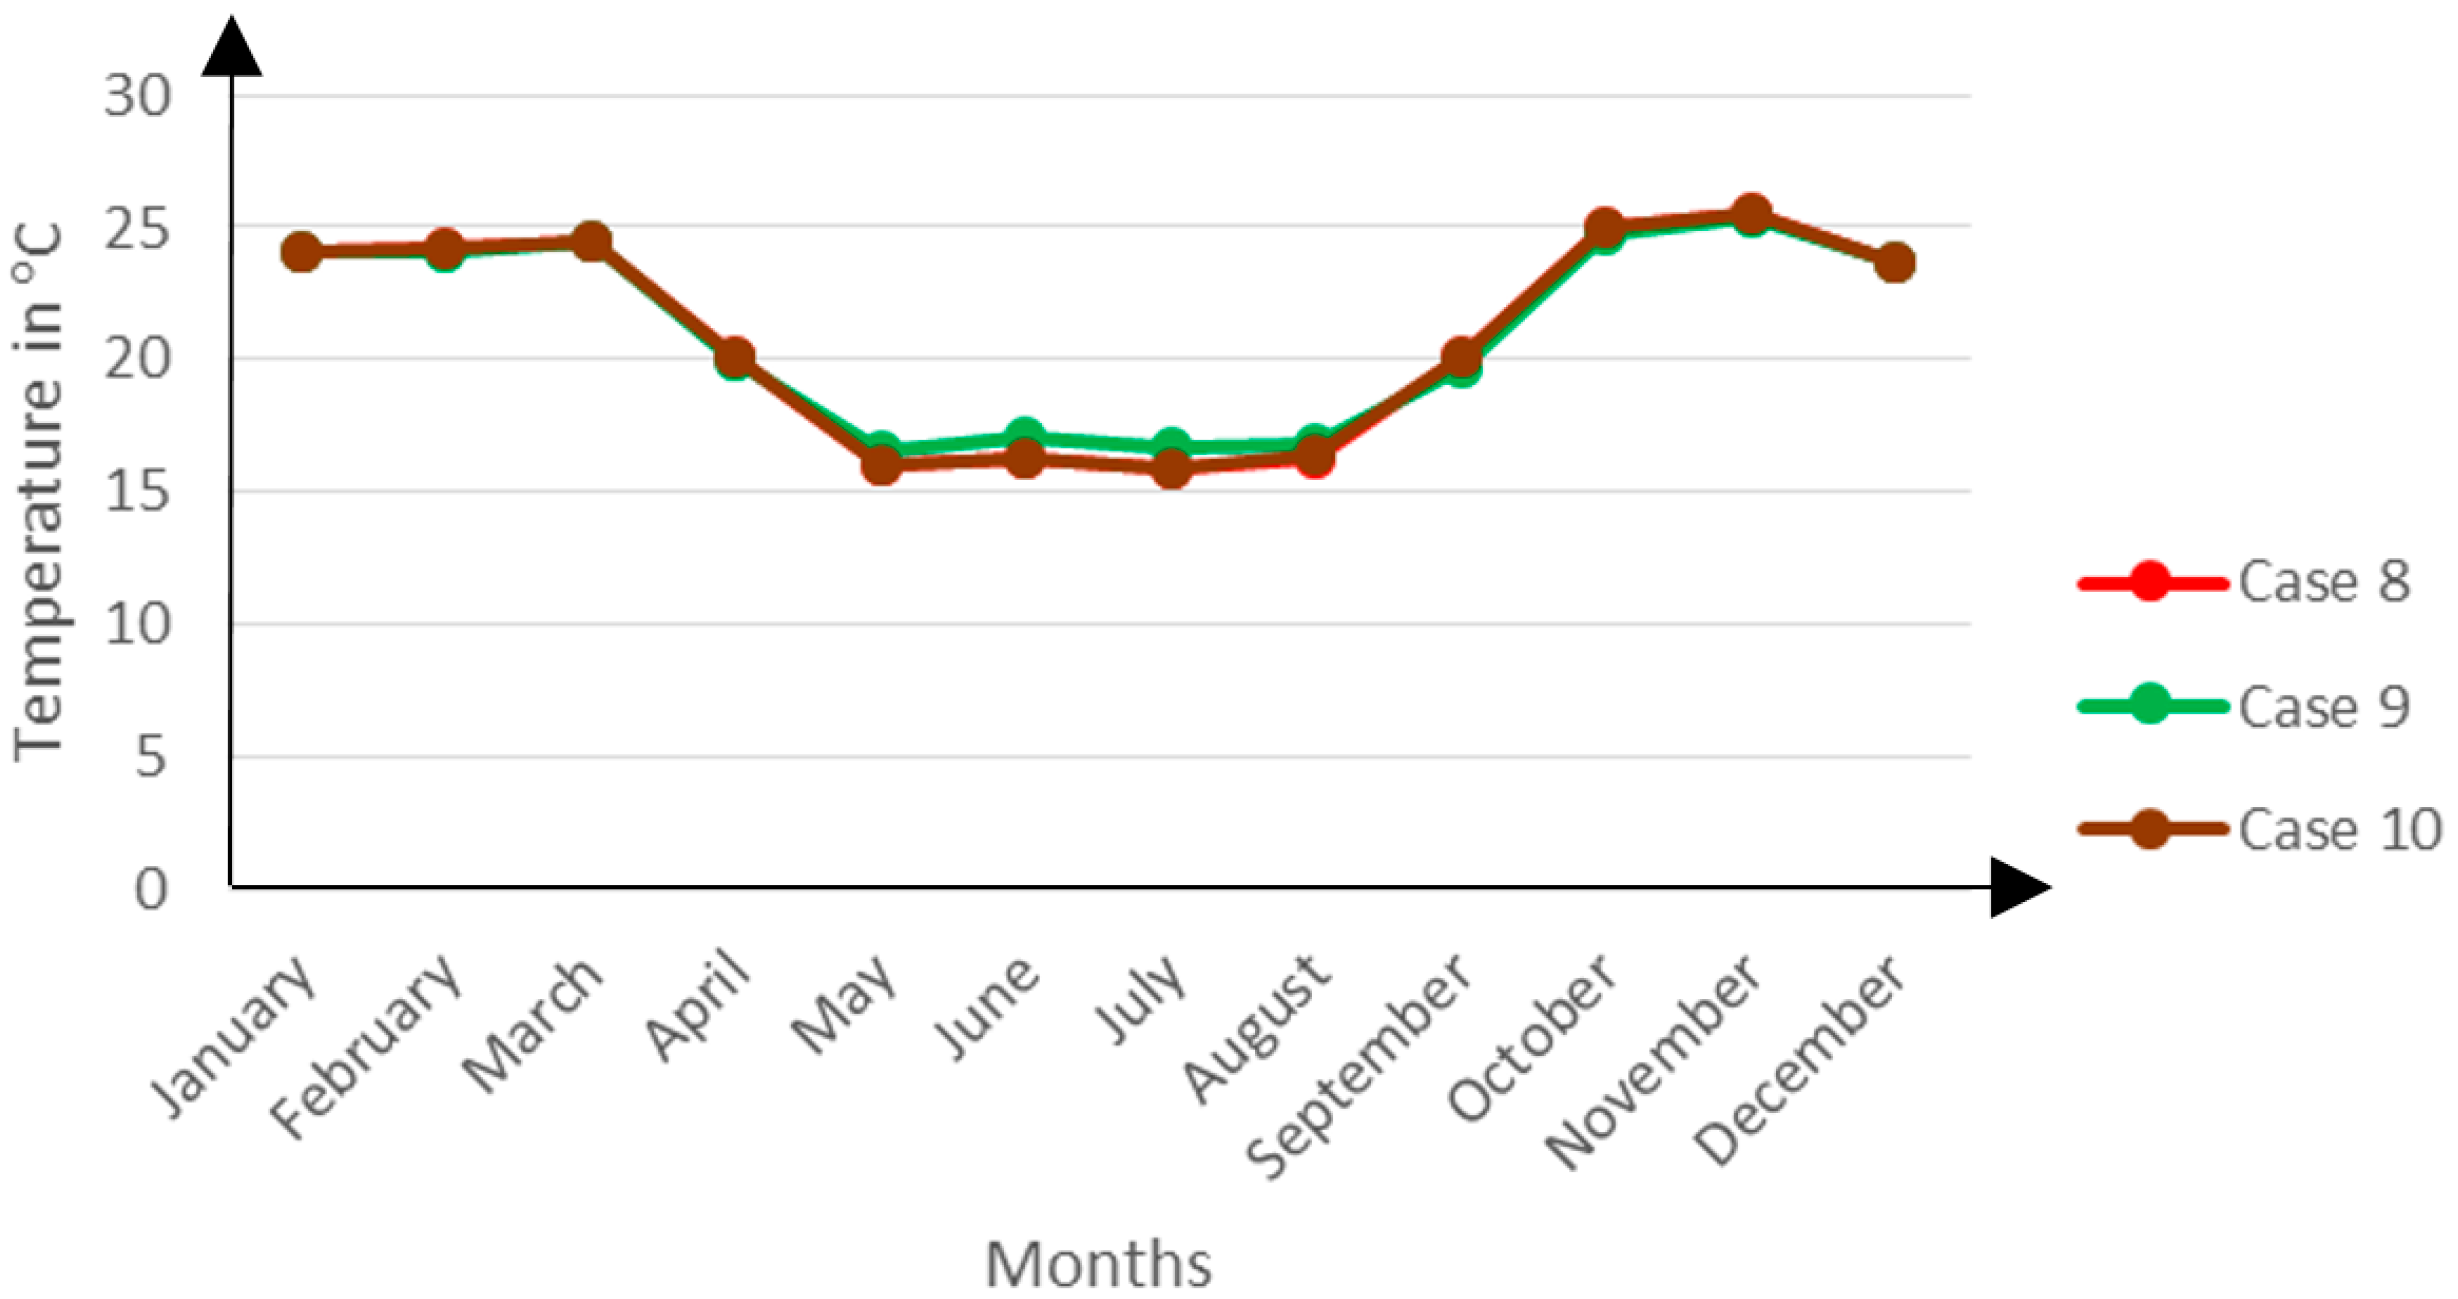
Cases 8, 9 and 10 model the variation on the roof R-value. In Case 8, the roof is made of metal sheets insulated by internal EPS. The roof envelope of Case 9 is made of 150 mm thick concrete slab. Case 10 uses corrugated fibrous cement for the roof. The schematic drawings for these Cases are provided in Figure A4.
The monthly mean zonal temperatures registered in the three Cases are shown in Figure 12 below.
It can be seen from the figure that these model envelope configurations are only capable of marginal impacts on the zonal temperatures overtime. However, Case 9 registers some slightly higher temperatures during the winter months. The lack of insulation enables this Case to warm up during the day time when the outdoor temperatures are higher. Nonetheless, this Case registers the highest discomfort hours over the same winter period as shown in Figure 13 below:
The lack of insulation in this Case means that the roof loses much of the internally generated heat during night time when the outdoor temperature falls. Unfortunately, night time is the longest occupied time for this present study, such that the daytime warming up effect does very little to moderate the amount of the discomfort hours. However, generally speaking, this Case registers slightly lower summer temperatures courtesy of its lack of insulation which ensures that much of the indoor heat escapes into the outdoor environment.
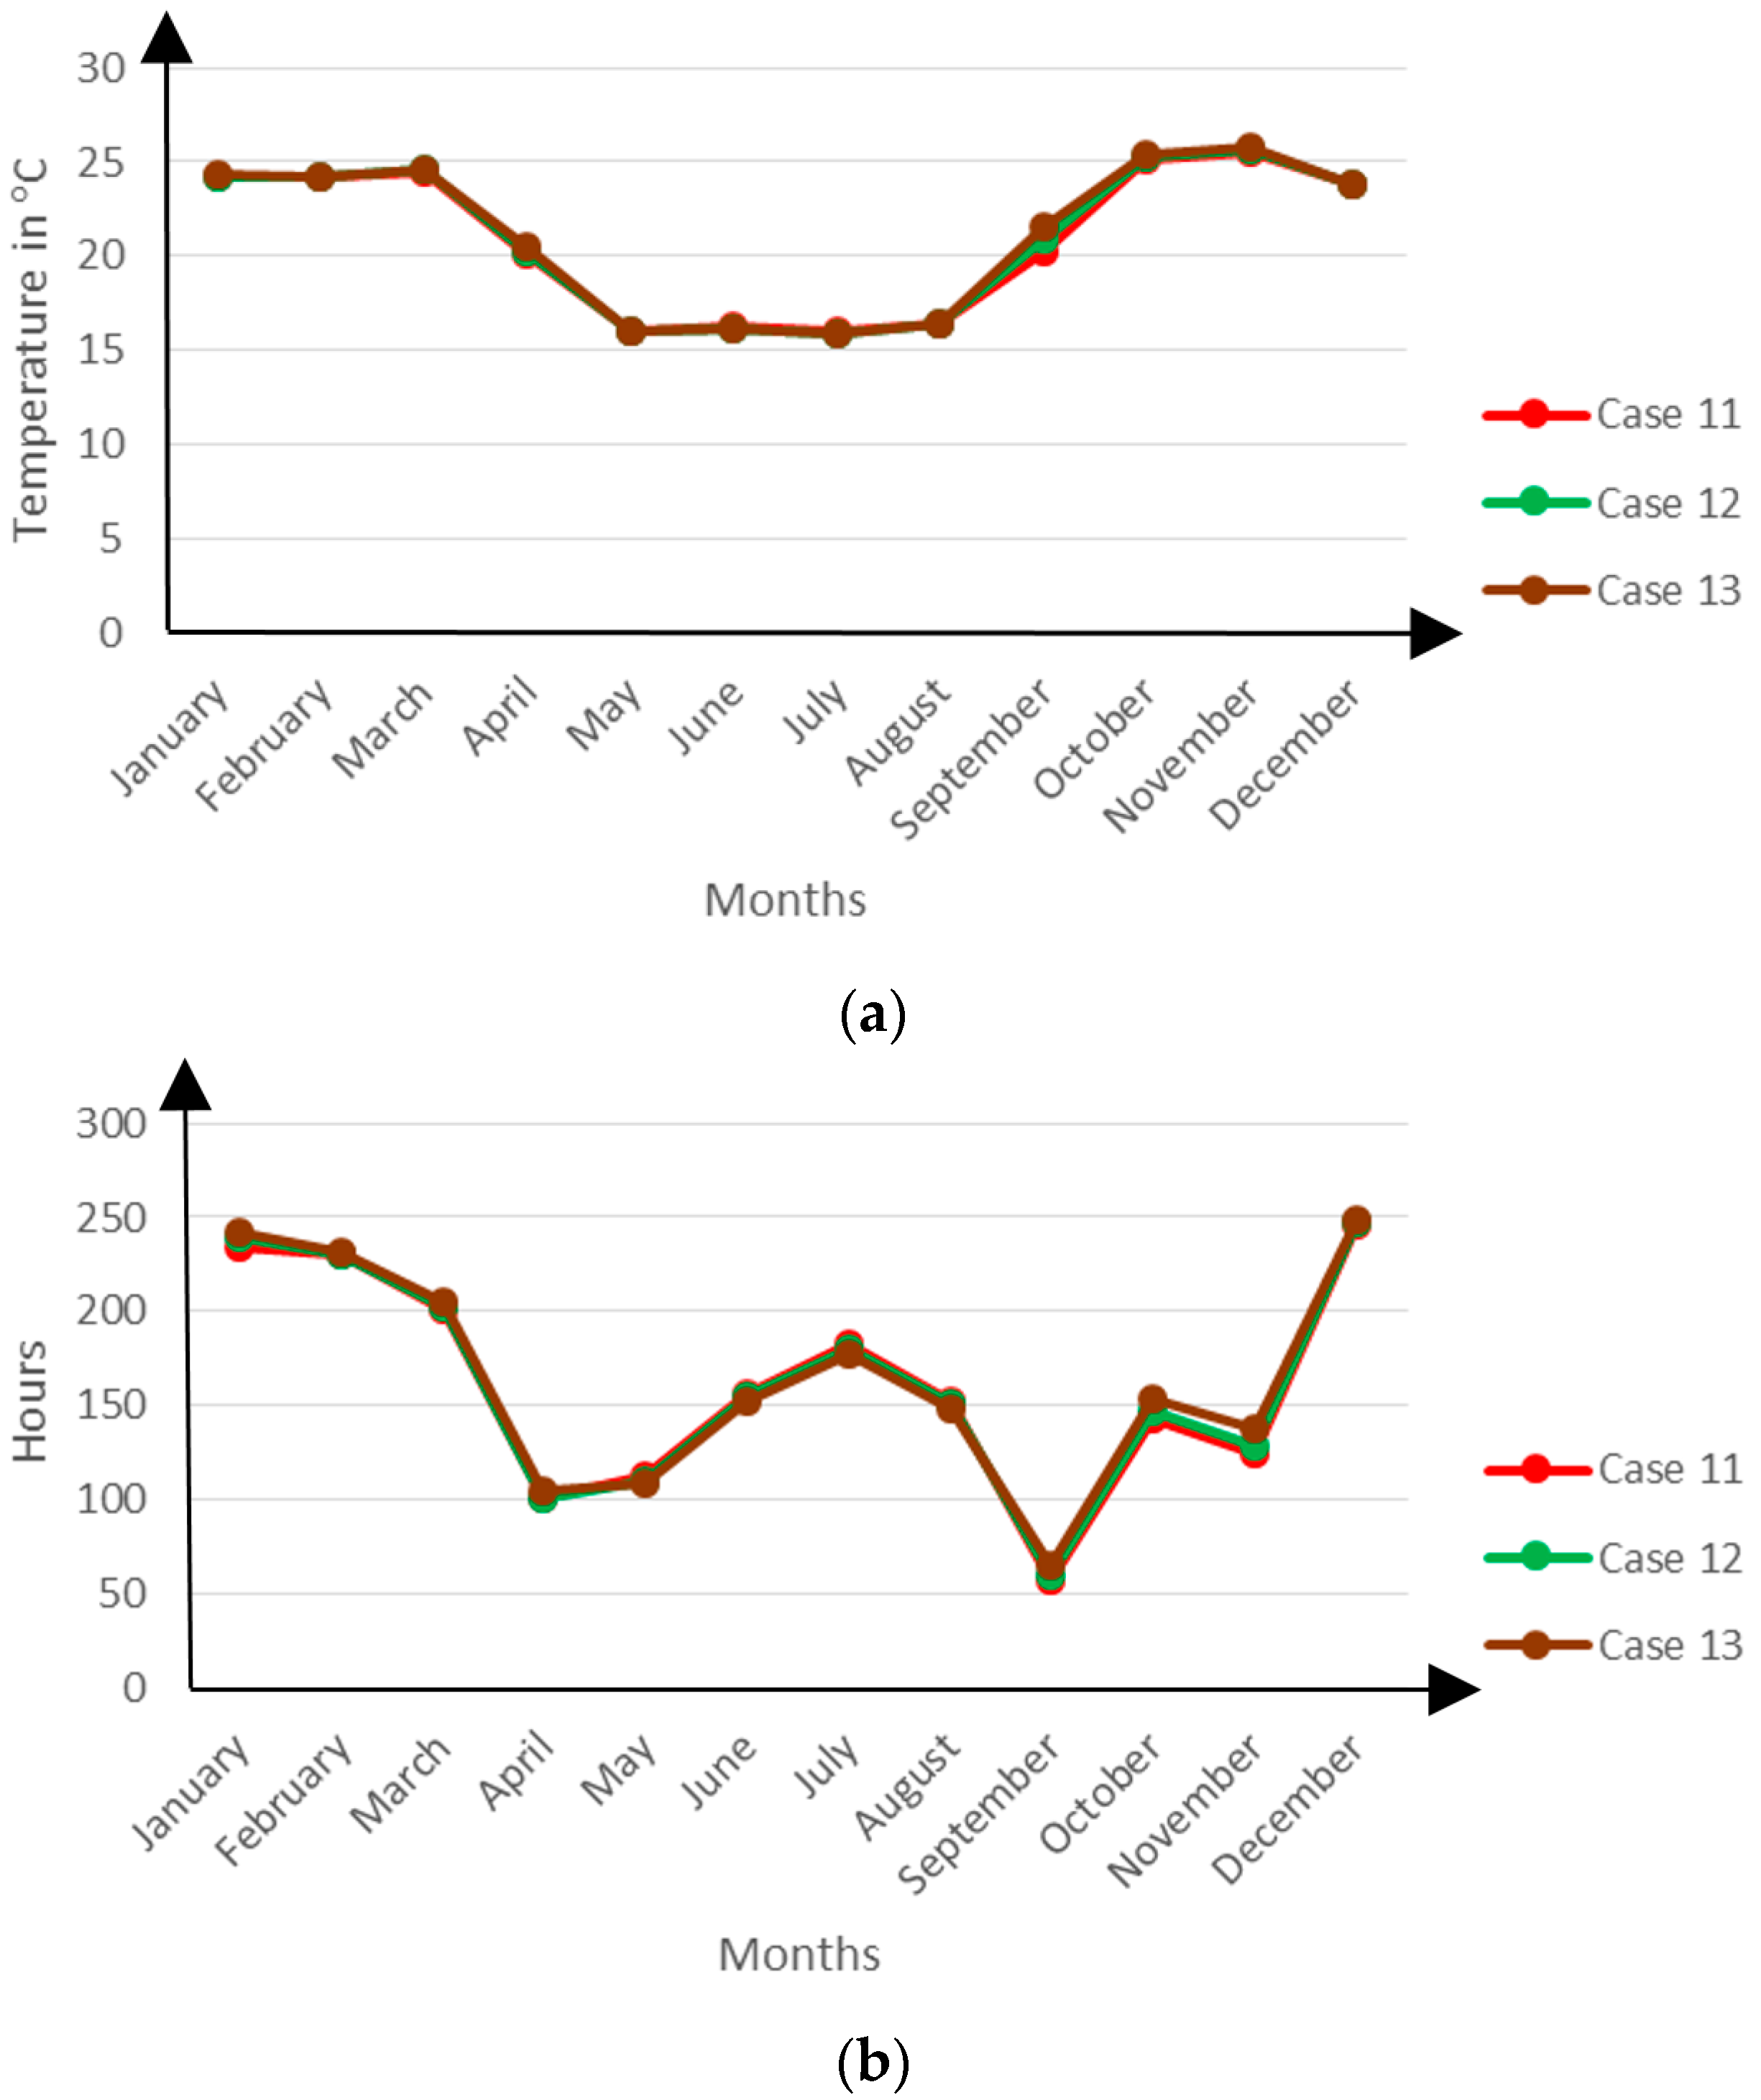
4.6. Impact of Varying Glazing Insulation
A variation in window glazing insulation is modelled in Cases 11, 12 and 13 which use triple glazing, double glazing and single glazing respectively.
There are very marginal variations in the thermal performance registered by these models as shown in Figure 14 below:
However, Case 11 registers slightly lower monthly mean zonal temperatures during the warmer periods and slightly higher discomfort hours during the winter period. This can be attributed to the insulation effect accorded by the triple glazing. This effect is similar to that accorded in the Cases 5, 8 and 10.
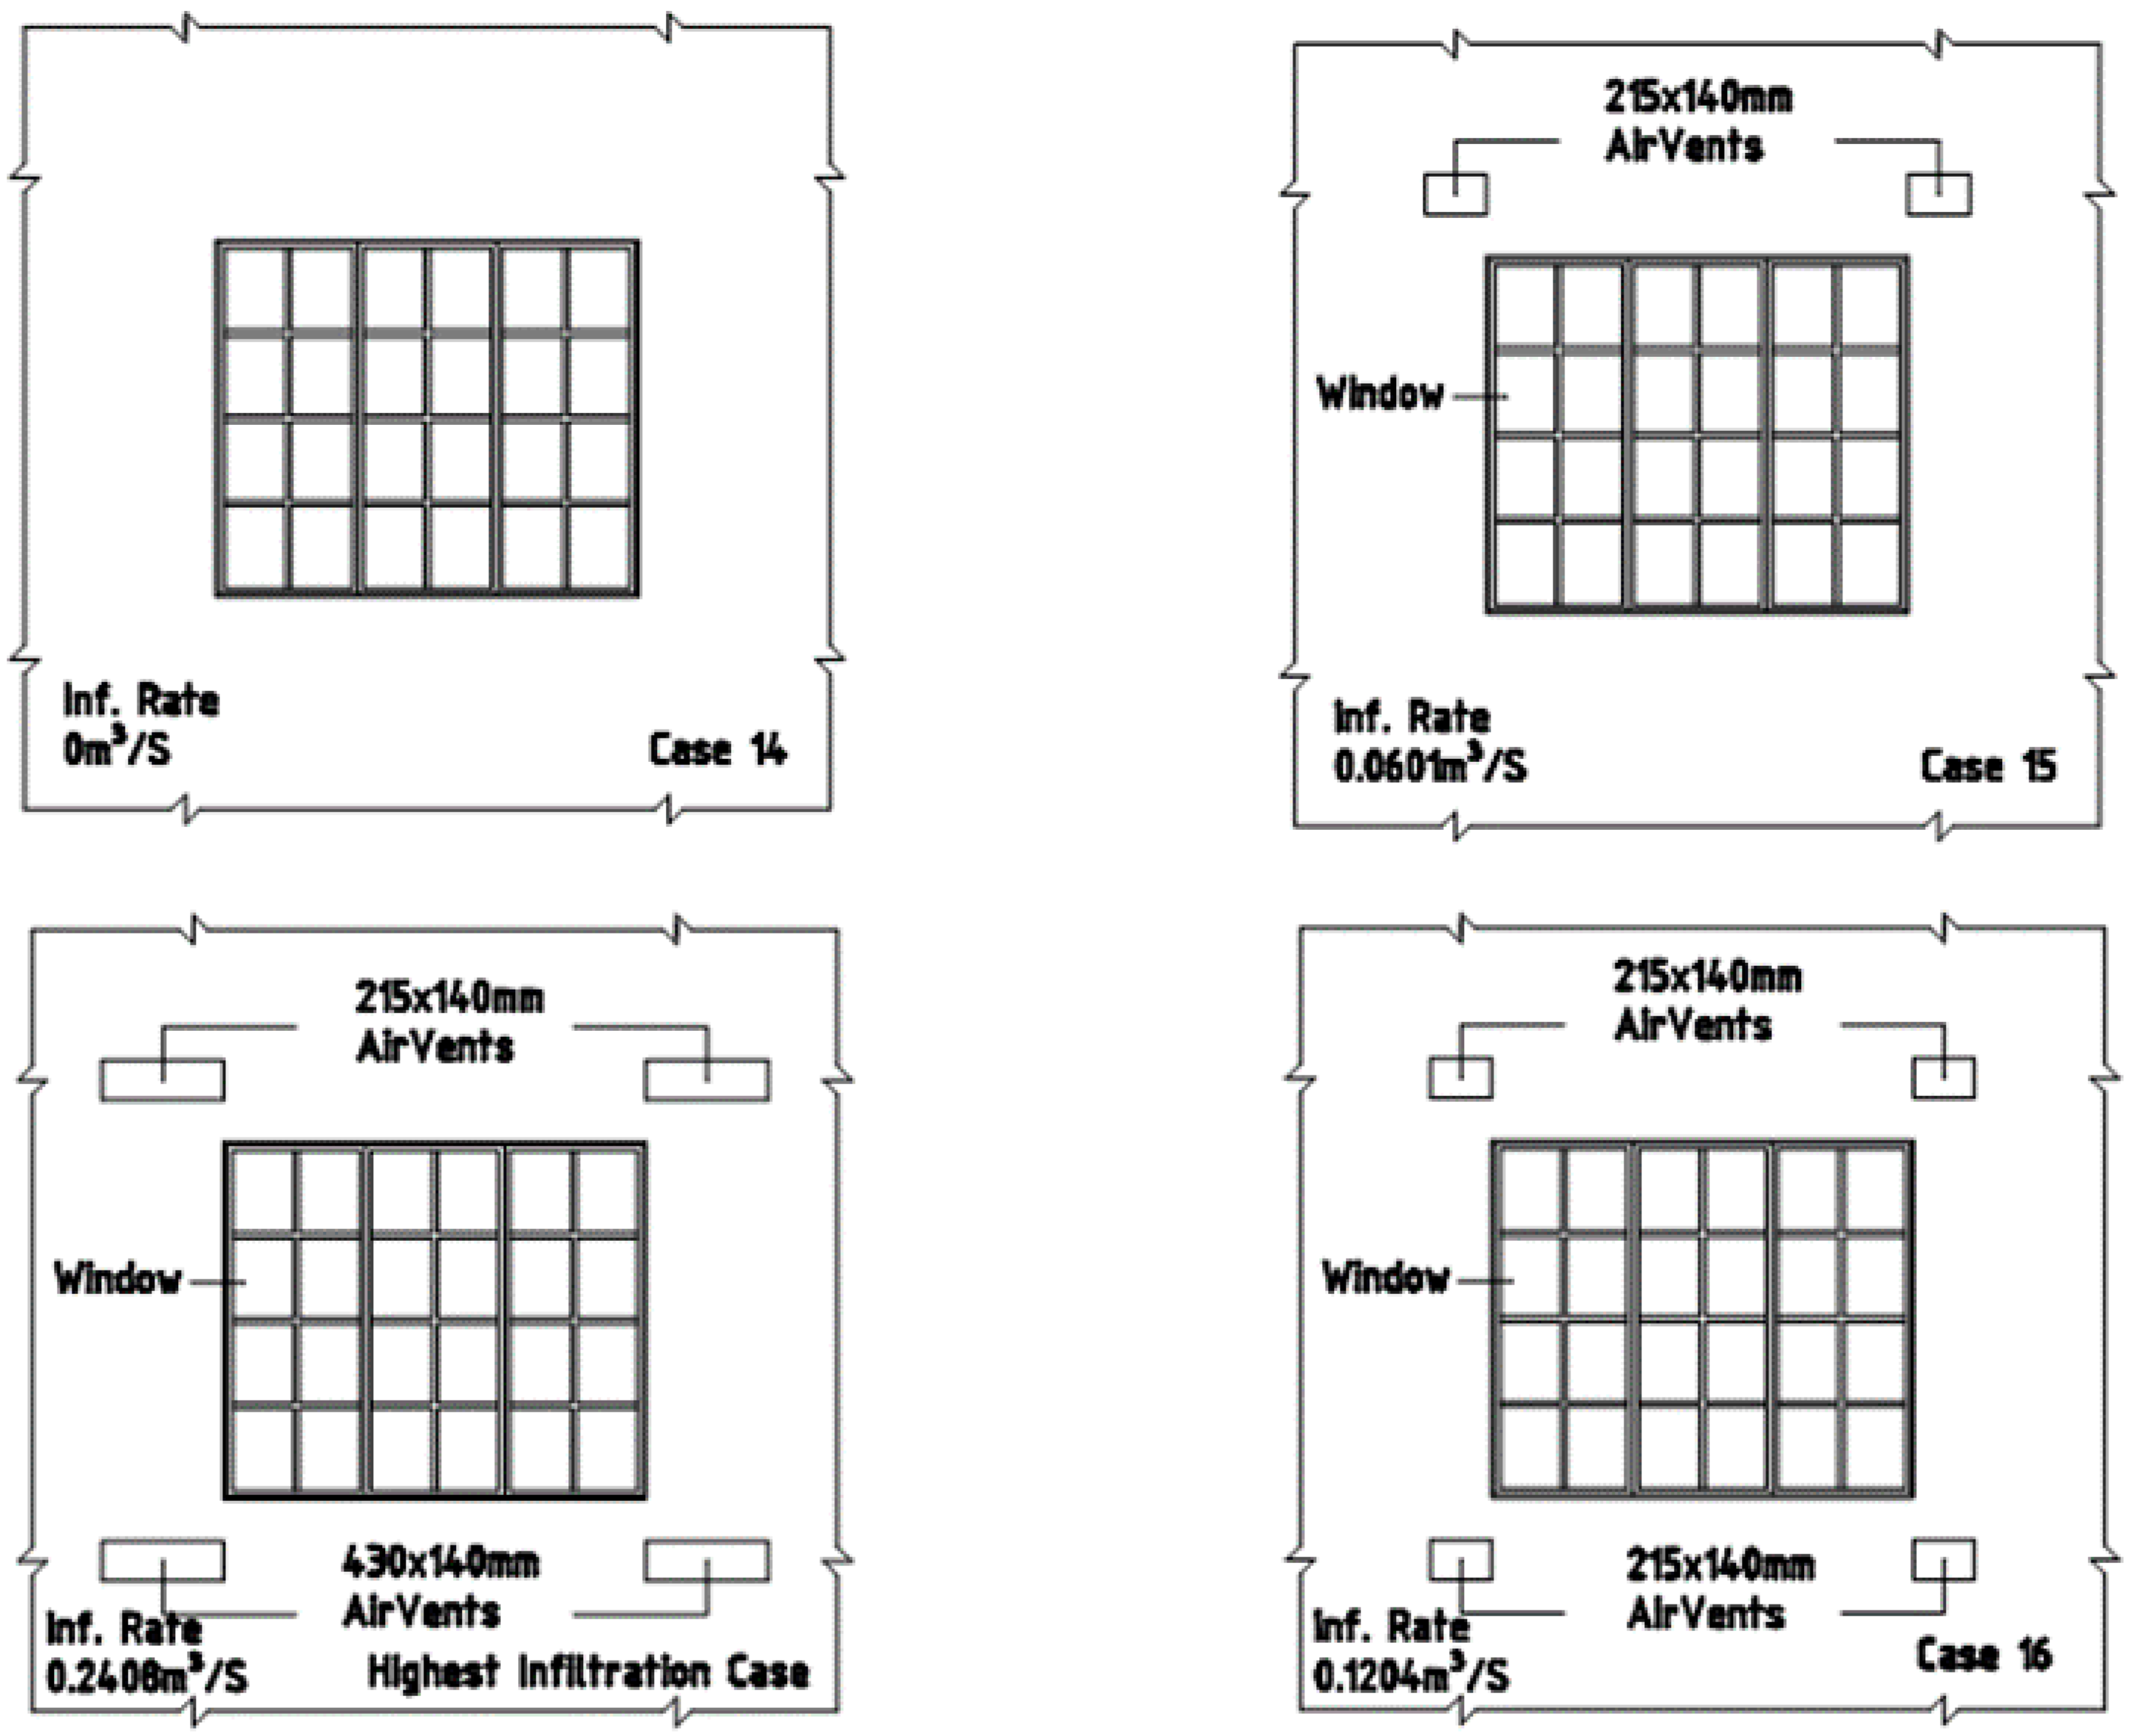
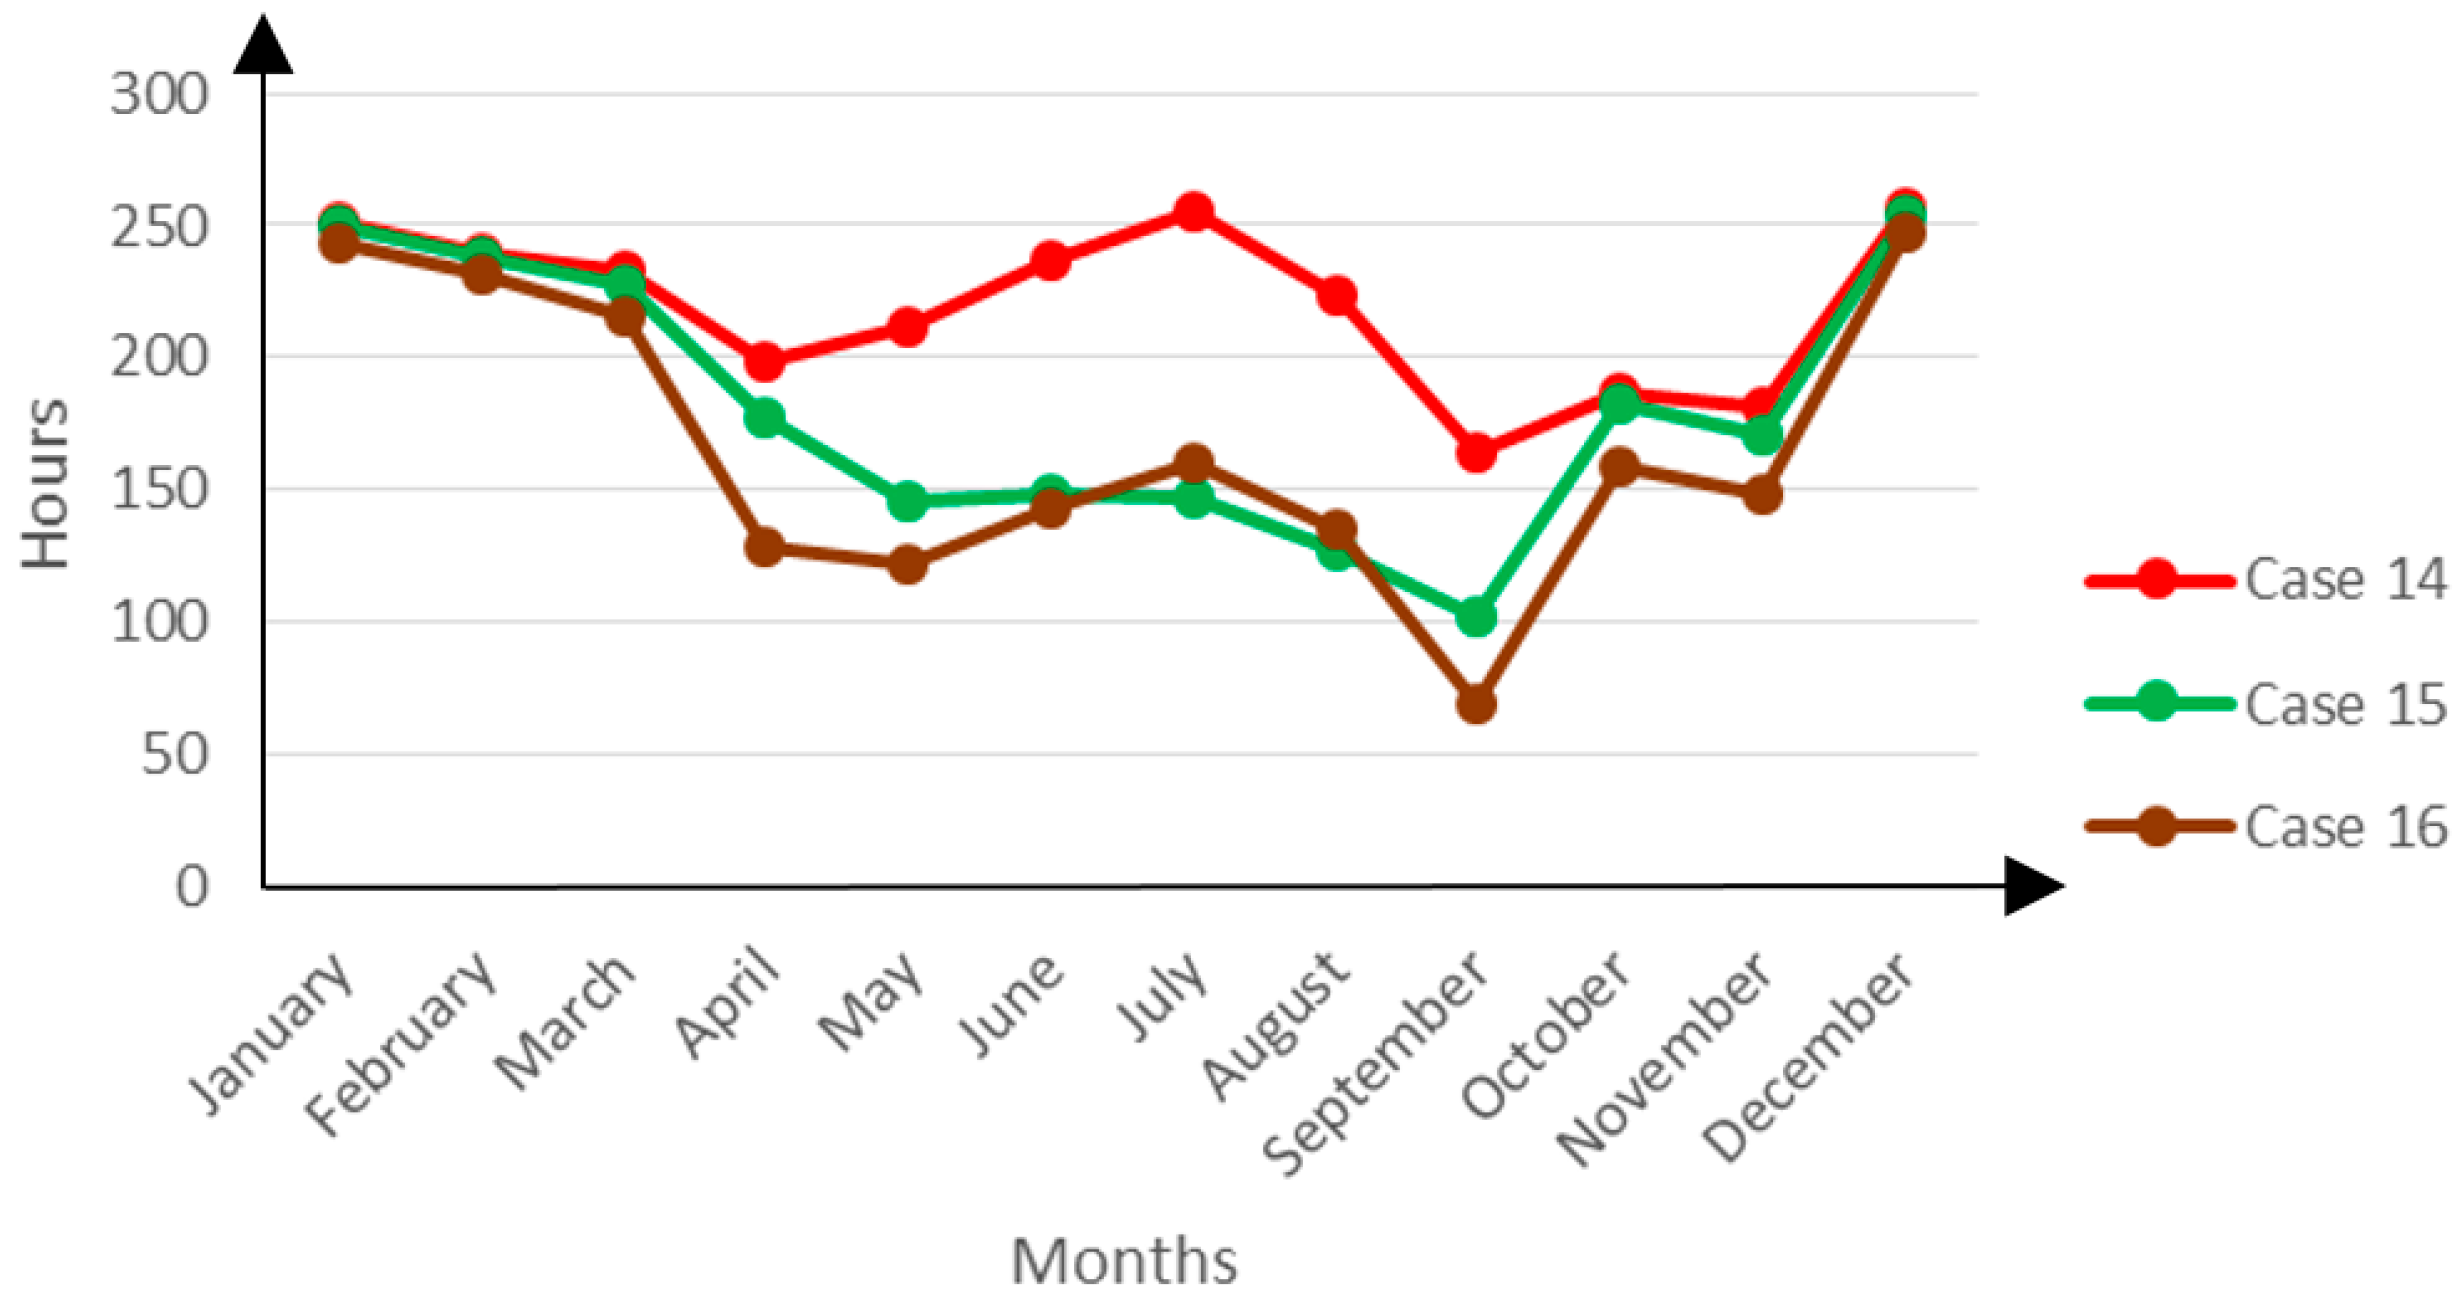
4.7. Impact of Varying Infiltration Rates
The statistical Analysis of Variance from the first simulation results showed that air infiltration through the air bricks constituted the most significant feature of all the seven features having the most substantial contribution to the buildings thermal performance.
During the comprehensive second round of simulation runs planned by the listing method, the air infiltration rates are varied between 0 m3·s−1, 0.0601 m3·s−1 and 0.1204 m3·s−1 in Cases 14, 15 and 16 respectively. In Case 14, the model’s envelope does not have any air bricks fitted. The infiltration occurs only through the envelope’s cracks and any other such unintended openings. Case 15 has four air bricks positioned above and below all window openings. These air bricks are typically sized being 215 mm × 140 mm. Case 16 also has four air bricks above and below every window opening, but these are much larger than is typically the case being 430 mm × 140 mm. The envelope configuration for these Cases is provided in Figure A5.
The simulation results show very distinct differences in the models’ thermal performance. Case 14 registers the highest monthly mean zonal temperatures followed by Case 15, with Case 16 at the very bottom. The Figure 15 below presents the zonal temperature variation:
The limited air infiltration in Case 14 means that the model cannot fully benefit from the diurnal temperature variations between the indoor environment and the outdoor environment. These temperature variations are responsible for alternating high and low air pressure zones between the enclosed space and the outside air, ultimately leading to air flows between these two areas.
In summer, when the indoor environment gets warmer than the outside air, a low pressure zone develops which eventually draws in outside air. As the warmer air leaves the indoor space, it takes away some heat with it thereby lowering the air temperatures inside. A limitation on the air infiltration into the building space thus effectively contributes to higher indoor temperatures.
The higher indoor temperatures result into more discomfort hours for Case 14 during the warmer months as shown in Figure 16 below:
However, the level of discomfort is not markedly different from that of the other Cases, especially during the warm humid months in the rainy season between November and March. This can be attributed to the higher humidity levels in the outside air. When this humid air is freely allowed into the indoor environment, it may raise the indoor air humidity to uncomfortably high values.
During the winter period, much as the building occupants would need warmer conditions, the indoor temperatures for Case 14 remain highest but still, the environment registers the highest discomfort hours. Case 14 presents an overly insulated environment whereby most of the indoor heat remains trapped inside and thus raising the temperatures to uncomfortable levels.
The peak in discomfort hours for Case 16 during the winter period could be an indication that the higher infiltration rate continuously brings huge volumes of outdoor cold air into the indoor space a thing which continuously lowers the temperatures much to the rising discomfort of the occupants.
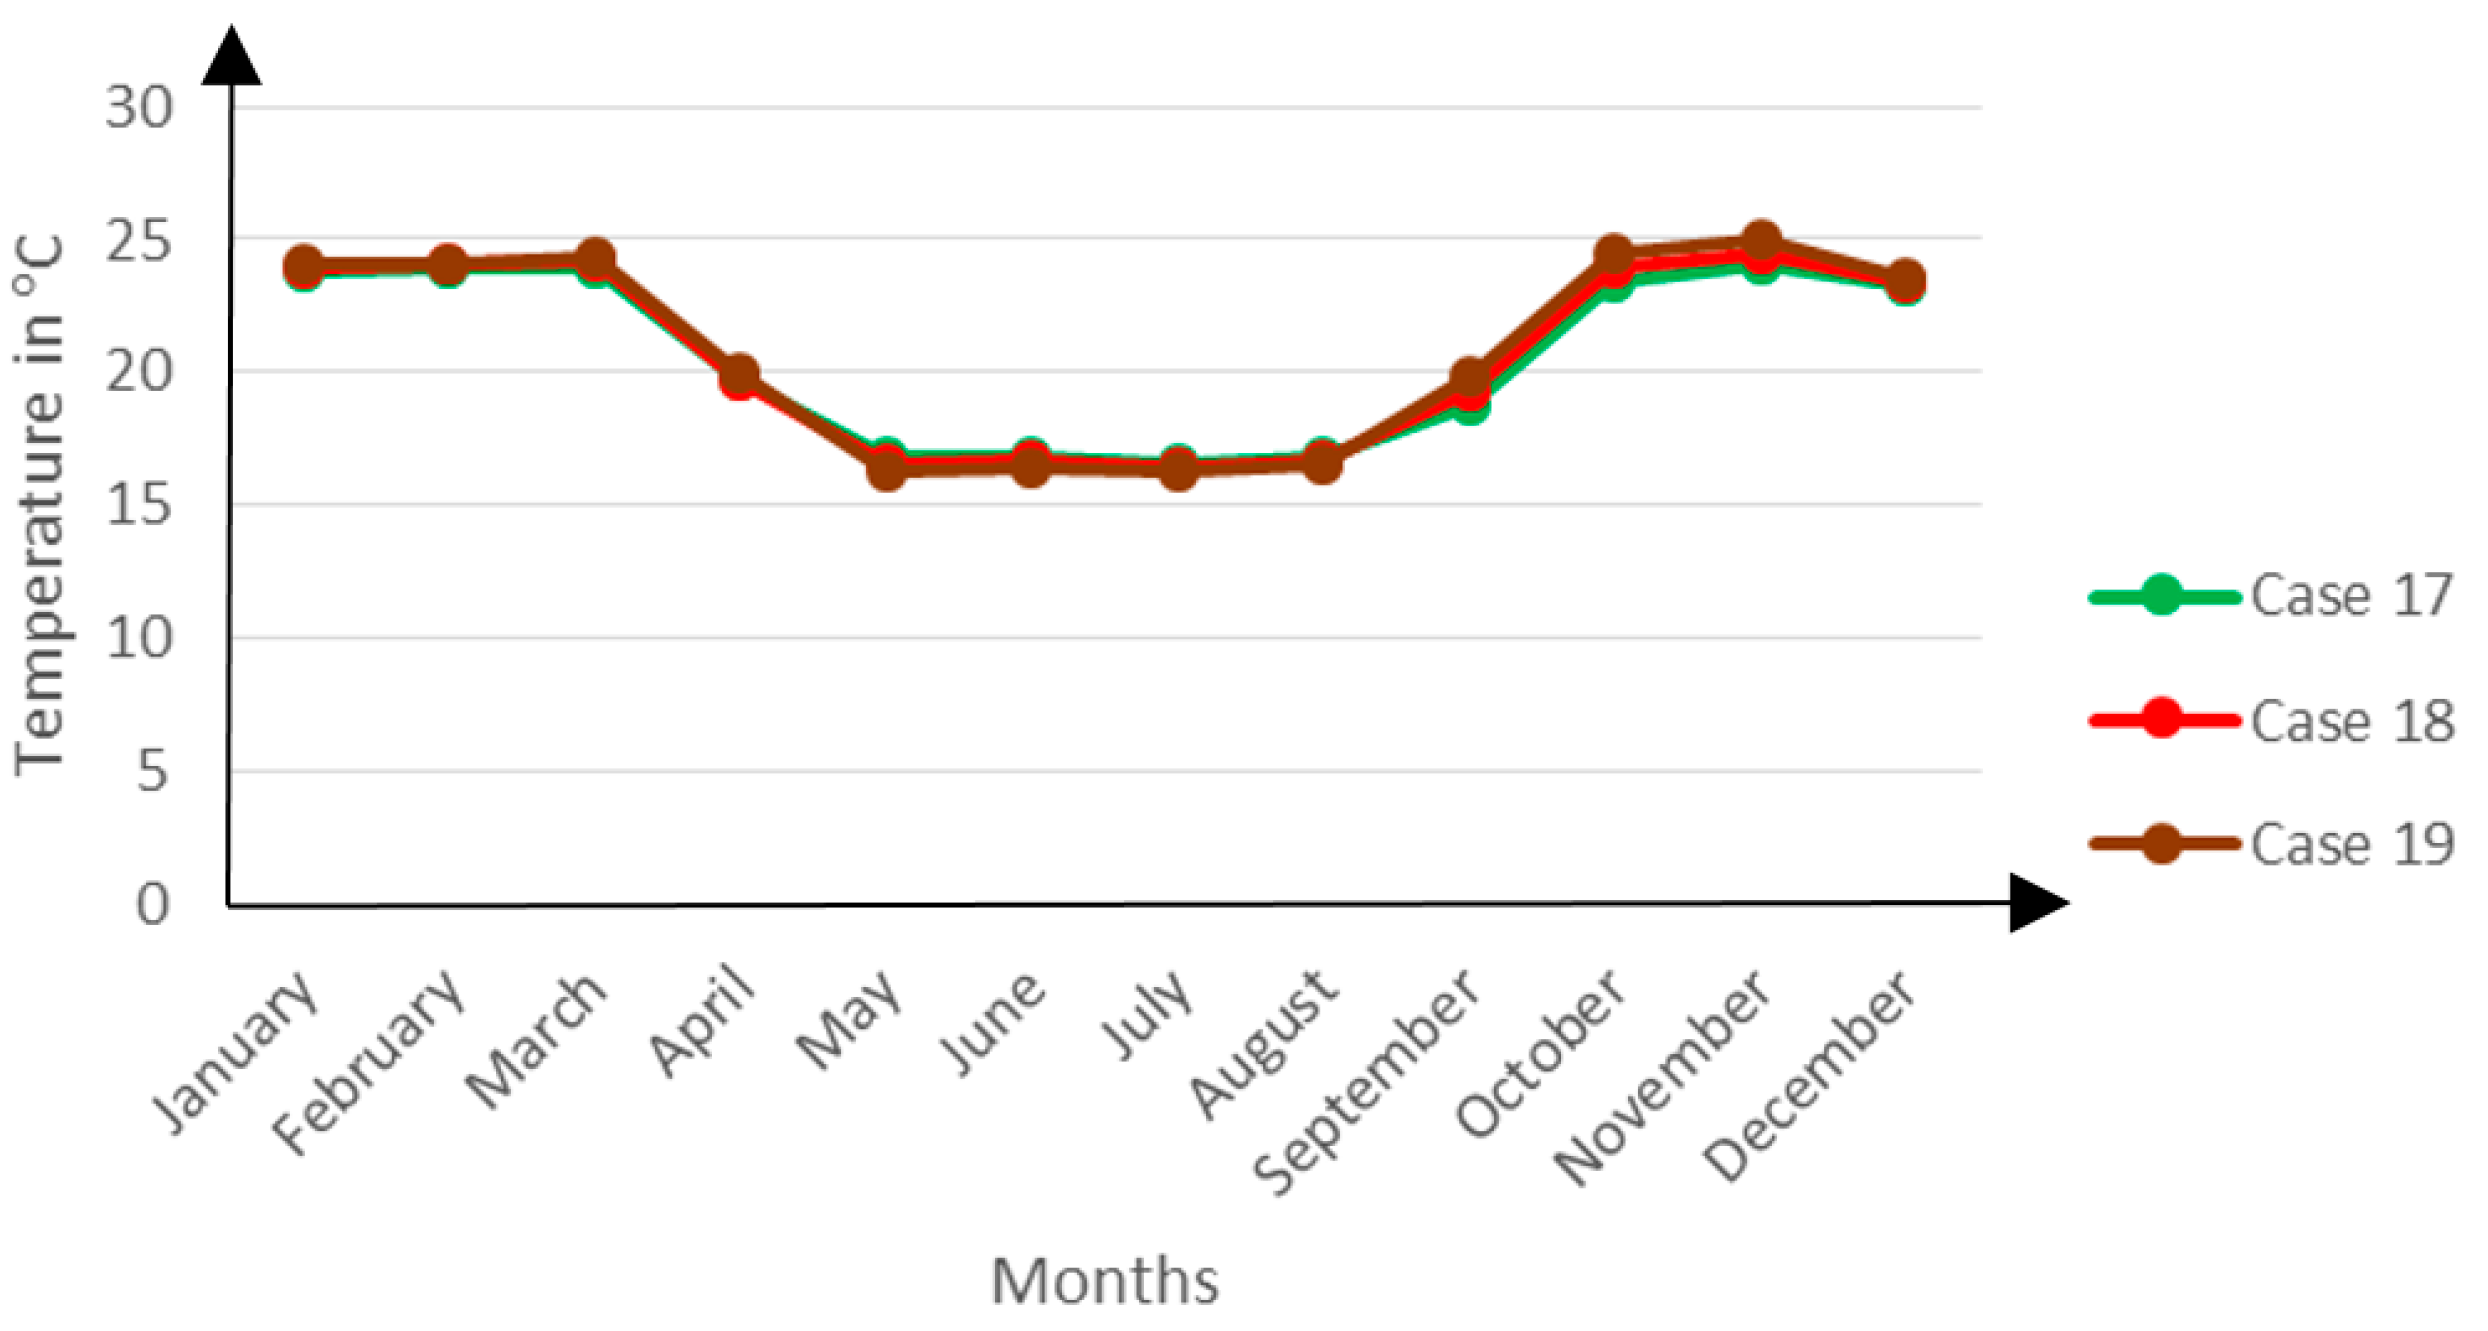
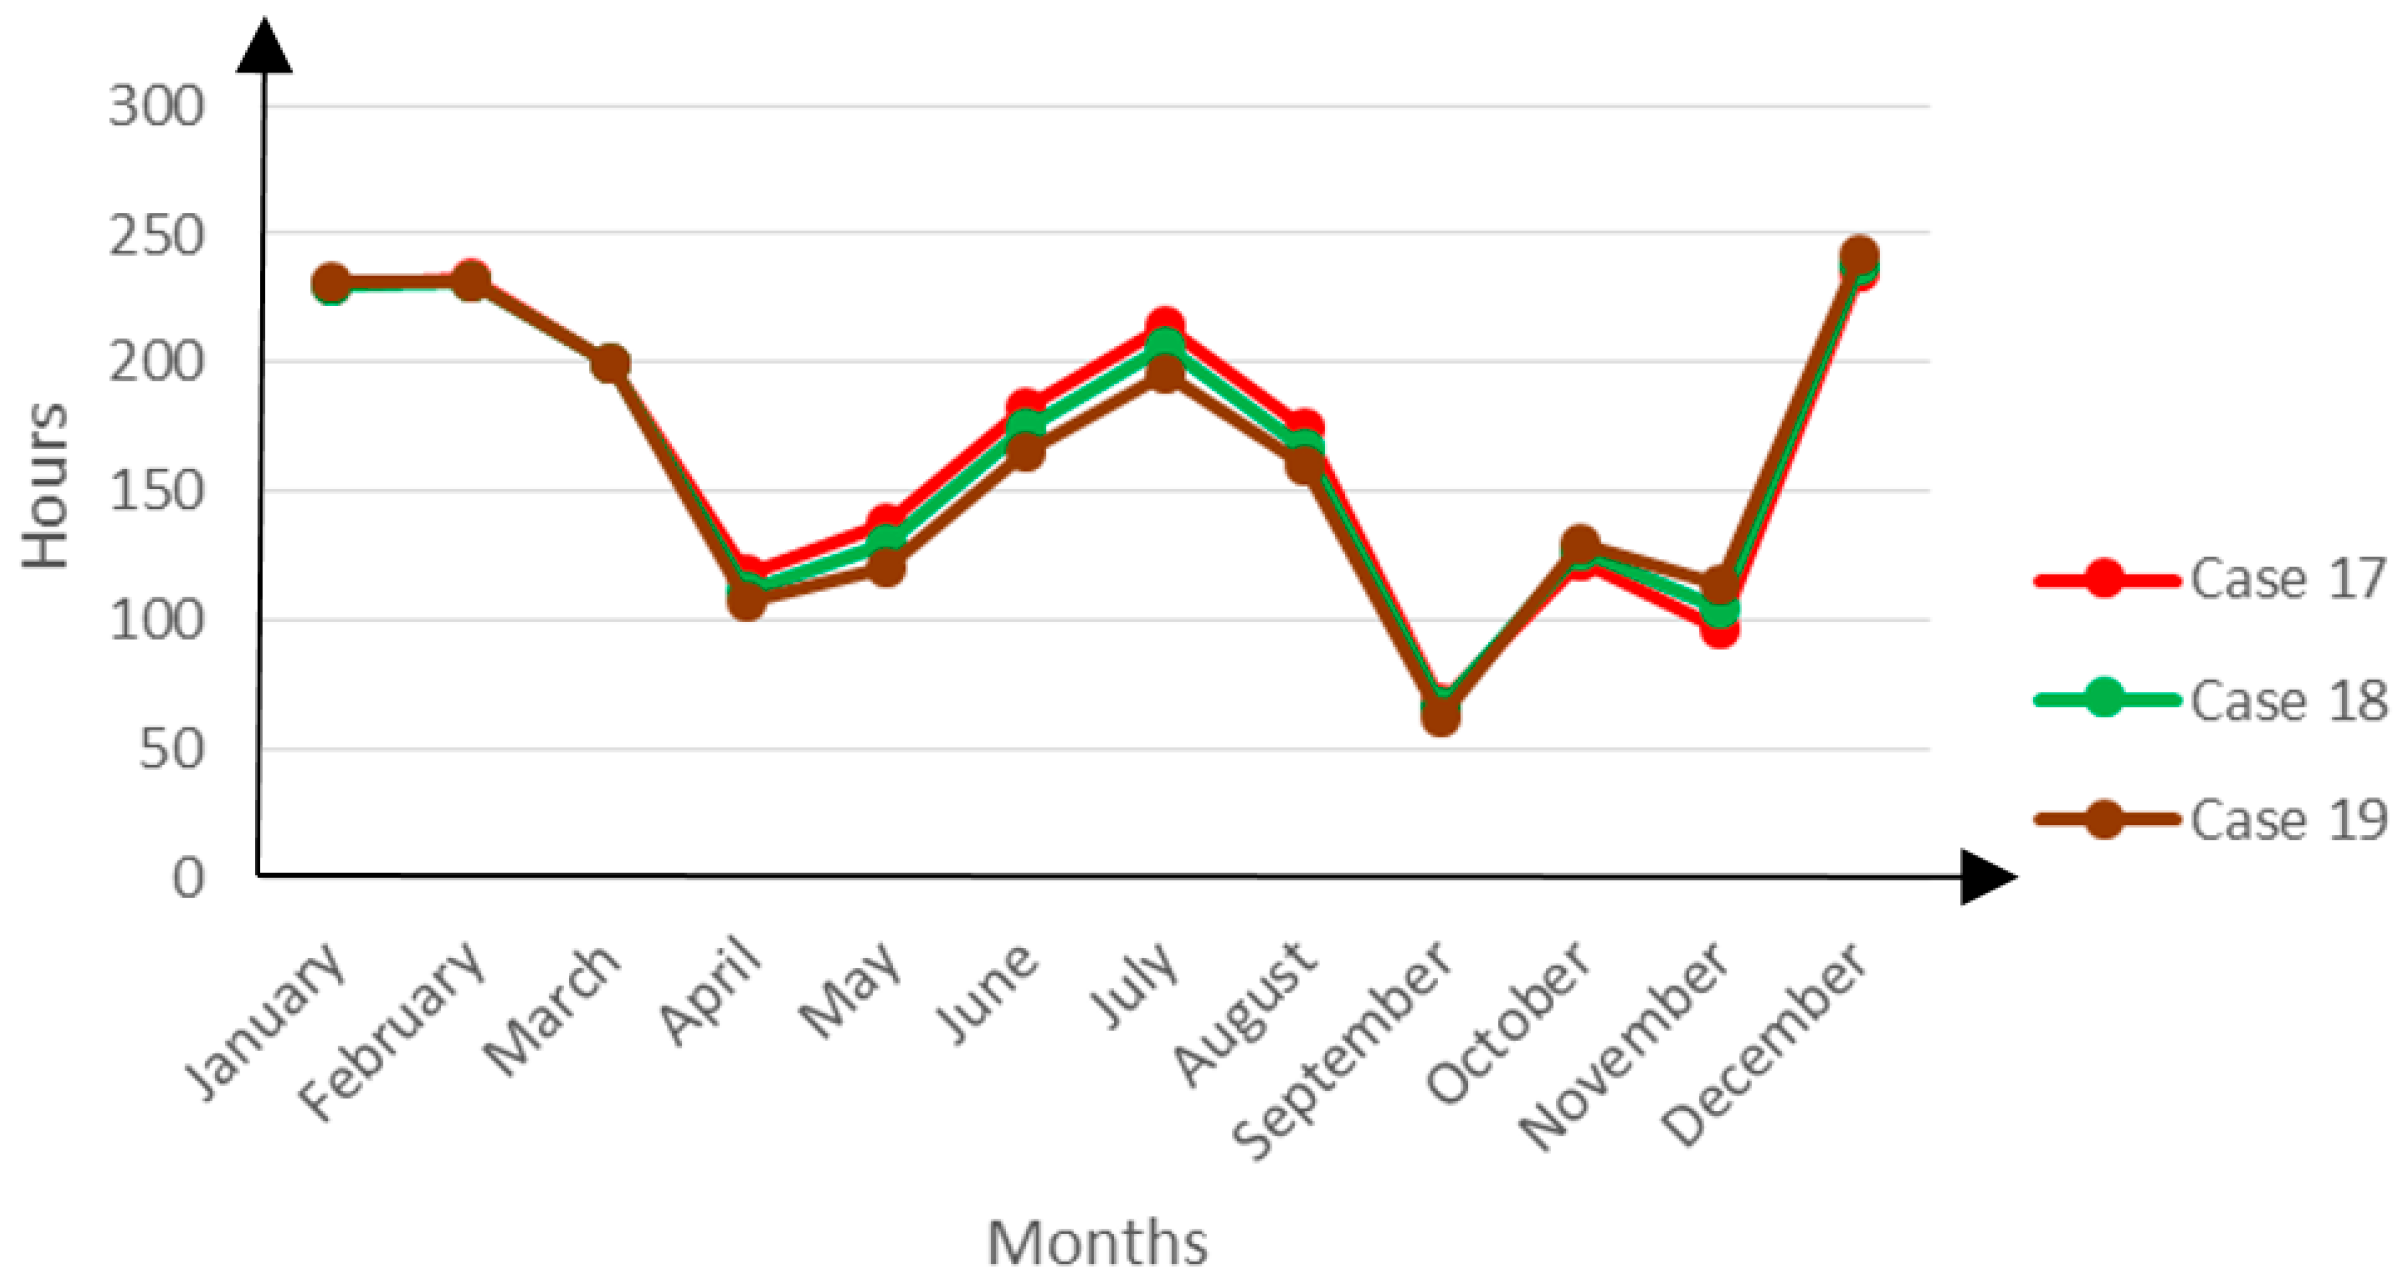
4.8. Impact of Varying Wall Transparency Ratio
The impact of varying wall transparency ratio is modelled in Cases 17, 18 and 19 where the models’ transparency ratios are 15%, 25% and 35% respectively.
The results reveal a very marginal zonal temperature variation for the models as presented in Figure 17 below:
Between the winter months of May and August, Case 17 registers slightly higher temperatures than Cases 17 and 18. This can be attributed to two factors namely the limited ventilation flow rate when the windows are opened and the limited heat flux density through the glazing when the windows are closed.
At a transparency ratio of 15%, Case 17 has the smallest window area and thus consequently, the smallest natural ventilation flow rate when the windows are opened. The smaller glazing area results into a reduction in the total heat flux density through the window. Much as glazing has a relatively higher R-value than the opaque components of the building, the latter have substantial thermal mass such that in the presence of temperature gradients, heat will always pass much quickly through the glazing. A larger glazing area would thus mean higher heat flux densities. In winter, these two factors jointly trap indoor heat within the enclosed space leading to the higher temperatures. In summer, the outdoor heat is largely prevented from reaching the indoor space.
The winter entrapment of indoor heat seems to be so severe that the indoor temperatures rise to uncomfortable levels while the summer limitation of the outdoor heat from reaching the indoor environment helps to moderate the discomfort hours in Case 17. The Figure 18 below shows the variation of the discomfort hours across the year.
4.9. Impact of Varying Window Overhang Depth
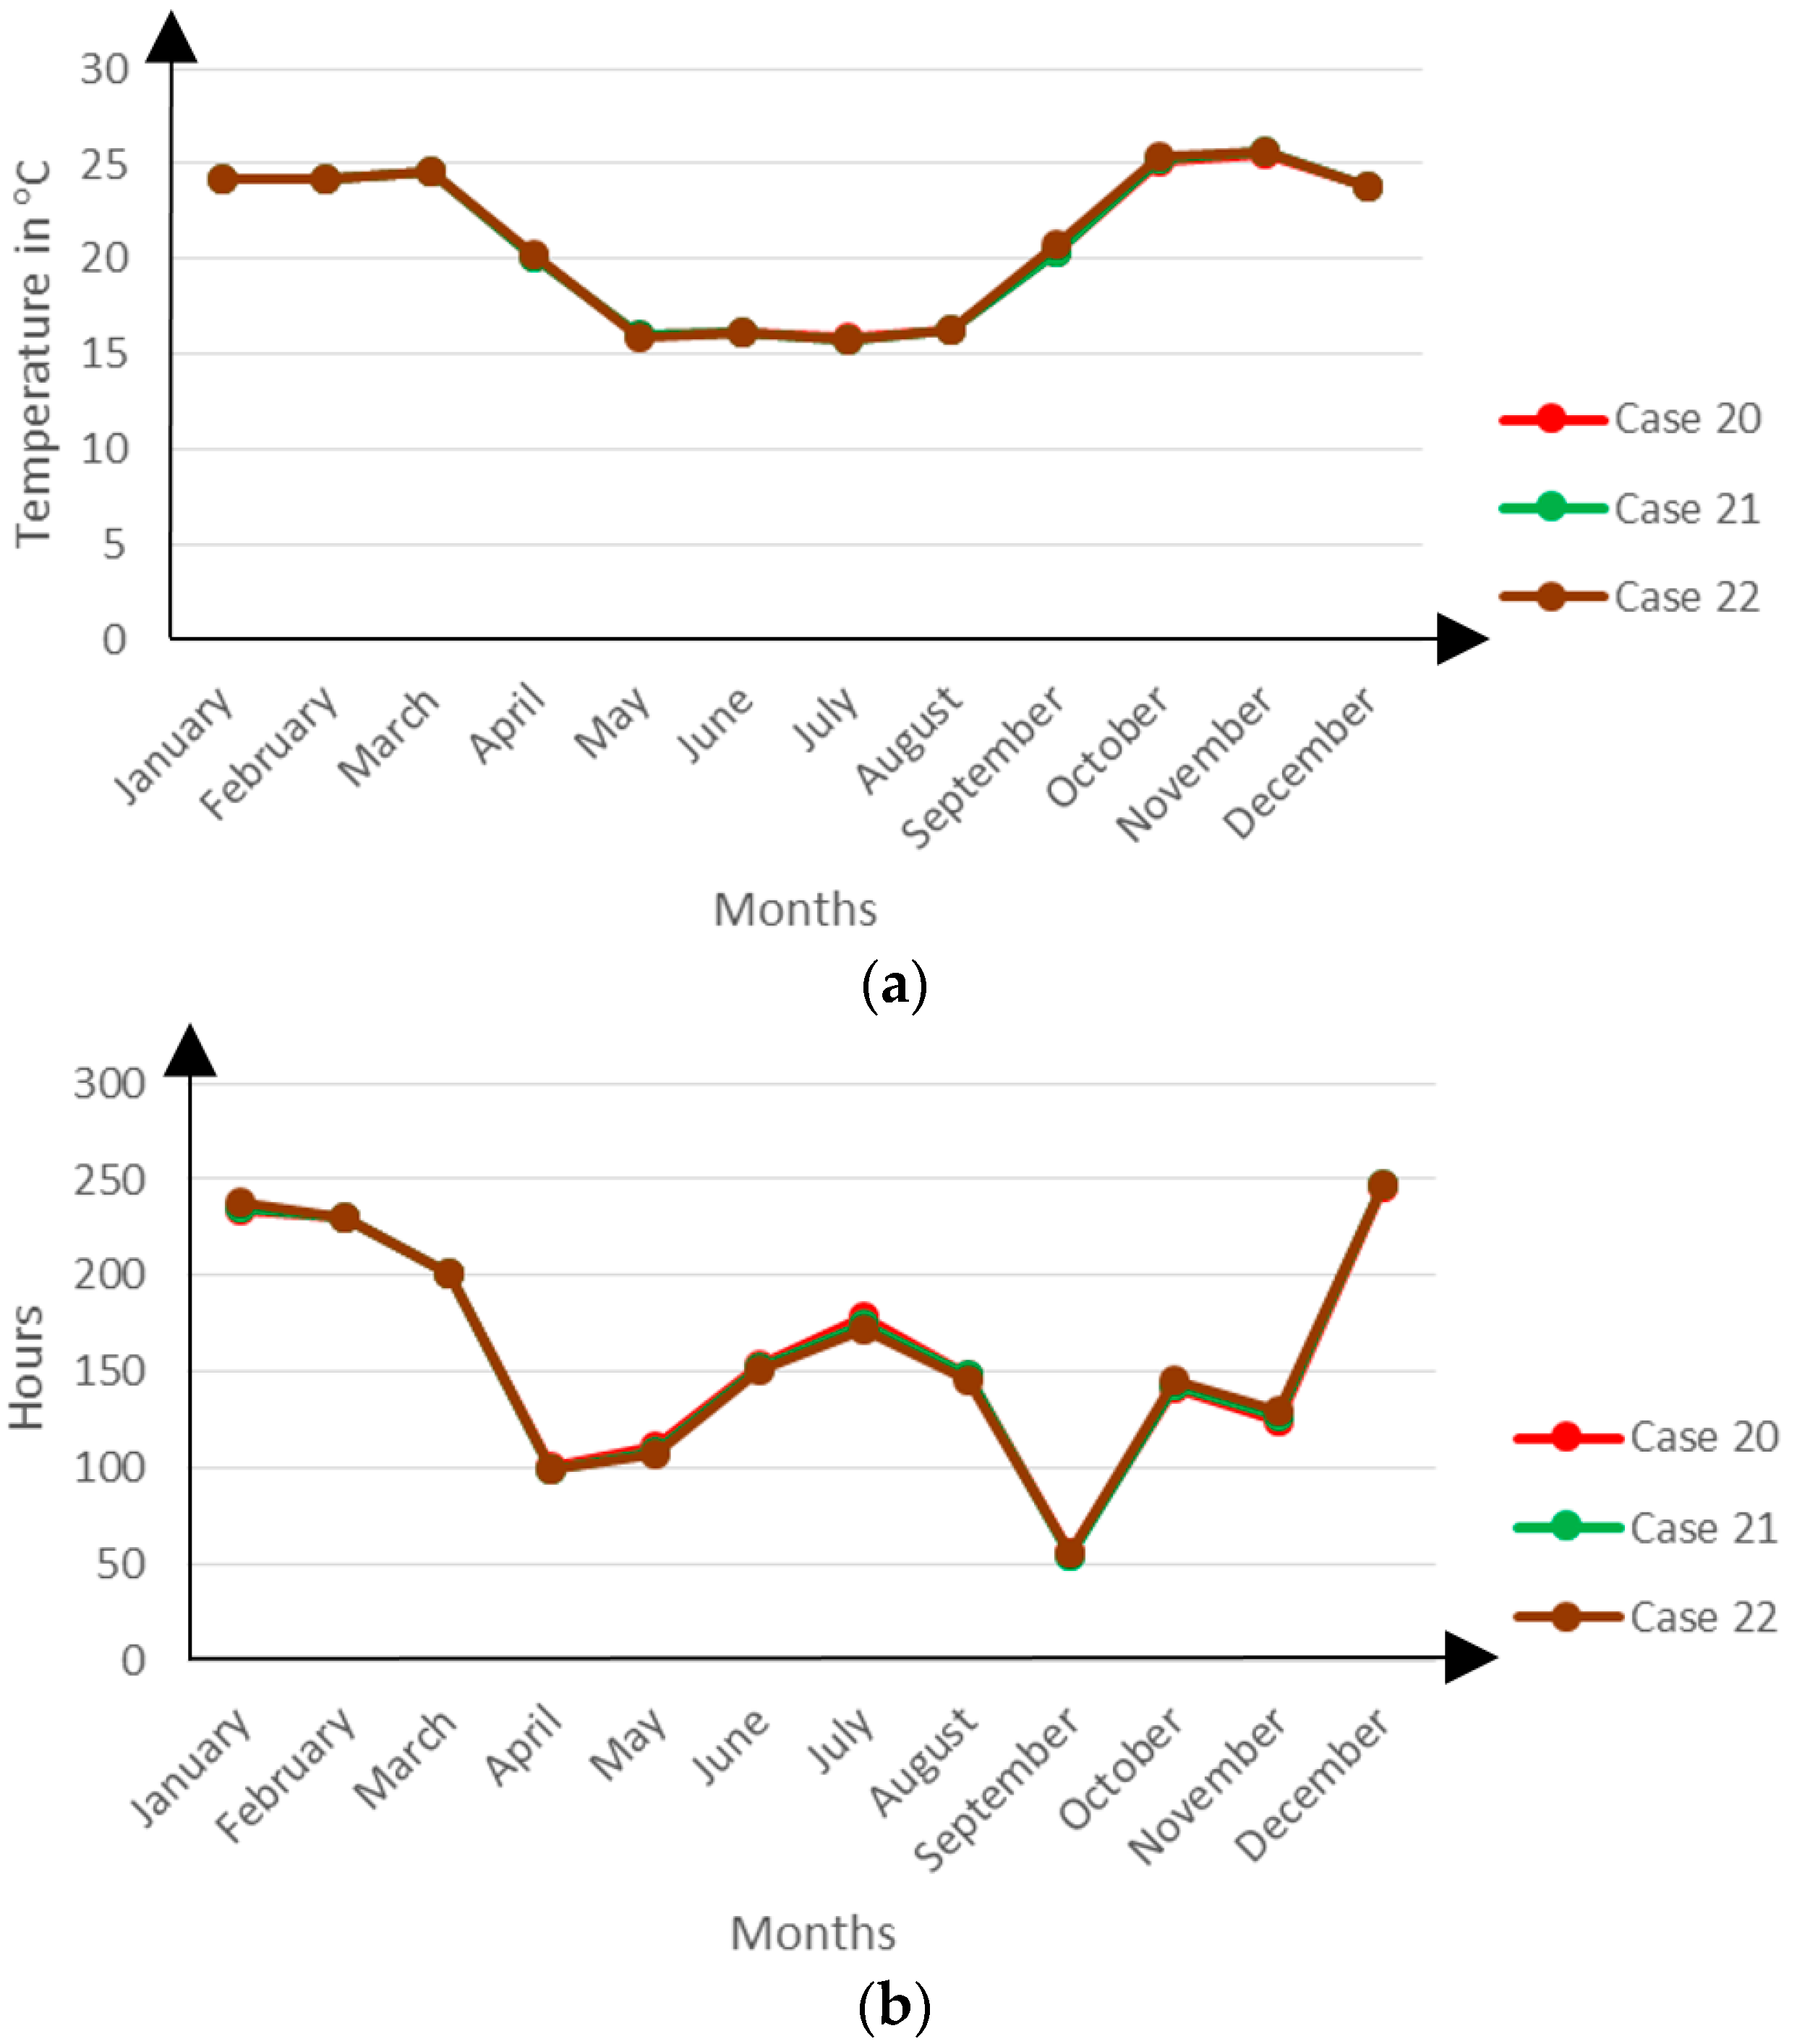
Cases 20, 21 and 22 were used to model the impact of changing the depth of the window overhang on the building’s thermal performance.
The results confirm the ANOVA results that this parameter’s contribution to the thermal performance is very small. There is hardly any marked variation in the zonal temperatures and discomfort hours registered by these Cases as shown in Figure 19 below:
4.10. Optimal Model Performance
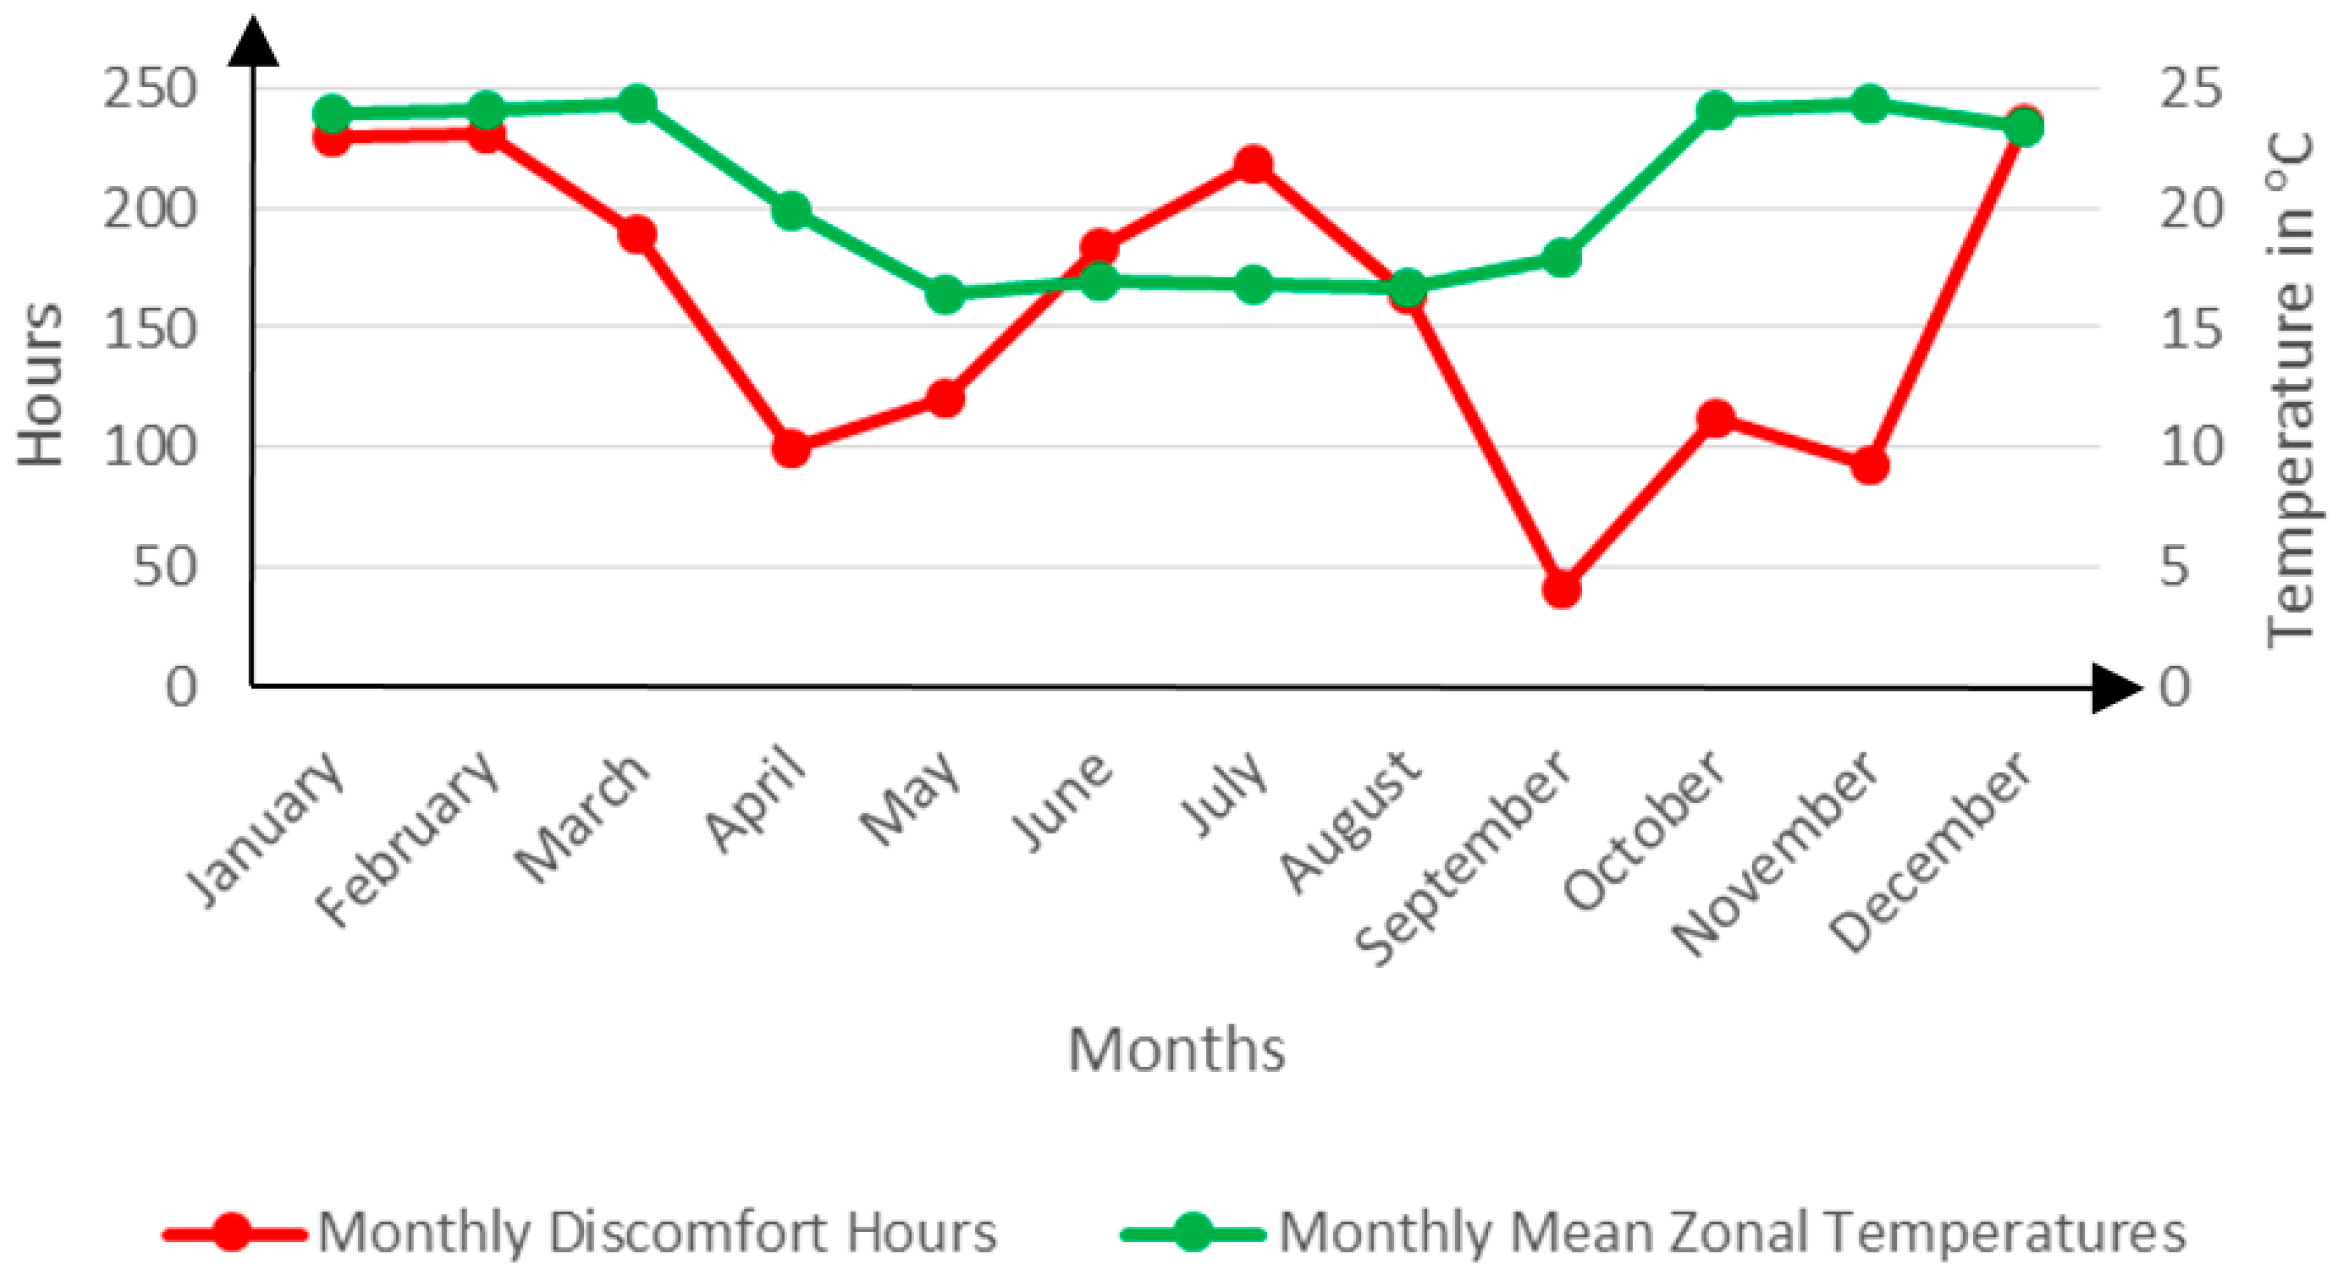
According to results from the simulation runs planned by the listing method, Case 5 emerged with the least amount of discomfort hours and thus qualified as the optimal Case. The study sought to closely examine this Case’s thermal behaviour in the hope of further improving it. The Figure 20 below shows the zonal temperature variations across the year for this Case.
In a fashion typical of all the other Cases, the temperature variation follows the seasonal changes across the year. During the winter period, the model temperatures fall and pick up again during the warmer months between September and March.
The temperature variations have a significant impact on the discomfort hours registered in the model as shown in Figure 20 above.
As the outdoor temperatures begin to fall around March, the indoor environment begins to register similar falls with reciprocal drops in discomfort hours which only last until April before beginning to rise again around May, peaking in July at the height of winter.
Case 5 has the largest air bricks’ surface area and thus the largest air infiltration volumetric flow rate at 0.2408 m3·s−1. The bigger infiltration rate means that during the winter period, Case 5 continues to draw huge volumes of cold air into the indoor environment much to the discomfort of the occupants. However, this volumetric flow rate is seen to be helpful in summer for purposes of enhancing the comfort levels.
At this point, an attempt was made at modifying the infiltration flow rate for Case 5 so as to minimize it but maintain it above 0 m3·s−1. The new infiltration rate was adopted from the upper lower infiltration value in the range of the study parameters (See Table 3).
For the duration of the period between May and August, the air infiltration flow rate would have to be minimized to 0.0601 m3·s−1. The full infiltration rate would have to be maintained for the rest of the year. This dynamism in the infiltration rates would be made possible through the use of operable air bricks whose operational surface area would be adaptable to manipulation.
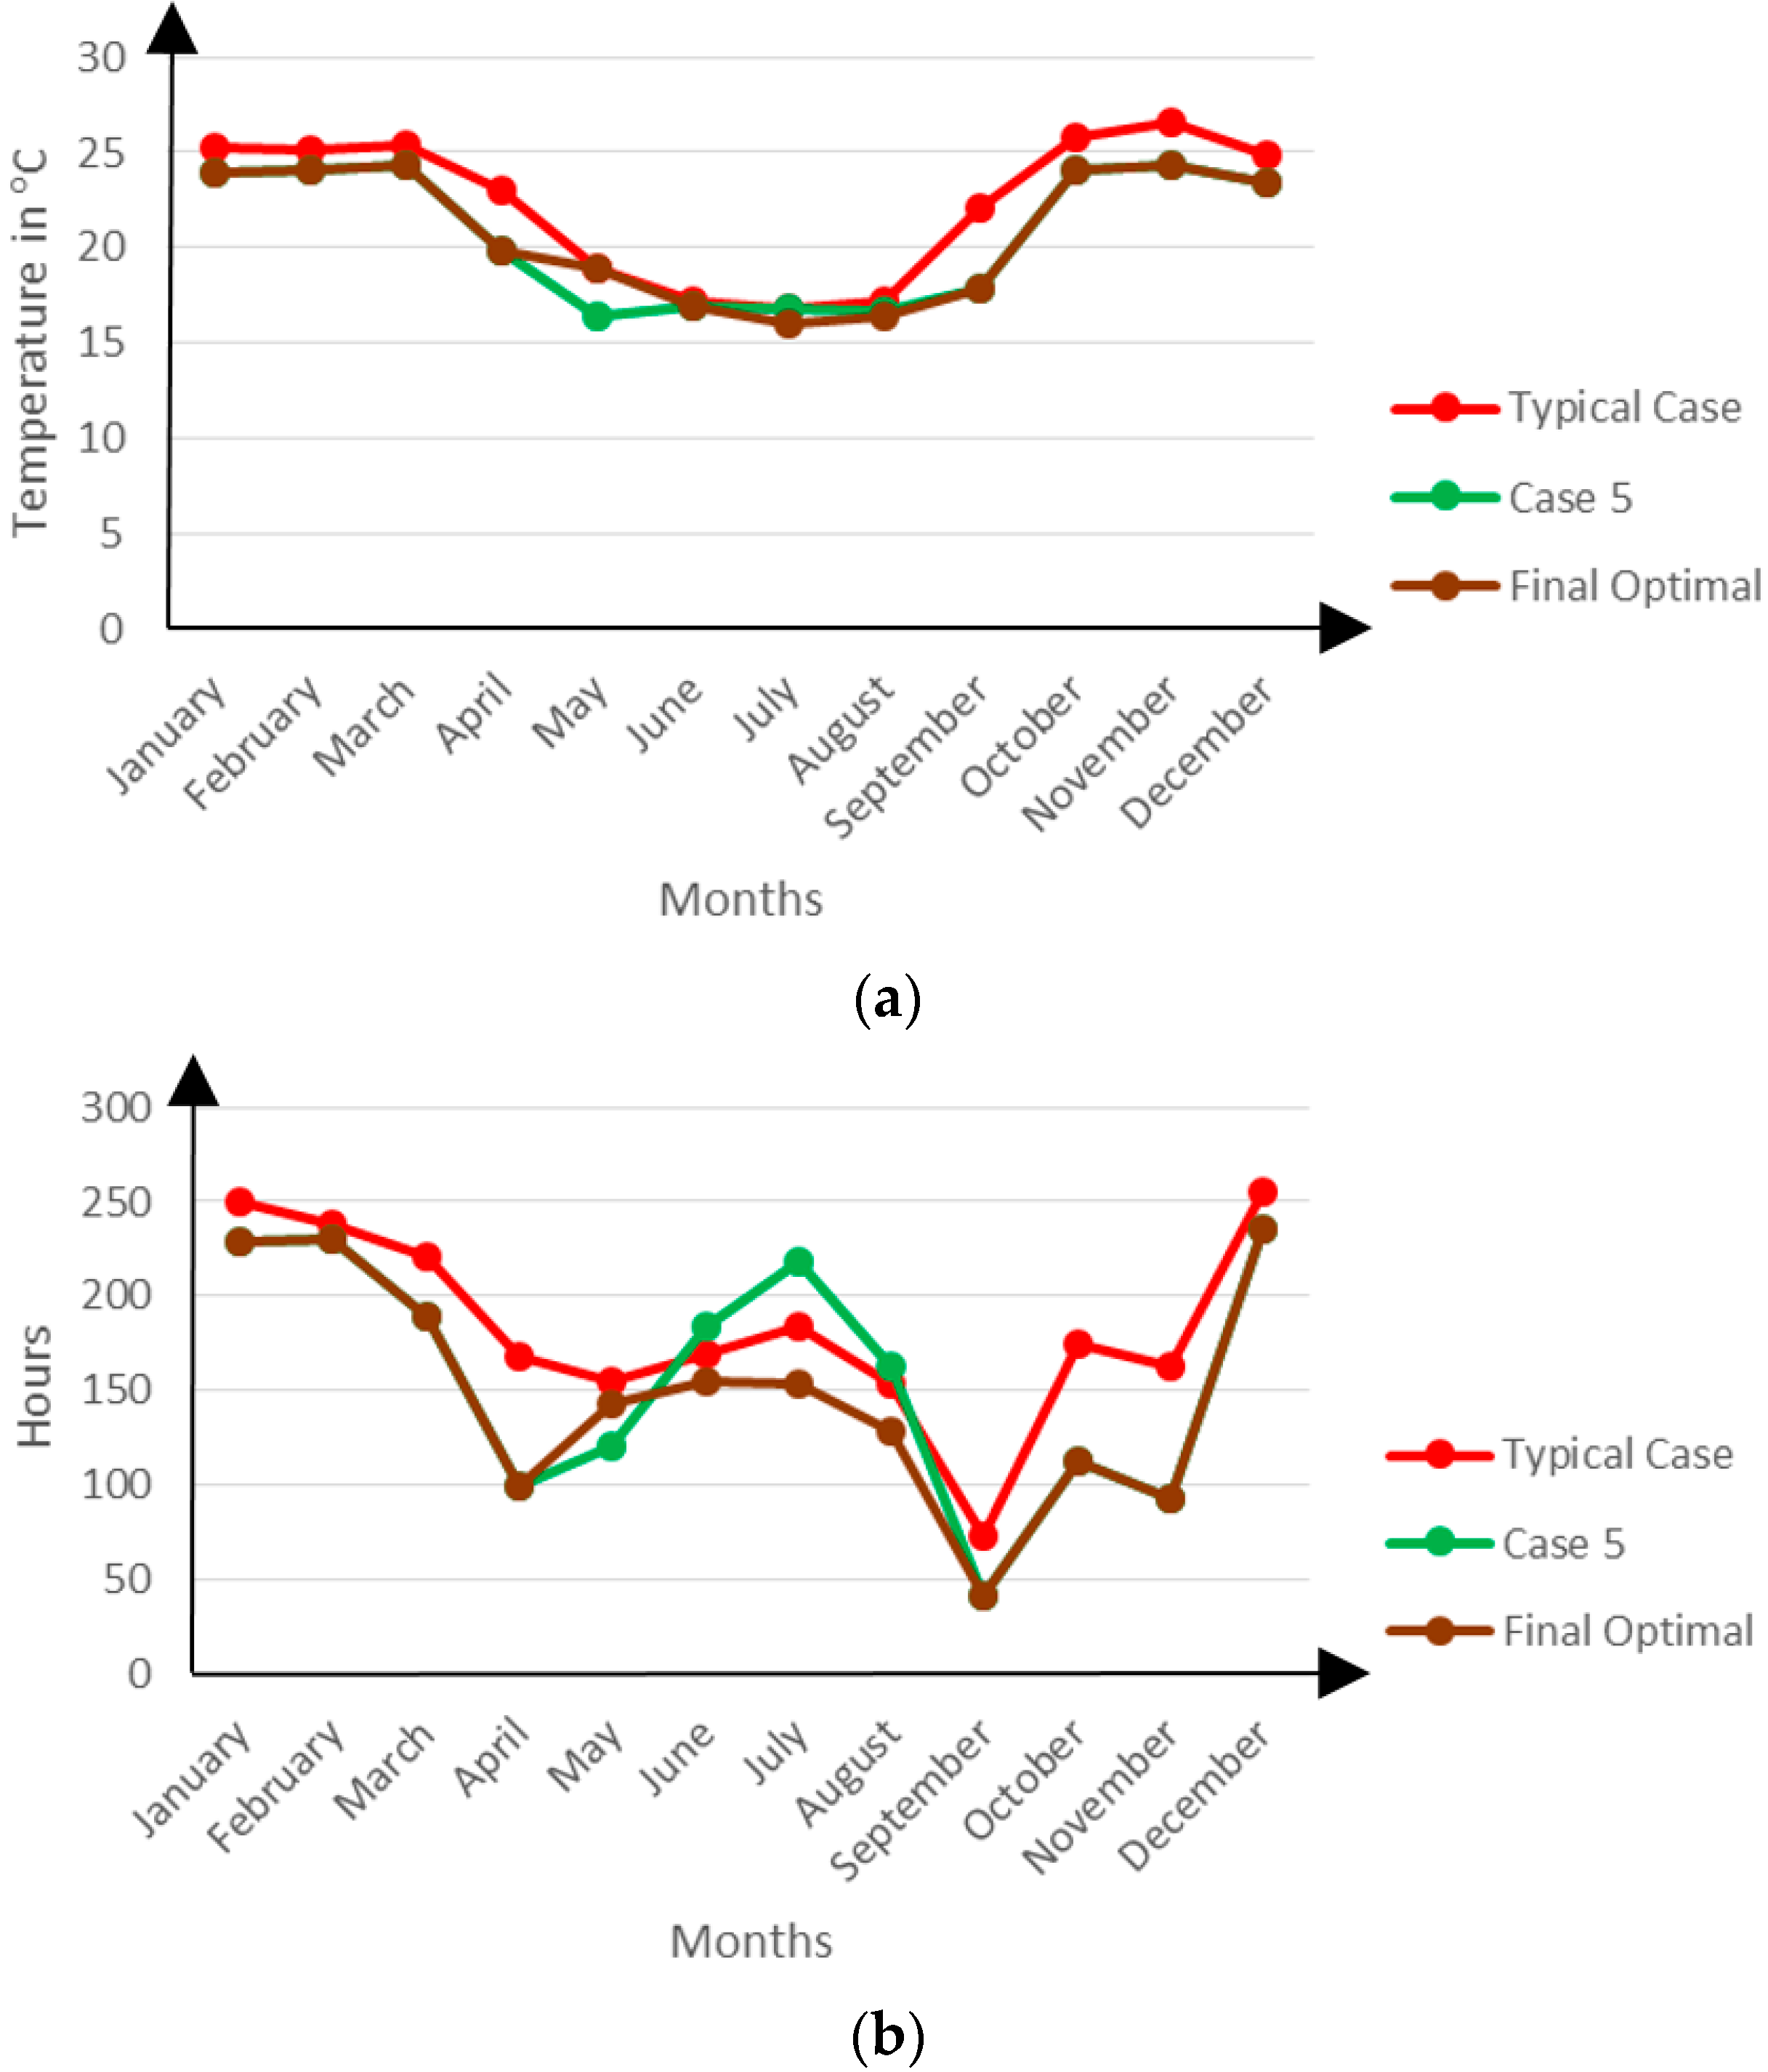
The simulation results from the modified Case 5 show substantial improvements in the thermal performance of the Case as shown in Figure 21 below.
The temperature variation is only marginally different from that of the original Case 5. However, the register of discomfort hours is clearly different. During the winter period, the discomfort hours registered in the modified Case 5 are about 6% lower than those in the original Case 5. These discomfort hours are cumulatively about 18% lower than those registered in the present typical residential building in Malawi. The modified Case 5 now becomes the final optimal case.
5. Conclusions
The study concludes that the optimal envelope thermal design configuration for residential buildings in Malawi is the one as presented in the modified Case 5. The floor in this building’s envelope is made of a relatively thin concrete slab of 50 mm. The walls are 230 mm thick and made of burnt bricks which are externally insulated with a layer of 19 mm thick EPS. The roof is covered with tiles which are internally insulated with a layer of sarking and 50 mm thick EPS. The windows use double low-e glazing and the wall transparency ratio is at 45%. The air bricks’ operational surface area at 0.2408 m2, is such that they encourage maximum air infiltration in summer and then adaptively limit it during winter. The optimal building envelope has been shown to achieve a significantly better thermal performance than the present typical residential building envelope, registering occupant discomfort hours up to 18% lower than the latter.
A statistical comparative analysis of the seven envelope features that were studied shows that air infiltration has the most significant contribution towards the ultimate residential building thermal performance. Uncontrolled infiltration rates however, were seen to have an adverse effect during the winter period. The study demonstrated that controlled air infiltration through the use of operable air bricks whose operational surface area is adaptable to manipulation can be very effective in enhancing the building’s comfort levels.
It was observed that excessive insulation of the building envelope generally has a detrimental effect on the indoor space comfort levels. Model cases which aimed at the maximization of the envelope’s R-value yielded the highest discomfort hours. Nonetheless, a moderated use of insulation has been demonstrated to be very beneficial as seen in the final optimal case.
The study shows that building envelope thermal design has not inspired as much interest in the lowly industrialized countries as it has done in the industrialized ones. The issue remains elusively addressed in building codes and there is very little research work which has been undertaken in this respect. Most of these lowly industrialized countries are located in tropical climatic zones where the study has revealed that passive design alone can only guarantee a very limited improvement in the residential buildings indoor space comfort levels.
There is need to raise the awareness levels on issues to do with building thermal comfort, building energy consumption and the environmental connection. The building codes need to be modernized accordingly. There may also be a need to widen access to sustainable active thermal environment control systems.
In future, further research work could focus on the optimal amounts of envelope insulation, infiltration flow rates and the positioning of air bricks in the context of the tropical climatic conditions prevalent in Malawi and other lowly industrialized countries.
Conflicts of Interest
The author declares no conflict of interest.
Appendix
Figure A1.
The completed L32 orthogonal array.

In the Matrix, numbers 1 and 2 respectively represent the highest and lowest levels of each of the seven variables. The Variables are represented by letters A, B, C, D, E, F and G. The Interaction between the variables is represented by “Letter” × “Letter” e.g., A × B represents the interaction between Floor Thickness and Wall R-Value. DH represents the annual Discomfort Hours registered. The empty columns are identified as Errors, Err.
Figure A2.
Floor envelope configuration.

Figure A3.
Wall envelope configuration.
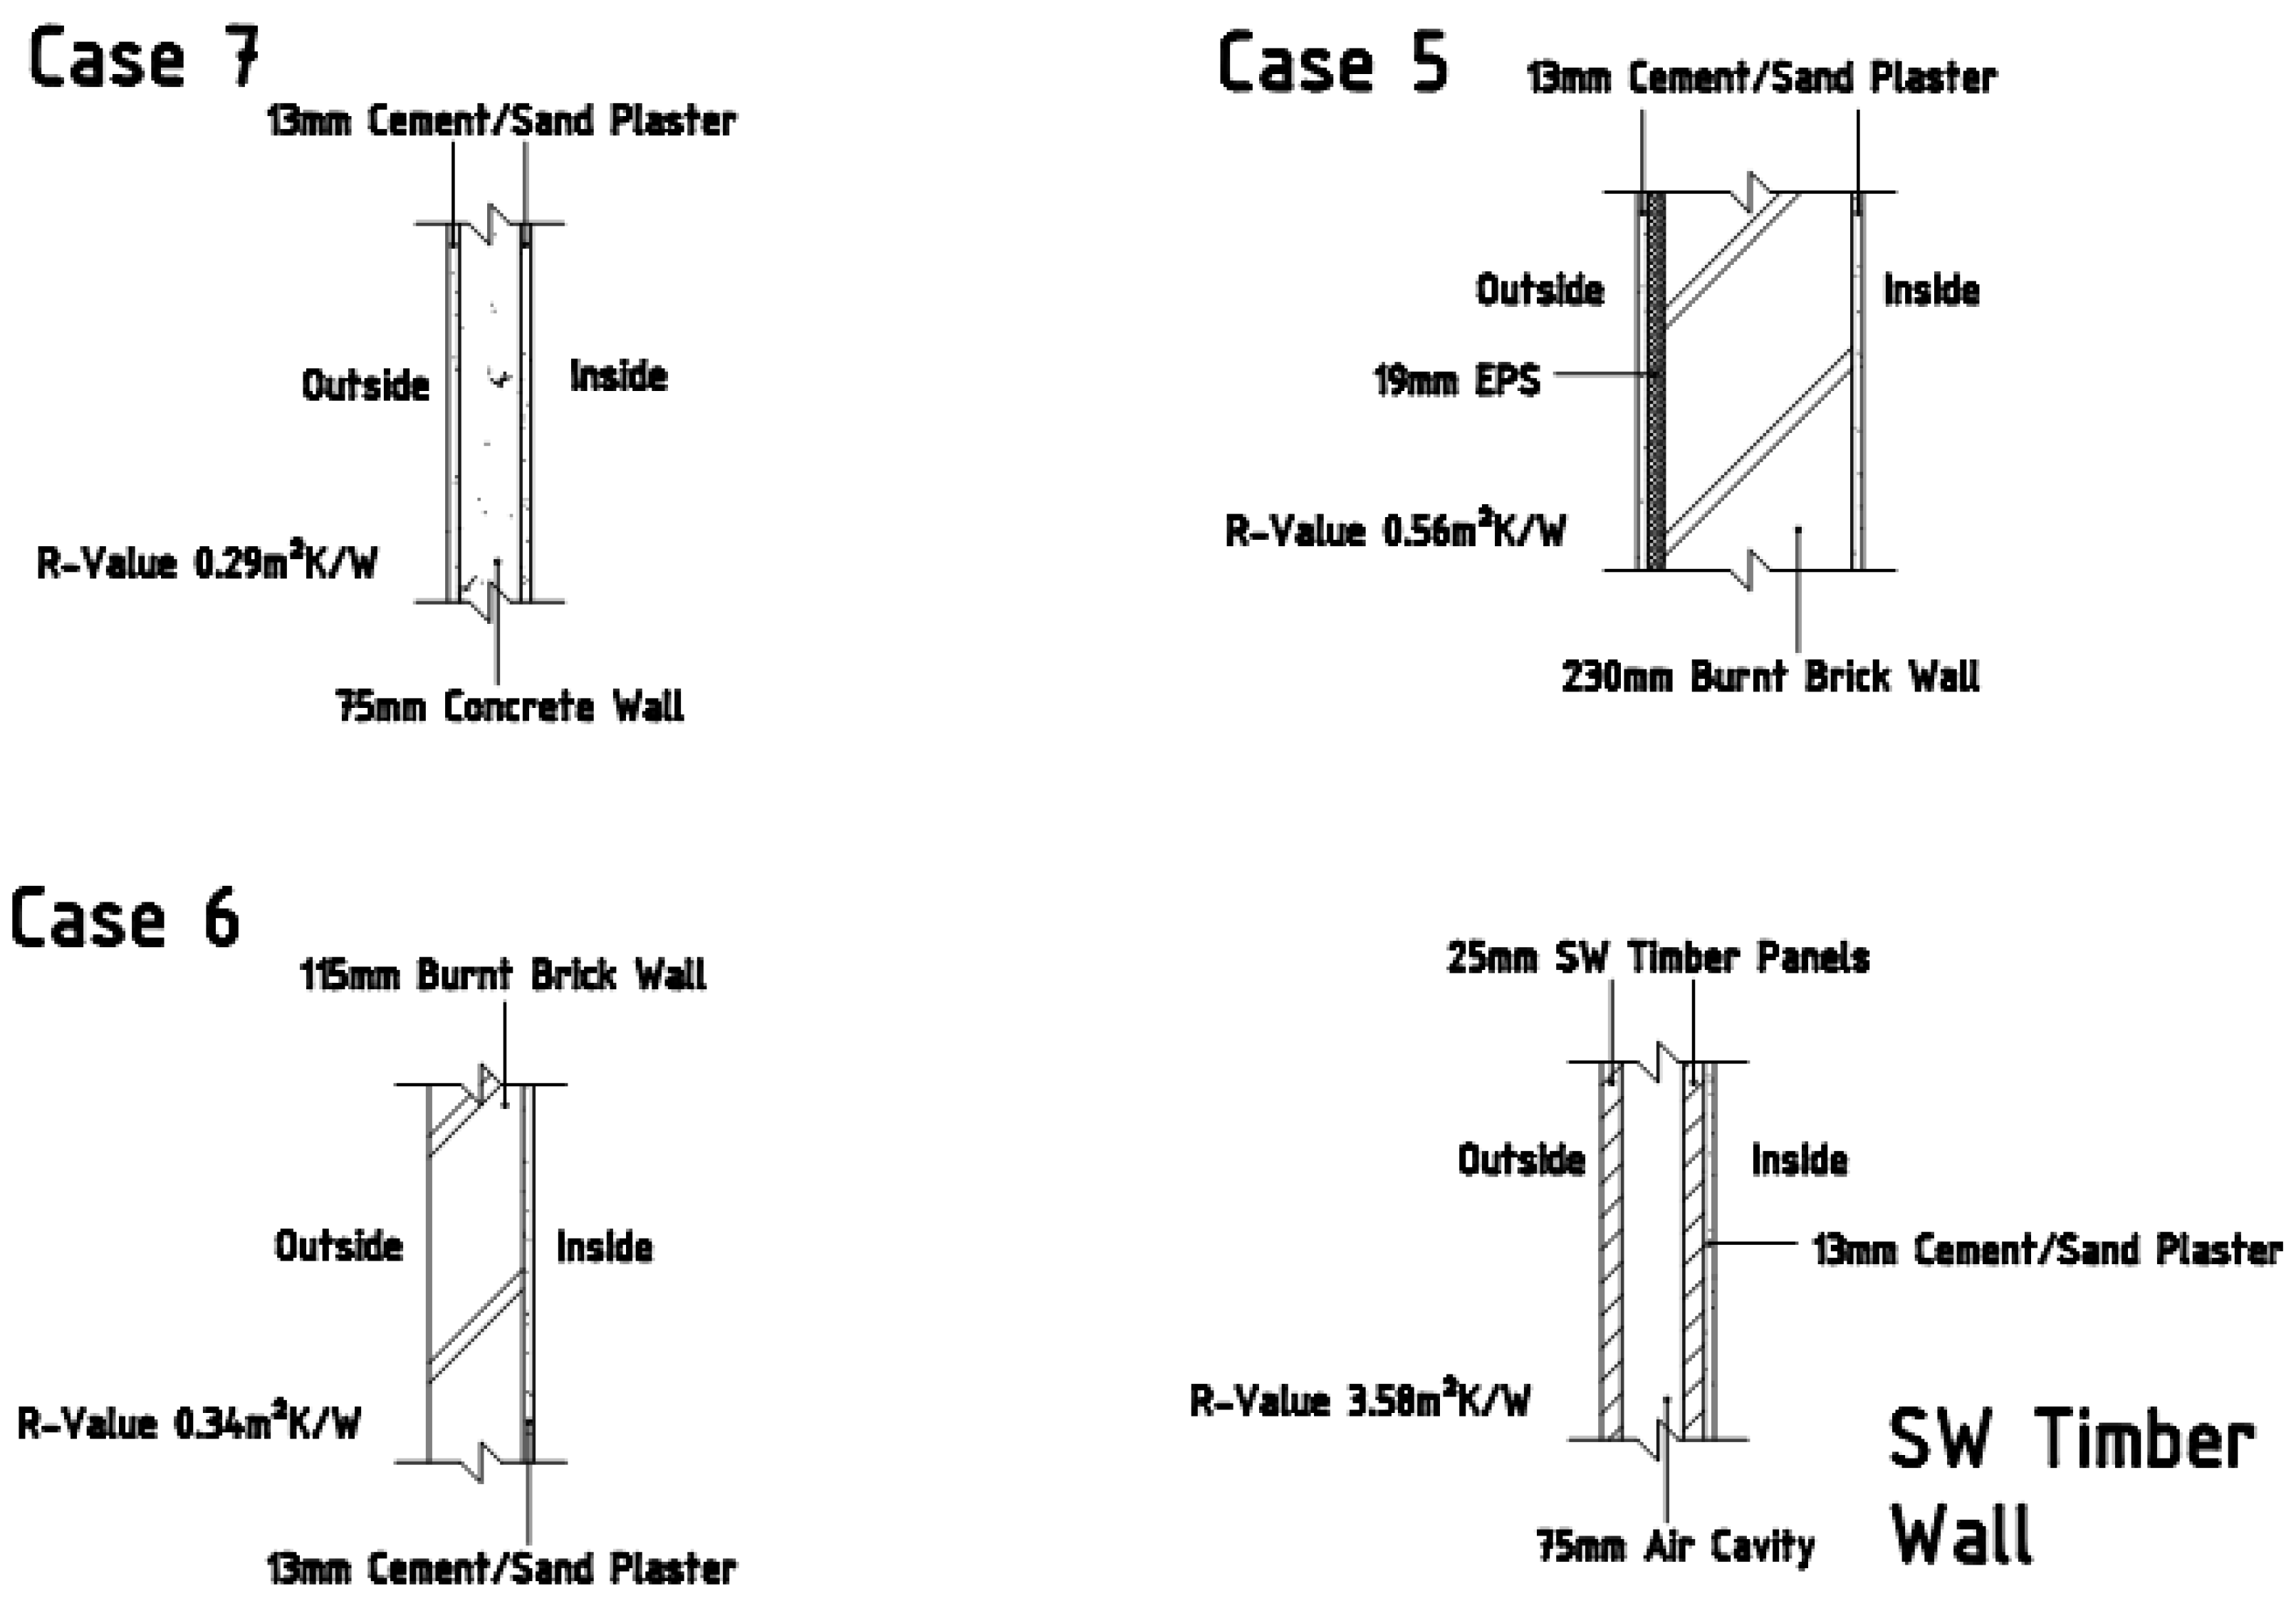
Figure A4.
Roof envelope configuration.

Figure A5.
Air vents infiltration configuration.
References
- Pérez-Lombard, L.; Ortiz, J.; Pout, C. A review on buildings energy consumption information. Energy Build. 2008, 40, 394–398. [Google Scholar] [CrossRef]
- Zalengera, C.; Blanchard, R.E.; Eames, P.C.; Juma, A.M.; Chitawo, M.L.; Gondwe, K.T. Overview of the Malawi energy situation and A PESTLE analysis for sustainable development of renewable energy. Renew. Sustain. Energy Rev. 2014, 38, 335–347. [Google Scholar] [CrossRef]
- Map of Africa. Available online: http://www.worldatlas.com/webimage/countrys/africa/afoutlnew.jpg (accessed on 16 March 2016).
- Map of Malawi. Available online: http://www.nationsonline.org/oneworld/map/malawi_map.htm (accessed on 16 March 2016).
- United Nations Department of Economic and Social Affairs. World Urbanization Prospects: The 2011 Revision; UN-DESA: New York, NY, USA, 2011. [Google Scholar]
- Global Climatic Zones. UK Meteorological Office. Available online: http://www.metoffice.gov.uk/climate-guide/climate/zones (accessed on 10 November 2015).
- Szokolay, S.V. Introduction to Architectural Science: The Basis of Sustainable Design; Architectural Press: Amsterdam, The Netherlands, 2008. [Google Scholar]
- Moffiet, T.; Alterman, D.; Hands, S.; Colyvas, K.; Page, A.; Moghtaderi, B. A statistical study on the combined effects of wall thermal mass and thermal resistance on internal air temperatures. J. Build. Phys. 2014. [Google Scholar] [CrossRef]
- Al-Homoud, M.S. The effectiveness of thermal insulation in different types of buildings in hot climates. J. Therm. Envel. Build. Sci. 2004, 27, 235–247. [Google Scholar] [CrossRef]
- Romani, Z.; Draoui, A.; Allard, F. Metamodeling the heating and cooling energy needs and simultaneous building envelope optimization for low energy building design in Morocco. Energy Build. 2015, 102, 139–148. [Google Scholar] [CrossRef]
- Alaidroos, A.; Krarti, M. Optimal design of residential building envelope systems in the Kingdom of Saudi Arabia. Energy Build. 2015, 86, 104–117. [Google Scholar] [CrossRef]
- Lenoir, A.; Cory, S.; Donn, M.; Garde, F. Optimisation methodology for the design of solar shading for thermal and visual comfort in tropical climates. In Proceedings of the 13th Conference of International Building Performance Simulation Association, Chambery, France, 25–28 August 2013.
- Ihm, P.; Krarti, M. Design optimization of energy efficient residential buildings in Tunisia. Build. Environ. 2012, 58, 81–90. [Google Scholar] [CrossRef]
- Arumugam, R.S.; Garg, V.; Ram, V.V.; Bhatia, A. Optimizing roof insulation for roofs with high albedo coating and radiant barriers in India. J. Build. Eng. 2015, 2, 52–58. [Google Scholar] [CrossRef]
- Laustsen, J. Energy Efficiency Requirements in Building Codes, Energy Efficiency Policies for New Buildings; International Energy Agency (IEA): Paris, France, 2008; pp. 477–488. [Google Scholar]
- Building and Construction Authority (BCA). Code for Environmental Sustainability of Buildings; BCA: Singapore, 2012. [Google Scholar]
- New Zealand Building Code. New Zealand Government. Available online: www.dbh.govt.nz (accessed on 30 June 2015).
- Myrsalieva, N. Energy Efficiency in the Arab World: Designing Indicators on Energy Efficiency Progress Evaluation. Master’s Thesis, Lund University, Lund, Sweden, 2012. [Google Scholar]
- Emtairah, T.; Myrsalieva, N.; Samborsky, B. Arab Renewable Energy Index: Investigating the Investment Climate. Available online: http://www.lth.se/fileadmin/iiiee/Photos_and_images/Arab_Renewable_Energy_Index_04.pdf (accessed on 15 March 2016).
- Green Building Regulations & Specifications. Government of Dubai. Available online: http://www.dewa.gov.ae/images/greenbuilding_eng.pdf (accessed on 15 March 2016).
- Al-Homoud, M.S. Envelope thermal design optimization of buildings with intermittent occupancy. J. Build. Phys. 2009, 33, 65–82. [Google Scholar] [CrossRef]
- Ahmad, E.H. Cost analysis and thickness optimization of thermal insulation materials used in residential buildings in Saudi Arabia. In Proceedings of the 6th Saudi Engineering Conference, Dhahran, Saudi Arabia, 14–17 December 2002; pp. 21–32.
- Taleb, H.M. Using passive cooling strategies to improve thermal performance and reduce energy consumption of residential buildings in UAE buildings. Front. Archit. Res. 2014, 3, 154–165. [Google Scholar] [CrossRef]
- Mohammad, S.; Shea, A. Performance evaluation of modern building thermal envelope designs in the semi-arid continental climate of Tehran. Buildings 2013, 3, 674–688. [Google Scholar] [CrossRef]
- Liping, W.; Hien, W.N. The impacts of ventilation strategies and facade on indoor thermal environment for naturally ventilated residential buildings in Singapore. Build. Environ. 2007, 42, 4006–4015. [Google Scholar] [CrossRef]
- Kalua, A.; Zhan, C.; Chang, C.C. A review of green building advocacy in least developed countries. In Proceedings of the CIB W107 2014 International Conference, Lagos, Nigeria, 28–30 January 2014.
- Chirisa, I. Building and Urban Planning in Zimbabwe with Special Reference to Harare: Putting Needs, Costs and Sustainability in Focus. Available online: http://www.consiliencejournal.org/index.php/consilience/article/viewFile/348/193 (accessed on 15 March 2016).
- UN-HABITAT. Malawi Urban Housing Sector Profile; UN-HABITAT: Nairobi, Kenya, 2010. [Google Scholar]
- Malawi Bureau of Standards. Catalogue of Malawi Standards; Malawi Bureau of Standards: Blantyre, Malawi, 2013.
- Energy Regulation Board—Zambia. Available online: http://www.zambiayp.com/company/5117/Energy_Regulation_Board (accessed on 15 March 2016).
- Mourtada, A. Resources Efficiency and Conservation Measures for Buildings-“RECM-Standard”; United Nations Human Settlements Programme: Nairobi, Kenya, 2013; p. 86. [Google Scholar]
- Rwanda Utilities Regulatory Agency. Guidelines Promoting Energy Efficiency Measures; Rwanda Utilities Regulatory Agency: Kigali, Rwanda, 2012. [Google Scholar]
- Visiteche, E. Legal Framework for Promoting Energy Efficiency in Buildings. Available online: https://www.linkedin.com/pulse/legal-framework-promoting-energy-efficiency-buildings-eche-visiteche (accessed on 15 March 2016).
- United Nations Development Programme. Promoting Energy Efficiency in Residential and Public Buildings in Nigeria; United Nations Development Programme: New York, NY, USA, 2011. [Google Scholar]
- Government of Sierra Leone. National Energy Profile of Sierra Leone; Development Programme: New York, NY, USA, 2012.
- Masoso, O.; Grobler, L. A new and innovative look at anti-insulation behaviour in building energy consumption. Energy Build. 2008, 40, 1889–1894. [Google Scholar] [CrossRef]
- Masoso, O.; Grobler, L.J. The dark side of occupants’ behaviour on building energy use. Energy Build. 2010, 42, 173–177. [Google Scholar] [CrossRef]
- Zingano, B. A discussion on thermal comfort with reference to bath water temperature to deduce a midpoint of the thermal comfort temperature zone. Renew. Energy 2001, 23, 41–47. [Google Scholar] [CrossRef]
- Nematchoua, M.K.; Tchinda, R.; Ricciardi, P.; Djongyang, N. A field study on thermal comfort in naturally-ventilated buildings located in the equatorial climatic region of Cameroon. Renew. Sustain. Energy Rev. 2014, 39, 381–393. [Google Scholar] [CrossRef]
- National Statistical Office. Household and Housing Conditions Report; National Statistical Office: Zomba, Malawi, 2008. [Google Scholar]
- Map of Malawi & Zimbabwe. Available online: www.google.com/maps (accessed on 30 June 2015).
- Malawi Meteorological Services. Available online: http://www.metmalawi.com/ (accessed on 15 March 2016).
- American Society of Heating, Refrigerating and Air Conditioning Engineers. Fundamentals; ASHRAE: Atlanta, GA, USA, 2001. [Google Scholar]
- American Society of Heating, Refrigerating and Air Conditioning Engineers. Fundamentals Handbook; ASHRAE: Atlanta, GA, USA, 2009. [Google Scholar]
- Nguyen, A.T.; Reiter, S. Passive Designs and Strategies for Low-Cost Housing using Simulation-Based Optimization and Different Thermal Criteria. J. Build. Perform. Simul. 2014, 7, 68–81. [Google Scholar] [CrossRef]
- Węglarz, A.; Narowski, P. The optimal thermal design of residential buildings using energy simulation and fuzzy sets theory. In Proceedings of the Building Simulation, Sydney, Australia, 14–16 November 2011.
- Gong, X.; Akashi, Y.; Sumiyoshi, D. Optimization of passive design measures for residential buildings in different Chinese areas. Building Environ. 2012, 58, 46–57. [Google Scholar] [CrossRef]
- Futrell, B.J.; Ozelkan, E.C.; Brentrup, D. Bi-objective Optimization of Building Enclosure Design for Thermal and Lighting Performance. Build. Environ. 2015, 92, 591–602. [Google Scholar] [CrossRef]
- Magnier, L.; Haghighat, F. Multiobjective optimization of building design using TRNSYS simulations, genetic algorithm, and Artificial Neural Network. Build. Environ. 2010, 45, 739–746. [Google Scholar] [CrossRef]
- Hwang, R.L.; Lin, T.P.; Liang, H.H.; Yang, K.H.; Yeh, T.C. Additive model for thermal comfort generated by matrix experiment using orthogonal array. Build. Environ. 2009, 44, 1730–1739. [Google Scholar] [CrossRef]
- Fraley, S.; Oom, M.; Terrien, B.; Date, J. Design of Experiments via Taguchi Methods: Orthogonal Arrays. The Michigan Chemical Process Dynamic and Controls Open Text Book. Available online: http://controls.engin.umich.edu (accessed on 20 August 2010).
- American Society of Heating, Refrigerating and Air Conditioning Engineers. Standard 55. Thermal Environmental Conditions for Human Occupancy; ASHRAE: Atlanta, GA, USA, 2004. [Google Scholar]
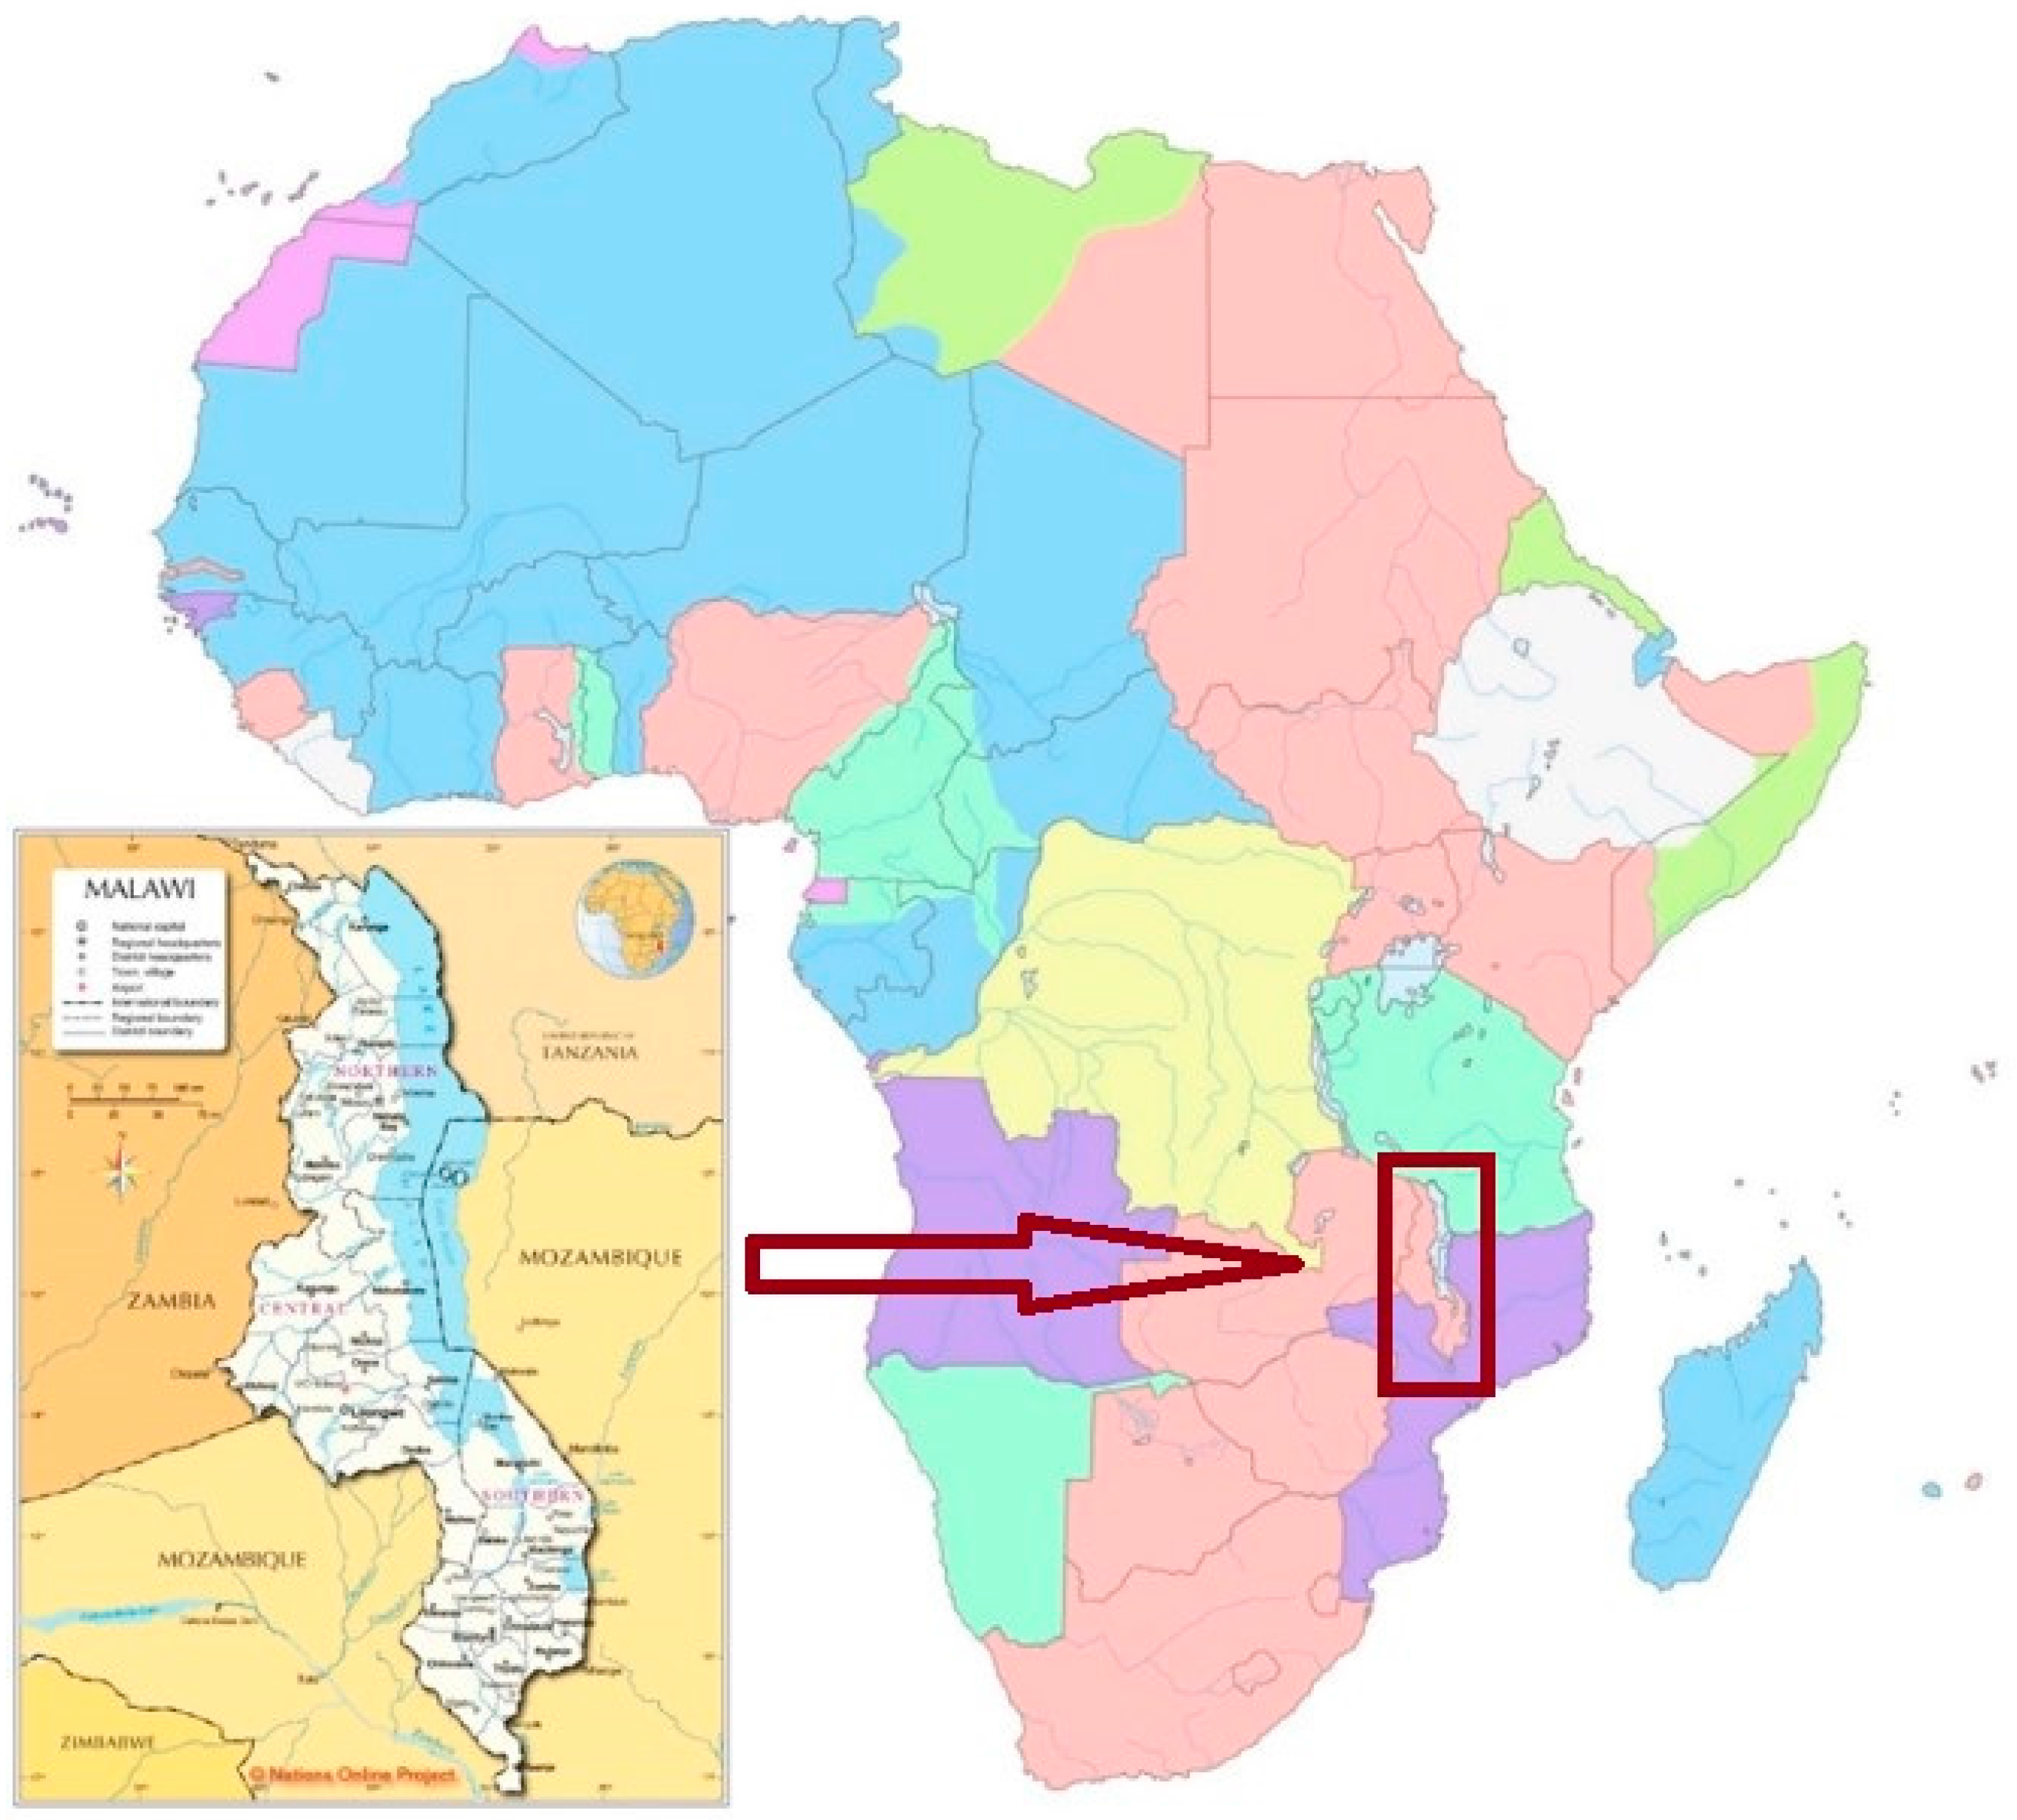
Figure 2.
Floor plan and elevations of urban residential building model.


Figure 3.
Map showing geographical locations of Malawi and Zimbabwe [41].
Figure 3.
Map showing geographical locations of Malawi and Zimbabwe [41].

Figure 4.
Mean monthly temperatures in °C for Harare, Mzuzu, Lilongwe and Blantyre.

Figure 5.
Building model thermal zones.
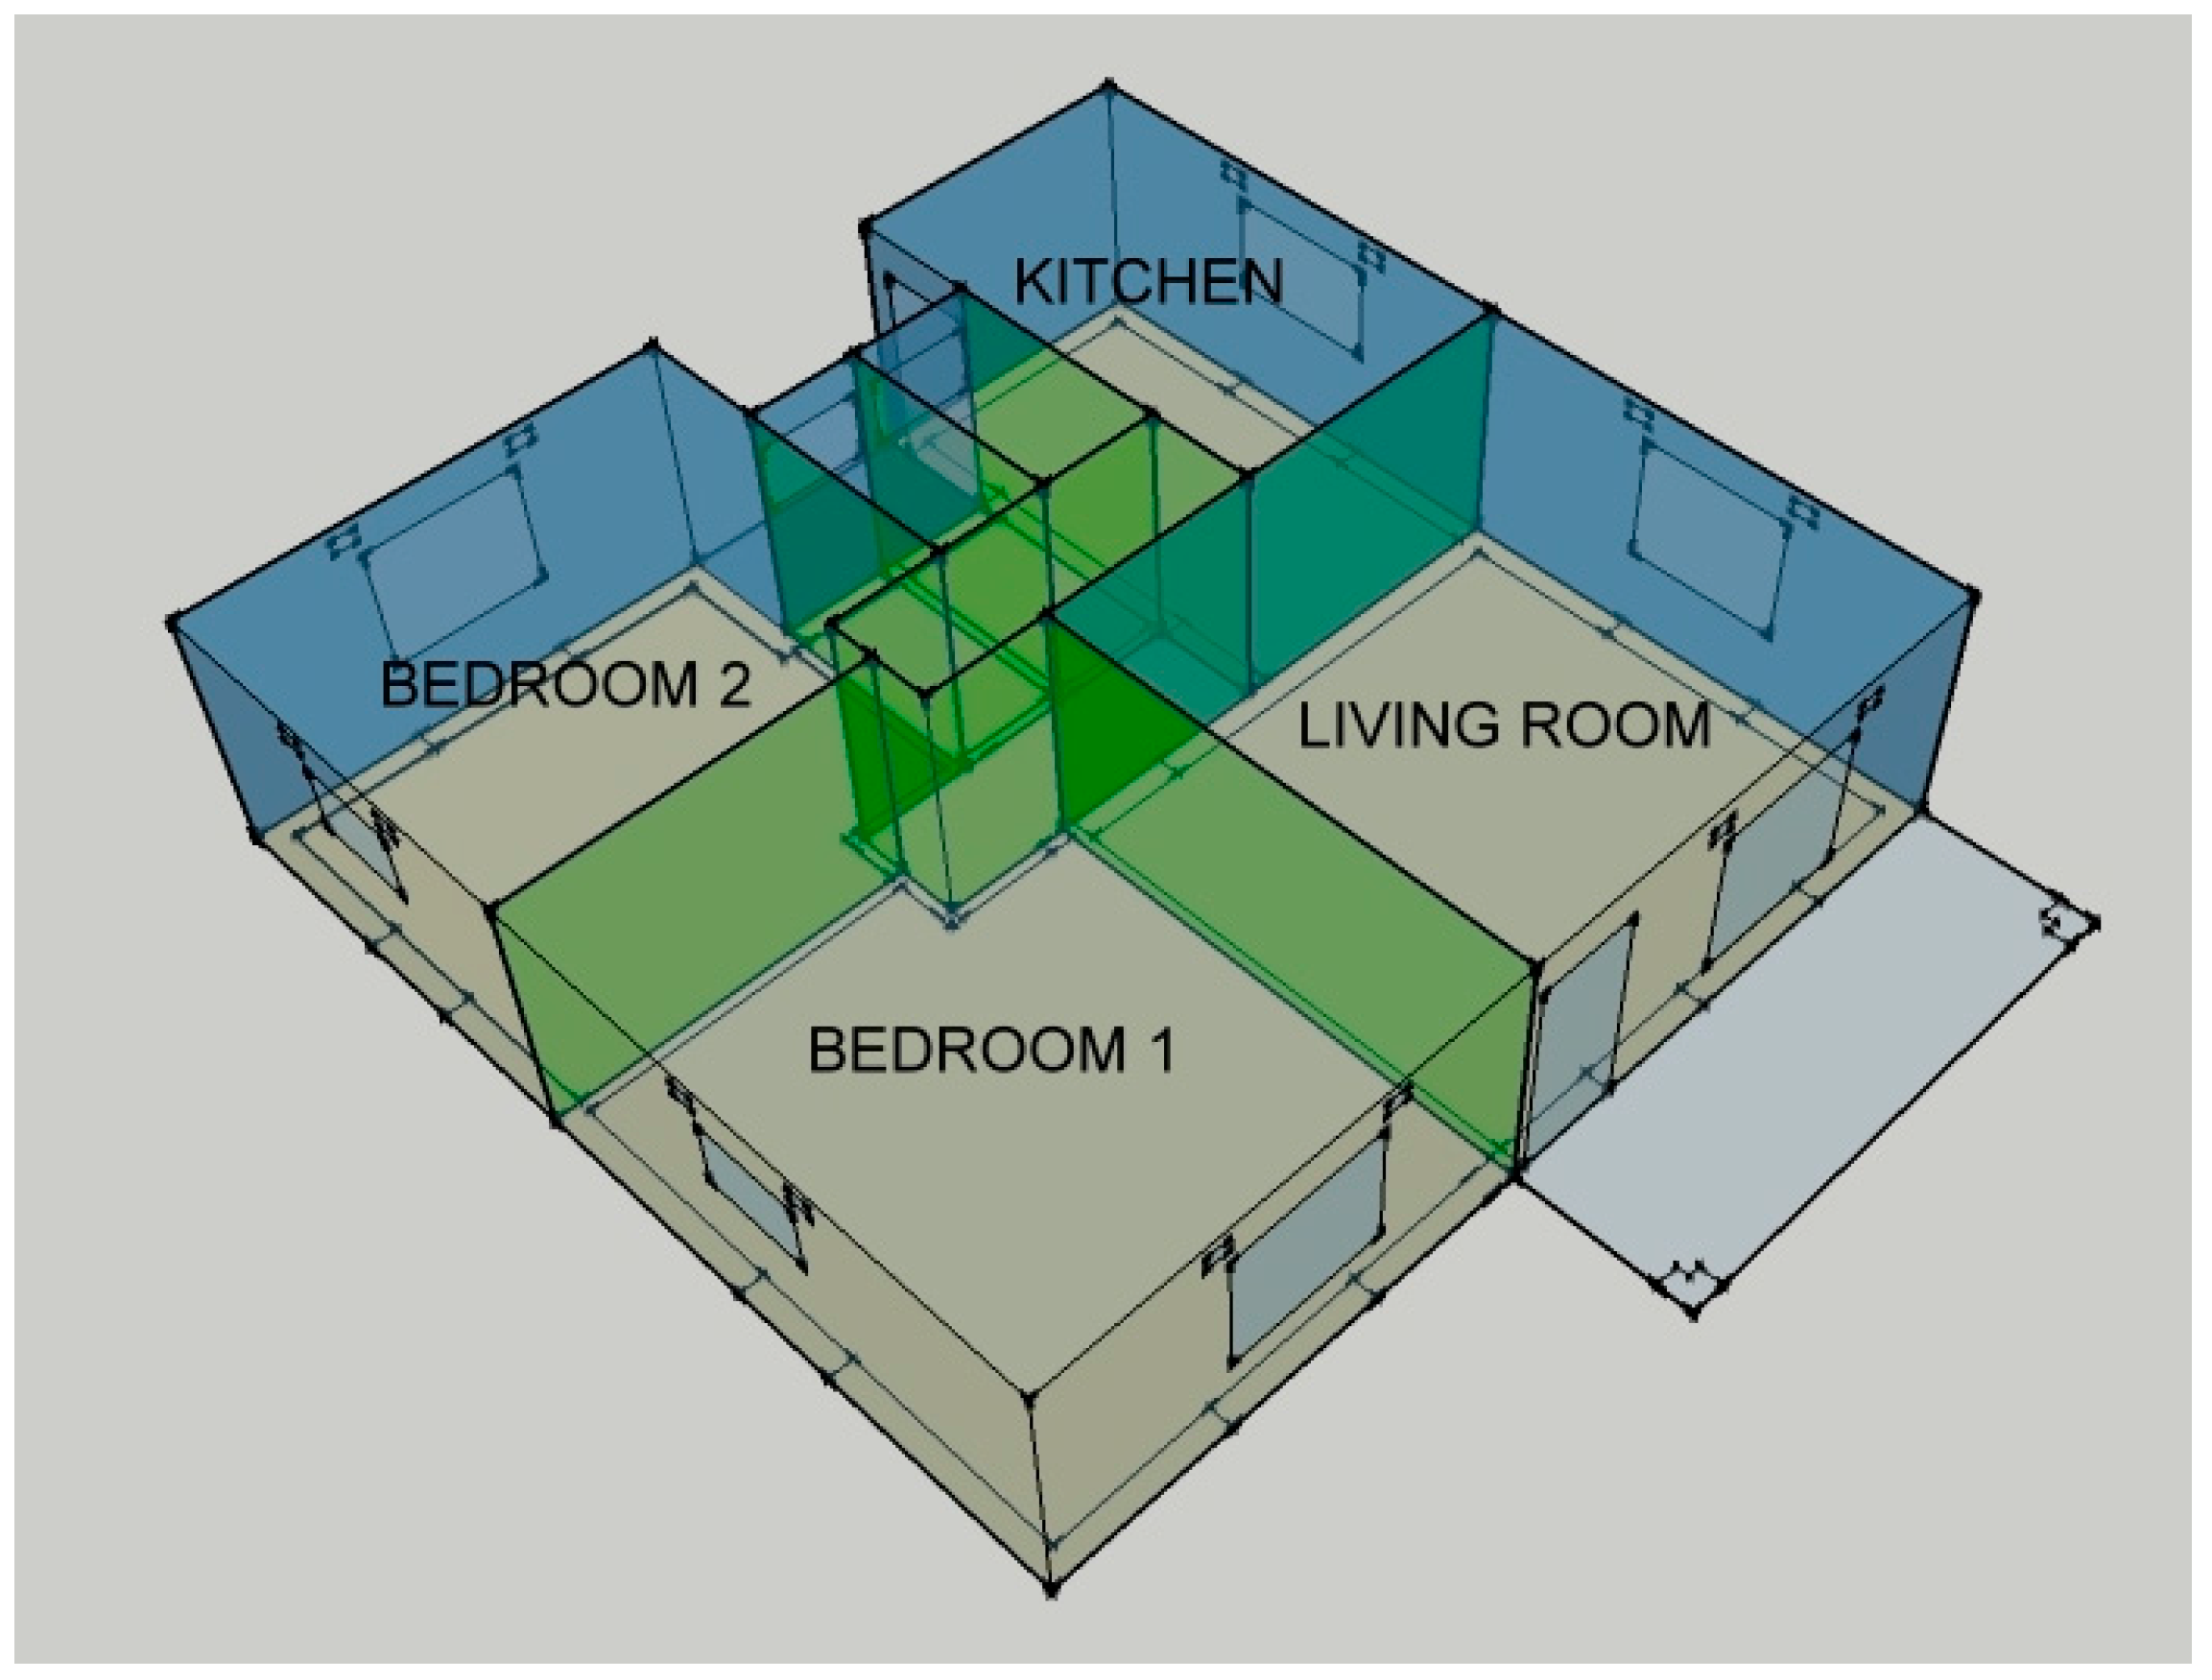
Figure 6.
Living room in singly zoned model.
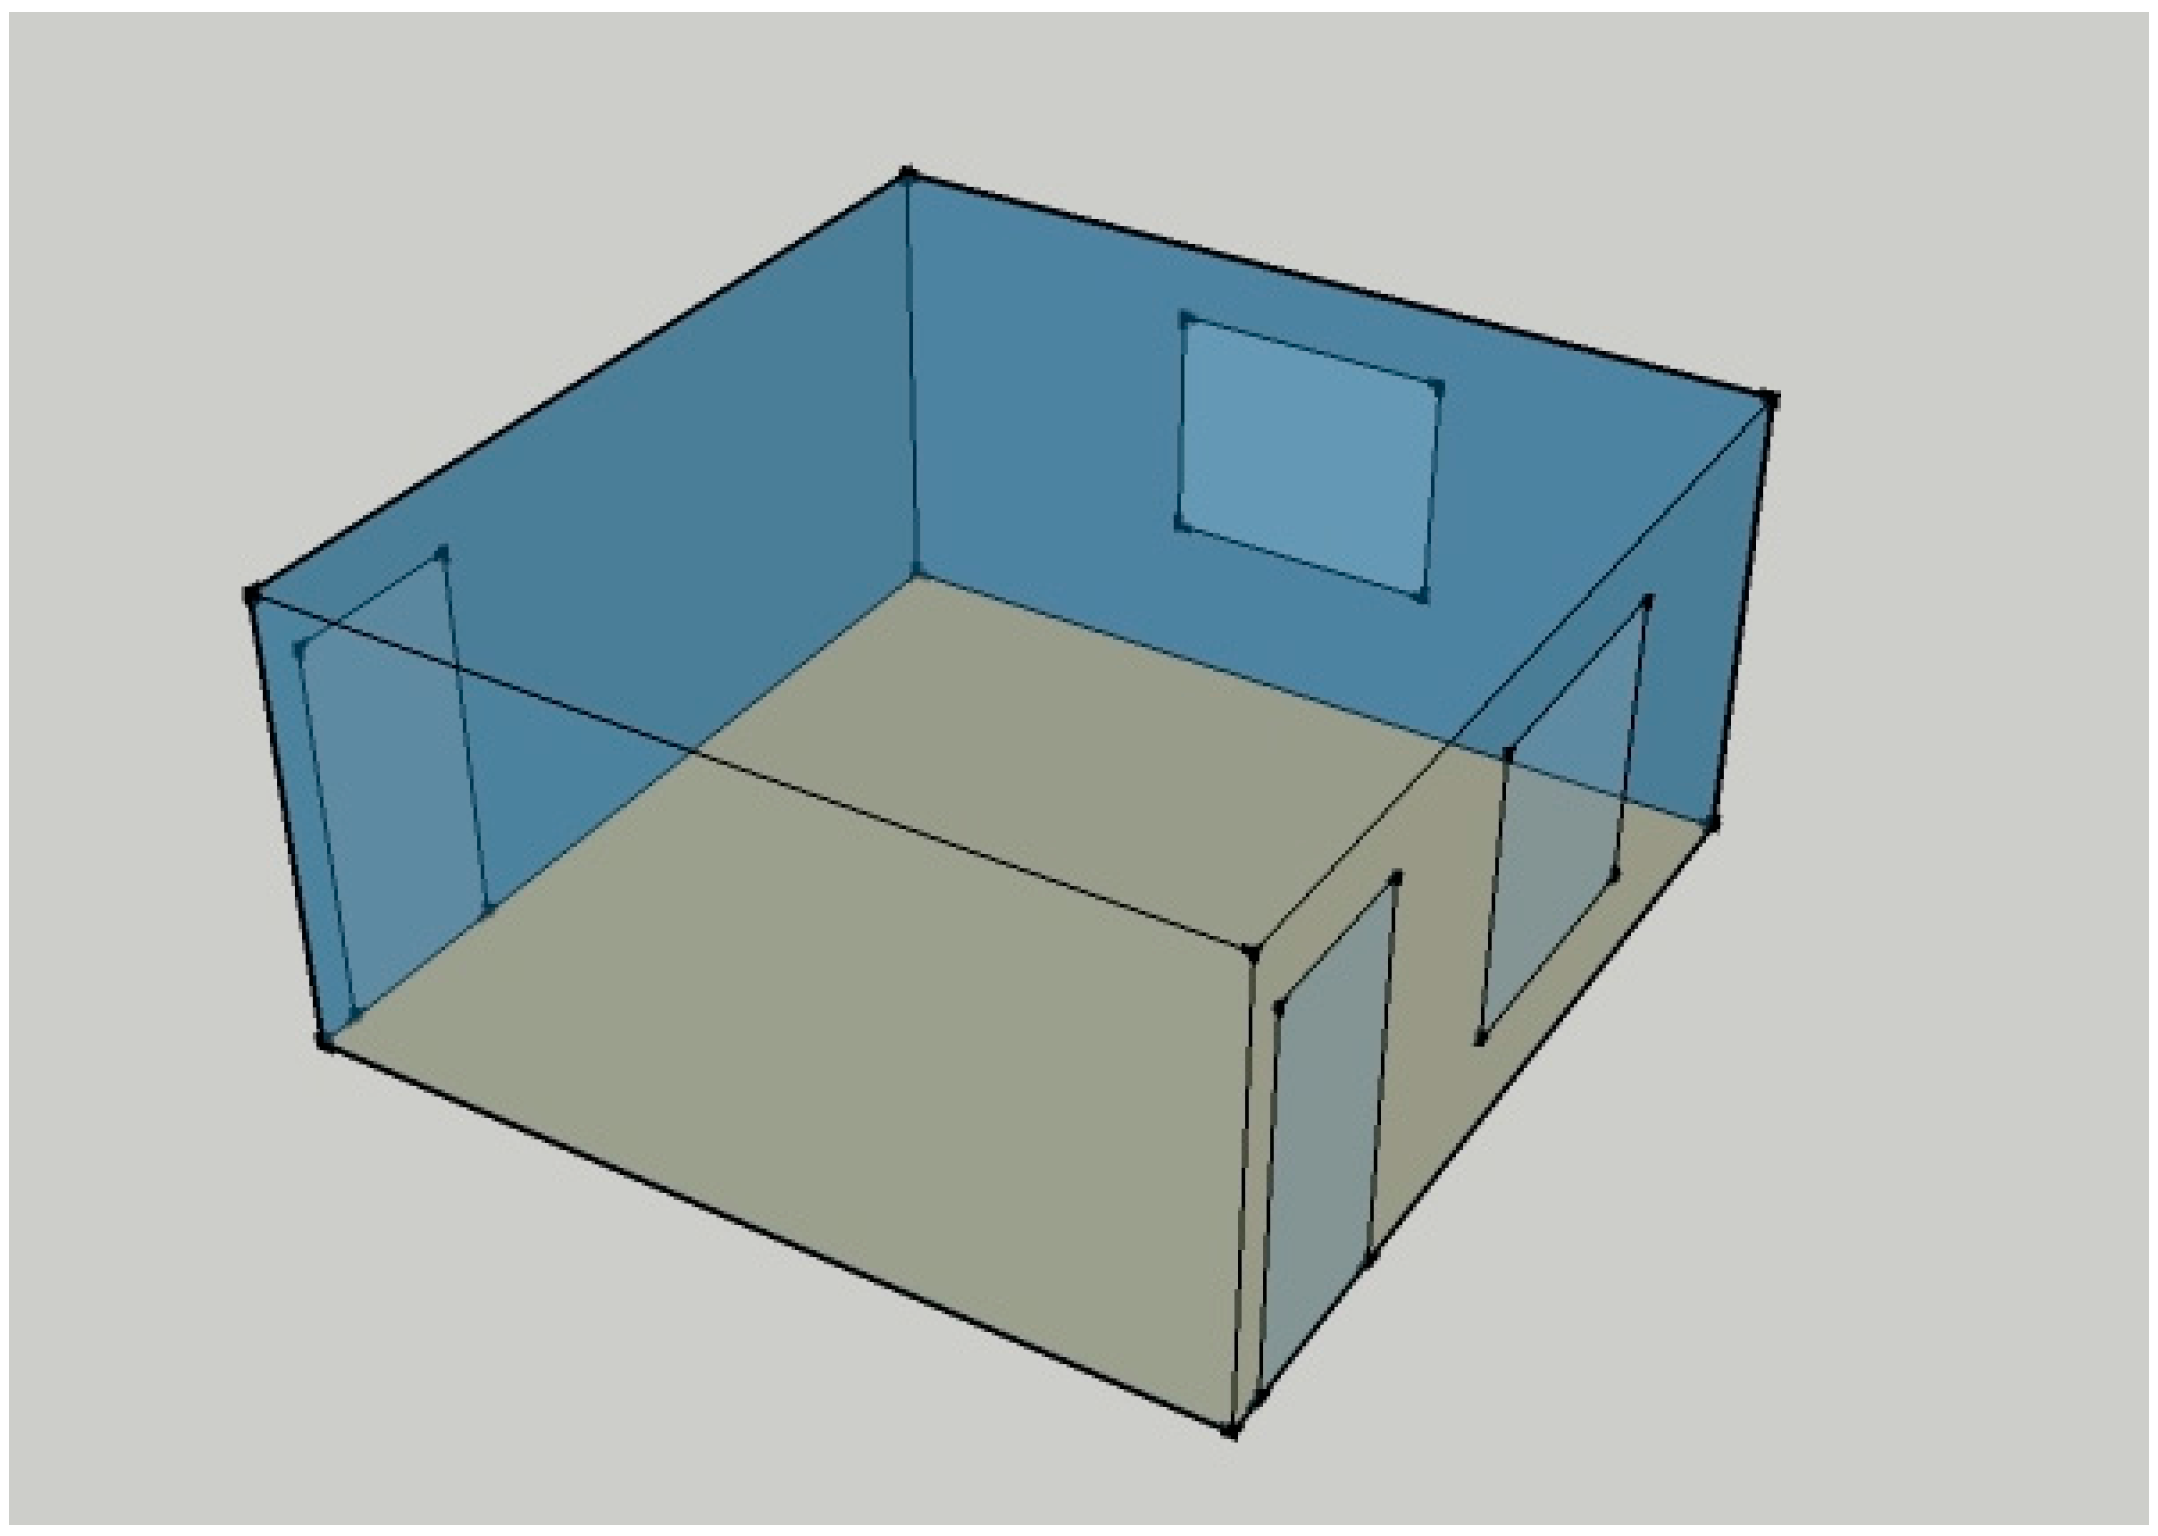
Figure 7.
Flow of work when using Orthogonal Arrays Optimization Methodology.

Figure 8.
Monthly mean zonal temperature (a) and discomfort hours (b) for Cases 2, 3 and 4.

Figure 9.
Monthly mean zonal temperature for Cases 5, 6 and 7.

Figure 10.
Discomfort hours for Cases 5, 6 and 7.

Figure 11.
Comparison of indoor and outdoor temperatures for Cases 5, 6 and 7.

Figure 12.
Monthly mean zonal temperatures for Cases 8, 9 and 10.

Figure 13.
Discomfort hours for Cases 8, 9 and 10.
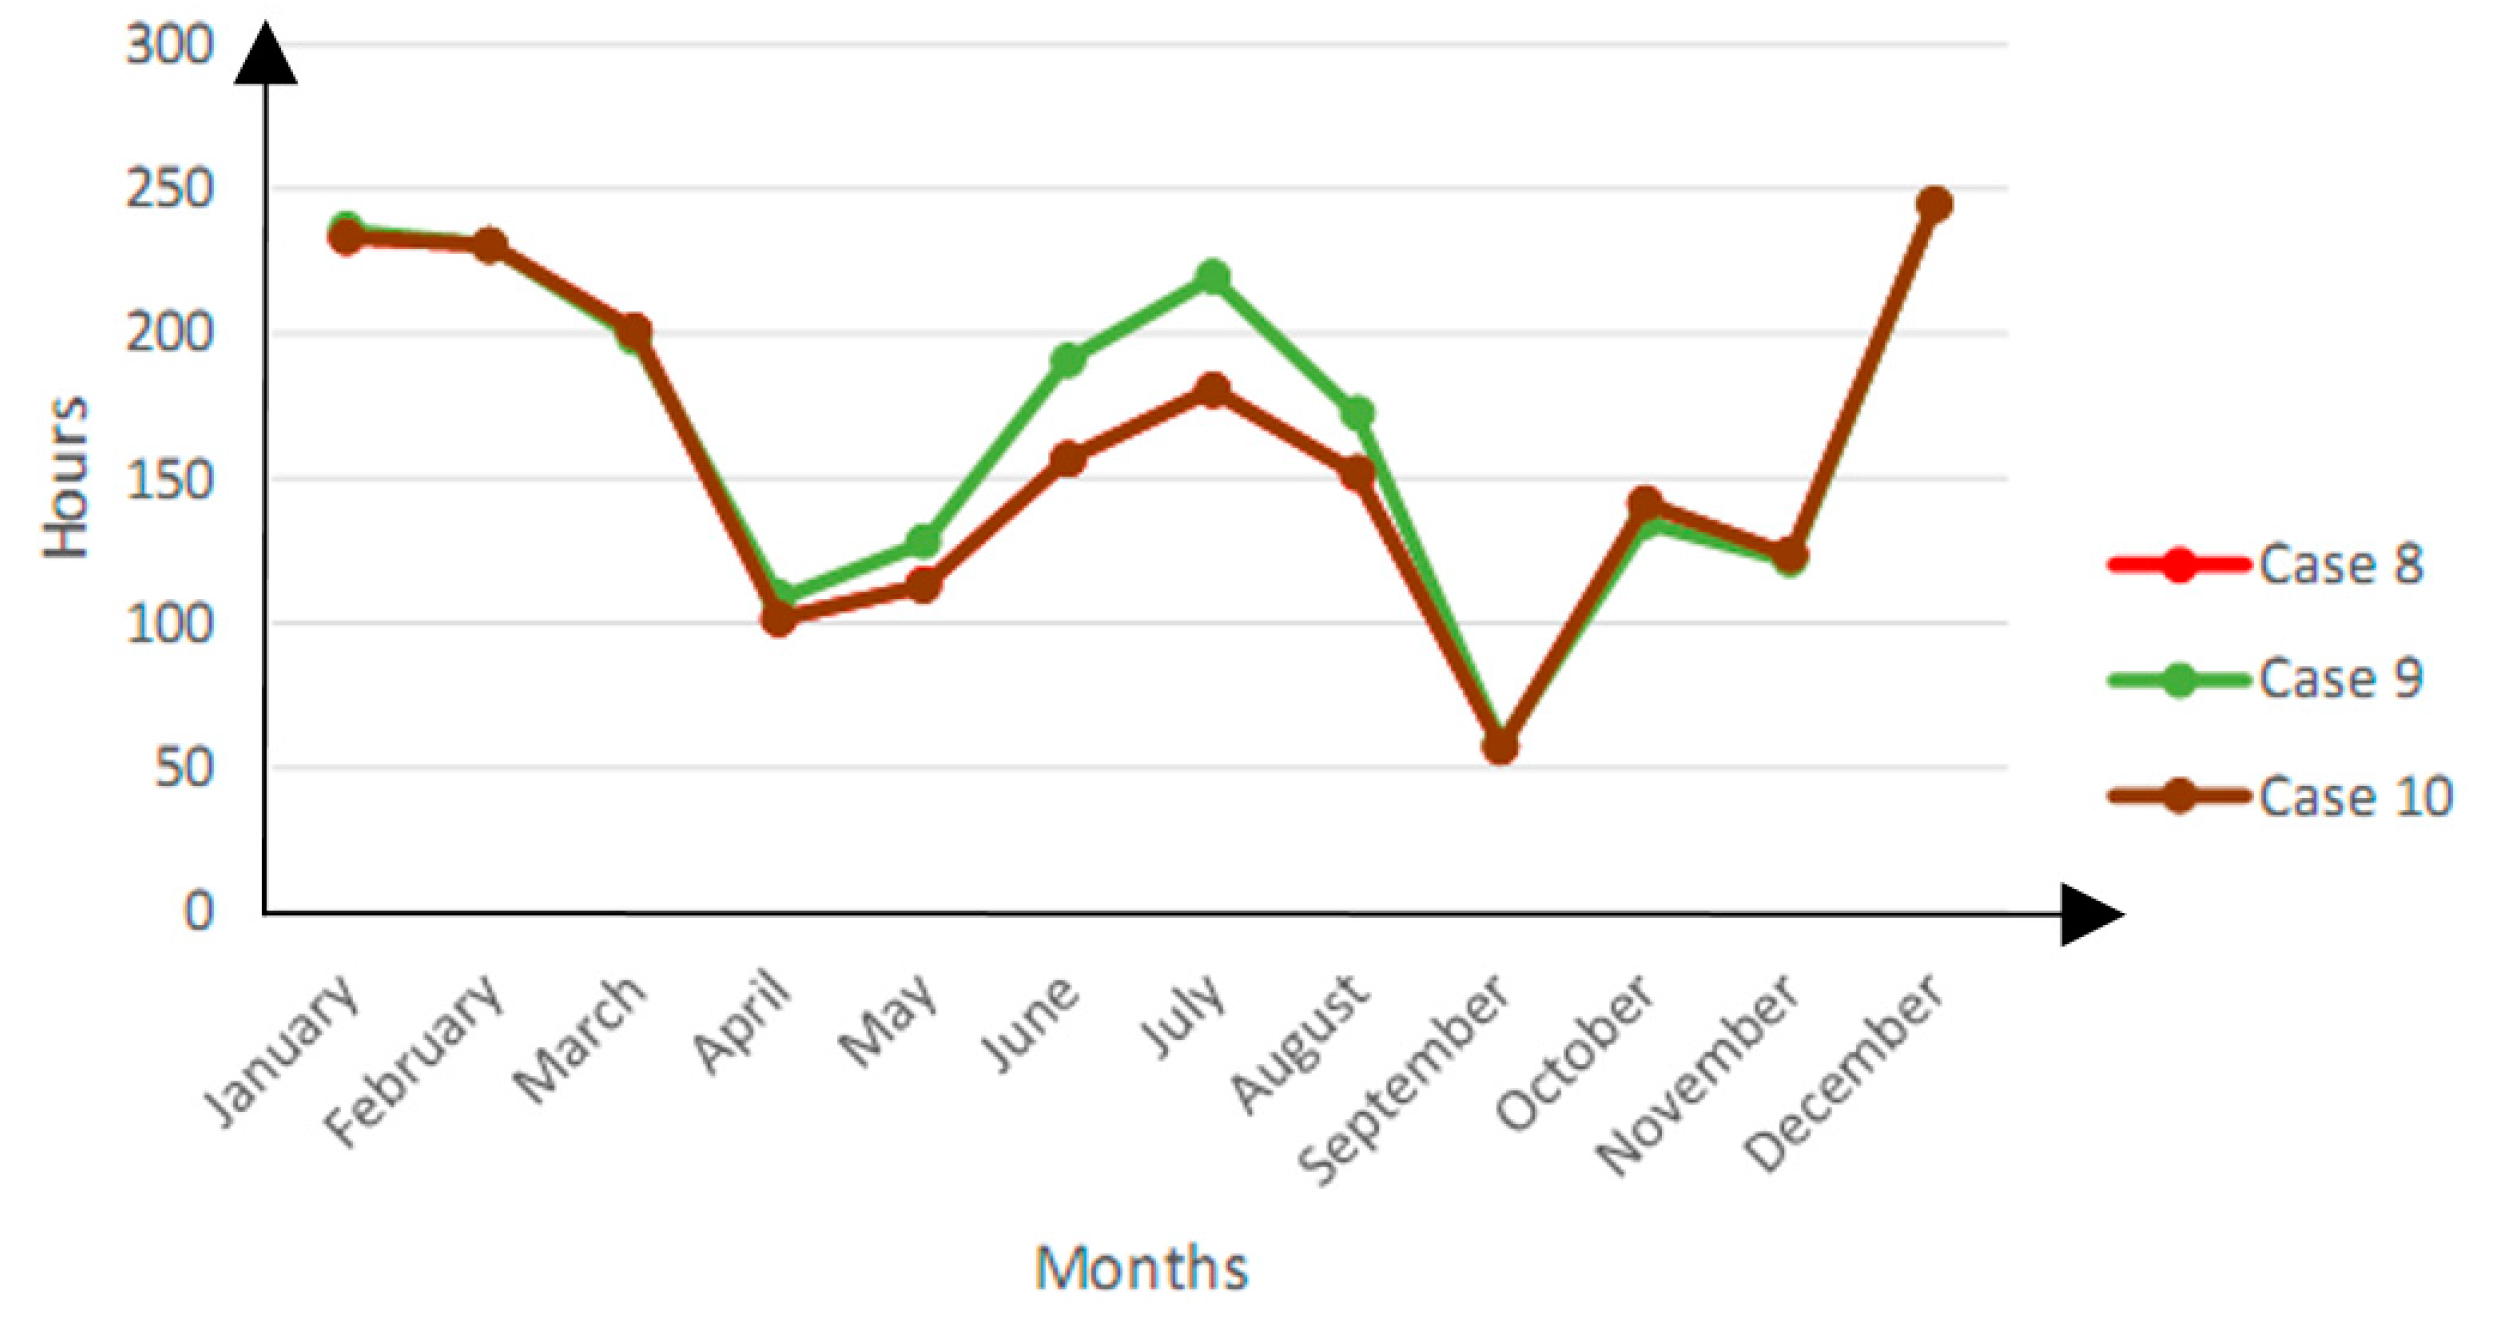
Figure 14.
Monthly mean zonal temperatures (a) and discomfort hours (b) for Cases 11, 12 and 13.

Figure 15.
Monthly mean zonal temperatures for Cases 14, 15 and 16.
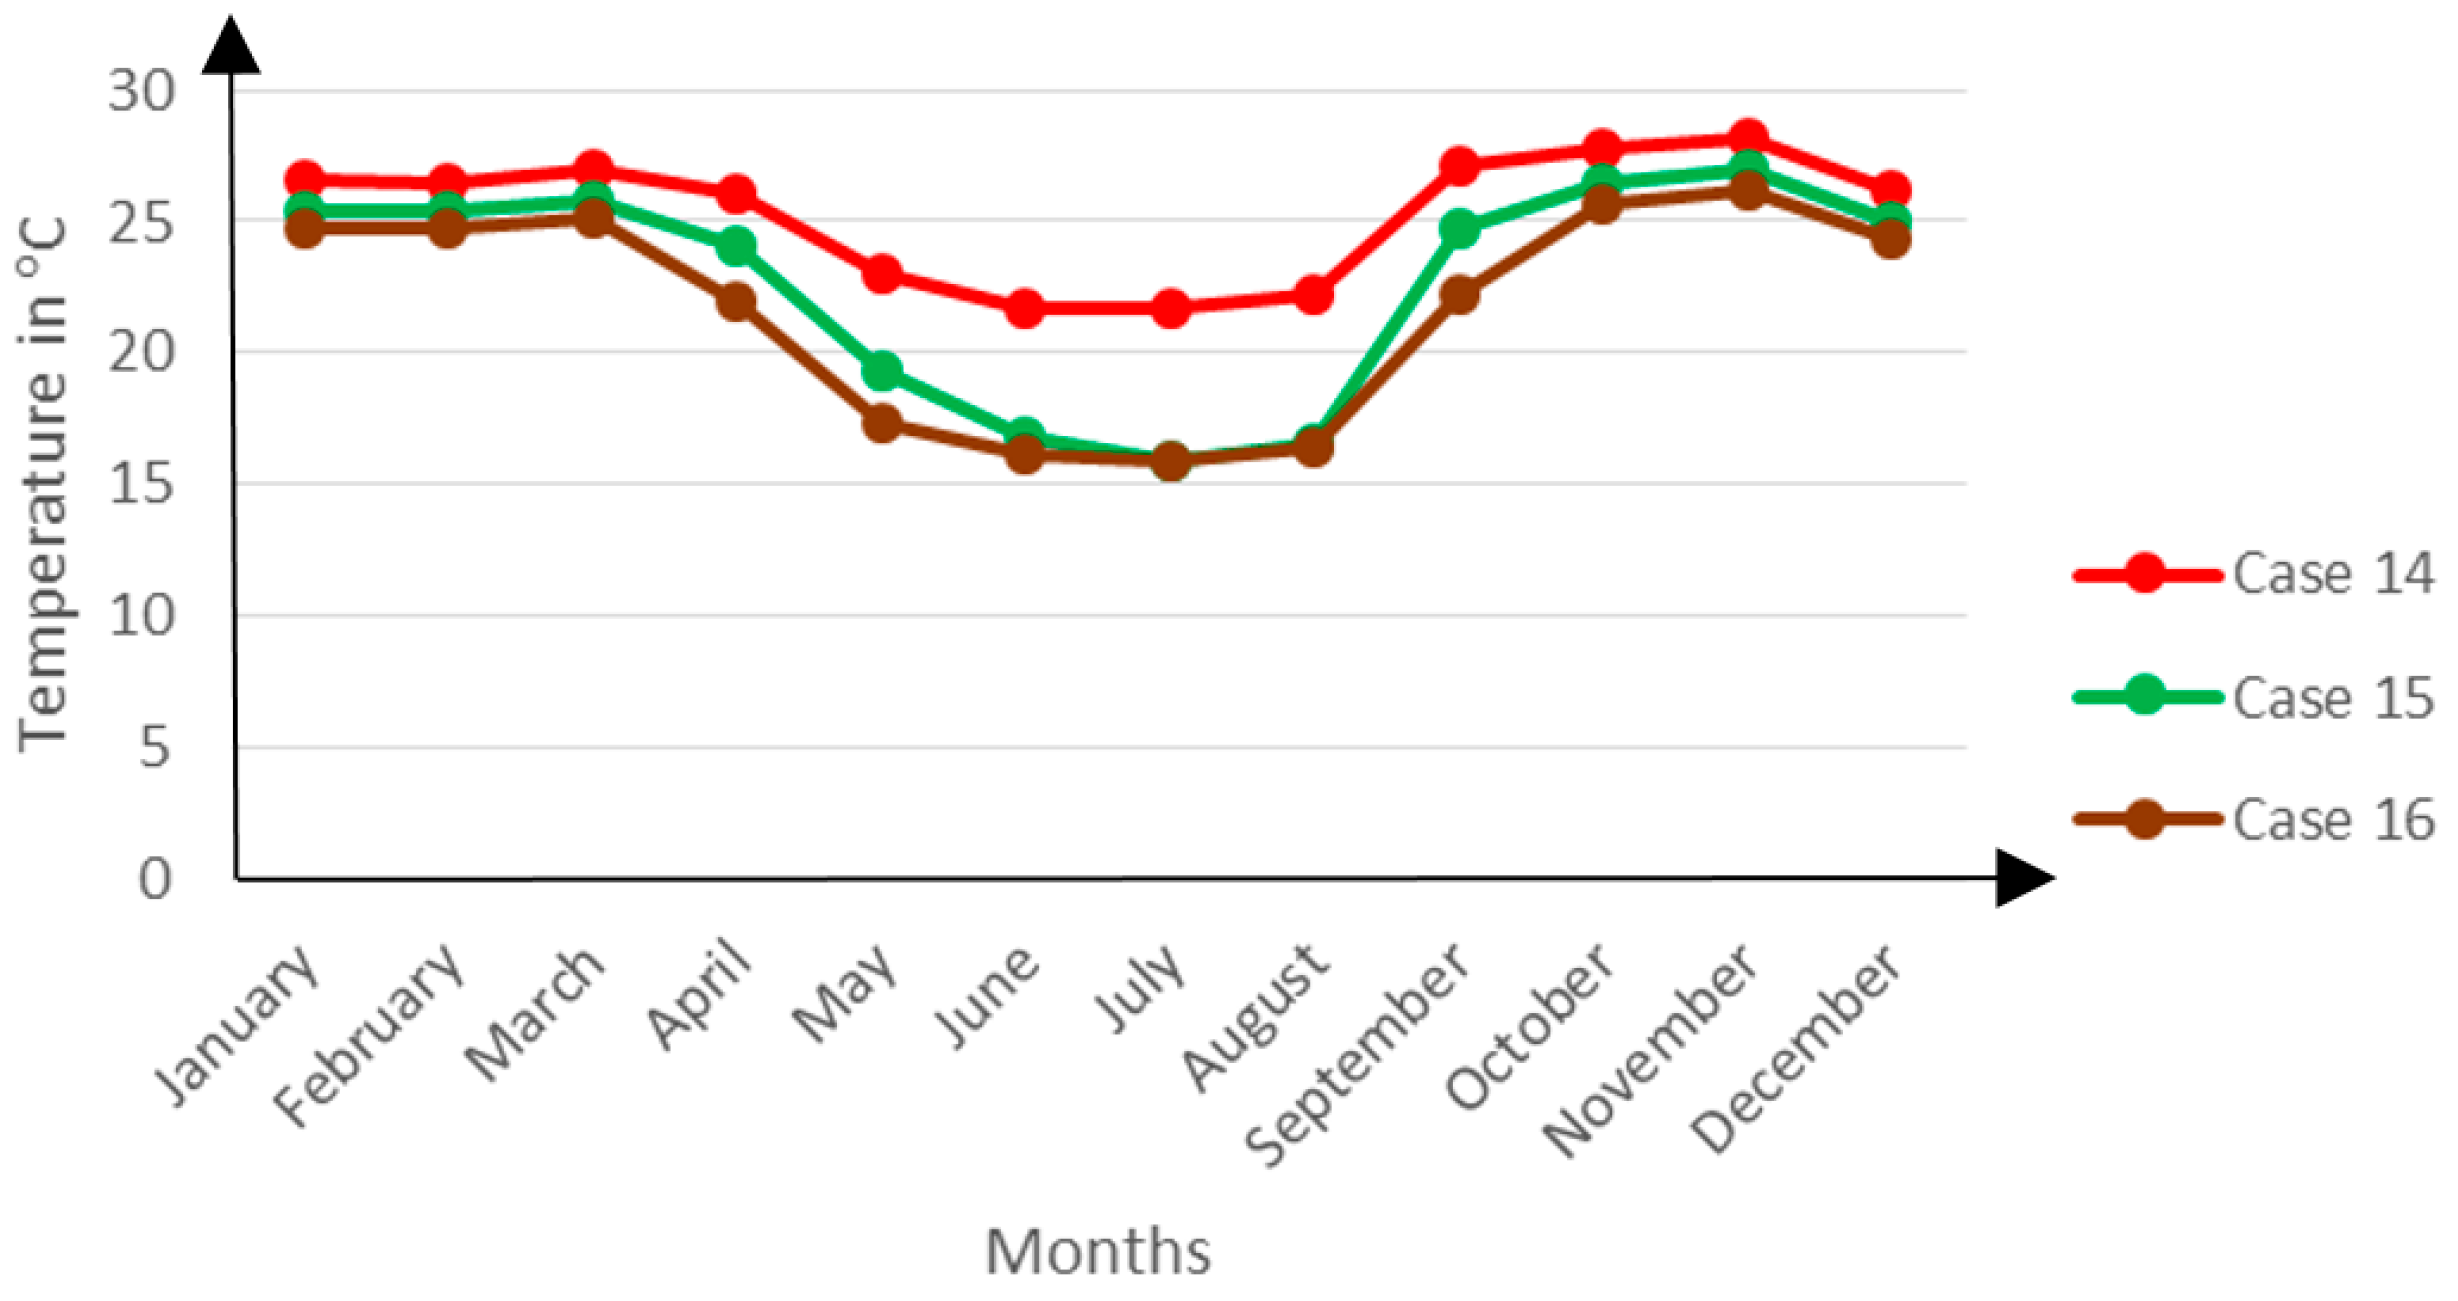
Figure 16.
Discomfort hours for Cases 14, 15 and 16.

Figure 17.
Monthly mean zonal temperatures for Cases 17, 18 and 19.

Figure 18.
Discomfort hours for Cases 17, 18 and 19.

Figure 19.
Monthly mean zonal temperatures (a) and discomfort hours (b) for Cases 20, 21 and 22.

Figure 20.
Monthly mean zonal temperatures and discomfort hours for Case 5.

Figure 21.
Monthly mean zonal temperatures (a), discomfort hours (b) for typical case, Case 5 and final optimal case.
Figure 21.
Monthly mean zonal temperatures (a), discomfort hours (b) for typical case, Case 5 and final optimal case.


Table 1.
Urban residential buildings’ construction materials by proportion of the urban residential building stock. Source: Adapted from NSO [40].
| Building Component | Construction Material | Proportion |
|---|---|---|
| Floor | Cement | 67.3% |
| Wall | Unburnt Bricks | 53.1% |
| Roof | Iron Sheets | 75.9% |
Table 2.
Thermal properties of Malawian urban residential buildings’ construction materials. Source: Szokolay [7].
| Material Name | Conductivity (W/m.K) | Density (kg/m3) | Specific Heat Capacity (J/kg/K) |
|---|---|---|---|
| Burnt Bricks (Outer Leaf) | 0.840 | 1700 | 800 |
| Burnt Bricks (Inner Leaf) | 0.620 | 1700 | 800 |
| Plaster | 0.160 | 600 | 1000 |
| Glazing | 1.100 | 2500 | 840 |
| Iron Sheets | 78 | 7900 | 437 |
| Feature Name | Levels | |||
|---|---|---|---|---|
| 1 | 2 | 3 | 4 | |
| Highest Value | Upper Lower Value | Lower Value | Lowest Value | |
| A: Floor Thickness (FT) | 300 mm | 150 mm | 75 mm | 50 mm |
| B: Wall R-Value (WR) | 3.58 m2K/W | 0.56 m2K/W | 0.34 m2K/W | 0.29 m2K/W |
| C: Roof R-Value (RR) | 1.85 m2K/W | 1.82 m2K/W | 1.19 m2K/W | 0.39 m2K/W |
| D: Glazing Insulation (GI) | Double Low-E | Triple Glazing | Double Glazing | Single Glazing |
| E: Air Infiltration (AI) | 0 m3·s−1 | 0.0601 m3·s−1 | 0.1204 m3·s−1 | 0.2408 m3·s−1 |
| F: Transparency Ratio (TR) | 15% | 25% | 35% | 45% |
| G: Window Overhang (WO) | 900 mm | 750 mm | 600 mm | 450 mm |
Table 4.
Climatic design conditions (a) for Harare, Zimbabwe [44].
| Coldest Month | Heating DB | Humidification DP/MCDB & HR | Coldest Month WS/MCDB | MCWS/PCWD to 99.6% DB | ||||||||||
|---|---|---|---|---|---|---|---|---|---|---|---|---|---|---|
| 99.6% | 99% | 96.6% | 99% | 0.4% | 1% | |||||||||
| DP | HR | MCDB | DP | HR | MCDB | WS | MCDB | WS | MCDB | MCWS | PCWD | |||
| 2 | ||||||||||||||
| 7 | 7.0 | 8.0 | −4.1 | 3.2 | 20.1 | −2.1 | 3.8 | 19.9 | 10.4 | 15.2 | 9.4 | 14.8 | 2.5 | 110 |
Table 5.
Climatic design conditions (b) for Harare, Zimbabwe [44].
| Hottest Month | Hottest Month DB Range | Cooling DB/MCWB | Evaporation WB/MCDB | MCWS/PCWD to 0.4% DB | |||||||||||
|---|---|---|---|---|---|---|---|---|---|---|---|---|---|---|---|
| 0.4% | 1% | 2% | 0.4% | 1% | 2% | ||||||||||
| DB | MCWB | DB | MCWB | DB | MCWB | WB | MCDB | WB | MCDB | WB | MCDB | MCWS | PCWD | ||
| 7 | 8 | ||||||||||||||
| 11 | 10.4 | 30.5 | 16.5 | 29.4 | 16.4 | 28.6 | 16.3 | 20.1 | 24.7 | 19.7 | 24.1 | 19.3 | 23.6 | 4.4 | 60 |
Table 6.
Climatic design conditions (c) for Harare, Zimbabwe [44].
| Dehumidification DP/MCDB and HR | Enthalpy/MCDB | |||||||||||||
|---|---|---|---|---|---|---|---|---|---|---|---|---|---|---|
| 0.4% | 1% | 2% | 0.4% | 1% | 2% | |||||||||
| DP | HR | MCDB | DP | HR | MCDB | DP | HR | MCDB | Enth | MCDB | Enth | MCDB | Enth | MCDB |
| 19.0 | 16.6 | 21.1 | 18.5 | 16.1 | 20.8 | 18.1 | 15.7 | 20.6 | 65.1 | 24.7 | 63.5 | 24.3 | 62.2 | 23.8 |
Table 7.
Building occupant activity levels worked out using 1.8 m2 as the Du Bois area for the average person.
| Activity | Activity Level (W/Person) | Activity Level (W/m2) |
|---|---|---|
| Reading | 99 | 55 |
| Writing | 108 | 60 |
| Sleeping | 72 | 40 |
| Seated | 108 | 60 |
| Cooking | 207 | 115 |
| House Cleaning | 207 | 115 |
| Component Name | Heat Output (W) | Thermal Zone |
|---|---|---|
| Building Occupants | See Activity Level in Table 7 | All Zones |
| Compact Fluorescent Lamp | 18 | All Zones |
| Cooking Stove | 1450 | Kitchen |
| Refrigerator | 700 | Kitchen |
| Plasma TV Screen | 154 | Living Room |
| City Name | Correlation Coefficient, r | Validation Remark |
|---|---|---|
| Mzuzu | 0.96 | Valid |
| Lilongwe | 0.98 | Valid |
| Blantyre | 0.72 | Invalid |
| Variable | Degree of Freedom | Sum of Squares | Mean Square | Variance Ratio |
|---|---|---|---|---|
| f | S | S/f | F | |
| A | 1 | 47,643.9863 | 47,643.9863 | 0.51 |
| B | 1 | 54,099.9395 | 54,099.9395 | 0.58 |
| C | 1 | 2.3926 | 2.3926 | 0 |
| D | 1 | 895.1738 | 895.1738 | 0.01 |
| E | 1 | 2,679,467.8145 | 2,679,467.8145 | 526.36 |
| F | 1 | 2650.8301 | 2650.8301 | 0.03 |
| G | 1 | 514.002 | 514.002 | 0.01 |
| A × B | 1 | 129.002 | 129.002 | 0 |
| A × F | 1 | 2.6738 | 2.6738 | 0 |
| A × E | 1 | 317.2051 | 317.2051 | 0 |
| B × C | 1 | 43.3613 | 43.3613 | 0 |
| B × D | 1 | 37.7363 | 37.7363 | 0 |
| B × E | 1 | 24.0645 | 24.0645 | 0 |
| B × F | 1 | 1089.8613 | 1089.8613 | 0.01 |
| B × G | 1 | 25,046.0176 | 25,046.0176 | 0.27 |
| C × G | 1 | 15,018.6113 | 15,018.6113 | 0.16 |
| C × D | 1 | 0.5645 | 0.5645 | 0 |
| C × E | 1 | 80.4863 | 80.4863 | 0 |
| D × E | 1 | 812.5488 | 812.5488 | 0.01 |
| E × F | 1 | 33.5176 | 33.5176 | 0 |
| E × G | 1 | 292.5176 | 292.5176 | 0 |
| F × G | 1 | 1026.6113 | 1026.6113 | 0.01 |
Table 11.
Summary of the discomfort hours registered at each of the two levels of the seven features.
| Variable | Highest Level | Lowest Level |
|---|---|---|
| A: FT | 2441.890625 | 2364.71875 |
| B: WR | 2362.1875 | 2444.421875 |
| C: RR | 2403.03125 | 2403.578125 |
| D: GI | 2398.015625 | 2408.59375 |
| E: AI | 2692.671875 | 2113.9375 |
| F: TR | 2412.40625 | 2394.203125 |
| G: RO | 2399.296875 | 2407.3125 |
| Case No. | Variable | DH | ||||||
|---|---|---|---|---|---|---|---|---|
| A | B | C | D | E | F | G | ||
| 1 | 4 | 1 | 1 | 1 | 4 | 4 | 1 | 1936.5 |
| 2 | 1 | 1 | 1 | 1 | 4 | 4 | 1 | 2086.5 |
| 3 | 2 | 1 | 1 | 1 | 4 | 4 | 1 | 2030.5 |
| 4 | 3 | 1 | 1 | 1 | 4 | 4 | 1 | 1967.75 |
| 5 | 4 | 2 | 1 | 1 | 4 | 4 | 1 | 1915.25 |
| 6 | 4 | 3 | 1 | 1 | 4 | 4 | 1 | 2062.5 |
| 7 | 4 | 4 | 1 | 1 | 4 | 4 | 1 | 2118.25 |
| 8 | 4 | 1 | 2 | 1 | 4 | 4 | 1 | 1936.5 |
| 9 | 4 | 1 | 3 | 1 | 4 | 4 | 1 | 2045.5 |
| 10 | 4 | 1 | 4 | 1 | 4 | 4 | 1 | 1936.75 |
| 11 | 4 | 1 | 1 | 2 | 4 | 4 | 1 | 1943.5 |
| 12 | 4 | 1 | 1 | 3 | 4 | 4 | 1 | 1952 |
| 13 | 4 | 1 | 1 | 4 | 4 | 4 | 1 | 1975.25 |
| 14 | 4 | 1 | 1 | 1 | 1 | 4 | 1 | 2638.5 |
| 15 | 4 | 1 | 1 | 1 | 2 | 4 | 1 | 2171.75 |
| 16 | 4 | 1 | 1 | 1 | 3 | 4 | 1 | 2002.75 |
| 17 | 4 | 1 | 1 | 1 | 4 | 1 | 1 | 2015.25 |
| 18 | 4 | 1 | 1 | 1 | 4 | 2 | 1 | 1988 |
| 19 | 4 | 1 | 1 | 1 | 4 | 3 | 1 | 1961 |
| 20 | 4 | 1 | 1 | 1 | 4 | 4 | 2 | 1928 |
| 21 | 4 | 1 | 1 | 1 | 4 | 4 | 3 | 1924 |
| 22 | 4 | 1 | 1 | 1 | 4 | 4 | 4 | 1927 |
© 2016 by the author; licensee MDPI, Basel, Switzerland. This article is an open access article distributed under the terms and conditions of the Creative Commons by Attribution (CC-BY) license (http://creativecommons.org/licenses/by/4.0/).
Share and Cite
MDPI and ACS Style
Kalua, A. Envelope Thermal Design Optimization for Urban Residential Buildings in Malawi. Buildings 2016, 6, 13. https://doi.org/10.3390/buildings6020013
AMA Style
Kalua A. Envelope Thermal Design Optimization for Urban Residential Buildings in Malawi. Buildings. 2016; 6(2):13. https://doi.org/10.3390/buildings6020013
Chicago/Turabian StyleKalua, Amos. 2016. "Envelope Thermal Design Optimization for Urban Residential Buildings in Malawi" Buildings 6, no. 2: 13. https://doi.org/10.3390/buildings6020013
Note that from the first issue of 2016, this journal uses article numbers instead of page numbers. See further details here.