1. Introduction
Future climate models (such as the General Circulation Model-based Hadley Model) are now demonstrating the scale of change that might be expected in local weather conditions [
1] in the coming decades. Simultaneously, with persuasive arguments around the embodied energy and carbon involved in building construction projects, there is now an onus on industry to ensure buildings last for several decades; a timescale within which we might expect to see significant climate change for a given location. Quantifying this change in a meaningful way, whilst portraying the true nature of these climate models, is quite a challenge. Climate models are not designed, or capable, of giving precise and accurate predictions of a deterministic future. Rather, as demonstrated by the UK Climate Projections 2009 (UKCP’09) [
2], climate models can give a spectrum of possibilities that relate to different probabilities of occurrence. Furthermore, these projections will change with specific time period, location, and greenhouse gas emission scenario (as discussed in
Section 3).
Any user of building models, whether detailed dynamic simulation or energy compliance modelling, will understand the importance of weather (and by association climate) data. The balance between the heating and cooling requirements of a building, and risk of overheating, could be substantially different near the end of a building’s life than when compared to the assessment of that building during the design stage [
3,
4]. However, this should not just be a concern for building designers. Those responsible for designing infrastructure for delivering energy to the built environment, and understanding the relationship between energy generation and energy demand, also need to have some understanding of how climate-driven energy use might change.
Designers, both in areas of building design and energy provision, therefore need adequate tools to help inform decisions that, although made now, will have an impact on energy use later within the life cycle of that building. To propose methods of dealing with this dilemma, this paper will collate the findings of two research projects that, respectively, look at incorporating probabilistic climate projections into building modelling and translating such outputs for use in the energy sector. Such tools should aim to improve the robustness and understanding of how energy could be delivered to buildings in a changing climate. The work also intimates the importance that decisions made in areas of the built environment will have on wider energy issues in the future, and how communication between the different actors involved (and the use of the same information/assumptions) is vital. For example, if a prediction is made for (or policy is used to encourage/subsidise) a growth in electric heat pumps and home-charged electric vehicles, assessments of future domestic energy use must account for this in the same way as for assessments of required electricity grid infrastructure. In that way, there is more likely to be a consistency between decisions relating to energy demand (e.g., building design) and decisions made for generating and supplying that energy (e.g., infrastructure required to supply that energy, reflecting the portfolio of generation technologies that might be expected at that time).
This paper will describe the use of probabilistic climate projections in building analyses, and therefore will be centred on a country (i.e., UK) that has this information currently available. However, the methodology is directly transferrable to other countries with similar multi-climate descriptions available. The existing approaches of the Low Carbon Futures (LCF) tool and the Adaptation and Resilience In Energy Systems (ARIES) method are reviewed to provide context, but the added functionality achieved from combining the two approaches is explored by describing the overlap between these two projects. Finally, an application is produced that applies both these methodologies (from the two respective projects) in a new way with a specific end goal of multi-climate, multi-building energy assessments.
2. Climate Change and Buildings
The risks posed to the built environment by climate change are diverse. In some parts of the UK, rising flooding risks are of prime concern [
5], whereas other locations are witnessing changes in land management that impact how that land should be used [
6]. The impact on the thermal performance of buildings, in terms of overheating and/or changes in energy use, have also been investigated by several research projects, for example within the Adaptation and Resilience in a Changing Climate (ARCC) network [
7,
8,
9,
10]. Recognising this particular risk, and making building users aware of its existence, requires a long-term view as, for example, persistent overheating is something that will become apparent over several years of occupancy in a building, rather than a one-off extreme event (and therefore is visible and experienced in a different way than flooding).
There are various challenges to quantifying whether a building will not function as designed in a future climate. Firstly, the designer must assess what constitutes a failure. For a thermal assessment, this is likely to be associated with either overheating or excess energy use linked to a change in building cooling load. This latter factor can, in theory, cause a cooling plant to be undersized, or might merely change the energy targets of that building—though the point at which the plant is using “too much” energy might become subjective in this case. If overheating is highlighted as the issue, quantifying this is non-trivial. As discussed elsewhere [
11,
12], although standardised definitions of overheating do exist (such as the threshold of 1% of occupied hours exceeding 28 °C [
13], as used in this paper), the exact nature of overheating is more complicated than this, bringing together issues of adaptive comfort, location, and building services that are used to provide that comfort. Building modellers tend to use the more simplified definitions of overheating that can, at least, be quantified and compared between different cases, though adaptive comfort algorithms can be applied to building simulation [
14] in an attempt to account for a more nuanced understanding of thermal comfort.
Having defined a failure criteria (whether based on internal temperature or energy consumption), the designer may choose to apply adaptations to the design of the building. This will be aimed at increasing the probability that the building will still function adequately in the future. As discussed later, the climate projections of UKCP’09 enable this probabilistic approach, where the probability of an external (i.e., weather) condition being met can be related to the probability of an internal building metric (e.g., temperature threshold) occurring. This is also likely to have an effect on the energy consumption of the building (both in heating and cooling seasons), and therefore the adaptation or change to that building will have a secondary effect on the infrastructure used to provide that energy.
This therefore leads to a desire to recognise climate-associated risks that relate to the whole energy system of building, energy infrastructure and energy generation. Is there a “perfect storm” of future climate, energy and technology scenarios that a wide range of practitioners (from those working in large-scale energy production to those designing building) should be aware of? For example, it is likely that increased frequency of extreme summer temperatures will lead to higher summertime electrical loads (due to increased cooling), that could be exacerbated by a continued growth in IT equipment (and higher resulting internal heat gains). At the same time, higher temperatures can have a negative effect on the efficiency and performance of power transmission lines in the national grid [
15], and it may be that this type of coincidence of different, but related, problems magnifies the overall risk that an existing approach will not be suitable in the future. In this case, the future scenario being proposed will produce a higher electrical demand from a supply structure that is not functioning as efficiently as before.
Of course, predicting such future scenarios is highly subjective. Even if climate model outputs are deemed suitable, making similar assumptions about future energy (generation) and technology (on the demand-side from the built environment) scenarios is open to interpretation. A more suitable approach is to recognise that many different future scenarios are possible (combining future climate, energy and technology options) and any tools and methods used to test these different projections should be flexible enough to account for this potential variation. Therefore, while a final “answer” corresponding to a future scenario can be subjective, the method used to achieve that answer should be robust and justifiable. In terms of application of method, this should also be replicable and sensitive to concerns of the practitioners likely to require the outputs and advice from such methods.
3. Using Climate Change Projections in Building and Systems Design
The use of future climate projections for building energy assessment is not particularly novel, though its use is rare in more standardised assessments (e.g., relating to energy performance certificates). Previous forms of climate projection, such as that provided by the UK Climate Impact Programme (UKCIP’02) [
16], provided deterministic scenarios for assumed future conditions. This enabled weather information that had been formatted for building-based assessments (such as Test Reference Years and Design Summer Years [
17]) to be morphed for some future climate scenario. Although this gave, perhaps, a misleading picture as to the nature of climate model outputs, it did allow for relatively simple future climate assessments to be carried out for building performance.
With the introduction of probabilistic climate projections, like UKCP’09, a slightly different approach is required to accommodate this new form of information. Rather than providing a deterministic description of future climate, a spectrum of probabilities is generated for any possible future climate change that is projected by the climate model. As discussed elsewhere [
18], in its most basic form, this is not immediately amenable to building modelling and simulation. Design guides for building services engineers [
13] have introduced this in a way that can be used for, amongst other applications, heating, cooling and ventilation system sizing; however, this is usually more appropriate for “steady-state” assessments of buildings and, even then, are more suitable for those with some previous experience in the application of future climate projections.
For some assessments of buildings, more detailed modelling is required that requires (for example) an hourly description of weather across an entire year that is in some way indicative of the conditions that a given location might experience, for a given climate scenario (NB This paper will use future greenhouse gas emission scenarios of “Low”, “Medium” and “High”, respectively corresponding to the B1, A1B and A1F1 scenarios from the Intergovernmental Panel on Climate Change, as introduced elsewhere [
1]). This is the case for overheating assessments, where the number of hours above a certain threshold of overheating might be required. It is also necessary for understanding transient energy demand profiles of a building (or buildings), where the peak demand (e.g., gas usage or electricity) and variation in this demand can be crucial for identifying future issues that energy suppliers need to be aware of.
Therefore, with these quite different assessments requiring similar forms of information, there is the potential to manage and translate this probabilistic climate information into a format that is suitable for different applications. Previous work by the authors [
19] on the Low Carbon Futures project demonstrated a tool that could emulate dynamic building performance simulations such that the equivalent of thousands of building simulations, using thousands of different weather files generated by the UKCP’09 “Weather Generator” [
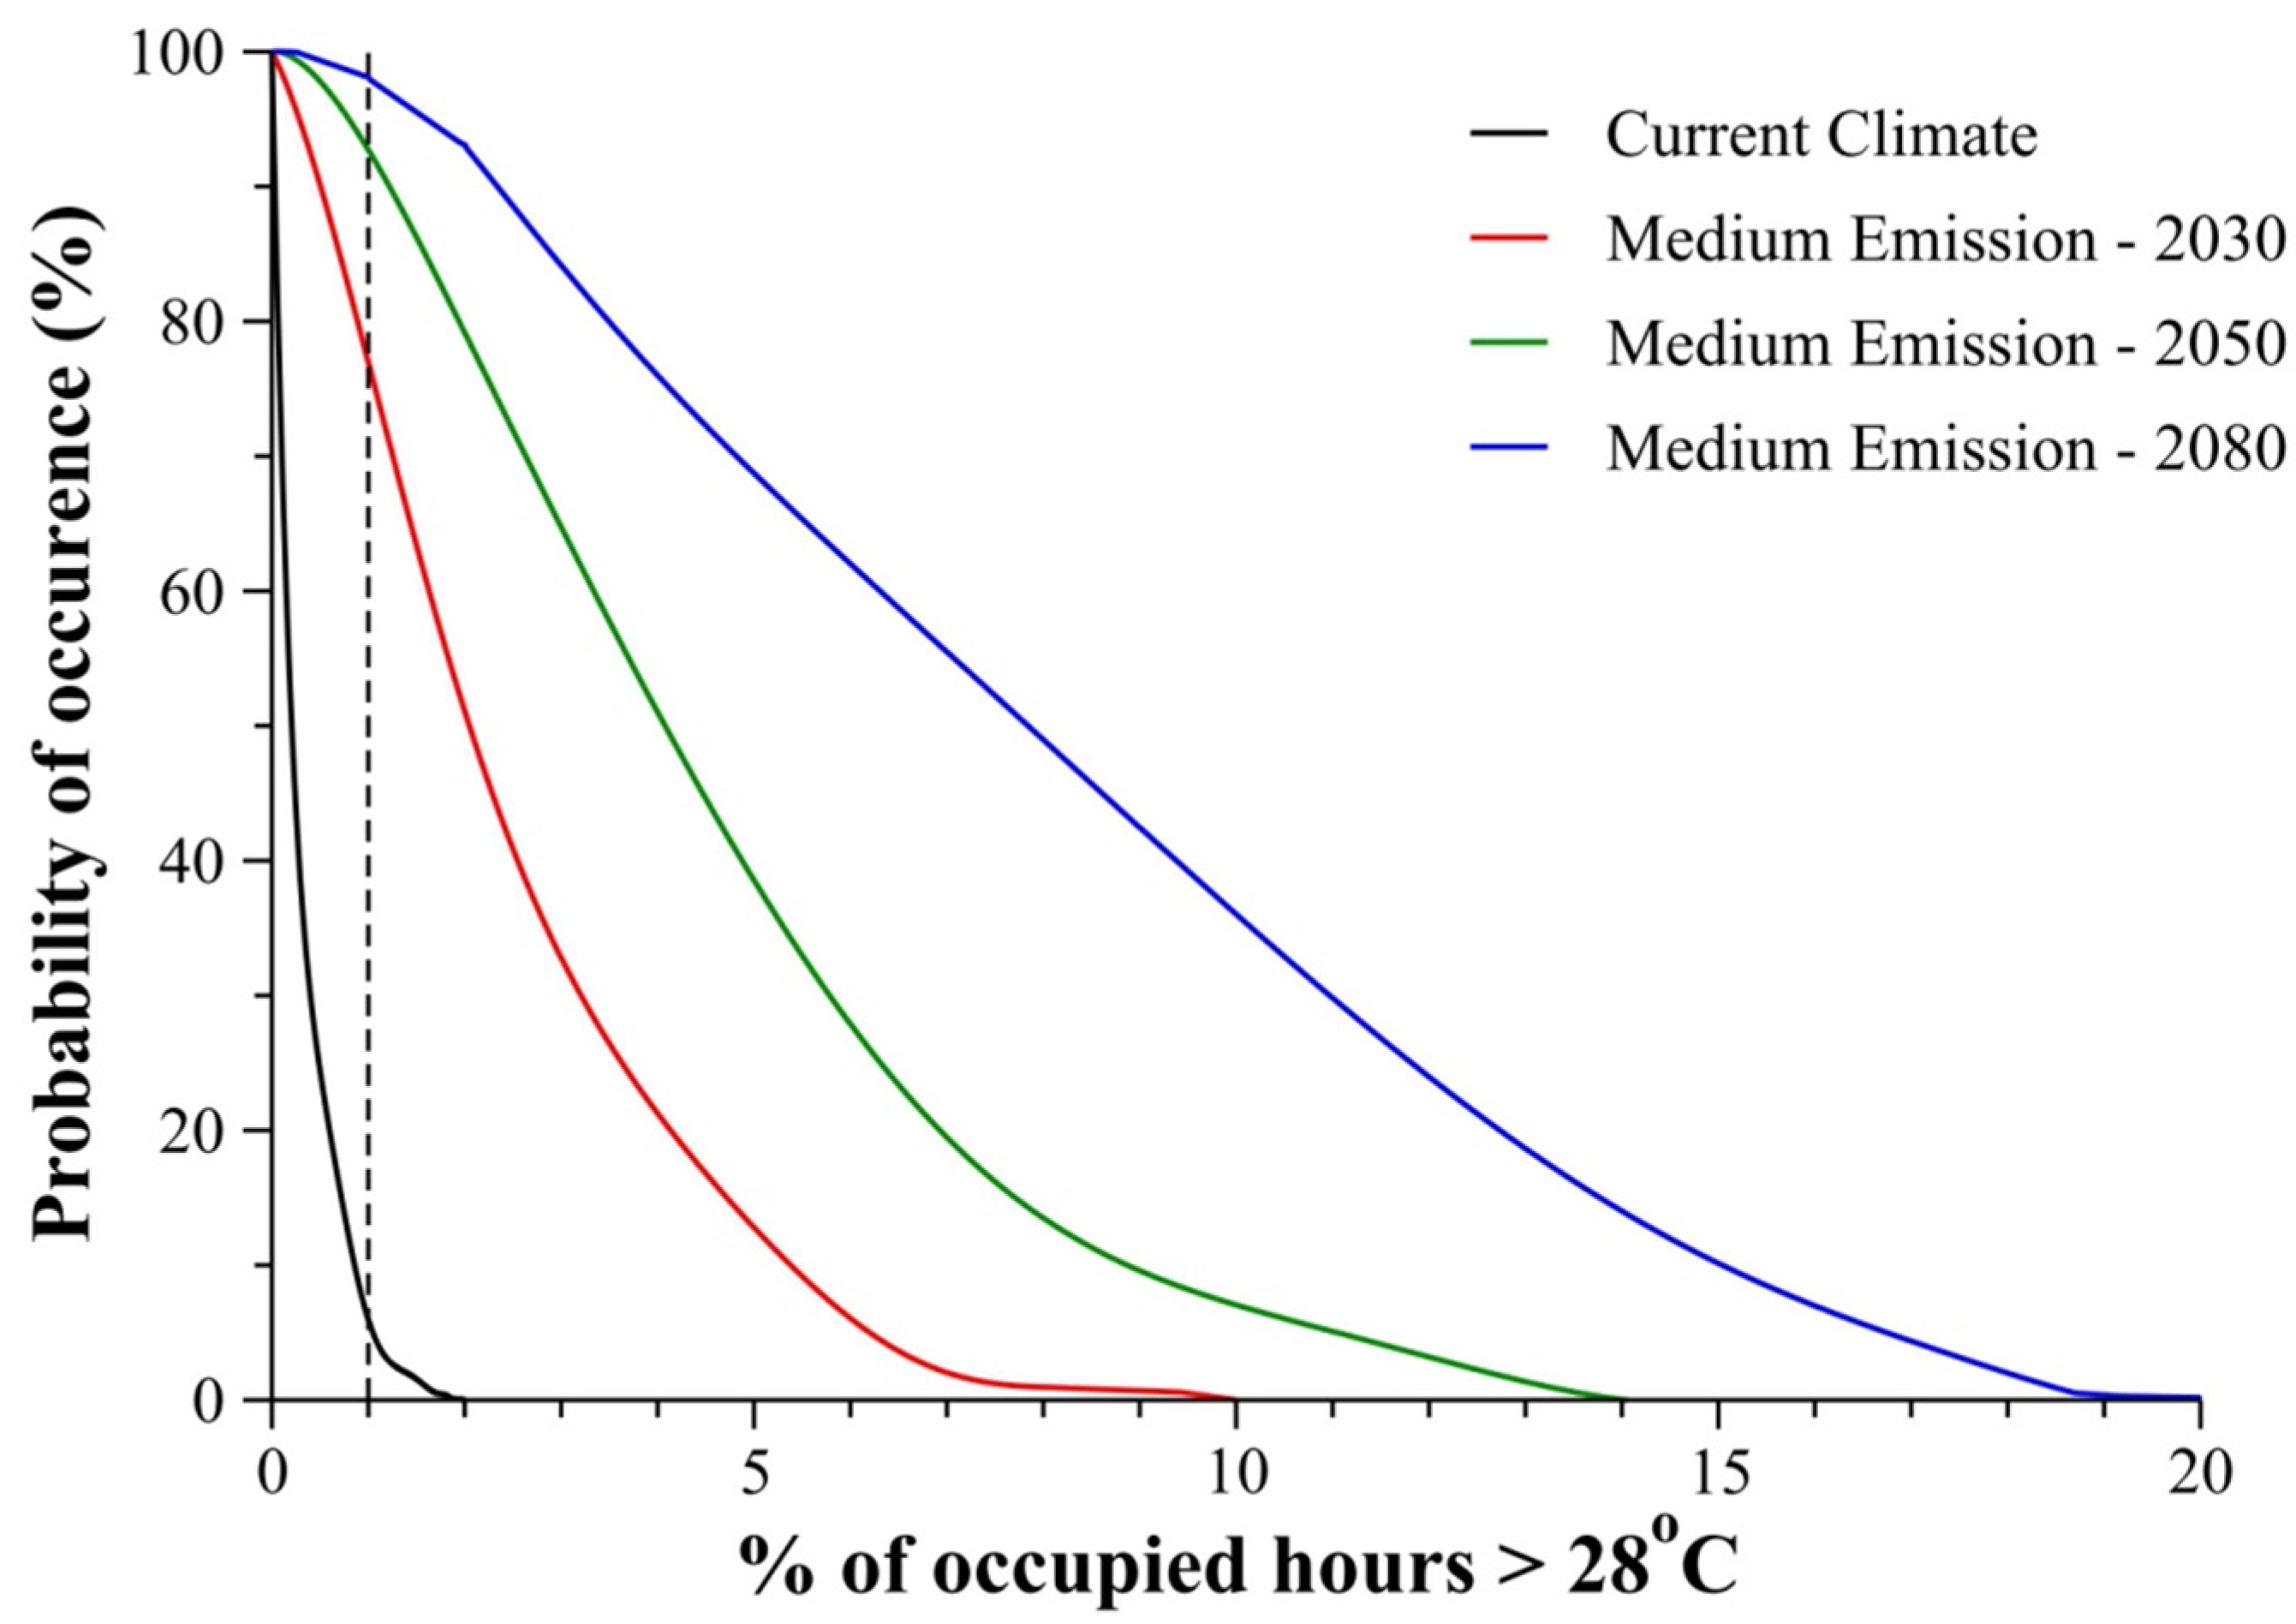
2], could be used towards decision-making related to the future performance of an assessed building (NB Data underpinning this Weather Generator has been updated since this work was completed, but the suitability of the methodology remains unchanged). Specifically, the tool provided a quantification of risk regarding the probability that a modelled building might “fail” in the future. The definition of failure was centred around overheating, or exceeding a cooling load should mechanical cooling be present, with examples of the output of the tool shown in
Figure 1 and
Figure 2. For this example, the probability curve (
Figure 1) is showing the risk of a dwelling becoming overheated, specifically exceeding an overheating threshold of 1% of hours above 28 °C [
13]. This dwelling (a two storey, three bedroom detached house) is just used to provide an example of the model output, but is described in previous work [
8]. A simplified output (
Figure 2) shows the probability of just this particular exceedance occurring, essentially returning the values found on the dotted vertical line in
Figure 1.
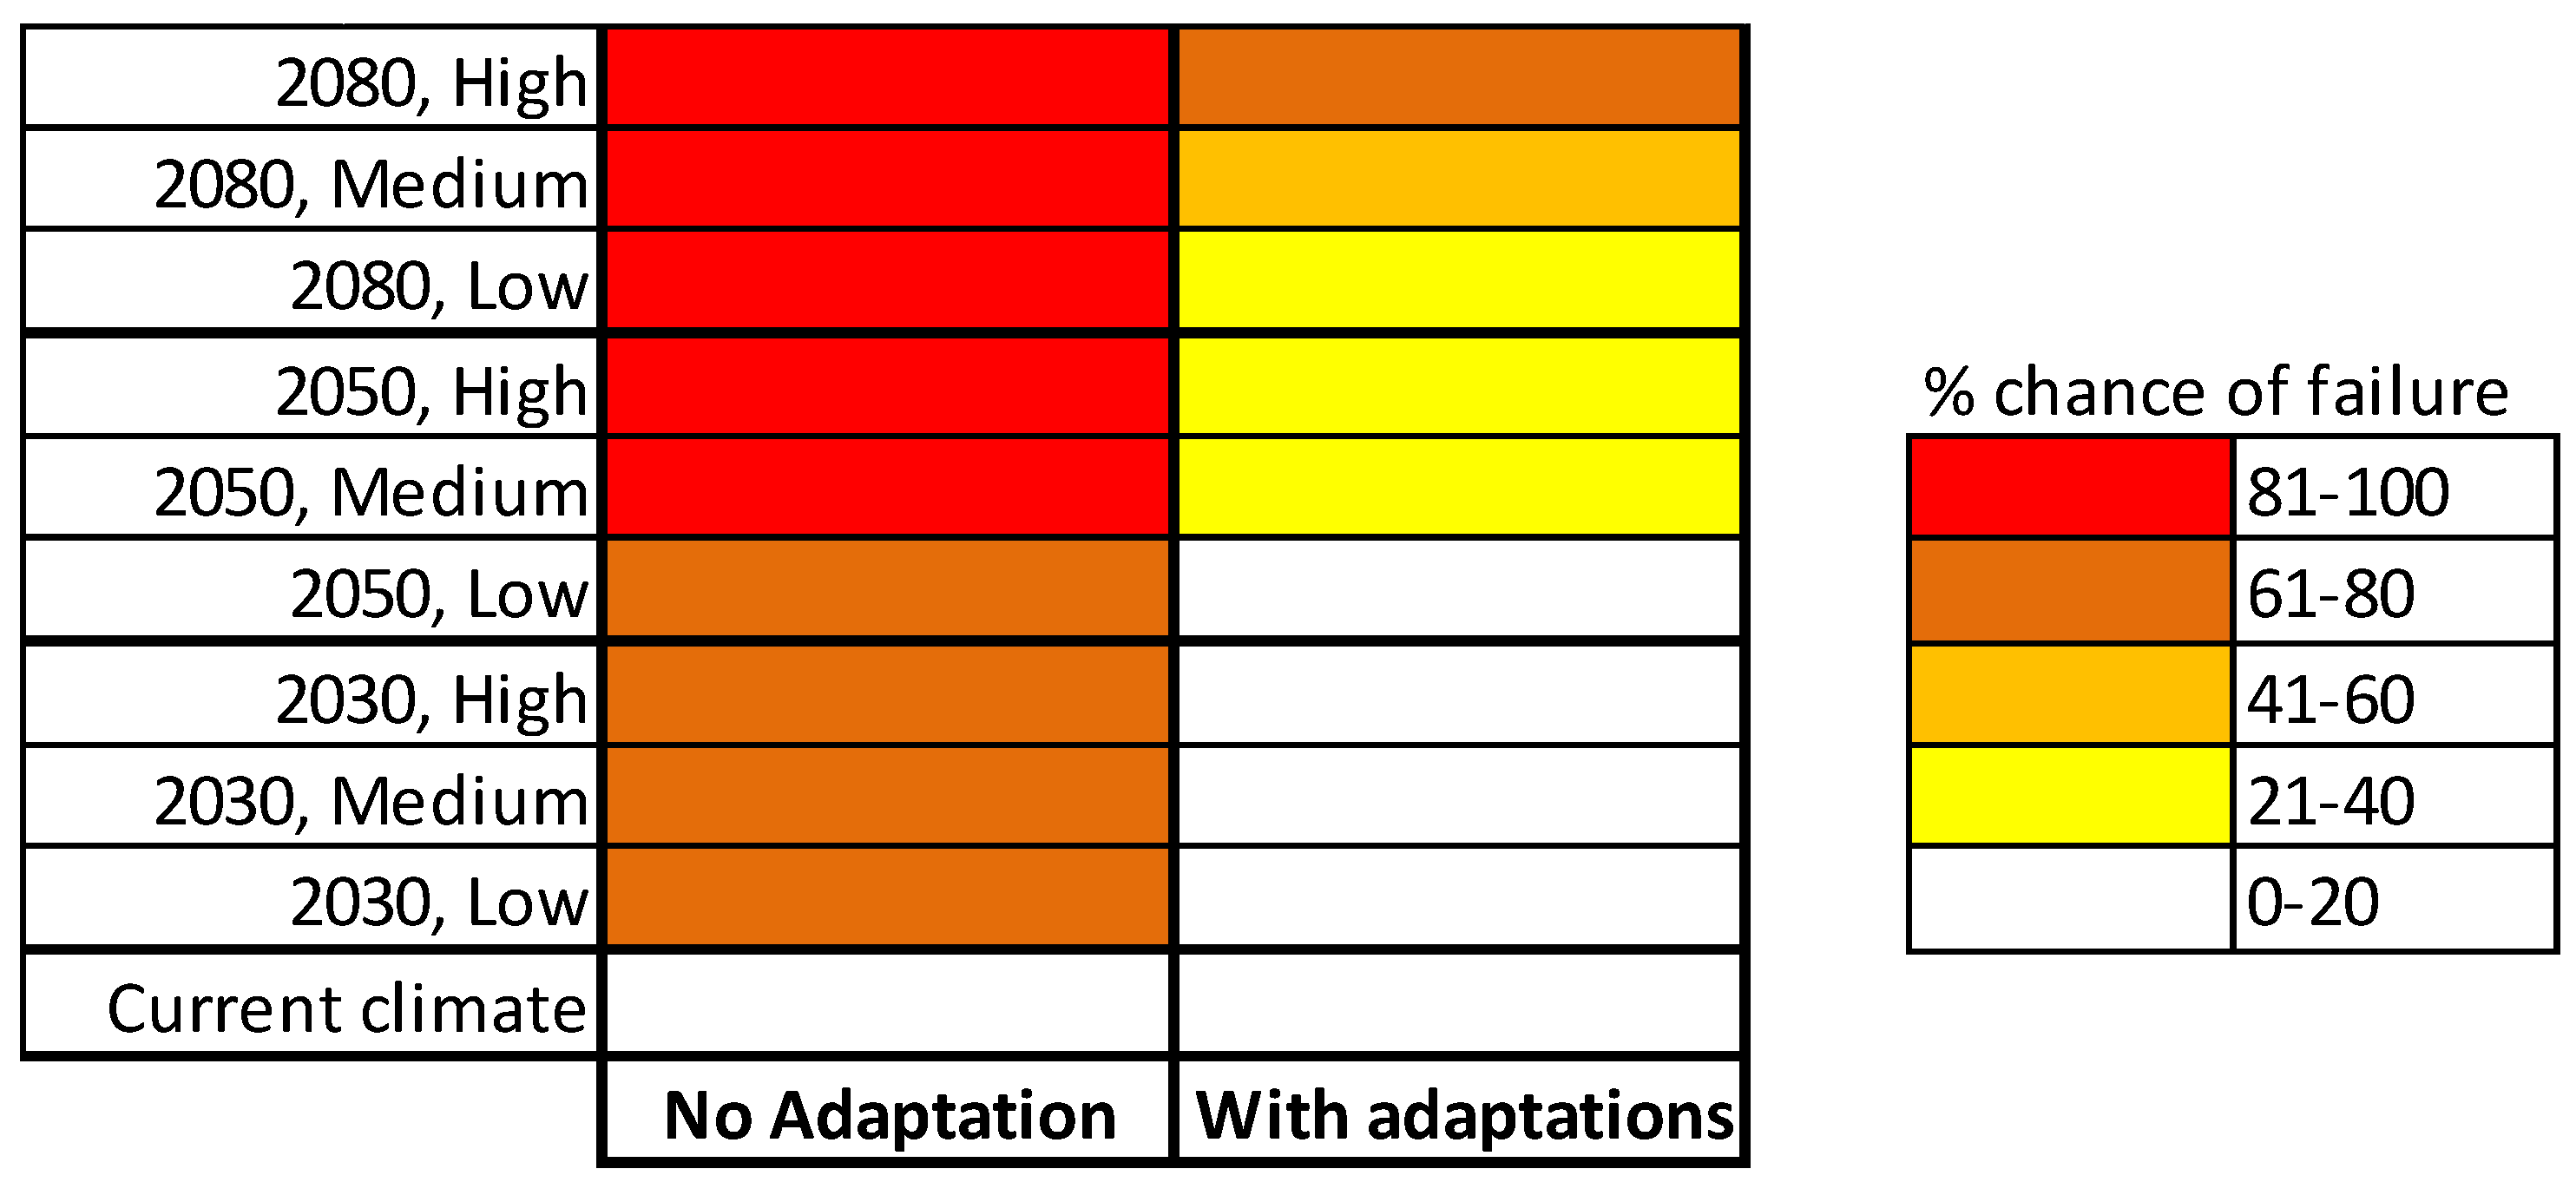
Figure 2 also shows equivalent values for an altered version of the building, using adaptations.
This information can therefore, firstly, be used to identify any current/baseline risk of a problem occurring. The tool then suggests how this problem might be exacerbated (or a new problem developed) for different future climate scenarios, where each climate scenario is based on (at least) 100 separate weather files generated from UKCP’09 projections—it is these multiple, equally probable weather files that give the tool the ability to assign a probability for a particular scenario. A designer can then investigate the effect of adaptations (
i.e., changes to the building to reduce a projected risk) on those various future scenarios. This particular paper is focussed on the application of this method, but the description and validation of the tool is discussed at length elsewhere [
19,
20]. Establishing an appropriate form of output has also been investigated [
21]. Caution should still be applied when using such a tool; this is the product of both theoretical building modelling and climate modelling, both of which have quite high levels of uncertainty. It is, however, suggested that such tools can still perform a role in suggesting likely areas of risk, and suitable actions to deal with such risks, within a timescale that is commensurate for most building design projects. The design team, for a non-domestic building project, will already be carrying out a detailed building simulation as part of their analysis. The LCF tool allows the user to convert this single simulation, with just one set of building performance outputs (e.g., temperature or energy profiles), into the multiple-climate simulations necessary for outputs such as
Figure 1. The tool is equally applicable to the domestic sector, though such analyses tend to be less common in industry for such buildings.
Figure 1.
Example of Low Carbon Futures (LCF) tool output for quantifying risk of future building failure in an example dwelling.
Figure 1.
Example of Low Carbon Futures (LCF) tool output for quantifying risk of future building failure in an example dwelling.
Figure 2.
Simplified risk matrix from LCF tool for quantifying risk of future building failure in an example dwelling.
Figure 2.
Simplified risk matrix from LCF tool for quantifying risk of future building failure in an example dwelling.
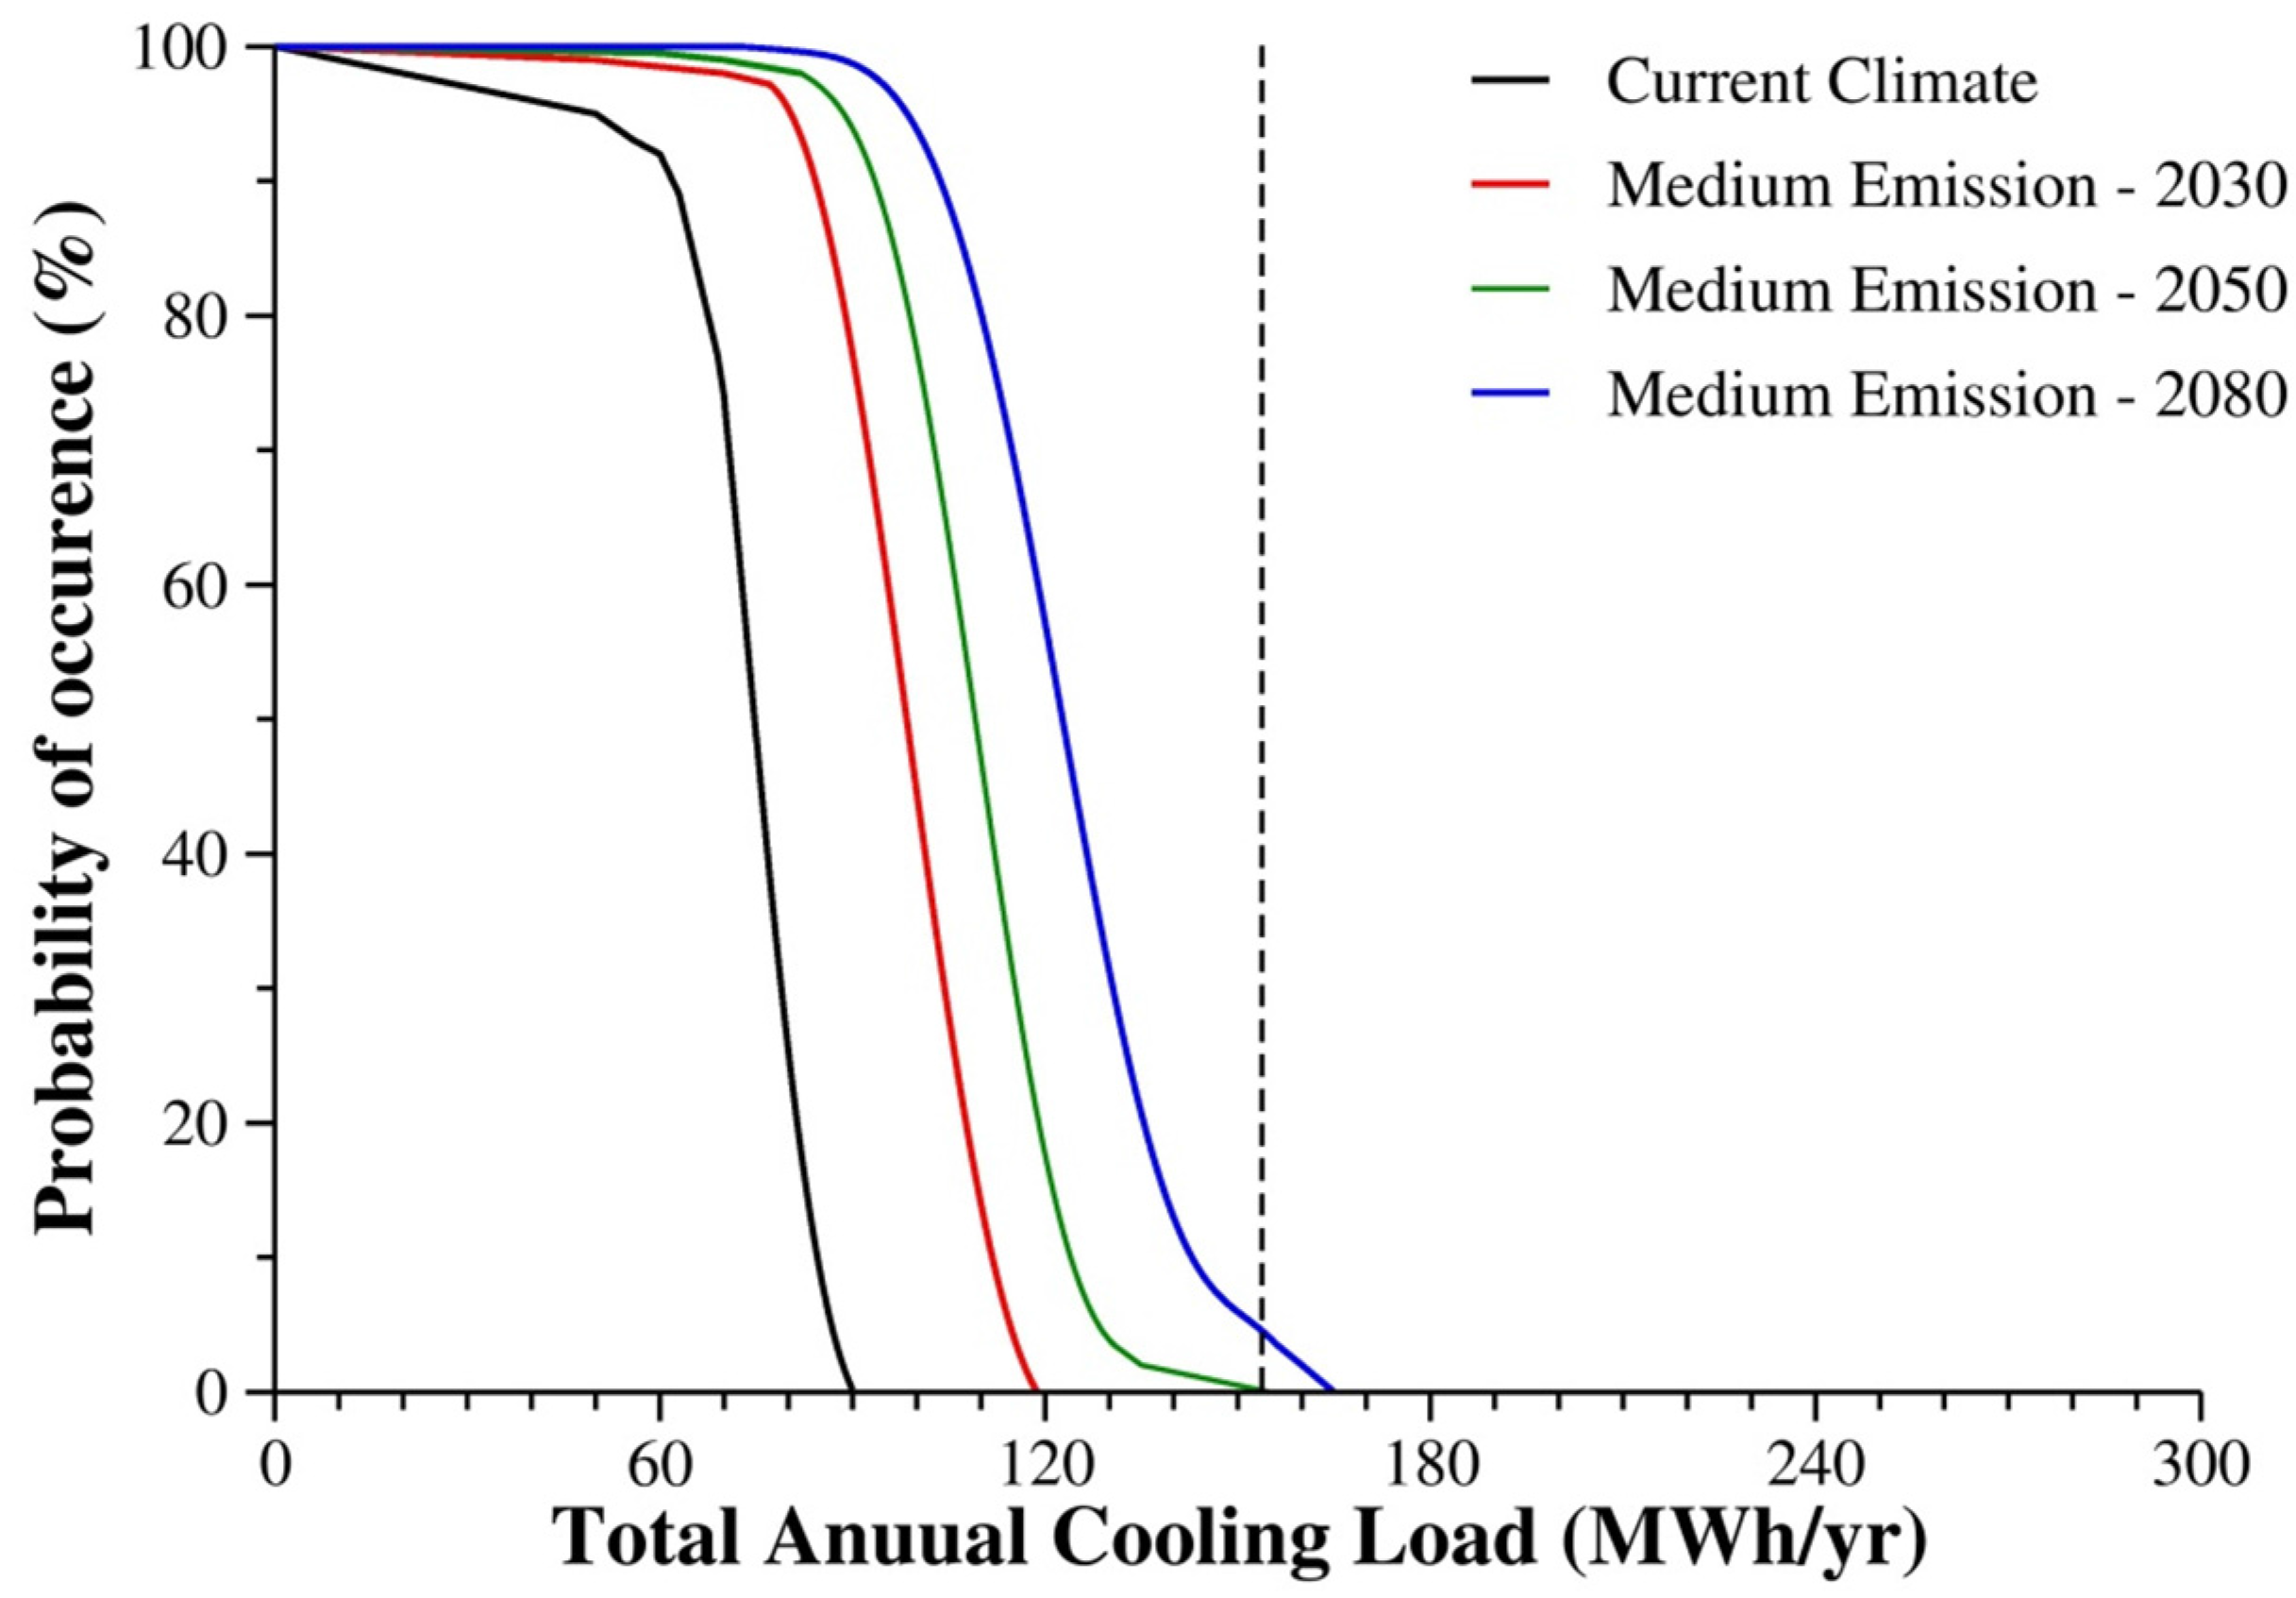
While the LCF project focussed on the modelled (usually overheating) performance of a single building in a future climate, the tool and wider approach can be applied to energy assessments as well. For example,
Figure 3 shows a distribution curve of cooling energy consumption for a building, based on probabilistic future climate descriptions. This is analogous to
Figure 1, using similar climate information, but rather than “failure” being based around a probability that a number of hours exceeds a threshold internal temperature, failure is now based around the probability that an annual cooling usage (in kWh/year) might be exceeded. Alternatively, the tool can estimate the probability that a peak cooling demand (in kW) might be exceeded, perhaps linked to the size of an installed cooling system.
The mechanism for achieving these projections is identical to the overheating example, except simulation outputs are used that refer to cooling loads, rather than internal temperatures. Taken a step further, and with the ability of the tool to also treat heating loads in the same way, the projected total energy consumption of multiple simulations could similarly be modelled such that probabilistic future energy demand profiles of that building could be constructed. This could be used to model the impact of future technologies and future uses of buildings, all within the context of climate change.
Figure 3.
Cooling energy consumption projections in a future climate for an example building.
Figure 3.
Cooling energy consumption projections in a future climate for an example building.
4. Modelling Future Scenario Projections on Building Demand
The research project ARIES (Adaptation and Resilience In Energy Systems) [
22] is investigating the effect of climate, and other changes, on the relationship between energy supply and demand associated with buildings. Climate change can affect the yield from renewable energy generation, the performance of key parts of the energy transmission/distribution infrastructure, and the type of energy demand profiles produced from the building stock. It is important to investigate this confluence of different climate-instigated changes to fully appreciate how adaptations to the building stock should be carried out in the coming decades.
This is likely to be particularly true for the electricity grid. Electric vehicles, low-carbon electric heating (specifically heat pumps) and growth in consumer/IT appliances could be stimuli for quite different patterns of electricity use from our building stock in the future. It is impossible to predict exactly what technologies will become commonplace, but it is possible to investigate the sensitivity of energy networks to possible changes based on defined future scenarios.
The approach taken by the ARIES approach is semi-empirical, and is different for electrical demands than for thermal demands (though there is clear crossover between the two). In both cases, as the effect on the wider energy network is of prime importance, the key step is producing demand profiles that could correspond to, at least, a community-scale of buildings. Changes in demand of large regions of building stock are far more important than changes observed (or predicted) at an individual building level.
4.1. Electrical Demand Profiles of Groups of Buildings
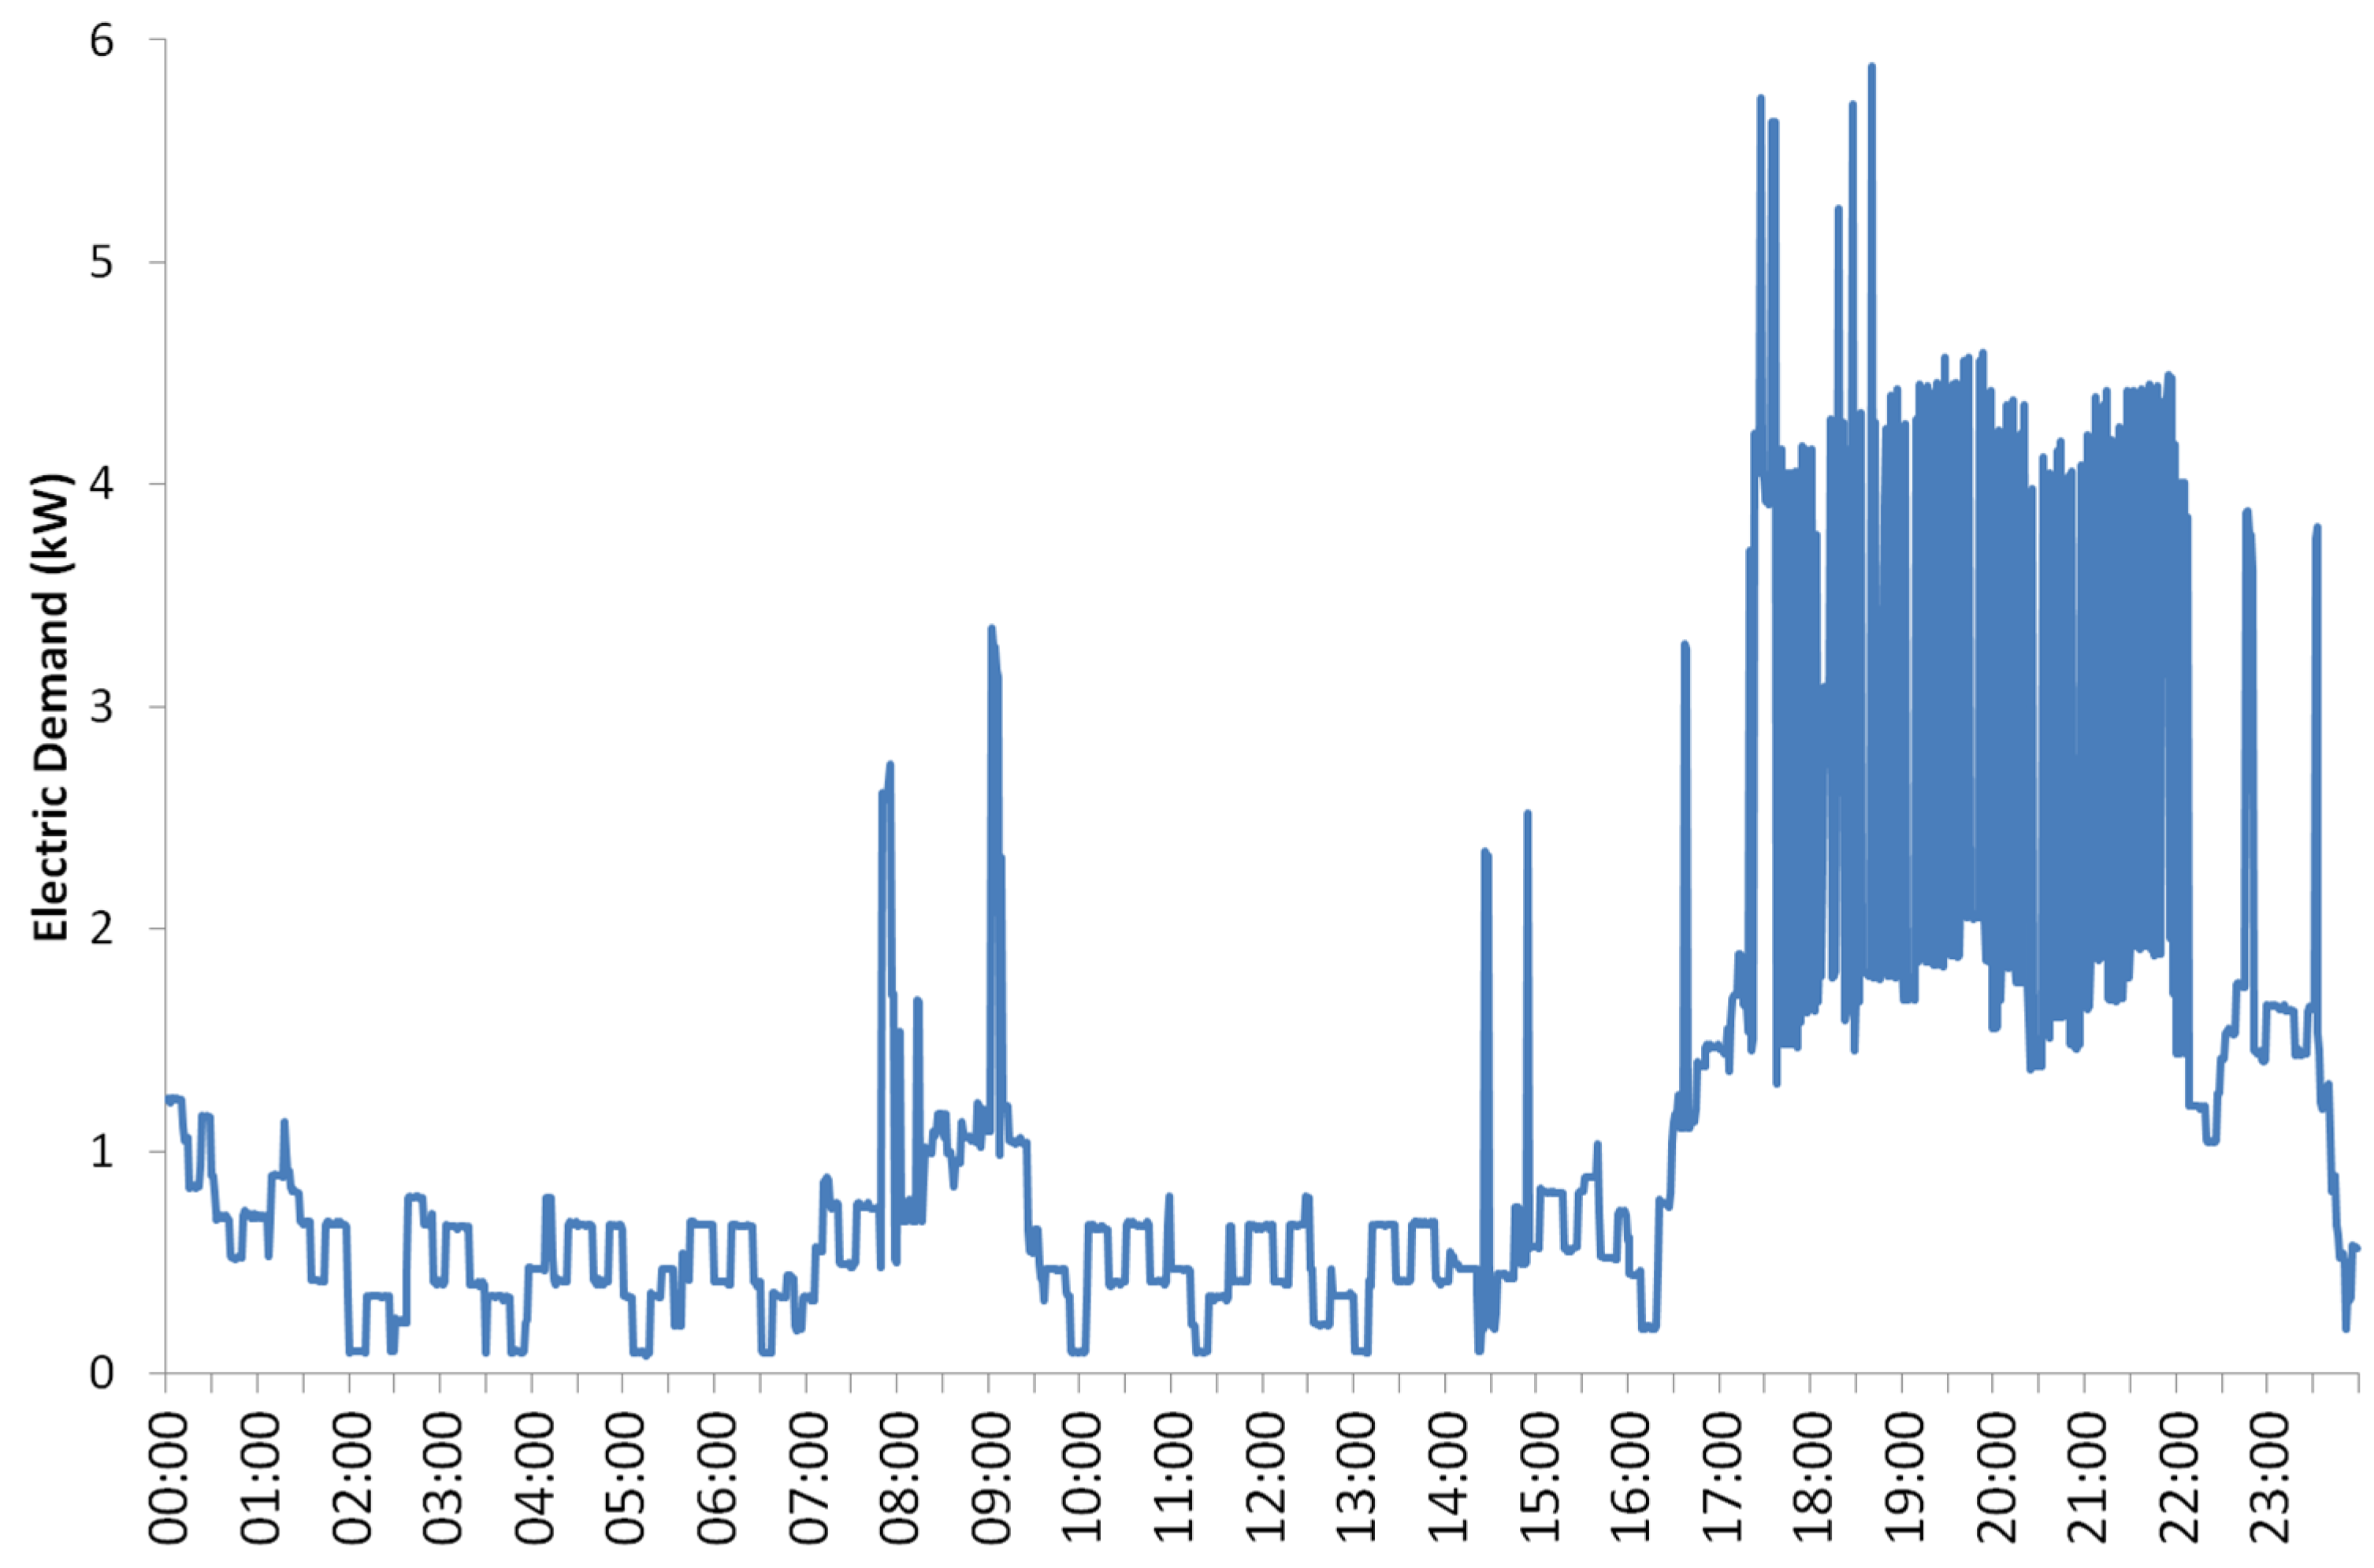
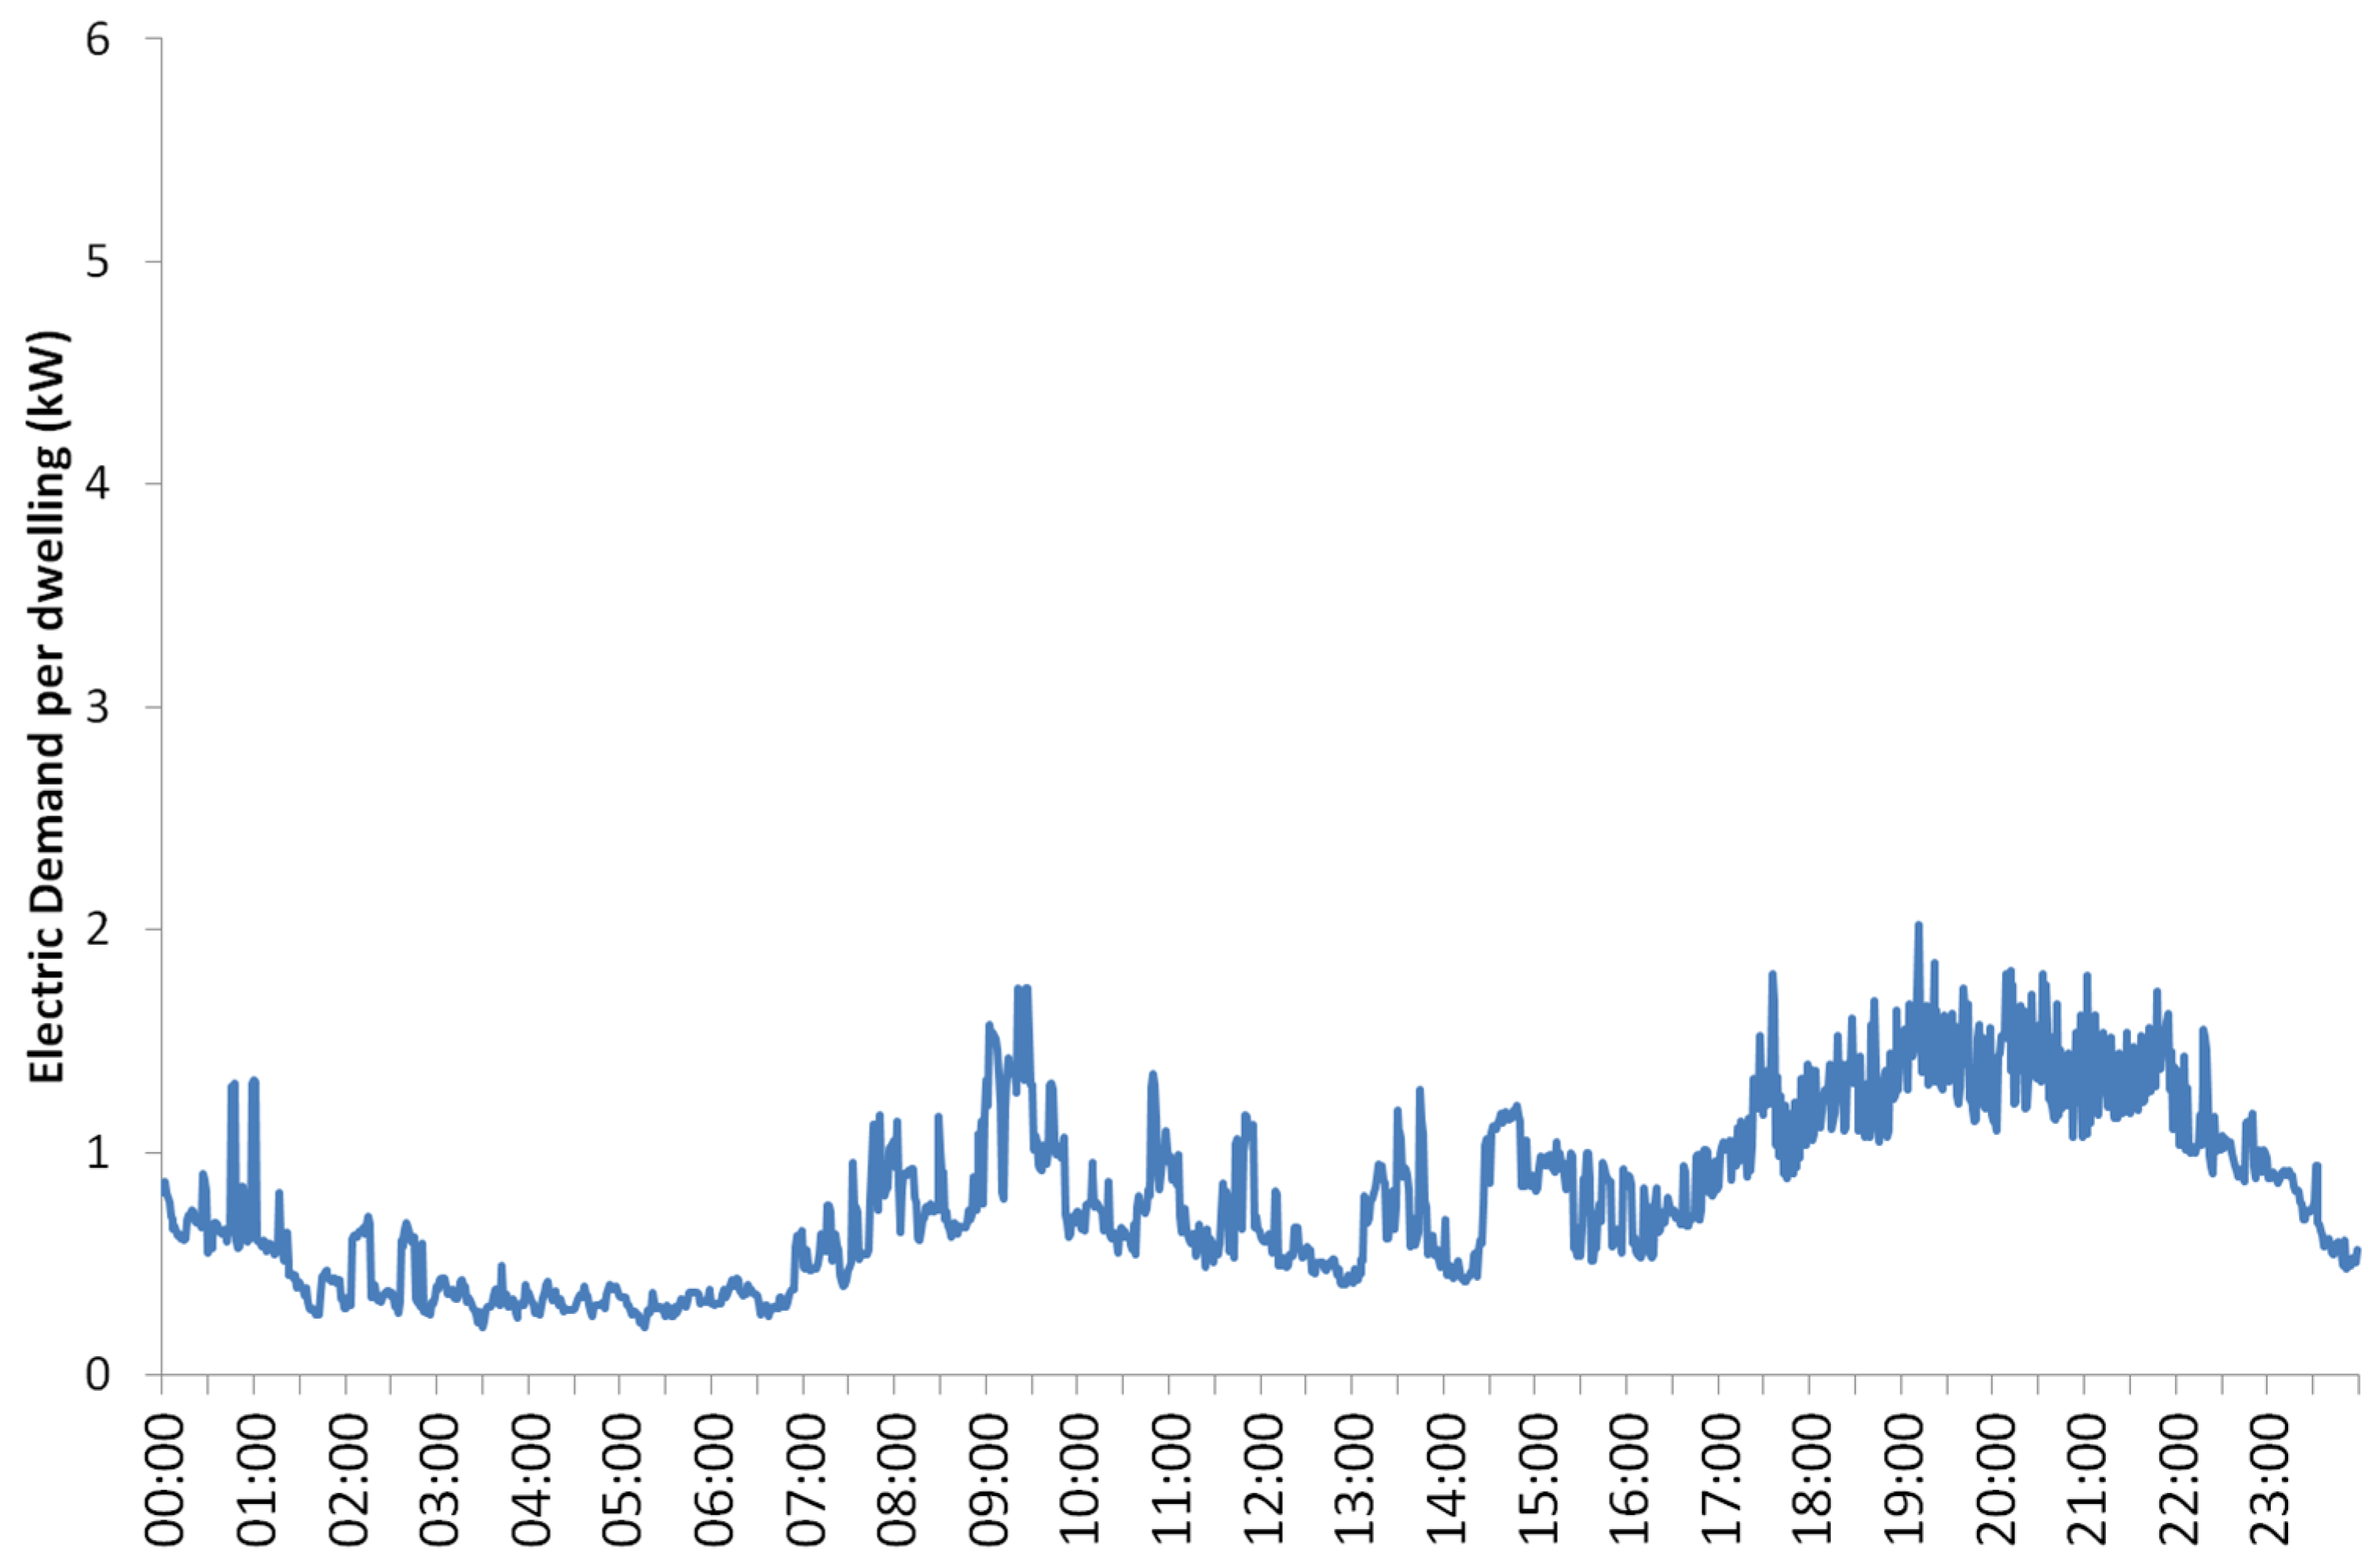
Electrical demand profiles of buildings, particularly dwellings, can be most interesting when observed at a high temporal resolution. These profiles, such as
Figure 4 (discussed elsewhere [
23]), exhibit clear features that are directly related to the types of technologies being used throughout the day (such as kettle spikes or refrigeration cycles). When the profiles of many dwellings are aggregated together, a different profile shape emerges (such as
Figure 5) that is due to the effect of After Diversity Maximum Demand (ADMD). In simple terms, the aggregated profile is much smoother than that of an individual dwelling profile as individual actions over periods of just a few minutes (seen as almost stochastic events on an individual dwelling profile, such as a boiled kettle) become less noticeable, whereas common practices (such as typical times that people across the country switch lighting on during the winter) become superimposed and create the key characteristics of the aggregated profile.
Figure 4.
Example of an individual dwelling demand profile at minutely resolution taken from an empirical dataset [
24].
Figure 4.
Example of an individual dwelling demand profile at minutely resolution taken from an empirical dataset [
24].
Figure 5.
Example of an aggregated electrical demand profile of nine different dwellings at minutely resolution from an empirical dataset [
24].
Figure 5.
Example of an aggregated electrical demand profile of nine different dwellings at minutely resolution from an empirical dataset [
24].
This process of aggregation is crucially important to understanding how changes to the built environment might affect energy provision in the future. The individual dwelling demand profiles allow specific technologies to be observed, and indeed modelled for future scenarios (such as adding to
Figure 4 an electric vehicle being charged). The aggregated profiles allow for an understanding of how such changes across a building stock might result in different energy demand characteristics that then have to be met by those involved with energy generation. While it is quite common, for example, for a high penetration of electric heat pumps and electric vehicles to be proposed in future low-carbon scenarios [
25], the effect such technologies might have on transient demand profiles and, therefore, peak demand is less well investigated. The techniques proposed here are still in development, but provide an approach to estimating this for future electrical demand profiles.
4.2. Future Thermal Demand Profiles of Groups of Buildings
The approach taken by the ARIES project for thermal demand profiling of buildings is more based in theoretical building simulation than empirical data. Building stock models (such as [
26]) are well-used tools in many countries for identifying the impact that changes in building design, and the introduction of low-energy retrofits, might have on energy use and carbon emissions of the buildings. These models tend to have relatively simple, steady-state building physics behind their assumptions, and are therefore not designed for the calculation of transient energy demand profiles. As such profiles are required for the objectives of the ARIES project, a transient dynamic model (specifically Integrated Environmental Solutions-Virtual Environment (IES-VE)) is used instead of a traditional stock model. The shortcoming of this approach is that complex, dynamic simulations of a small number of buildings cannot be extrapolated to the building stock of an entire country. However, the methods proposed here will suggest that it is feasible to simulate a sample of buildings that can be upscaled to represent a “region” of buildings and an associated energy demand profile for heating.
4.2.1. Accounting for Multiple Buildings
The compromise proposed by the ARIES project, between a detailed thermal model of an individual building and a stock model of many buildings, is a dynamic, local-scale stock model. Reasonable detail can be provided for building archetypes within the simulation environment, but simplified to such a level that multiple buildings (of the order of hundreds, but then extrapolated to thousands) can be practically simulated at the same time. These archetypes can be thought of as more detailed versions of what might be modelled within a traditional stock model. They can be tailored to the local stock of a region, using available data (see below) to represent the building typology, efficiency levels and activities expected in that region; the reduced geographical scale also means that a single weather file is a more acceptable compromise than for a country-wide assessment.
The methodology is described in detail elsewhere [
27] but involves the following key steps:
Build up a series of dwelling archetypes based on national stock information (construction, typology, occupancy, heating schedules etc.);
Simulate these within a dynamic simulation software (nominally IES-VE, but other software can be used) to obtain a series of transient hourly heating profiles, using a weather file representing the local area under investigation;
Choose a more localised area and weight a chosen sample of simulated variants to represent that local stock of dwellings;
Post-process data to obtain an aggregated hourly thermal demand profile for a given time period (e.g., heating season or entire year);
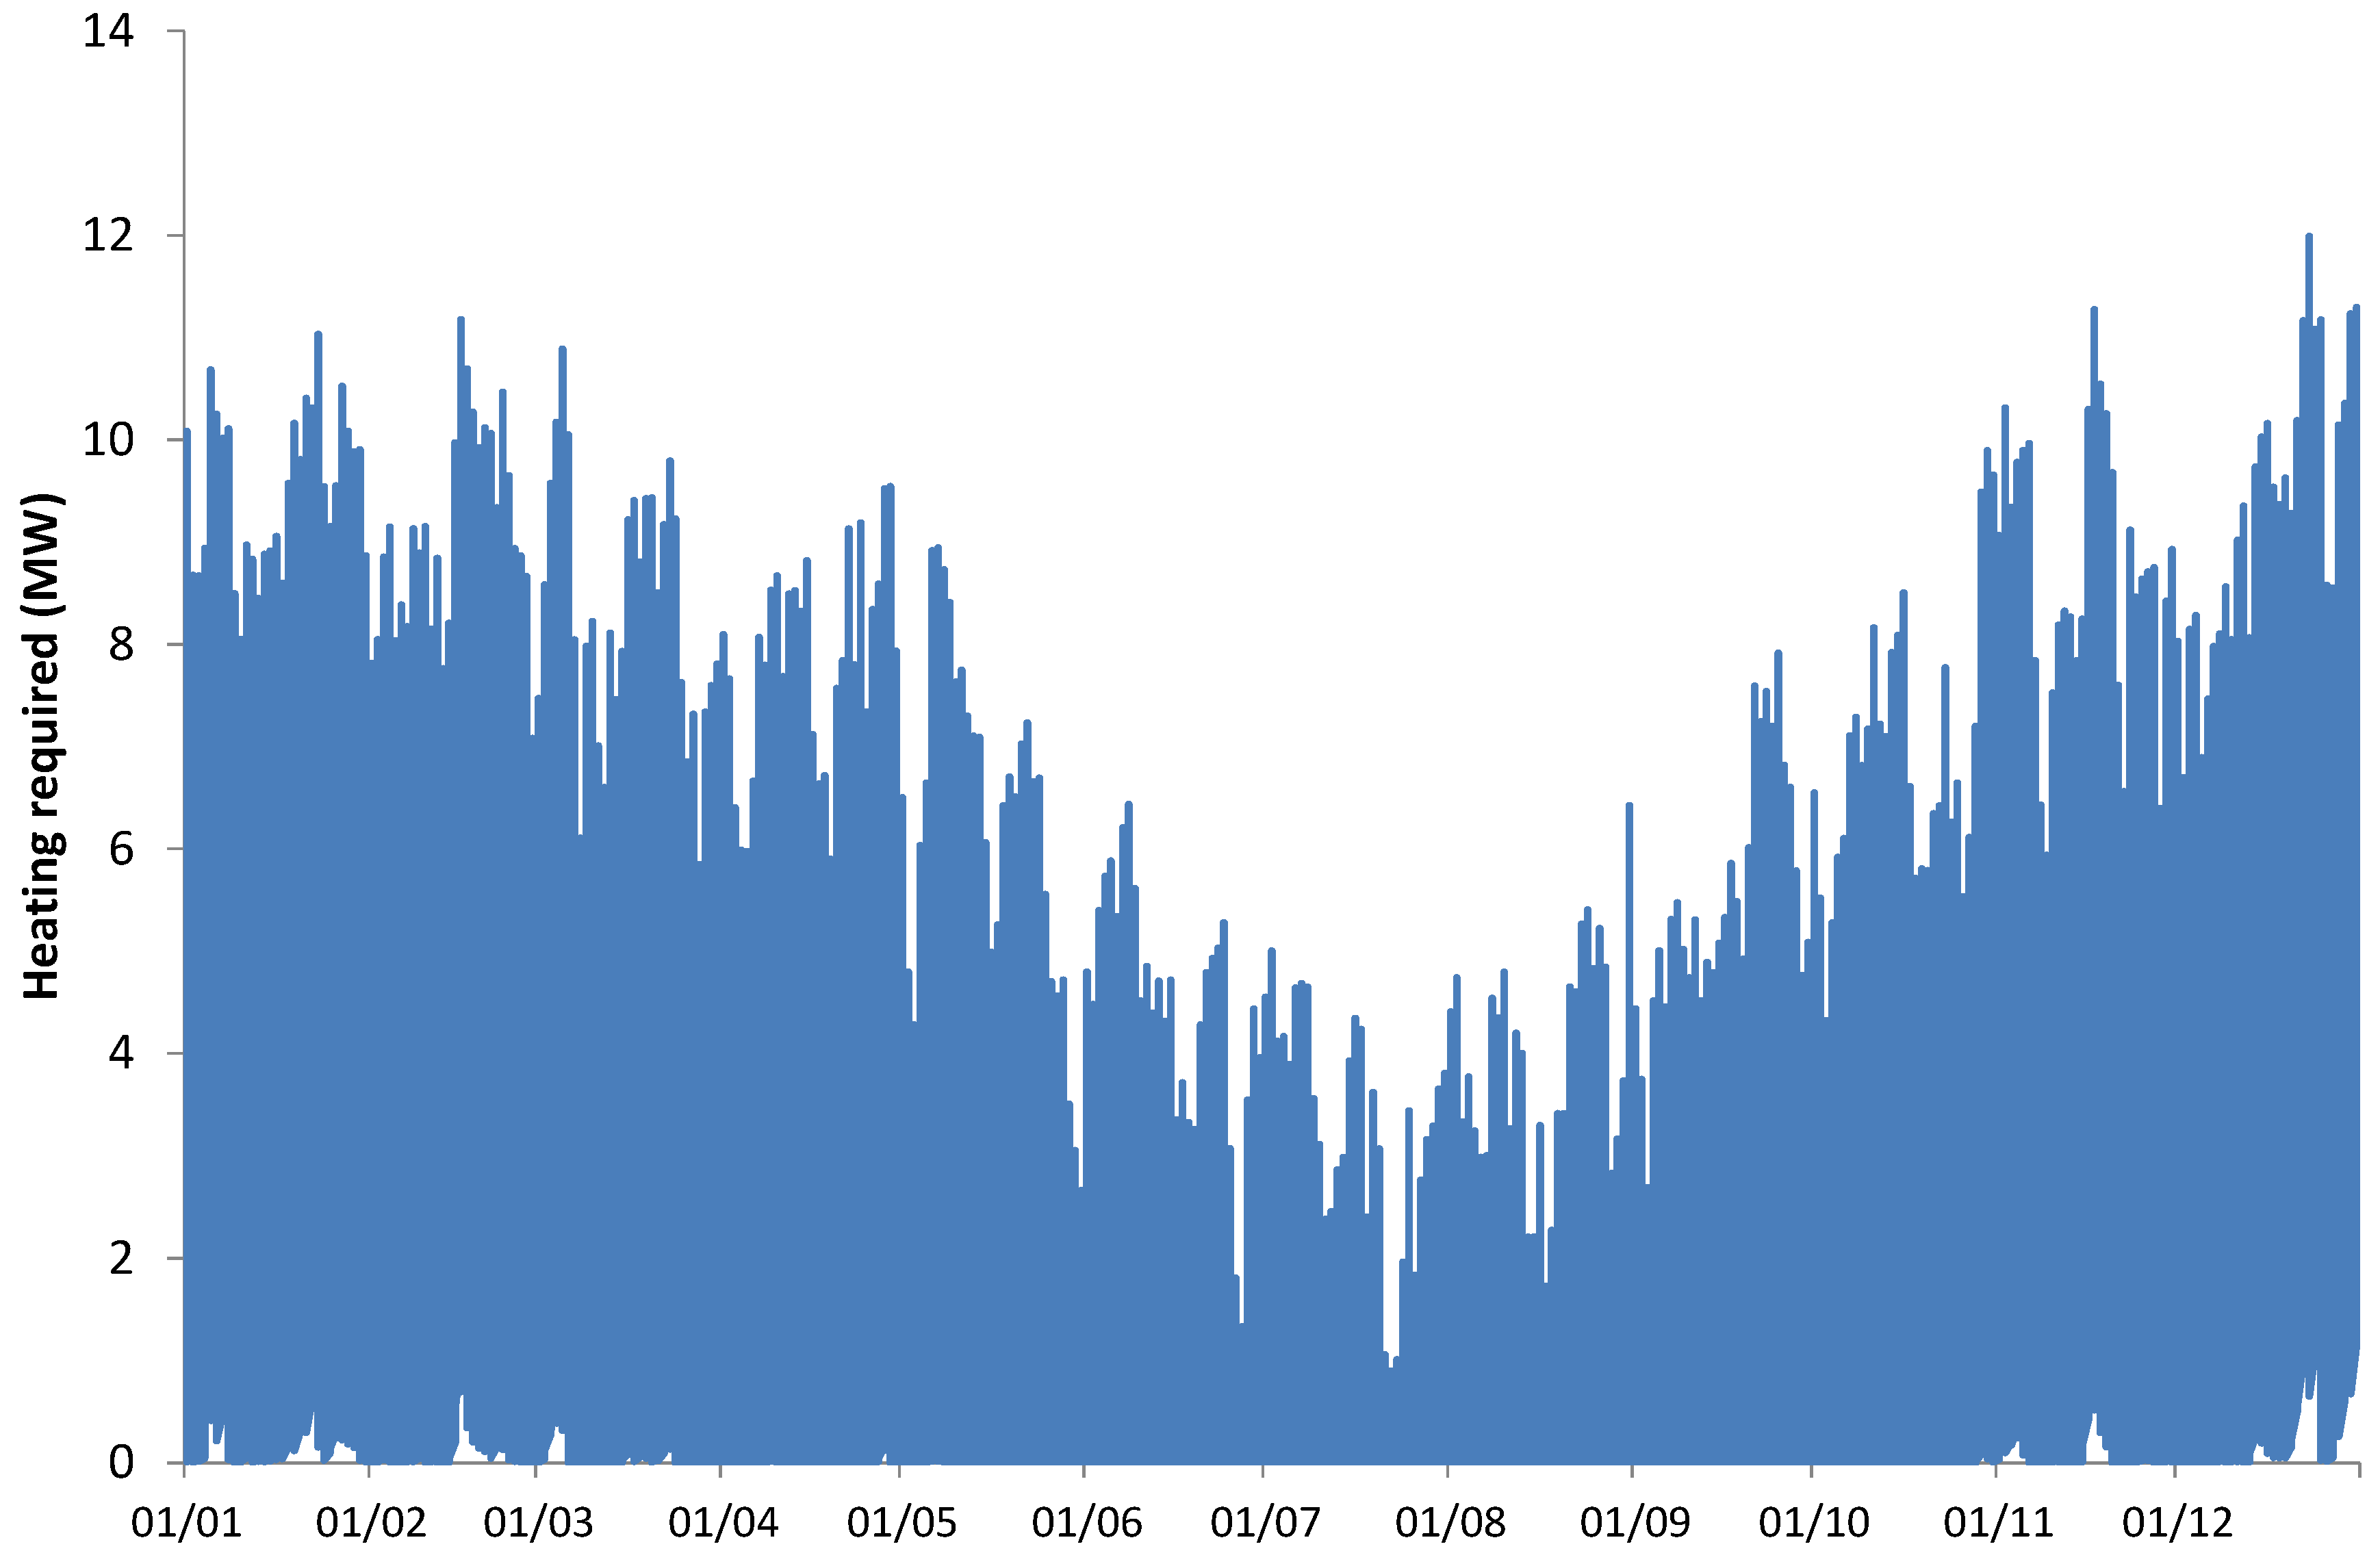
Figure 6 provides an example of this multi-dwelling aggregated thermal demand, for the equivalent of 1271 simulated dwellings located within an Intermediate Geography Zone (IGZ) in Edinburgh (simulated using the Edinburgh Test Reference Year (TRY) weather file [
17]). Scotland is comprised of 1235 IGZs, where these represent a statistical geography used to collate and report data at a much higher spatial resolution (broadly equivalent to Middle Layer Super Output Areas (MLSOA), used in England). Edinburgh is represented by 101 IGZ’s, therefore a single simulation exercise using Edinburgh weather data can be used to determine data for these 101 localised areas.
Figure 6.
Example of an hourly aggregated thermal demand profile of 1271 dwellings as simulated using described method.
Figure 6.
Example of an hourly aggregated thermal demand profile of 1271 dwellings as simulated using described method.
The profile represented in
Figure 6 is based on the information summarised in
Table 1, a virtual case-study with a mix of building types, orientations and occupancies—some of the chosen values are for demonstration purposes while others are informed by census data and national averages. Specifically, the chosen mix of buildings for the IGZ applies the following assumptions:
Table 1.
Overview of building and occupancy types used to construct the aggregated thermal demand profile of
Figure 6.
Table 1.
Overview of building and occupancy types used to construct the aggregated thermal demand profile of Figure 6.
| Build Type | Semi Detached | End Terrace | Flat | Mid Terrace | Detached |
| Percentage | 50.9% | 10.0% | 7.1% | 14.6% | 17.4% |
| Construction Type and Age Banding | Brick B_E | Brick F | Brick G | Conc B_D | Conc E_F | Ins Brick B_E | Ins Brick F_H | Ins Brick J_K | Sstone A_D | Timbr D_E | Timbr F_I | Timbr J_K | Whin A_D |
| Percentage | 23.2% | 4.1% | 1.0% | 1.7% | 2.1% | 24.2% | 8.7% | 3.9% | 12.0% | 1.5% | 13.1% | 0.5% | 4.1% |
| Orientation | N/A | E | E-W | N | N-S | S | W |
| Percentage | 17.4% | 18.3% | 7.6% | 17.3% | 9.2% | 15.7% | 14.5% |
| Occupancy Profile | FT | PT_aftrn | PT_morn | HAD |
| Percentage | 44.8% | 23.7% | 22.6% | 9.0% |
| Average House Temperature | 17 °C | 19 °C | 21 °C |
| Percentage | 8.3% | 71.3% | 20.5% |
“Build Type” is taken from Census data [
28], with an assumed split of 40:60 between end- and mid-terrace dwellings (as census data has no such distinction);
Age bands and construction type are assumed from national averages of the chosen building types [
29], based on an assessment of common construction materials relative to building form and construction period;
Orientation is part-randomised but informed by dwelling types. “Detached” has no orientation where distribution of glazing is equal on all sides (“N/A” in
Table 1), mid-terrace dwellings have an East/West (“E-W”) or North/South (“N-S”) exposure where stated orientations indicate sheltered sides relative to other connected dwellings. An end-terrace dwelling can be situated East (“E”) or West (“W”) of an E-W mid-terrace, or North (“N”) and South (“S”) of an N-S mid-terrace;
Occupancy is informed by census data [
28], albeit simplified for demonstration purposes;
House temperatures are based on simplified use of social indicators of reference occupants, again from census data [
28].
The approach can be repeated with a completely different selection of criteria to match a specific case-study, so the above assumptions can (and should) vary on a case by case basis.
4.2.2. Accounting for Multiple Future Climates for Multiple Buildings
With a method for accounting for multiple future climates, and a separate method for simulating multiple buildings simultaneously, the logical progression is to combine these methods to produce a probabilistic climate, multi-building simulation environment that can produce aggregated heating requirements (and other types of energy requirements) for a community of buildings in a range of future climate scenarios. This combination of methods is presented in this paper for the first time.
The aggregated heating load of
Figure 6 is processed through the LCF tool, where the tool emulates the effect of the weather file used in the original building simulation (of
Section 4.2.1) on the aggregated heating load for an entire year. As the tool effectively produces a new aggregated heating profile for every climate file used, this can result in many hundreds of heating load profiles which, if being used to make decisions on building energy efficiency, would not be desired in their entirety. There is also the issue of what a user of a tool wishes to find out; are they concerned with peak heating load exceedance or annual energy consumption? The tool can deal with both these requests, though post-processing is currently needed to draw meaning from such results.
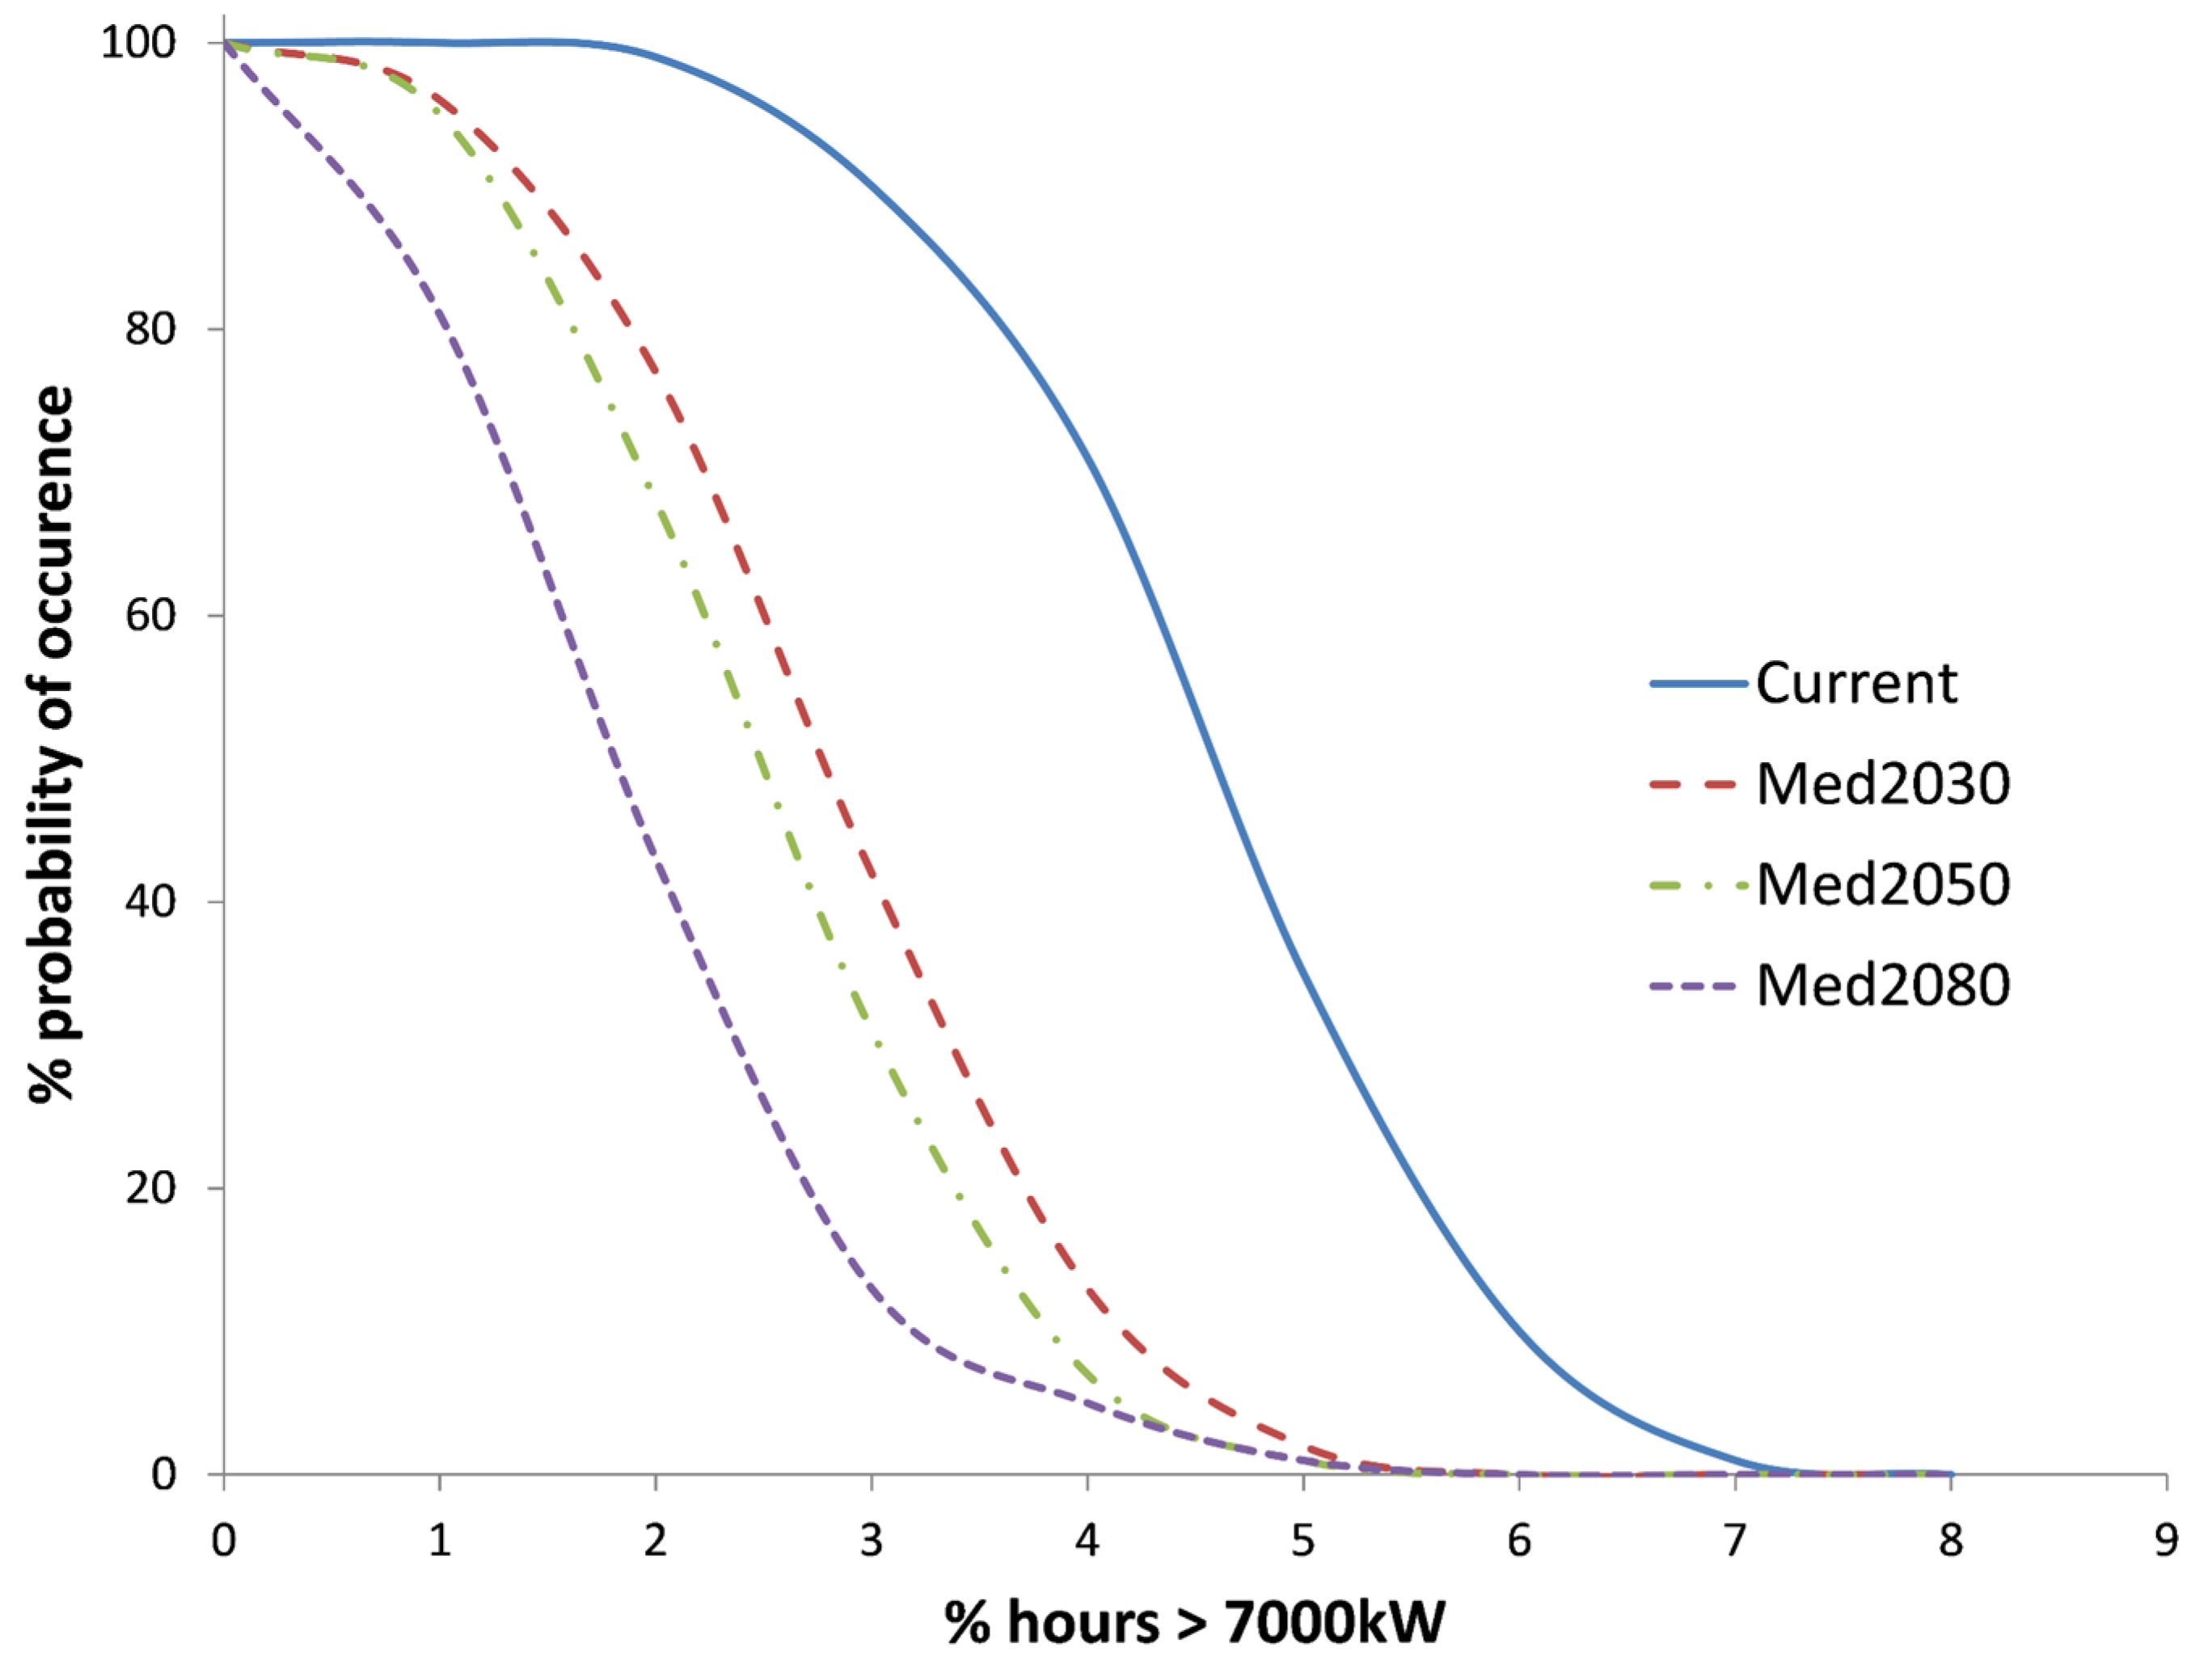
Figure 7 provides just one type of output to demonstrate the potential of the method being described. This shows the percentage probability that a peak heating load (simulated hourly) will be exceeded, for different magnitudes of exceedances. Three future climate scenarios (from UKCP09 definitions) have been used relating to “medium” greenhouse gas emissions for the years 2030, 2050 and 2080, and these are compared to a current baseline climate for Edinburgh (where this is a slightly different source of weather data than the Edinburgh TRY used in
Section 4.2.1 but, broadly, describing the same location and timescale).
Nominally, a heating load of 7000 kW (aggregated for all 1271 dwellings) has been chosen for examination—the user of the tool might choose a value that, if exceeded, would be undesirable or simply a high percentile value when compared to the baseline simulation. From
Figure 7 it can be estimated, for example, that there is a 100% probability that an aggregated heating load is exceeded for 2% of hours throughout the year. However, the equivalent probabilities for the 2030, 2050 and 2080 scenarios are 77%, 68% and 43% respectively—this represents a significant difference in the frequency of high percentile heating loads. This could, amongst other things, help a designer think about a replacement district heating system or just more generally understand times of high heat demand, and how this might change in the future, in more detail.
As mentioned, there might also be a desire to produce similar output but for annual energy consumption (e.g., percentage probability that the group of dwellings will exceed an MWh/year value and how this might reduce for future climate scenarios). This is a simpler task in that it does not require the interrogation of detailed hourly heating loads, merely a summed value over the entire year. The example of output selected (
Figure 7) is therefore chosen to highlight the ability of the tool to use hourly heating (or indeed cooling) loads that emanate from a large number of buildings.
There are current limitations when applying the LCF tool to multiple dwellings. The tool was originally designed for single dwellings where a specific occupancy (i.e., an hourly profile of occupant presence in the dwelling) could be input. However, when using an aggregated profile of hundreds of dwellings, the ideal occupancy profile would indicate, for example, the percentage of dwellings occupied every hour of the day. The tool does not allow for such an input to be accommodated at present, though later versions are planned to have such a feature to better distinguish between times of low and high occupancy. Despite this, the current version of the tool does demonstrate the type of output possible, allows researchers to think about the type of information that can be processed and, ultimately, what functions could be offered to practitioners.
Figure 7.
Result of future probabilistic heating load assessment of case-study dwellings.
Figure 7.
Result of future probabilistic heating load assessment of case-study dwellings.
4.3. Decision Tools for Future Design
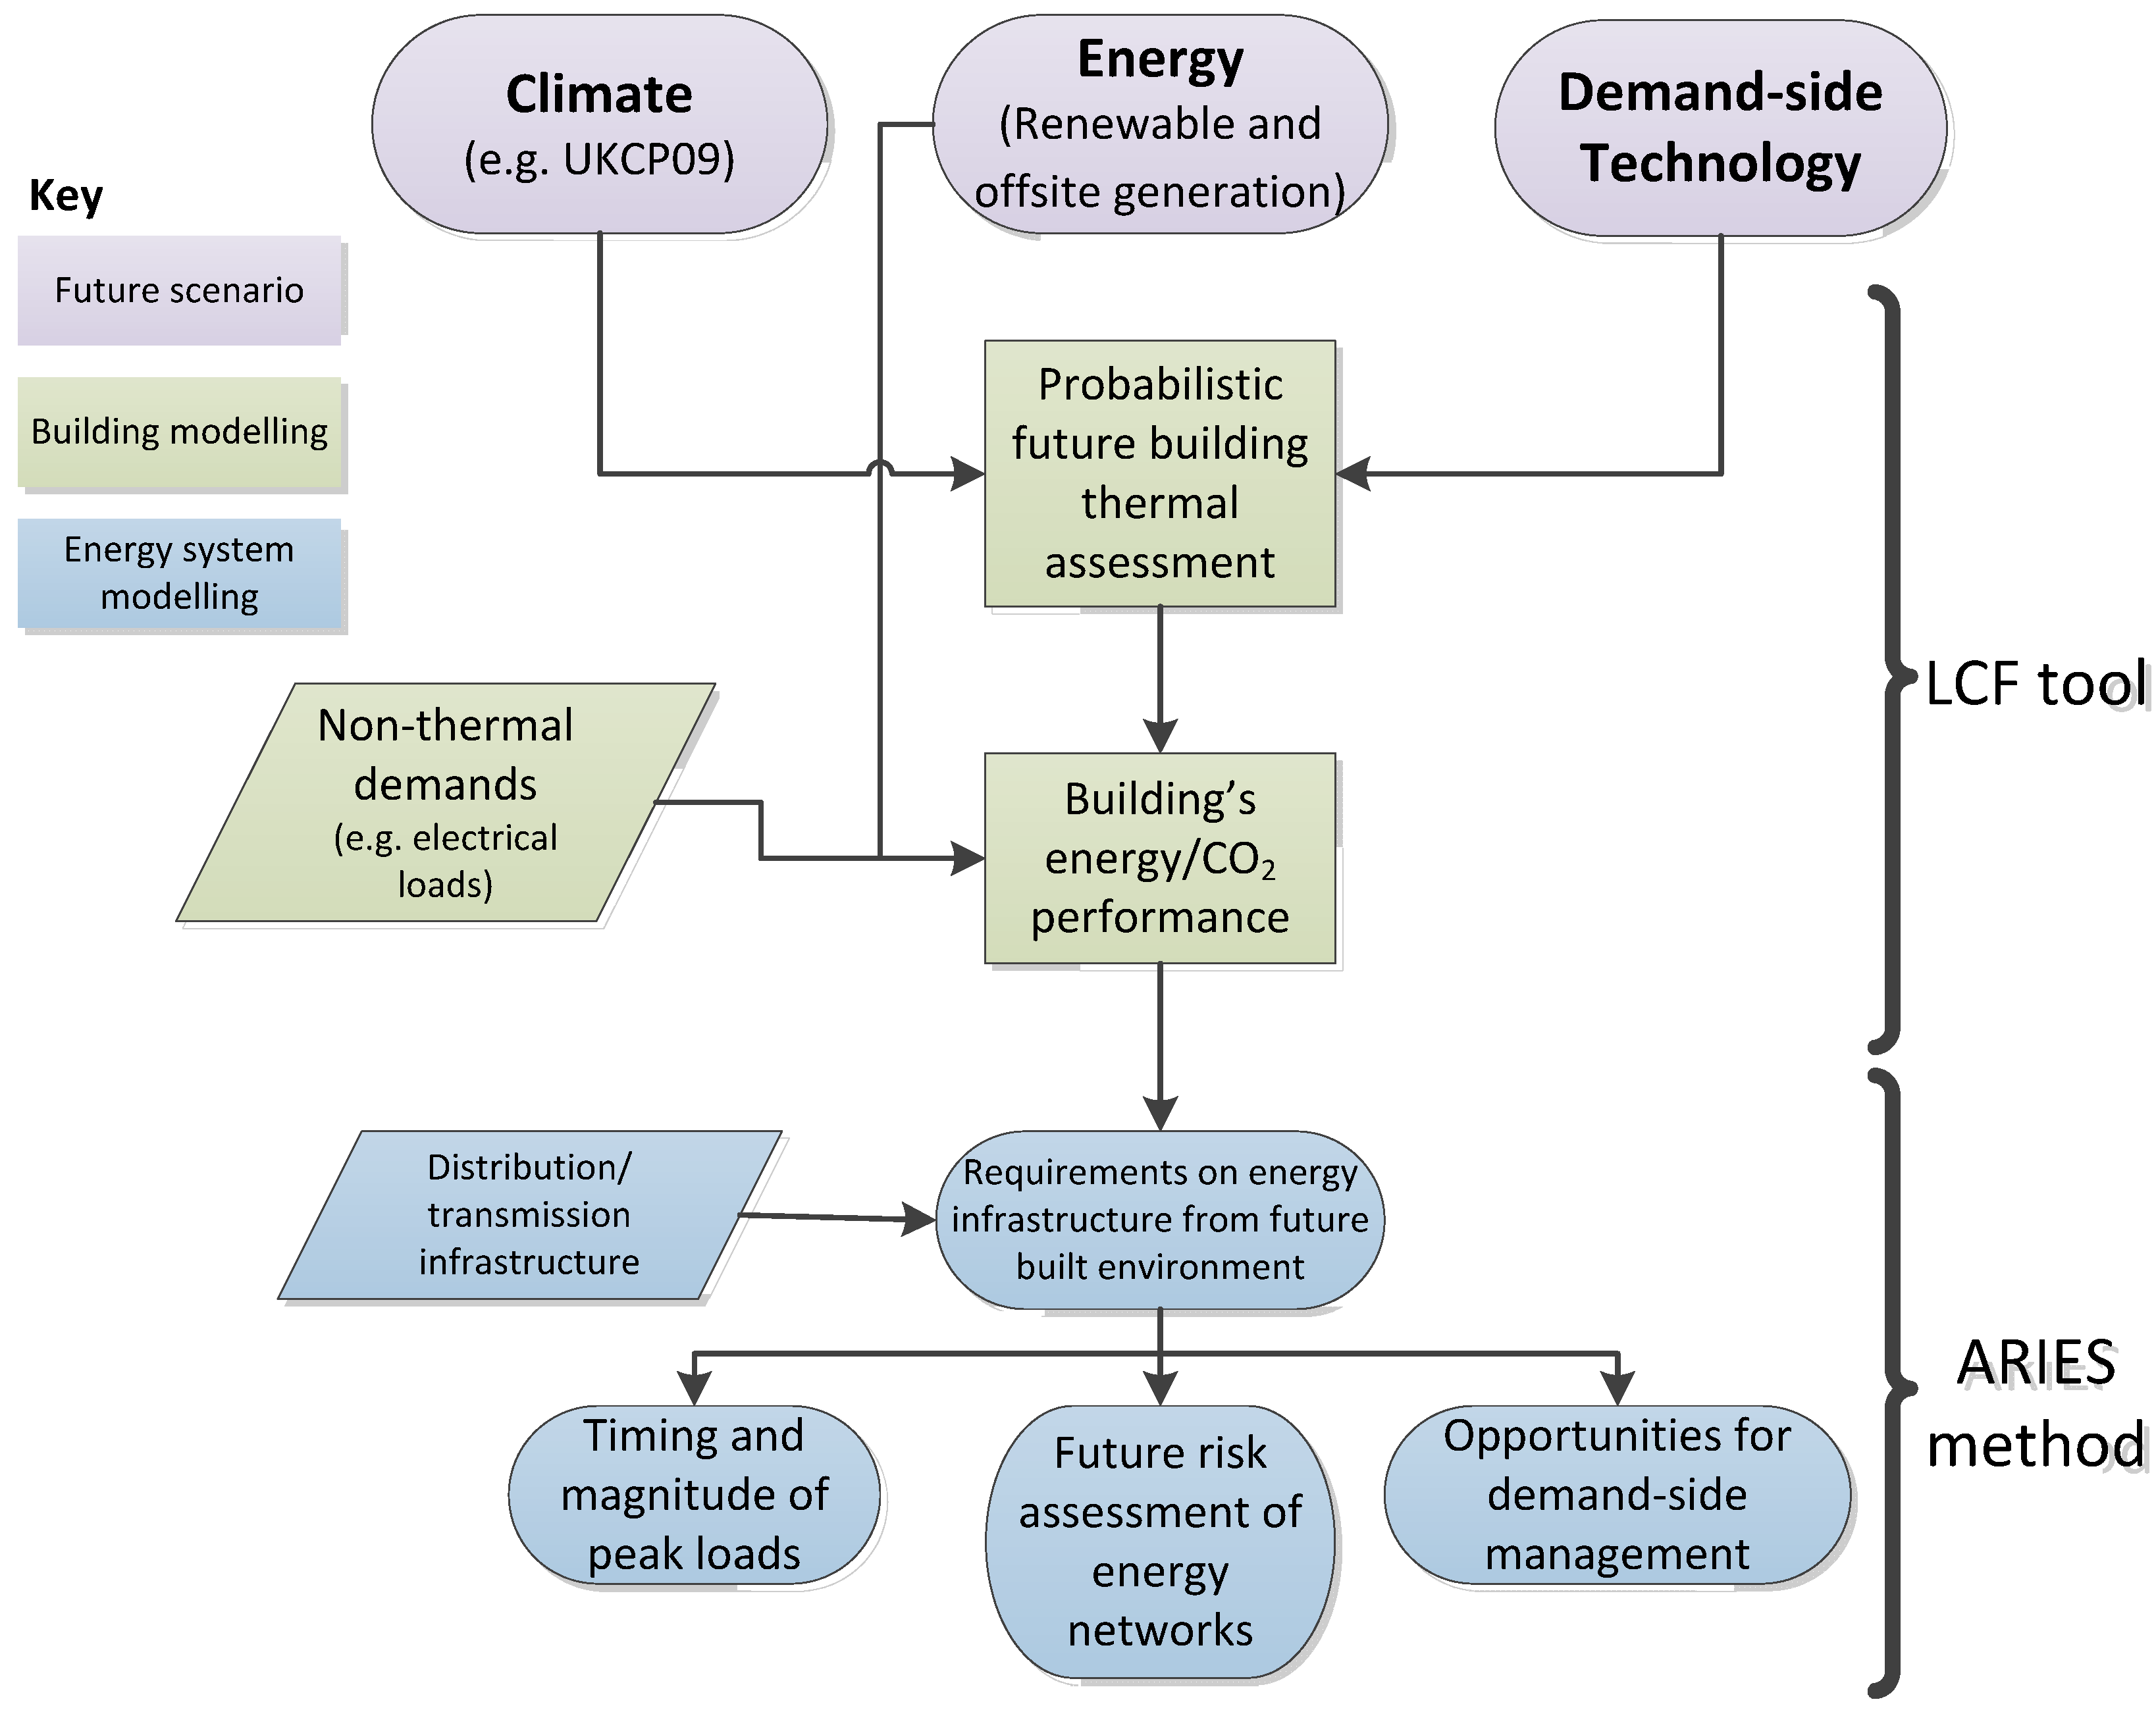
Combining the approaches of the LCF and ARIES projects gives
Figure 8. This, in a simplified form, presents the ability of the tools/methods to influence decision making for future design. The approach is flexible enough to account for different future scenarios, and can assist a designer in choosing features (or adaptations) that might suit a building (or buildings) for a future climate. Furthermore, the impact that this might have on an energy network, for that given future scenario, can be explored. As previously discussed, more work is required to expand the application of this method (particularly in terms of spatial and geographical scale), but the concept and initial simulations suggest the information provided would be suitable for practitioners in these respective industries.
Figure 8.
Use of LCF and Adaptation and Resilience In Energy Systems (ARIES) methodologies for identifying future forms of energy provision for the built environment.
Figure 8.
Use of LCF and Adaptation and Resilience In Energy Systems (ARIES) methodologies for identifying future forms of energy provision for the built environment.
5. Discussion
It is important to recognise common practice in industry when it comes to future building design, and the methods used in this area. Though several examples of applying future climate information to building design exists (albeit mostly in the non-domestic sector for the UK), there are different avenues that a designer might take depending on their end goal. The use of future probabilistic climate information is just one avenue, and the described research in this paper (and other sources referenced) provides a rationale for why and how such information can be used.
For building modellers interested in future climates, it is usually the case that the focus is on overheating (or under-cooling) of buildings, and the LCF tool provides a function in this respect. Applying the modelling to wider issues of energy supply, and factoring in future technologies that are likely to have an effect on electrical and thermal demand profiles across a country, is less common. The initial approach proposed here, collating the work of the LCF and ARIES projects, is therefore particularly novel and requires further work for such a method to be incorporated into industry practice. The work is not merely about merging two different tools/methods; it also provides a means for merging the different, but related, disciplines of building and energy system engineering.
It would also be remiss to ignore the fact that changes to the built environment, and the energy infrastructure serving this built environment, occur over timescales of decades. It could be argued that this gradual change of building stock, adaptations, mitigation refurbishments and resulting energy demand, will mean that both building designers and those involved with energy provision have time to respond, even within the context of changing climate and building technology. However, to ensure that designers are heading in the right direction, decisions for future decades need to be thought about now, and tools such as those proposed here can play an important part in this.
At the same time, the outputs of climate models should be used responsibly. Projections such as UKCP’09 provide a new approach in that they are slightly more faithful to the outputs of the climate models, but then have the disadvantage of being more complex and less immediately accessible than other projections of climate. The processing of this form of climate projection, in a way that it becomes useful for an end user, is paramount to ensuring that it becomes a standard and practical approach to estimating how to approach climate change in the built environment.


