
Life-Cycle Energy Implications of Downtown High-Rise vs. Suburban Low-Rise Living: An Overview and Quantitative Case Study for Chicago


Abstract
:1. Introduction
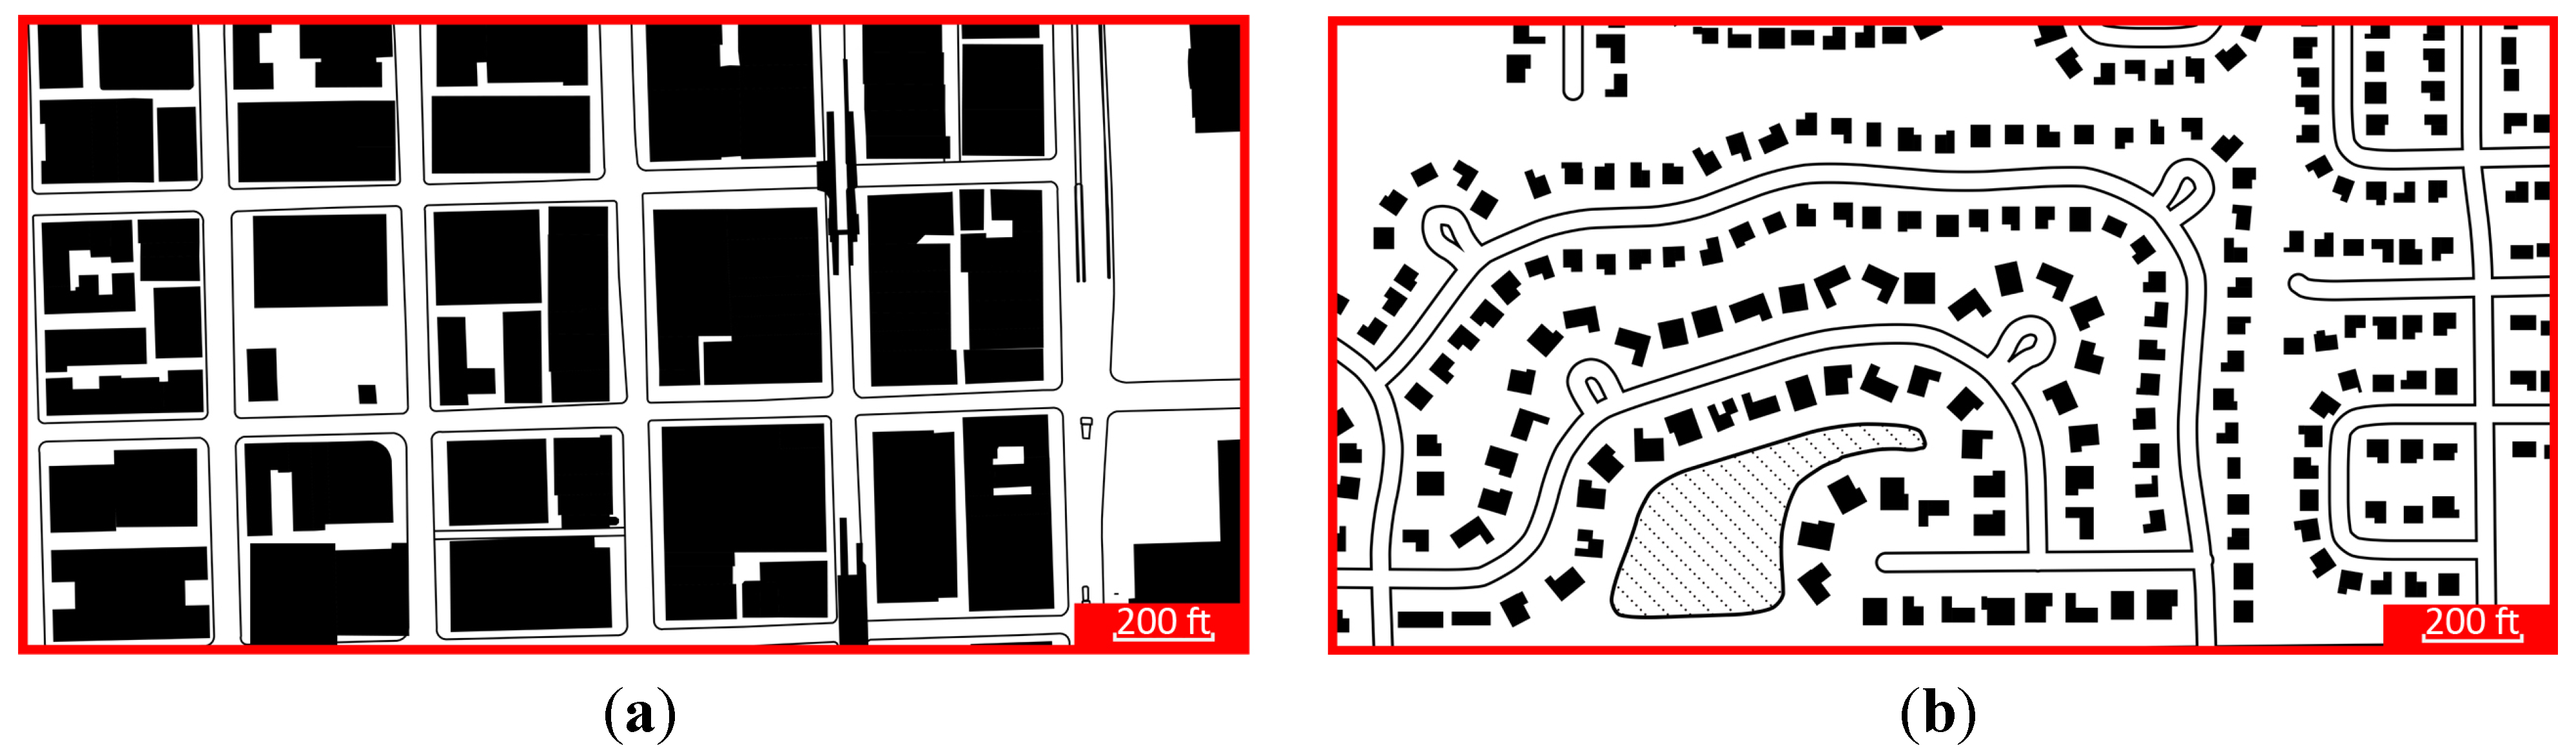
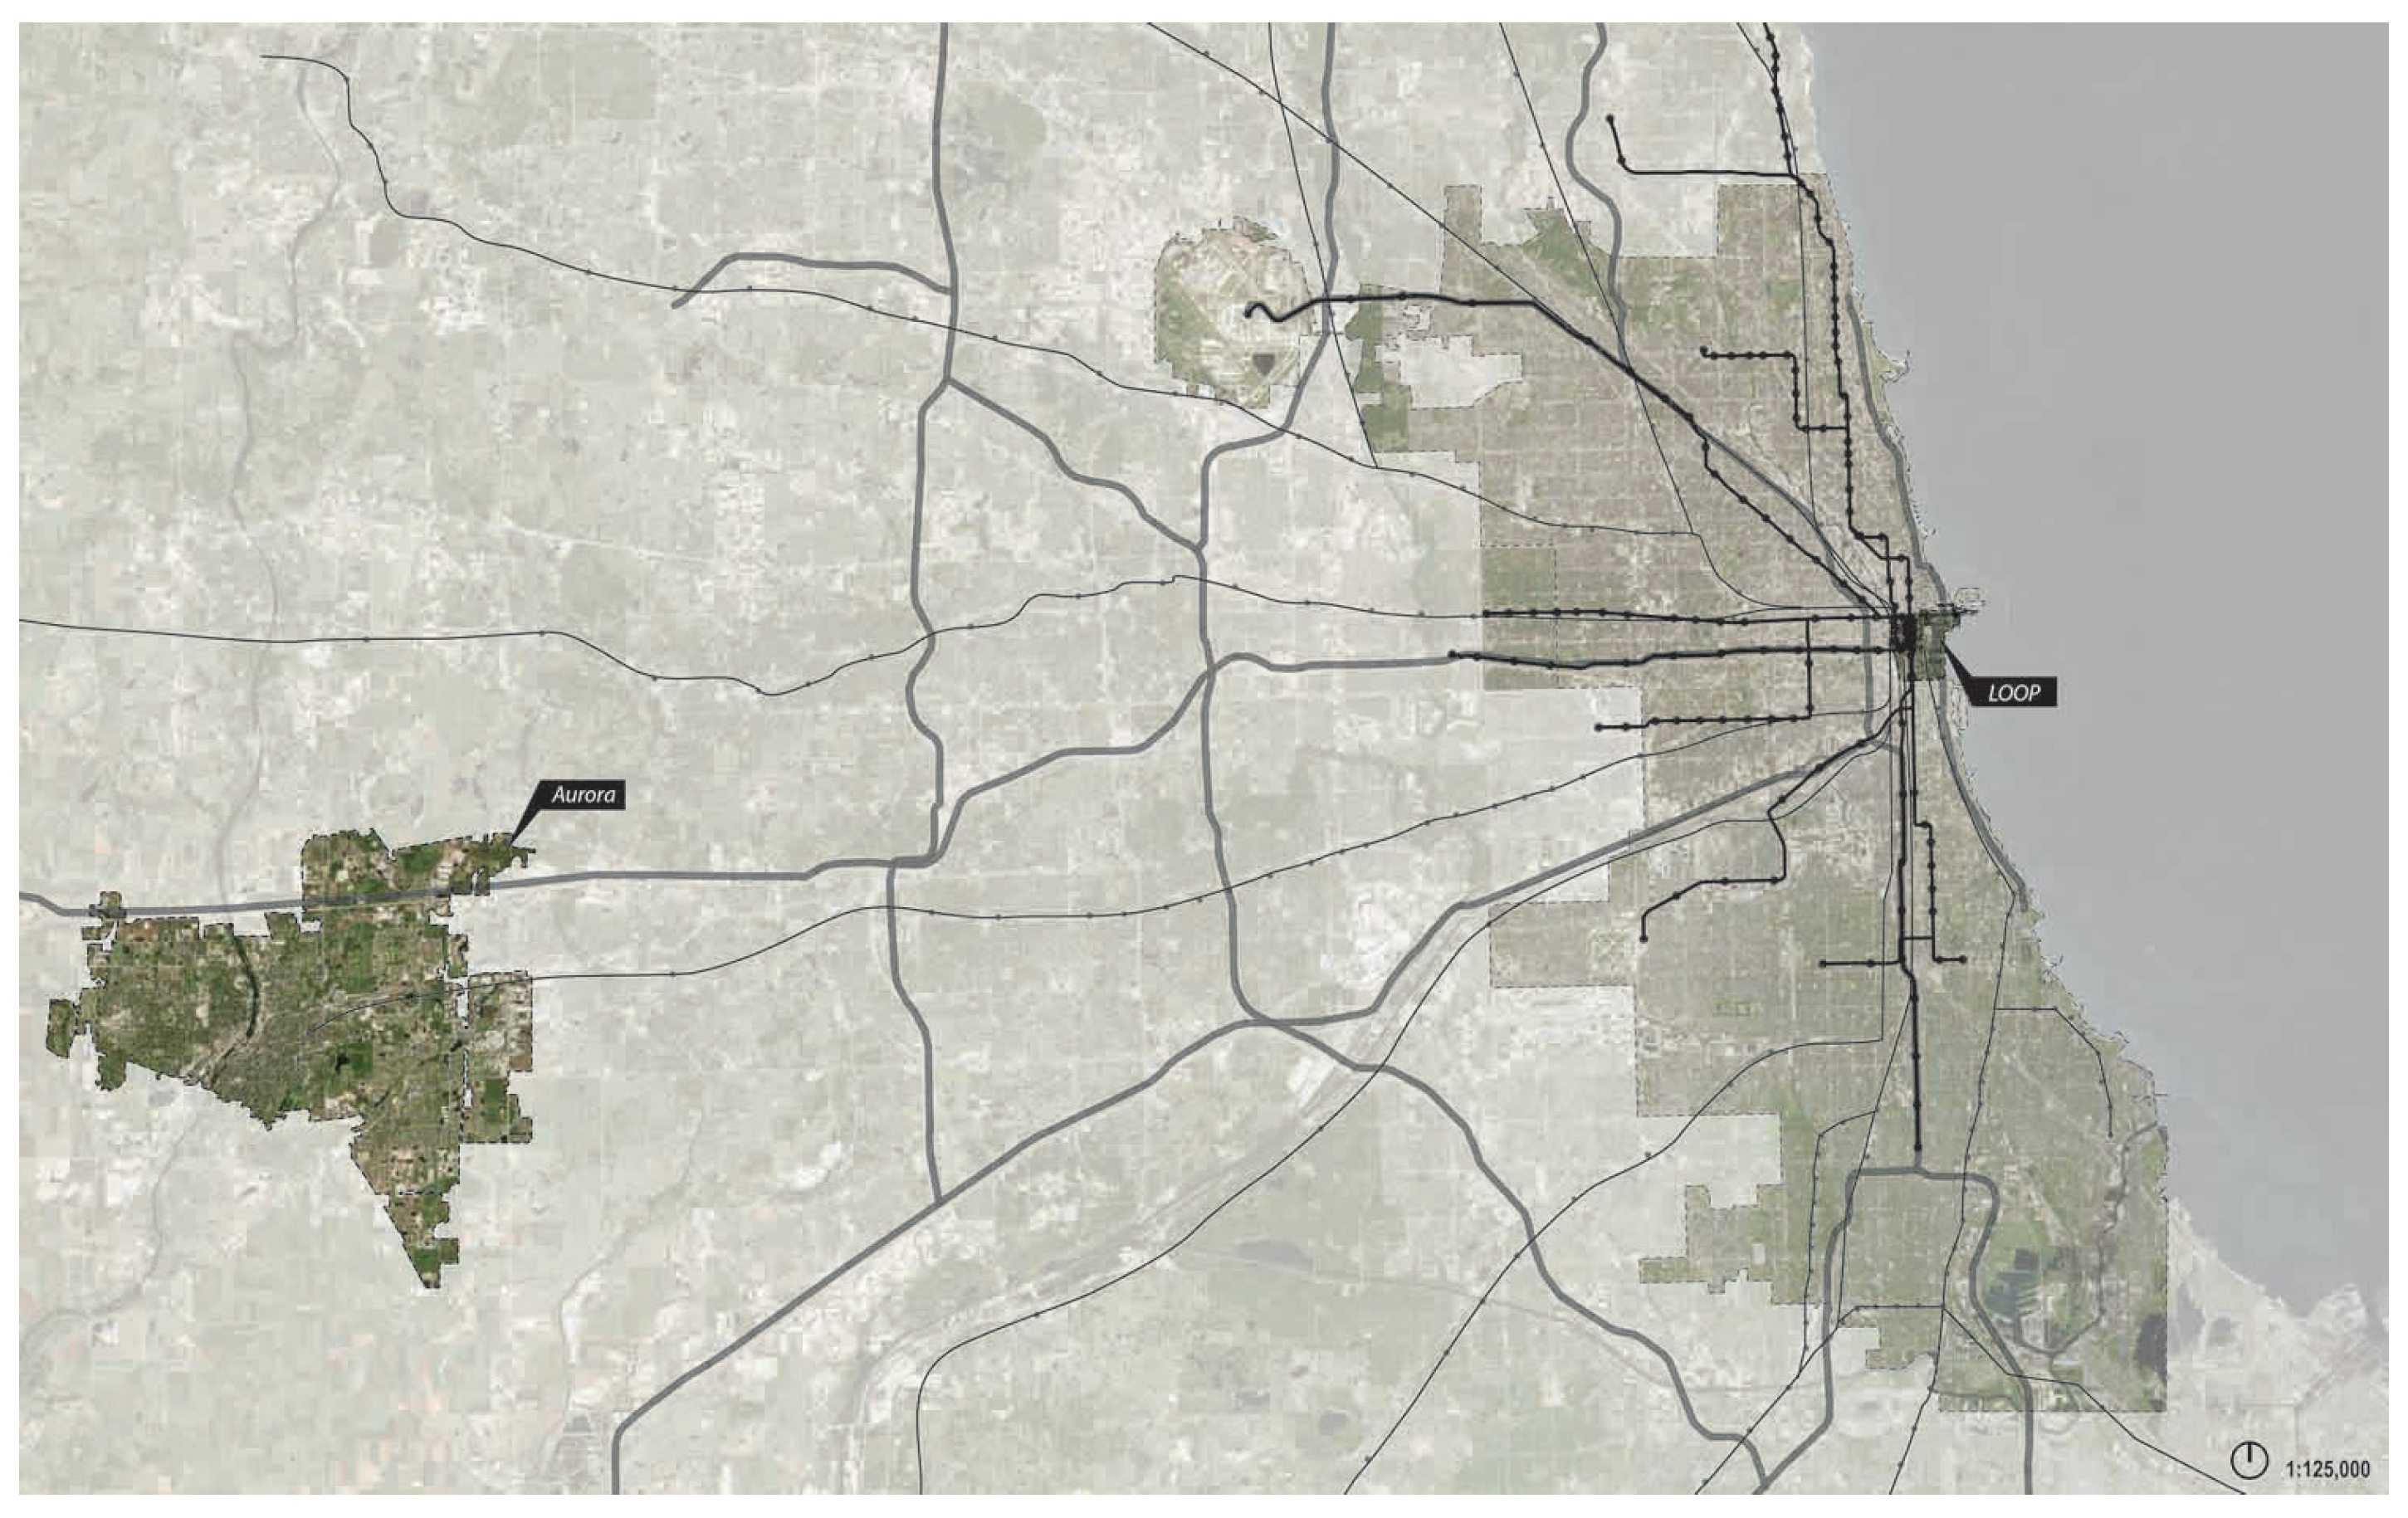
2. Case Studies


| Basic Characteristics | Chicago Loop | Aurora |
|---|---|---|
| Urban Pattern | Downtown area | Suburb area |
| Population [18] | 28,614 | 198,726 |
| Distance to Downtown | Walkable | Avg. 50 miles |
| Avg. HH Size [18] | 1.6 | 3.2 |
| Avg. Floor Area Occupied per Person (m2) * | 66 | 66 |
| Avg. Annual VMT per HH [18] | 6406 miles | 20,150 miles |
| Avg. Annual VMT per Person * | 4004 miles | 6297 miles |
| Public Transportation | All CTA Lines, All Metra Lines, and Multiple Bus Lines | Metra BNFT Line and Pace Buses |
3. Methodology
3.1. LCA Analysis: An Overview
3.2. Research Scope and Analysis
| Research Phase | Research Scope | Data Sources |
|---|---|---|
| Building EE | Initial EE | Existing literature |
| Building OE | OE of the entire building facility | US DOE prototype building models |
| Transportation EE and OE | Vehicle and supporting infrastructure of automobile, CTA bus, Pace bus, school bus, CTA train, and Metra | US Census, 2011 American Community Survey, Chicago Metropolitan Agency for Planning (CMAP), Illinois Secretary of State, The Transportation LCA Database (tLCAdb) [23] |
3.2.1. Building Operational Energy
| Characteristics | High-Rise | Low-Rise |
|---|---|---|
| Type * | High-rise apartment building | Single-family detached house |
| Location | Chicago, IL | Peoria, IL |
| Number of floors | 10 | N/A |
| Conditioned Building Area (ft2) | 75,992 | 2,401 |
| Energy simulation program | EnergyPlus Version 8.0 | EnergyPlus Version 5.0 |
| Annual OE (MJ/m2) | 1843 (STD 2004) 1802 (STD 2007) 1663 (STD 2010) 1559 (STD 2013) | 1246 (IECC 2006) 1187 (IECC 2009) 998 (IECC 2012) |

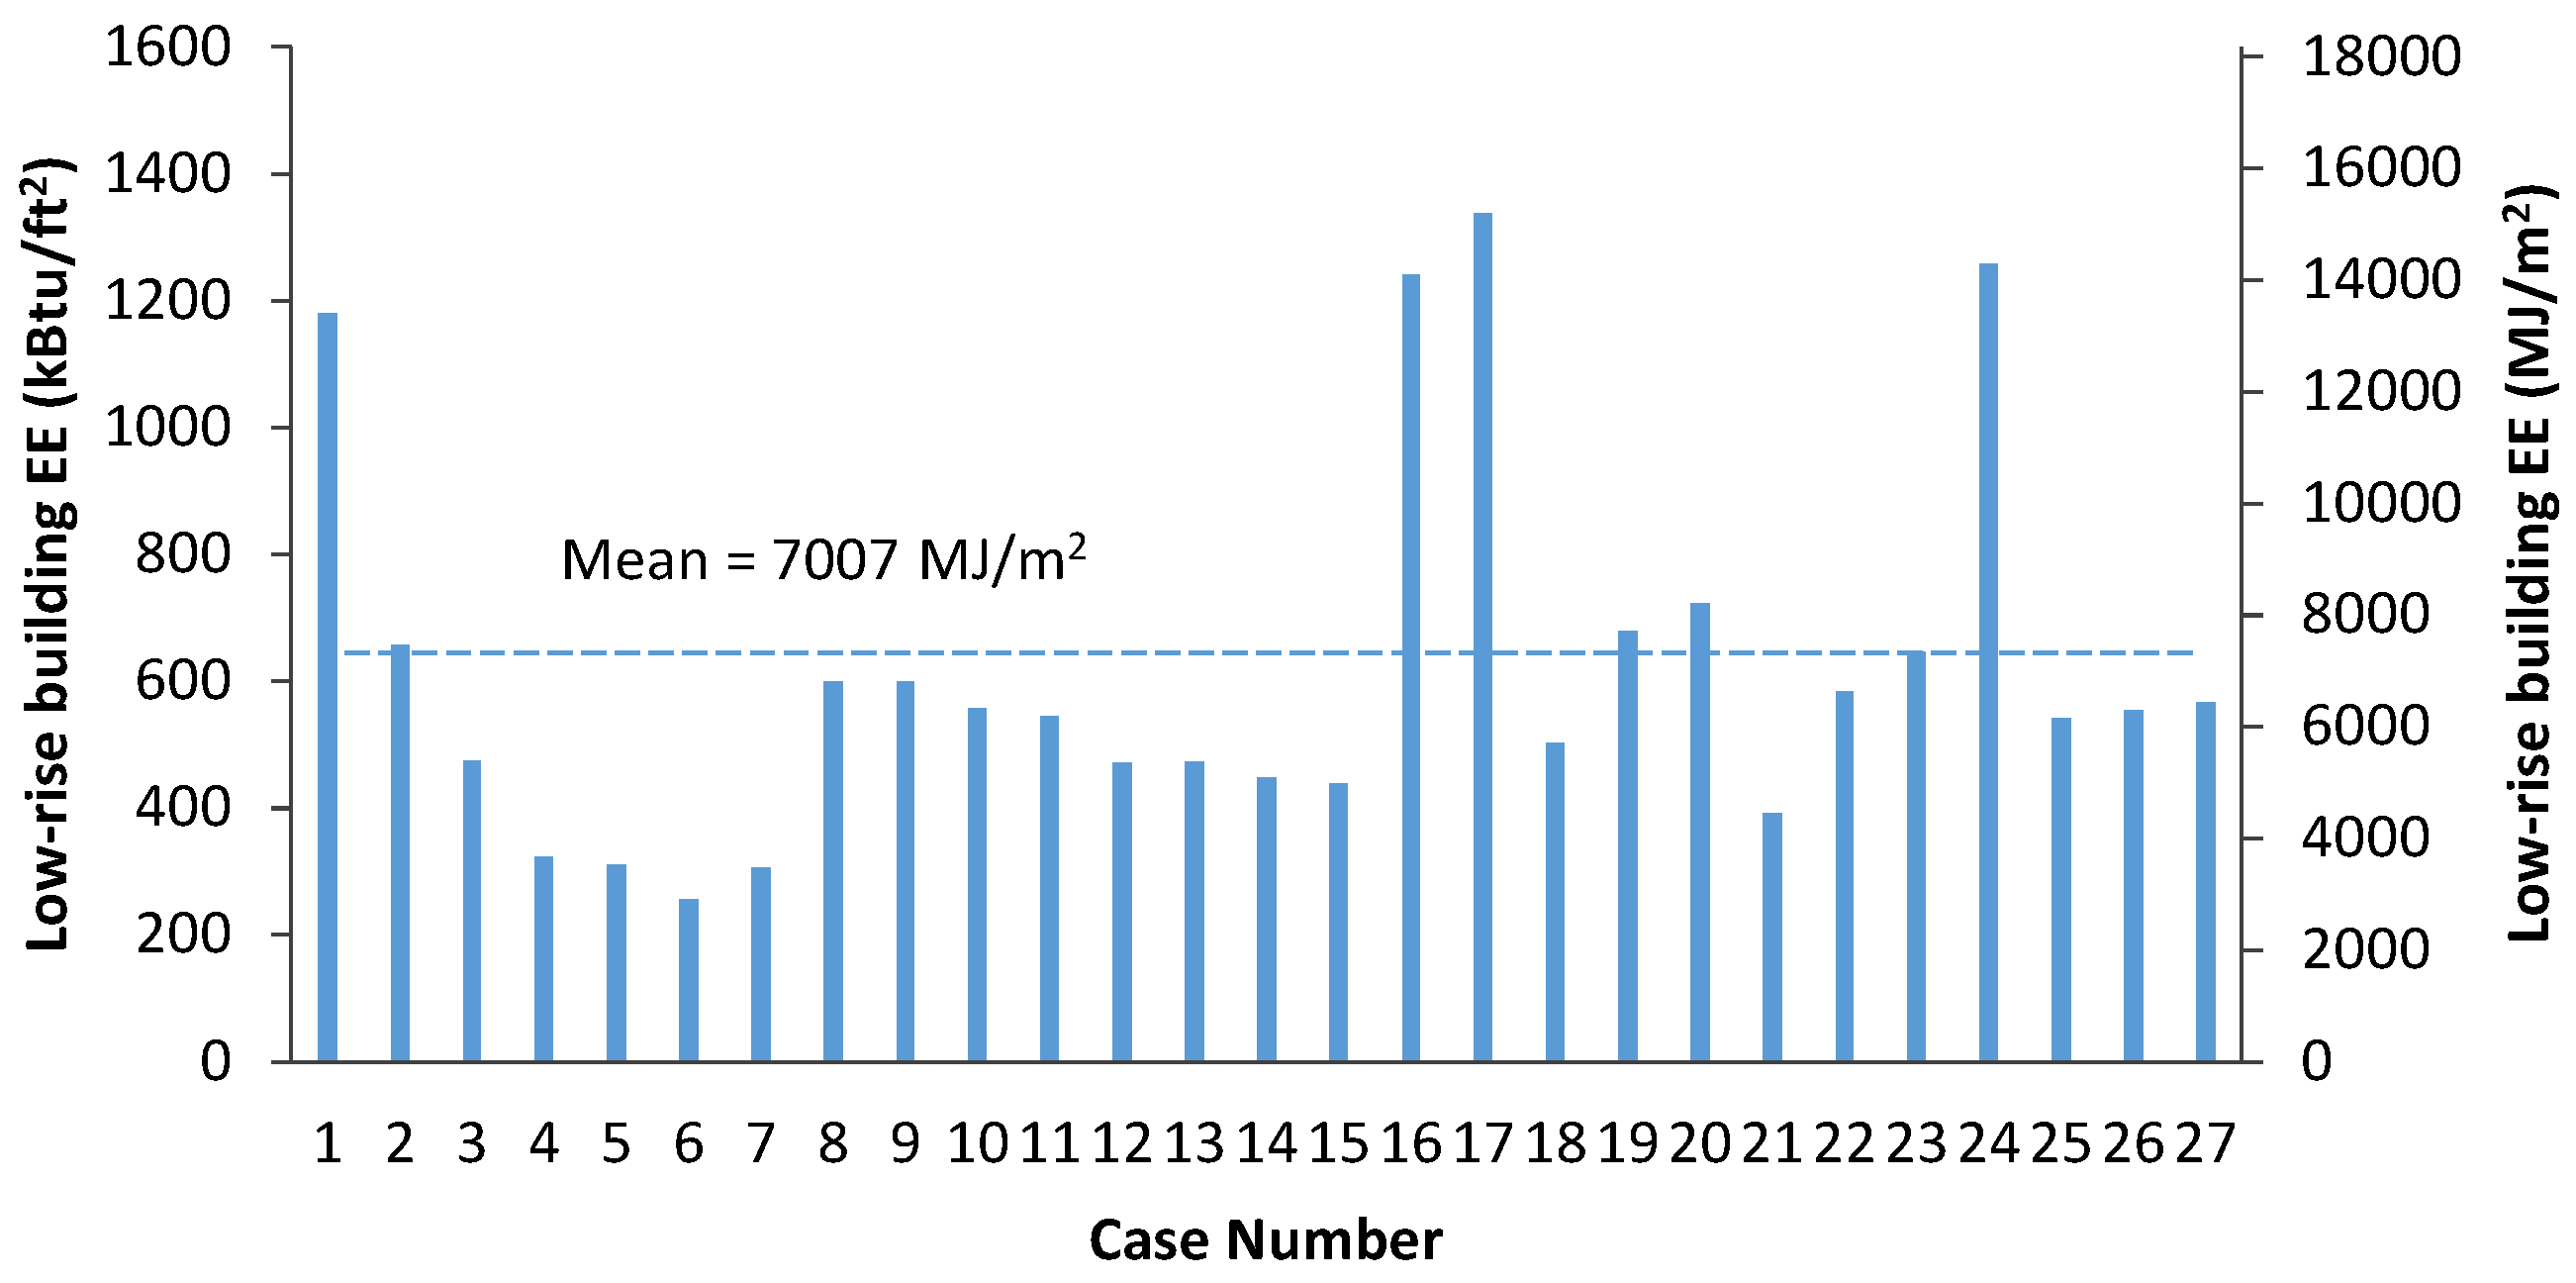
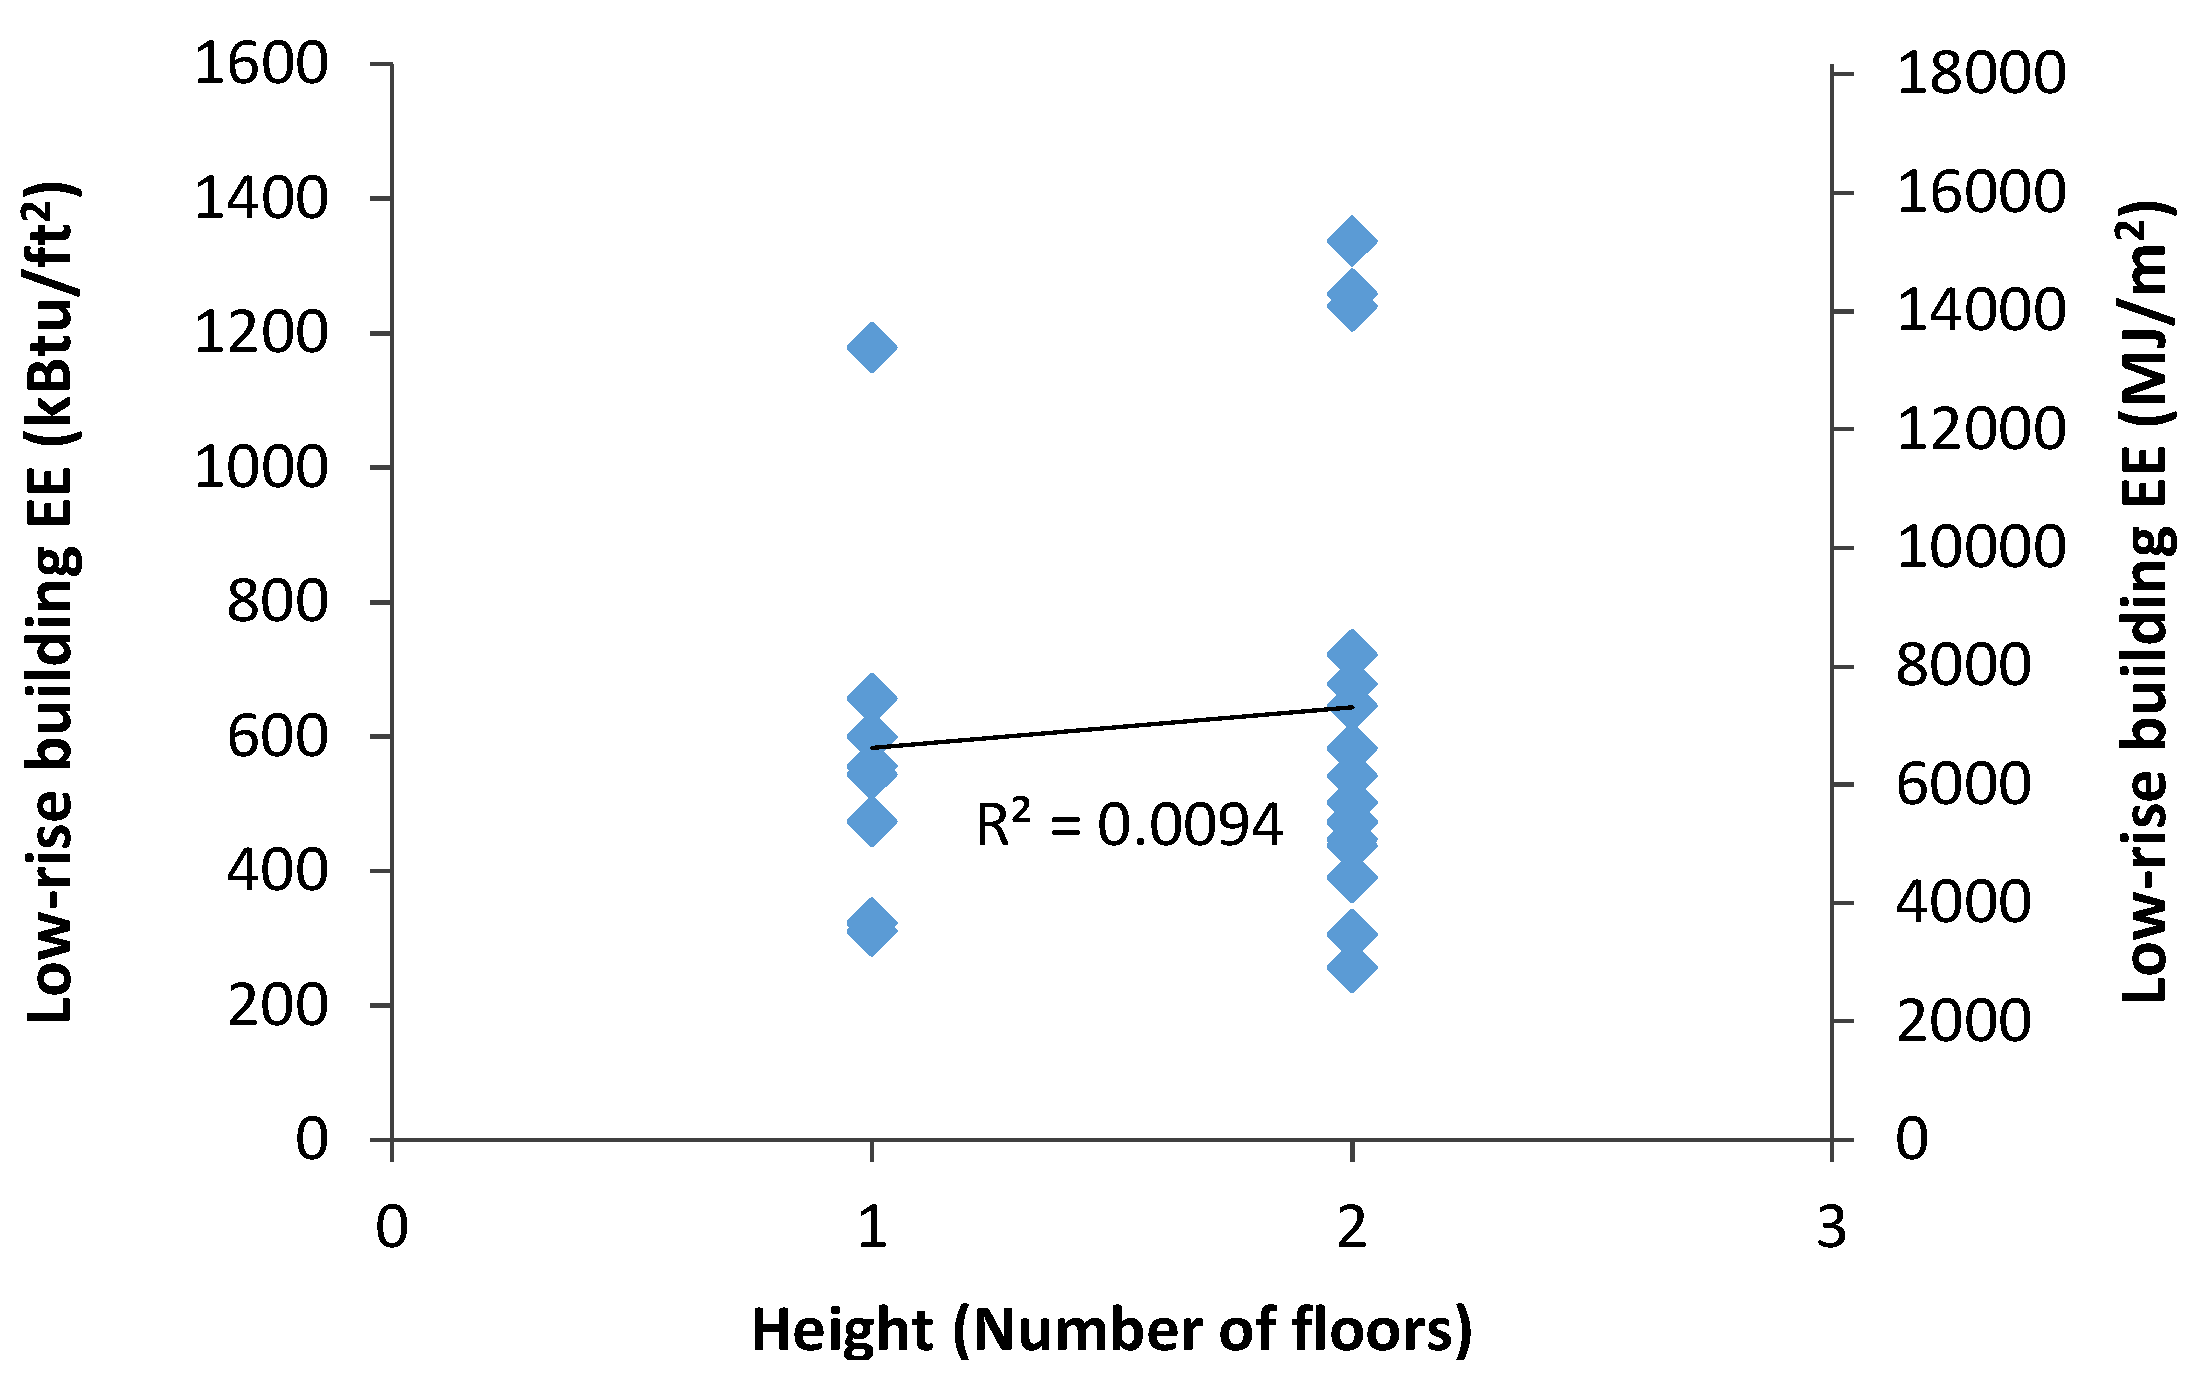
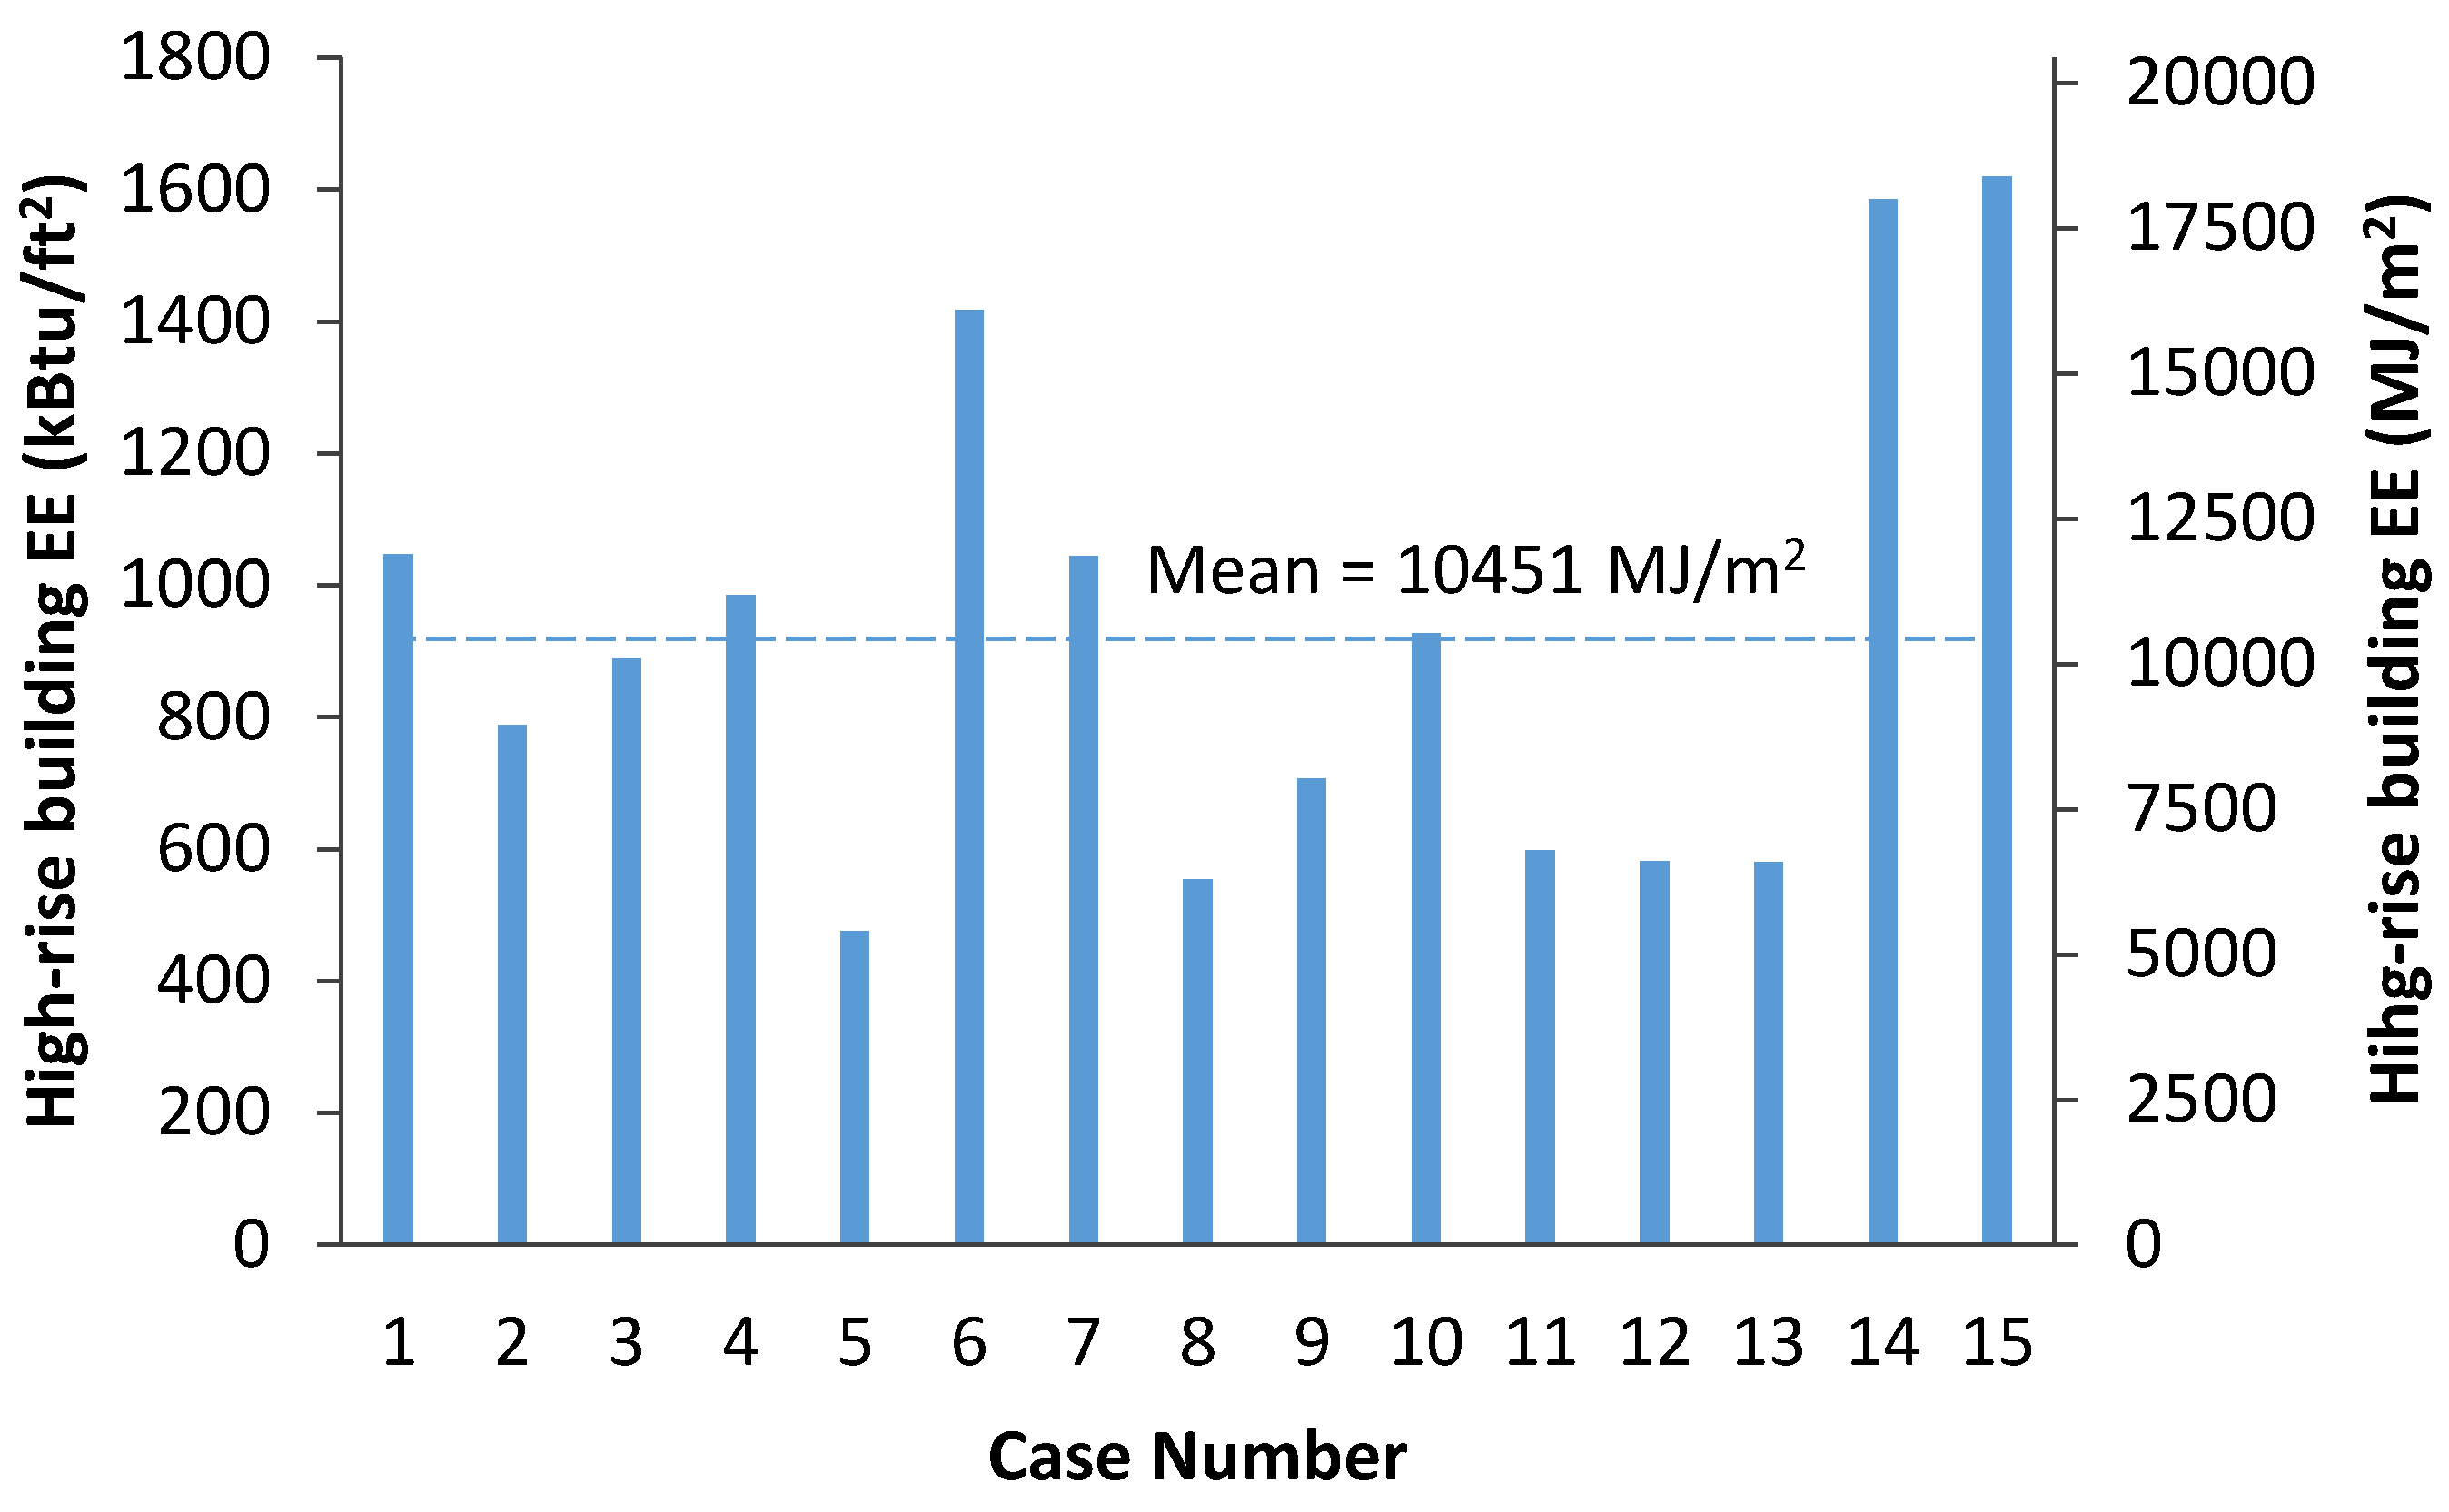
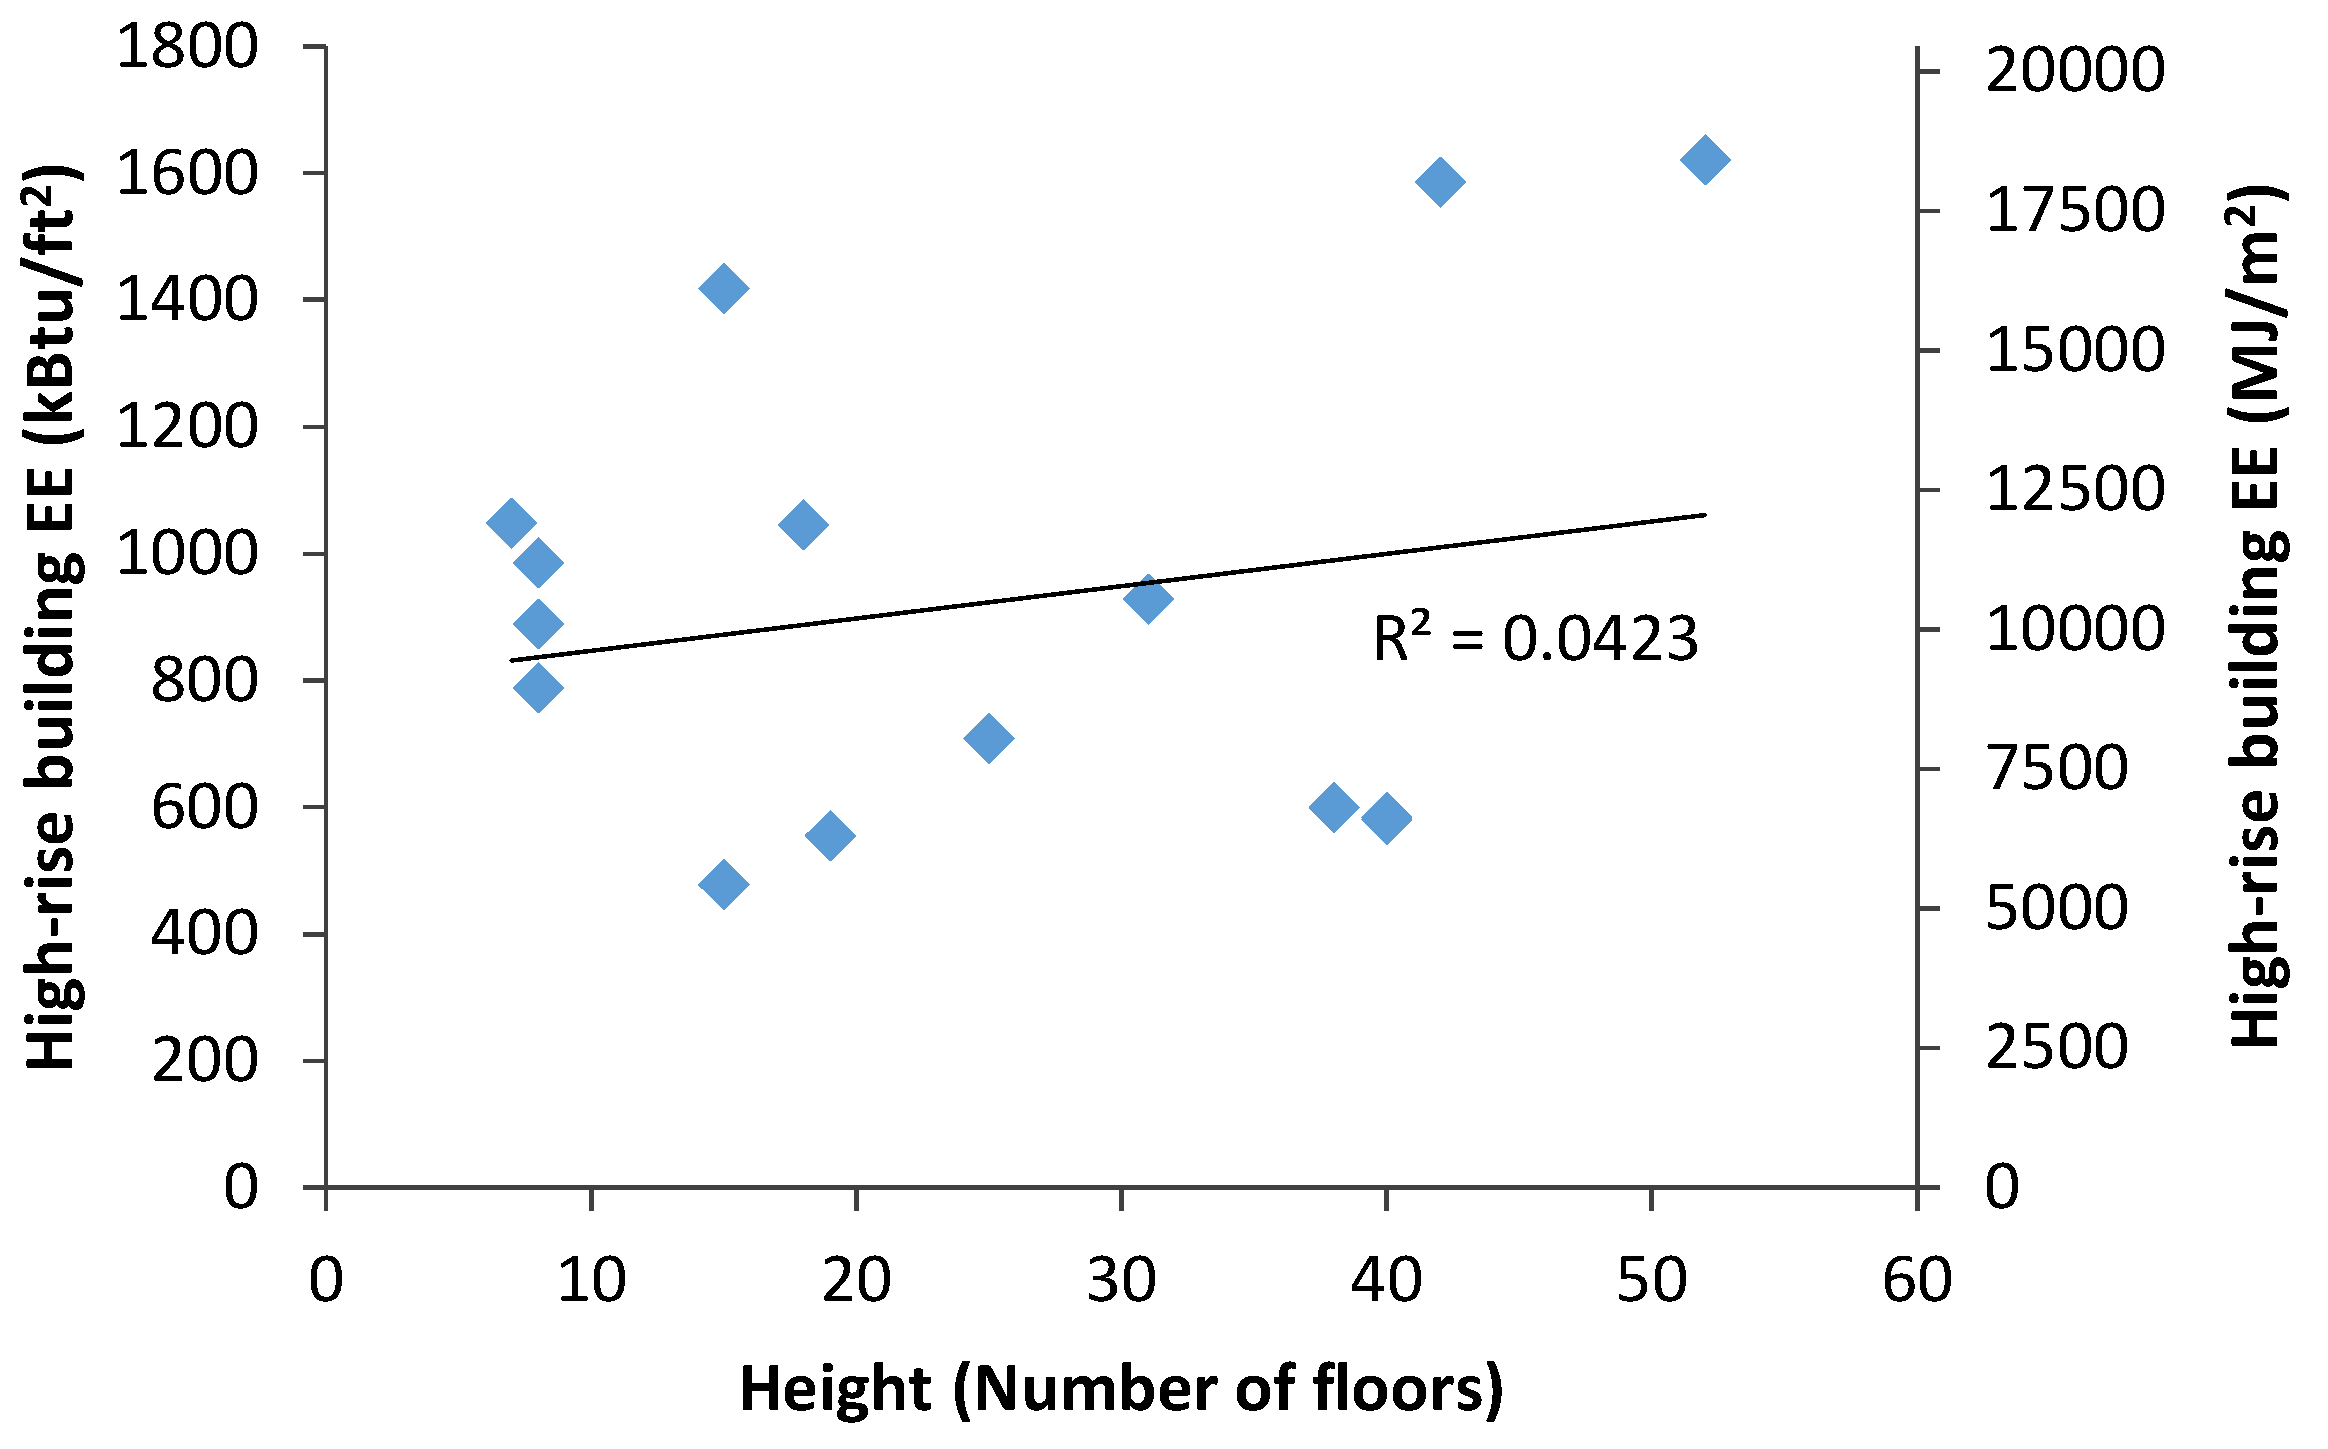
3.2.2. Building Embodied Energy
| Case No. | Type | No. of Floors * | Location | Structure | Method | Source |
|---|---|---|---|---|---|---|
| 1 | Single-detached | 1 | Australia | Wood-frame | I-O-based hybrid | [31] |
| 2 | Single-detached | 1 | Australia | Wood-frame | Process | [32] |
| 3 ** | Single-detached | 1 | ||||
| 4 | Single-detached | 1 | Sweden | Wood-frame | Process | [33] |
| 5 | Single-detached | 1 | Sweden | Wood-frame | ||
| 6 | Single-detached | 2 | Sweden | Wood-frame | ||
| 7 | Single-detached | 2 | Sweden | N/A | I-O | [34] |
| 8 | Single-detached | 1 | USA | N/A | I-O-based hybrid | [35] *** |
| 9 | Single-detached | 1 | USA | N/A | ||
| 10 | Single-detached | 1 | USA | N/A | ||
| 11 | Single-detached | 1 | USA | N/A | ||
| 12 | Single-detached | 2 | USA | N/A | ||
| 13 | Single-detached | 2 | USA | N/A | ||
| 14 | Single-detached | 2 | USA | N/A | ||
| 15 | Single-detached | 2 | USA | N/A | ||
| 16 | Single-detached | 2 | Australia | N/A | I-O-based hybrid | [36] |
| 17 ** | Single-detached | 2 | Australia | N/A | ||
| 18 | Semi-detached | 2 | UK | Wood-frame | Process | [37] |
| 19 | Semi-detached | 2 | UK | Wood-frame | ||
| 20 | Semi-detached | 2 | UK | Masonry cavity wall | ||
| 21 | Single-detached | 2 | Canada | Wood-frame | I-O-based hybrid | [7] |
| 22 | Single-detached | 2 | USA | Wood-frame | Process | [9] |
| 23 ** | Single-detached | 2 | USA | Wood-frame | ||
| 24 | Semi-detached | 2 | Australia | Wood-frame | I-O-based hybrid | [30] |
| 25 | Detached | 2 | Sweden | N/A | Process-based hybrid | [38] |
| 26 | N/A | N/A | N/A | N/A | I-O | [39] **** |
| 27 | Single-detached | N/A | N/A | Wood-frame | I-O | [40] |


| Case No. | Type | No. of Floors * | Location | Structure | Method | Source |
|---|---|---|---|---|---|---|
| 1 | Office | 7 | Australia | Reinforced concrete | I-O-based hybrid | [45] |
| 2 | Office | 15 | Australia | Reinforced concrete | ||
| 3 | Office | 42 | Australia | Reinforced concrete | ||
| 4 | Office | 52 | Australia | Reinforced concrete | ||
| 5 | Office | 7–9 | Japan | N/A | I-O | [46] ** |
| 6 | Office | 8 | Japan | Steel reinforced concrete + Steel | I-O | [47] |
| 7 | Office | 8 | Japan | Steel reinforced concrete | ||
| 8 | Office | 18 | Japan | Steel | ||
| 9 | Office | 25 | Japan | Steel | ||
| 10 | Office | 31 | Japan | Steel | ||
| 11 | Residential | 15 | Canada | N/A | I-O | [7] |
| 12 | Education | 19 | China | N/A | Process-based hybrid | [48] |
| 13 | Office | 38 | Thailand | Concrete | I-O-based hybrid | [49] |
| 14 | Residential | 40 | Hong Kong | N/A | Process-based hybrid | [50] |
| 15 | Residential | 40 | Hong Kong |

3.2.3. Transportation Embodied and Operational Energy
| Study Area | Automobile | CTA/Pace Bus | School Bus | CTA Train | Metra |
|---|---|---|---|---|---|
| Chicago Loop | 4004 | 764.8 | 24.1 | 572.6 | 144.2 |
| Aurora | 6297 | 7.3 | 103.2 | 0.0 | 574.9 |
| LCA Component | Automobile | CTA/Pace/School Bus | CTA Train/Metra |
|---|---|---|---|
| Vehicle | |||
| Manufacturing | Manufacturing | Manufacturing | Manufacturing |
| Maintenance | Typical Maintenance Tire Replacement | Typical Maintenance Tire Replacement | Routine Maintenance Flooring Replacement |
| Operation | Propulsion | Propulsion Idling | Propulsion Idling HVAC |
| Infrastructure | |||
| Construction | Roadway Parking | Roadway | Station Station Parking Track |
| Maintenance | Parking | Roadway | Station Station Parking Track |
| Operation | Roadway Lighting | Roadway Lighting | Station Lighting Station Parking Lighting Station Escalators Station Train Control Station miscellaneous |
| LCA Energy Component | Automobile | Bus | CTA Train | Metra | ||||
|---|---|---|---|---|---|---|---|---|
| Value | Percent | Value | Percent | Value | Percent | Value | Percent | |
| Vehicle EE | 0.55 | 13.1% | 0.45 | 12.0% | 0.07 | 3.7% | 0.17 | 8.9% |
| Vehicle OE | 3.00 | 71.3% | 3.10 | 82.8% | 1.13 | 60.1% | 1.07 | 55.7% |
| Infrastructure EE | 0.62 | 14.7% | 0.19 | 5.1% | 0.62 | 33.0% | 0.42 | 21.9% |
| Infrastructure OE | 0.04 | 1.0% | 0.002 | 0.1% | 0.06 | 3.2% | 0.26 | 13.5% |
| Total life-cycle energy (MJ/PMT) | 4.21 | 100% | 3.74 | 100% | 1.88 | 100% | 1.92 | 100% |
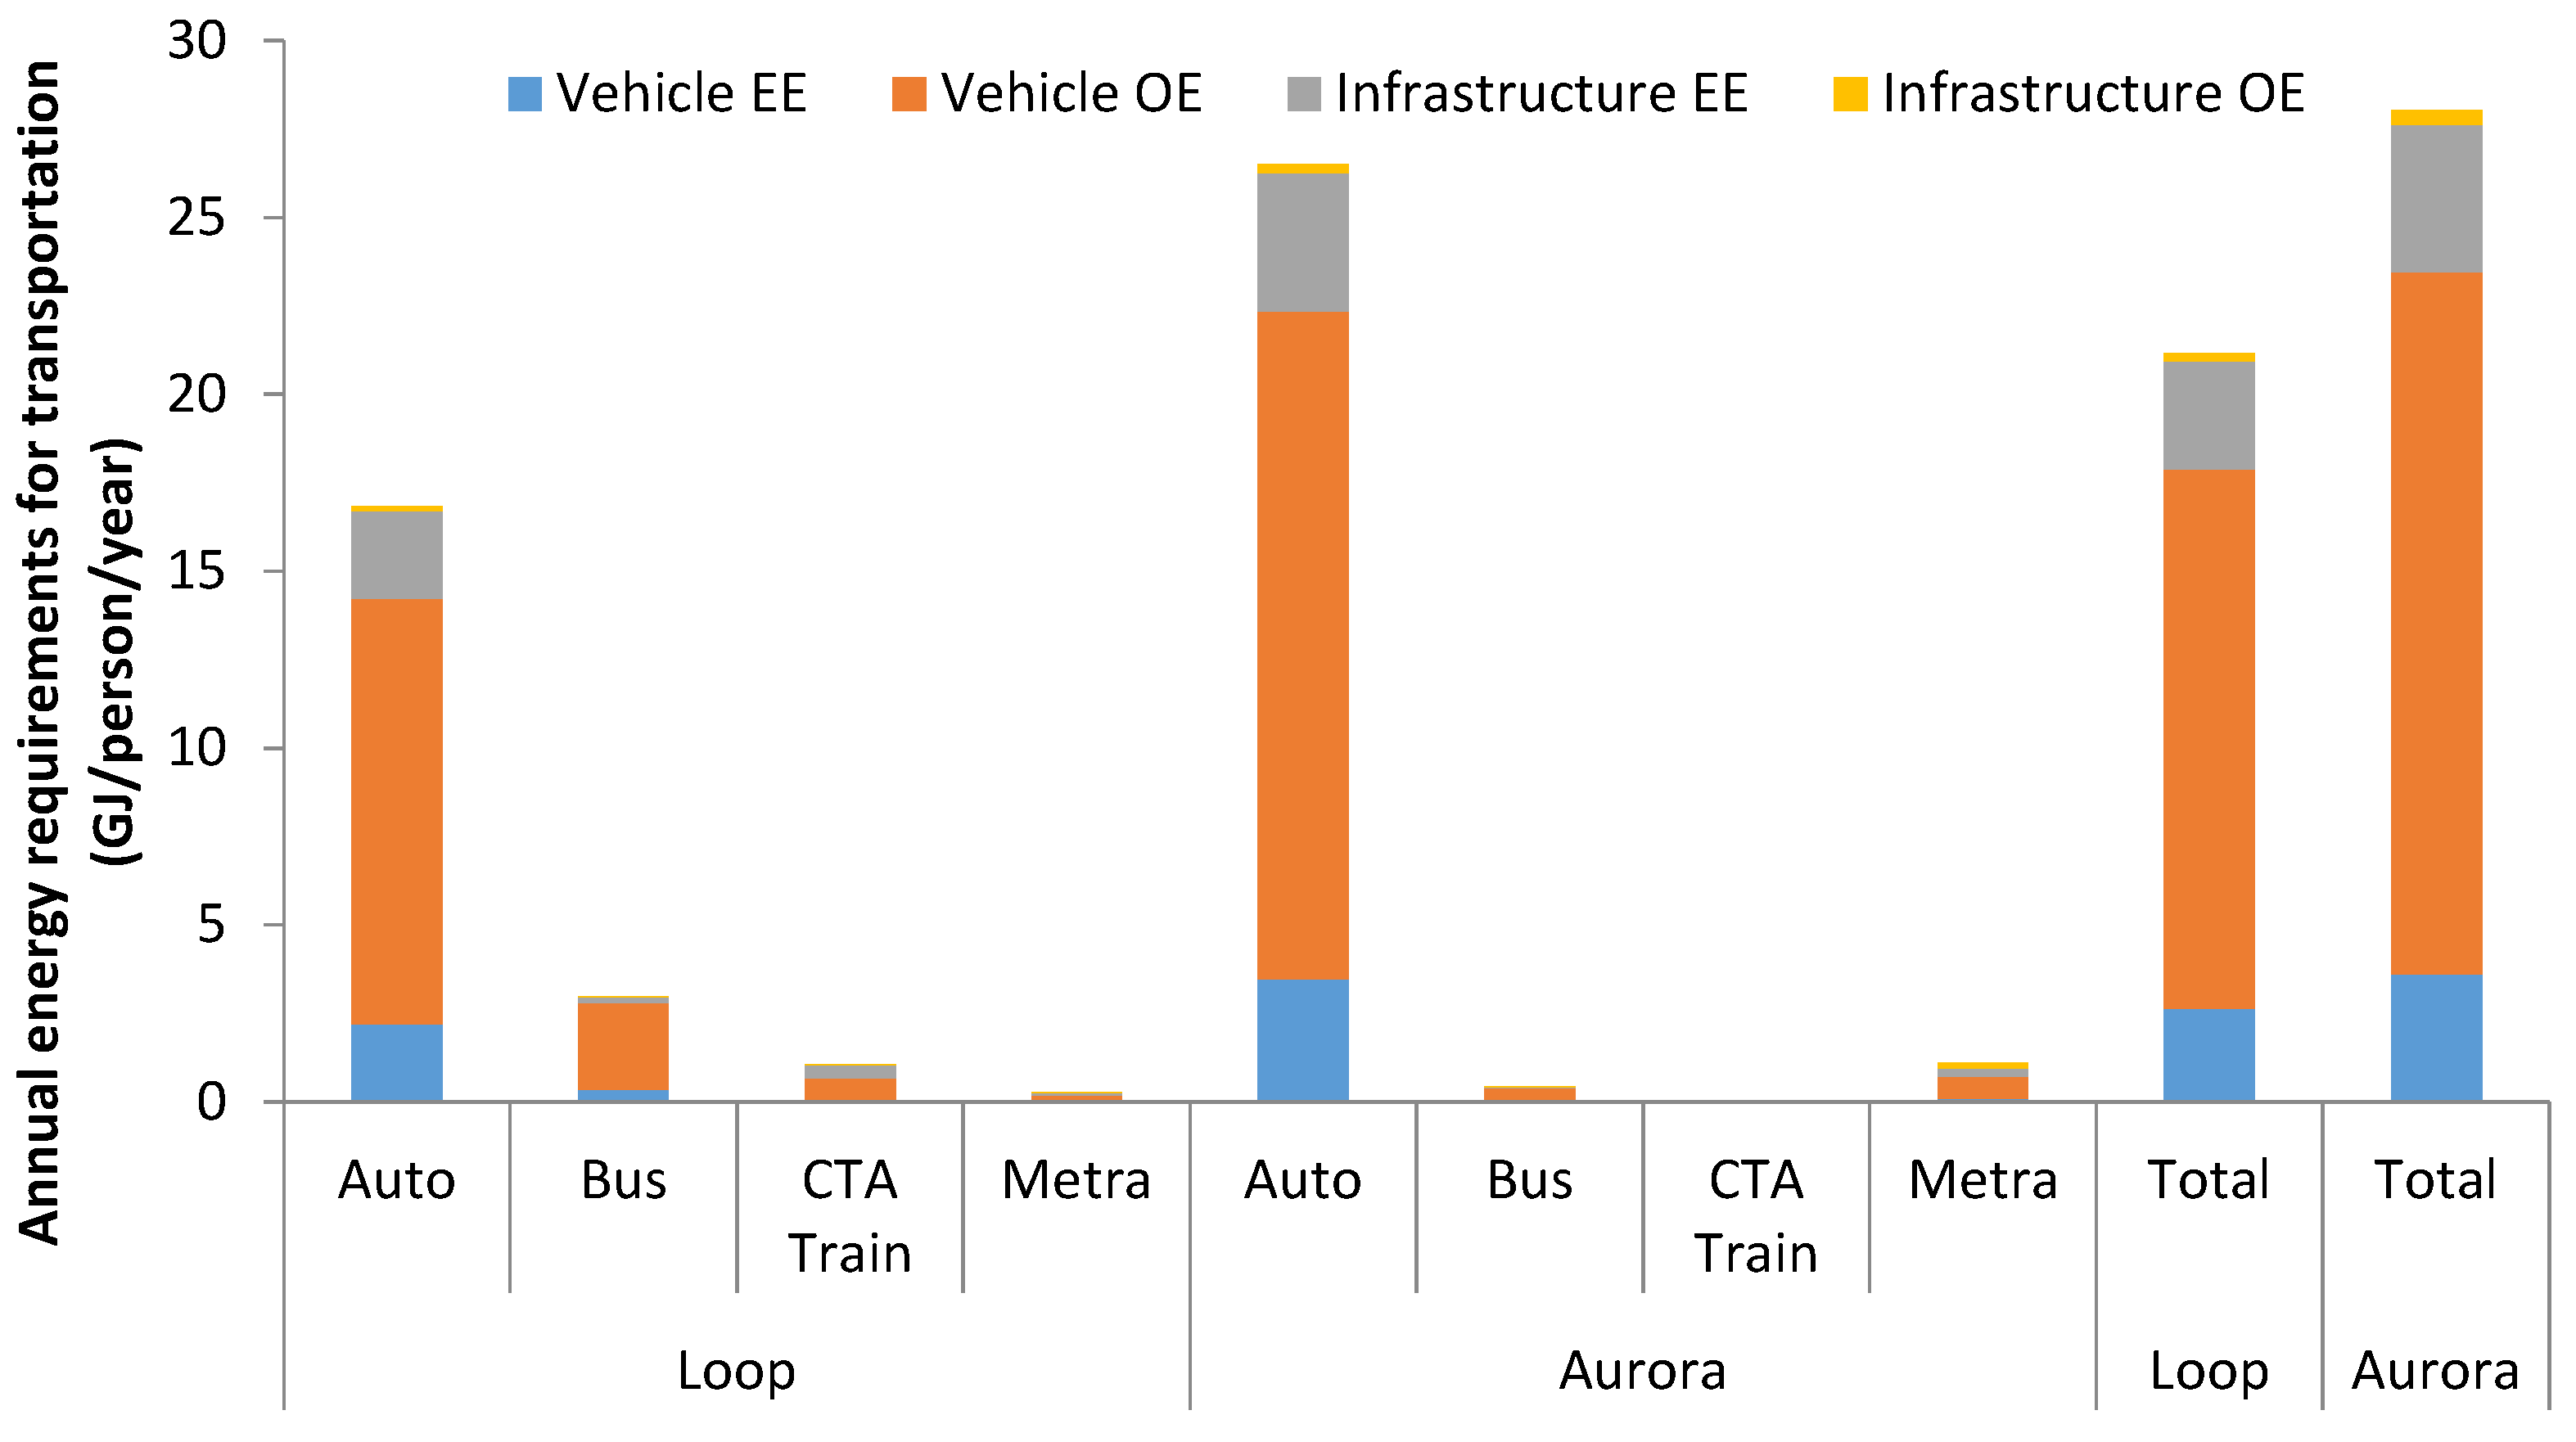
| LCA Energy Component | Loop | Aurora | ||||||||
|---|---|---|---|---|---|---|---|---|---|---|
| Auto | Bus | CTA Train | Metra | Total | Auto | Bus | CTA Train | Metra | Total | |
| Vehicle EE | 2.20 | 0.36 | 0.04 | 0.02 | 2.62 | 3.46 | 0.05 | 0 | 0.10 | 3.61 |
| Vehicle OE | 12.01 | 2.45 | 0.65 | 0.15 | 15.26 | 18.89 | 0.34 | 0 | 0.62 | 19.85 |
| Infrastructure EE | 2.48 | 0.15 | 0.36 | 0.06 | 3.05 | 3.90 | 0.02 | 0 | 0.24 | 4.16 |
| Infrastructure OE | 0.16 | 0.002 | 0.03 | 0.04 | 0.23 | 0.25 | 0 | 0 | 0.15 | 0.40 |
| Total life-cycle energy (GJ/person/year) | 16.86 | 2.95 | 1.08 | 0.27 | 21.16 | 26.51 | 0.41 | 0 | 1.10 | 28.02 |
3.3. Overall Life-Cycle Energy Comparison of Downtown High-Rise vs. Suburban Low-Rise Living
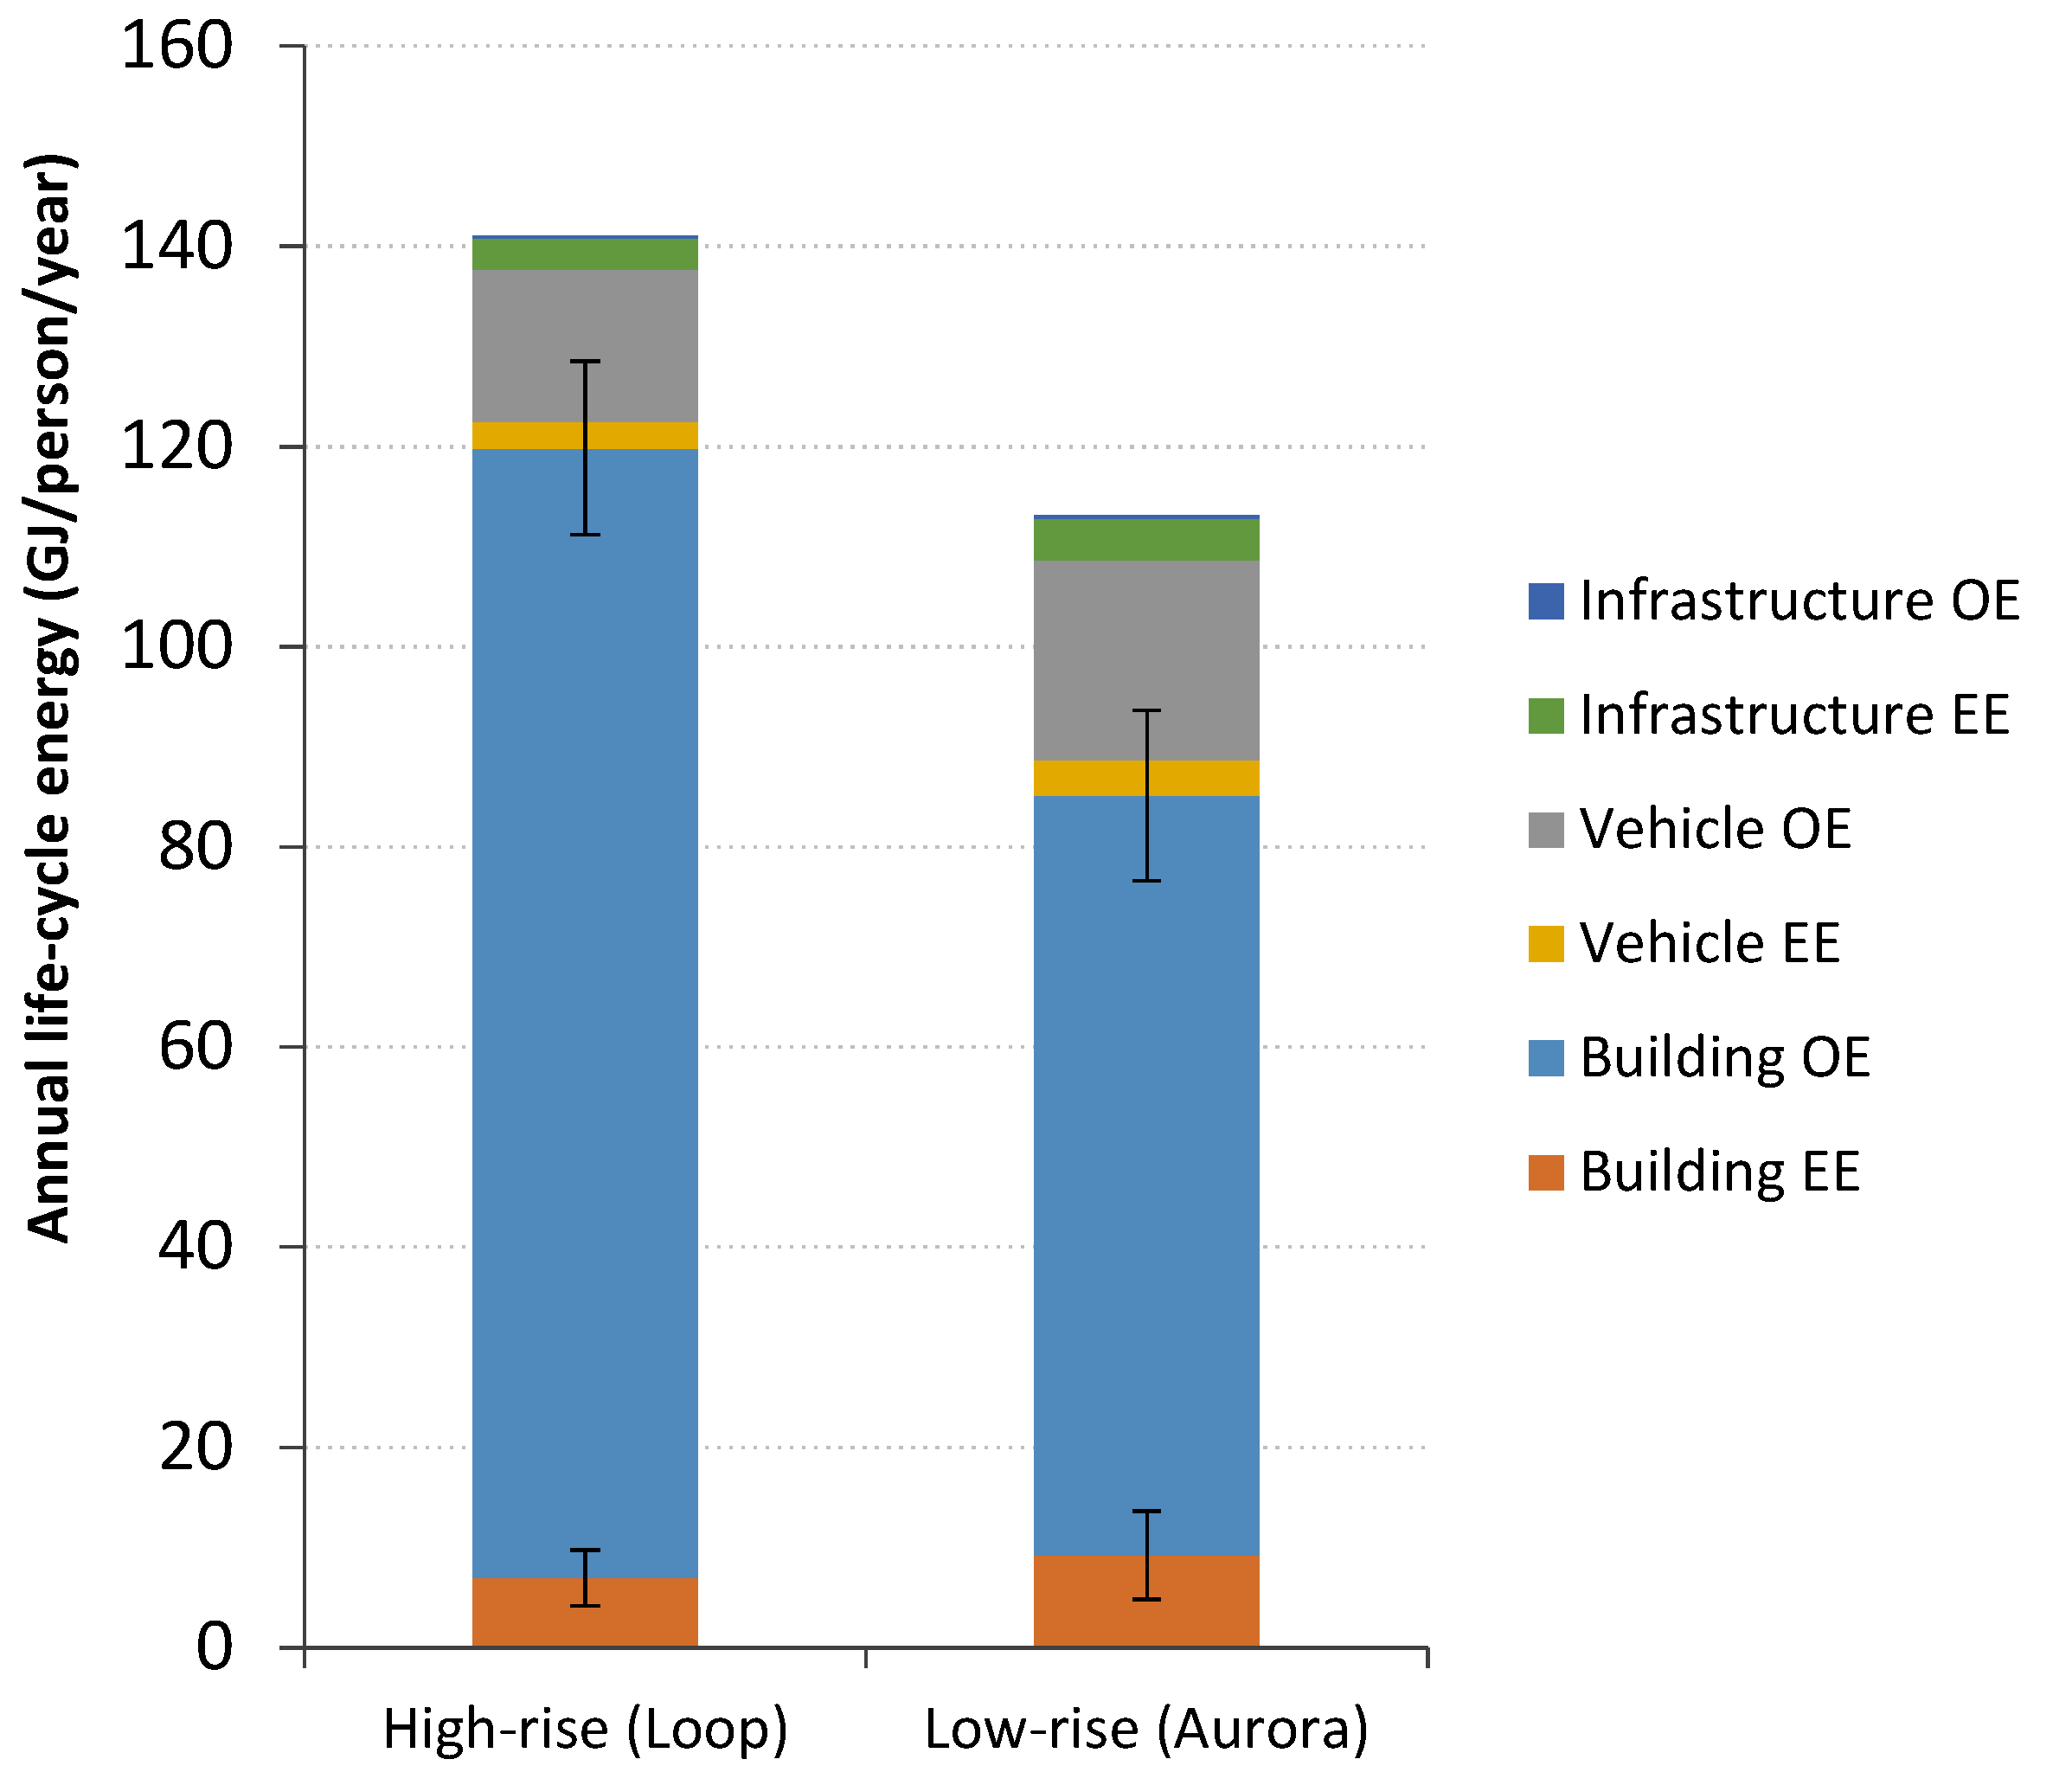
| LCA Energy Component | High-Rises in Loop (Downtown) | Low-Rises in Aurora (Suburb) | ||
|---|---|---|---|---|
| Value | Percent | Value | Percent | |
| Building EE | 6.9 | 4.9% | 9.3 | 8.2% |
| Building OE | 112.9 | 80.1% | 75.9 | 67.1% |
| Vehicle EE | 2.6 | 1.9% | 3.6 | 3.2% |
| Vehicle OE | 15.3 | 10.8% | 19.8 | 17.5% |
| Infrastructure EE | 3 | 2.2% | 4.2 | 3.7% |
| Infrastructure OE | 0.2 | 0.2% | 0.4 | 0.4% |
| Total life-cycle energy (GJ/person/year) | 141.0 | 100% | 113.1 | 100% |
4. Discussion and Conclusions
4.1. Building Embodied Energy
4.2. Building Operational Energy
4.3. Transportation Embodied and Operational Energy
Acknowledgments
Author Contributions
Conflicts of Interest
References
- Gomez-Ibanez, D.J.; Boarnet, M.G.; Brake, D.R. Driving and the Built Environment: The Effects of Compact Development on Motorized Travel, Energy Use, and CO2 Emissions; Oak Ridge National Laboratory: Oak Ridge, TN, USA, 2009. [Google Scholar]
- University of Illinois at Chicago. Metropolitan Decentralization in Chicago; University of Illinois at Chicago: Chicago, IL, USA, 2001. [Google Scholar]
- Giuliano, G.; Agarwal, A.; Redfearn, C. Metropolitan Spatial Trends in Employment and Housing Literature Review; University of Southern California: Los Angeles, CA, USA, 2008. [Google Scholar]
- Newman, P.W.G.; Kenworthy, J.R. Gasoline consumption and cities. J. Am. Plann. Assoc. 1989, 55, 24–37. [Google Scholar] [CrossRef]
- Ewing, R.; Rong, F. The impact of urban form on U.S. residential energy use. Hous. Policy Debate 2008, 19, 1–30. [Google Scholar] [CrossRef]
- Nichols, B.G.; Kockelman, K. Urban Form and Life-Cycle Energy Consumption: Case Studies at the City Scale. In Proceedings of Transportation Research Board 94th Annual Meeting, Washington, DC, USA, 11–15 January 2015.
- Norman, J.; MacLean, H.L.; Kennedy, C.A. Comparing high and low residential density: Life-cycle analysis of energy use and greenhouse gas emissions. J. Urban Plan. Dev. 2006, 132, 10–21. [Google Scholar] [CrossRef]
- Cole, R.J. Energy and greenhouse gas emissions associated with the construction of alternative structural systems. Build. Environ. 1998, 34, 335–348. [Google Scholar] [CrossRef]
- Keoleian, G.A.; Blanchard, S.; Reppe, P. Life-cycle energy, costs, and strategies for improving a single-family house. J. Ind. Ecol. 2000, 4, 135–156. [Google Scholar] [CrossRef]
- Ochoa, L.; Hendrickson, C.; Matthews, H.S. Economic input-output life-cycle assessment of U.S. residential buildings. J. Infrastruct. Syst. 2002, 8, 132–138. [Google Scholar] [CrossRef]
- Ramesh, T.; Prakash, R.; Shukla, K.K. Life cycle energy analysis of buildings: An overview. Energy Build. 2010, 42, 1592–1600. [Google Scholar] [CrossRef]
- Optis, M.; Wild, P. Inadequate documentation in published life cycle energy reports on buildings. Int. J. Life Cycle Assess. 2010, 15, 644–651. [Google Scholar] [CrossRef]
- Lang, R. Residential Density and Energy Conservation; York University: Toronto, Canada, 1986. [Google Scholar]
- Heinonen, J.; Junnila, S. A carbon consumption comparison of rural and urban lifestyles. Sustainability 2011, 3, 1234–1249. [Google Scholar] [CrossRef]
- Heinonen, J.; Junnila, S. Implications of urban structure on carbon consumption in metropolitan areas. Environ. Res. Lett. 2011, 6. [Google Scholar] [CrossRef]
- Heinonen, J.; Kyrö, R.; Junnila, S. Dense downtown living more carbon intense due to higher consumption: A case study of Helsinki. Environ. Res. Lett. 2011, 6. [Google Scholar] [CrossRef]
- Wilson, J.; Spinney, J.; Millward, H.; Scott, D.; Hayden, A.; Tyedmers, P. Blame the exurbs, not the suburbs: Exploring the distribution of greenhouse gas emissions within a city region. Energy Policy 2013, 62, 1329–1335. [Google Scholar] [CrossRef]
- Community Data Snapshots. Available online: http://www.cmap.illinois.gov/data/metropulse/community-snapshots (accessed on 10 August 2015).
- Median and Average Square Feet of Floor Area in New Single-Family Houses Completed by Location. Available online: https://www.census.gov/construction/chars/pdf/medavgsqft.pdf (accessed on 10 August 2015).
- Median and Average Square Feet of Floor Area in Units in New Multifamily Buildings Completed. Available online: http://www.census.gov/const/C25Ann/mfu_medavgsqft.pdf (accessed on 10 August 2015).
- American National Standards Institute. Environmental Management—Life Cycle Assessment—Principles and Framework; ANSI/ISO 14040; American National Standards Institute: Washington, DC, USA, 1997. [Google Scholar]
- Baird, G.; Aun, C.S. Energy Cost of Houses and Light Construction Buildings; New Zealand Energy Research and Development Committee: Auckland, New Zealand, 1983. [Google Scholar]
- Transportation Life-Cycle-Assessment. Available online: http://www.transportationlca.org/index.php (accessed on 23 June 2015).
- Building Energy Codes Program: Residential Prototype Building Models. Available online: https://www.energycodes.gov/development/residential/iecc_models (accessed on 5 July 2015).
- Prototype Building Models High-Rise Apartment. Available online: https://www.energycodes.gov/901-prototype-building-models-high-rise-apartment (accessed on 5 July 2015).
- Characteristics of New Housing. Available online: https://www.census.gov/construction/chars/completed.html (accessed on 23 June 2015).
- Building Performance Database. Available online: https://bpd.lbl.gov/ (accessed on 3 July2015).
- Bullard, C.W.; Penner, P.S.; Pilati, D.A. Net energy analysis: Handbook for combining process and input-output analysis. Resour. Energy 1978, 1, 267–313. [Google Scholar] [CrossRef]
- Graham, J.; Owen, T.C.; Fay, R. Environmental assessment of rammed earth construction systems. Struct. Surv. 2001, 19, 99–106. [Google Scholar]
- Treloar, G.J.; Love, P.E.D.; Holt, G.D. Using national input/output data for embodied energy analysis of individual residential buildings. Constr. Manag. Econ. 2001, 19, 49–61. [Google Scholar] [CrossRef]
- Crawford, R. An As-Occupied Life Cycle Energy Assessment of a Residential Building. In Proceedings of 46th Annual Conference of the Architectural Science Association, Gold Coast, Australia, 14–16 November 2012.
- Myer, F.; Fuller, R.; Crawford, R.H. The Potential to Reduce the Embodied Energy in Construction through the Use of Renewable Materials. In Proceedings of 46th Annual Conference of the Architectural Science Association, Gold Coast, Australia, 14–16 November 2012.
- Adalberth, K. Energy use during the life cycle of single-unit dwellings: Examples. Build. Environ. 1997, 32, 321–329. [Google Scholar] [CrossRef]
- Gustavsson, L.; Joelsson, A. Life cycle primary energy analysis of residential buildings. Energy Build. 2010, 42, 210–220. [Google Scholar] [CrossRef]
- Frijia, S. Energy Use and Greenhouse Gas Emissions in Residential Neighborhoods in the Southwest: A Built Environment Life-Cycle Assessment. Master’s Thesis, Arizona State University, Phoenix, AZ, USA, August 2011. [Google Scholar]
- Fay, R.; Treloar, G.; Iyer-Raniga, U. Life-cycle energy analysis of buildings: A case study. Build. Res. Inf. 2000, 28, 31–41. [Google Scholar] [CrossRef]
- Monahan, J.; Powell, J.C. An embodied carbon and energy analysis of modern methods of construction in housing: A case study using a lifecycle assessment framework. Energy Build. 2011, 43, 179–188. [Google Scholar] [CrossRef]
- Thormark, C. A low energy building in a life cycle—Its embodied energy, energy need for operation and recycling potential. Build. Environ. 2002, 37, 429–435. [Google Scholar] [CrossRef]
- Pullen, S.F. Energy used in the construction and operation of houses. Archit. Sci. Rev. 2000, 43, 87–94. [Google Scholar] [CrossRef]
- Analysis of the Life Cycle Impacts and Potential for Avoided Impacts Associated with Single-Family Homes. Available online: http://www.epa.gov/wastes/conserve/imr/cdm/pdfs/sfhomes.pdf (accessed on 10 August 2015).
- Oldfield, P. Embodied Carbon and High-Rise. In Proceedings of CTBUH 9th World Congress, Shanghai, China, 19–21 September 2012.
- CTBUH Height Criteria. Available online: http://www.ctbuh.org/HighRiseInfo/TallestDatabase/Criteria/tabid/446/language/en-GB/Default.aspx (accessed on 10 August 2015).
- Simmonds, P. ASHRAE Design Guide for Tall, Supertall, and Megatall Building Systems; American Society of Heating, Refrigerating, and Air-Conditioning Engineers: Atlanta, GA, USA, 2015. [Google Scholar]
- High-Rise Building Fires. Available online: http://www.nfpa.org/research/reports-and-statistics/fires-by-property-type/high-rise-building-fires (accessed on 10 August 2015).
- Treloar, G.J.; Fay, R.; Ilozor, B.; Love, P.E.D. An analysis of the embodied energy of office buildings by height. Facilities 2001, 19, 204–214. [Google Scholar] [CrossRef]
- Suzuki, M.; Oka, T. Estimation of life cycle energy consumption and CO2 emission of office buildings in Japan. Energy Build. 1998, 28, 33–41. [Google Scholar] [CrossRef]
- Oka, T.; Suzuki, M.; Konnya, T. The estimation of energy consumption and amount of pollutants due to the construction of buildings. Energy Build. 1993, 19, 303–311. [Google Scholar] [CrossRef]
- Chang, Y.; Ries, R.J.; Lei, S. The embodied energy and emissions of a high-rise education building: A quantification using process-based hybrid life cycle inventory model. Energy Build. 2012, 55, 790–798. [Google Scholar] [CrossRef]
- Kofoworola, O.F.; Gheewala, S.H. Life cycle energy assessment of a typical office building in Thailand. Energy Build. 2009, 41, 1076–1083. [Google Scholar] [CrossRef]
- Chen, T.Y.; Burnett, J.; Chau, C.K. Analysis of embodied energy use in the residential building of Hong Kong. Energy 2001, 26, 323–340. [Google Scholar] [CrossRef]
- The Chicago Metropolitan Agency for Planning. Chicago Regional Household Travel Inventory: Mode Choice and Trip Purpose for the 2008 and 1990 Surveys; The Chicago Metropolitan Agency for Planning: Chicago, IL, USA, 2010. [Google Scholar]
- Du, P.; Wood, A.; Stephens, B. Cycle Assessment of Urban vs. Suburban Residential Mobility in Chicago. In Proceedings of the ARCC 2015 Conference, Chicago, IL, USA, 6–9 April 2015.
- Chester, M.V. Life-Cycle Environmental Inventory of Passenger Transportation in the United States; University of California: Berkeley, CA, USA, 2008. [Google Scholar]
- A Life Cycle Approach to Prioritizing Methods of Preventing Waste from the Residential Construction Sector in the State of Oregon. Available online: http://www.deq.state.or.us/lq/pubs/docs/sw/ResidentialBldgLCA.pdf (accessed on 10th August 2015).
- Perkins, A.; Hamnett, S.; Pullen, S.; Zito, R.; Trebilcock, D. Transport, housing and urban form: The life cycle energy consumption and emissions of city centre apartments compared with suburban dwellings. Urban Policy Res. 2009, 27, 377–396. [Google Scholar]
© 2015 by the authors; licensee MDPI, Basel, Switzerland. This article is an open access article distributed under the terms and conditions of the Creative Commons Attribution license (http://creativecommons.org/licenses/by/4.0/).
Share and Cite
Du, P.; Wood, A.; Stephens, B.; Song, X. Life-Cycle Energy Implications of Downtown High-Rise vs. Suburban Low-Rise Living: An Overview and Quantitative Case Study for Chicago. Buildings 2015, 5, 1003-1024. https://doi.org/10.3390/buildings5031003
Du P, Wood A, Stephens B, Song X. Life-Cycle Energy Implications of Downtown High-Rise vs. Suburban Low-Rise Living: An Overview and Quantitative Case Study for Chicago. Buildings. 2015; 5(3):1003-1024. https://doi.org/10.3390/buildings5031003
Chicago/Turabian StyleDu, Peng, Antony Wood, Brent Stephens, and Xiaoyu Song. 2015. "Life-Cycle Energy Implications of Downtown High-Rise vs. Suburban Low-Rise Living: An Overview and Quantitative Case Study for Chicago" Buildings 5, no. 3: 1003-1024. https://doi.org/10.3390/buildings5031003