Article

Climate Change Mitigation through Energy Benchmarking in the GCC Green Buildings Codes

Gulf Organisation for Research and Development (GORD), Qatar Science and Technology Park (QSTP), P.O. Box 210162, Doha, Qatar
*
Author to whom correspondence should be addressed.
Buildings 2015, 5(2), 700-714; https://doi.org/10.3390/buildings5020700
Submission received: 7 April 2015 / Accepted: 26 May 2015 / Published: 5 June 2015
(This article belongs to the Special Issue Buildings, Design and Climate Change)

Abstract

:
It is well known that the Gulf Cooperation Council (GCC) of countries resides at or close to the top of the global table of CO2 emissions per capita and its economy relies heavily on its fossil fuels. This provides a context for green building programs that initially aim to create an understanding of emission pathways within the GCC and hence develop approaches to their reduction in the built environment. A set of criteria will allow specific analysis to be undertaken linked to the spatial dimensions of the sector under study. In this paper, approaches to modelling energy consumption and CO2 emissions are presented. As investment in the built environment continues, natural resources dwindle and the cost of energy increases, delivering low-energy buildings will become mandatory. In this study, a hybrid modelling approach (bottom-top & top-bottom) is presented. Energy benchmarks are developed for different buildings’ uses and compared with international standards. The main goals are to establish design benchmarks and develop a modelling tool that contains specific information for all buildings types (existing and new), as well as planned and projected growths within the various city districts, then integrate this database within a geospatial information system that will allow us to answer a range of “what-if”-type questions about various intervention strategies, emissions savings, and acceptability of pre-defined course of actions in the city sector under consideration. The spatial carbon intensity may be adjusted over a certain period, (e.g., through local generation (microgeneration)) or due to an increasing proportion of lower carbon-energy in the generation mix and this can be related to the sector and city overall consumption.

1. Background

Climate change has received much attention at international forums amongst politicians and business leaders in the past decade. Scientists recognise the relationship between global warming and climate change. The carbon footprint arose out of the debate on climate change and became a tool to measure and estimate greenhouse gas (GHG) emissions related to human activities [1,2] and raised the concern to countries to setup integrated climate and energy policies [3]. It measures the emission of gases that contribute to heating the planet in carbon dioxide (CO2) equivalents per unit of time or product.
The building and construction sectors consume large amounts of energy, water, and other natural resources. Consequently, they produce waste, GHG emissions, and air pollution. Globally, buildings in developed countries consume about 30% to 40% for heating, cooling, and other purposes [4]. However, one-third of energy related to GHG emissions is associated with the building sector. Energy benchmarking for domestic and non-domestic buildings has attracted a number of researchers [5,6,7,8,9,10,11,12,13,14,15].
Recently, Qatar has had a rapid boom in construction development activities, such as the Qatar Integrated Railway Project, planning new cities and high-rise building construction. According to the Qatar Statistics Authority, there has been a 50% increase in the number of buildings between 2004 and 2010 in Qatar, and natural gas provides nearly all of the electricity and energy used in buildings. Hence, energy use in buildings contributes significantly to Qatar’s GHG emissions. Additionally, the integration of buildings with transportation and economic infrastructure can impact the overall CO2 emissions and dictate social and environmental outcomes. Obviously, the design of buildings during Qatar’s rapid growth can considerably affect the country’s development. The building and construction sectors present both challenges and opportunities for Qatar in promoting sustainable development [16]. The CO2 emissions in the GCC region are shown in Figure 1.
Governments, policy makers and businesses are urgently required to mitigate global warming and to seek ways to reduce GHG emissions in response to growing interests and concerns about climate change over the past two decades. Awareness of global warming was raised by the Intergovernmental Panel on Climate Change (IPCC), which also provided scientific insights on climate change to governments [17].
The first IPCC assessment report played an important role in the establishment of the United Nations Framework Convention on Climate Change (UNFCCC) [18]. Efforts under the UNFCCC led to the Kyoto Protocol, an international agreement to cut GHG emissions with specific reduction targets by country. It was signed in December 1997 and entered into force in 2005 [18]. Qatar is a Non-Annex І party, and therefore it is not obliged to introduce binding emission reduction targets legally. However, since environmental protection has been enshrined in the constitution and climate change is a cross-cutting element for sustainable development, Qatar recognises the need to be integrated into all relevant social, economic and environmental policies.
Figure 1. The Gulf Cooperation Council (GCC) region CO2 emissions per capita.
Buildings 05 00700 g001
Qatar recently hosted the Conference of the Parties (COP18) of the UNFCCC where an agreement was signed to extend the life of the Kyoto Protocol to 2020 (with an interim arrangement to achieve progress towards the accord terminates). Although achieving a consensus approval is extremely difficult when taking into account the divergent views and interests of participating countries, the conference could be considered an achievement for Qatar [19]. By 2030, Qatar aims to be an advanced society capable of sustaining its development and providing a high standard of living for its people. The Qatar National Vision 2030 (QNV 2030) [20] embraces four main pillars: economic, social, human and environment developments. The initial path for this vision was set out within the Qatar National Development Strategy (QNDS 2011–2016) [21], launched on 28 February 2011 to describe a strategy for sustainable development in Qatar and promote energy efficiency in new buildings.
As a response to an overall environmental policy laid down by government in itiatives, the Gulf Organisation for Research and Development (GORD) has repeatedly demonstrated its commitment to sustainability, primarily by the development of the Qatar Sustainability Assessment System (QSAS). The Global Sustainability Assessment System (GSAS) is an expansion of the QSAS code designed to be the foremost green buildings standard in the Middle East and North Africa, based on a comprehensive review of global best practices and its adaptation to the regional context. GSAS is mainly a performance-based sustainability rating system. It was developed to create a sustainable urban environment that reduces environmental impacts while satisfying local community needs, in addition to addressing all relevant aspects of sustainability, ecological impact and green building design criteria [22]. GSAS covers all phases of a building’s life, i.e., design, construction and operation, taking into account the specific requirements of the region. Its scope emphasises a range of sustainability issues including energy, carbon and mitigation of climate change, water and adaptation to climate change and ecosystems [23]. Qatar Construction Specifications (QCS 2014) [24] adopted the GSAS minimum standards as part of the building code.
This research work conducts a review of energy consumption and carbon emissions procedures. Here, a hybrid modelling approach and energy benchmarks in the GCC region are presented.

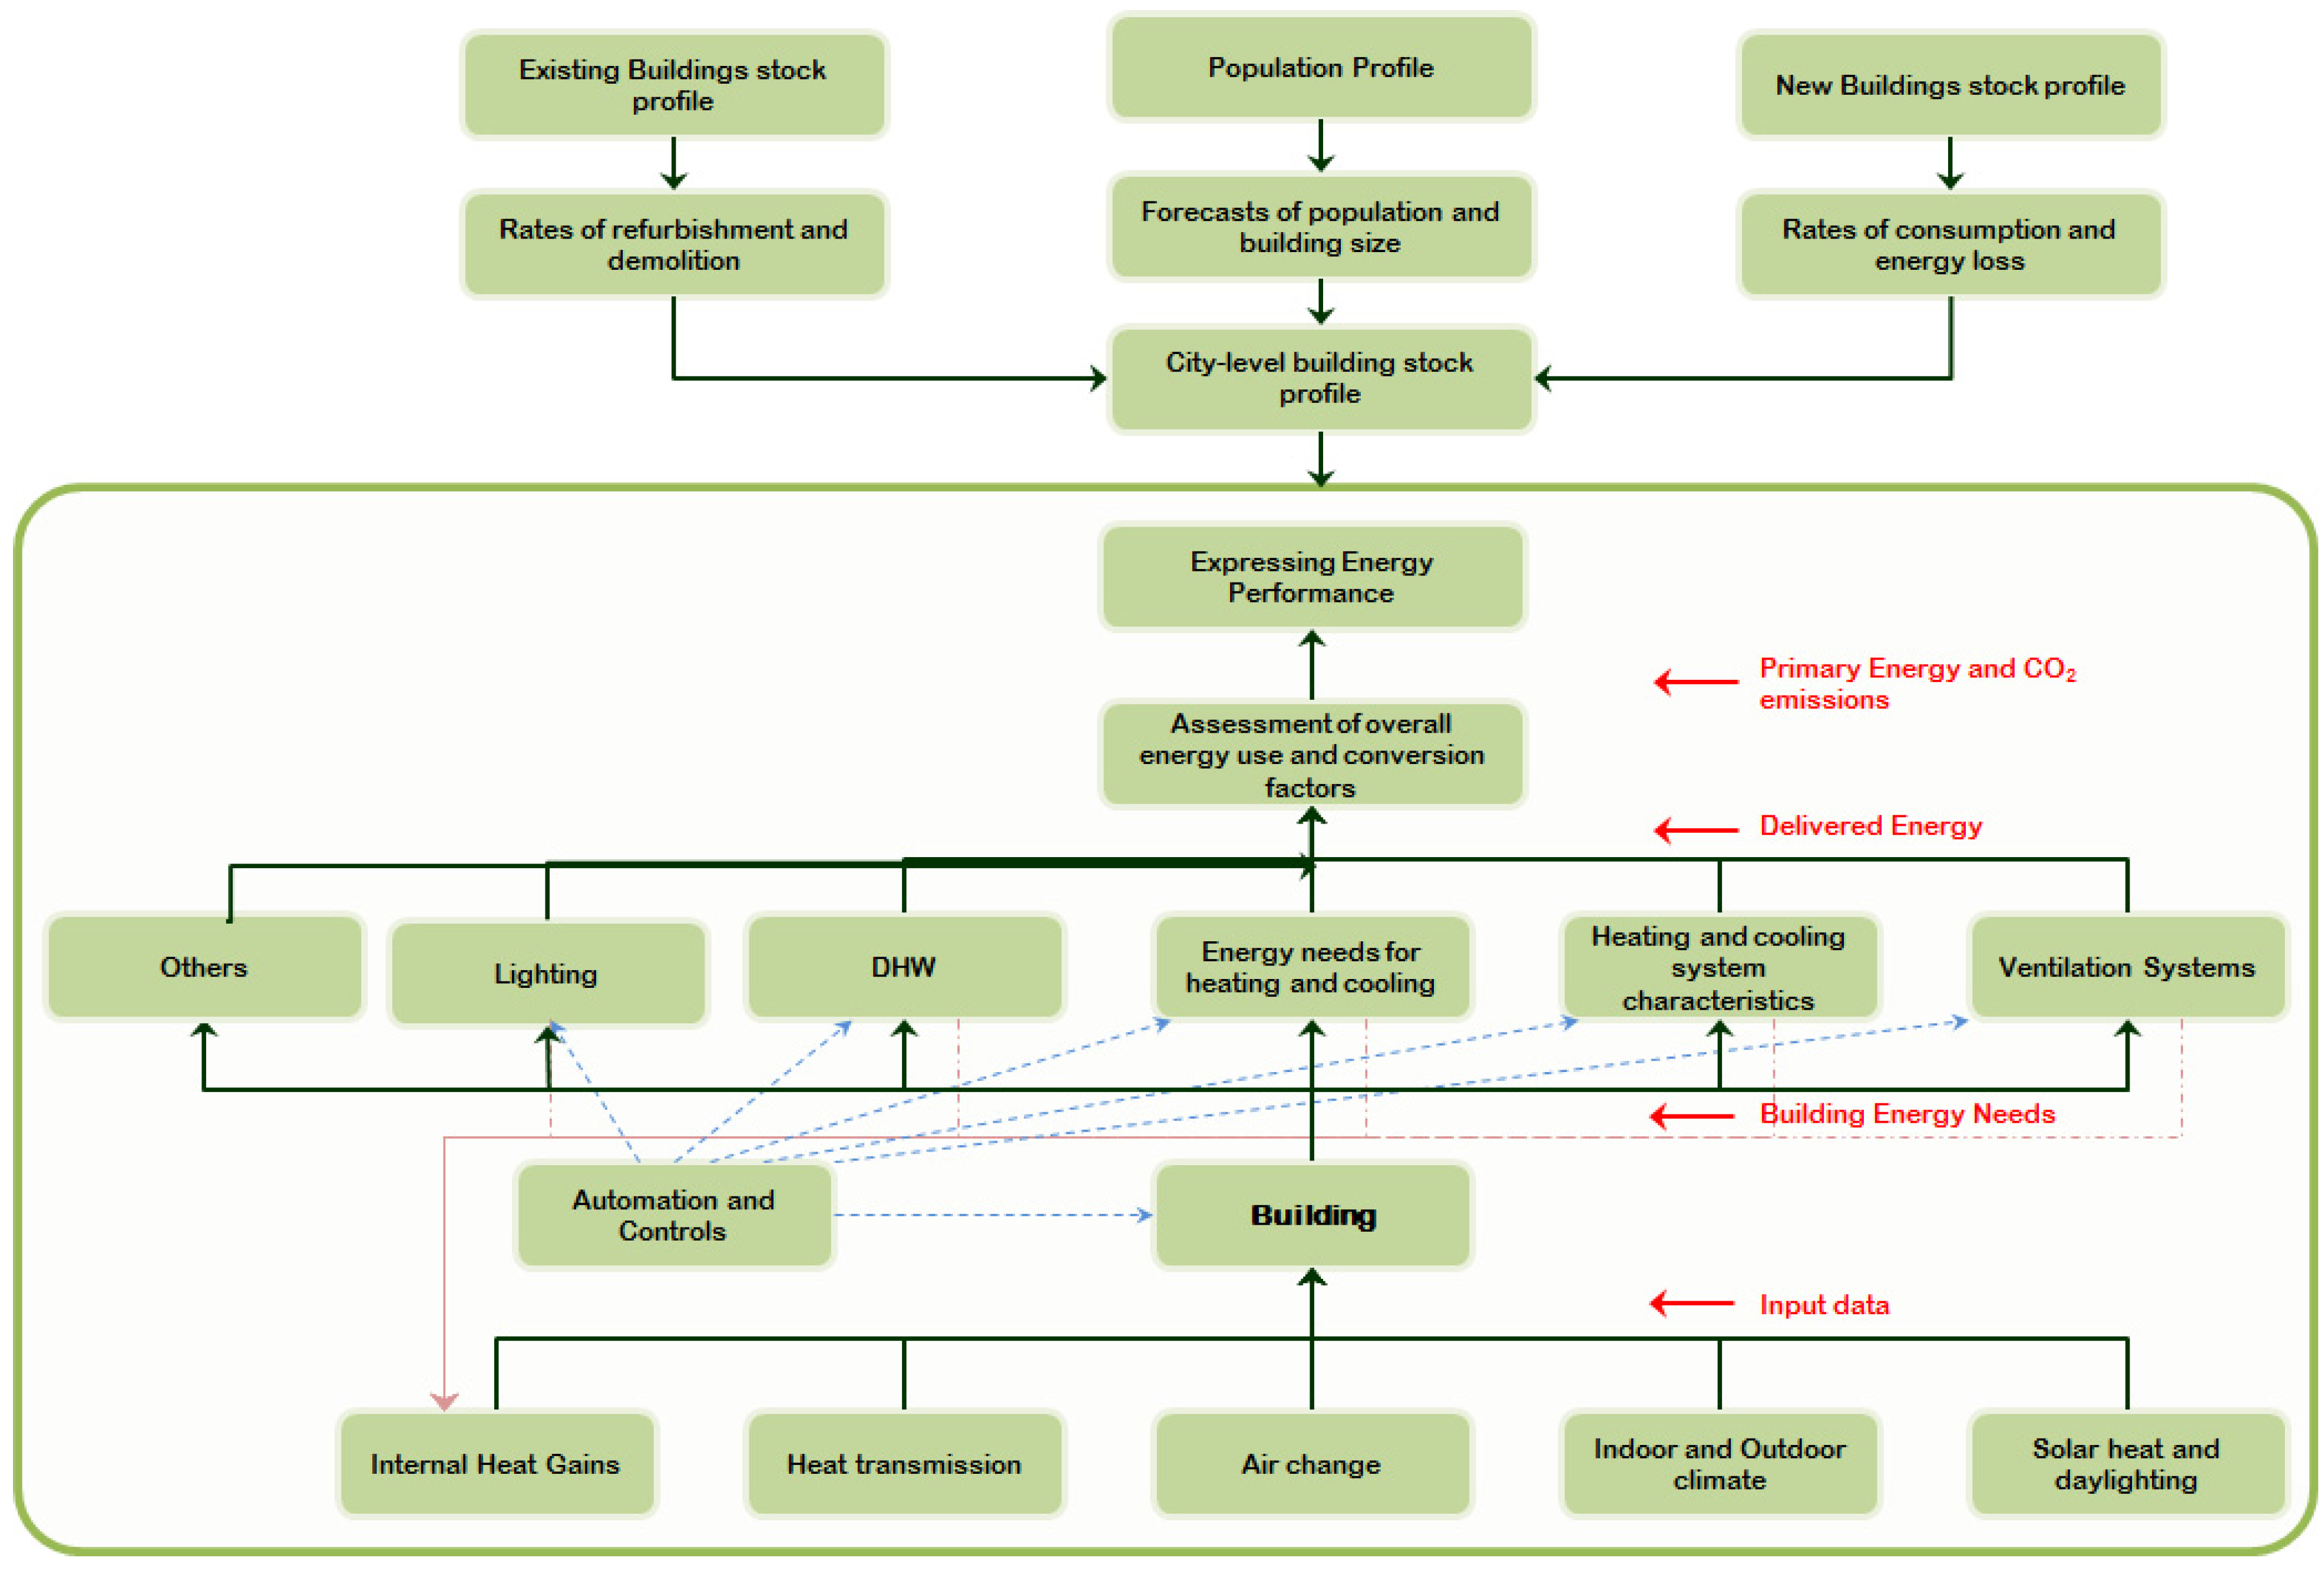
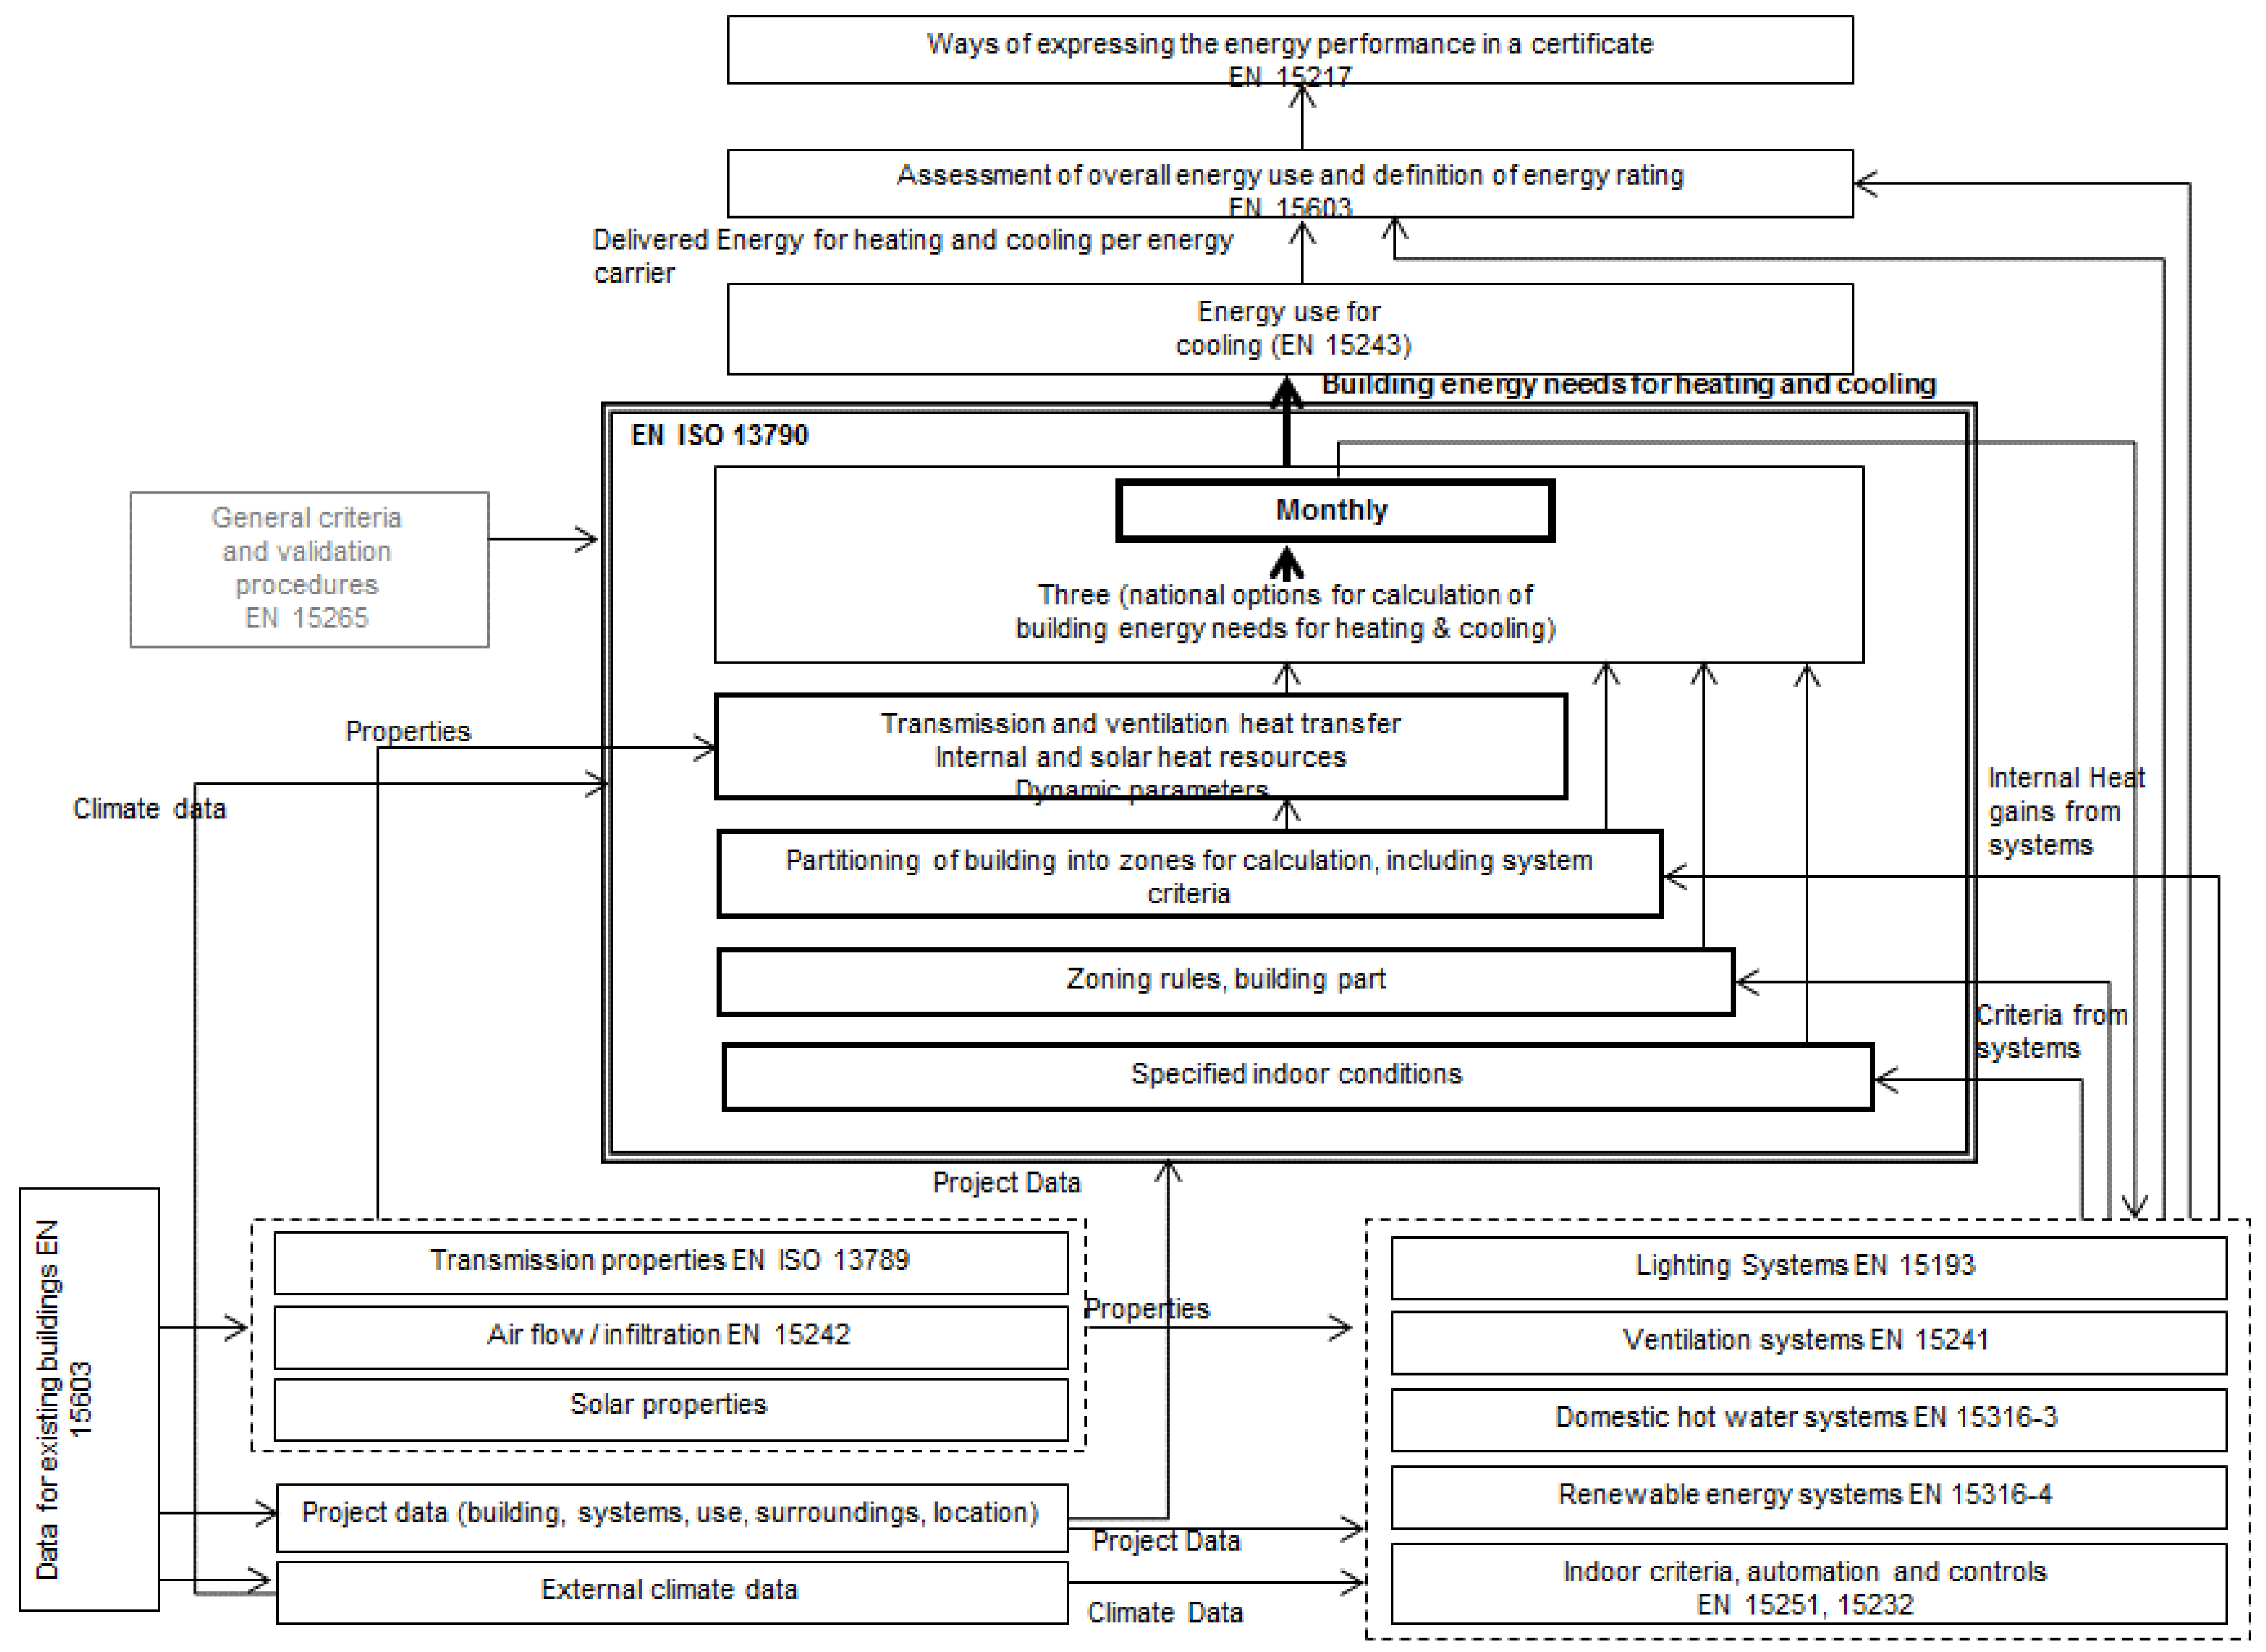
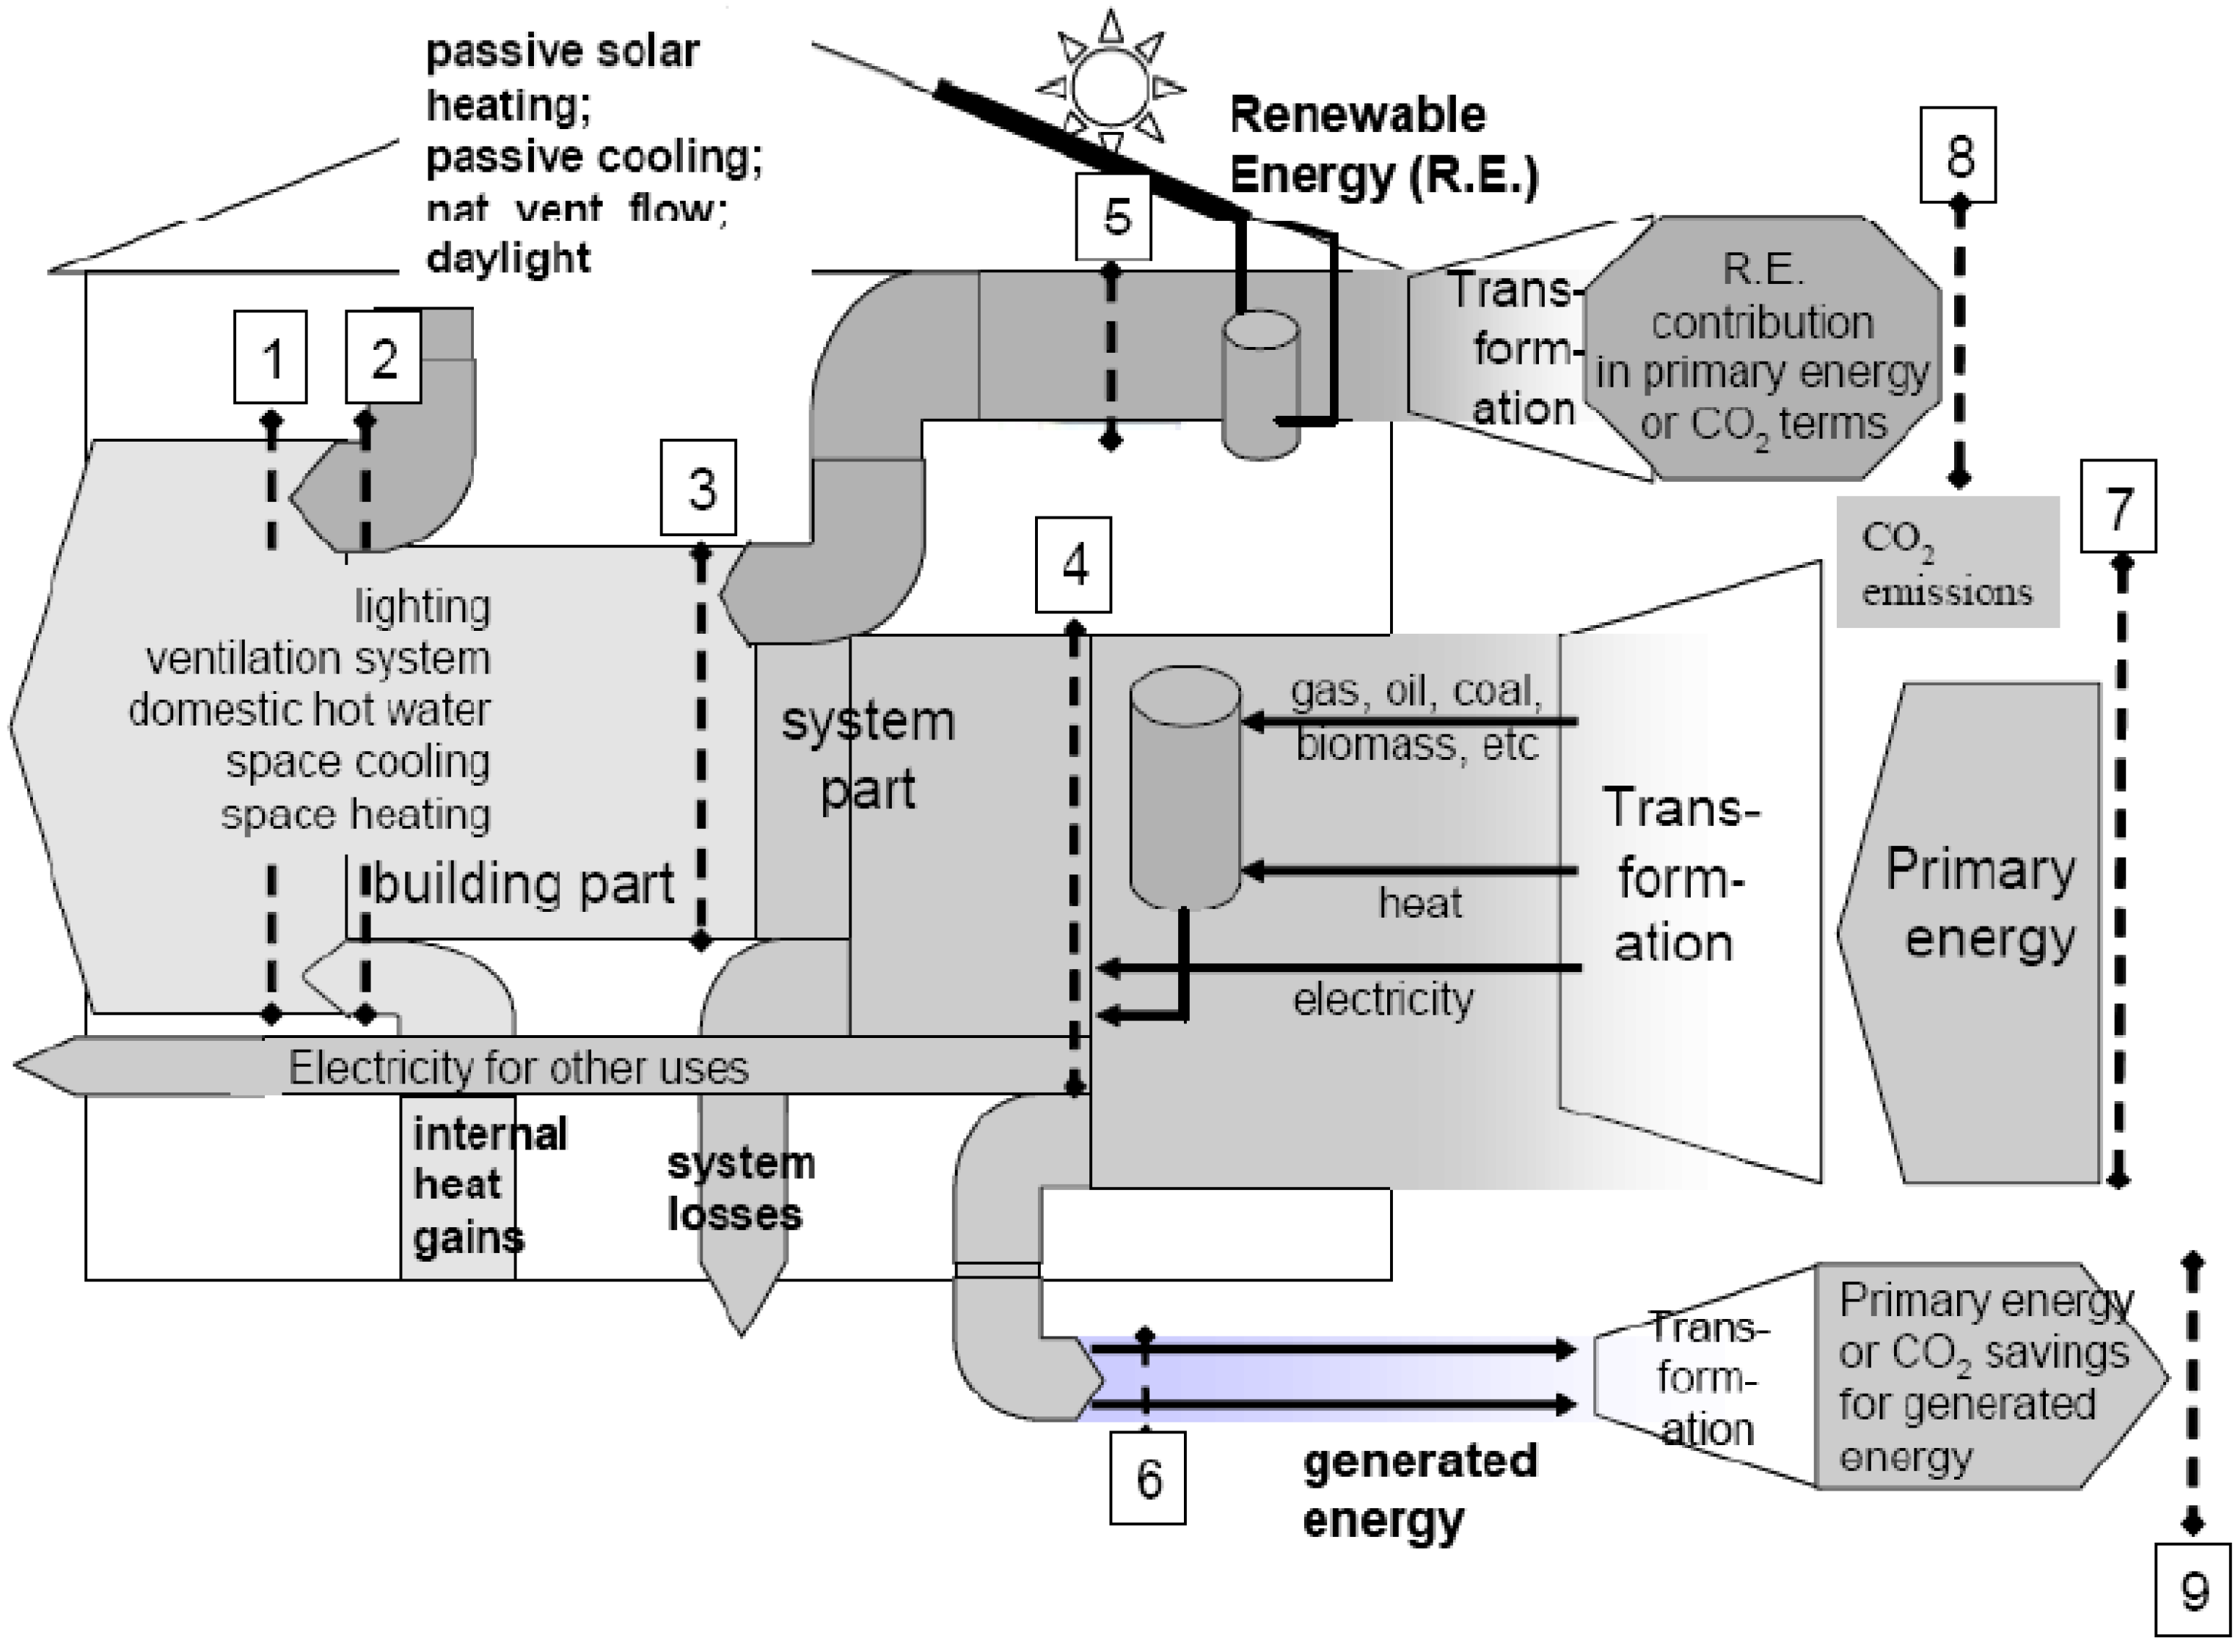
2. Energy Consumption and Carbon Emissions Modelling Procedure

Several theoretical frameworks in the literature are used to conceptualise energy consumption and carbon emissions. Keirstead [25] explored the fact that such frameworks fall into disciplinary and integrated domains. Consequent studies identified four main disciplines (engineering, economics, psychology, and sociology and anthropology). Natarajan et al. [26] recognized the limitation of purely disciplinary approaches to analysis of energy consumption and carbon emissions which are reflected in their inability to give a proper explanation for the disconnection between actual and predicted values. In dwellings, Hitchcock [27] suggested an integrated framework of energy use and behaviour.
Two main approaches are used as alternatives to modelling energy consumption and carbon emissions: top-down and bottom-up. The top-down works to predict the future by fitting the historical time series data on energy and carbon emissions to macroeconomic variables using econometric and multiple regression methods [28,29]. This approach was criticised with regard to its lack of flexibility in using and incorporating details regarding current and future technological improvements with other variables such as the socio-technical and behavioural aspects of energy consumption and carbon emissions [28,30].
In the domestic energy sector, top-down modelling approach has been extensively used and implemented for several household energy consumption and carbon emissions models [1,31,32,33,34,35,36].
The bottom-up approach to modelling is a building physics modelling technique that requires quantitative data on physically measurable variables like building fabric, heating and cooling systems, etc., and does not rely on historical data [29,36,37,38,39].
In this study, our model will be based on building physics (bottom-top approach) using a hybrid method that produces mainly archetypes, distribution and sample methods. The proposed structure for energy and carbon models is shown in Figure 2 below. The detailed energy consumption and carbon emissions model structure for each building stock type and profile is shown Figure 3 and Figure 4.
The approach defined in this document relies on the relevant CEN/ISO standards for building energy performance, which have been prepared under a mandate given to CEN by the European Commission and the European Free Trade Association (Mandate M/343). This mandate supports the essential requirements of EU Directive for the energy performance of buildings (EPBD) [40]. This series of standards aims to provide consistent methodologies for the calculation of the energy performance of buildings.
The GSAS calculation of energy performance for buildings in the MENA region, as set forth in this document, has fully adhered to all parts of the CEN/ISO set of standards.. An overview of the complete set of CEN/ISO standards for building energy performance assessment is given in CEN/TR 15615 [26].
Figure 2. Proposed energy and carbon models structure.
Buildings 05 00700 g002
Figure 3. Schematic illustration of the developed tool calculation scheme.
Buildings 05 00700 g003
Figure 4. Flow chart of energy consumption calculation procedure for building type.
Buildings 05 00700 g004
The following is an explanation of the calculation nodes in Figure 3: Node (1) represents the energy needed to fulfil the user’s requirements for heating, cooling, lighting, etc., according to levels that are specified for the purposes of the calculation. Node (2) represents the “natural” energy gains—passive solar heating, passive cooling, natural ventilation, daylighting—together with internal gains (occupants, lighting, electrical equipment, etc.). Node (3) represents the building’s energy needs, obtained from Node (1) and Node (2) along with the characteristics of the building itself. Node (4) represents the delivered energy, recorded separately for each energy carrier and inclusive of auxiliary energy, used by space heating, cooling, ventilation, domestic hot water, and lighting systems, taking into account renewable energy sources and co-generation. This may be expressed in energy units or in units of the energy type (kg, m3, kWh, etc.). Node (5) represents renewable energy produced on the building premises. Node (6) represents generated energy, produced on the premises and exported to the market. This can include part of Node (5). Node (7) represents the primary energy usage or the CO2 emissions associated with the building. Node (8) represents the primary energy or CO2 emissions associated with on-site generation which is used on-site and thus is not subtracted from Node (7). Node (9) represents the primary energy or CO2 savings associated with energy exported to the market, which is thus subtracted from Node (7).
In the past, energy codes were formulated in prescriptive terms (i.e., prescribing certain features of the planned building). Now, many countries are grounding their energy regulations and standards on a performance basis.
This transition requires that the code only contains statements that one must prove and the expected performance complies with a certain minimal requirement. This means that the code needs to be supported by a standard that defines the performance and normatively states the way to calculate it, with phase relevant parameters as input. The latter means that for “as-designed” performance one would define which design parameters are used as inputs, whereas for “as-operated” performance one would use parameters that describe the operation of the building in addition to design specifications. This requires a benchmark to be established for each building type.
Figure 4 presents the flow chart calculation procedure in EN-ISO 13790 [41].

3. Establishing Energy Consumption Baseline and Benchmarks for Building Typologies

There are a number of carbon footprint assessment methodologies, such as the IPCC’s Guidelines for National Greenhouse Gas Inventories [42], the GHG protocol [43] and UK’s PAS2050 [44] and forthcoming PAS2070 [45] for cities. These constitute a framework to calculate the carbon footprint across sectors. But at the city level, calculation boundaries, emissions factors and other parameters still need to be investigated to identify the impact of growth and changing climate. These boundaries are specific to the spatial regions under consideration and will need to be quantified through both data analysis and modelling approaches [23].
The first step is to establish baseline benchmarks based on dynamic simulation modelling for different buildings types in the region using existing design data, i.e., business-as-usual practices. Doha is the largest city in Qatar and its capital city. Due to the rapid urbanization in the region, many high-rise commercial buildings have been built in recent years to satisfy the increasing demands for offices. For instance, Doha West Bay is considered one of the most prominent business districts of Doha. It includes many modern high-rise commercial towers, and many more are planned to be built in the near future, see Figure 5.
Figure 5. Doha West Bay Business District.
Buildings 05 00700 g005
The example below demonstrates how the energy consumption baseline is established for commercial buildings.
Design information for ten existing commercial buildings in Qatar is available for the test (necessary assumptions have been applied as well due to the inadequacy of information for some buildings), see Table 1, Table 2, and Table 3.
Table 1. Building Profiles of Studied Sample Buildings.
NoNamePictureProfile
1HE Buildings 05 00700 i001H.E. Ahmed Abdulla Al Mahmoud
Location: West Bay, Doha
Floors: B + G + 19
Size: 14,747 m2
2UT Buildings 05 00700 i002United Tower
Location: Al Sadd, Doha
Floors: B + G + 7
Size: 10,711 m2
3AT Buildings 05 00700 i003Attiyah Tower
Status: Under Construction
Location: West Bay, Doha
Floors: B + G + 23
Size: 45,175 m2
4T1 Buildings 05 00700 i004Barwa Financial District, Tower 1
Location: West Bay, Doha
Floors: 3B + 3G + ME + 13 + ME
Size: 16,918 m2
5T2 Buildings 05 00700 i005
In the same district with the above building
Barwa Financial District, Tower 2
Location: West Bay, Doha
Floors: 3B + 3G + ME + 16 + ME
Size: 20,223 m2
6T3In the same district with the above buildingBarwa Financial District, Tower 3
Location: West Bay, Doha
Floors: 3B + 2G + ME + 19 + ME
Size: 26,036 m2
7T4In the same district with the above buildingBarwa Financial District, Tower 4
Location: West Bay, Doha
Floors: 3B + 2G + ME + 22 + ME
Size: 31,584 m2
8T5In the same district with the above buildingBarwa Financial District, Tower 5
Location: West Bay, Doha
Floors: 3B + 2G + ME + 26 + ME
Size: 30,536 m2
9T6In the same district with the above buildingBarwa Financial District, Tower 6
Location: West Bay, Doha
Floors: 3B + 2G + ME + 28 + ME
Size: 38,400 m2
10T7 Buildings 05 00700 i006
In the same district with the above building
Barwa Financial District, Tower 7
Location: West Bay, Doha
Floors: 3B + 2G + ME + 44 + 2ME
Size: 63,233 m2
Table 2. Summary of design data.
Building NameDesign Data
  • HE
Wall: U value 0.56 W/m2K; Window: U value 2.4 W/m2K; Shading Coefficient 0.56
System: Air cooled chillers with constant volume air handling units; Lighting: 15 W/m2
Ventilation: 8 l/s/person; Equipment: 2 W/m2
2.
UT
Wall U value 0.56 W/m2K; Window type-1: U value 1.8 W/m2K, Shading Coefficient 0.6
Window type-2: U value 1.6 W/m2K, Shading Coefficient 0.42; System: Air cooled chillers with constant volume air handling units; Lighting: 15 W/m2; Ventilation: 8 l/s/person; Equipment: 2 W/m2
3.
AT
Wall U value 0.56 W/m2K; Window U value 1.8 W/m2K, Shading Coefficient 0.6; System: Air cooled chillers with constant volume air handling units; Lighting: 15 W/m2; Ventilation: 8 l/s/person; Equipment: 2 W/m2
4.
T1
Wall U value 0.56 W/m2K; Window type-1: U value 1.8 W/m2K, Shading Coefficient 0.6
Window type-2: U value 1.6 W/m2K, Shading Coefficient 0.42; System: Purchased district cooling with variable volume air handling units; Lighting: 15 W/m2; Ventilation: 8 l/s/person
Equipment: 2 W/m2
5.
T2
Wall U value 0.56 W/m2K; Window type-1: U value 1.8 W/m2K, Shading Coefficient 0.6
Window type-2: U value 1.6 W/m2K, Shading Coefficient 0.42; System: Purchased district cooling with variable volume air handling units; Lighting: 15 W/m2; Ventilation: 8 l/s/person
Equipment: 2 W/m2
6.
T3
Wall U value 0.56 W/m2K; Window type-1: U value 1.8 W/m2K, Shading Coefficient 0.6
Window type-2: U value 1.6 W/m2K, Shading Coefficient 0.42; System: Purchased district cooling with variable volume air handling units; Lighting: 15 W/m2; Ventilation: 8 l/s/person
Equipment: 2 W/m2
7.
T4
Wall U value 0.56 W/m2K; Window type-1: U value 1.8 W/m2K, Shading Coefficient 0.6
Window type-2: U value 1.6 W/m2K, Shading Coefficient 0.42; System: Purchased district cooling with variable volume air handling units; Lighting: 15 W/m2; Ventilation: 8 l/s/person
Equipment: 2 W/m2
8.
T5
Wall U value 0.56 W/m2K; Window type-1: U value 1.8 W/m2K, Shading Coefficient 0.6
Window type-2: U value 1.6 W/m2K, Shading Coefficient 0.42; System: Purchased district cooling with variable volume air handling units; Lighting: 15 W/m2; Ventilation: 8 l/s/person
Equipment: 2 W/m2
9.
T6
Wall U value 0.56 W /m2K; Window type-1: U value 1.8W /m2K, Shading Coefficient 0.6
Window type-2: U value 1.6 W/m2K, Shading Coefficient 0.42; System: Purchased district cooling with variable volume air handling units; Lighting: 15 W/m2; Ventilation: 8 l/s/person
Equipment: 2 W/m2
10.
T7
Wall U value 0.56 W/m2K; Window type-1: U value 1.8 W/m2K, Shading Coefficient 0.6
Window type-2: U value 1.6 W/m2K, Shading Coefficient 0.42; System: Purchased district cooling with variable volume air handling units; Lighting: 15 W/m2; Ventilation: 8 l/s/person
Equipment: 2 W/m2
Dynamic simulation modelling was conducted using the design data of the ten commercial towers. Table 2 shows the buildings component and technical systems information which was extracted from the design documents. The operation schedule, Table 3, has been applied to all sample buildings.
Table 3. Operation Schedule.
Operation Time7 a.m. to 5 p.m. (10 h)
Occupancy10 m2/person
Occupied set point Temp23 °C
Unoccupied Set point Temp28 °C
The simulation results of eQuest and Energyplus are shown in Figure 6. The annual average energy consumption of the sample buildings is 181 kWh/m2. It is essential to compare the modelled building’s baseline with the best practices standards deployed in the region, i.e., ASHRAE standards 90.1. The main purpose of the ASHRAE building energy standard 90.1 is to set minimum energy efficiency requirements for the design of new buildings and also for new systems in existing buildings. For the methodology to derive a sensible GSAS reference value, the ASHRAE 90.1-2007 [46] simulation was performed for the ten sample buildings, this led to an average normalised value of 128 kWh/m2/year which is 30% less than the existing design value. The GSAS benchmark was set to be 89 kWh/m2/year, assuming all commercial buildings (existing and new) are subject to improvements.
Figure 6. Baseline simulation results for 10 typical commercial buildings in Qatar.
Buildings 05 00700 g006
The results obtained from dynamic simulation for the ten buildings are normalised and depicted graphically in Figure 7. It can be seen that the GSAS design benchmark (mandated in the building code) is almost 50% less than the business as usual practices design (the baseline) and at least 30% less than ASHRAE 90.1-2007 [46] (best practices in the region).
An important philosophical difference between the ASHRAE 90.1 [46] and GSAS compliance approaches is that, according to ASHRAE, the comparison is not done with respect to peer buildings but only to itself (i.e., its own cost budget as a baseline). As it happens, this baseline has a relatively high energy consumption, which results in a design/cost-budget value that is relatively low. This is one of the major concerns when using ASHARE 90.1 [10] for energy performance compliance. A poor building may pass as long as it improves its own baseline sufficiently. However, the GSAS approach is to set a benchmark based on the building type into which all buildings should adhere to.
Figure 7. Energy consumption baseline for commercial buildings in Qatar (kWh/m2/year).
Buildings 05 00700 g007
It is important to understand that not all commercial buildings are functionally equivalent. For instance, one building can have a retail space whereas another building does not. There is no rational basis on which to consider both buildings if they are not functionally equivalent. Therefore, to accommodate the comparison and thereby the rating, it is essential that buildings are compared on the basis of normative assumptions of their internal processes and usage scenarios. This is the reason that buildings of the same type are subjected to a normative scenario and all secondary functions are based on each space function benchmark.
Again, because of lack of data, the determination of the reference value for another building type was based on a similar parametric study as shown above for commercial. The baseline, ASHRAE 90.1 [46] and benchmarks for different building types are summarised in Figure 8.
Figure 8. Energy consumption baseline for different building types in Qatar (kWh/m2/year).
Buildings 05 00700 g008
Due to lack of field measurements it is difficult to establish the correlation between actual energy consumption and the simulated values. This correlation will be established as measurements were taken or obtained from local authorities. A continuous discussion with the electricity and water authority is underway to obtain the same.

4. Conclusions

The operation of buildings contributes 30%–40% of total global energy use and associated CO2 emissions [47]. This paper serves as a master document for the application and implementation of the CEN/ISO energy performance standard and all its related standards to buildings in the GCC region. It explains the roadmap of the calculations and points to all the relevant parts of the standards, including references to detailed explanations and stipulations.
This research introduced energy baselines for several building types (Commercial, Schools, Residential, Hotels, Mosques and Light Industry). The GSAS energy benchmarks performance standard is part of a larger effort targeting building sustainability regulation, supported by the Global Sustainability Assessment System (GSAS). The forthcoming building regulation in Qatar [48] includes mandatory levels of sustainability performance and potentially energy certification. Both reference the Building Energy Performance standard for all underlying normative calculations and references. Future research will deal with the development of a building energy code that is ready to be implemented in the local situation and the local regulatory building code system of the GCC region. It is expected that this future code development will heavily rely on the energy portion of the overall GSAS rating system.

Acknowledgment

The authors acknowledge the support provided by Qatar National Research Funds, NPRP 6-691-2-287.

Author Contributions

The two authors have equally contributed to the reported research and writing of the paper

Conflicts of Interest

The authors declare no conflict of interest.

References

  1. Wiedmann, T. Carbon footprint and input-output analysis: An introduction. Econ. Syst. Res. 2009, 21, 175–186. [Google Scholar] [CrossRef]
  2. Moss, J.; Lambert, C.G.; Rennie, A.E.W. SME application of LCA-based carbon footprints. Int. J. Sustain. Eng. 2008, 1, 132–141. [Google Scholar] [CrossRef]
  3. International Energy Agency. Mapping the Energy Future: Energy Modelling and Climate Change Policy; International Energy Agency: Paris, France, 1998. [Google Scholar]
  4. Buildings and Climate Change: Status, Challenges and Opportunities. Available online: http://www.unep.org/sbci/pdfs/BuildingsandClimateChange.pdf (accessed on 3 June 2015).
  5. Hernandez, P.; Burke, K.; Lewis, J.O. Development of energy performance benchmarks and building energy ratings for non-domestic buildings: An example for Irish primary schools. Energy Build. 2008, 40, 249–254. [Google Scholar] [CrossRef]
  6. Chan, W. Energy benchmarking in support of low carbon hotels: Developments, challenges, and approaches in China. Int. J. Hosp. Manag. 2012, 31, 1130–1142. [Google Scholar] [CrossRef]
  7. Hong, S.; Paterson, G.; Burman, E.; Steadman, P.; Mumovic, D. A comparative study of benchmarking approaches for non-domestic buildings: Part 1—Top-down approach. Int. J. Sustain. Built Environ. 2013, 2, 119–130. [Google Scholar] [CrossRef]
  8. Martin, C. Generating low-cost national energy benchmarks: A case study in commercial buildings in Cape Town, South Africa. Energy Build. 2013, 64, 26–31. [Google Scholar] [CrossRef]
  9. Ays, E.T.; Soofia, T.E.O.; Ursula, E. Energy benchmarking for residential buildings. Energy Build. 2013, 60, 92–99. [Google Scholar]
  10. Burman, E.; Hong, S.; Paterson, G.; Kimpian, J.; Mumovic, D. A comparative study of benchmarking approaches for non-domestic buildings: Part 2—Bottom-up approach. Int. J. Sustain. Built Environ. 2014, 3, 247–261. [Google Scholar] [CrossRef]
  11. Chung, W. Using the fuzzy linear regression method to benchmark the energy efficiency of commercial buildings. Appl. Energy 2012, 95, 45–49. [Google Scholar] [CrossRef]
  12. Kavgic, M.; Mavrogianni, A.; Mumovic, D.; Summerfield, A.; Stevanovic, Z.; Djurovic Petrovic, M. Review of bottom-up building stock models for energy consumption in the residential sector. Build. Environ. 2010, 45, 1683–1697. [Google Scholar] [CrossRef]
  13. Mihalakakou, G.; Santamouris, M.; Tsangrassoulis, A. On the energy consumption in residential buildings. Energy Build. 2002, 34, 727–736. [Google Scholar] [CrossRef]
  14. Swan, L.G.; Ugursal, V.I.; Beausoleil-Morrison, I. A New Hybrid End-Use Energy and Emissions Model of the Canadian Housing Stock. In Proceedings of the COBEE Conference, Dalian, China, 13–16 July 2008.
  15. Wheelock, J.; Oughton, E. The Household as a Focus for Comparative Research; University of Newcastle, Centre for Rural Economy: Newcastle, UK, 1994. [Google Scholar]
  16. RAND-Qatar Policy Institute. Recommended Research Priorities for the Qatar Foundation’s Environment and Energy Research Institute; ISBN 978-0-8330-5820-1. RAND Cooperation: Santa Monica, CA, USA, 2011. [Google Scholar]
  17. IPCC. Contribution of Working Group III to the Fourth Assessment Report of the Intergovernmental Panel on Climate Change. In Climate Change 2007: Mitigation; Metz, B., Davidson, O., Bosch, P., Dave, R., Meyer, L., Eds.; Cambridge University Press: Cambridge, UK; New York, NY, USA, 2007. [Google Scholar]
  18. Ercin, A.E.; Hoekstra, A.Y. Carbon and Water Footprints Concepts, Methodologies and Policy Responses; ISBN 978-92-3-001095-9; UNESCO: Paris, France, 2012. [Google Scholar]
  19. United Nations Framework Convention on Climate Change. 2012. Available online: http://unfccc.int/documentation/decisions/items/3597.php#beg (accessed on 3 June 2015).
  20. General Secretariat for Development Planning, 2008. Qatar National Vision 2030. Available online: http://www.gsdp.gov.qa/www1_docs/QNV2030_English_v2.pdf (accessed on 3 June 2015).
  21. General Secretariat for Development Planning, 2010. Qatar National Development Strategy 2011–2016. Available online: http://www.gsdp.gov.qa/gsdp_vision/docs/NDS_EN.pdf (accessed on 3 June 2015).
  22. Elsarrag, E.; Alhorr, Y. Modelling the thermal energy demand of a passive-house in the Gulf region: The impact of thermal insulation. Int. J. Sustain. Built Environ. 2012, 1, 1–15. [Google Scholar] [CrossRef]
  23. Alhorr, Y.; Eliskandarani, E.; Elsarrag, E. Approaches to reducing carbon dioxide emissions in the built environment: Low carbon cities. Int. J. Sustain. Built Environ. 2014, 3, 167–272. [Google Scholar] [CrossRef]
  24. The Ministry of Environment: Qatar Construction Specifications (QCS) 2014—Section 7 Green Construction. MoE 2015. Available online: http://www.moe.gov.qa (accessed on 3 June 2015).
  25. Keirstead, J. Evaluating the applicability of integrated domestic energy consumption frameworks in the UK. Energy Policy 2006, 34, 3065–3077. [Google Scholar] [CrossRef]
  26. Natarajan, S.; Padget, J.; Elliott, L. Modelling UK domestic energy and carbon emissions: An agent-based approach. Energy Build. 2011, 43, 2602–2612. [Google Scholar] [CrossRef] [Green Version]
  27. Hitchcock, G. An integrated framework for energy use and behaviour in the domestic sector. Energy Build. 1993, 20, 151–157. [Google Scholar] [CrossRef]
  28. Kelly, S. Do Homes that Are More Energy Efficient Consume Less Energy? A Structural Equation Model for England’s Residential Sector; EPRG Working Paper; Electricity Policy Research Group, University of Cambridge: Cambridge, UK, 2011. [Google Scholar]
  29. Johnston, D. A Physically Based Energy and Carbon Dioxide Emission Model of the UK Housing Stock. Ph.D. Thesis, Leeds Metropolitan University, Leeds, UK, 2003. [Google Scholar]
  30. Massachusetts Institute of Technology (MIT) Energy Laboratory. Energy Technology Availability: Review of Longer Term Scenarios for Development and Deployment of Climate-Friendly Technologies; MIT Energy Laboratory: Cambridge, MA, USA, 1997. [Google Scholar]
  31. Hirst, E.; Lin, W.; Cope, J. A residential energy use model sensitive to demographic, economic, and technological factors. Q. Rev. Econ. Financ. 1977, 17, 7–22. [Google Scholar]
  32. Haas, R.; Schipper, L. Residential energy demand in OECD-countries and the role of irreversible efficiency improvements. Energy Econ. 1998, 20, 421–442. [Google Scholar] [CrossRef]
  33. FitzGerald, J.; Hore, J. A Model for Forecasting Energy Demand and Greenhouse Gas Emissions in Ireland; Working Paper No 146; the Economic and Social Research Institute: Dublin, Ireland, 2002. [Google Scholar]
  34. Summerfield, A.J.; Lowe, R.J.; Oreszczyn, T. Two models for benchmarking UK domestic delivered energy. Build. Res. Inf. 2010, 38, 12–24. [Google Scholar] [CrossRef]
  35. Lee, T.; Yao, R. Incorporating technology buying behaviour into UK-based long term domestic stock energy models to provide improved policy analysis. Energy Policy 2013, 52, 363–372. [Google Scholar] [CrossRef]
  36. Swan, L.G.; Ugursal, V.I. Modelling of end-use energy consumption in the residential sector: A review of modelling techniques. Renew. Sustain. Energy Rev. 2009, 13, 1819–1835. [Google Scholar] [CrossRef]
  37. Mhalas, A.; Kassem, M.; Crosbie, T.; Dawood, N. A visual energy performance assessment and decision support tool for dwellings. Vis. Eng. 2013. [Google Scholar] [CrossRef]
  38. Hoogwijk, M.; van Vuuren, D.P.; Scrieciu, S. Sectoral Emission Mitigation Potentials: Comparing Bottom up and Top down Approaches. Available online: http://www.env.go.jp/press/files/jp/12478.pdf (accessed on 18 November 2014).
  39. Shorrock, L.D.; Dunster, J.E. The physically-based model BREHOMES and its use in deriving scenarios for the energy use and carbon dioxide emissions of the UK housing stock. Energy Policy 1997, 25, 1027–1037. [Google Scholar] [CrossRef]
  40. Explanation of the general relationship between various European standards and the Energy Performance of Buildings Directive (EPBD)—Umbrella document. Available online: http://www.buildup.eu/sites/default/files/umbrella_p2353.pdf (accessed on 3 June 2015).
  41. International Organization for Standardization. Energy Performance of Buildings—Calculation of Energy Use for Space Heating and Cooling; EN-ISO 13790; ISO: Geneva, Switzerland, 2008. [Google Scholar]
  42. IPCC Guidelines for National Greenhouse Gas Inventories; Eggleston, H.S.; Buendia, L.; Miwa, K.; Ngara, T.; Tanabe, K. (Eds.) Institute for Global Environmental Strategies (IGES): Hayama, Japan, 2006.
  43. World Resources Institute (WRI). The Greenhouse Gas Protocol; ISBN 1-56973-568-9; WRI: Washington, DC, USA; World Business Council for Sustainable Development: Geneva, Switzerland, 2004. [Google Scholar]
  44. Specification for the assessment of the life cycle greenhouse gas emissions of goods and services. Available online: http://shop.bsigroup.com/upload/shop/download/pas/pas2050.pdf (accessed on 3 June 2015).
  45. Specification for the assessment of greenhouse gas emissions of a city. Available online: http://shop.bsigroup.com/upload/PASs/Free-Download/PAS-2070-2013.pdf (accessed on 3 June 2015).
  46. American Society of Heating, Refrigerating and Air-Conditioning Engineers, Inc. Energy Standard for Buildings except Low-Rise Residential Buildings; ASHRAE Standard 90.1; ASHRAE: Atlanta, GA, USA, 2007. [Google Scholar]
  47. UNEP Year Book: Emerging Issues in Our Global Environment. Available online: http://www.unep.org/pdf/uyb_2013.pdf (accessed on 3 June 2015).
  48. Wilson, D.; Swisher, J. Exploring the gap: Top-down versus bottom-up analyses of the cost of mitigating global warming. Energy Policy 1993, 21, 249–263. [Google Scholar] [CrossRef]

