The Eco-Refurbishment of a 19th Century Terraced House: Energy and Cost Performance for Current and Future UK Climates

Abstract
:1. Introduction
1.1. Climate Change and the UK Housing Stock
1.2. Eco-Refurbishment
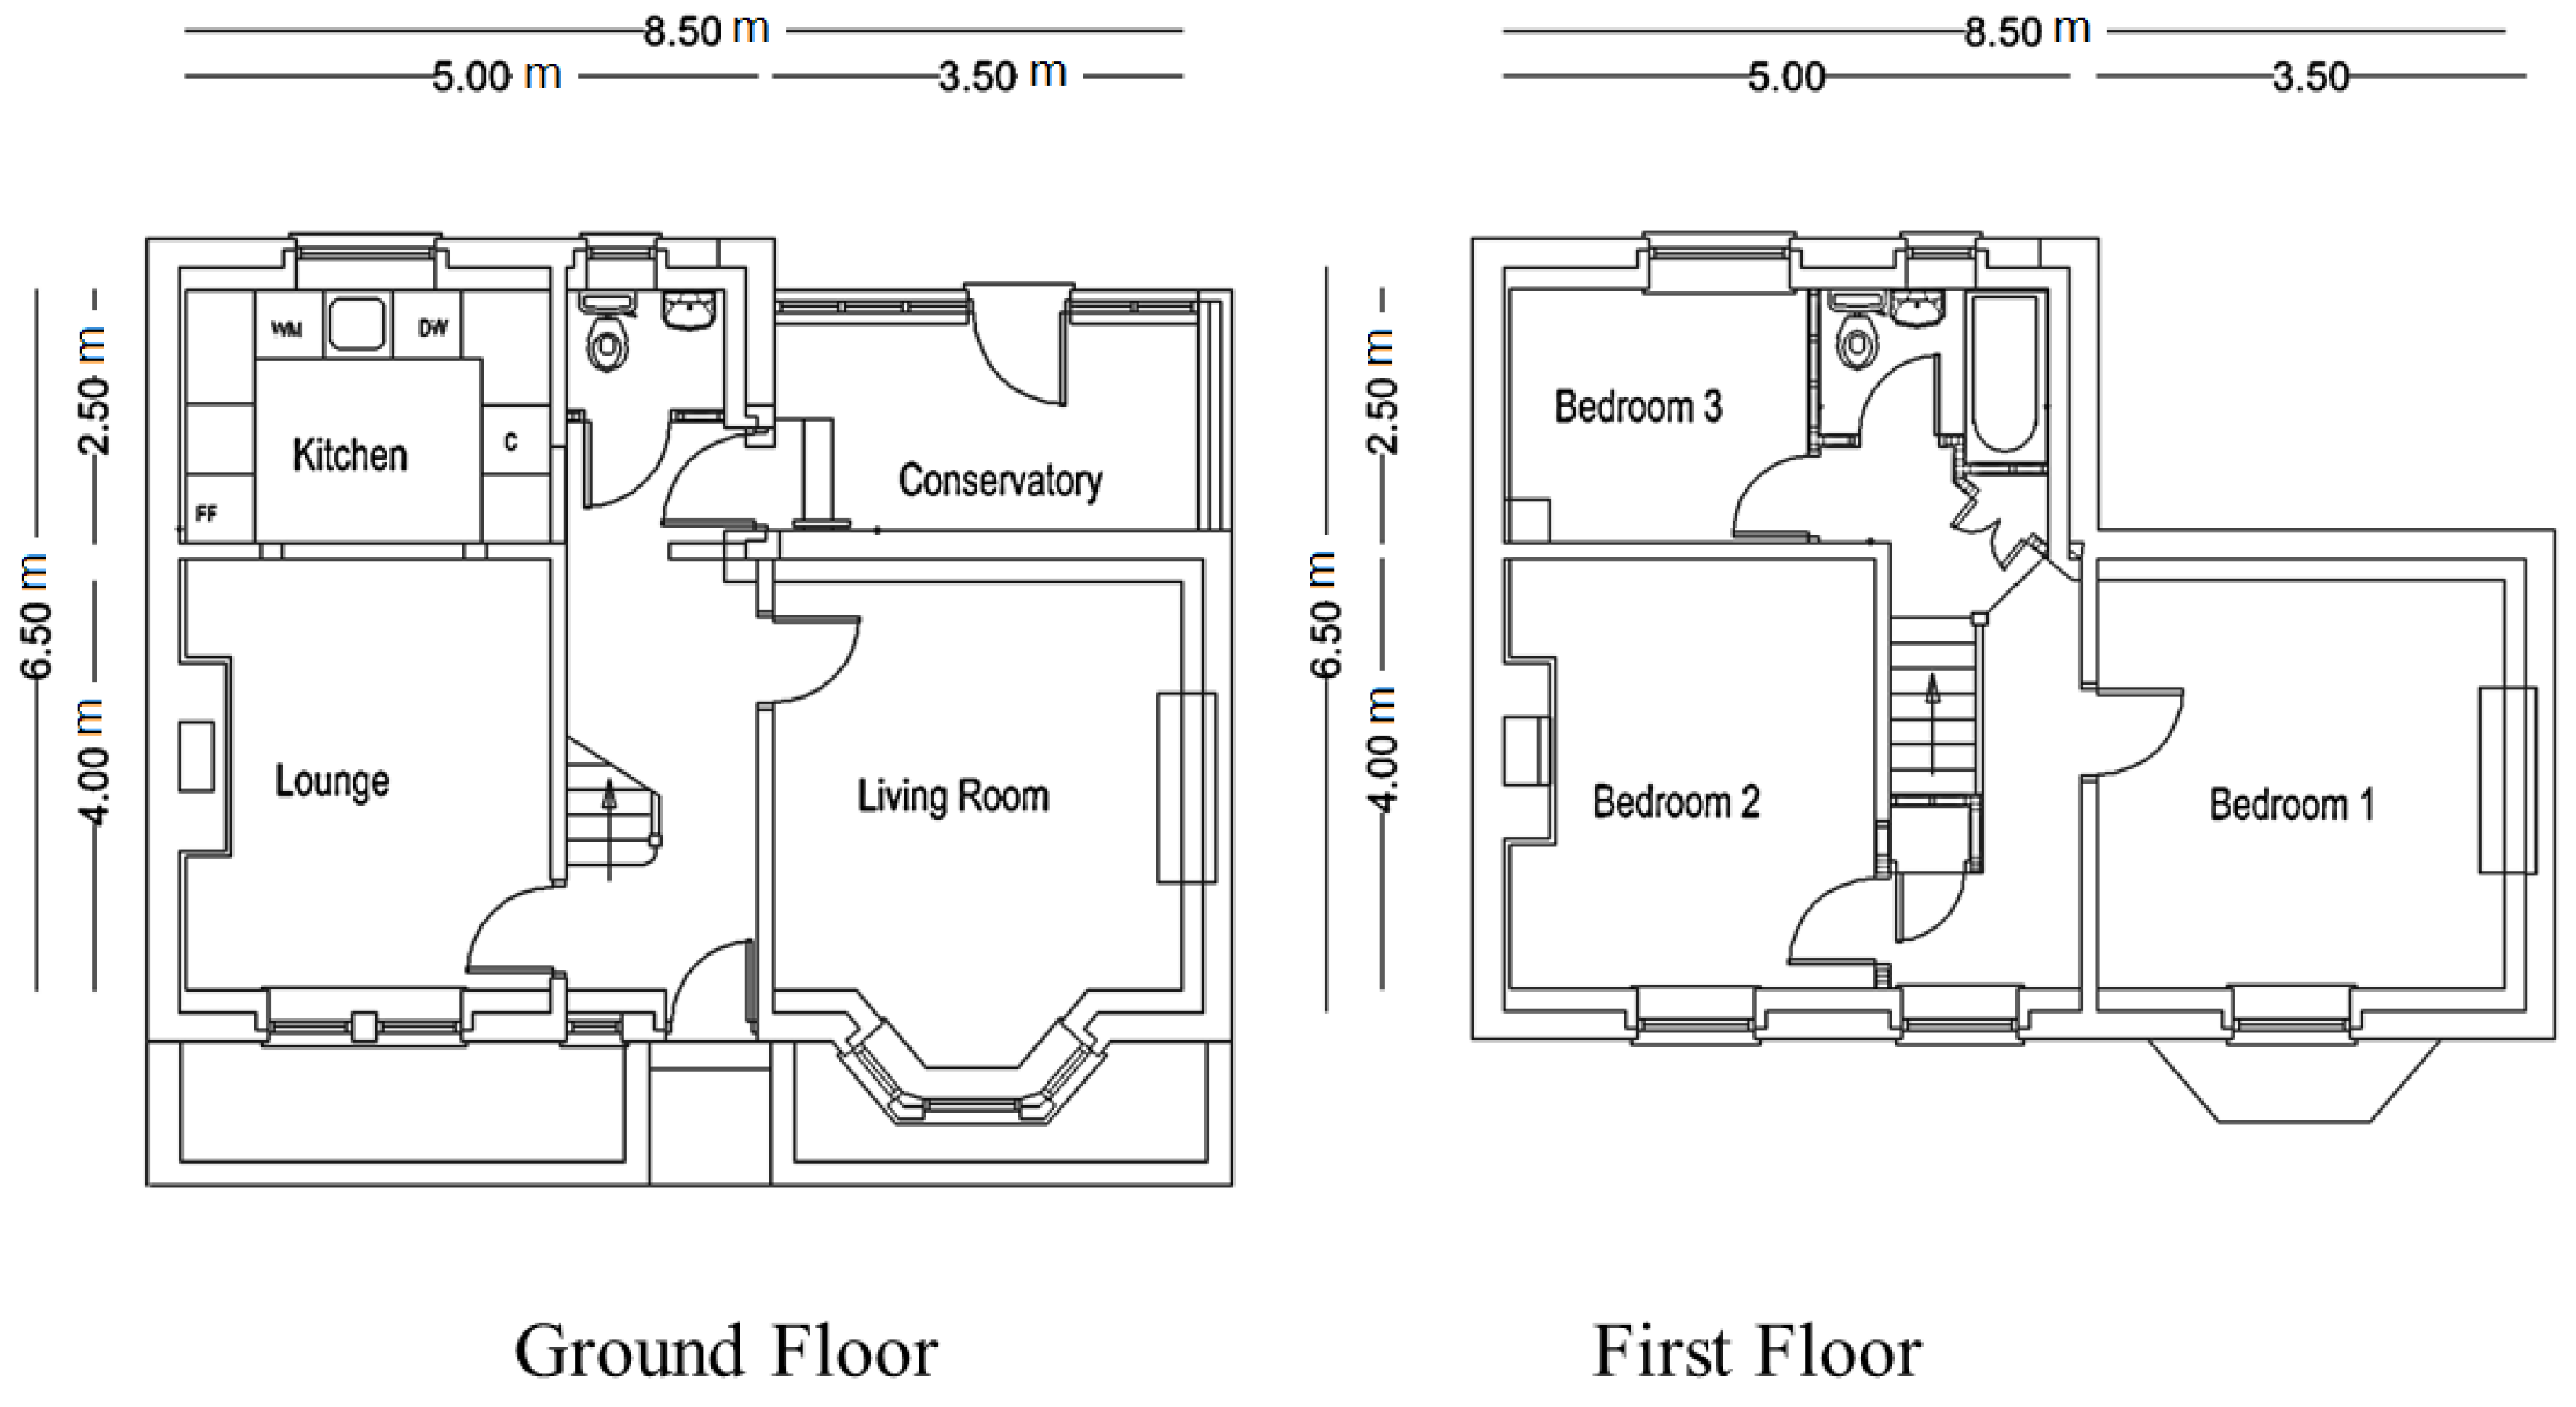
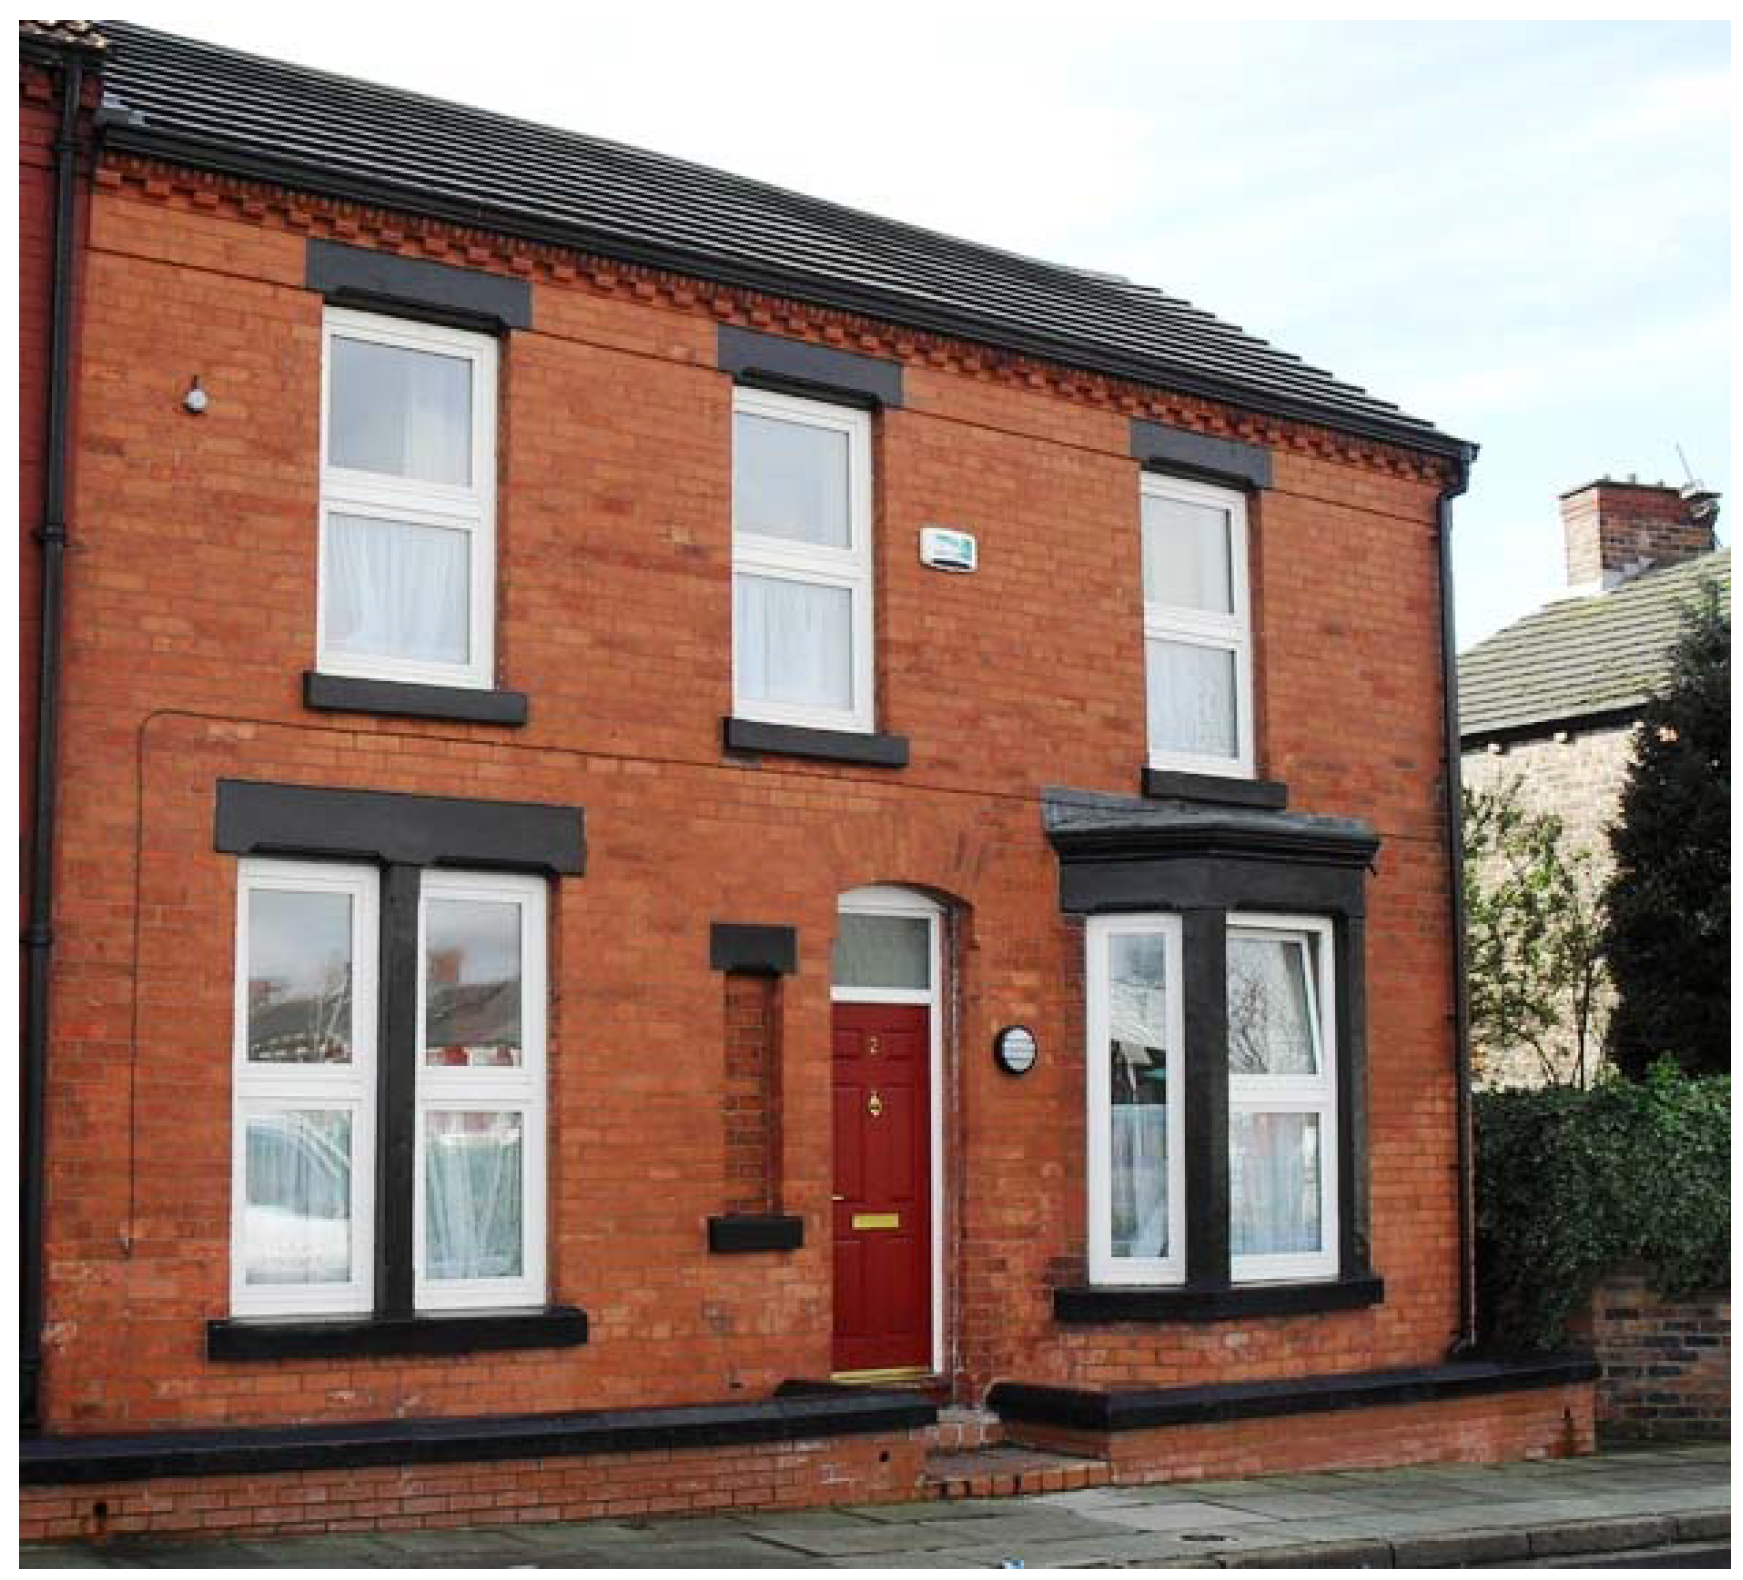
1.3. Case Study
- Maximum CO2 emissions—17 kg/m2yr;
- Maximum primary energy use—115 kWh/m2yr.


1.4. Research Objectives
2. Methodology
2.1. Modelling

| Element | Fabric U-value | |
|---|---|---|
| Insulated roof-100mm mineral wool | 0.40 W/m2K | |
| Solid Walls-215mm thick brick work | 2.10 W/m2K | |
| Typical existing construction | Uninsulated suspended timber floor | 0.50 W/m2K |
| Windows-single glazed timber frames | 4.80 W/m2K | |
| Doors-unglazed solid timber | 3.00 W/m2K |
| Element | Fabric U-value | |
|---|---|---|
| Insulated roof-400mm Rockwool | 0.15 W/m2K | |
| Solid wall-internal insulation (using Supa Wall) | 0.11 W/m2K | |
| Upgraded fabric construction | Concrete floor slab, Supa floor panels | 0.12 W/m2K |
| Windows-triple glazed | 0.78 W/m2K | |
| FD20 rated fire doors in frames containing intumescent seals | 1.00 W/m2K |
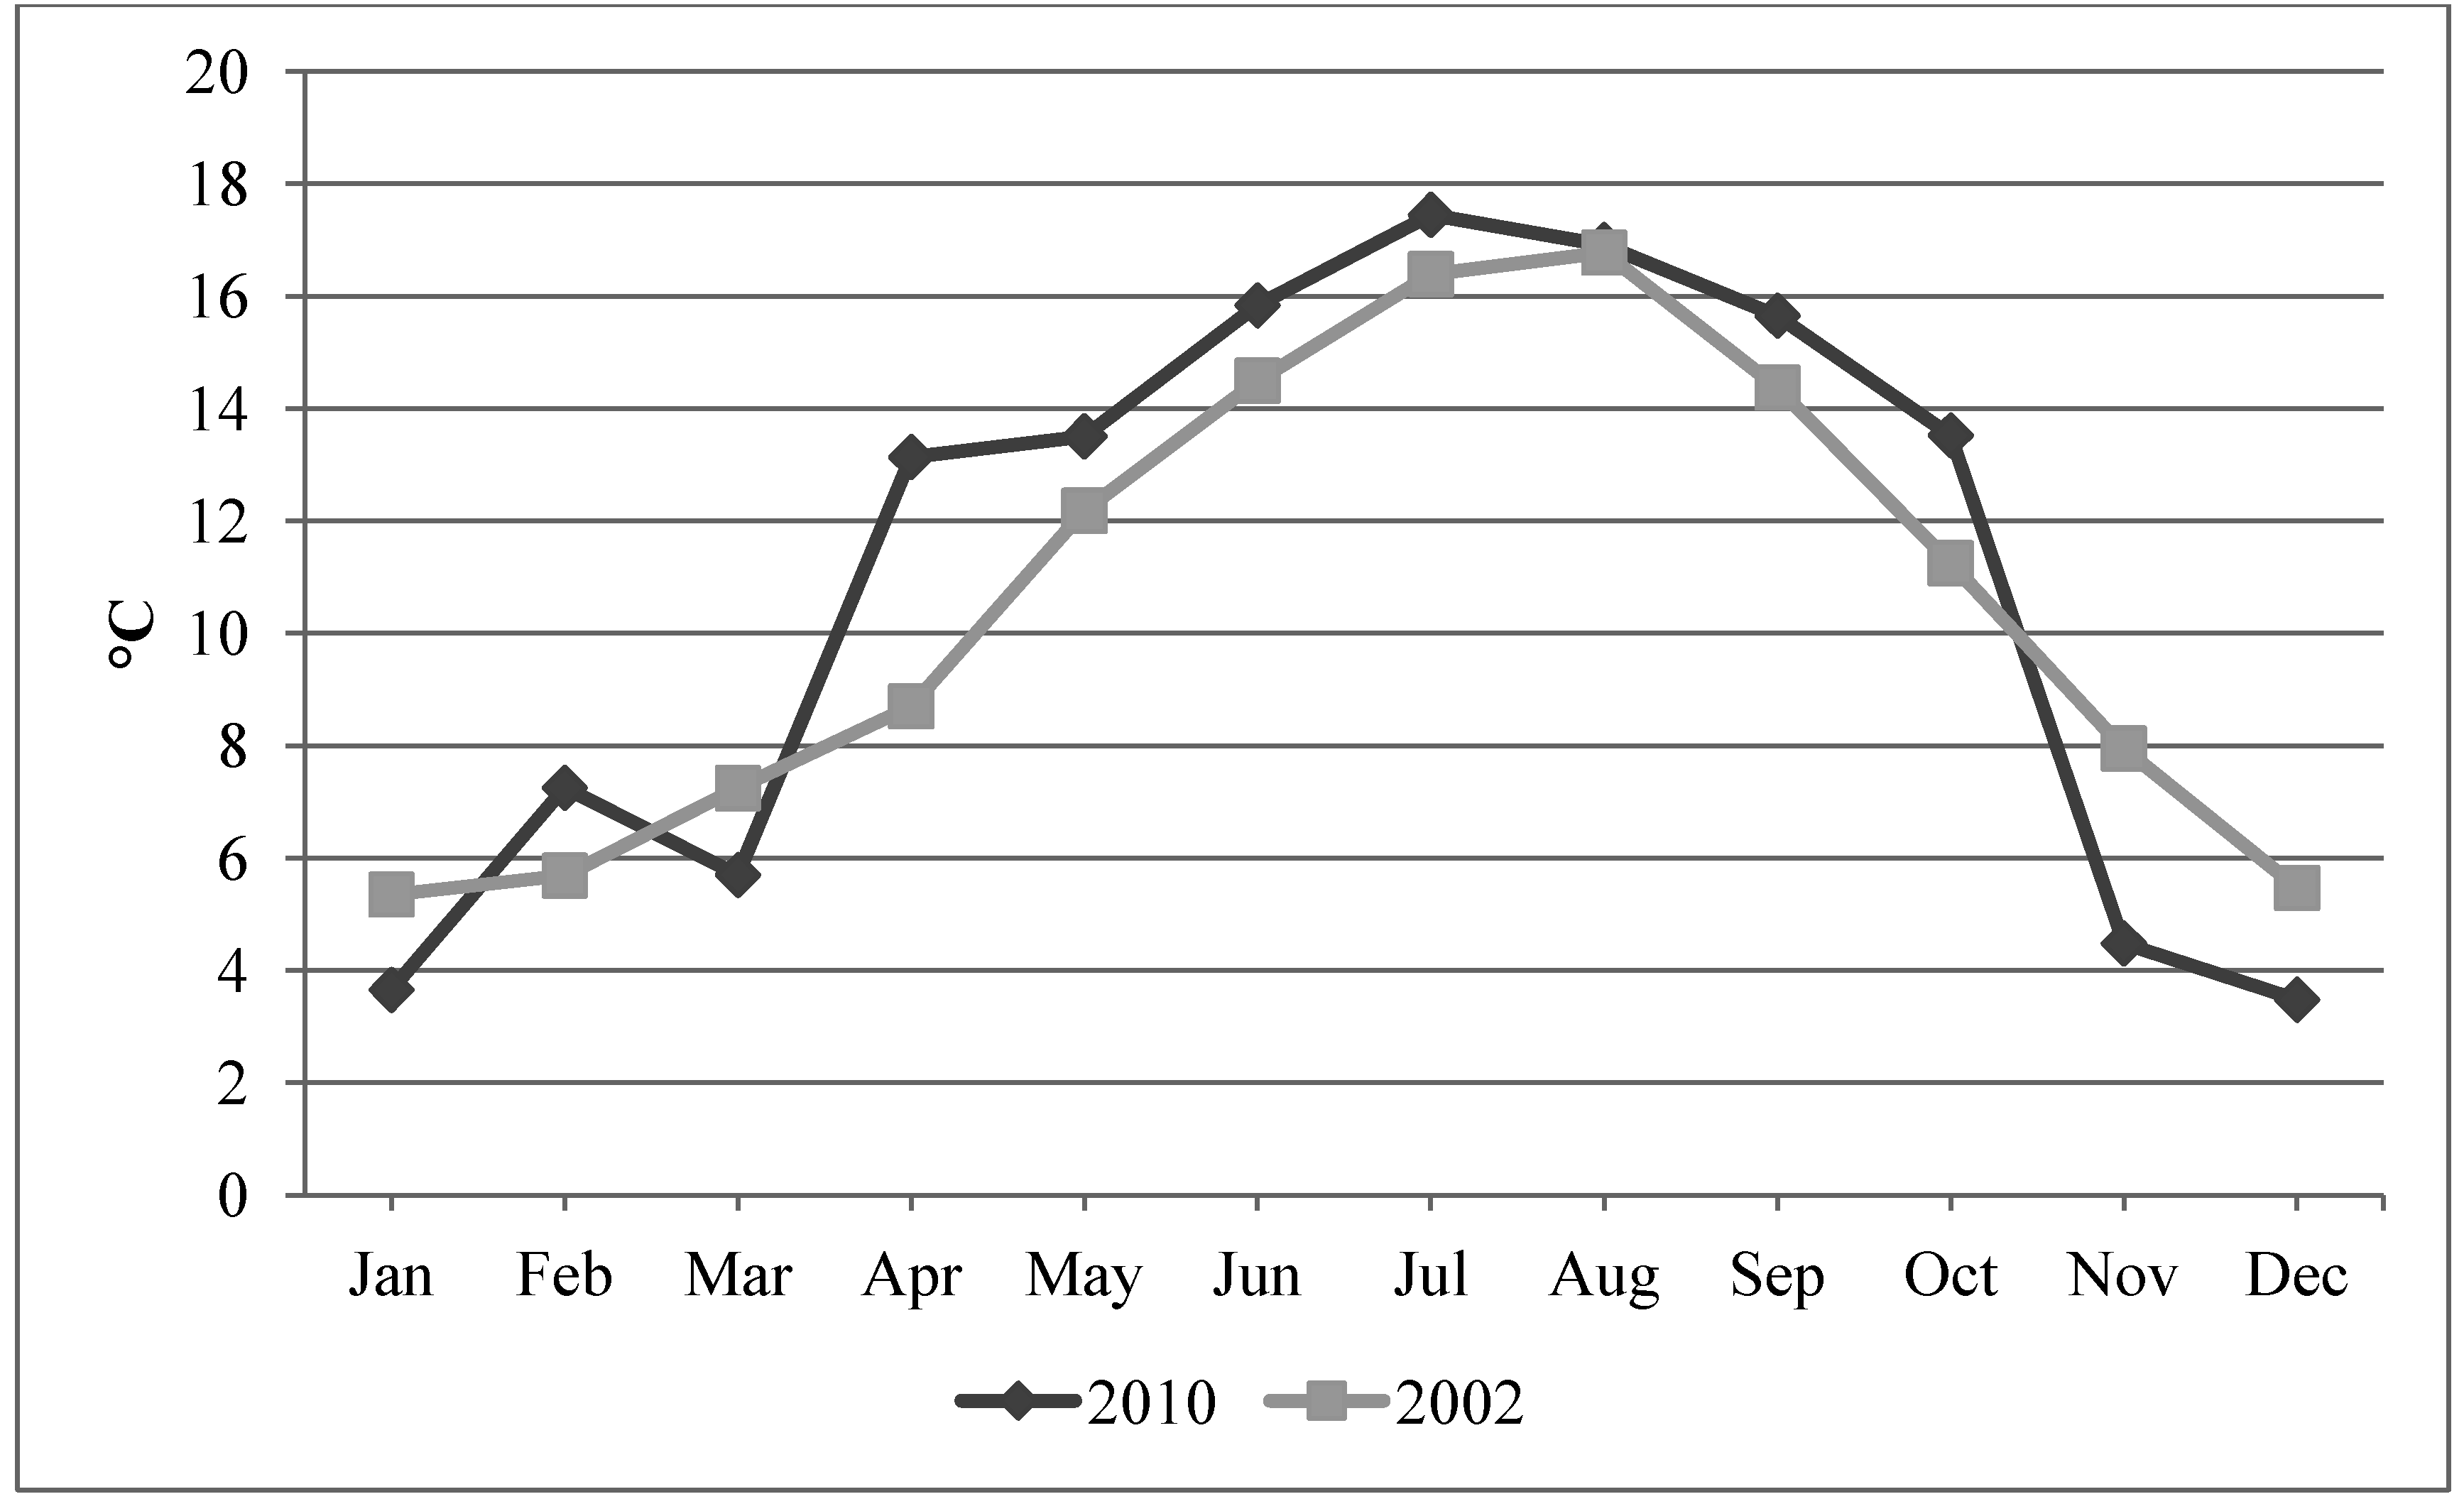
2.2. Weather Data for Simulation
2.3. Model Validation
| Measures | PHPP | DesignBuilder |
|---|---|---|
| Annual CO2 emissions (kg CO2/m2yr) | 77 | 72 |
| Primary energy requirement (kWh/m2yr) | 380 | 320 |

| Measures | Monitored | DesignBuilder |
|---|---|---|
| Annual CO2 emissions (kg CO2/m2yr) | 16 | 18 |
| Primary energy requirement (kWh/m2yr) | 105 | 119 |
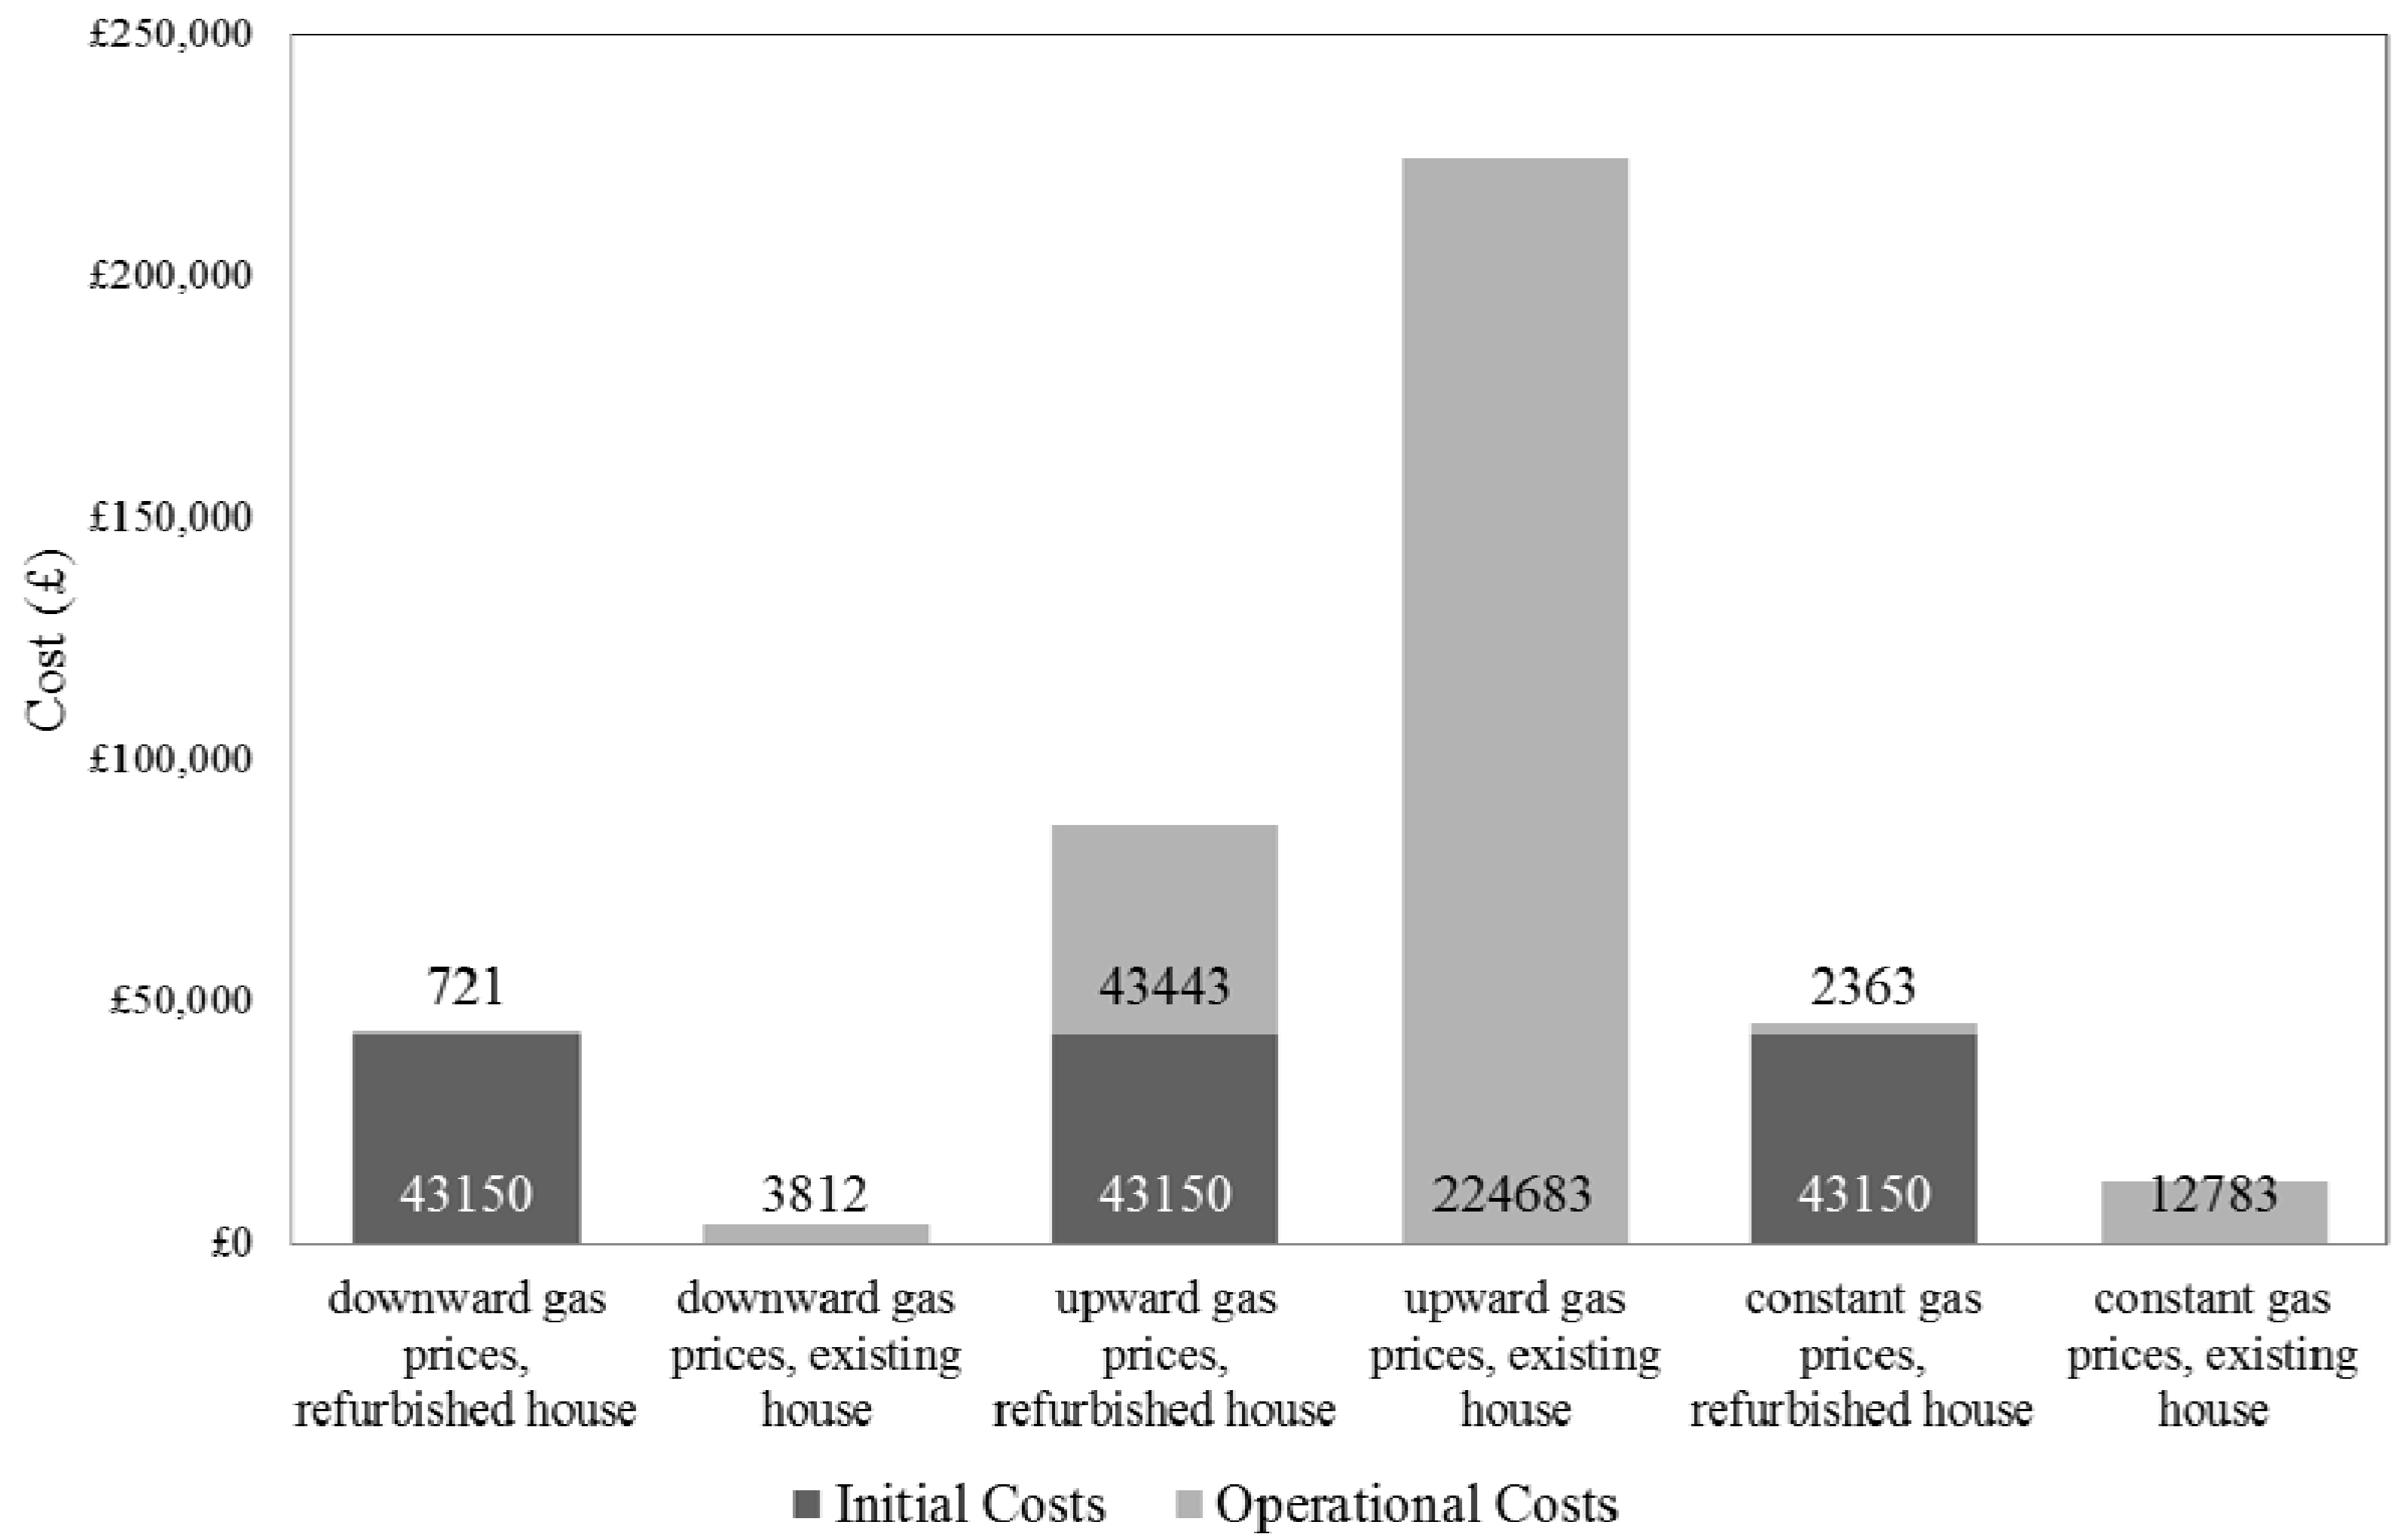
2.4. Whole Life-Cycle Costing
2.4.1. Definition
2.4.2. Total Initial Costs Inputs
| Item | Material | Labor | Total |
|---|---|---|---|
| Insulation | £ 12,000 | £ 7,000 | £ 19,000 |
| New roof | £ 1,950 | £ 2,000 | £ 3,950 |
| Triple glazing and doors | £ 18,200 | £ 2,000 | £ 20,200 |
| Total initial cost of construction | - | - | £ 43,150 |
2.4.3. Operating Cost Inputs
2.4.4. Heating Energy Savings
2.4.4.1. Effect of Climate Change on Annual Savings
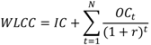
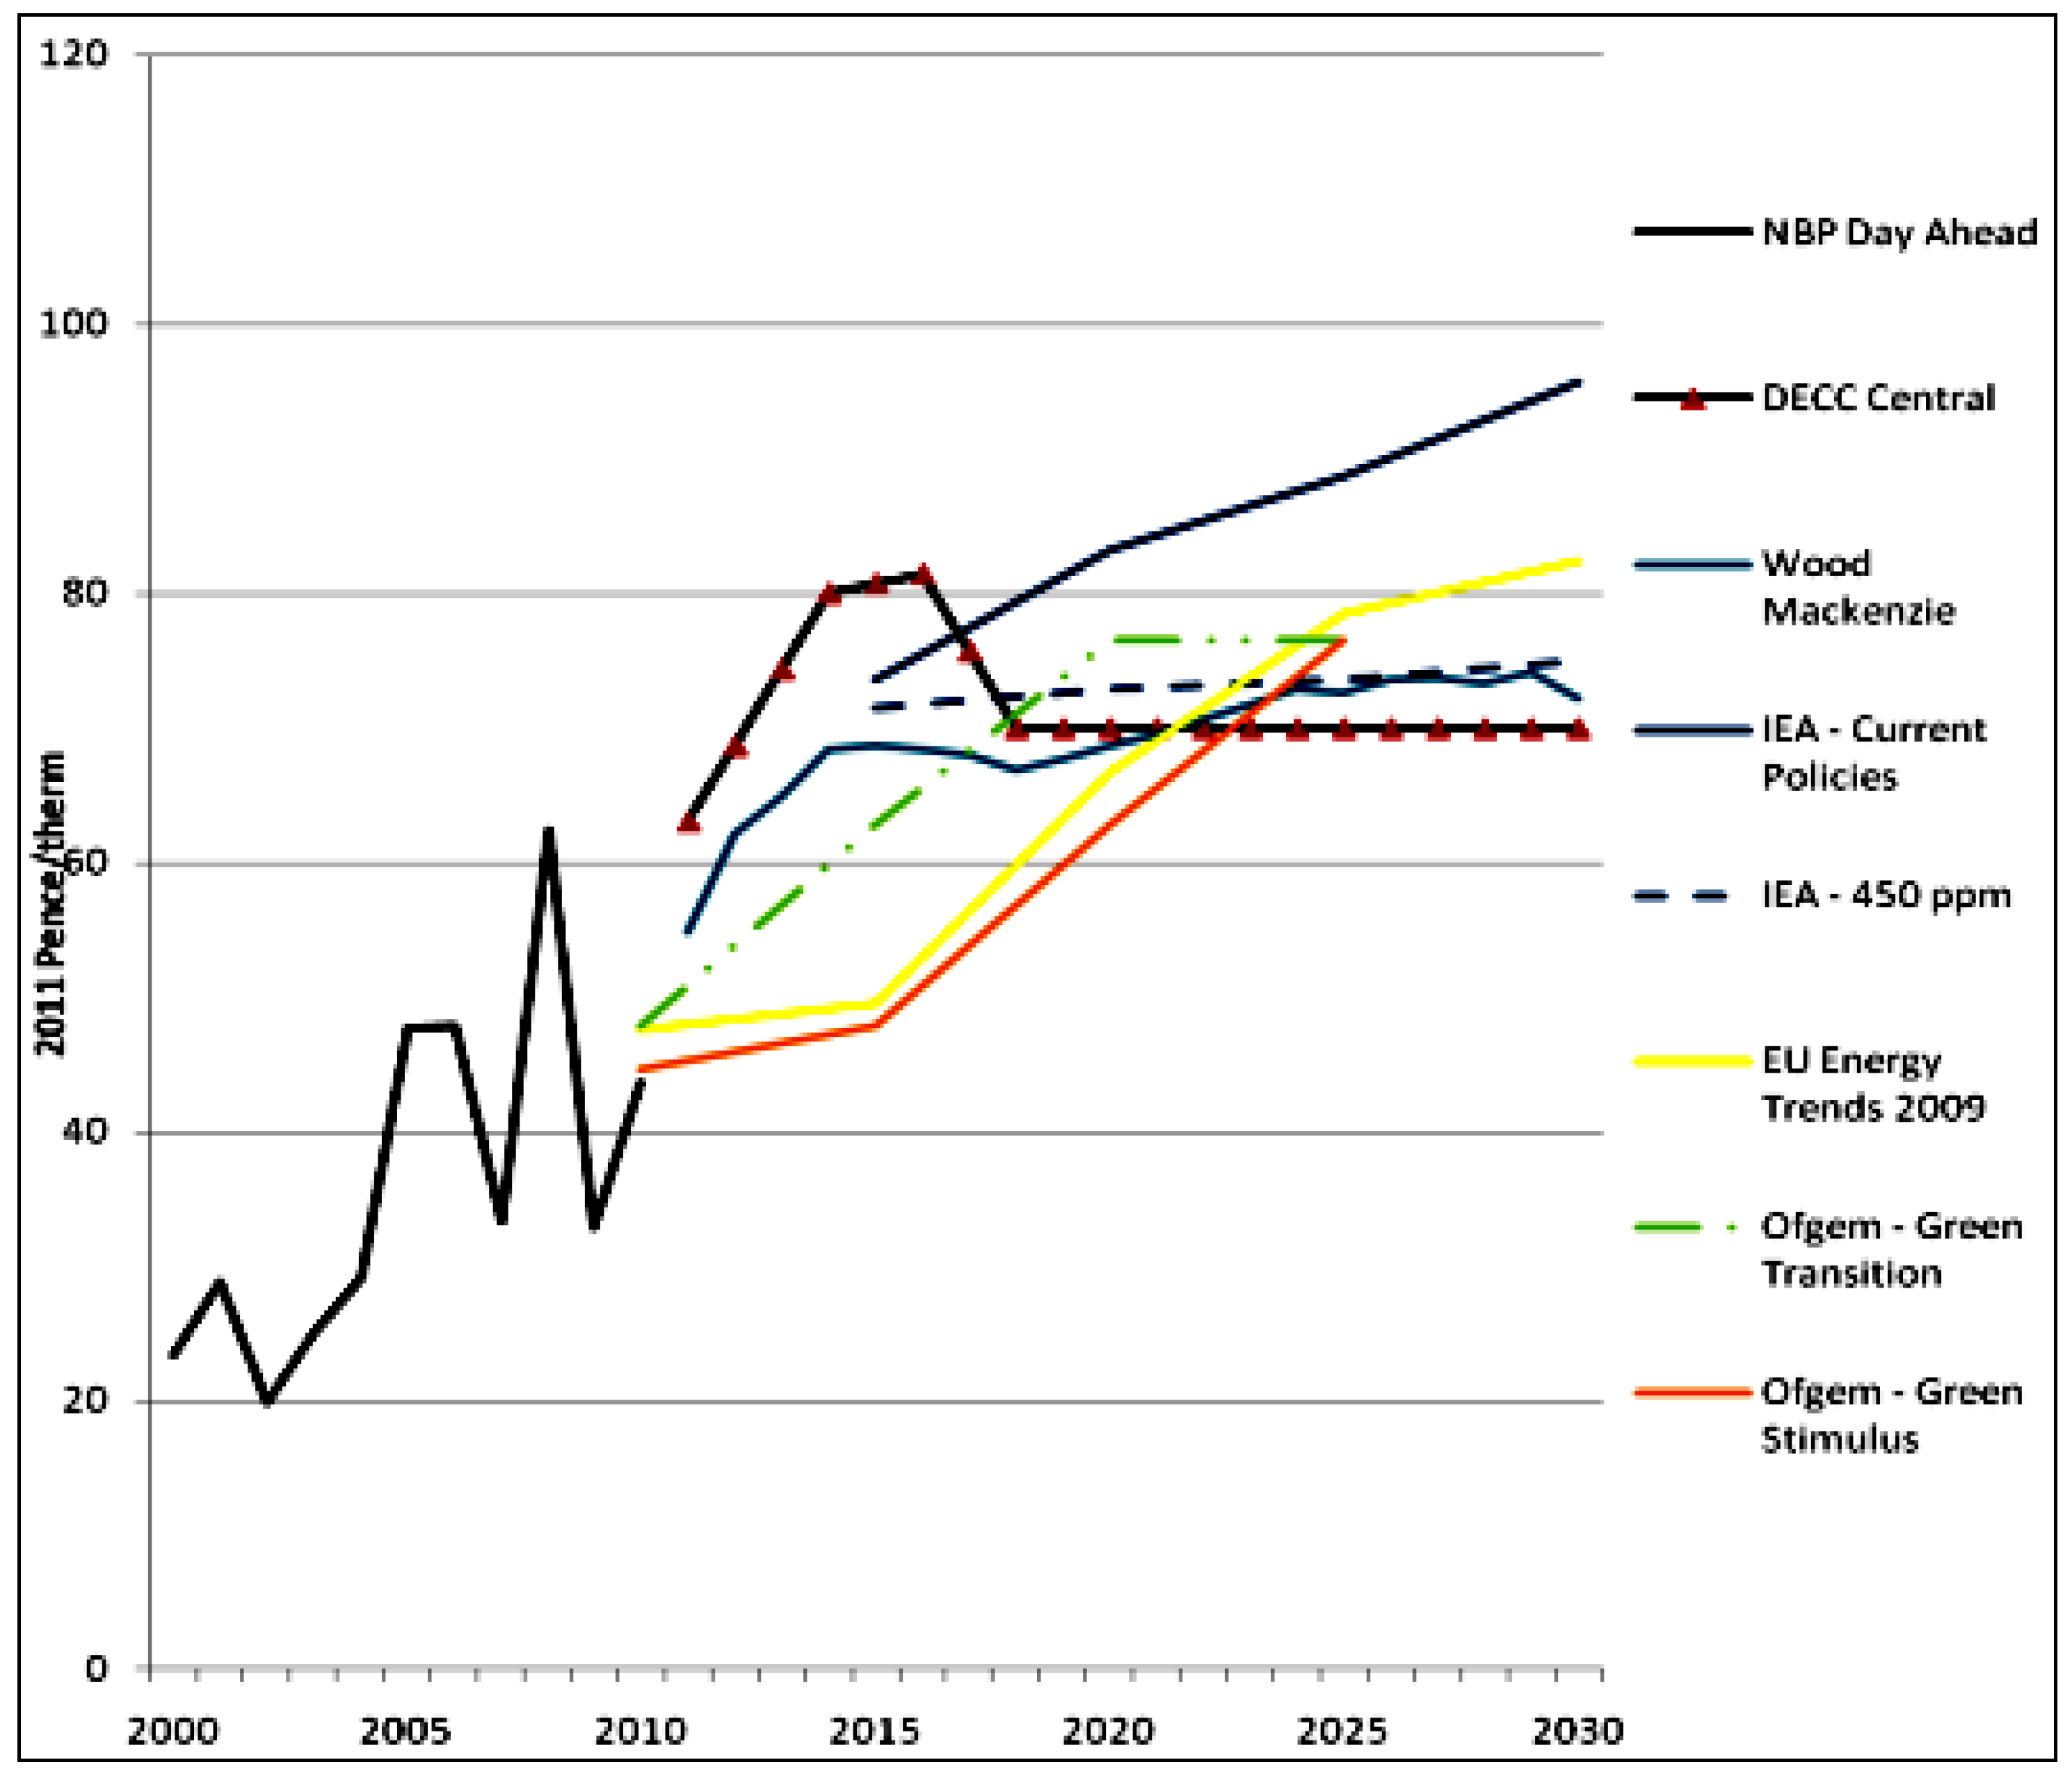
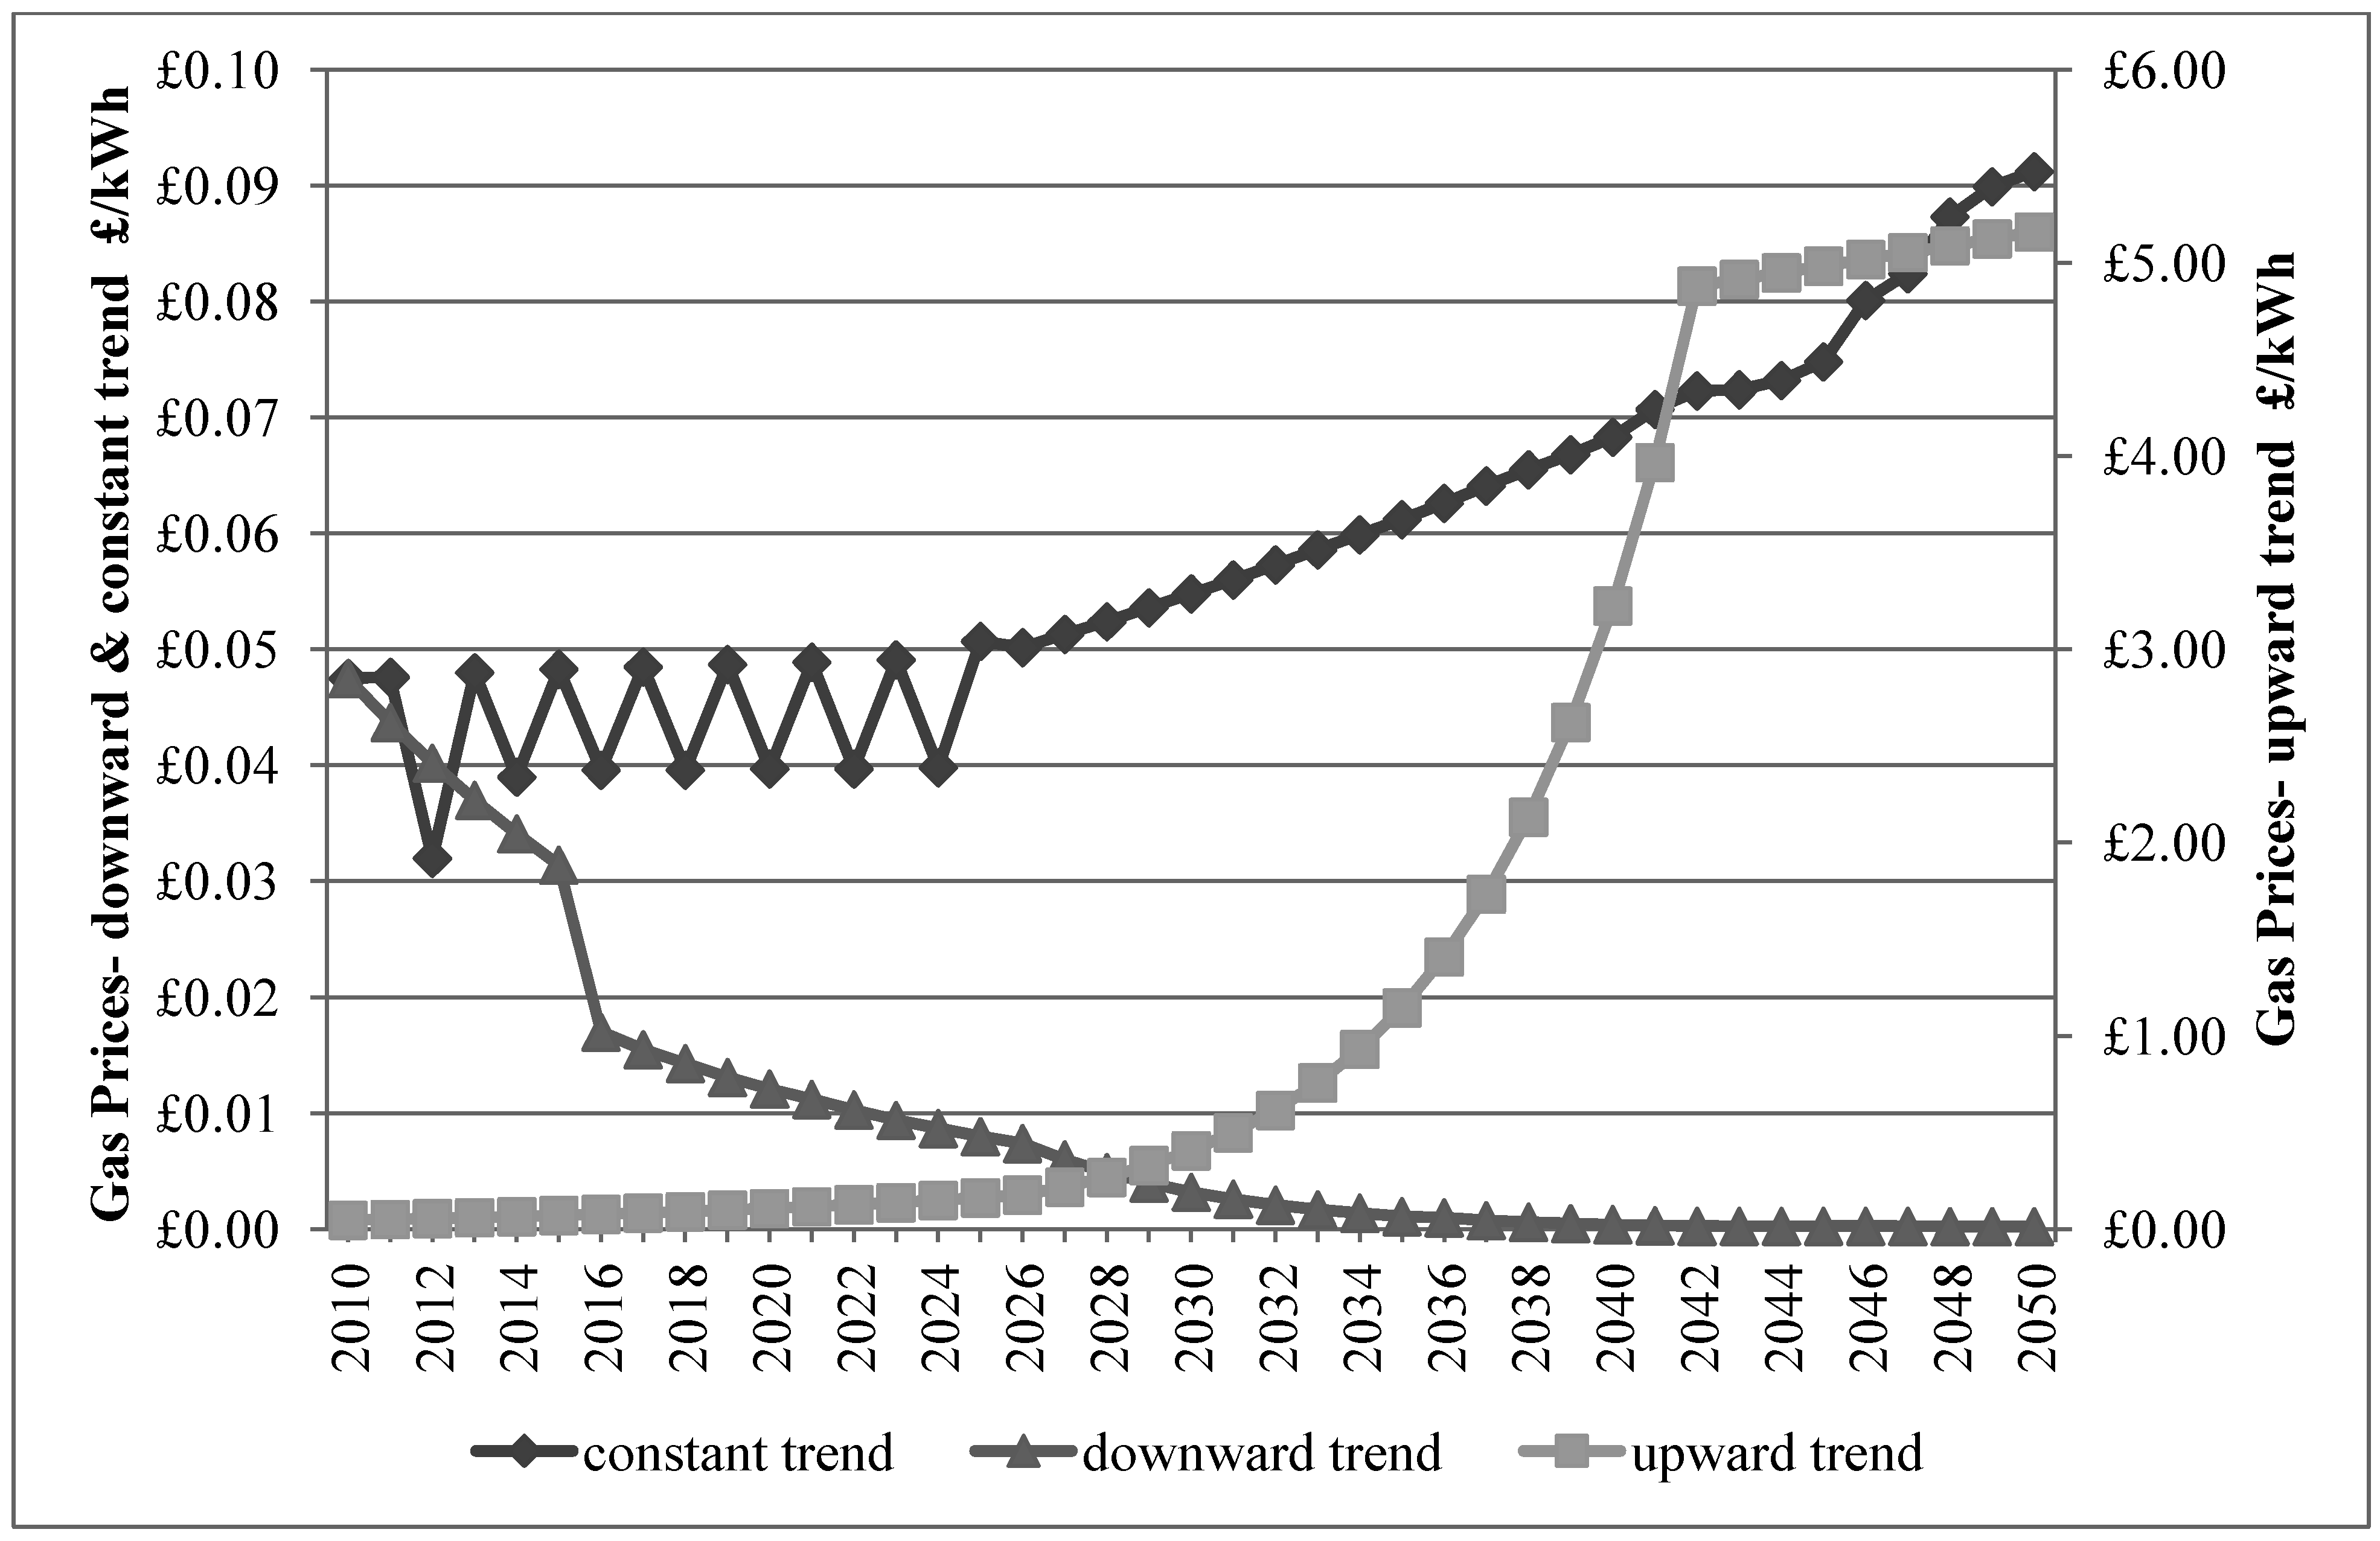
2.4.4.2. Instability of Future Gas Price and Annual Savings
| Increase in unit costs due to | Gas% | |
|---|---|---|
| Whole sale energy | 66 | |
| Transmission, distribution and metering | 20 | |
| Carbon price | - | |
| Estimated increase in annual bill | Renewables | - |
| Energy efficiency funding | 7 | |
| VAT | 5 | |
| Overall price increase | 121 | |
| Estimated increase in annual bill (2004 to 2010) | £295 |
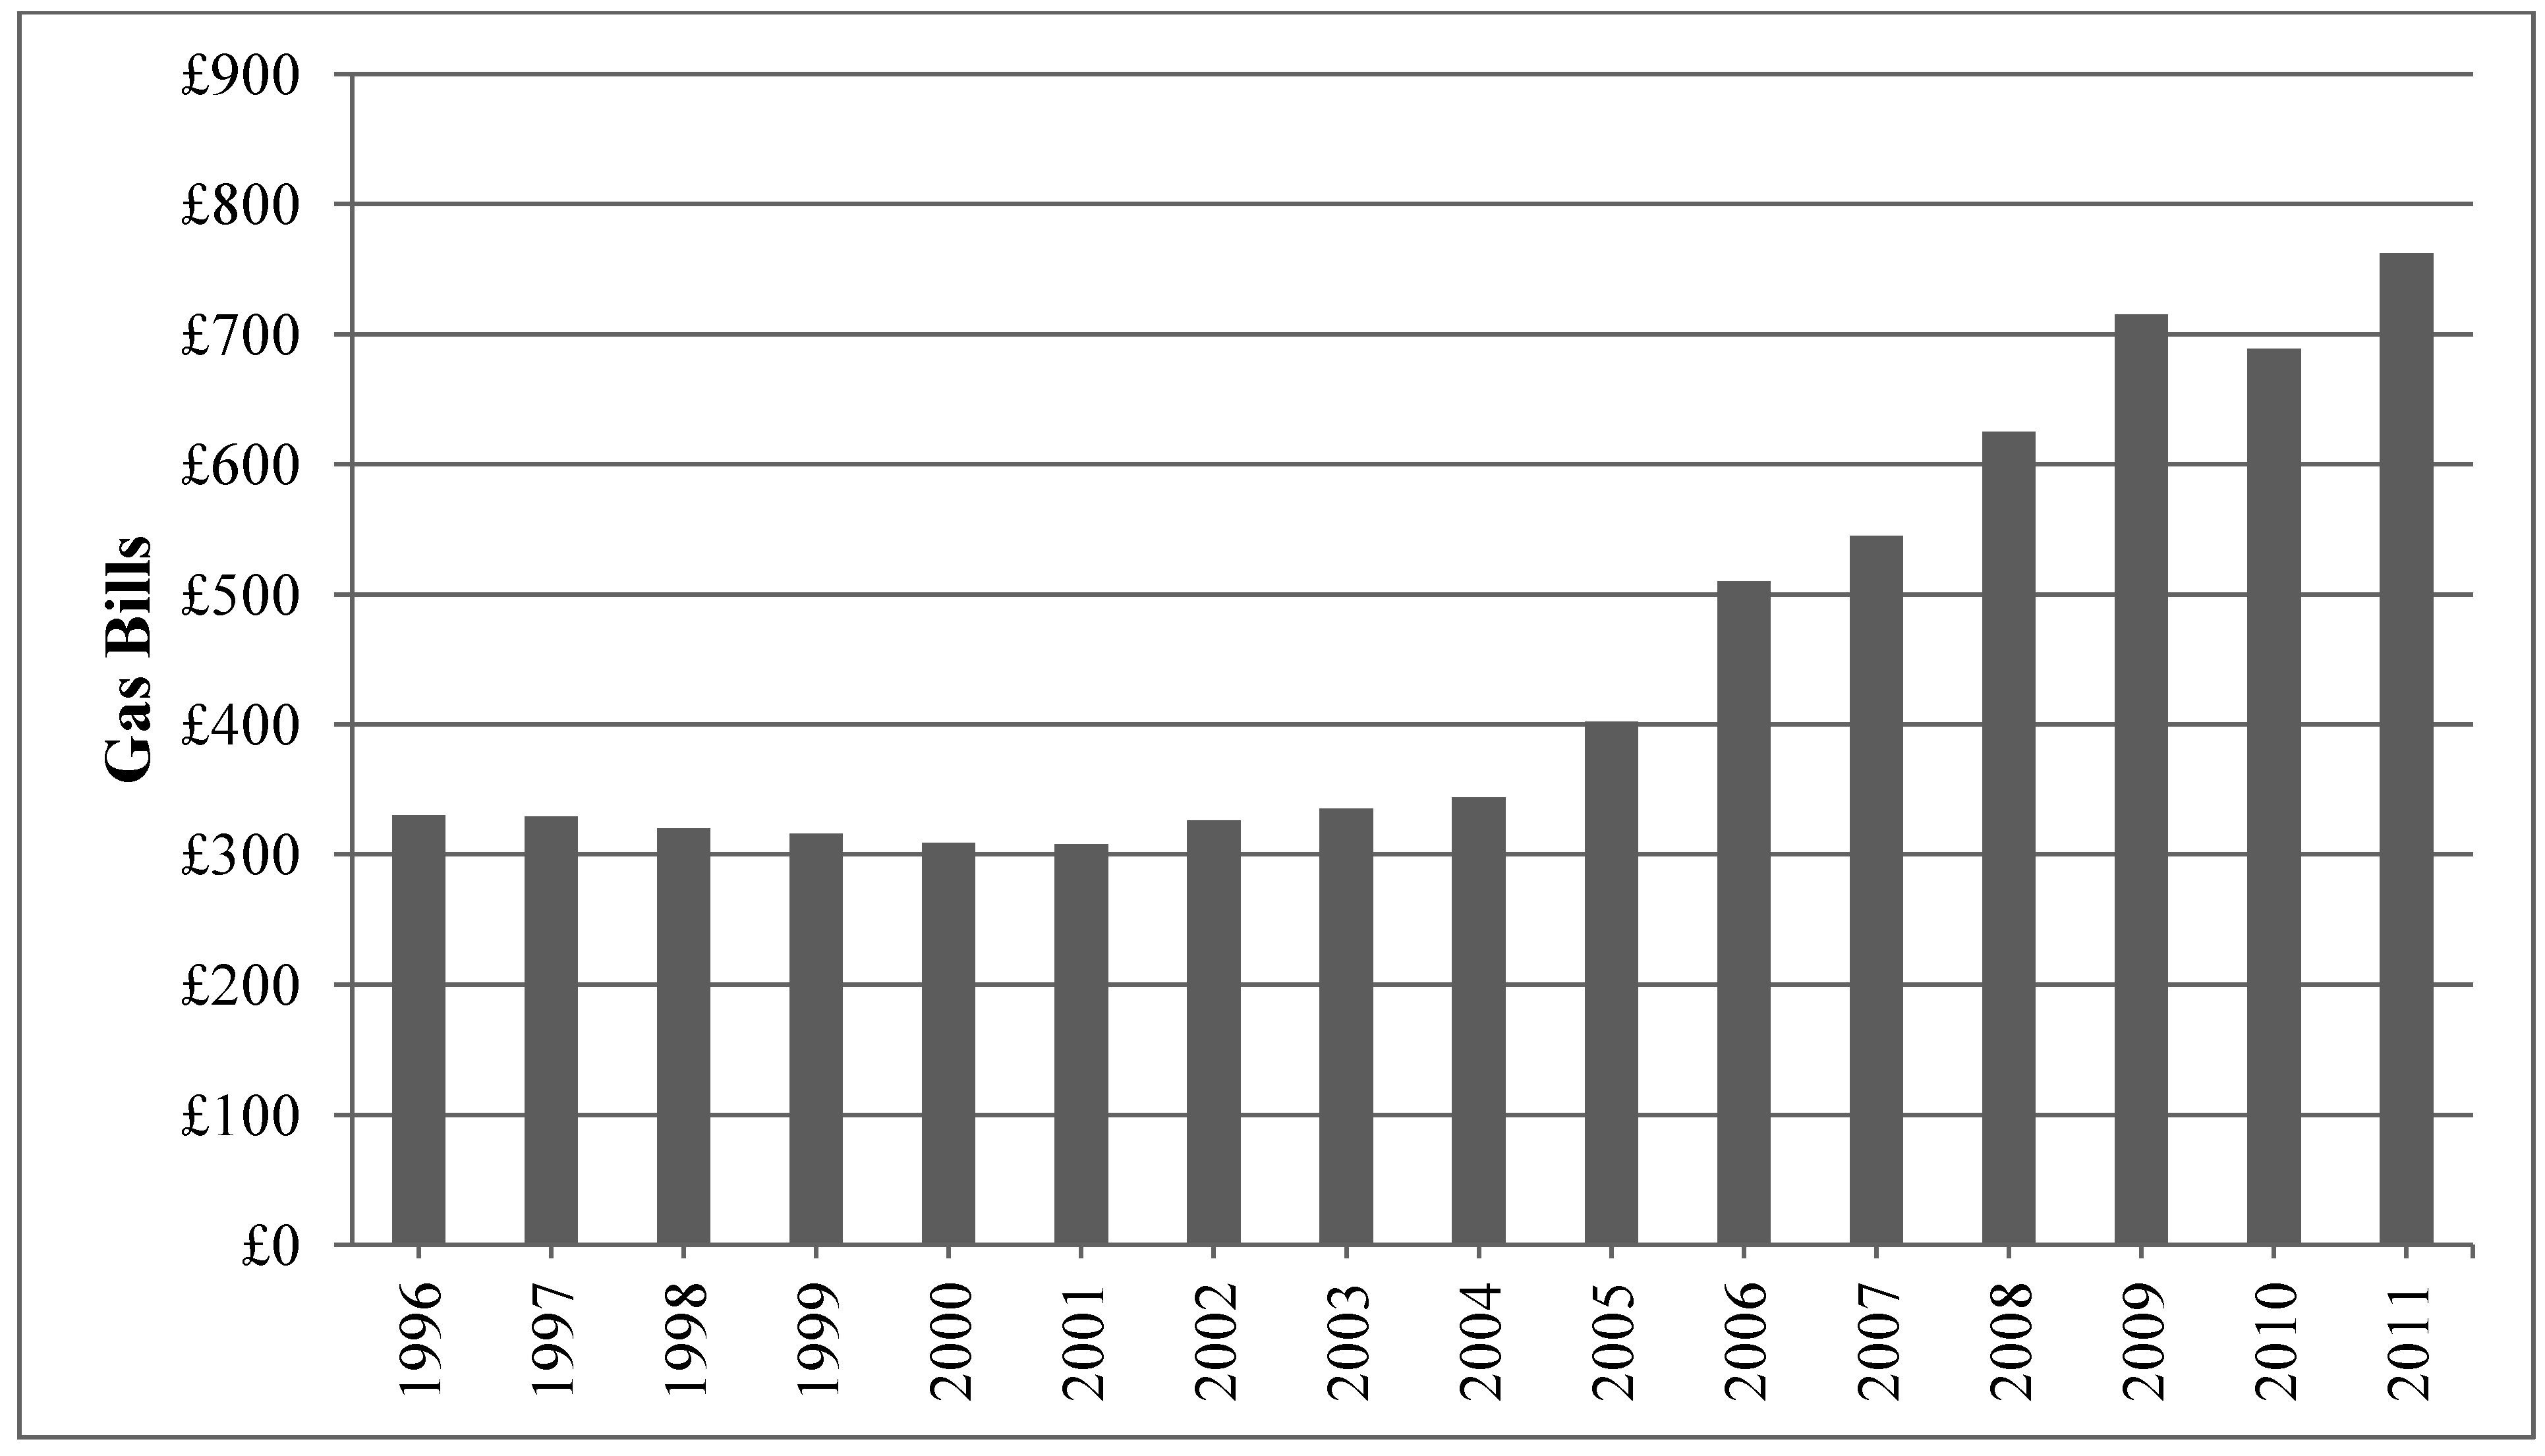
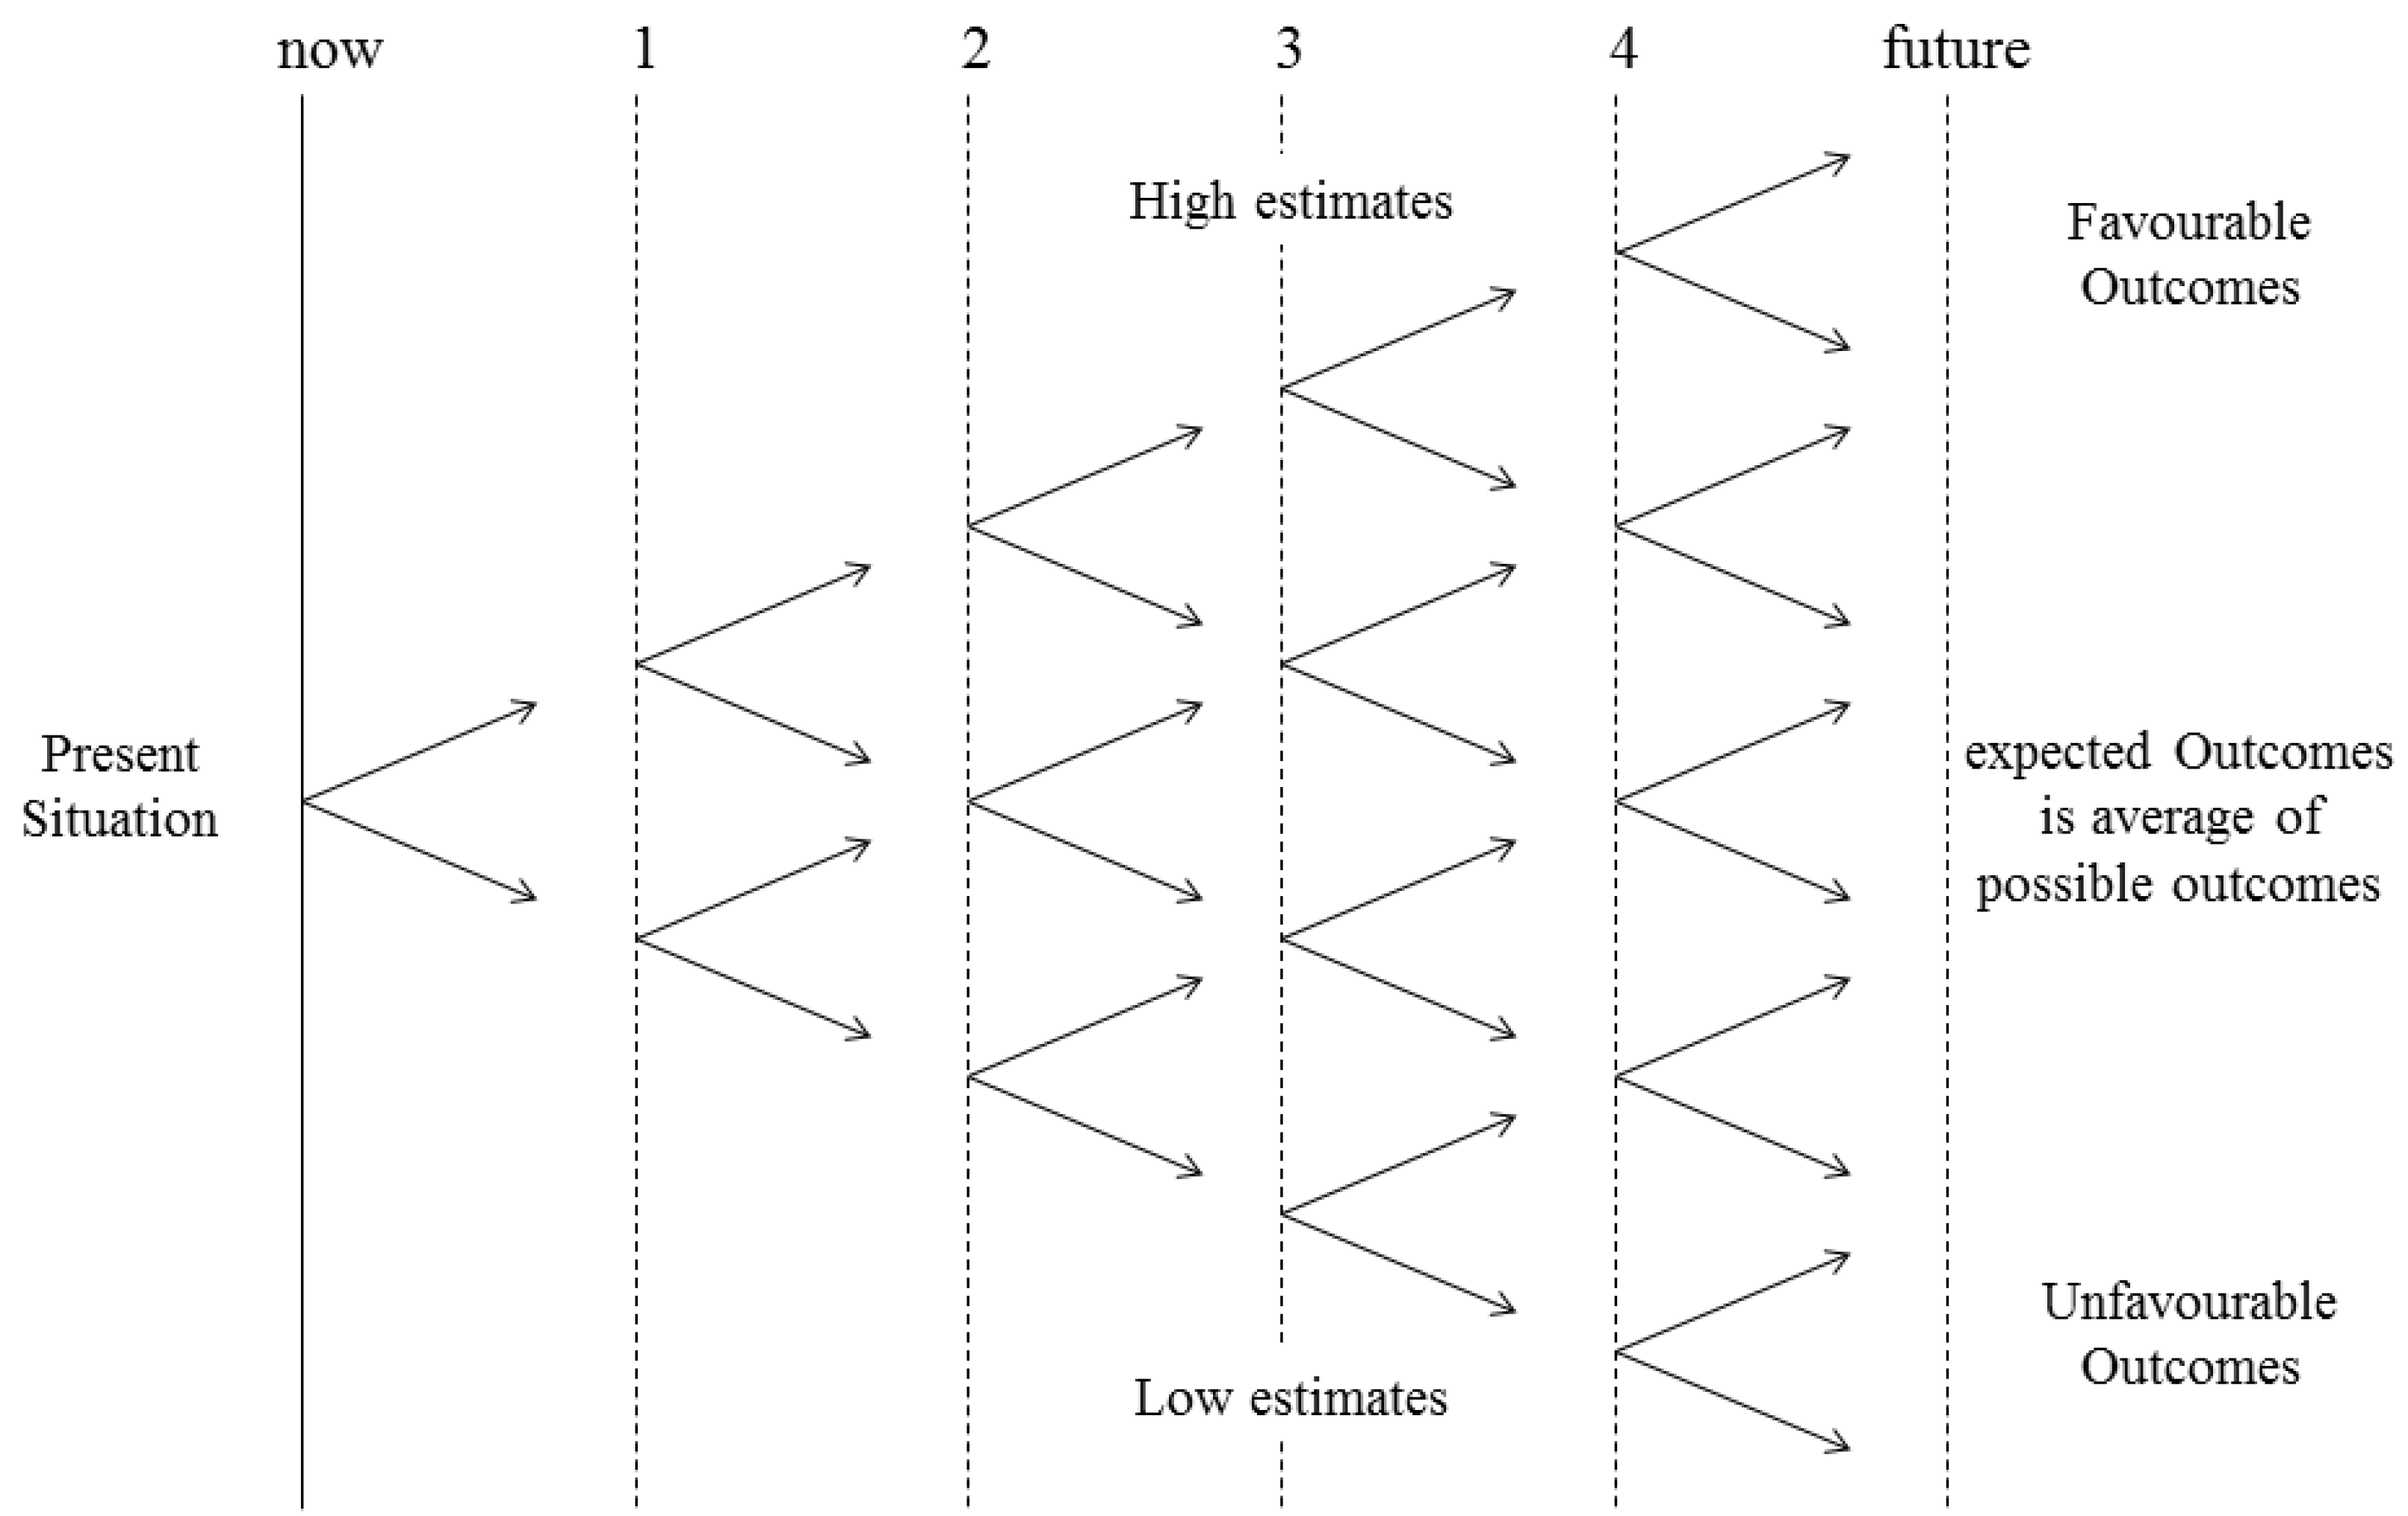
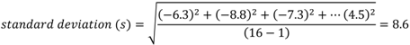
2.4.5. Standard Deviation and Binomial Tree
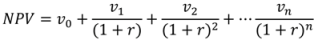
2.4.6. Time Preference, Discount Rate and Net Present Value
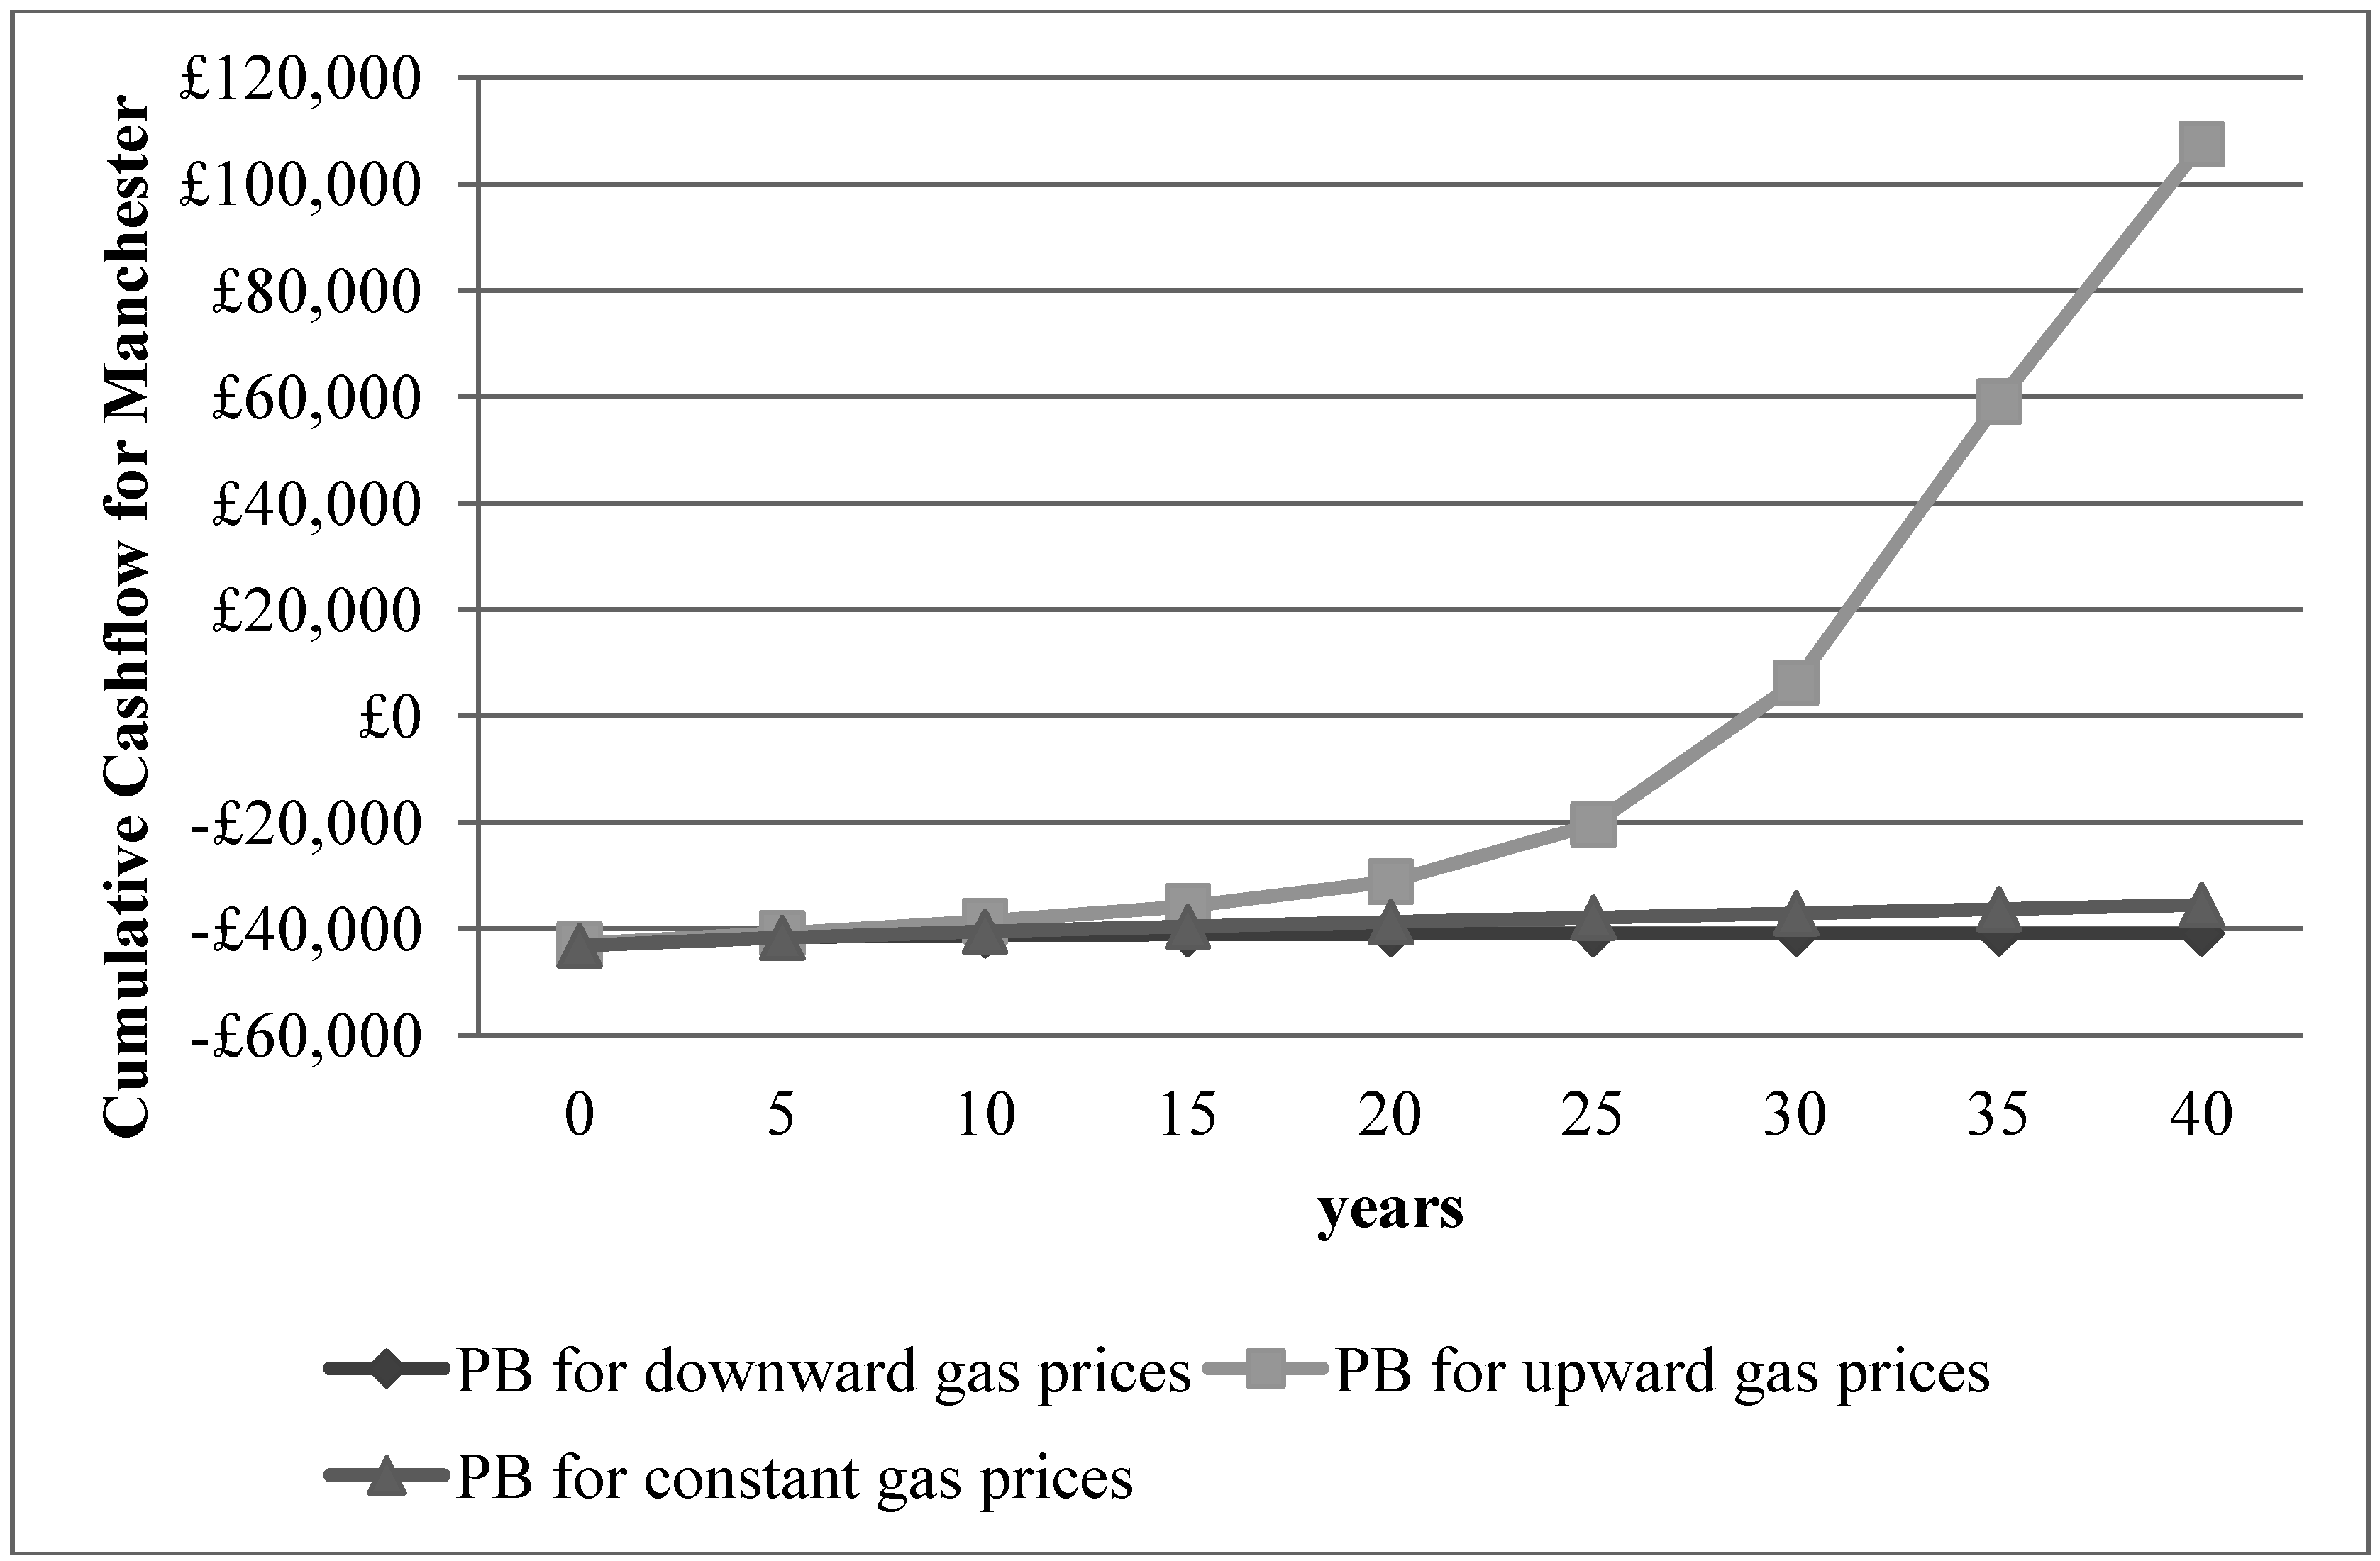
2.4.7. Payback Period
3. Results and Discussion
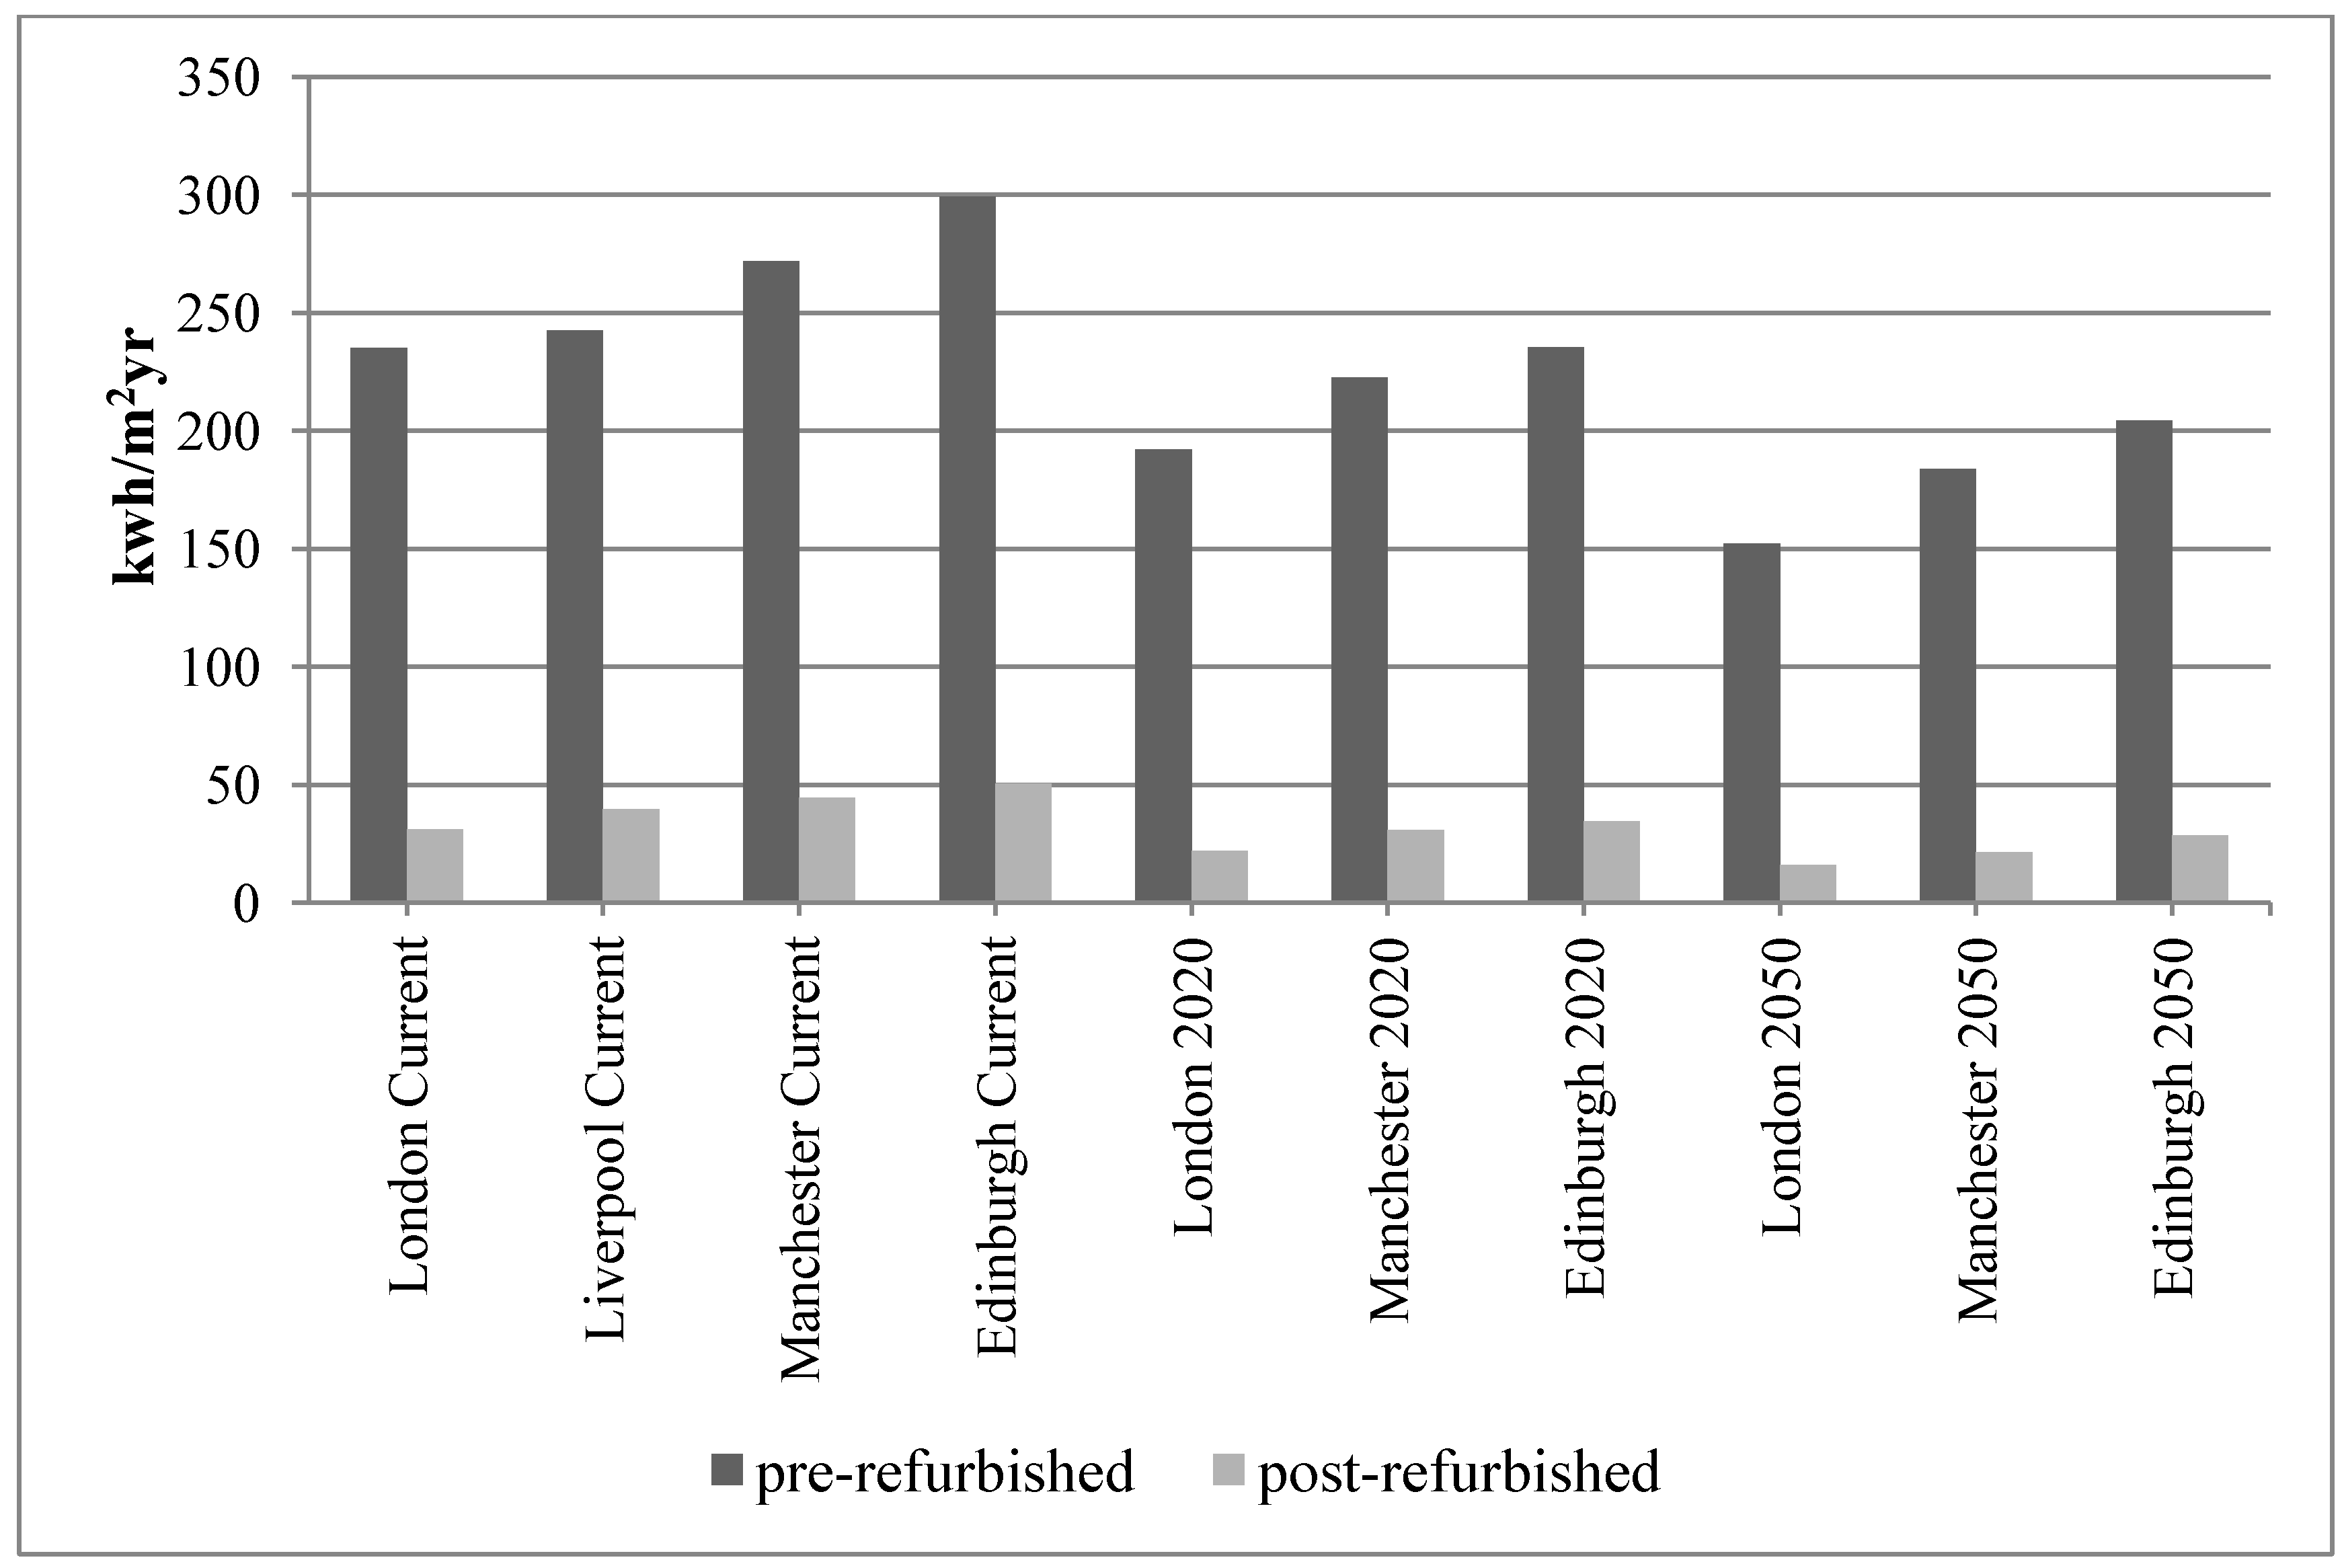
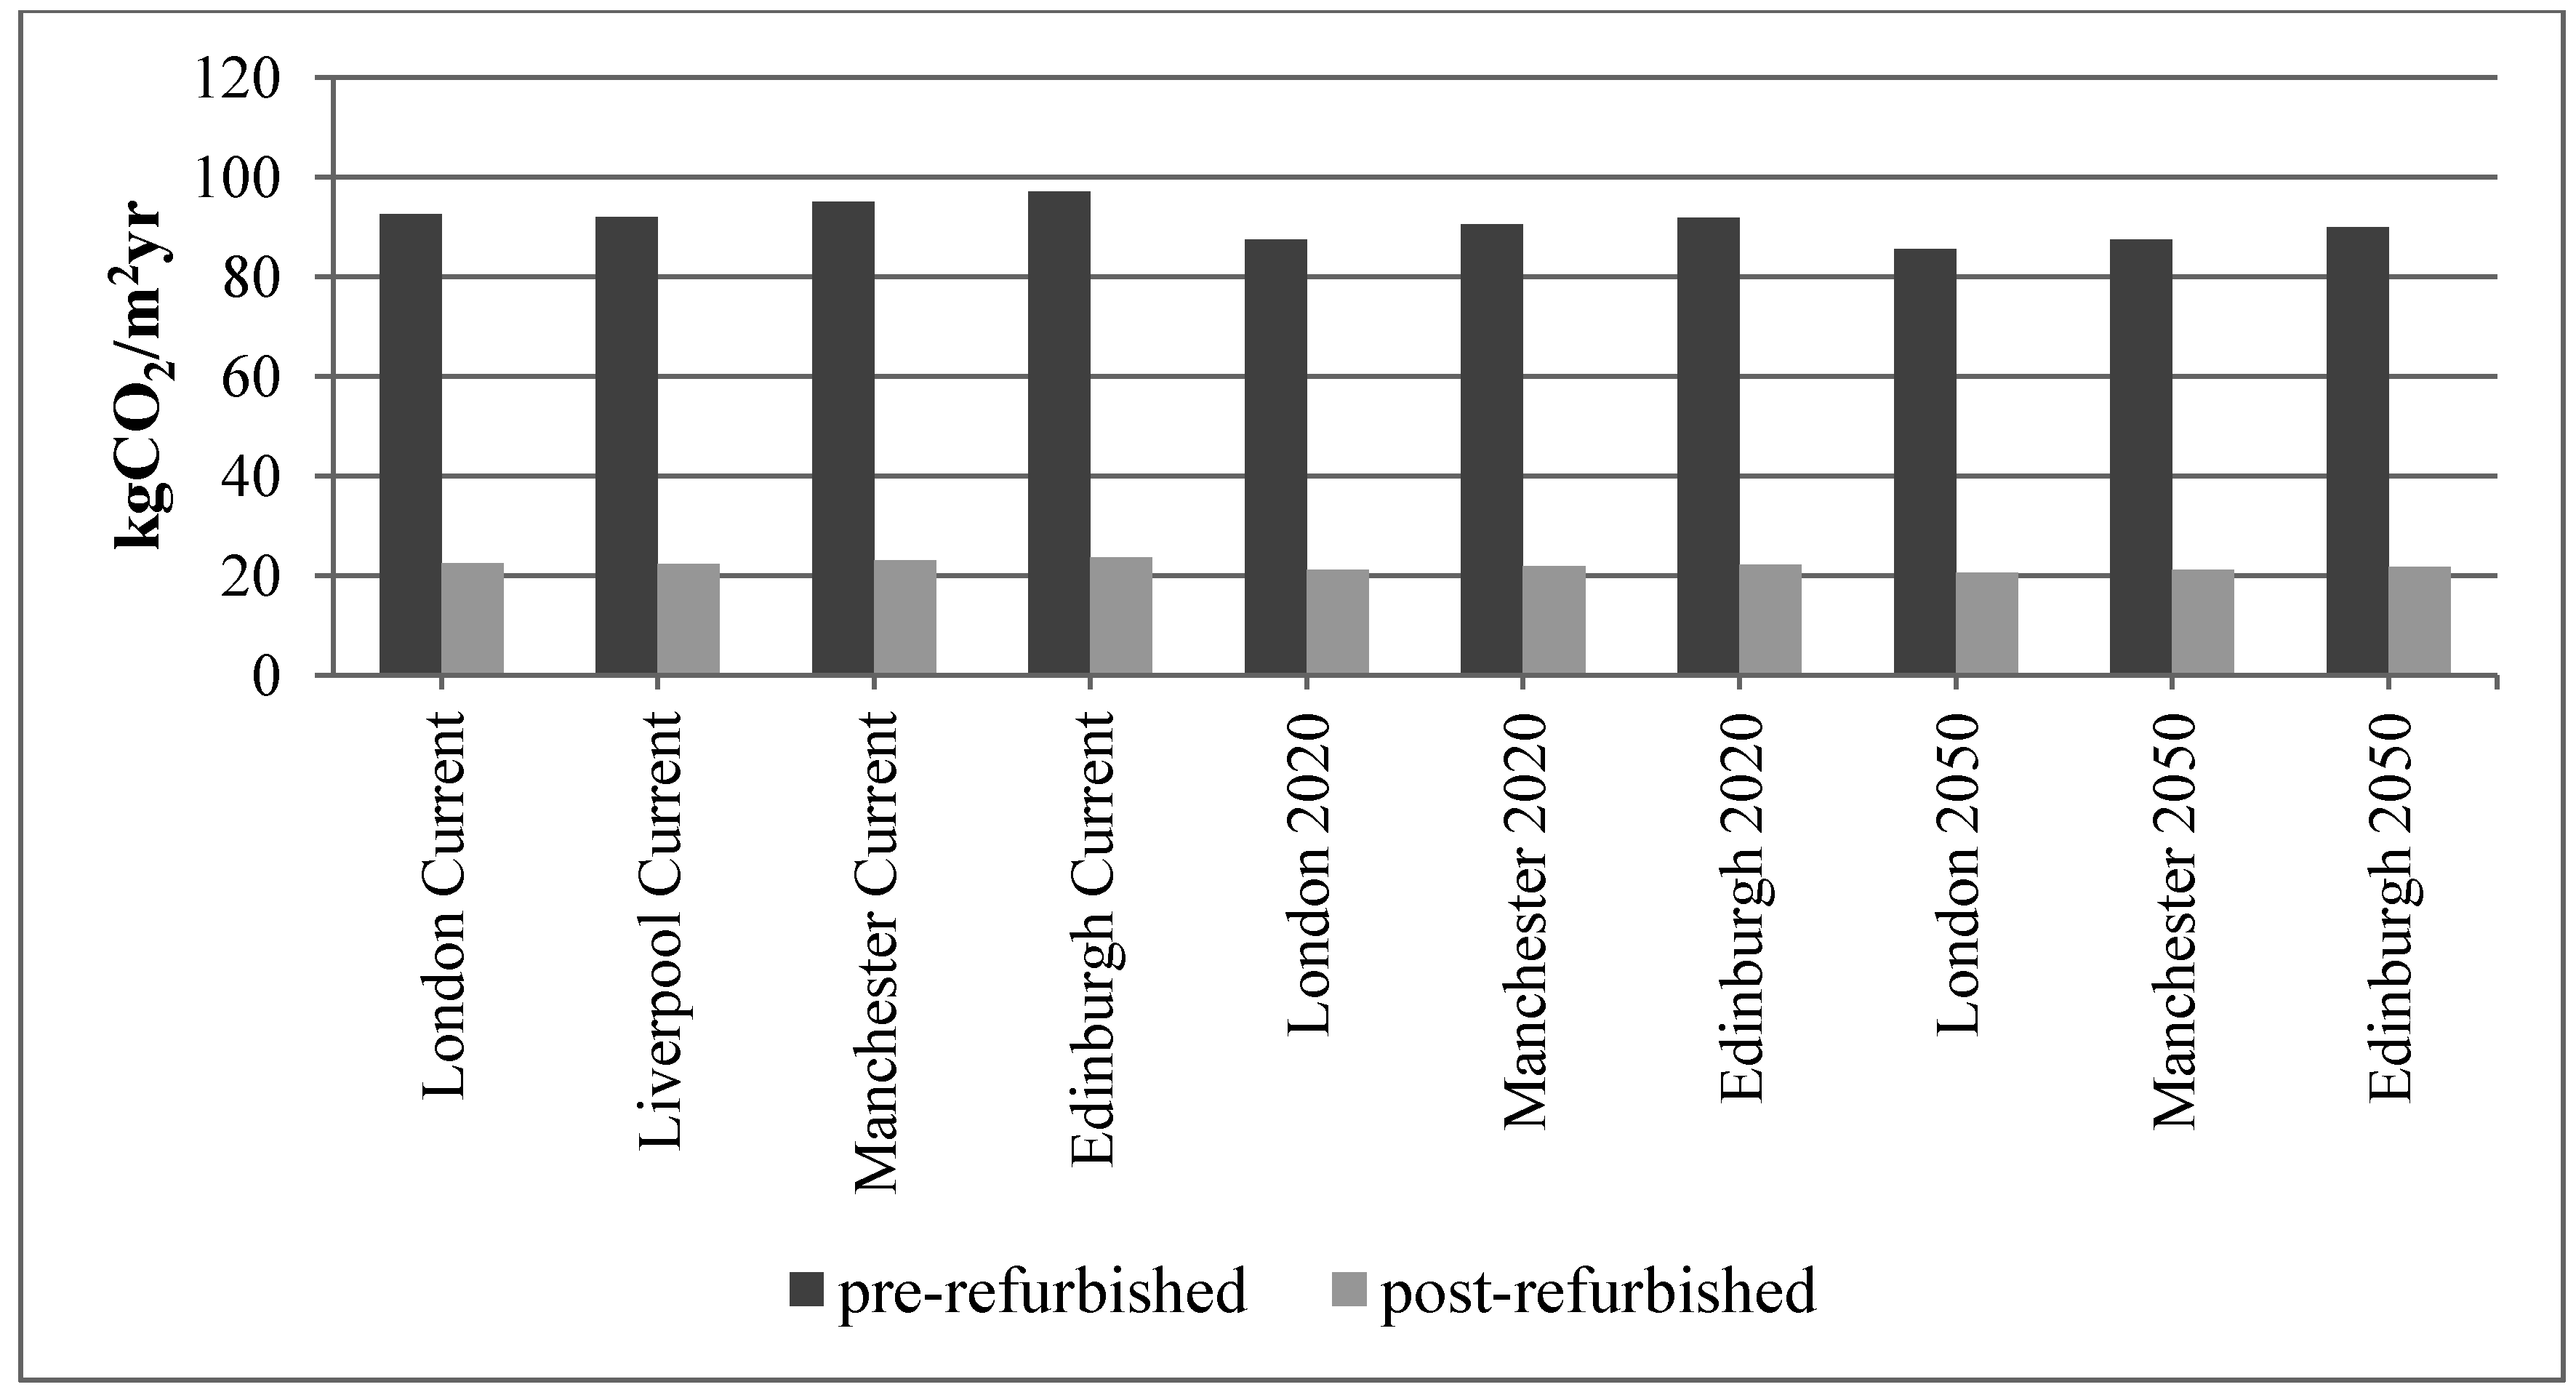
3.1. Effect of the Terraced House’s Eco-Refurbishment on Heating Consumption and CO2 Emissions for Current and Future Weather Conditions


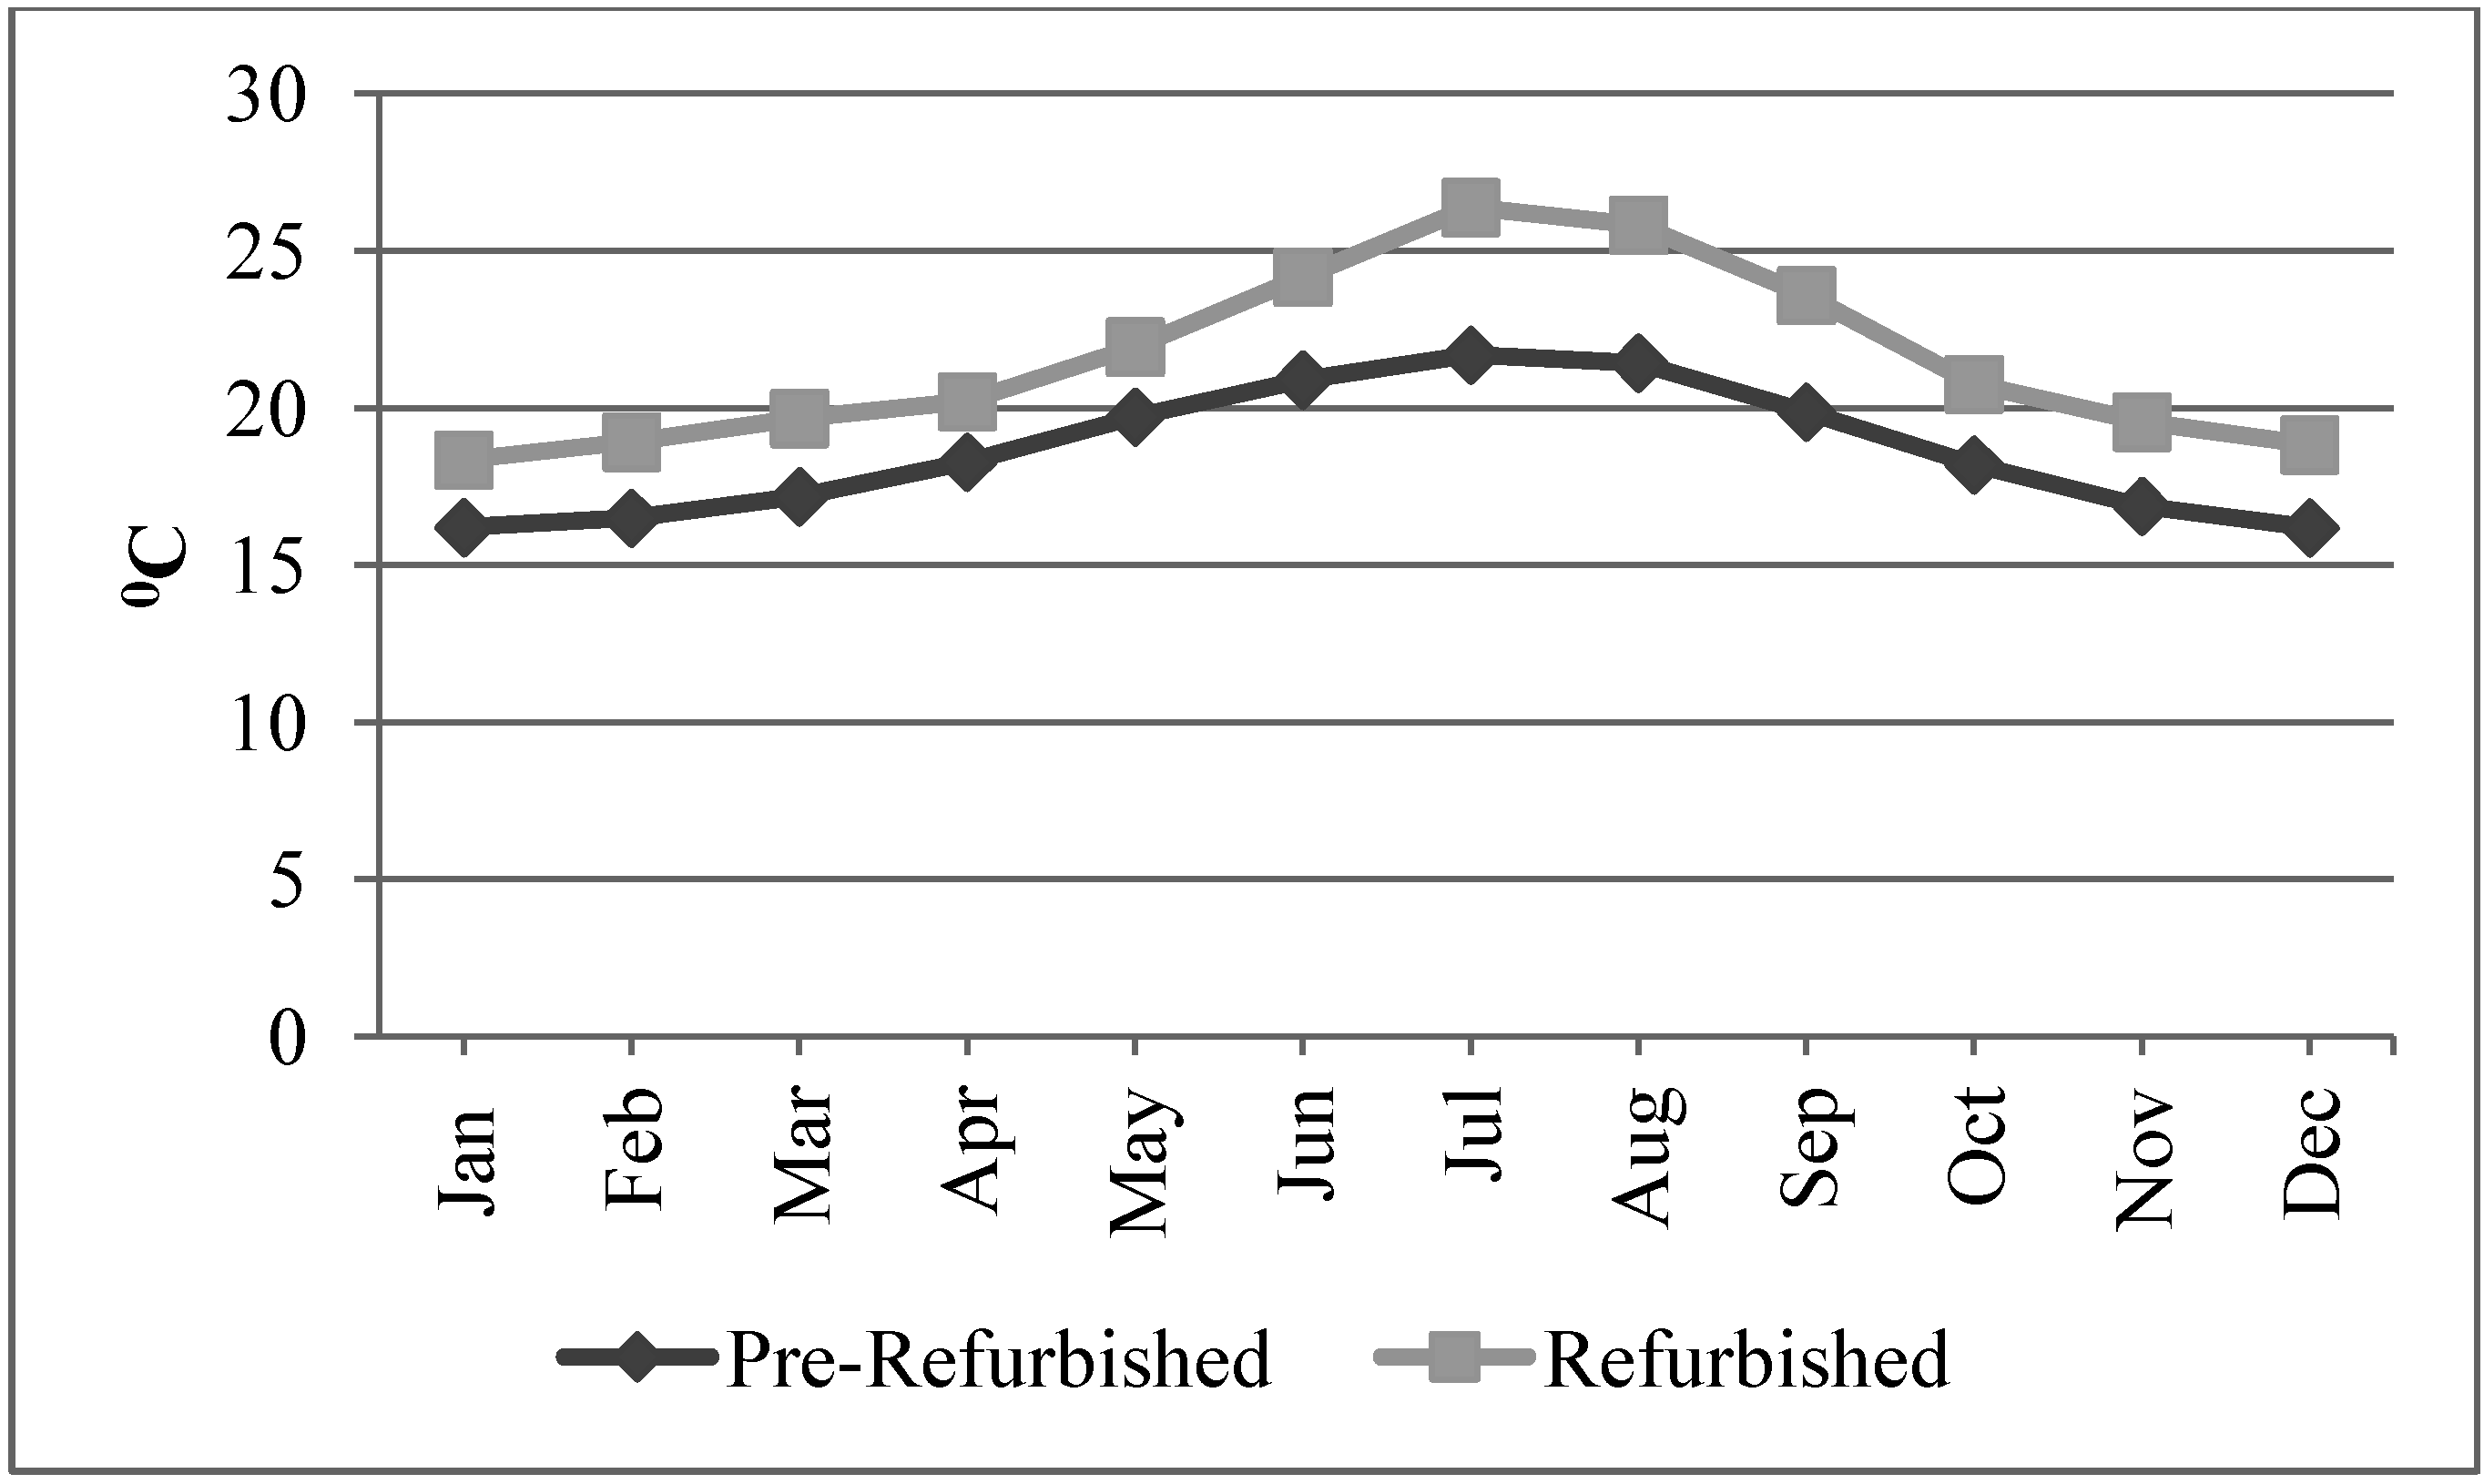
3.2. Summer and Winter Discomfort Hours
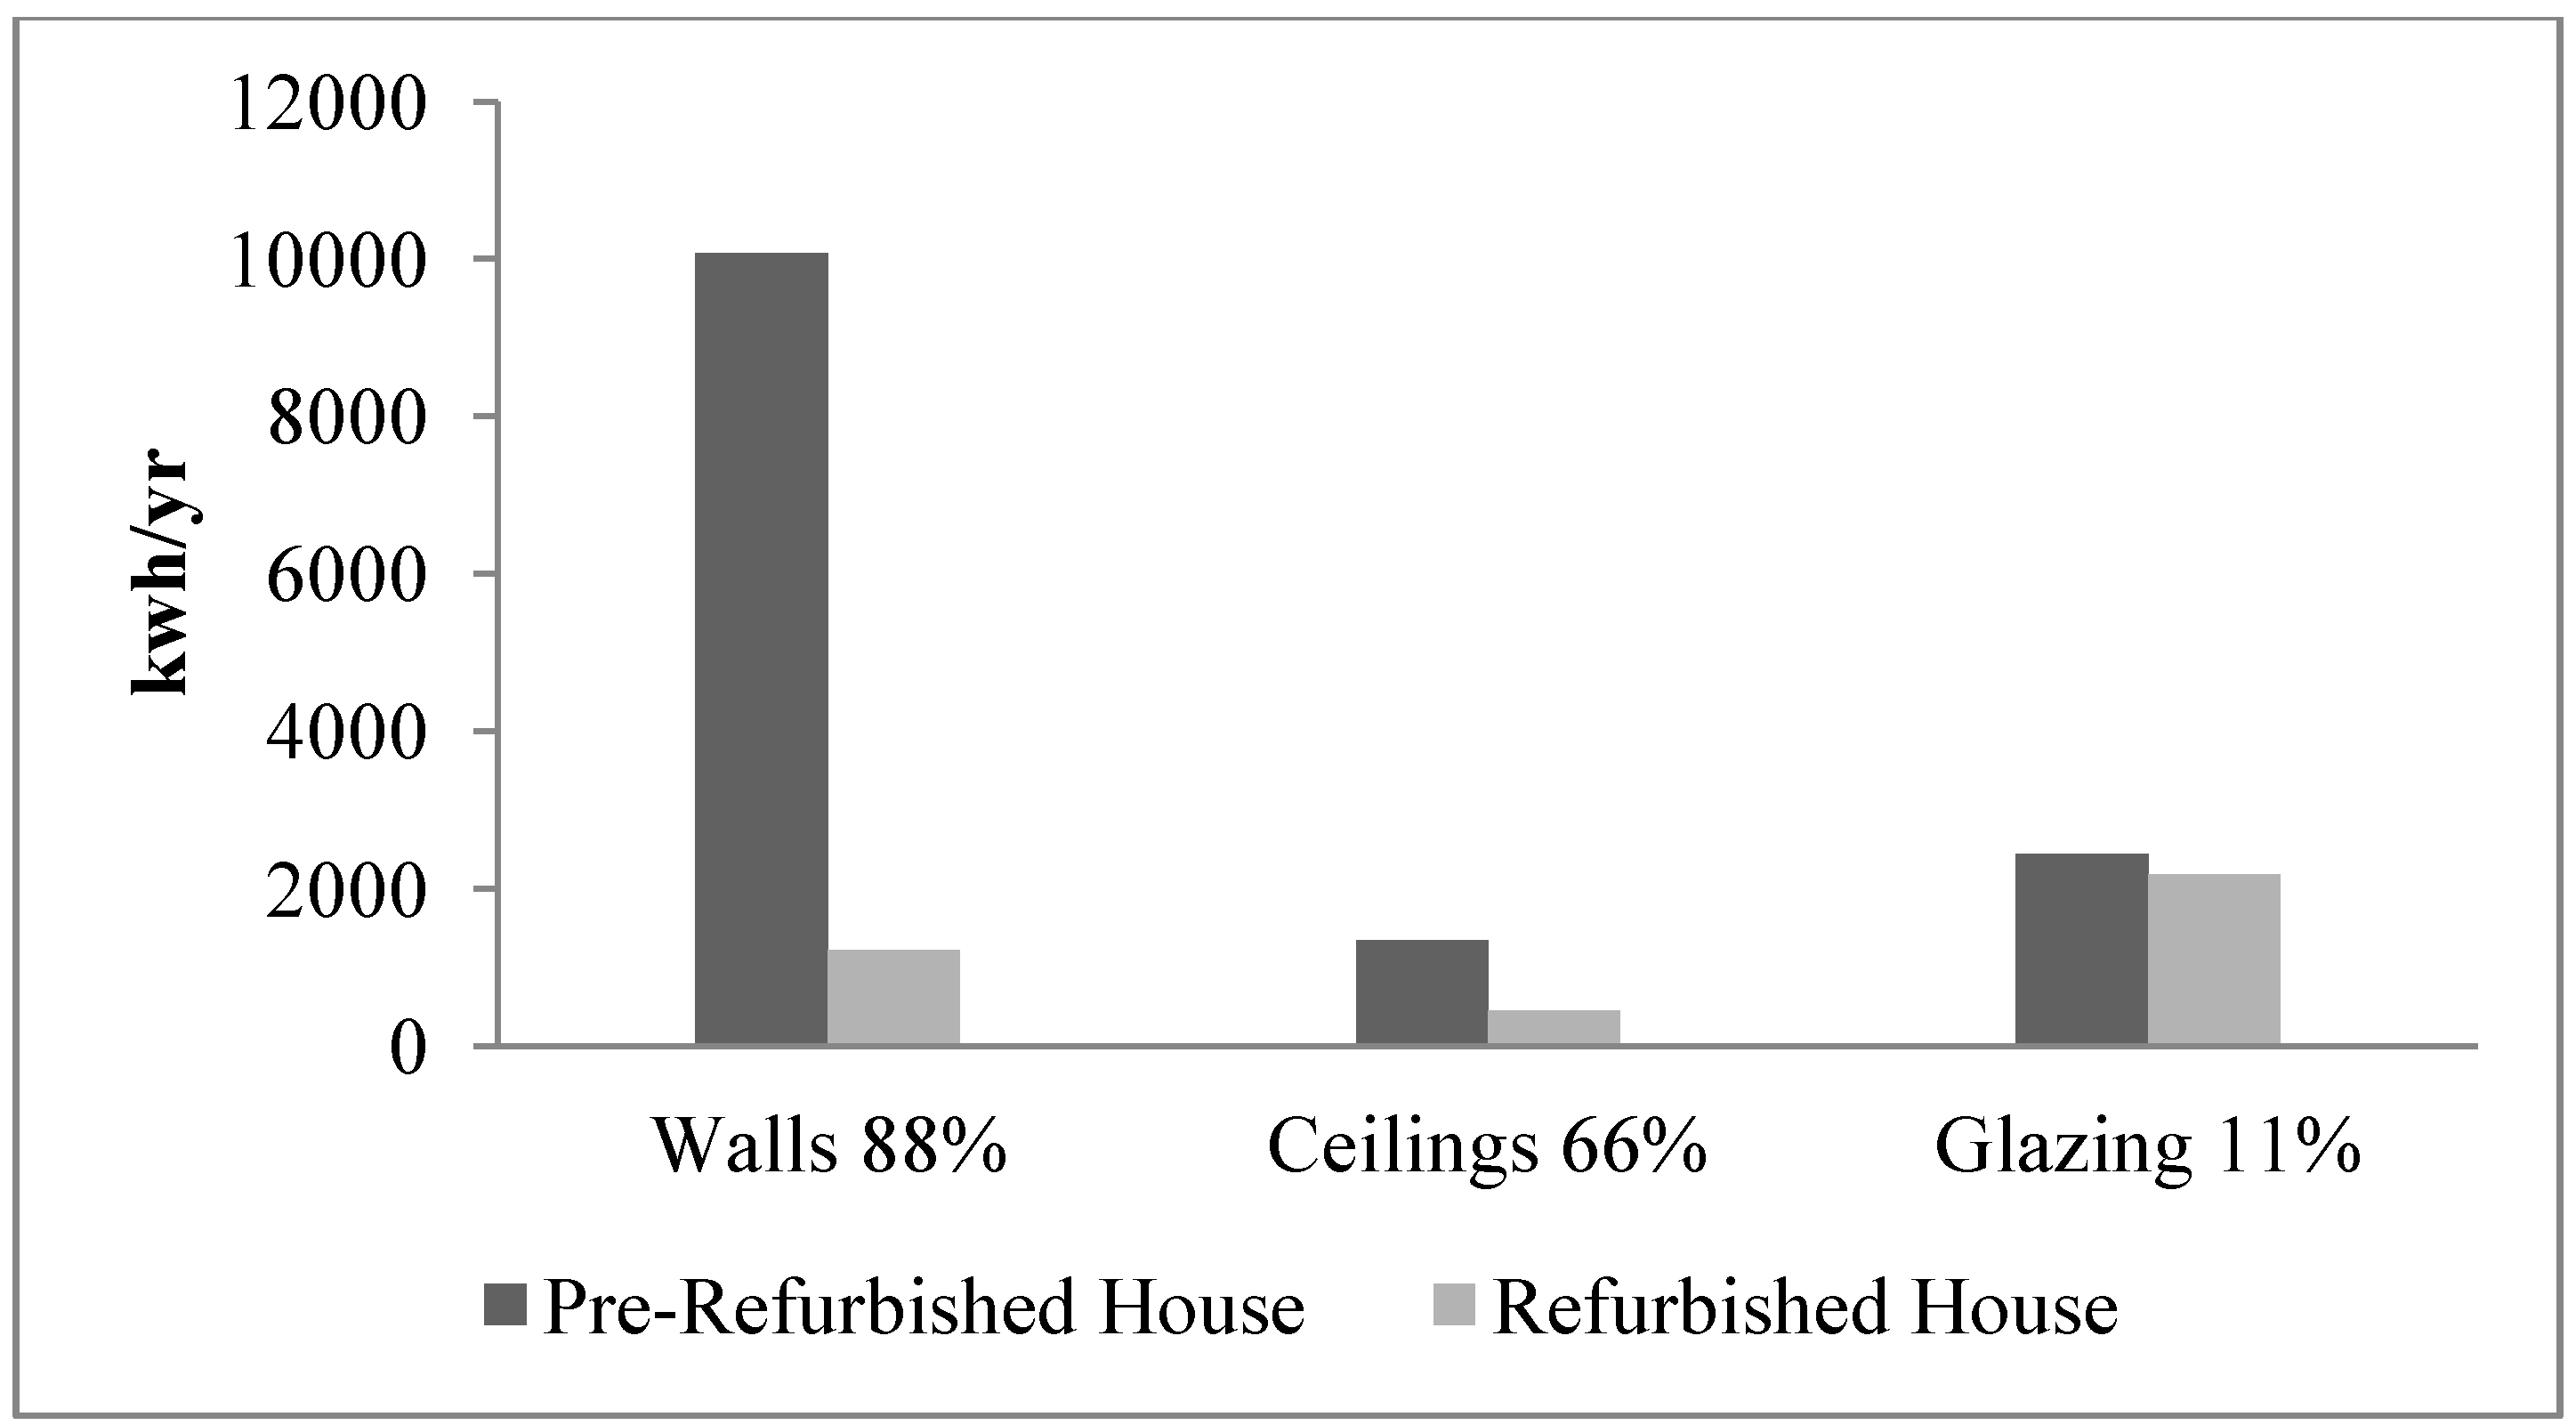
3.3. Efficiency of Various Technologies in Reducing Carbon Emission and Costs in the Terraced House

3.4. Annual Savings for the Terraced House, Liverpool
| Measures | Operative temperature °C | |
|---|---|---|
| DB Pre-Refurbished | 16.3 | |
| Average internal temperature | DB Refurbished | 19.6 |
| Monitoring | 25.4 |
| Climate scenarios | Estimated annual heating load for existing house (kWh) | Estimated annual heating load for refurbished house (kWh) | Heating reduction (kWh) | Annual energy cost savings (£) for a gas price of 0.0475 £/kWh |
|---|---|---|---|---|
| London-Current | 12,336 | 2527 | 9808 | 466 |
| Liverpool-Current | 12,628 | 2587 | 10,041 | 477 |
| Manchester-Current | 13,500 | 2878 | 10,622 | 505 |
| Edinburgh-Current | 15,200 | 3114 | 12,086 | 574 |
3.5. Future Climate Change and Annual Savings
| Climate scenarios | Estimated annual heating load for existing house (kWh) | Estimated annual heating load for refurbished house (kWh) | Reduction (kWh) (%) |
|---|---|---|---|
| London 2020 | 11,419 | 1908 | 9511 (83%) |
| Edinburgh 2020 | 12,188 | 2497 | 9691 (80%) |
| Manchester 2020 | 10,675 | 2168 | 8507 (80%) |
| London 2050 | 8148 | 1669 | 6479 (80%) |
| Edinburgh 2050 | 10,762 | 2205 | 8557 (80%) |
| Manchester 2050 | 9483 | 1833 | 7650 (81%) |
3.6. Future Gas Prices and Annual Savings
| Year | Gas prices in real terms(£) | Annual % variation | Instability |
|---|---|---|---|
| 1996 | 330 | - | - |
| 1997 | 329 | −0.3 | −6.3 |
| 1998 | 320 | −2.7 | −8.8 |
| 1999 | 316 | −1.2 | −7.3 |
| 2000 | 309 | −2.2 | −8.3 |
| 2001 | 308 | −0.3 | −6.4 |
| 2002 | 326 | 5.8 | −0.2 |
| 2003 | 335 | 2.7 | −3.3 |
| 2004 | 344 | 2.6 | −3.4 |
| 2005 | 402 | 16.8 | 10.8 |
| 2006 | 510 | 26.8 | 20.8 |
| 2007 | 545 | 6.8 | 0.8 |
| 2008 | 625 | 14.6 | 8.7 |
| 2009 | 715 | 14.4 | 8.3 |
| 2010 | 689 | −3.6 | −9.7 |
| 2011 | 762 | 10.6 | 4.5 |
| Average | - | 6.07 | - |
| year | Refurbished annual heating load (kWh) | Existing annual heating load (kWh) | Gas prices (p/kWh) | Refurbished annual heating cost (£) | Existing annual heating cost (£) | Annual savings (£) | Annual savings, NPV at 3.5%/3% discount |
|---|---|---|---|---|---|---|---|
| 2010 | 2527 | 12336 | 4.75 | 120.03 | 585.94 | 465.91 | 465.91 |
| 2011 | 2458 | 12236 | 4.76 | 117.01 | 582.33 | 465.32 | 449.58 |
| 2012 | 2389 | 12132 | 3.20 | 76.46 | 388.22 | 311.76 | 291.03 |
| 2013 | 2321 | 12030 | 4.80 | 111.40 | 577.45 | 466.05 | 420.35 |
| 2014 | 2252 | 11928 | 3.90 | 87.83 | 465.21 | 377.37 | 328.86 |
| 2015 | 2183 | 11827 | 4.83 | 105.46 | 571.23 | 465.76 | 392.16 |
| 2016 | 2115 | 11725 | 3.96 | 83.74 | 464.30 | 380.56 | 309.58 |
| 2017 | 2046 | 11623 | 4.85 | 99.23 | 563.72 | 464.48 | 365.08 |
| 2018 | 1977 | 11521 | 3.96 | 78.30 | 456.24 | 377.94 | 287.01 |
| 2019 | 1909 | 11419 | 4.87 | 92.95 | 556.12 | 463.17 | 339.84 |
| 2020 | 1908 | 11419 | 3.97 | 75.74 | 453.33 | 377.58 | 267.68 |
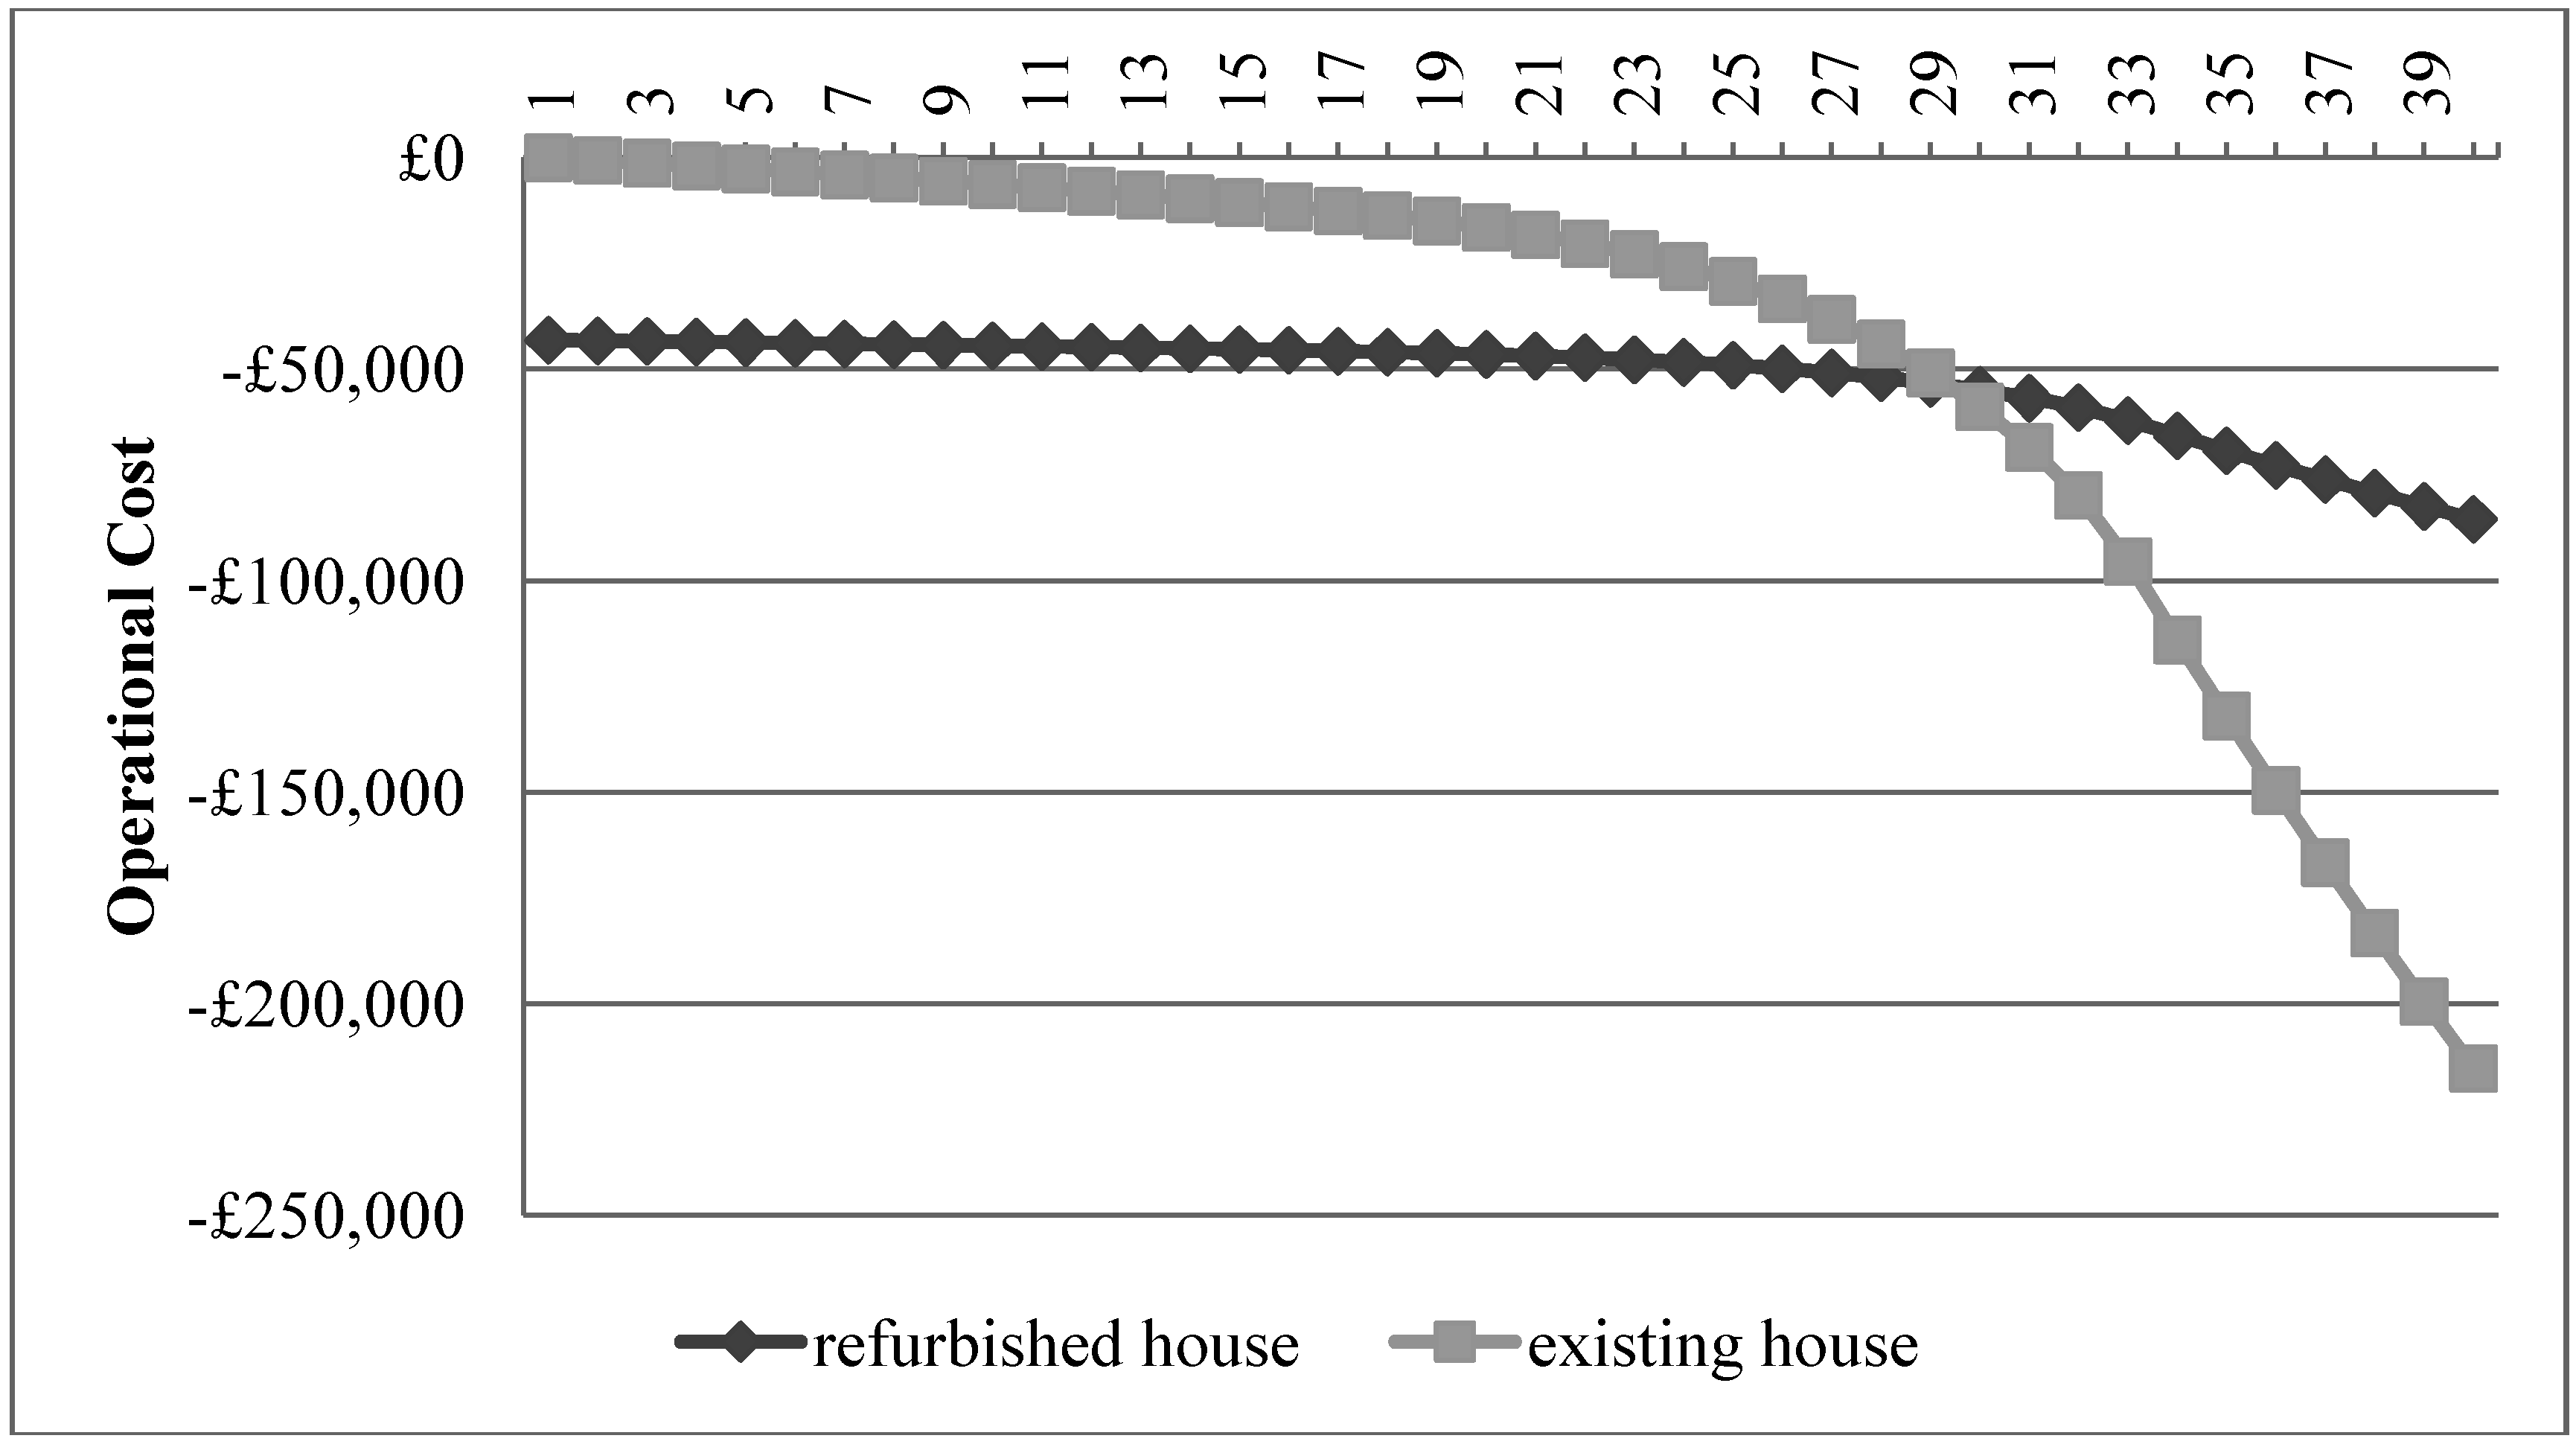
3.7. Future Energy Saving Costs
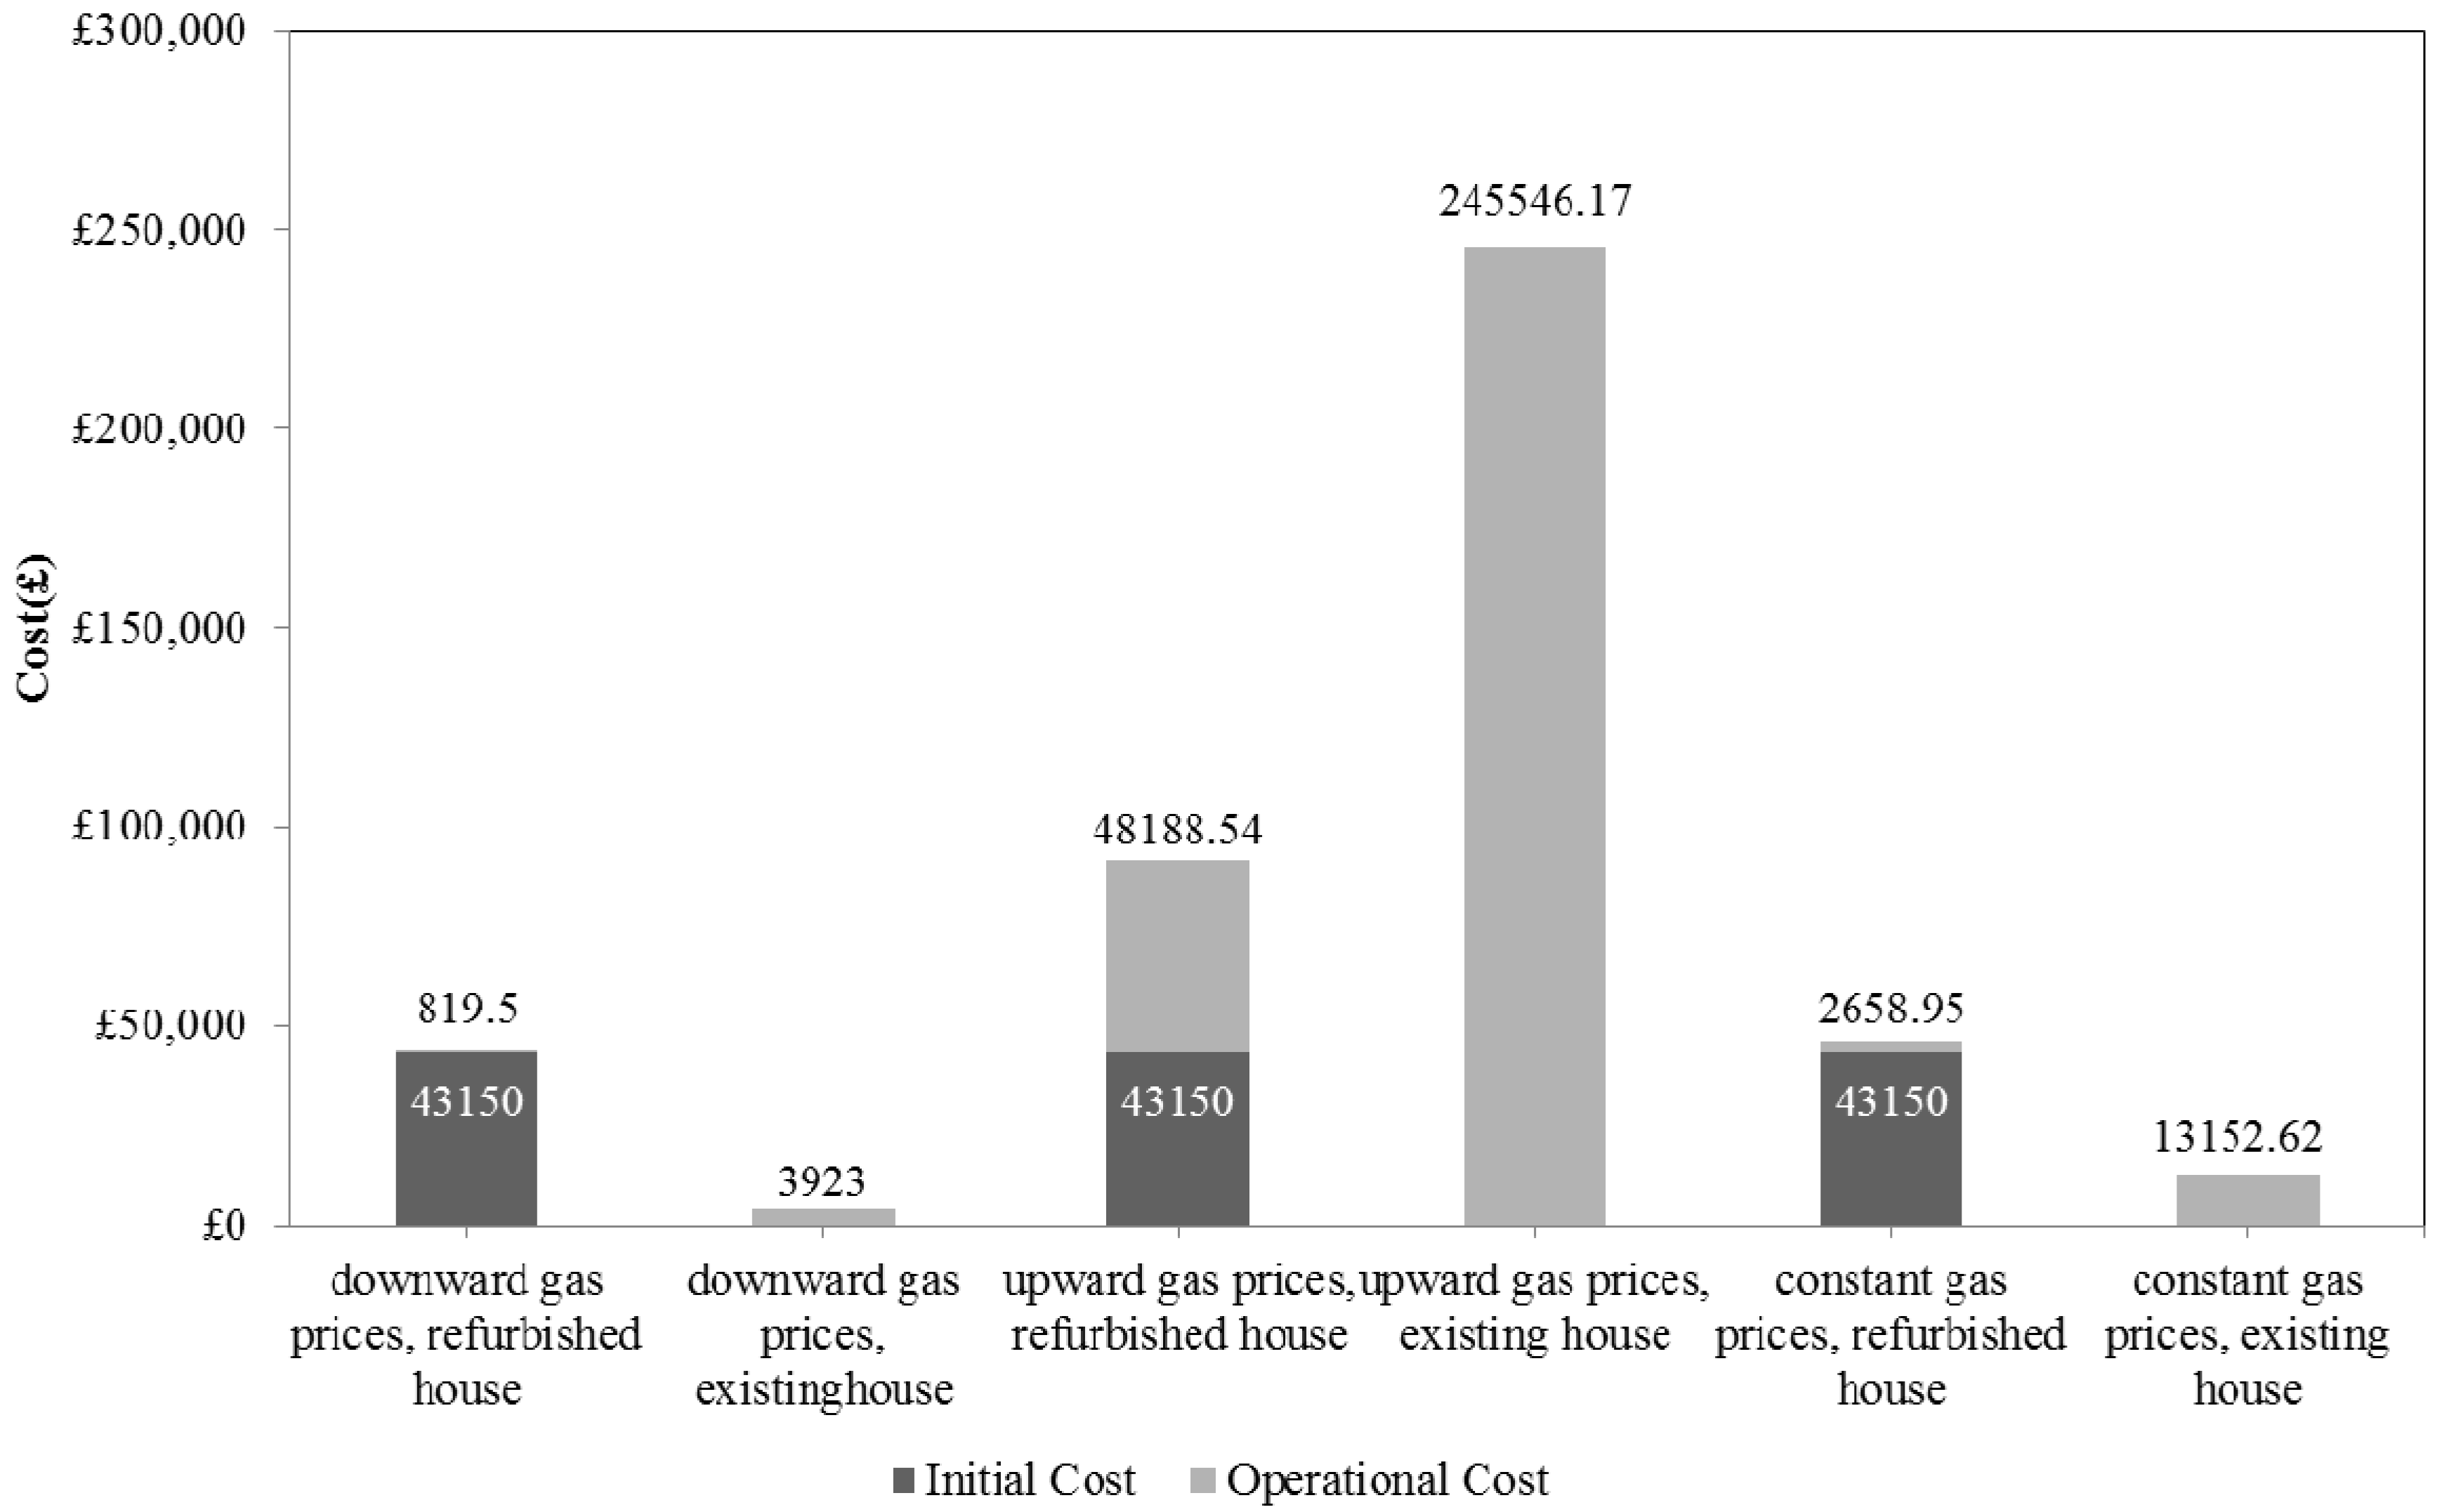
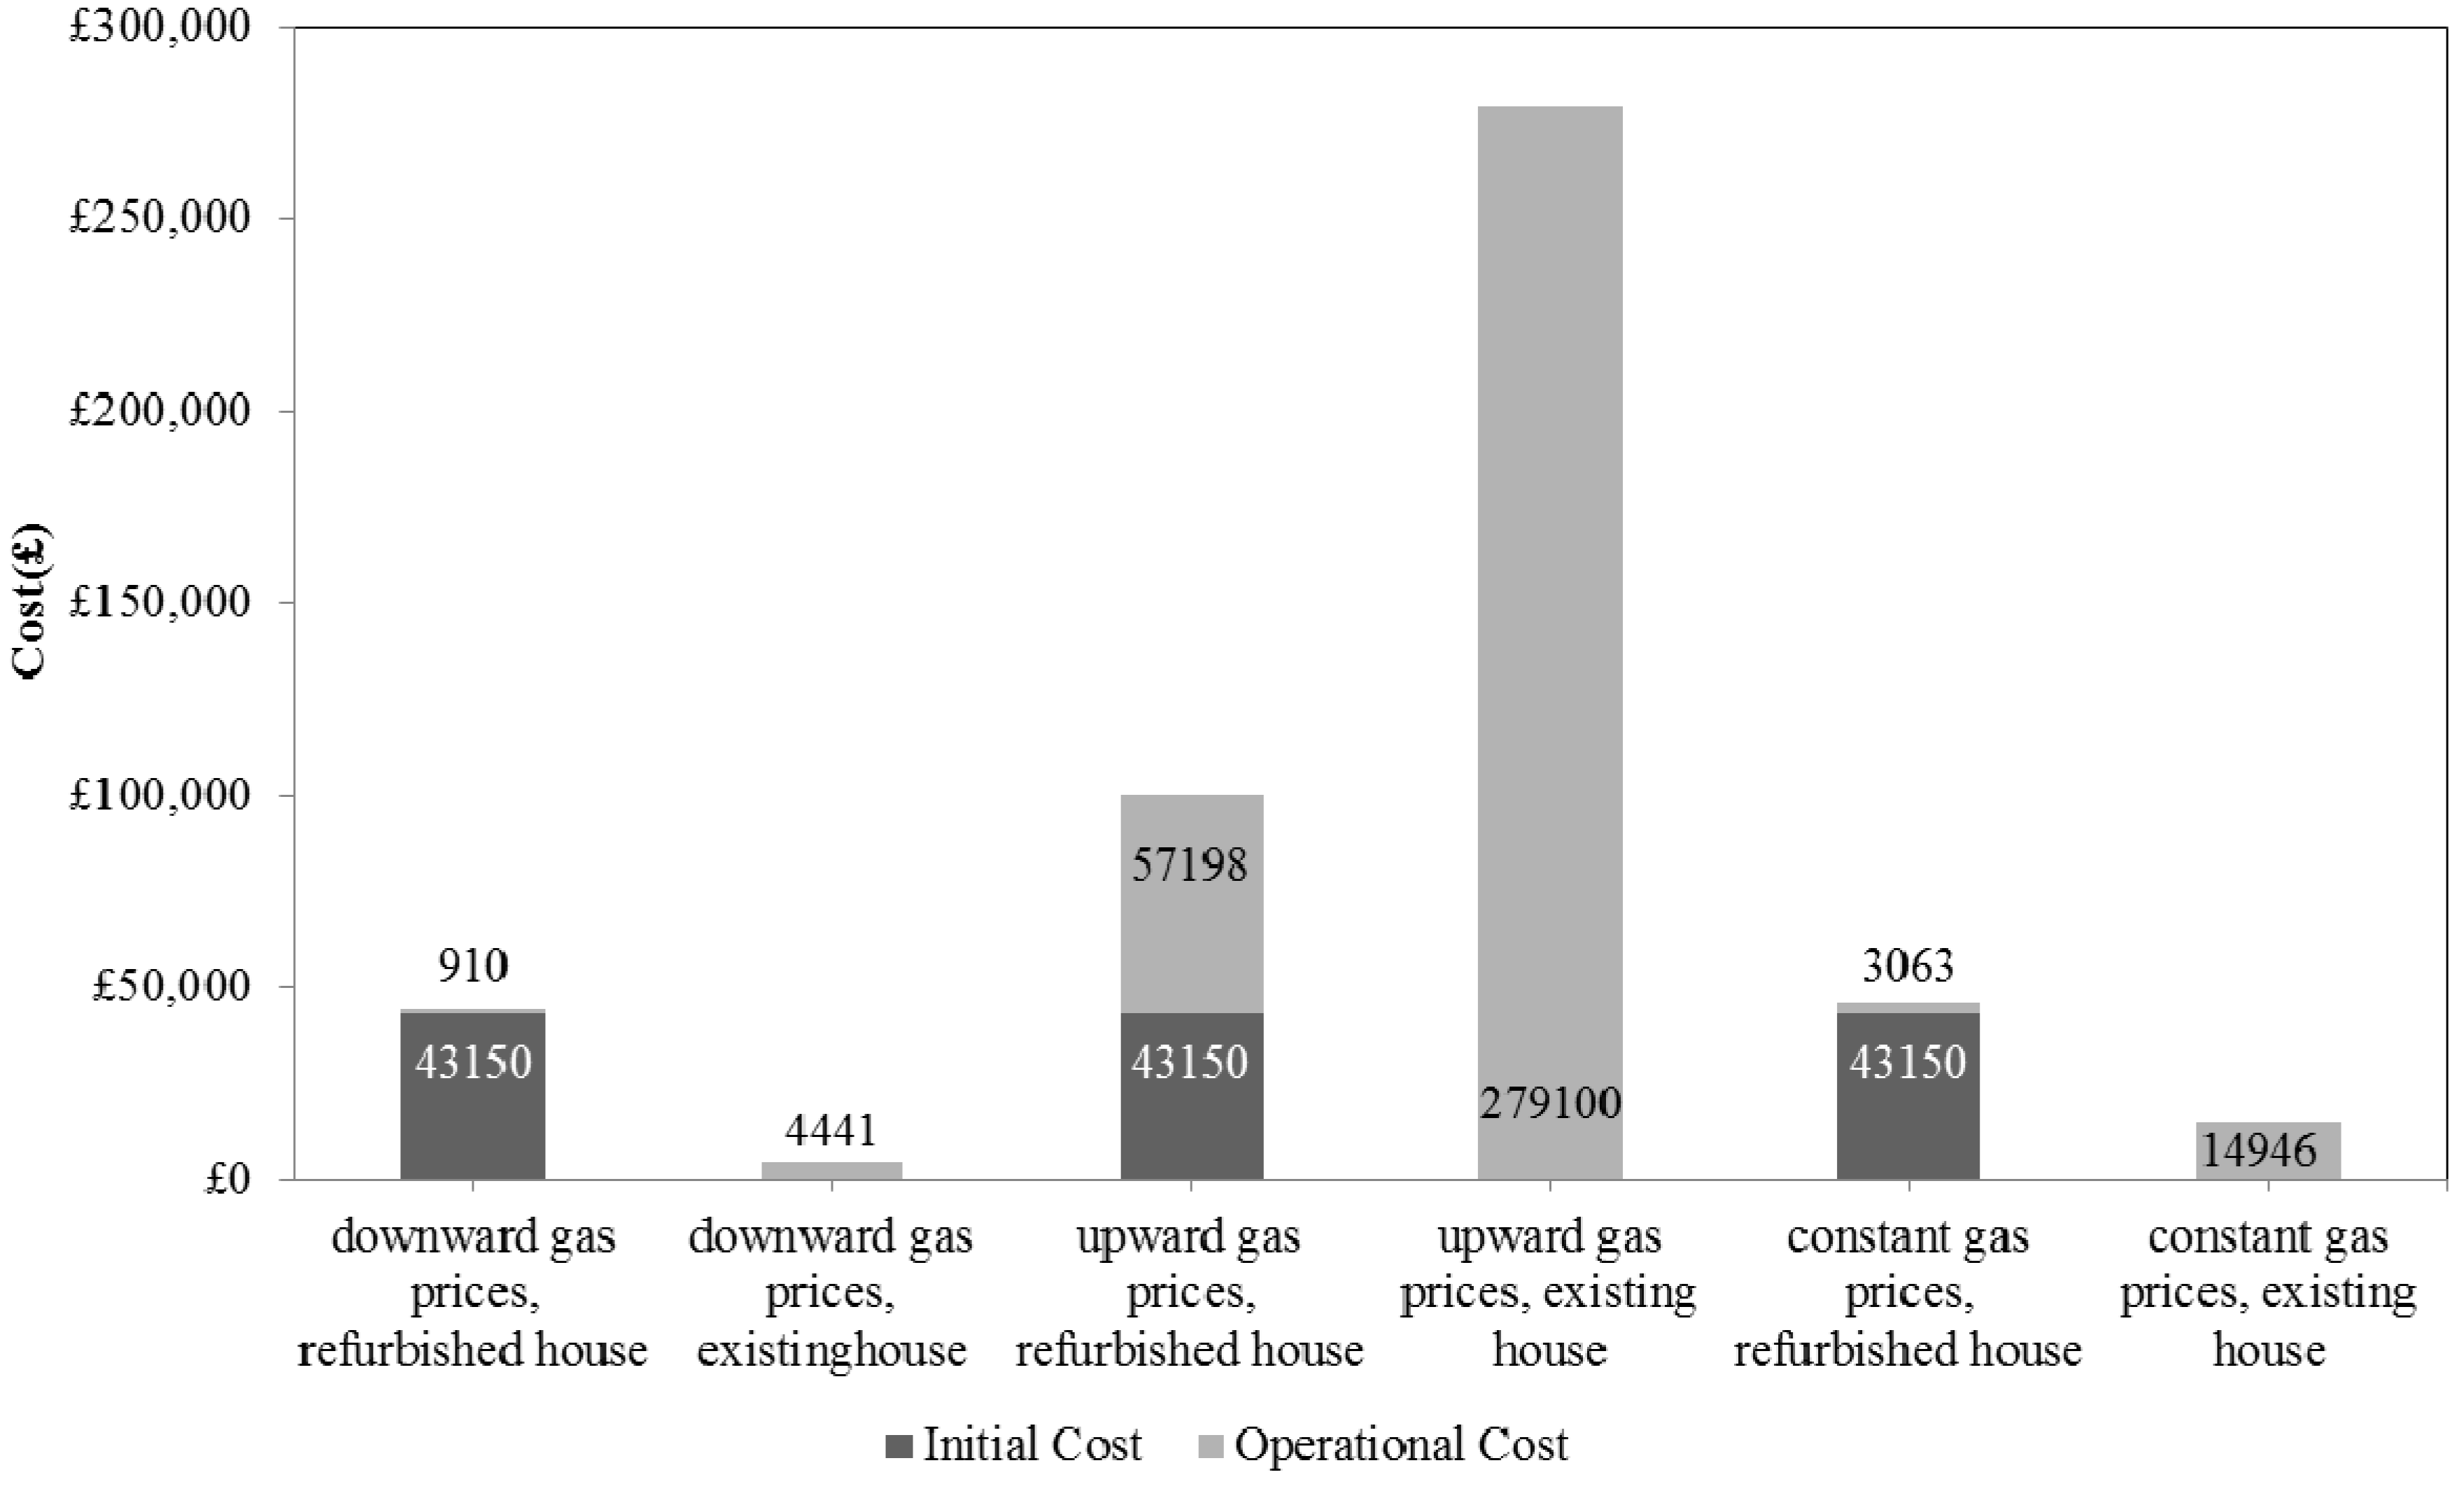
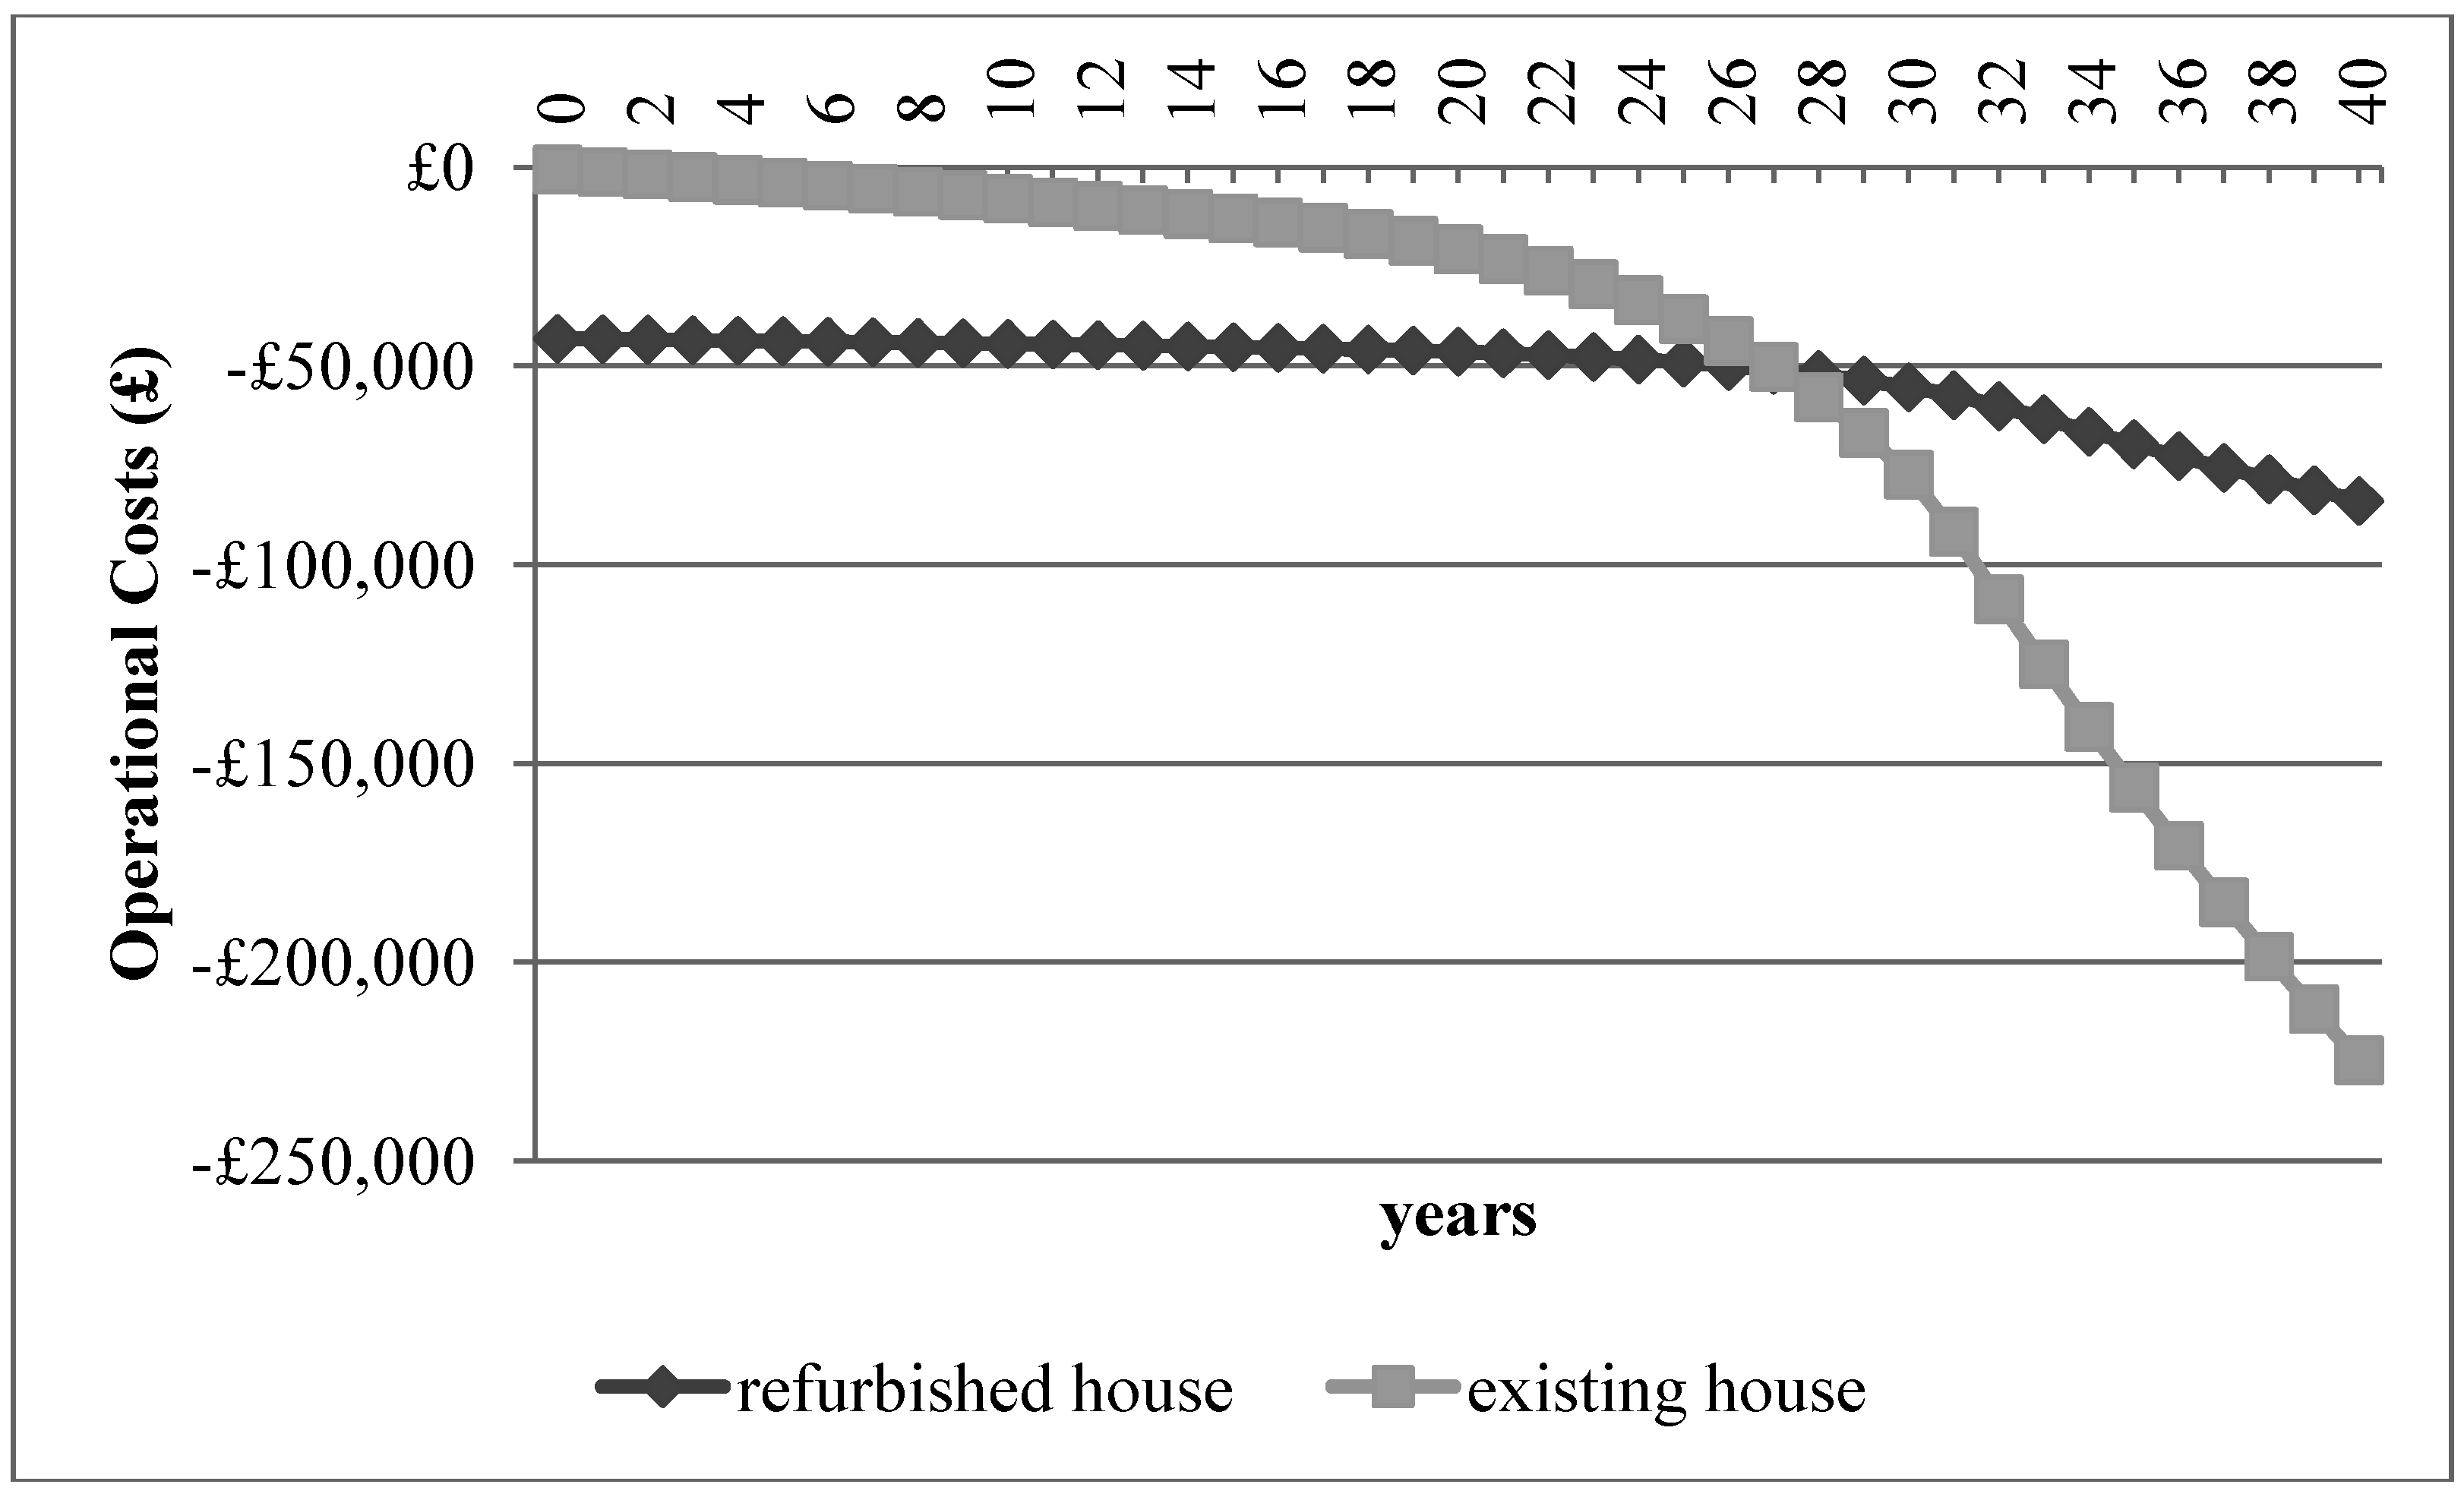
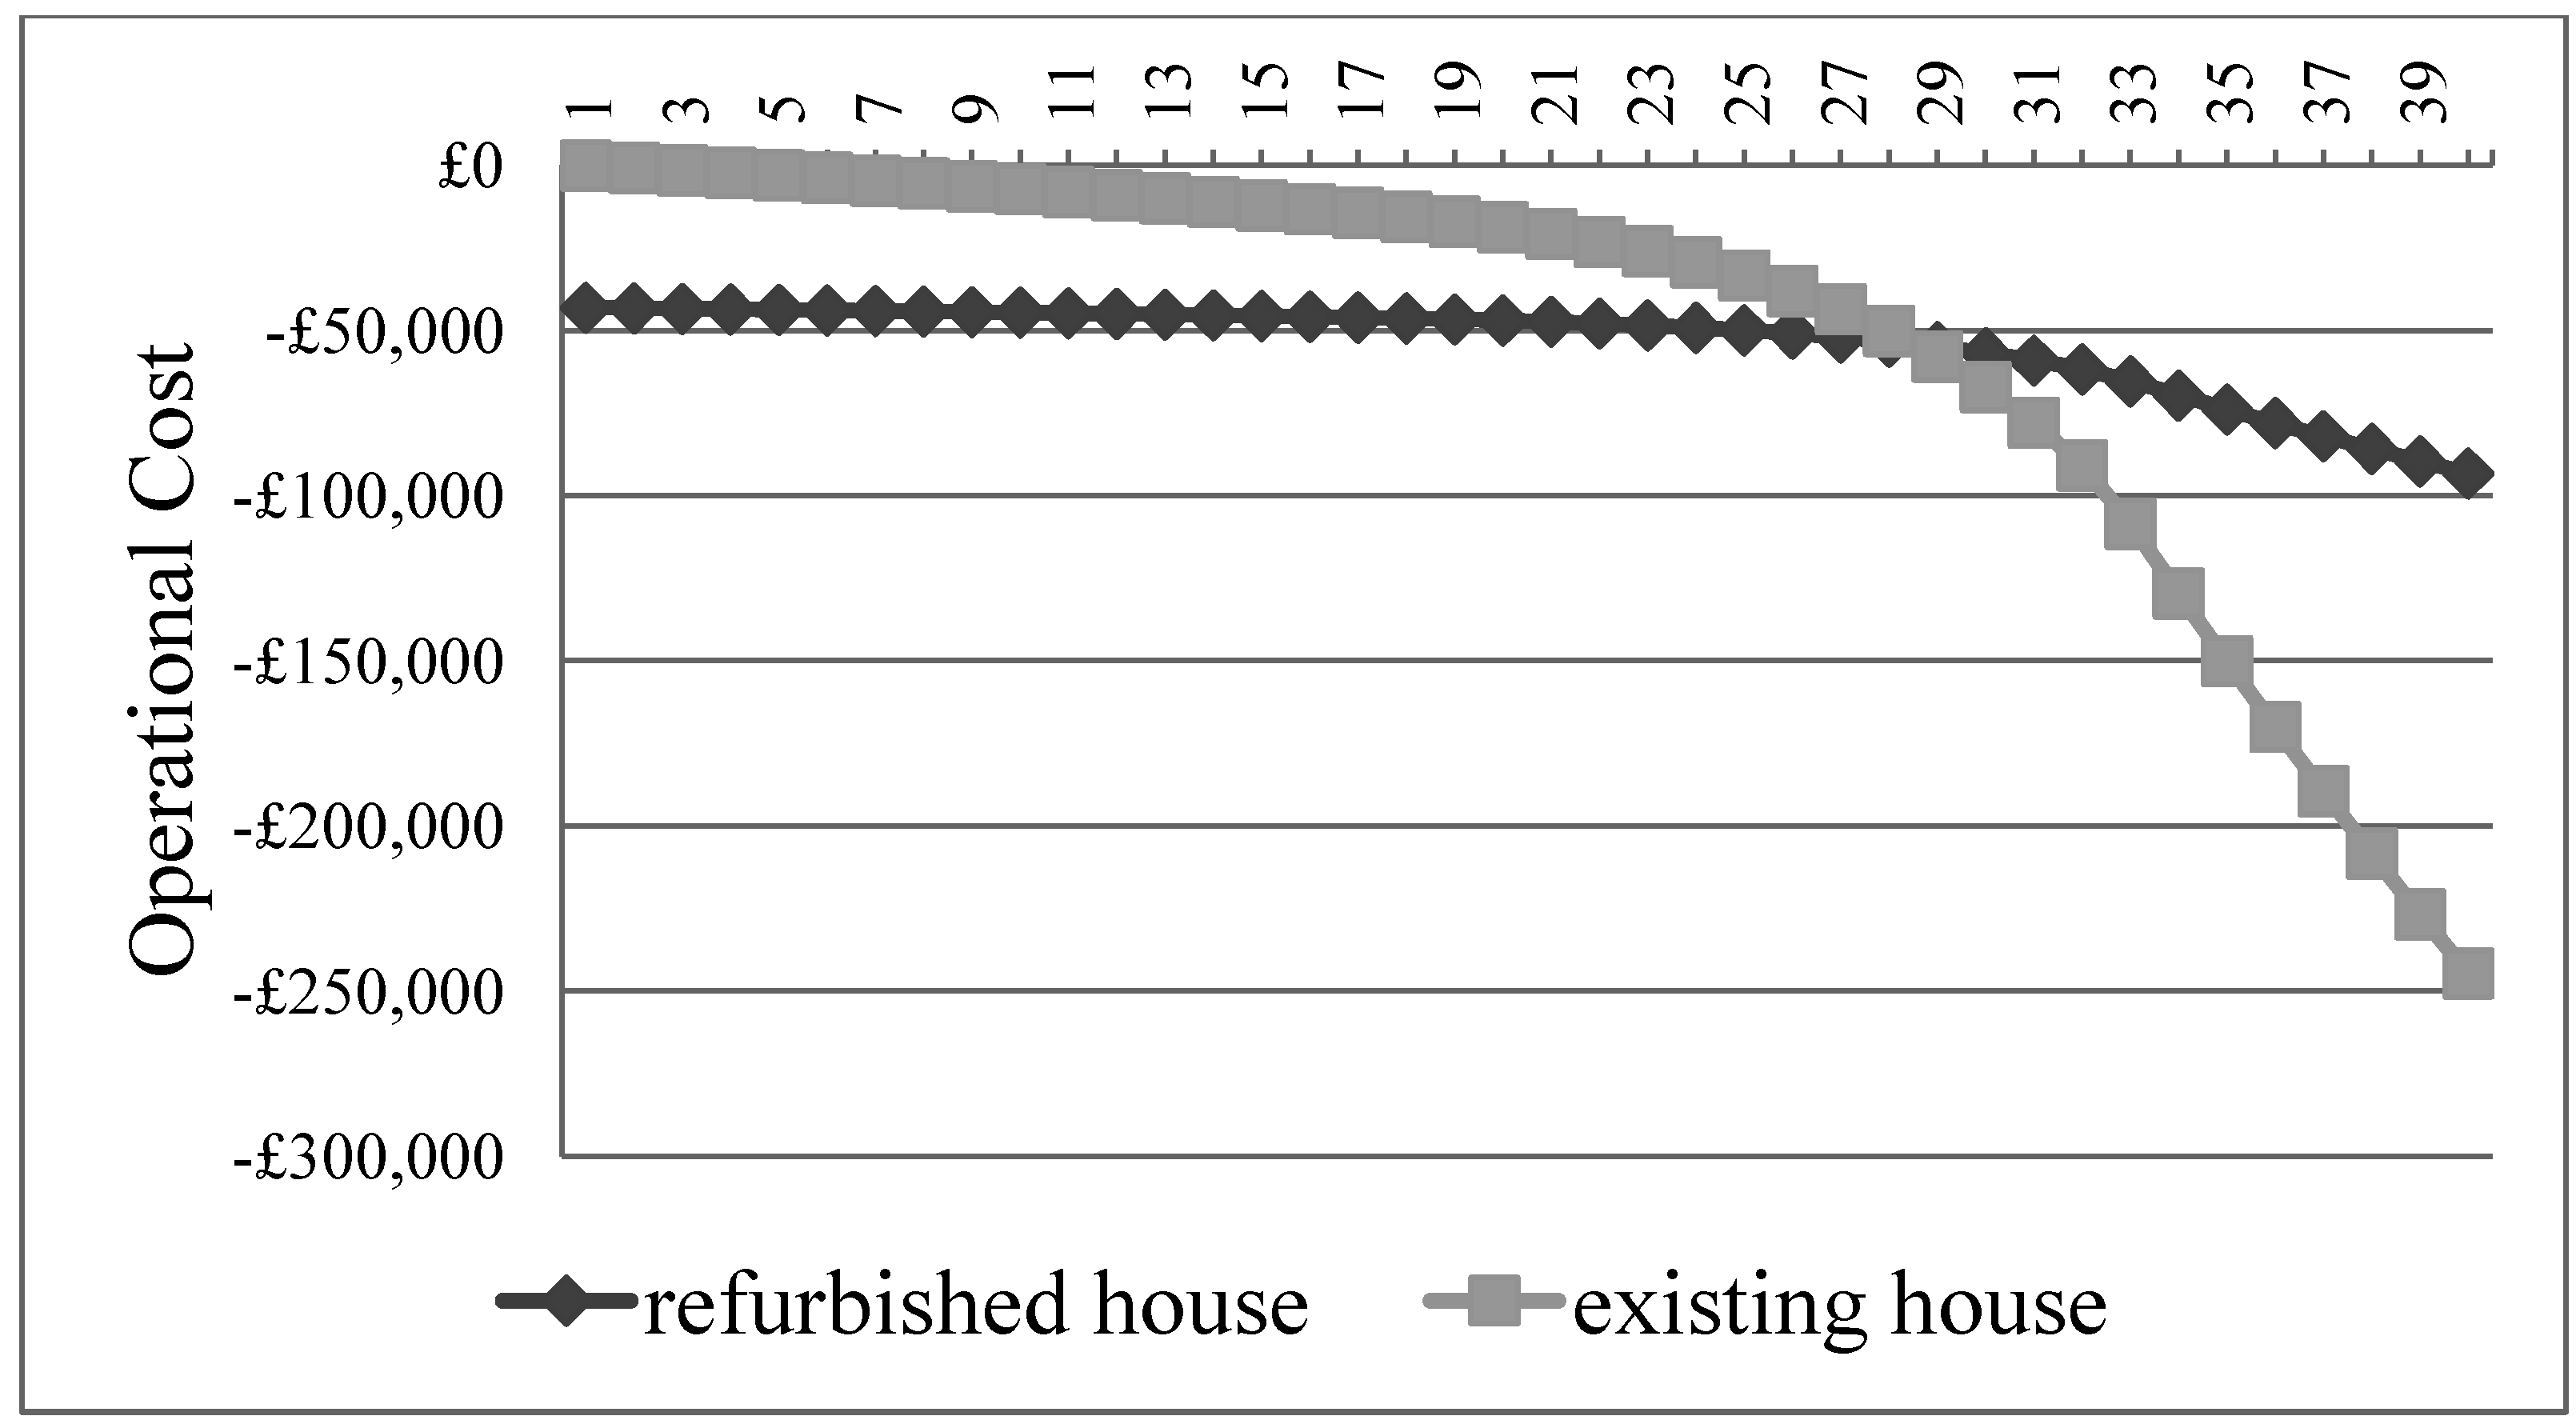
3.8. Whole Life Cycle Costing


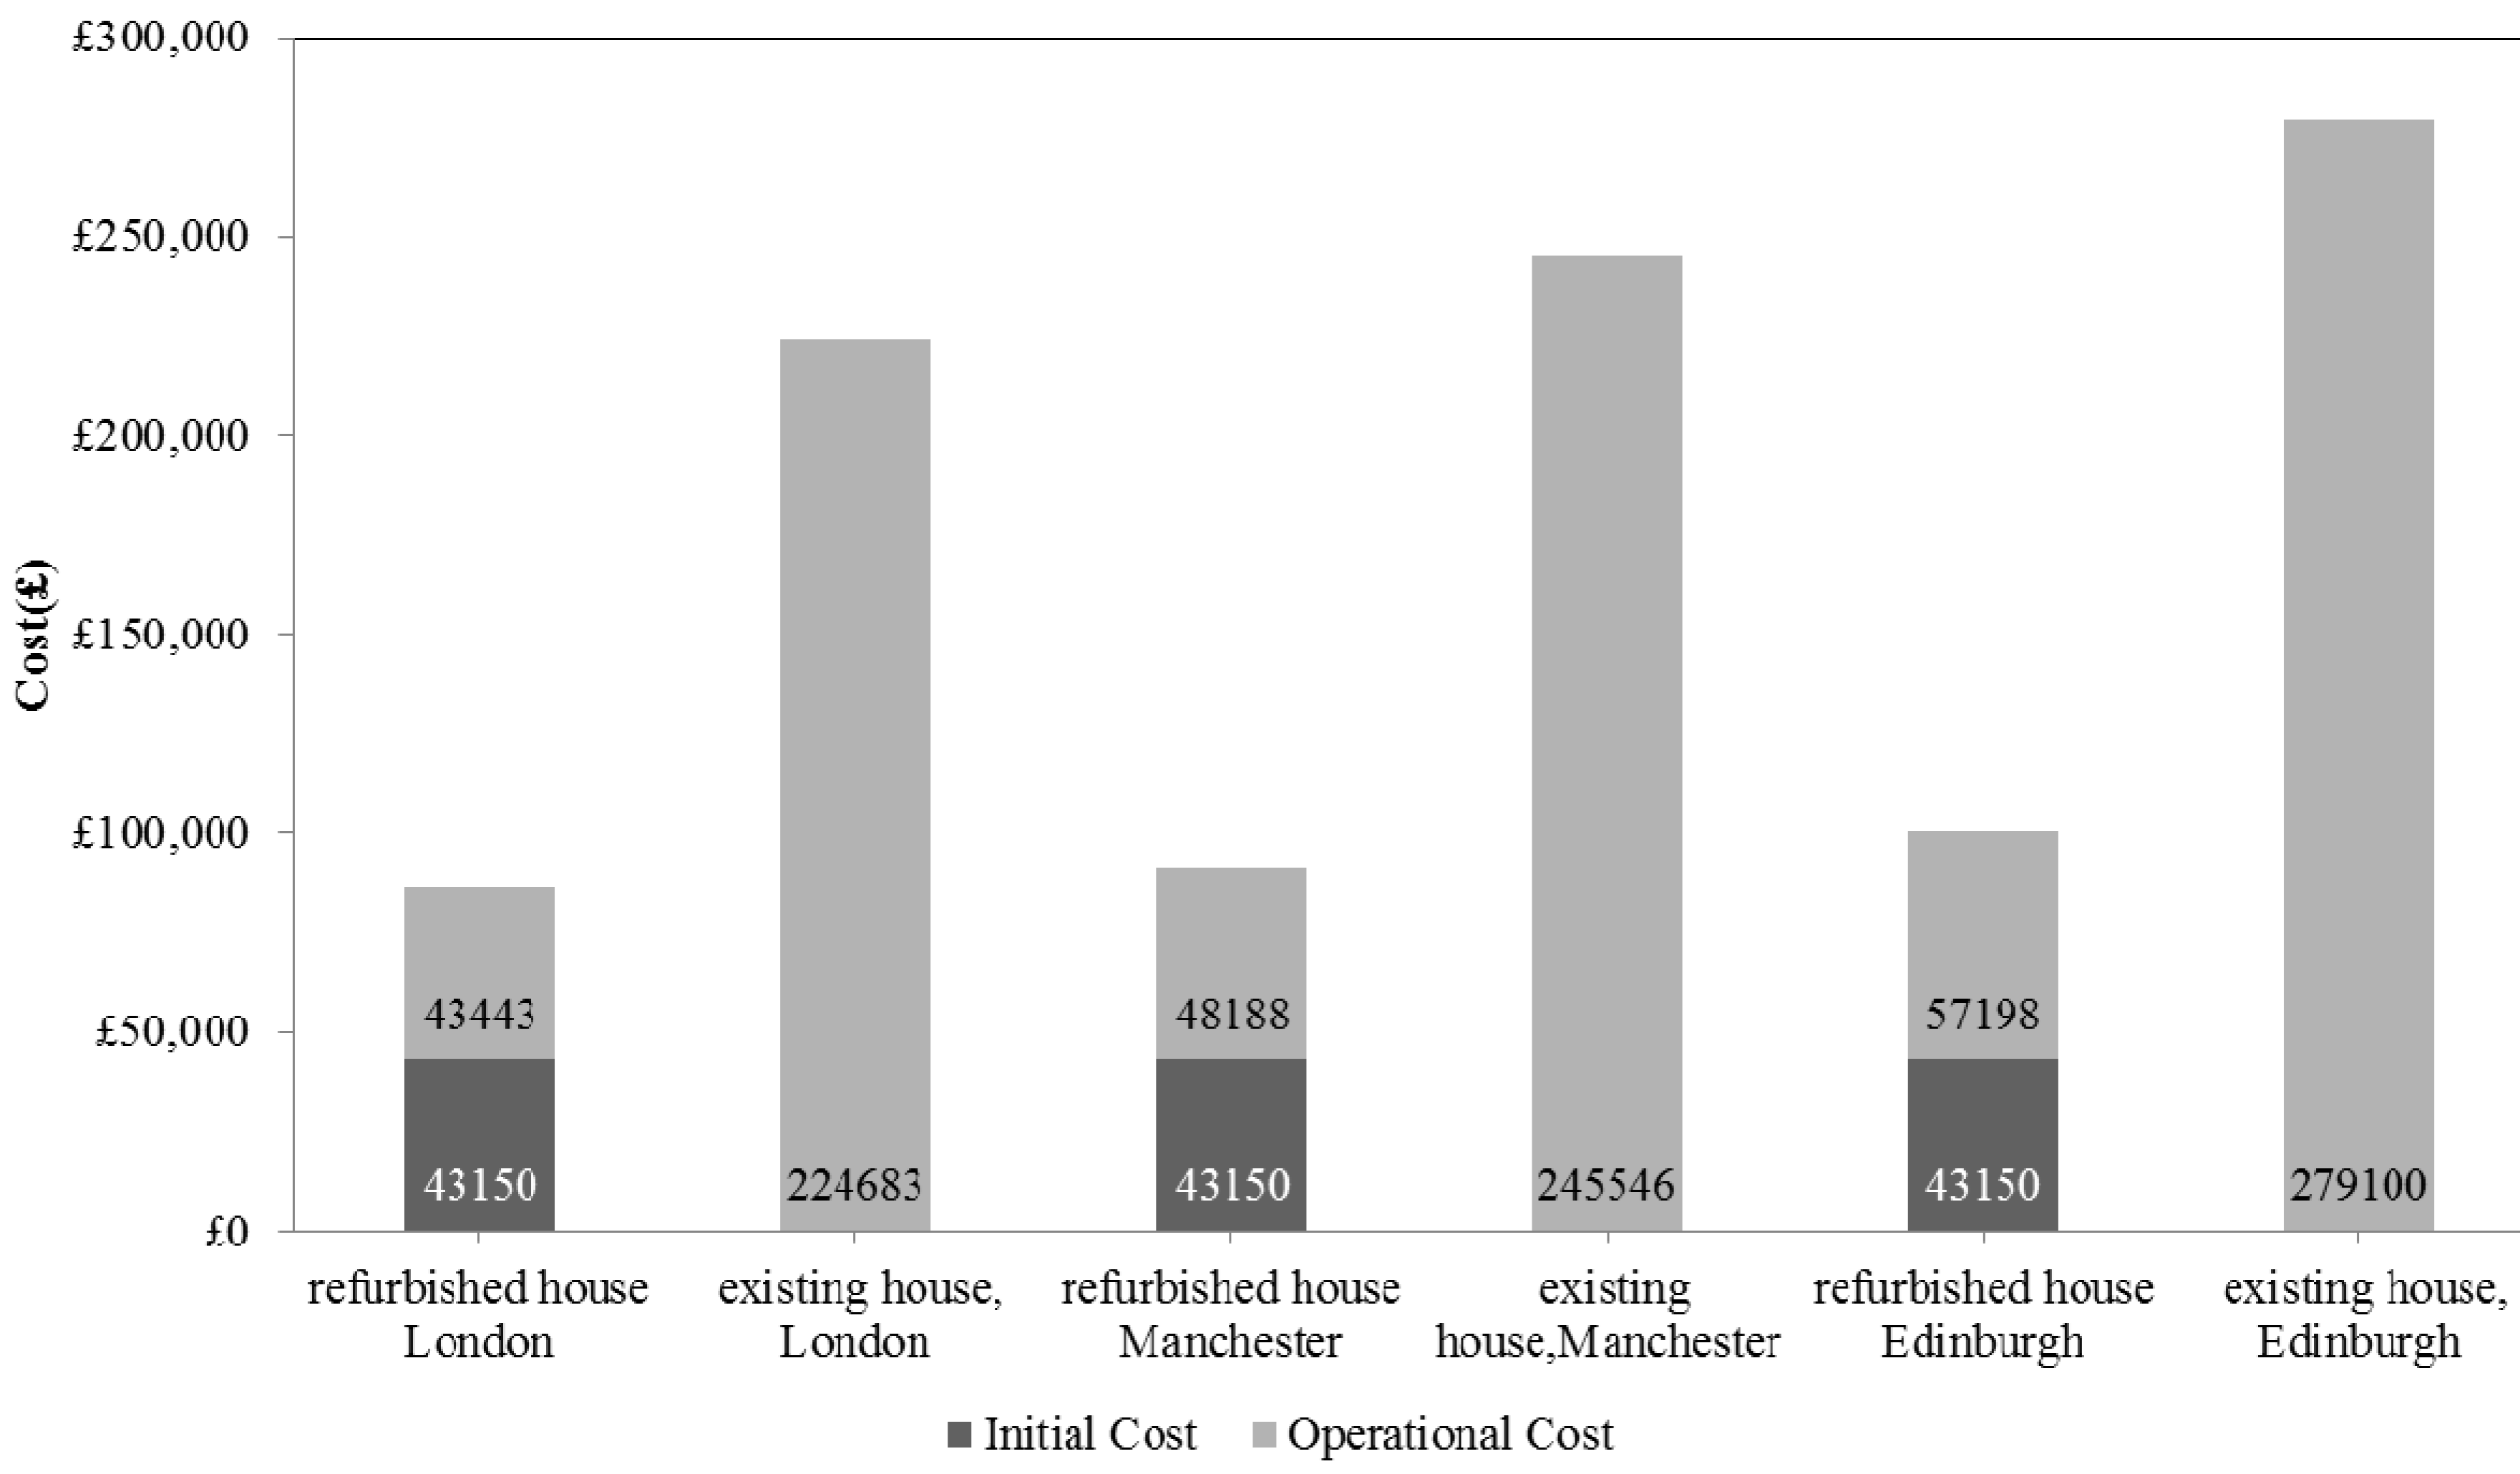
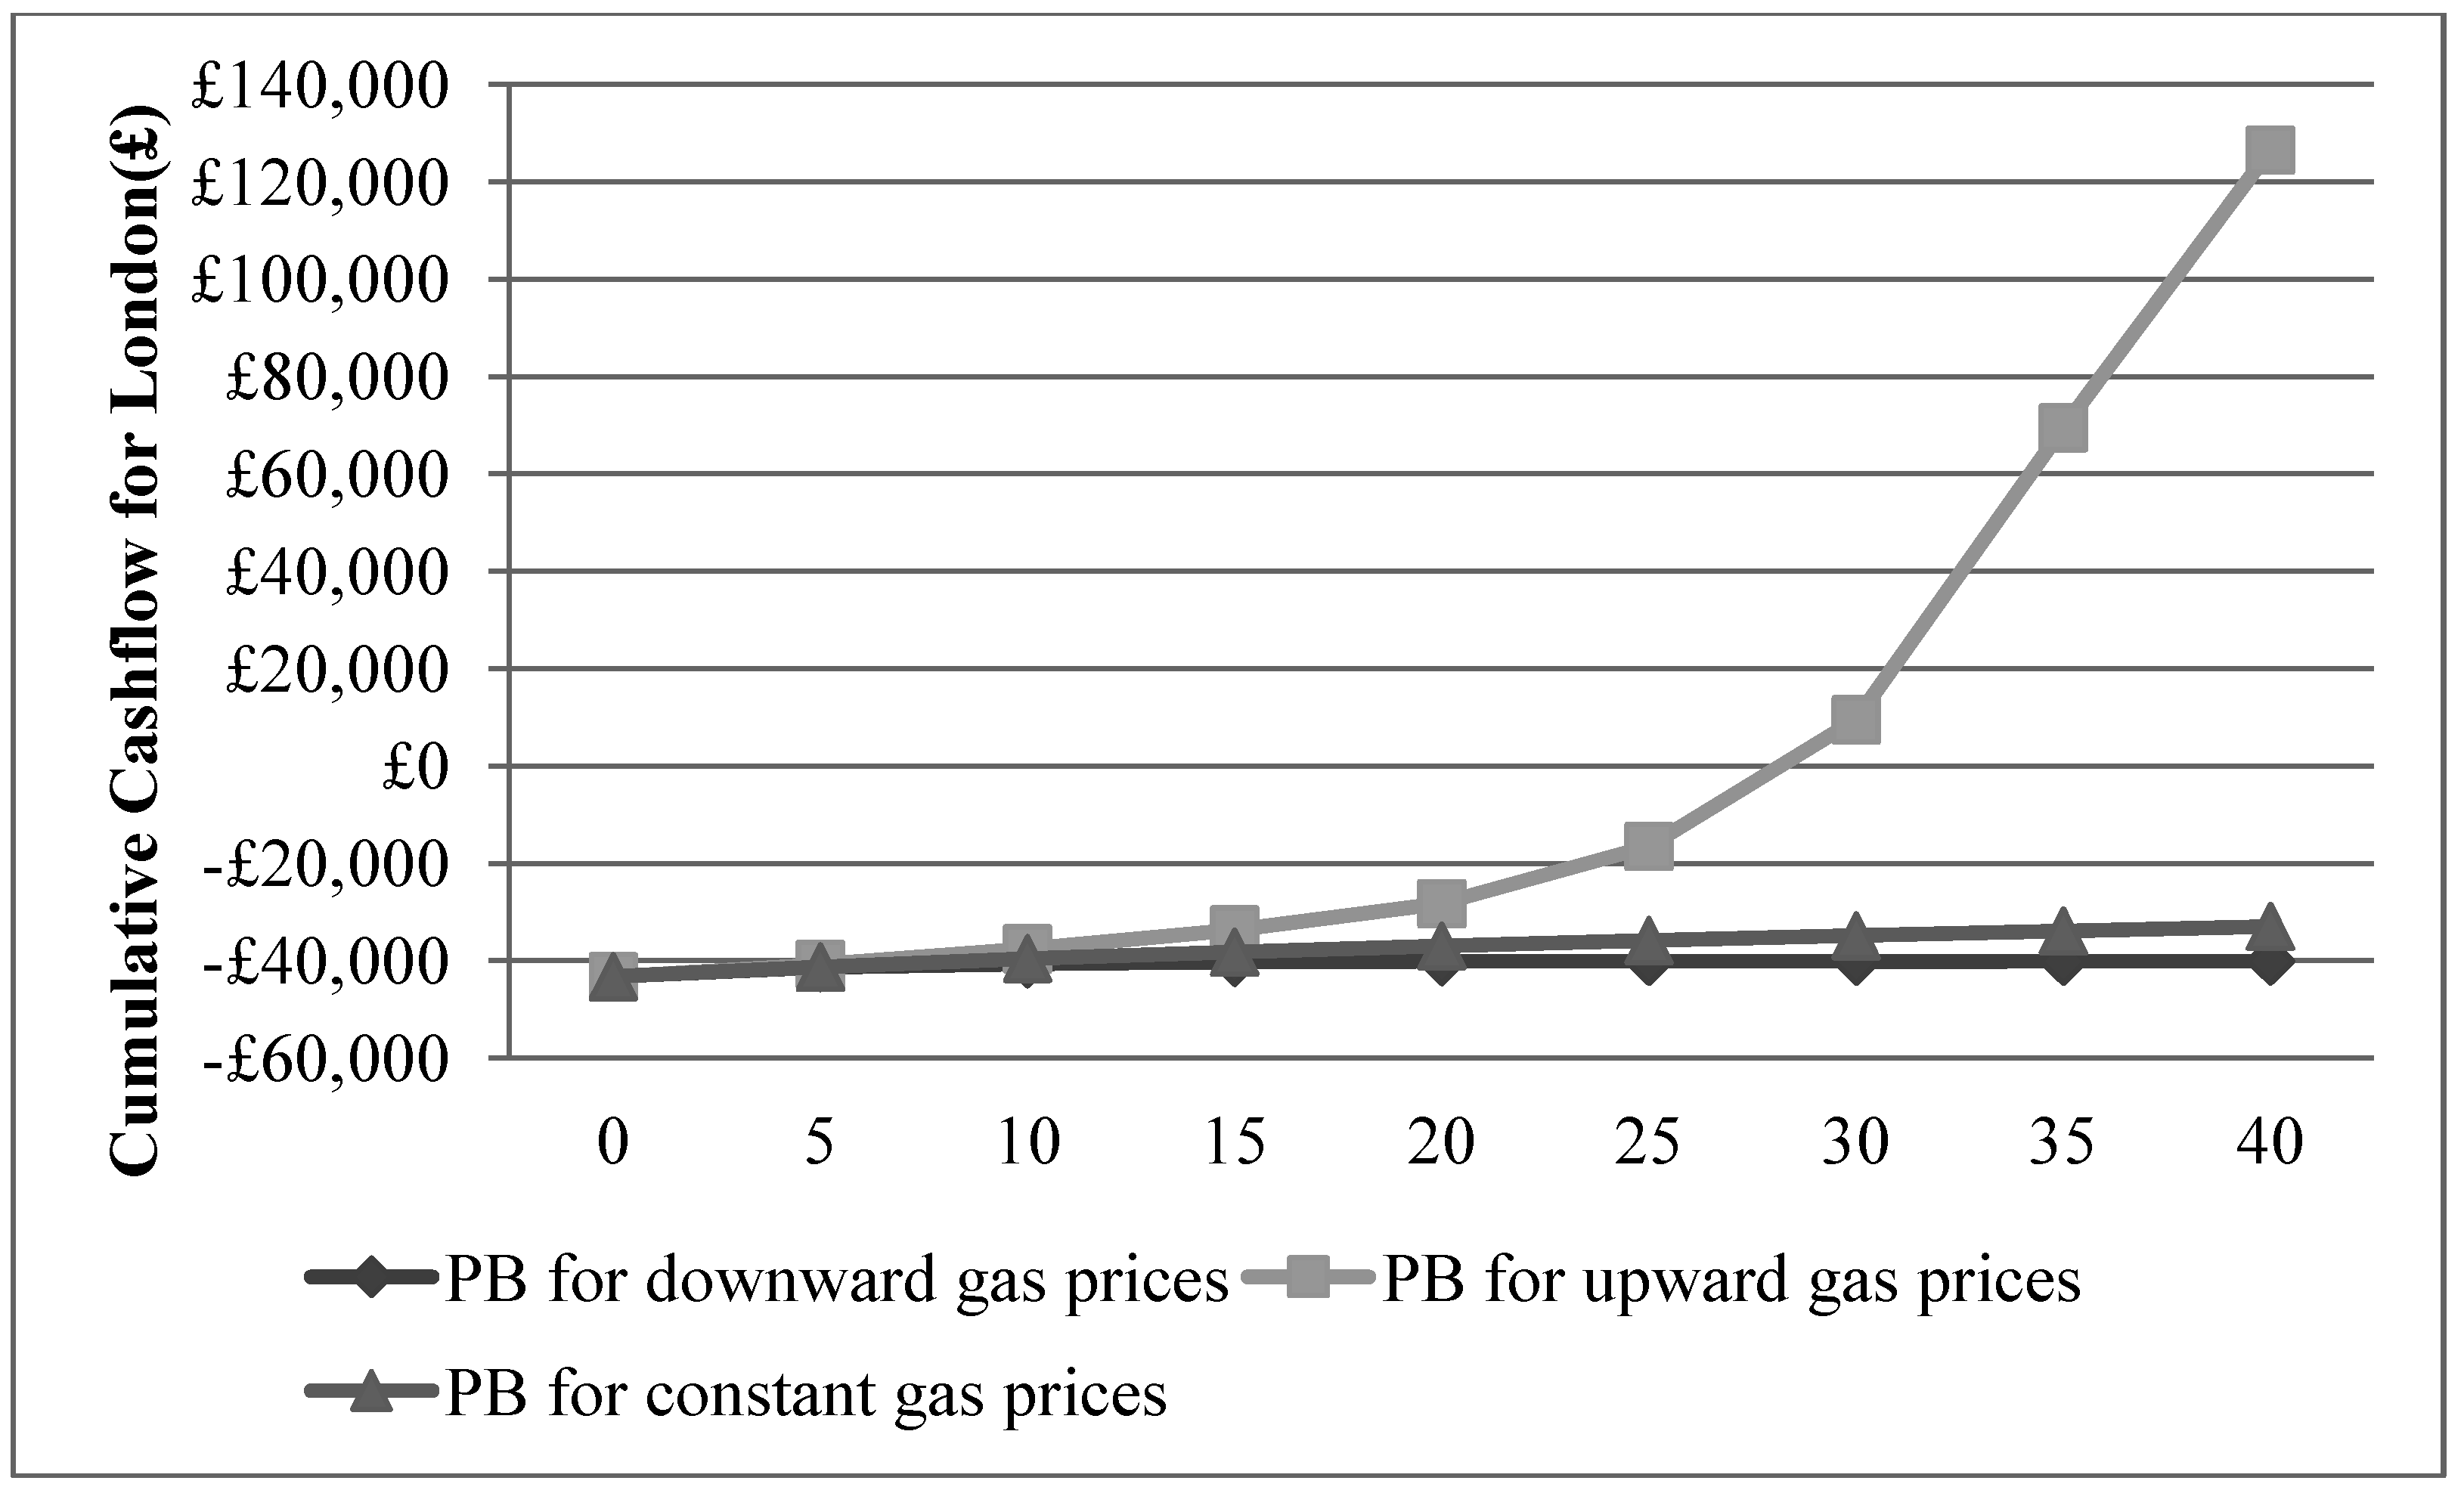
3.9. Payback Period
3.9.1. London


3.9.2. Manchester
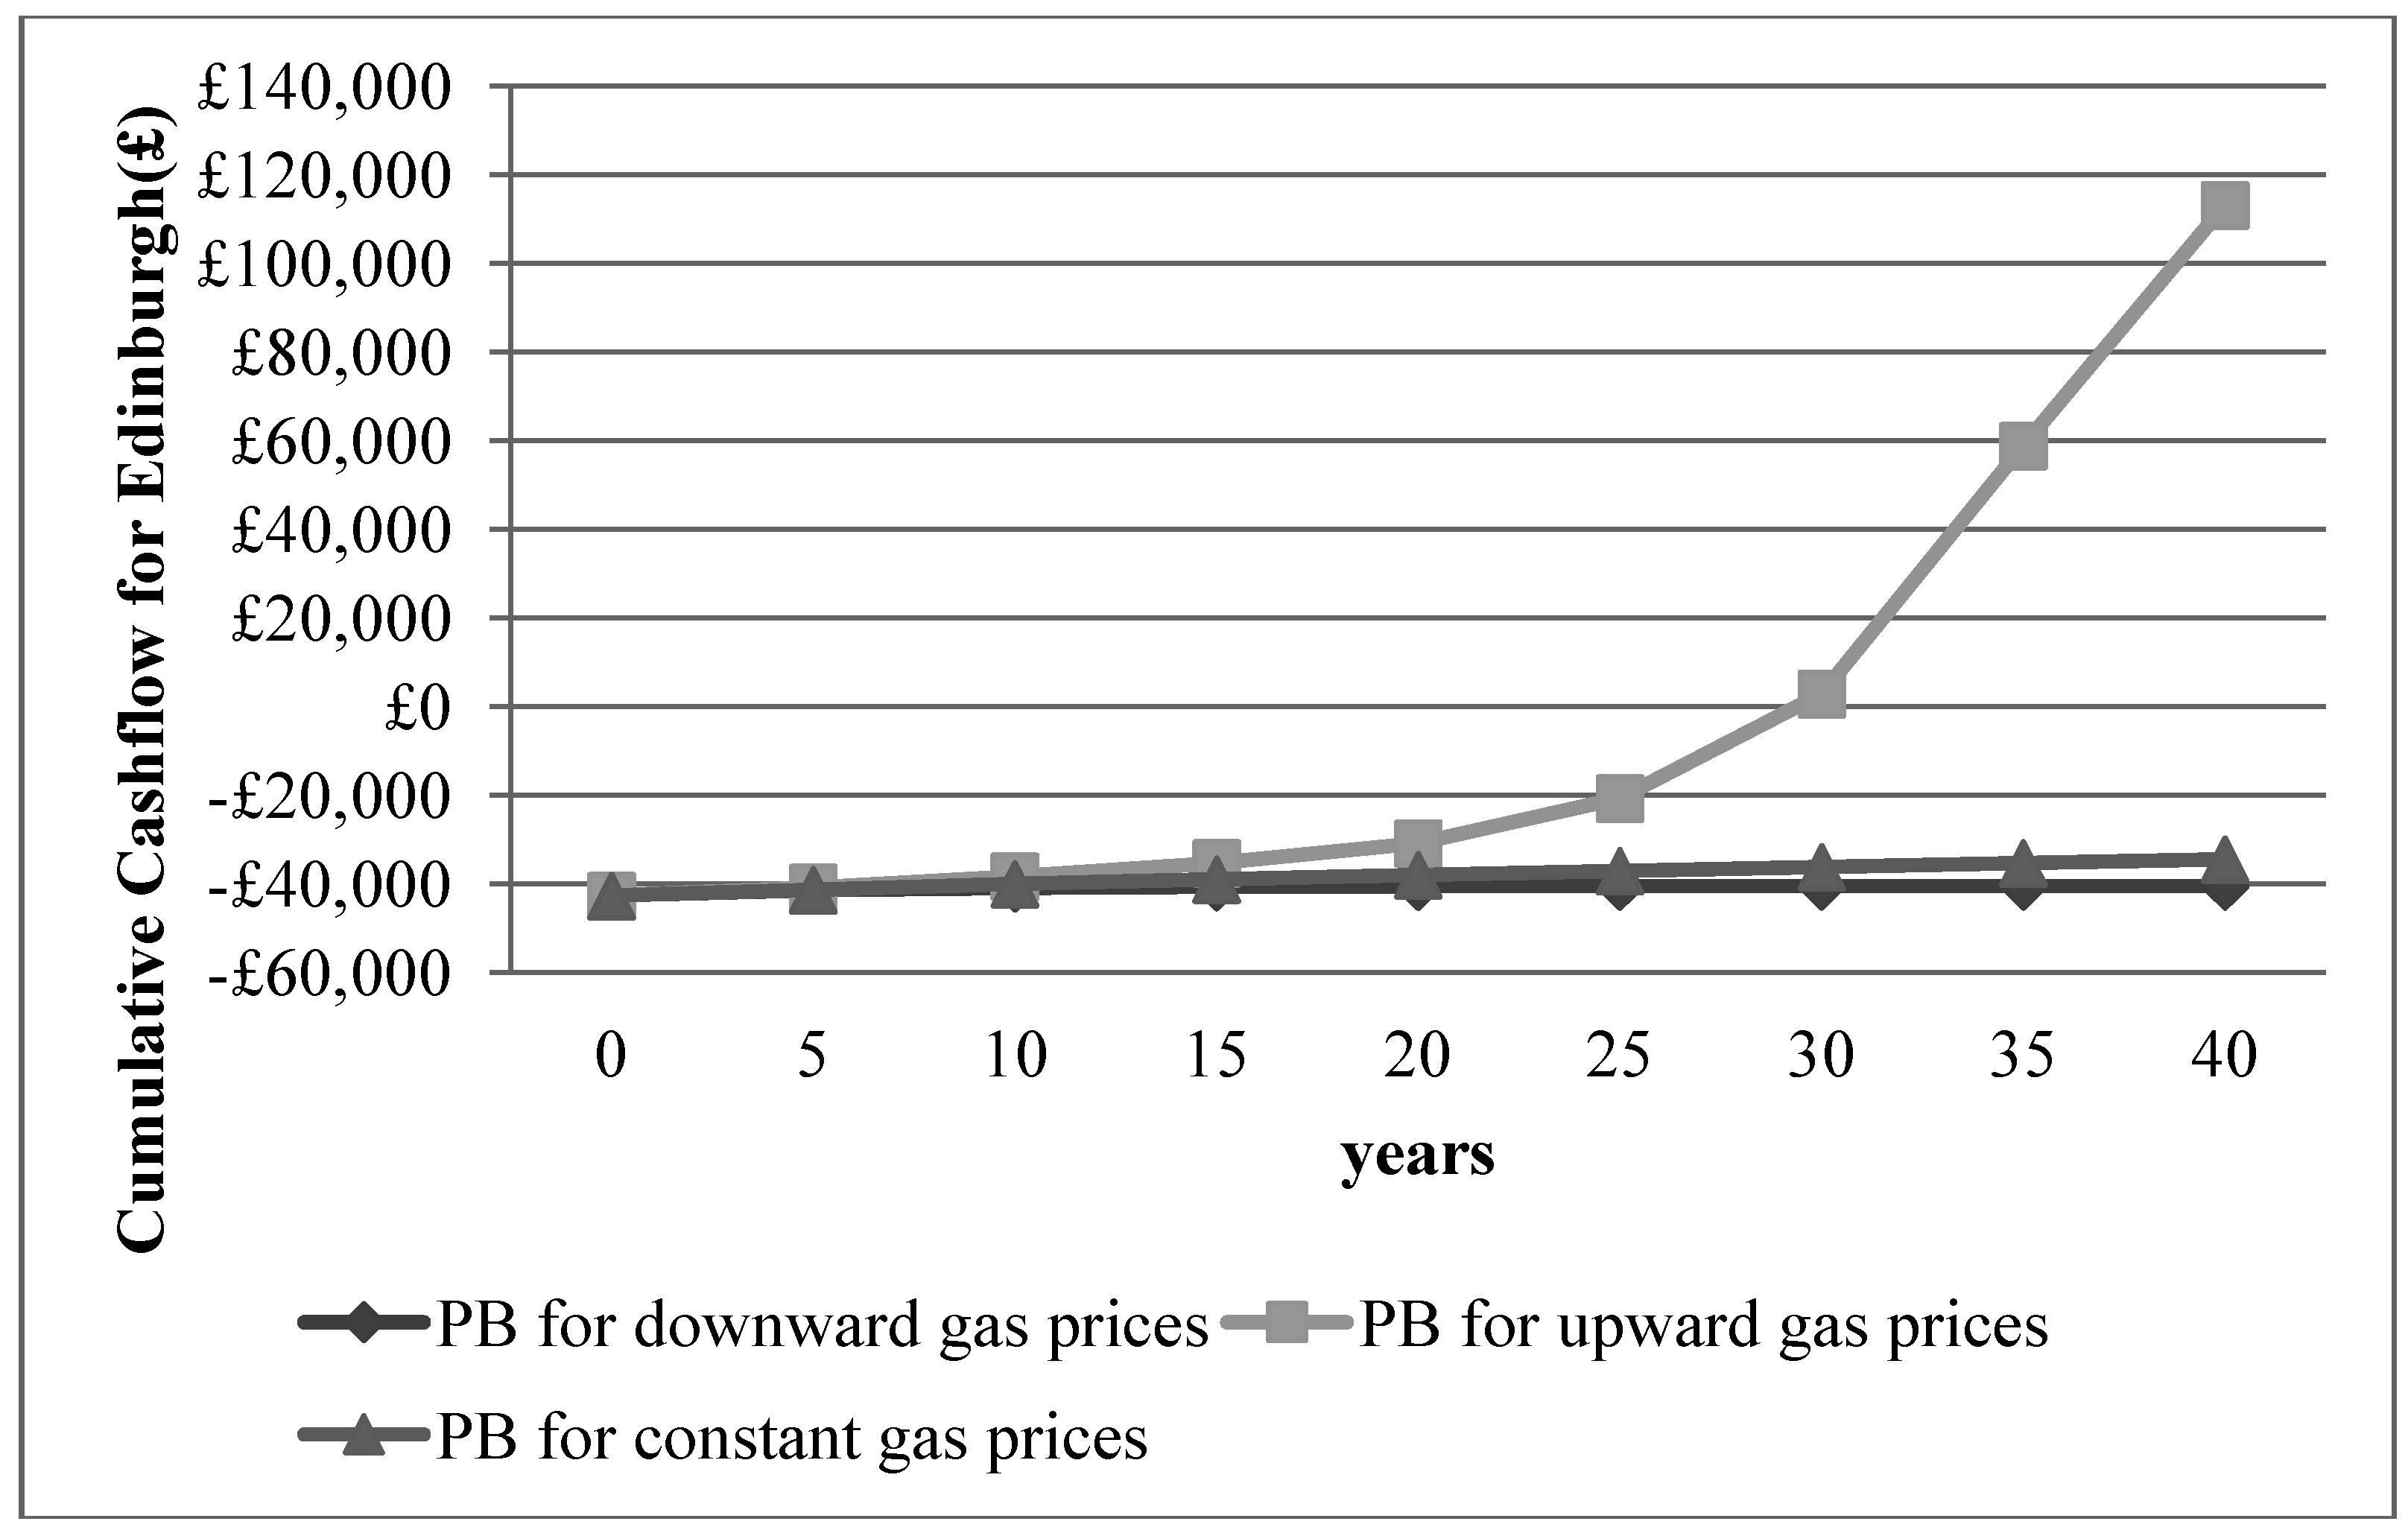
3.9.3. Edinburgh


4. Conclusions
Acknowledgments
Conflict of Interest
References
- Building a Greener Britain. Available online: http://www.fmb.org.uk/news/campaigns/building-a-greener-britain/ (accessed on 11 November 2012).
- Department of Energy and Climate Change. Available online: http://www.decc.gov.uk/assets/decc/What%20we%20do/A%20low%20carbon%20UK/1358-the-carbon-plan.pdf (accessed on 11 November 2012).
- PASSIVHAUS. Available online: http://www.passivhaus.org.uk/standard.jsp?id=122 (accessed on 31 October 2012).
- AECB, Carbon Lite. Available online: http://www.carbonlite.org.uk/carbonlite/passivhaus.php (accessed on 31 October 2012).
- Trafford Eco House. Available online: http://traffordecohouse.wordpress.com/2009/01/03/a-passivhaus-passive-house-renovation/ (accessed on 19 September 2012).
- Technology Strategy Board. Available online: http://www.innovateuk.org/ourstrategy/innovationplatforms/lowimpactbuilding/retrofit-.ashx (accessed on 11 November 2012).
- Plus Dane Group. Available online: http://www.plusgroupltd.org.uk/article.asp?id=389 (accessed on 25 September 2012).
- Bonfield, P. Rising to the refurbishment challenge. Green Build. 4 July 2012. Available online: http://www.environmentmagazine.co.uk/features/green-build/760-rising-to-the-refurbishment-challenge (accessed on 25 September 2012).
- Appendix S: Reduced Data SAP for existing dwellings. Available online: http://www.bre.co.uk/filelibrary/accreditation/scheme_standards/SAP_2009_9-91_Appendix_S_January_2012.pdf (accessed on 18 December 2012).
- Low Energy Building Database. Available online: http://retrofitforthefuture.org/projectPDF.php?id=77 (accessed on 18 December 2012).
- IPCC (Intergovernmental Panel on Climate Change), The Physical Science Basis: Contribution of Working Group I 2007; Cambridge University Press: Cambridge, UK, 2007.
- University of Southampton, Sustainable Energy Research Group. Available online: http://www.serg.soton.ac.uk/ccweathergen/ (accessed on 19 September 2012).
- Eames, M.; Kershaw, T.; Coley, D. On the creation of future probabilistic design weather years from UKCP09. Build. Serv. Eng. 2010, 32, 127–142. [Google Scholar] [CrossRef] [Green Version]
- ISO (International Organization for Standardization). Task Group 4: Life Cycle Costs in Construction. LCC as a contribution to sustainable construction—Final; David Langdon Management Consulting: London, UK, 2003. Available online: www.ceetb.eu/docs/Reports/LCC FINAL REPORT-2.pdf (accessed on 15 February 2013).
- Sodagar, B.; Rai, D.; Murphy, J.; Altan, H. The role of eco-refurbishment in sustainable construction and built environment. In Proceedings of the 3rd CIB International Conference on Smart and Sustainable Built Environments, Delft, The Netherlands, 15–19 June 2009.
- Bolton, P. Energy Price Rises and Their Impact on Demand—Commons Library Standard Note. Available online: http://www.parliament.uk/briefing-papers/SN04850 (accessed on 19 September 2012).
- Friends of the Earth. Available online: http://www.foe.co.uk/resource/briefings/gas_price_briefing.pdf (accessed on 19 September 2012).
- Ellingham, I.; Fawcett, W. The option to refurbish. In New Generation of Whole-Life Costing: Property and Construction Decision-Making under Uncertainty; Taylor & Francis: New York, NY, USA, 2006; pp. 140–141. [Google Scholar]
- DECC (Department of Energy and Climate Change). Available online: http://www.decc.gov.uk/en/content/cms/statistics/energy_stats/prices/prices.aspx (accessed on 19 September 2012).
- Hanton, A. Small Number with Surprisingly Large Consequences—Why the Government Choice of Discount Rate Should Interest Everyone. Available online: http://www.storage.co.uk/downloads/a-small-number.pdf (accessed on 10 Aug 2012).
- Green Book. Available online: http://www.hm-treasury.gov.uk/d/green_book_complete.pdf (accessed on 19 September 2012).
© 2013 by the authors; licensee MDPI, Basel, Switzerland. This article is an open access article distributed under the terms and conditions of the Creative Commons Attribution license (http://creativecommons.org/licenses/by/3.0/).
Share and Cite
Mohammadpourkarbasi, H.; Sharples, S. The Eco-Refurbishment of a 19th Century Terraced House: Energy and Cost Performance for Current and Future UK Climates. Buildings 2013, 3, 220-244. https://doi.org/10.3390/buildings3010220
Mohammadpourkarbasi H, Sharples S. The Eco-Refurbishment of a 19th Century Terraced House: Energy and Cost Performance for Current and Future UK Climates. Buildings. 2013; 3(1):220-244. https://doi.org/10.3390/buildings3010220
Chicago/Turabian StyleMohammadpourkarbasi, Haniyeh, and Steve Sharples. 2013. "The Eco-Refurbishment of a 19th Century Terraced House: Energy and Cost Performance for Current and Future UK Climates" Buildings 3, no. 1: 220-244. https://doi.org/10.3390/buildings3010220