Article

Historical Consumption of Heating Natural Gas and Thermal Monitoring of a Multifamily High-Rise Building in a Temperate/Cold Climate in Argentina

by
Celina Filippín
1,* and
Silvana Flores Larsen
2
1
National Research Council, Av. Spinetto 685, CP 6300, Santa Rosa, La Pampa, Argentina
2
Non Conventional Energies Research Institute, Av. Bolivia 5150, CP 4400, Salta Capital, Argentina
*
Author to whom correspondence should be addressed.
Buildings 2012, 2(4), 477-496; https://doi.org/10.3390/buildings2040477
Submission received: 7 October 2012 / Revised: 9 November 2012 / Accepted: 22 November 2012 / Published: 4 December 2012
(This article belongs to the Special Issue Sustainable Design and Construction)

Abstract

:
This paper analyzes the historical consumption of natural gas in a multifamily high-rise building and the monitored winter thermal behavior of an apartment sample. The building is located in the center of Argentina (latitude: 36º27’S; longitude: 64º27’W), where the climate is a cold temperate with an absolute minimum temperature that may reach −10 °C. The building has two blocks, North and South. The building’s annual gas consumption and its variability between 1996 and 2008 are shown. The South block consumed 78% more gas, a situation expected due to lower solar resource availability and greater vulnerability regarding strong and cold SW winds. Indoor temperatures monitored during 2009 in four apartments are described. The outdoor minimum temperature reached −5 °C, with solar irradiance around 500 W/m2 at midday. Results showed that the average indoor temperatures were 20.1, 20.6, 24.0 and 22.1 °C. The highest consumption value corresponded to the apartment exposed to SW cold winds. Compared to the rest of the building, the apartment on the top floor consumes 59% more energy than the average for the gas consumed throughout the year. The authors assume that the energy potentials of intervention are different, and not necessarily all the apartments should have the same technological response.

1. Introduction

Buildings provide human beings with a life and work environment. 80% of human beings’ lives take place inside buildings; thus, special attention must be paid both to the design of quality indoor environments and to the assessment of their energy-environmental performance [1]. The premonitory vision of the architect Buckminster Fuller regarding the finite nature of world resources dates back to the end of 1920 [2]. But, it was only in 1973, as a result of high oil prices, when energy conservation strategies appeared to be part of the environmental agenda. The building sector is particularly under pressure: approximately half of the world’s resources are destined to condition indoor environments. The building sector constitutes itself as one of the main protagonists of environmental problems due to the over-use of non-renewable resources, land use and energy consumption during the buildings’ life-cycle. Urge-Vorsatz and Novikova [3] stated that during 2004, 37% of the world’s energy was used by buildings, and this figure will reach 42% by 2030. In Europe during 2000, 45% of the produced energy was consumed by the building sector and 50% of the generated pollution had its origin in the same sector [4].
According to Ganem, Esteves and Coch [5], the built area is a valuable cultural resource, which constitutes the city’s fabric and image and which contributes to making up the identity of its inhabitants. It also represents huge amounts of material resources and built-in energy. Buildings are unique in their longevity compared with other industrial products [6]. Morillón Gálvez [7] states that construction processes that consume natural resources along time cause different environmental impacts; for instance, popular architecture and high-tech architecture have a minimum impact (1014 ergs = 107 J) and a severe one (1024 ergs), respectively.
Energy use plays an important role in buildings’ design and operation, so careful and long-term decisions taken during the design stage can significantly improve their thermal performance and reduce their energy consumption [8]. Buildings consume energy in many different ways, i.e., through construction materials, components and systems (built-in energy) and during the distribution and transportation stage of materials to the construction site (grey energy). Also, buildings consume energy as a result of the construction process (induced energy) and through their installed equipment (operative energy). Additionally, they consume energy as a result of maintenance, remodeling and final distribution. Thus, in order to be energy efficient, a building should try to reduce its consumption by all means [9].
The last report from the Intergovernmental Panel on Climate Change states that improvement in the energy efficiency of buildings could potentially reduce projected global emissions up to 29% by 2020, and up to 40% by 2030 [10]. Furthermore, energy efficiency is seen as the most effective way of improving the availability of energy supply, reducing carbon emissions and increasing competitiveness, while enforcing these energy-saving measures. The major obstacles to increase energy efficiency in the building sector are institutional barriers and market failures, rather than technical problems [11]. Flavin [12] said that the greatest potential of energy saving lies in the most basic elements of the energy economy: “buildings”. Buildings worldwide account for as much as 45% of primary energy resources and a similar share of greenhouse-gas emissions that makes buildings the biggest single contributors to anthropogenic climate change [11].
Thus, there is an urgent need for serious energy policies to deal with this problem. Particularly, policy measures to improve building insulation must be gradual, because it strongly depends on the availability of construction materials and methods, training of builders and household-owners, economic incomes of the owners, culture and education, environmental awareness, and so on. The regulations should be applied in the whole country, including warm climate areas, where a good insulation standard could significantly reduce the energy consumption for air conditioning.
In order to promote energy conservation in the residential sector, and to mitigate the CO2 emissions, it is important to examine the residential energy consumption pattern. The total energy use in households was studied in developed and developing countries: Biesiot and Noorman [13] studied the consumption of households in the Netherlands; Reinders et al. [14] performed the study for households in the European Union; Cohen et al. [15] described the energy requirements of dwellings in Brazil; Pachauri and Spreng [16] studied the case of India; and Carlsson-Kanyama [17] performed a similar study for Sweden. The use of non-conventional energy sources, the energy perspective in Argentina and the possibility to revise Regulations and Building Codes in Argentina, led many authors towards an evaluation of residential buildings in order to analyze the thermal-energy behavior, comfort conditions, energy consumption and users/dwellers’ behavior [5,18,19,20,21,22,23,24,25,26,27,28,29,30,31,32].
Argentina is a very vulnerable country due to its high dependency on fossil fuels: oil and natural gas provide around 90% of the total energy consumed in Argentina. Around 22.5% of the delivered gas in Argentina is destined to the residential sector, and 60% of households are connected to the gas network [33]. The lack of codes regulating energy efficiency of buildings, the high gas-dependence of the Argentinean energy consumption matrix, the lack of policy and investment on energy generation and the fast growth of energy consumption in the last decades make the energy situation in Argentina a cause of deep concern. In the last years, the high consumption levels of natural gas during winter caused a strong restriction—between 20 and 50%, of the gas delivered to the industrial sector and to the power stations—in order to supply it to the top priority residential sector. Nationwide fuel prices are between five and 15 times lower than international prices [34], natural gas being the cheapest per energy unit. Thus, the low energy bills discourage investments in technological improvements [35]
Furthermore, the subsidies are not income-sensitive and not equally distributed, i.e., all households enjoying natural gas pay the same unit price of heavily subsidized energy, which is probably the single, most convincing reason for middle-high and high income households not to choose better thermal performance buildings, even though they can afford them. The availability of cheap gas is certainly not a motivation for improving insulation, but this situation will not last longer in time; at the current production rate, the oil and natural gas resources in Argentina will not last beyond 2012 and 2015, respectively [36,37].
This work is made to understand how current policies related to energy use could be improved for increased residential energy efficiency in Argentina. Within this framework, the present article has as a general aim to evaluate the historical annual and winter thermal energy behavior in apartments of a multifamily tower building located in Argentina in the central region.
Specific objectives are: to evaluate historical heating natural gas consumption in the different apartments along the period 1996-2008; to analyze, through monitoring, the thermal-energy behavior of an apartment sample with different orientations in July 2009; to study indoor temperature, heating energy consumption and comfort conditions; to compare heating energy consumption during 2009 and the historical average consumption; to study the technical feasibility of intervention to improve envelopes to reduce consumption of conventional energy.

1.1. Geographical Localization and Description of the Study Building

Figure 1 shows the geographical localization and a panoramic view of the city of Santa Rosa (36°27’S, 64°27’W, 182 m above sea level), capital of the province of La Pampa. It belongs to the III bio-environmental region, IRAM Norm 11603 [38], where the climate is a cold temperate with an absolute minimum temperature that may reach −10 °C and where the SW winds prevail. Table 1 shows the most important climatic variables in the region.
Figure 1. Localization of Santa Rosa and a panoramic view. The picture in the lower right shows the change in the profile of the urban edification and the morphology of the city.
Buildings 02 00477 g001
Figure 2 shows the psychrometric chart for monthly average temperature and humidity, average minimum and maximum temperature, minimum and maximum relative humidity and average maximum temperature. The chart was drawn using software developed by Gonzalo [39]. Comfort temperature (TCON), which serves as the basis to determine the different zones, depends on the annual mean temperature (TMAN) through the following expression: TCON = 17.6 + 0.31 × TMAN. For the study city, the comfort temperature is 22.4 °C [40]. To the left, minimum temperature and maximum relative humidity values in July show that auxiliary heating is needed to reach the comfort zone. The figure shows the design strategies considered adequate to reach the comfort zone during the winter months. Even though for temperature mean medium and maximum values it would be enough to use the solar resource, for minimum temperature values, mechanical auxiliary heating is required. The situation is exacerbated if we consider that the minimum absolute temperature was around −11.3 according to Table 1.
Figure 2. Winter psychrometric chart. The average minimum temperature values during June, July and August indicate that mechanical auxiliary heating is required. The solar resource is not enough for these values.
Buildings 02 00477 g002
Table 1. Average of climatic variables during the period 1996–2008 and geographical location of Santa Rosa: Latitude: 36°57’; longitude: 64°27’ y height above sea level: 189 m [41,42].
PeriodClimatic variables1996–20082009
Annual valuesTemperaturemaximum mean22.1 °C23.6 °C
minimum mean8.7 °C8.6 °C
Mean15.4 °C16.4 °C
Relative humidity68%72%
Solar radiation over horizontal surface annual mean16.3 MJ/m2-
JulyTemperatureminimum mean [2]2.1 °C0.1 °C
Mean8.2 °C7.5 °C
maximum mean [1]14.3 °C15 °C
minimum absolute temperature during the period−11.3 °C−9 °C
Thermal amplitude [1,2]12.2 °C-
Wind velocity mean10 Km/h-
Solar radiation over horizontal surface mean8.1 MJ/m2-
Heating Degree-days (Tbase = 18 °C)15451480
Figure 3 shows the study building’s plant. It has two blocks of 11 floors each (2–12); each ground has five apartments: A, B, C, D and E. Apartments A and B in the block looking onto San Martin Avenue have part of their façade facing north. Apartments C, D and E in the back block have part of their façade facing south and looking towards the block’s center. The building is not shaded by other buildings, but there is a reduction in the availability of the solar resource on the North façade in the South tower (to see the Figure 4). The technology of the studied multifamily buildings is conventional and of common use in the country: independent reinforced concrete with a vertical and horizontal envelope without thermal insulation. The walls are of hollow ceramic bricks, plastered on both sides (U = 1.84 W/m2 °C) [43]. The roof consists of a concrete flat slab with its corresponding waterproof insulation (U= 3.82 W/m2 °C). Hermetic aluminum windows with PVC roller shutters, most of them with single glass, complete the design. The label category for each apartment is higher than the H value of IRAM Norm 11900 E1 (2009), which does not qualify from an energy-saving perspective [44]. Table 2 shows some dimensional and energetic indicators.
Figure 3. Gemelius Building: (a) first level of apartments; and (b) from third to twelfth floor.
Buildings 02 00477 g003
Figure 4. Building’s Views. (a) North façade; and (b) Northwestern façade.
Buildings 02 00477 g004
Table 2. Some dimensional and energetic indicators.
Area (m2)Volume (m3)Vertical envelope (m2)Vertical envelope to windows area ratio (%)ApartmentExternal surface to heated volume ratio (%)G-value [45] (W/m3 °C)1
Floors
1–11121–1112
892316414.4A0.280.662.73.4
1293358320.5B0.250.632.63.3
1042707216.6C0.270.652.53.3
471221936.4D0.160.542.22.9
701825317.0E0.290.672.73.4
1 G-value (Volumetric Heat Loss Coefficient): the total heat loss of a dwelling through the fabric and ventilation divided by the heated volume and the temperature at which the loss occurs (W/m3 °C).

2. Results and Discussion

2.1. Historical Natural Gas Consumption for Heating during the Period between 1996 and 2008

Table 3 shows the annual average natural gas consumption of 22 apartments, which total 41% of all apartments. The same table shows the standard deviation, the consumption variation coefficient among the studied years and the annual average historical consumption of natural gas destined exclusively to air heating. Only data from apartments whose records are uninterrupted and show little variability of the natural gas consumption among the study years were analyzed. This would assure the permanence of the same user in the apartment.
According to the average percentage estimated by the fluid distribution company, the 67% of the natural gas consumed in the study area is used to heat rooms [46]. Considering this percentage, each apartment’s heating consumption was calculated on the basis of the gas recorded by each of them. Results show that natural gas historical annual heating consumption per m2 of useful surface from the second to the top floor varied between a minimum of 59.0 kWh/m2 (apartment 3C) and a maximum of 244.1 kWh/m2 (apartment 9A). The sample average is 111.9 kWh/m2, and the variation coefficient among apartments is 40.2%. The apartment located on the top floor (12E) consumes during the same period 176.3 kWh/m2, which shows 60% more heating gas than the building’s average due to the higher energy losses through the roof without thermal insulation and a thermal transmittance around 3.82 W/m2 °C, which is well above the Norma IRAM.
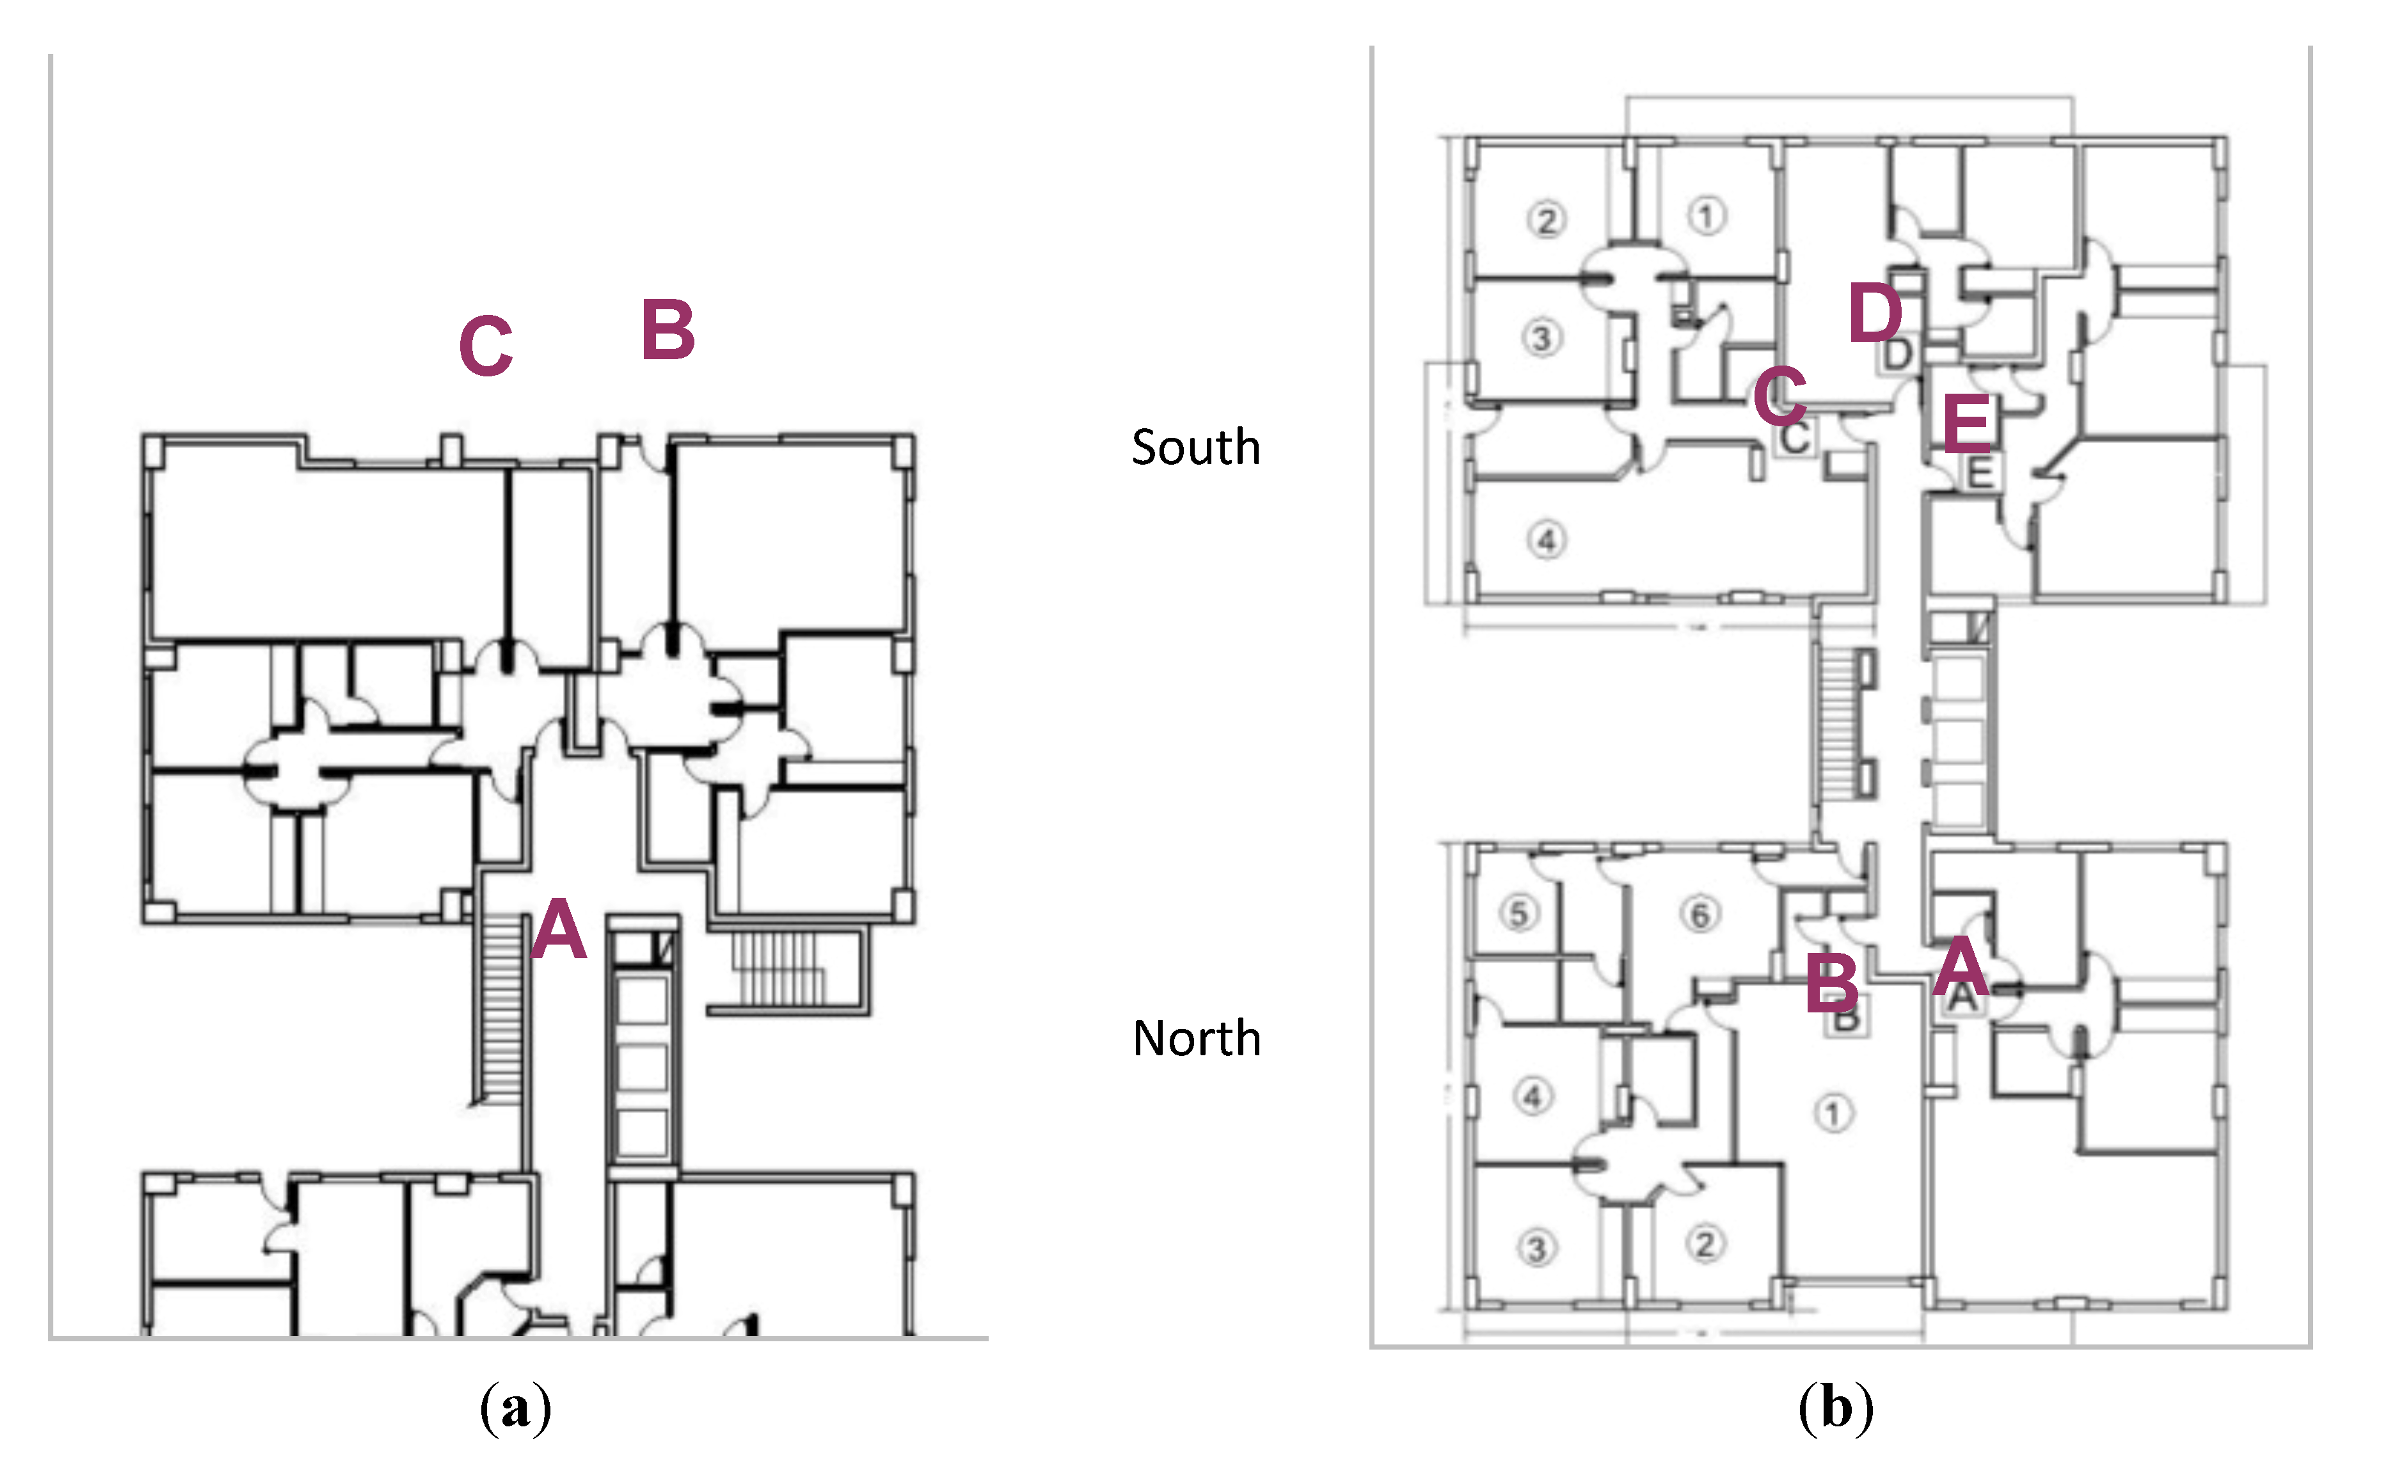
Variability among apartments’ consumption can be explained if, apart from the conditions of use, which are assumed to be different, other aspects are taken into account, such as orientation, shading provided by the North Block to the South Block—thus reducing solar recourse availability—and, also, heat transfer among the different apartments through the bordering walls and/or through the external envelope without insulation. In order to establish a comparison between the A, B, C, D and E apartments on all the floors, they were grouped, and both average and variability were calculated according to their orientation.
Table 3. Average and variability of historical annual natural gas consumption and heating energy consumption estimated according to the percentage defined by the fluid distribution company (period: 1996–2008).
ApartmentGas total annual consumption (m3) [1]CV (%)Annual heating natural gas consumption.
67% of [1]. 1 m3 = 8400 kcal
m3kWhkWh/m2
2A3833.310.72568.325025.6114.8
3A1175.211.5787.47672.386.2
3B1580.813.91059.110320.280.0
3C940.214.9629.96138.159.0
4A1812.715.71214.511834.2133.0
4B2046.517.51371.213360.5103.6
6B1378.812.0923.89001.569.8
7E1442.410.4966.49416.7134.5
8C3146.310.92108.020540.6197.5
8E1206.513.6808.47876.6112.5
9A3327.59.52229.421723.5244.1
9D737.712.8494.34816.1102.5
10A834.820.4559.35450.089.0
10B2069.612.81386.613511.3104.7
10D964.510.4646.26296.7134.0
10E1259.215.6843.78220.7117.4
11A1707.716.71144.211148.7125.3
11B1538.213.31030.610042.177.8
11C1005.515.6673.76564.463.1
11D628.211.3420.94101.287.3
11E1310.513.7878.08555.6122.2
12E1890.614.91266.712342.7176.3
Average-111.9
SD1-44.6
CV2-40.2
1 SD (Standard deviation); 2 CV (Coefficient of variation): Standard deviation/Average × 100.
Table 4 shows average consumption rates according to orientation. Apartment B, facing NE has the highest solar resource availability through its transparent area facing north in the living-room and two of the bedrooms; this apartment shows the lowest heating energy consumption/m2. The highest consumption corresponds to apartment E, facing SW, strongly exposed to cold winds. Apartment D, facing south, has the least envelope surface in contact with the exterior area and shows 27.3% less energy consumption if compared to apartment E, the one with the greatest exposure to the exterior. Regarding the variation coefficient among floors, apartment D shows the lowest value (14.8%).
Table 4. Average and variability of heating historical annual consumption (kWh/m2) according to orientation. Period 1996–2008 (To see Figure 3).
Statistical indicatorsBlock northBlock south
A: facing to the northwestB: facing to the northeastC: facing to the southeastD: facing to the southE:facing to the southwest
Included 9AWithout 9AIncluded 8CWithout 8C
Average127.4104.187.2109.058.0121.0161.0
SD63.129.816.088.610.917.934.9
CV49.528.618.381.318.814.821.7
Among the C apartments, the variation coefficient is 81.3%, which would be associated to the user’s thermal requirements (apartment 8C = 197.5 kWh/m2). Without the 8C apartment, the average descended to 58 kWh/m2 and the CV to 18.8%. The A apartments’ sample has a variation coefficient of more than 49.5% due to the high consumption in apartment 9A (244.1 kWh/m2). If it is not considered, the average and the CV drops to 101.1 kWh/m2 and 28.63%, respectively. These two apartments (8C and 9A) deserve an energy evaluation and thermal monitoring as special cases. It is necessary to know the evolution of indoor temperatures and the period of use of heating systems.
The apartment A, without apartment 9A, shows 16.2% more heating energy consumption than its neighboring apartment. Apartment A has less north solar gains availability, and it may be possible that there is heat transfer to apartment B. We assume that there is heat transfer among the units, for instance between apartment A and B, perhaps between D and E. It may be possible that apartments A and E, apart from their over-exposure to cold winds from the SW, may be releasing heat to the neighboring apartments, and consequently need more heating gas. The top floor consumed 59% more gas than the average heating gas consumed in the rest of the building.
Without 9A and 8C, apartment could be grouped in two blocks: North and South. Total consumption is 191.3 and 340 kWh/m2 for the North and South blocks, respectively. The South block consumed 78% more gas, a situation expected due to lower solar resource availability and greater vulnerability regarding strong and cold SW winds.
The analysis of gas historical consumption during July and August can be observed in Table 5. The top floor consumed 87% more gas than the average heating gas consumed in the rest of the building (25.1 kWh/m2).
Table 6 shows the historical average consumption during July, according to orientation. Including apartment 8C, apartment B, facing north and with the highest solar resource availability, shows the lowest value. The highest consumption value is that of apartment A, considering apartment 9A. Following the same pattern of annual consumption, we could say that there is heat transfer from apartment A to B, heat that would improve its thermal comfort conditions without increasing energy consumption. Apartment E shows the least natural gas historical consumption dispersion (CV = 4%) and one of the highest historical gas consumption/m2, but not the highest, as occurred with the annual consumption. It is possible that due to its location, the heating period may extend longer.
Table 5. Average and variability of historical heating gas natural consumption during July and August (period = 1996–2008).
ApartmentJuly–August (m3) [1]CV (%)July (59.2% of [1])
July (m3) [2]Heating (75% of [2])kWh/m2
(m3)kWh 1 m3 = 8400 kcal
2B1321.610.2782.4586.85717.726.2
3A433.313.9256.5192.41874.621.1
3B56918.4336.8252.62461.719.1
3C349.413.6206.8155.11511.614.5
4A615.814.7364.6273.42664.229.9
4B731.416.1433.0324.73164.324.5
6B461.217.8273.0204.81995.315.5
7E521.614.4308.8231.62256.632.2
8C979.212.8579.7434.84236.340.7
8E389.417.7230.5172.91684.724.1
9A1077.89.4638.1478.54662.952.4
9D200.129.7118.588.8865.718.4
10A315.130.7186.5139.91363.215.3
10B702.112.3415.6311.73037.523.5
10D303.811.0179.8134.91314.328.0
10E412.217.3244.0183.01783.325.5
11A543.023.4321.5241.12349.226.4
11B331.418.5196.2147.11433.711.1
11C364.314.1215.7161.71576.115.2
11D202.524.7119.989.9876.118.6
11E434.113.3257.0192.71878.124.1
12E730.417.9432.4324.33160.045.1
Average25.1
SD10.3
CV41.0
Table 6. Average and variability of historical natural gas consumption to heating during July according to orientation in kWh/m2. Period 1996–2008.
Statistical indicatorsBlock NorthBlock South
A: facing to the northwestB: facing to the northeastC: facing to the southeastD: facing to the southE: facing to the southwest
Included 9AWithout 9AIncluded 8CWithout 8C
Average28.623.820.727.614.921.724.8
SD12.75.74.218.50.55.41.0
CV44.623.920.367.03.225.14.0
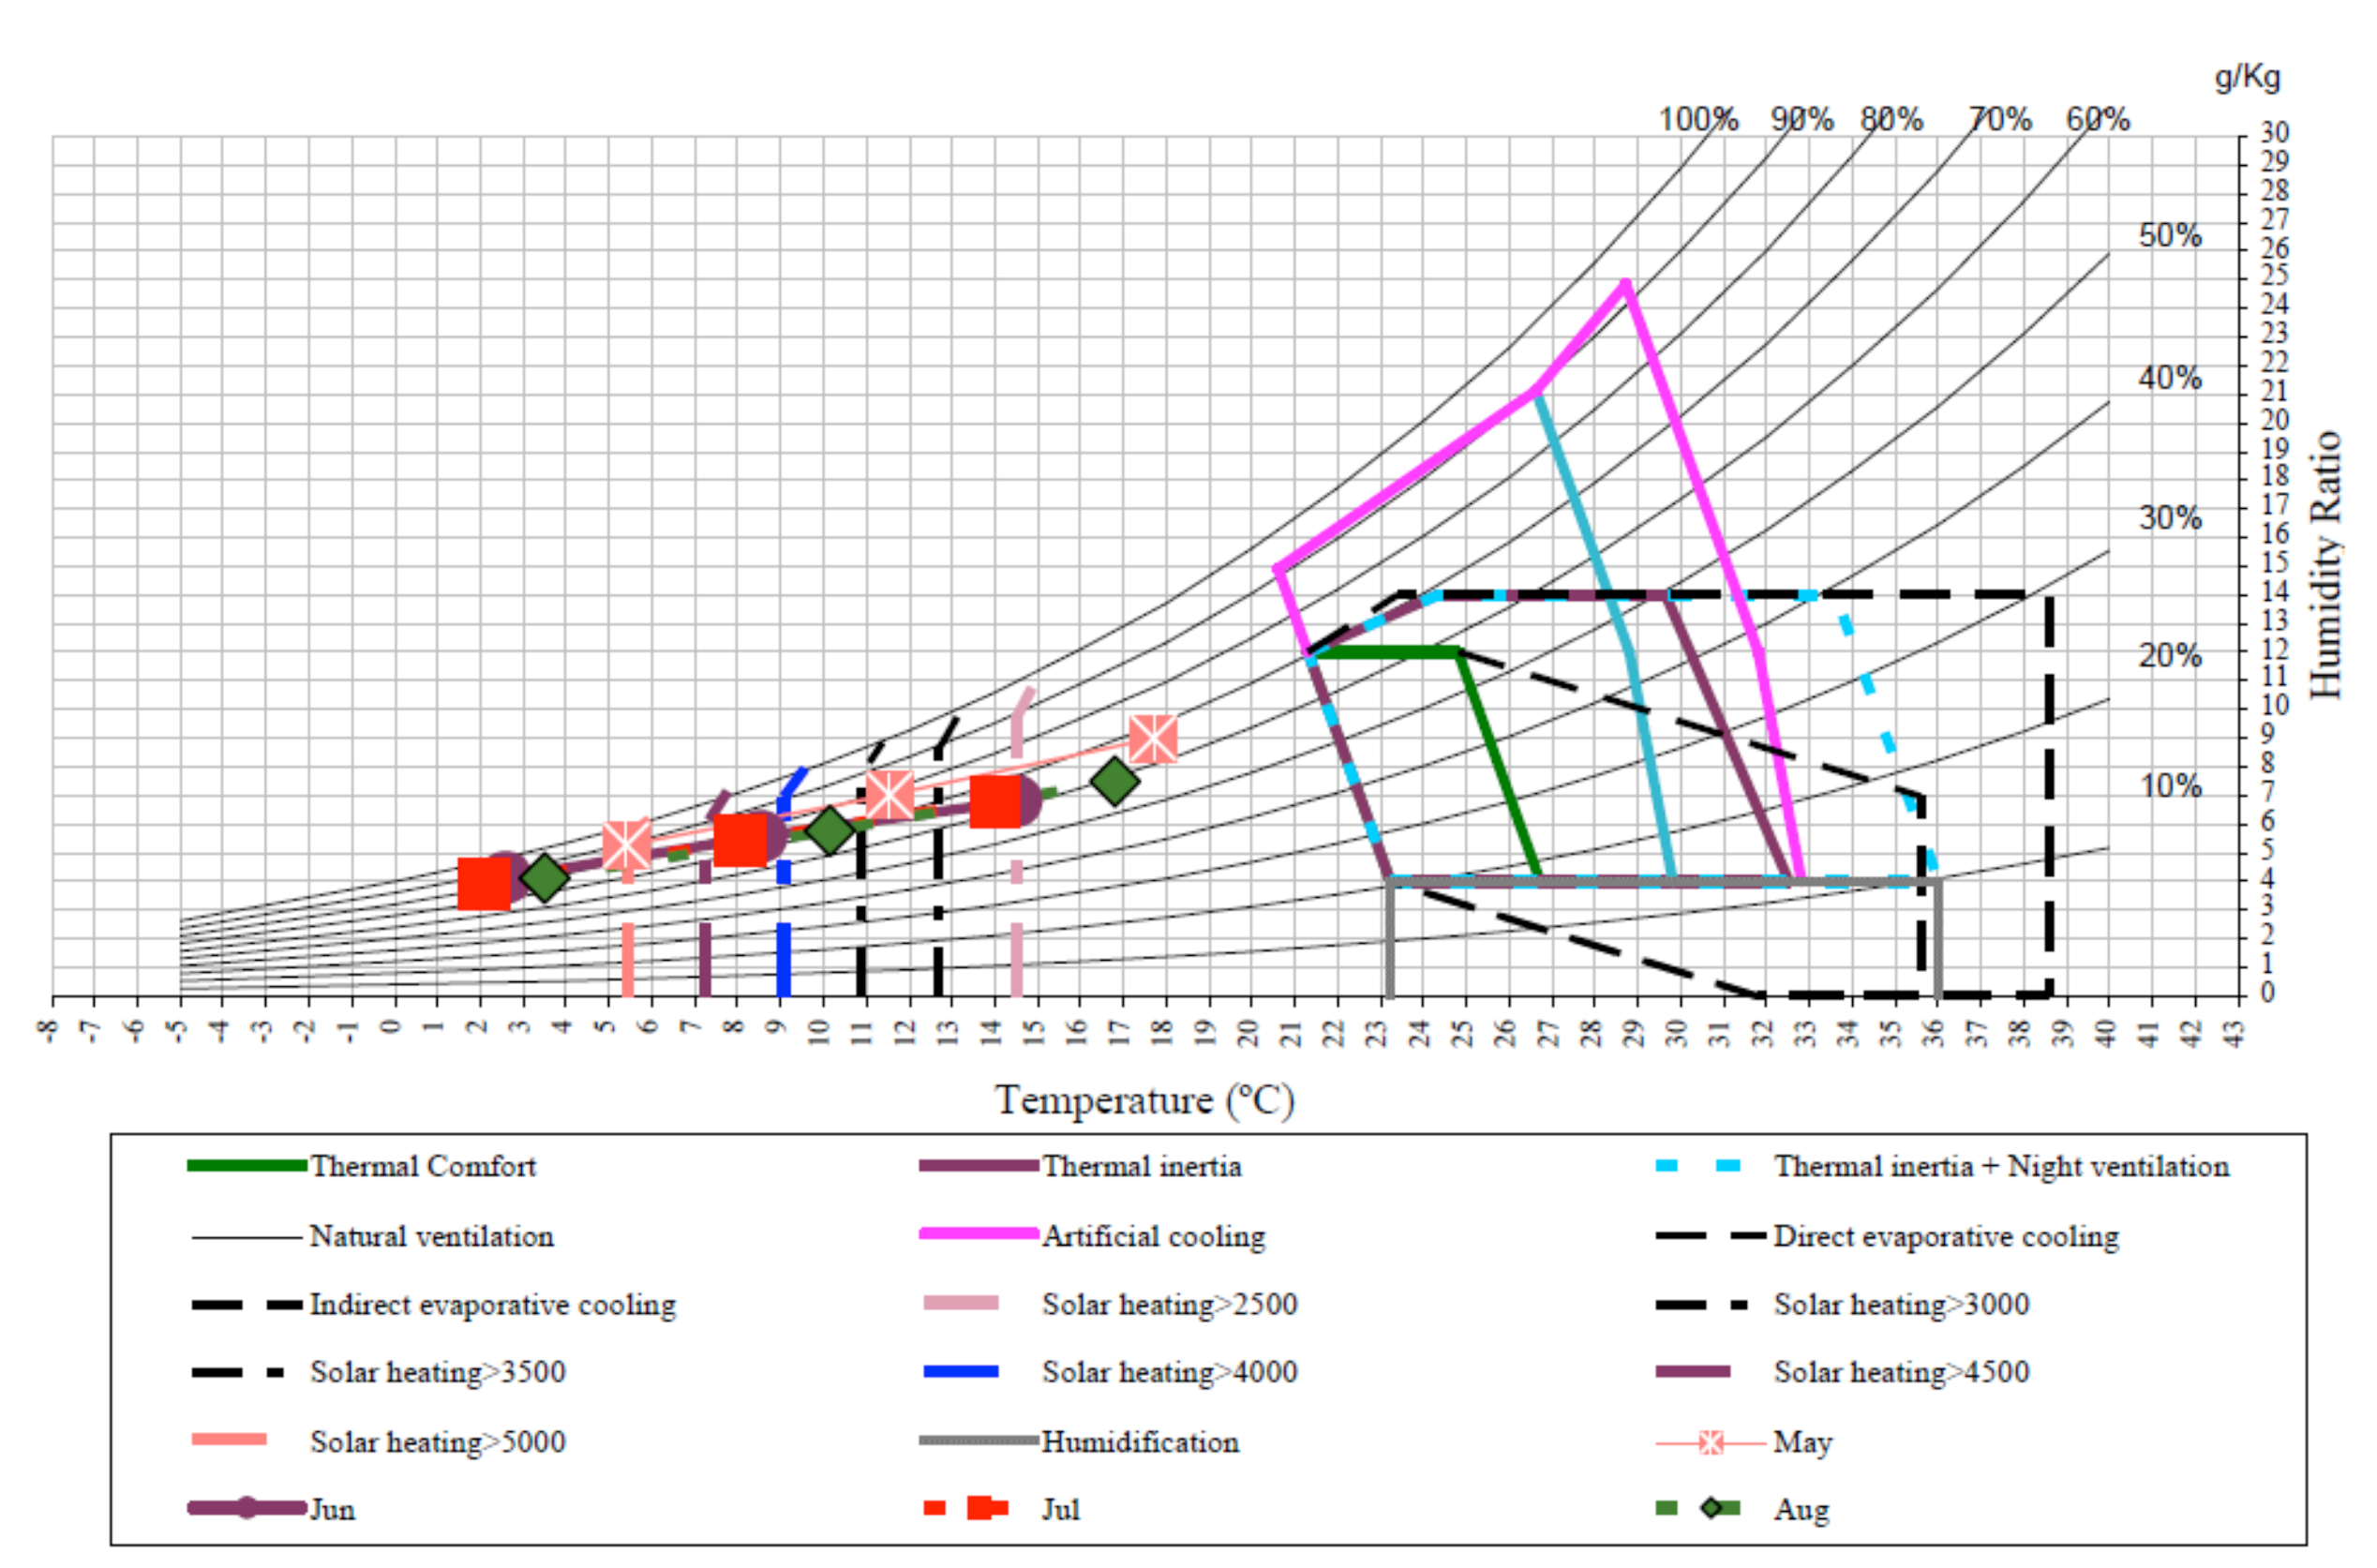
Excluding 9A and 8C, and considering both blocks separately, the South block consumes 38% more heating gas than the North one. The difference between the two blocks decreased in relation to the historical annual consumption (78%), a situation that allows us to infer the potential of the use of the solar resource for heating the building, according to Givoni’s design strategies.
These two apartments (8C and 9A) deserve an energy evaluation and thermal monitoring as special cases in future research. Anyway, the variability of consumption during July in the period 1996–2008 is low. The records are: 12.8 and 9.4% for apartments 9A and 8C, respectively. These values could show that throughout the period, users maintain the same thermal conditions.

3. Energy-Thermal Experimental Monitoring of Floor 11 during July 2009

One of the objectives of this work was to analyze the thermal behavior of a sample of differently oriented apartments. To be successful and accurate, such a monitoring requires users’ adequate predisposition. In the multi-family building under study, and in view of the personal interest of one of the owners toward this experiment, we decided to monitor floor 11. On the other hand, it was important that all the apartments had been occupied by the same dwellers for a number of years. The results of the thermal monitoring of apartments B, C, D and E, floor 11 for the period July 15 to 31 2009, and their gas consumption (total and heating) for the period July–August 2009, are described. Figure 5 shows the results of the thermal monitoring. HOBO data collectors were set up in the apartments’ different rooms, and afterwards, weighted average temperatures were calculated to obtain each apartment’s representative temperatures. The monitoring period had mostly clear-sky days, with a solar irradiance over the horizontal surface that reached 500 W/m2 at midday. Outdoor temperatures were between −5 °C and 18 °C, with a mean temperature of 6.3 °C for the period. The temperature minimum mean was 1.6 °C lower than the temperature minimum mean during the period 1996–2008 (Table 1). The temperature minimum absolute during the experimental period was −5.3 °C, 6 °C above that recorded in the period 1996–2008.
Figure 5. Thermal behavior between 15 July 2009 and 31 July 2009.
Buildings 02 00477 g005
The apartments were monitored at a logging interval of 15 min. In each room inside the building, one data logger sensing air temperature was placed at 1.5 m over the floor level. Data loggers HOBO U8 and U12 (models 001 and 011) were used to sense indoor and outdoor temperature and relative humidity, while a Kipp&Zonen Model CM3 pyranometer sensed the solar irradiance on horizontal surfaces.
Regarding the indoor temperatures, it can be observed that all the apartments reached thermal comfort during the period, with temperatures between 18 °C and 26 °C. Indoor temperature never went beyond 26.5 °C. Apartment 11D is the one that showed the highest indoor temperatures (23.9 °C, average) and 11B the lowest indoor temperatures (14.2 °C, average). Apartment E was not occupied until July 18 at midday. From that moment onwards, heaters were turned on, and the indoor temperature increased until it reached 25 °C; the temperature does not go beyond 22.5 °C and does not fall, either, under 17 °C. In this apartment, the effect of turning heating on during the nighttime is noticeable, which, on average, increases the indoor temperature by 2.5 °C. In order to carry out an in-depth energy analysis, the gas consumption during winter—and in particular in July—is studied to add results to the experimental thermal monitoring carried out in 2009, a year that was excluded from the evaluation of the historical consumption.
Table 7 shows the heating energy daily average consumption during the monitoring period and the values of the weighted indoor mean temperature. It can be noticed that apartments D and E, facing south and SW, respectively, reached the highest weighted mean temperature: 23.9 y 22.4 °C, with a daily heating natural gas consumption per square meter of useful surface of 0.8 and 2.2 kWh/m2. The lowest energy consumption corresponded to apartments B and C, 0.6 kWh/m2/day and 0.7 kWh/m2/day, respectively, and a weighted mean temperature of 20.5 °C in apartment B and 20.6 °C in apartment C. It is certain that solar resource from the north produces a different thermal sensation, and the dweller can live comfortably with a lower temperature, thus consuming less energy.
Table 7. Natural gas annual consumption during 2009 in apartments on Floor 11. Weighted indoor mean temperature and ∆T indoor-outdoor temperature difference.
ApartmentNatural gas consumptionTemperature (°C)
(m3)kWh
2009July-AugustJuly (59.2% of the two-month period)Heating gas consumption (75% of total consumption)Heating gas consumptionWeighted mean∆T (outdoor mean temperature = 6.3 °C)
kWh/m2kWh/m2/d (during use days)
A1433524310.2232.625.50.8--
B1173339200.7150.511.40.620.514.2
C980352208.4156.314.60.720.614.3
D637272161.0120.725.00.823.917.6
E1325470278.2208.629.02.222.416.1
It may be inferred that the non-monitored apartment A, with direct solar gain, had also reached comfort conditions with a daily heating energy consumption of 0.8 kWh/m2. Some questions come up. First, did the average heating gas consumed by the different apartments on Floor 11 and during the analyzed period allow users to live comfortably? Until 2008, apartment B had consumed in July a daily 0.7 kWh/m2 /day, almost 43% more than the heating gas consumed during the monitoring period. Apartment C consumed, on average, 0.9 kWh/m2/day, 44% more than in 2009. Precisely, the two apartments that during monitoring showed the highest weighted mean temperature D and E consumed until 2008, on average, less heating gas than in 2009, a year in which the absolute minimum temperature in July was −6 °C, 30-tenths below the average value for the period 1996–2008, which showed a standard deviation of 2.6 °C and a variation coefficient of 46.2%. It is difficult to infer the number of variables that take part, especially in relation to the dwellers’ use habits. However, we could suggest that, at least in apartments B and C, which were the ones with higher consumption rates, and during colder winters, the users lived comfortably. It may be possible that in apartments D and E, indoor temperature in the years before the experimental monitoring had been below the recorded values measured during 2009, and as a result of that, energy consumption was lower. Maybe in 2009, the prevalent winds to which these apartments are exposed to had been less strong.

3.1. Energy Analysis in the Rest of the Apartments during 2009

Table 8 shows heating gas consumption during 2009 and, also, the average value between 1996 and 2008. The period of monitoring was more benign than the 1996–2003, but the building’s average in both cases is the same, with a statistically significant agreement according to a regression analysis (R2 = 0.85). On the top floor, which is greatly exposed to outdoor conditions, the heating gas consumption per square meter increased during 2009 with respect to the historical average, which can be associated with the weather conditions. Up to Floor 11, inclusive of 52.4% of all apartments, consumed less heating gas than the average value for the period 1996–2008. In these apartments, the average for the period 1996–2008 was 24.7 kWh/m2, and for 2009, the value was reduced a 13% (21.5 kWh/m2).
What was the thermal behavior of the apartments that had not been monitored? Some inferences can be made due to the fact that all dwellers have different living habits and indoor temperature requirements. Apartments B on the different levels of the building consumed more gas/m2 (between 17.1 and 26.7 kWh/m2) than the monitored 11B apartment (11.4 kWh/m2). We could suggest that the users of the B apartments on the different levels lived comfortably, even more so if it is considered that they have solar gains from the north. Apartments 3C and 8C consumed 9.2 and 41.2 kWh/m2, less and more, respectively, than apartment 11C was monitored (14.6 kWh/m2). In this case, we can be certain that the dwellers of apartment C lived with a mean temperature way above 20.6 °C. Apartments 9 and 10D consumed 19.3 and 22.7 kWh/m2, respectively. In both cases, the values are lower than those shown by the monitored apartment (25.0 kWh/m2), which reached the highest mean temperature (23.9 °C). It may be possible that the mean temperature in the non-monitored apartments was lower. Finally, apartments 8 and 10E consumed 24.4 and 32.1 kWh/m2, respectively, values below and above the ones for the monitored apartment, which reached an average temperature of 22.4 °C. As we did in the case of apartment C, we can assure that the dwellers of apartment 10E lived with a mean temperature way above 22.4 °C.
Table 8. Natural gas consumption.
ApartmentJuly-August 2009kWh/m2
July-August (m3) [1]July (59.2% de [1])
July (m3) [2]Heating (75% of [2])20091996–2008
(m3)kWh (1m3 = 8400 kcal)(Table 4)
2 B1297767.8575.95611.325.726.2
3A332196.5147.41436.316.121.1
3 B509301.3226.02202.117.119.1
3 C222131.498.6960.49.214.5
4A500296222.02163.224.329.9
4 B797471.8353.93448.126.724.5
6 B615364.1273.12660.720.615.5
7E630373.0279.72725.638.932.2
8 C991586.7440.04287.441.240.7
8 E395233.8175.41708.924.424.1
9A910538.7404.03937.044.252.4
9 D210124.393.2908.519.318.4
10A286169.3127.01237.313.915.3
10 B680402.6301.92941.922.823.5
10 D247146.2109.71068.622.728.0
10E520307.8230.92249.732.125.5
11A524310.2232.72267.025.526.4
11 B339200.7150.51466.611.411.1
11 C352208.4156.31522.914.615.2
11 D272161.0120.81176.825.018.6
11 E470278.2208.72033.429.024.1
12 E769455.2341.43327.047.545.1
Average25.124.1
SD10.49.5
CV21.931.3

3.2. Experimentally Evaluated Heating Energy Consumption in Different Typologies of Residential Buildings in the Study Region and in Other Countries, and the Potential of Intervention to Reach Energy Saving

If we consider the average energy heating consumption/m2 (111.9 KWh/m2), the values obtained in this work are higher than those recorded in a previous one about apartments in multi-family block buildings (3 floors) in the city of Santa Rosa, which consumed, on average, 127.5 KWh/m2 (apartment 15, 18, 23 of monoblock 126), reaching comfort in all the assessed apartments [47], which is approximately the difference in terms of energy consumption in both typologies for the city under study. This situation may be expected, among other things, due to the greater compactness, less exposure of the apartments’ envelope to the exterior andheat transfer through the mezzanine. We also agree with the conclusions drawn by Santamouris et al. [48] who said that, “Heating energy and electricity consumption is higher in low-income groups due to the poor energy quality of their housing envelope.” Nemry et al. [49], on their part, from the perspective of the life cycle, suggest that multifamily tower buildings have less environmental impact than single-family housing.
In our case, energy saving values between apartments and single-family housing are higher than those obtained by Asdrubali et al. [50]. These authors assert that apartments in Palermo (Italy) show savings of about 7.3% in heating energy consumption with respect to single-family housing. In Murcia and Valladolid (Spain), the record rises to 8.9% and 24.7%, respectively. In our case, we approach the value of Valladolid. Results obtained showed that it is possible to agree with Gauzin-Müller [51] when they say that housing densification in simple and compact volumes offers considerable energy and economic advantages. Moreover, if the recommendations that emerge from the psychrometric charts following passive solar design guidelines and national regulations regarding the envelope’s thermal permeability are added during the buildings’ design stage, it may be possible to obtain a substantial decrease in energy consumption in the study area, with saving values of up to 90%.
On the other hand, we agree with Verbeeck and Hens [52], who consider that implementing energy improvement measures depends on the available budget to take those actions, which can be carried out all at once or in different stages. Those authors point out that a first step should be to provide roof insulation, floor insulation, if possible, and glass thermal and heating systems improvement. Dascalaki et al. [53] state in their work that improving the roof’s thermal resistance is required in all buildings and must be implemented in all buildings’ rehabilitation routines; however, although the impact of such an intervention improves, both in winter or summer, the thermal condition on the top floor, it is not perceived in the building’s total energy consumption.
The authors of this paper assume that, on the one hand, and due to the fact that their energy potentials are different, it is not necessary that all the five apartments on the 12 floors have the same intervention requirements. Changing single glass by DVH would be a recommended step to take on all floors, since it would reduce 50% of energy loss, while at the same time it would improve acoustic conditions. This intervention would in no way affect each unit’s every day operation. Moreover, it would not modify the building’s image, something that could be expected from the thermal improvement of the vertical envelope; for instance, through adding paneling that would protect walls’ thermal insulation, an improvement considered a priority for apartments D and E of the South block. It is also recommended to improve the thermal resistance of the roof according to the values established by the relevant standards.
We would recommend to take action during the tower buildings’ design stage, by devising an energy-efficient distribution of the apartments in the plant in order to avoid an excessive envelope/m2 useful surface relationship and, also, to grant all units the possibility to have access to solar resource, minimizing obstructions that can originate in shading of one block by another. Filippín and Beascochea [54] presents the results obtained from the performance assessment of residential and non-residential low-energy buildings that were designed to minimize fossil energy use. They are located in the province of La Pampa, central Argentina, in a temperate continental climate that shows extreme hot and cold records, respectively, during the summer and winter seasons. Applied technologies for energy saving were: passive solar heating, natural ventilation for cooling and daylight. In our comparison of conventional and low-energy designs, a 25% reduction of the energy loss coefficient (G-value) was observed in the case of solar buildings. In practice, this means that the implementation of bioclimatic design strategies can represent, on average, a 50% saving of the energy budget used for heating. In parallel, this also means a significant reduction in CO2 emissions to the atmosphere.

4. Conclusions

This work enabled us to assess the historical natural gas consumption of the apartments in the building for the period 1996–2008; the laying of natural gas in the city network was launched in 1996. The paper also allowed us to analyze the thermal behavior in four apartments during 2009. The statistical analysis was conducted only for those apartments that did not show variability between the years composed by this study, to ensure that the functional unit was occupied by the inhabitant of the same during the period.
Thermal monitoring during July allowed us to know if the users were living in conditions of comfort, the influence of the orientation and the availability of solar resource in natural gas consumed in four of the five departments of one of the floors of the building. Comfort conditions were met in the four monitored apartments. Those apartments with open façades to the north, no obstructions and no shading show lower heating energy consumption values. The grouped apartments in the North block consume less energy heating than those in the South one. Extrapolation of results to the rest of the apartments on other floors allows us to suggest that, in most of the cases, dwellers lived comfortably. In two particular cases, they may have lived in overheated environments, causing energy waste.
In the beginning of the work, we described how the city of Santa Rosa has had a significant growth of the population in recent years and a significant growth in the construction of buildings. In recent years, multi-family mixed with low-rise houses and buildings emerged that have transformed the profile of urban construction and the morphology of the city. Densification began, perhaps in a disorderly manner. From the energy point of view, it is appropriate, but an urgent review of building codes is needed. Free access to solar heating and daylight should be required. Results in low energy consumption buildings designed and built in the studied region allow ratification of the advantage of the implementation of bioclimatic strategies and consideration at an early stage in the design of buildings.
The energy perspective in Argentina, the possibility to revise Building Regulation and Codes, the increased purchase of air-conditioning equipments by users, the housing growth tendency in the study area and the buildings’ process of labeling, among other aspects, call for an analysis of information derived from the stock characteristics of buildings, as well as of their energy performance. In agreement with Dascalaki et al. [53], we conclude that developing a data monitoring platform constitutes a principal action to take in the near future.

Acknowledgments

The authors feel grateful to Eng. Cuadrelli from the local gas company. Our gratitude to the owners for their cooperation. This work was partially funded by ANPCYT PICT 01963, 0956, PIP 2010-2012, PICTO 2009-0192 and CIUNSa (Universidad Nacional de Salta).

Conflict of Interest

The authors declare no conflict of interest.

References and Notes

  1. Liu, J.; Zhang, T.; Zhai, Z. Considering building energy from environmental perspective. Energy Build. 2010, 42, 1. [Google Scholar] [CrossRef]
  2. Behling, S.; Behling, S. Sol Power La Evolución de La Arquitectura Sostenible (in Spanish); Ediciones G. Gili: Barcelona, Spain, 2002. [Google Scholar]
  3. Ürge-Vorsatz, D.; Novikova, A. Energy efficiency and the Kyoto Protocol in an enlarged EU: Will they make a difference? In Proceedings of the Improving Energy Efficiency in New Europe, Oxford, UK, 28 September 2006.
  4. Ballarini, I.; Corrado, V. Application of energy rating methods to the existing building stock: Analysis of some residential buildings in Turin. Energy Build. 2009, 41, 790–800. [Google Scholar] [CrossRef]
  5. Ganem, C.; Esteves, A.; Coch, H. Rehabilitación ambiental de la tipología de medio patio. Parte 1: Diagnóstico cualitativo y cuantitativo del confort térmico (in Spanish). Av. Energ. Renov. Medio Ambient. 2006, 10, 5–55. [Google Scholar]
  6. OECD. OECD/IEA Joint Workshop Sustainable Buildings: Towards Sustainable Use of Building Stock; OECD: Tokyo, Japan, 2004. Available online: http://www.oecd.org/dataoecd/9/20/35896769.pdf (accessed on 20 January 2009).
  7. Morillón Gálvez, D. El diseño bioclimático en México (In Spanish). In Los Edificios en el Futuro, Estrategias Bioclimáticas y Sustentabilidad; INETI, Departamento de Energias Renováveis: Lisboa, Portugal, 2008. [Google Scholar]
  8. Mohammad, S.; Al-Homoud, M.S. Computer-aided building energy analysis techniques. Build. Environ. 2001, 36, 421–433. [Google Scholar] [CrossRef]
  9. Jones, D. Arquitectura y Entorno. El Diseño de la Construcción Bioclimática (in Spanish); BLUME: Barcelona, Spain, 2002. [Google Scholar]
  10. IPCC, Residential and commercial buildings. In Climate Change 2007: Working Group III: Mitigation of Climate Change; IPCC: Genev, Switzerland, 2007; Chapter 6.
  11. Nature Publishing Group. Architects of a low-energy future. Nature 2008, 452, 520–523. [CrossRef]
  12. Flavin, C. Low-Carbon Energy: A Roadmap; World Watch Institute: Washington, DC, USA, 2008. [Google Scholar]
  13. Biesiot, W.; Noorman, K.J. Energy requirements of household consumption: A case study of the Netherlands. Ecol. Econ. 1999, 28, 367–383. [Google Scholar] [CrossRef]
  14. Reinders, A.H.M.E.; Vringer, K.; Blok, K. The direct and indirect energy requirement of households in the European Union. Energy Policy 2003, 31, 139–153. [Google Scholar] [CrossRef]
  15. Cohen, C.; Lerzen, M.; Schaeffer, R. Energy requirements of household in Brazil. Energy Policy 2005, 33, 555–562. [Google Scholar] [CrossRef]
  16. Pachauri, S.; Spreng, D. Direct and indirect energy requirements of households in India. Energy Policy 2002, 30, 511–523. [Google Scholar] [CrossRef]
  17. Carlsson-Kanyama, A.; Engström, R.; Kok, R. Indirect and direct energy requirements of city households in Sweden. J. Ind. Ecol. 2005, 9, 221–235. [Google Scholar] [CrossRef]
  18. Re, M.G.; Blasco Lucas, I. Monitoreo higrotérmico-energético-lumínico de invierno en departamentos ubicados en las ciudades de San Juan y La Plata (in Spanish). Av. Energ. Renov. Medio Ambient. 2009, 14, 17–24. [Google Scholar]
  19. Blasco, I.; Facchini, M.; Pontoriero, D.; Rosés, R.; Carestía, C. Consumos energéticos de viviendas suburbanas y su relación con parámetros urbano-arquitectónicos (in Spanish). Av. Energ. Renov. Medio Ambient. 2000, 4, 115–118. [Google Scholar]
  20. Salvetti, M.B.; Czajkowski, J.G.; Analía, F. Análisis del comportamiento energético-ambiental en torre de viviendas en La Plata (in Spanish). Av. Energ. Renov. Medio Ambient. 2009, 13, 127–134. [Google Scholar]
  21. Salvetti, M.B.; Czajkowski, J.G.A. Ahorro de energía en refrigeración de edificios para oficinas. Propuesta de indicadores de eficiencia y valores admisibles (in Spanish). Av. Energ. Renov. Medio Ambient. 2010, 14, 17–24. [Google Scholar]
  22. Filippín, C. Energy consumption profile of public housing for lower-mid income families in a fast growing city of Argentina. Habitat Int. 1999, 23, 125–134. [Google Scholar] [CrossRef]
  23. Rosenfeld, E.; Czajkowski, J.D. Catálogo de Tipologías de Viviendas Urbanas en el Área Metropolitana de Buenos Aires. In Su Funcionamiento Energético y Bioclimático; Facultad de Arquitectura y Urbanismo, Universidad Nacional de La Plata: La Plata, Argentina, 1992. [Google Scholar]
  24. Molas, L.; García, V.; Iriarte, A.; Correa, E. Auditoría térmica y variables del confort. Caso de una vivienda del Instituto Provincial de la Vivienda, Ciudad de Catamarca (in Spanish). Av. Energ. Renov. Medio Ambient. 2008, 12, 121–128. [Google Scholar]
  25. Filippín, C.; Flores Larsen, S. Analysis of energy consumption patterns in multi-family housing in a moderate cold climate. Energy Policy 2009, 37, 3489–3501. [Google Scholar] [CrossRef]
  26. Filippín, C.; Flores Larsen, S.; Mercado, V. Winter energy behavior in multi-family block buildings in a temperate-cold climate in Argentina. Renew. Sustain. Energy Rev. 2011, 15, 203–219. [Google Scholar] [CrossRef]
  27. Hernández, A. Resultados del monitoreo térmico de una vivienda construida en la ciudad de Salta y su simulación detallada mediante Simedif (In Spanish). Av. Energ. Renov. Medio Ambient. 2006, 10, 39–46. [Google Scholar]
  28. Mitchell, J.; Acosta, P. Evaluación comparativa de tipologías de viviendas sociales en la provincia de Mendoza (In Spanish). Av. Energ. Renov. Medio Ambient. 2009, 13, 161–168. [Google Scholar]
  29. Mercado, V.; Esteves, A.; Filippín, C.; Navarro, L. Evaluación térmico-energético y cualitativa de condiciones ambientales de una vivienda social de la ciudad de Mendoza. Condiciones reales de uso y estrategias de mejoramiento térmico-energético bioclimático (In Spanish). Av. Energ. Renov. Medio Ambient. 2008, 12, 73–80. [Google Scholar]
  30. Viegas, G. Evaluación del Potencial Energético e Intervenciones de Mejoramiento del Entorno Edilicio en Áreas Urbanas de Media y Baja Consolidación. La Ciudad de La Plata Como Caso de Studio (In Spanish).
  31. Sulaiman, H.; Blasco Lucas, I.; Filippín, C. Incidencia del usuario en el comportamiento higrotérmico estival de una vivienda convencional en San Juan Mendoza (In Spanish). Av. Energ. Renov. Medio Ambient. 2009, 13, 53–60. [Google Scholar]
  32. González, A.D.; Carlsson-Kanyama, A.; Crivelli, E.S.; Gortari, S. Residential energy use in one-family household with natural gas provision in a city of the Patagonian Andean region. Energy Policy 2007, 35, 2141–2150. [Google Scholar]
  33. Enargas. Available online: http://www.enargas.gov.ar (accessed on 10 November 2010).
  34. Juanicó, L.; Gonzalez, A.D. Saving on natural gas consumption by doubling thermal efficiencies of balanced-flue space heaters. Energy Build. 2008, 40, 1479–1486. [Google Scholar] [CrossRef]
  35. Gonzalez, A.D. Energy subsidies in Argentina lead to inequalities and low thermal efficiency. Energies 2009, 2, 769–788. [Google Scholar]
  36. Freda, J.F.; De Dicco, R.A. Agotamiento de las Reservas de Hidrocarburos en Argentina (in Spanish); Universidad del Salvador: Buenos Aires, Argentina, 2004. [Google Scholar]
  37. De Dicco, R. Agotamiento de Las Reservas de Hisdrocarbuos en Argentina (in Spanish); Serie Materiales de Areas de Investigación del IDICSO, Universidad del Salvador: Buenos Aires, Argentina, 2004. [Google Scholar]
  38. Acondicionamiento Térmico de Ddificios (in Spanish); IRAM Norm 11603; Clasificación bio-ambiental de la República Argentina: Buenos Aires, Argentina, 1996.
  39. Gonzalo, G. Manual de Arquitectura Bioclimática (in Spanish); Universidad Nacional de Tucumán: Tucumán, Argentina, 2003. [Google Scholar]
  40. Auliciems, A. Psychophysical criteria for global thermal zones of building design. Int. J. Biometeorol. 1983, 26, 69–86. [Google Scholar]
  41. Vergara, G.; Casagrande, G. Estadísticas Agroclimáticas de la Facultad de Agronomía, Santa Rosa, La Pampa, Argentina (in Spanish); Ediciones de la Universidad nacional de La Pampa: La Pampa, Argentina, 2002. [Google Scholar]
  42. Grossi Gallegos, H.; Righini, R. Atlas de Energía Solar de la República Argentina (in Spanish); Universidad de Luján: Buenos Aires, Argentina, 2007. [Google Scholar]
  43. U-value: the thermal conductance of a composite building element; it is the reciprocal of the total thermal resistance of the element, which is the sum of all the relevant material across the section of the element, and is a measure of the energy flow through a unit area of the element per °C temperature difference across it (W/m2 °C).
  44. IRAM Norm 11900 E1. ‘Etiqueta de eficiencia energética de calificación para edificios. Clasificación según la transmitancia térmica de la envolvente’. Building heating energy efficiency label. Classification according to the termal transmittance of the shell. The efficiency label is qualified through a comparative system composed of eight efficiency classes identified by the letters A,B,C,D,E,F,G and H, in which the letter A is assigned to the most efficient envelopes and H to the least efficient ones in the different buildings studied.
  45. G-value (Volumetric Heat Loss Coefficient): the total heat loss of a dwelling through the fabric and ventilation divided by the heated volume and the temperature at which the loss occurs (W/m3°C).
  46. Fluid Distribution Company, Informe Anual’08; Camuzzi Gas Pampeana: Buenos Aires, Argentina, 2009.
  47. Filippín, C.; Flores Larsen, S.; Mercado, V. Winter energy behavior in multi-family block buildings in a temperate-cold climate in Argentina. Renew. Sustain. Energy Rev. 2011, 15, 203–219. [Google Scholar] [CrossRef]
  48. Santamouris, M.; Kapsis, K.; Korres, D.; Livada, I.; Pavlou, C.; Assimakopoulos, M.N. On the relation between the energy and social characteristics of the residential sector. Energy Build. 2007, 39, 893–905. [Google Scholar] [CrossRef]
  49. Nemry, F.; Uihleina, A.; Colodelb, C.M.; Wetzelc, C.; Brauned, A.; Wittstockb, B.; Hasanc, I.; Kreißigd, J.; Gallond, N.; Niemeierc, S.; Frechc, Y. Options to reduce the environmental impacts of residential buildings in the European Union—Potential and costs. Energy Build. 2010, 42, 976–984. [Google Scholar] [CrossRef]
  50. Asdrubali, F.; Bonaut, M.; Battisti, M.; Venegas, M. Comparative study of energy regulations for buildings in Italy and Spain. Energy Build. 2008, 40, 1805–1815. [Google Scholar] [CrossRef]
  51. Gauzin-Muller, D. ArquitecturaEcológica 29 Ejemplos Europeos (in Spanish); Editorial Gustavo Gili: Barcelona, Spain, 2001. [Google Scholar]
  52. Verbeeck, G.; Hens, H. Energy saving in retrofitted dwellings: Economically viable? Energy Build. 2005, 37, 747–754. [Google Scholar] [CrossRef]
  53. Dascalaki, E.; Droutsa, K.; Gaglia, A.; Kontoyiannidis, S.; Balaras, C. Data collection and analysis of the building stock and its energy performance—An example for Hellenic buildings. Energy Build. 2010, 42, 1231–1237. [Google Scholar]
  54. Filippín, C.; Beascochea, A. Performance assessment of low-energy buildings in central Argentina. Energy Build. 2007, 39, 54–557. [Google Scholar]

