Article

Influence of σ Phase on the Allotropic Transformation of the Matrix in Co-Re-Cr-Based Alloys with Ni Addition

1
Institut für Werkstoffe, TU Braunschweig, 38106 Braunschweig, Germany
2
Institut für Werkstofftechnik, Universität Siegen, 57068 Siegen, Germany
*
Author to whom correspondence should be addressed.
Metals 2018, 8(9), 706; https://doi.org/10.3390/met8090706
Submission received: 3 August 2018 / Revised: 3 September 2018 / Accepted: 6 September 2018 / Published: 8 September 2018
(This article belongs to the Special Issue High Temperature Materials Development beyond Ni-Base Superalloys)

Abstract

:
Co-Re-Cr alloys are being developed for high-temperature application in gas turbines. In these alloys, the Cr2Re3-based σ phase is stable when the Cr content is higher than 20 atomic %. The addition of Ni is being studied to partially substitute Cr, which aims to suppress σ formation without sacrificing the benefit of Cr in the oxidation resistance of the alloy. The microstructure of the alloys with varying Cr (18–23%) and Ni (8–25%) was investigated by electron microscopy in the present study, primarily to look into the stability of the σ phase and its influence on the Co matrix phase transformation. The σ phase is mainly found in two morphologies in these alloys, where at high temperature only blocky σ phase is present at grain boundaries but cellular σ is formed through a discontinuous precipitation within the grains at lower heat treatment temperatures. The presence of fine cellular σ phase influences the alloy hardness. Moreover, the σ precipitation, which depletes the matrix in Re, also influences the allotropic transformation of the Co matrix.

1. Introduction

To meet the increasing temperature demand of gas turbines, Co-Re-Cr-based alloys are an attractive supplement to Ni-superalloys due to their excellent specific strength and relatively high melting temperature (above 1500 °C) [1]. Cr is added to these alloys primarily for the oxidation resistance. However, Cr stabilizes the topologically closed packed (TCP) Cr2Re3-type σ phase in the alloy when added in excess of 20 atomic % (all compositions in this paper are presented in atomic %). A study is underway to investigate whether Ni can be added to partially substitute Cr in Co-Re alloys and improve oxidation behaviour at high temperature, while simultaneously suppressing σ phase formation. It may be noted that the TCP σ phase is generally regarded as an undesirable phase due to its brittleness.
In a previous study [2], it was shown that alloying of 15% Ni to the reference alloy Co-17Re-23Cr significantly improves the alloy oxidation resistance. A continuous protective Cr2O3 layer formed on alloys containing Ni, regardless of the existence or the nature of sigma phase distribution, whereby the oxidation of Re, and consequently the evaporation of its oxides, is strongly retarded. It was proposed that alloying with Ni accelerated bulk diffusion of Cr in the alloy towards the oxidation reaction front. The relatively slow growth of the outermost Co(Ni)O oxide layer results in the formation of a dense spinel layer in the transient oxidation period, facilitating selective oxidation of Cr at the oxide/alloy interface. Consequently, this promotes the formation of a continuous and protective chromia layer, which controls further oxidation kinetics [2]. In the present paper the influence of Cr and Ni on the microstructure of Co-Re-Cr-Ni alloys after different heat treatments is presented. For this, the Cr amount in the alloy varied between 18% and 23% and Ni between 8% and 25% (Table 1). Thermodynamics of the multi-component Co-Re systems, particularly the quaternary Co-Re-Cr-Ni system, was numerically modelled and the results were published in [3].
Cobalt has an allotropic phase transformation from low-temperature hexagonal (ε phase) to high-temperature cubic (γ phase) structure, and in pure Co this occurs at 417 °C [4]. The addition of alloying elements to Co influences the allotropic transformation temperature, where Re and Cr (which are hcp phase stabilizers) increase the temperature and Ni (fcc stabilizer) decreases it [1]. Therefore, in the Co-Re-Cr-Ni alloys the composition influences the Co matrix phase stability and the allotropic transformation of the matrix. Here we will present results to show that the σ phase fraction in the alloy also has a strong influence on the matrix phase structure. Partitioning of Cr and Re to the σ phase indirectly affects the stability of the Co matrix and the amounts of ε and γ Co.

2. Experimental Procedure

The alloys were produced by vacuum arc melting and cast into square rods in a copper mould with a cross section of 12 mm × 12 mm. In the first step of the melting process, the elements Co, Ni and Re were melted and in the second step Cr was added to the prealloy to minimize evaporation and loss of Cr. The cast bars were homogenized by a three-step solution heat treatment (designated ST) at 1350 °C, 1400 °C and 1450 °C for 5 h each. The samples were heat-treated in a vacuum furnace and cooled after the heat treatment by introducing high-pressure (5 bar) argon gas. Samples approximately 2 mm thick were cut from the bar and further heat-treated at 800 °C, 1050 °C, 1200 °C or 1350 °C for 100 h in a vacuum furnace and cooled by argon gas in order to study the σ phase formation, as well as the matrix phase transformation. The composition of all alloys studied and their designations (as used in this paper) are given in Table 1. Heat-treated samples were prepared by standard metallographic polishing and examined with scanning electron microscope (SEM). Hardness values (HV10) of the different alloys after various heat treatments were measured using Vickers Hardness testing with a diamond pyramid indenter (Reicherter Universal Hardness Tester: UH250, Buehler, Germany). The average of the five measured hardness values is reported.
Different SEMs, a desktop model (TM3000, Hitachi, Tokyo, Japan) and a high-resolution microscope (Leo 1550, Zeiss, Oberkochen, Germany) were used for the characterization of the microstructure. The Leo 1550 SEM was mainly used for high-magnification, high-resolution imaging and the desktop SEM, TM3000 for low-magnification imaging and quantitative evaluation of the σ phase. Both SEMs are equipped with backscatter electron (BSE) detectors, while the Leo1550 also provided other imaging modes, e.g., secondary electron (SE) and in-lens SE detectors. To quantify the σ phase microstructure, the open-source image processing software ImageJ (version 1.46r, Wayne Rasband, National Institutes of Health, Bethesda, MD, USA) [5] was used. For each heat treatment condition, five to seven SEM images at a relatively low magnification of 600× was recorded to achieve a large number of σ phase particles in the images. The first step was the binarization of the grey BSE images taken with the TM3000. ImageJ offers a function to set a threshold on the grey level scale, above which all grey levels are set to black and below which all grey levels are set to white. Due to the high amount of heavy Re, the σ phase appears brighter than the Co matrix due to the Z-contrast [6], and thus can be easily distinguished (Figure 1). The threshold has to be set manually for each image separately, because it strongly depends on the contrast and the brightness in each BSE image. With the σ phase appearing black and the Co matrix appearing white, the volume fraction of the σ phase could be digitally measured with ImageJ software and the results are presented below. As a large number of σ particles (>5000) were counted, the statistical errors in the area fraction measurements were reasonably small.
A Dual Beam microscope (ion plus electron beam, model Helios NanoLab 650 from FEI (Eindhoven, The Netherlands) was further used for a combined electron backscattered diffraction (EBSD, EDAX, Tilburg, The Netherlands) and energy-dispersive spectroscopy (EDS, EDAX, Tilburg, The Netherlands) measurement. The EBSD measurement requires that the sample surface is tilted 70° with respect to the electron beam. In such a highly tilted sample, EDS measurements can lead to some artefacts—for example, X-rays scattered from some inner surfaces of pores in this position are readily detected and in elemental maps, presented as bright regions (Figure 2). Figure 2 shows a SE image and the corresponding elemental maps of Co, Re and Cr. In the SE image two features are identified by arrows, namely a σ phase particle and a pore. In the elemental maps, the σ phase is bright in the Re and Cr maps but dark in the Co map as σ is a Cr- and Re-rich compound. In contrast, some part of the pore is bright in all the images, where in fact it would normally be dark in EDS elemental maps. This is an artefact of the highly tilted sample.
Many parameters influence the quality of the EBSD patterns and their indexing. For the correct indexing of the three phases present in the alloys studied, namely the two Co matrix phases (ε and γ) and the σ phase, their lattice parameters were determined by neutron diffraction measurement [7] and used for phase indexing in EBSD. The values are listed in Table 2. Despite using measured unit cell parameters in this study, EBSD maps often showed misindexing of phase. The reason for this is twofold: firstly, in many sample conditions the sample surface shows surface topography, resulting from polishing. As laths with different composition have differing hardness, they are polished differently. Due to the edge effect at the lath boundaries (and also sometimes at phase and grain boundaries), the Kikuchi patterns are not sharp or has distortion and this leads to misindexing or non-indexing. Secondly, the TEAM software platform (version V4.2.2, EDAX, Tilburg, The Netherlands) used in this study puts more weight on the angle between Kikuchi bands than the position of the band or its width for pattern indexing, and thus sometimes has difficulty in distinguishing patterns of the cubic and tetragonal phases with similar symmetry. This is the case for the fcc γ Co phase (Space group # 225) and the tetragonal σ phase (space group # 136), although these two structures have quite a different unit cell size (see Table 2).
The analysis software (TSL OIM Analysis 7, EDAX, Tilburg, The Netherlands) was used in the study to correct some of the misindexed pixels through a “Clean Up” routine. However, Figure 3 shows the consequence of overdoing clean-up, which can alter the microstructure significantly. In Figure 3, a typical example is shown. The top-left image shows a SE image of the region analysed, showing σ phase particles in a Co solid-solution matrix where the laths that are differently polished display surface topography. The top-right image is the measured EBSD map, where three phases have been identified and coloured red (ε Co), green (γ Co) and yellow (σ phase), respectively. The phase fractions are given in the inset of the maps. The measured data, however, show lot of misindexing, particularly of the σ phase. Therefore, a clean-up of the data was performed using the routines provided in the analysis software from EDAX. In cleanup-1 (bottom-left), which used Neighbour Phase Correlation followed by Grain Dilation, a reasonable clean-up could be achieved, which shows mostly an increase in the σ phase volume at the cost of fcc γ Co. The cleanup-2 image (bottom-right), on the contrary, shows the effect of excess cleaning of data. Here only Grain Dilation was performed, which incorrectly changed the σ phase points to γ phase, distorting the microstructure. In the present study, special care was therefore taken to avoid such a situation in measurement and analysis of the combined EBSD and EDS mapping results. With adequate caution, reliable orientation and elemental maps could be obtained, which showed a correlation between crystal structure, phase orientation and composition in the microstructure. Selected results are presented in the paper.

3. Results

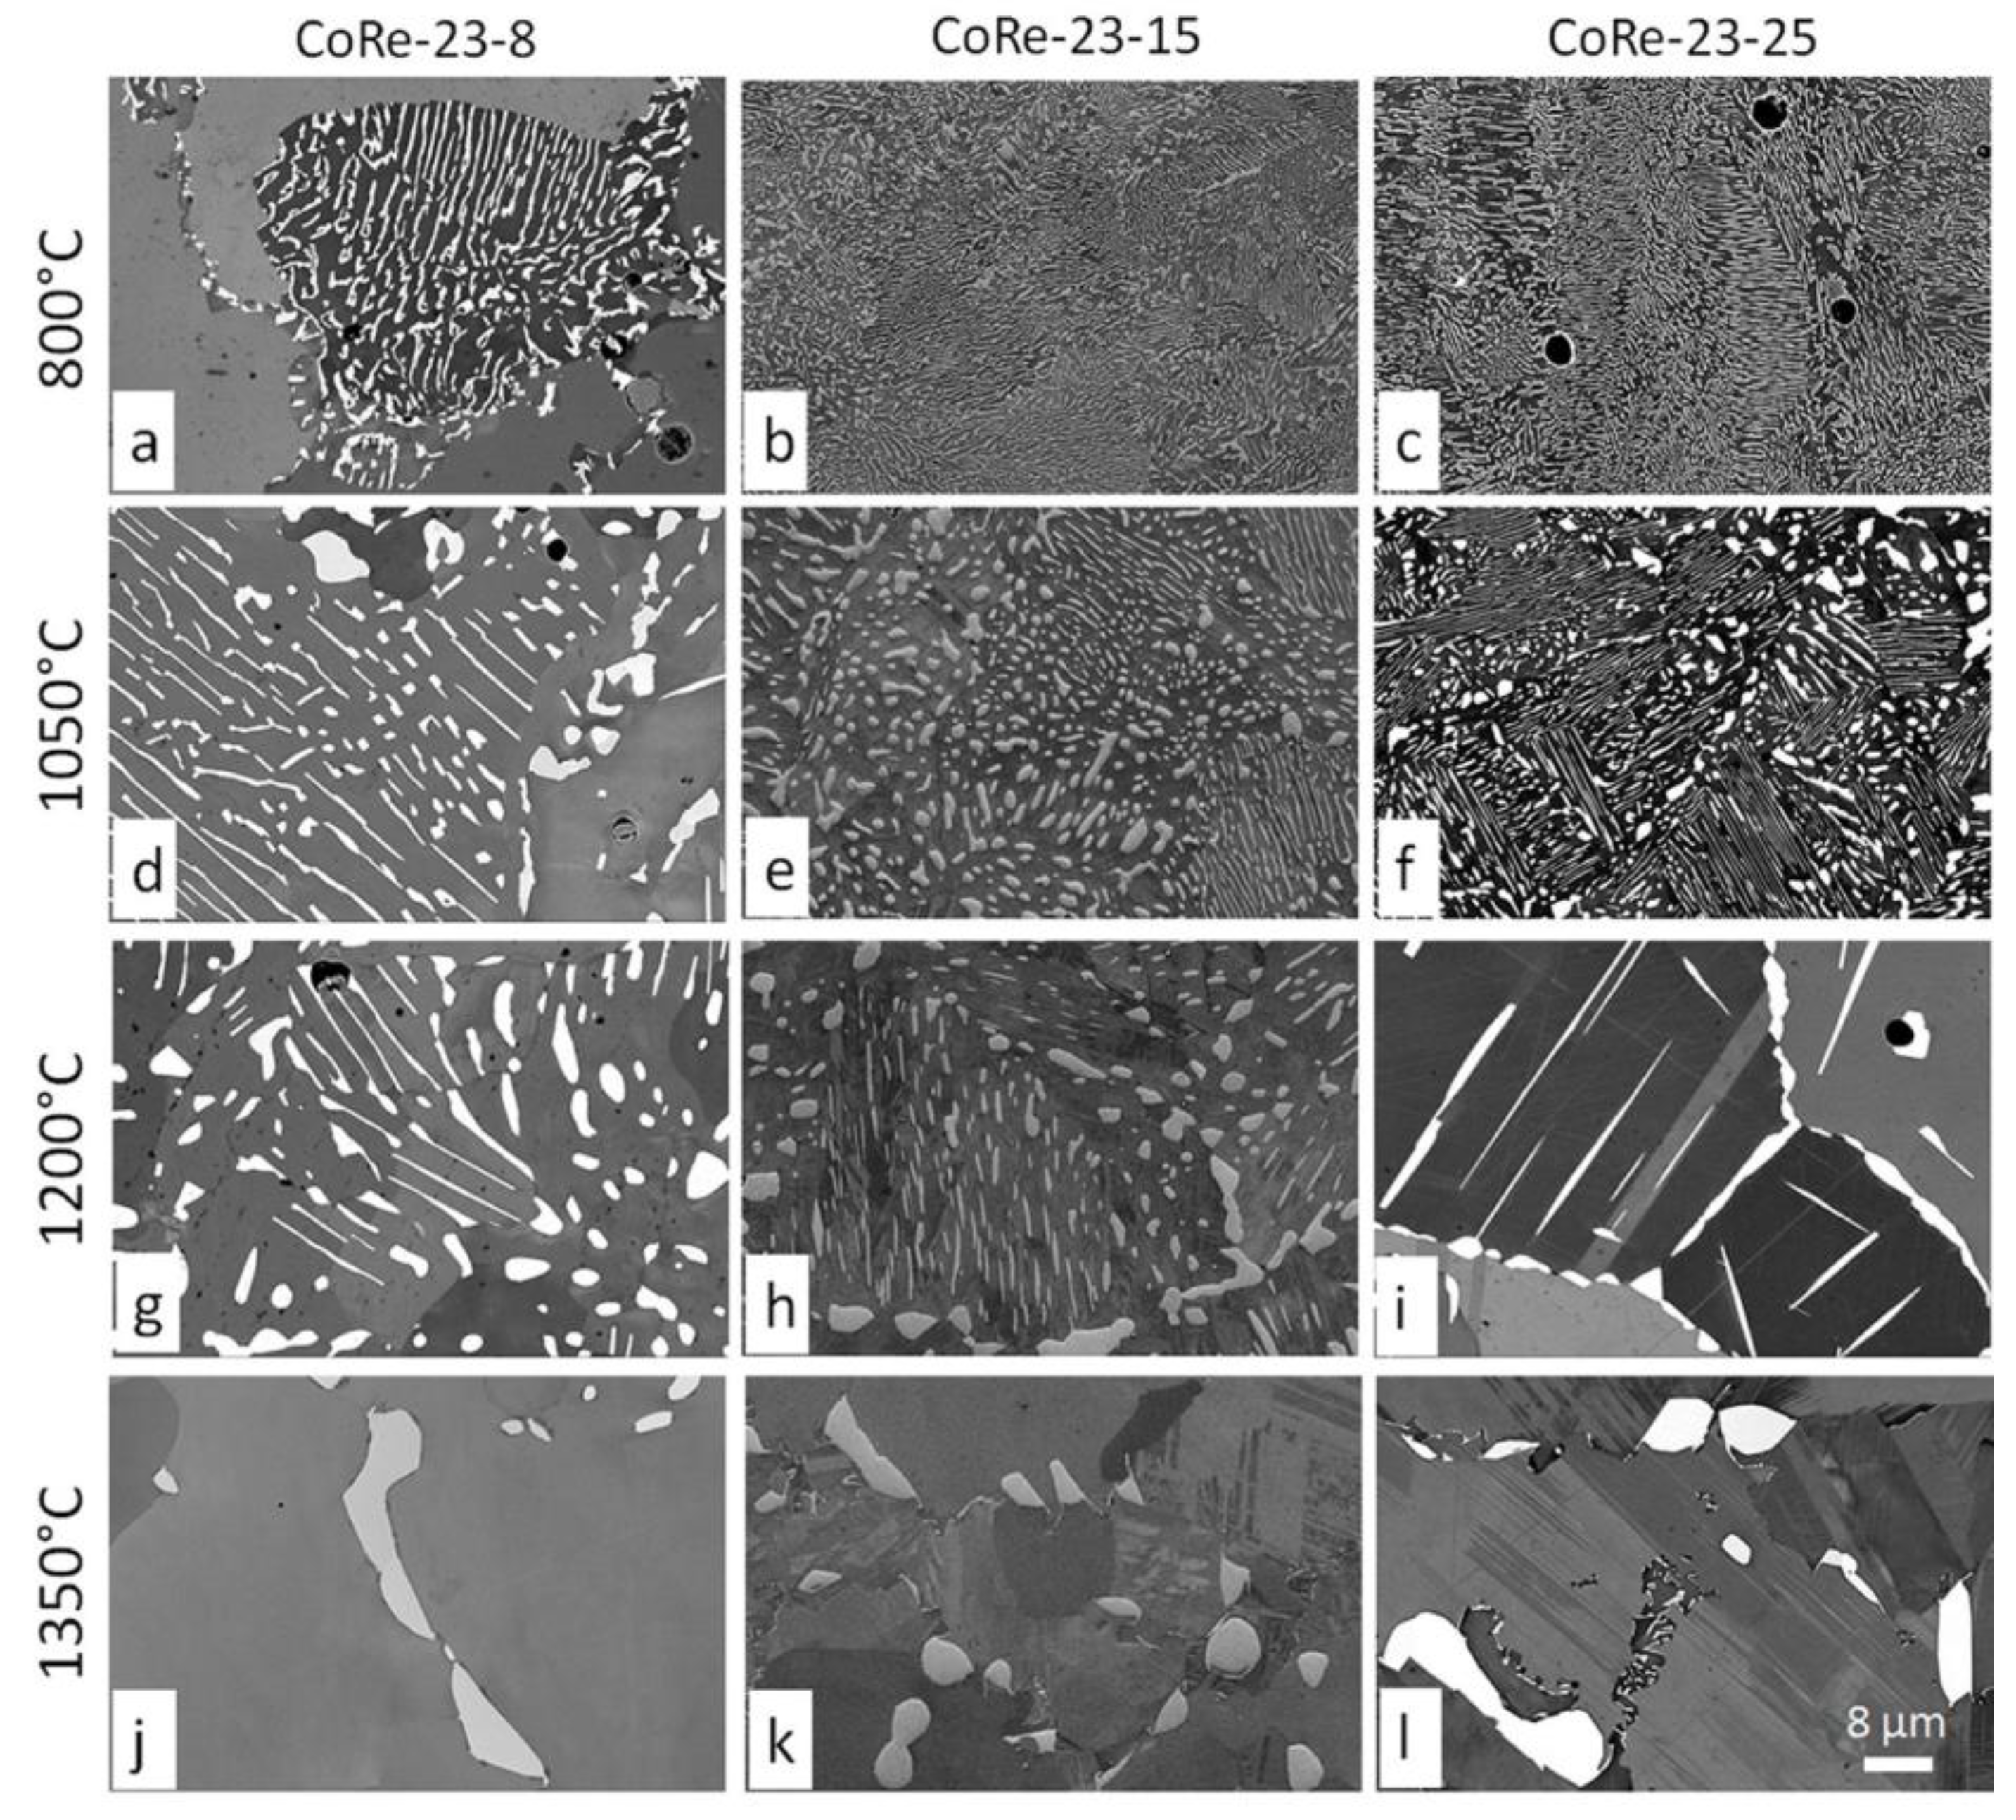
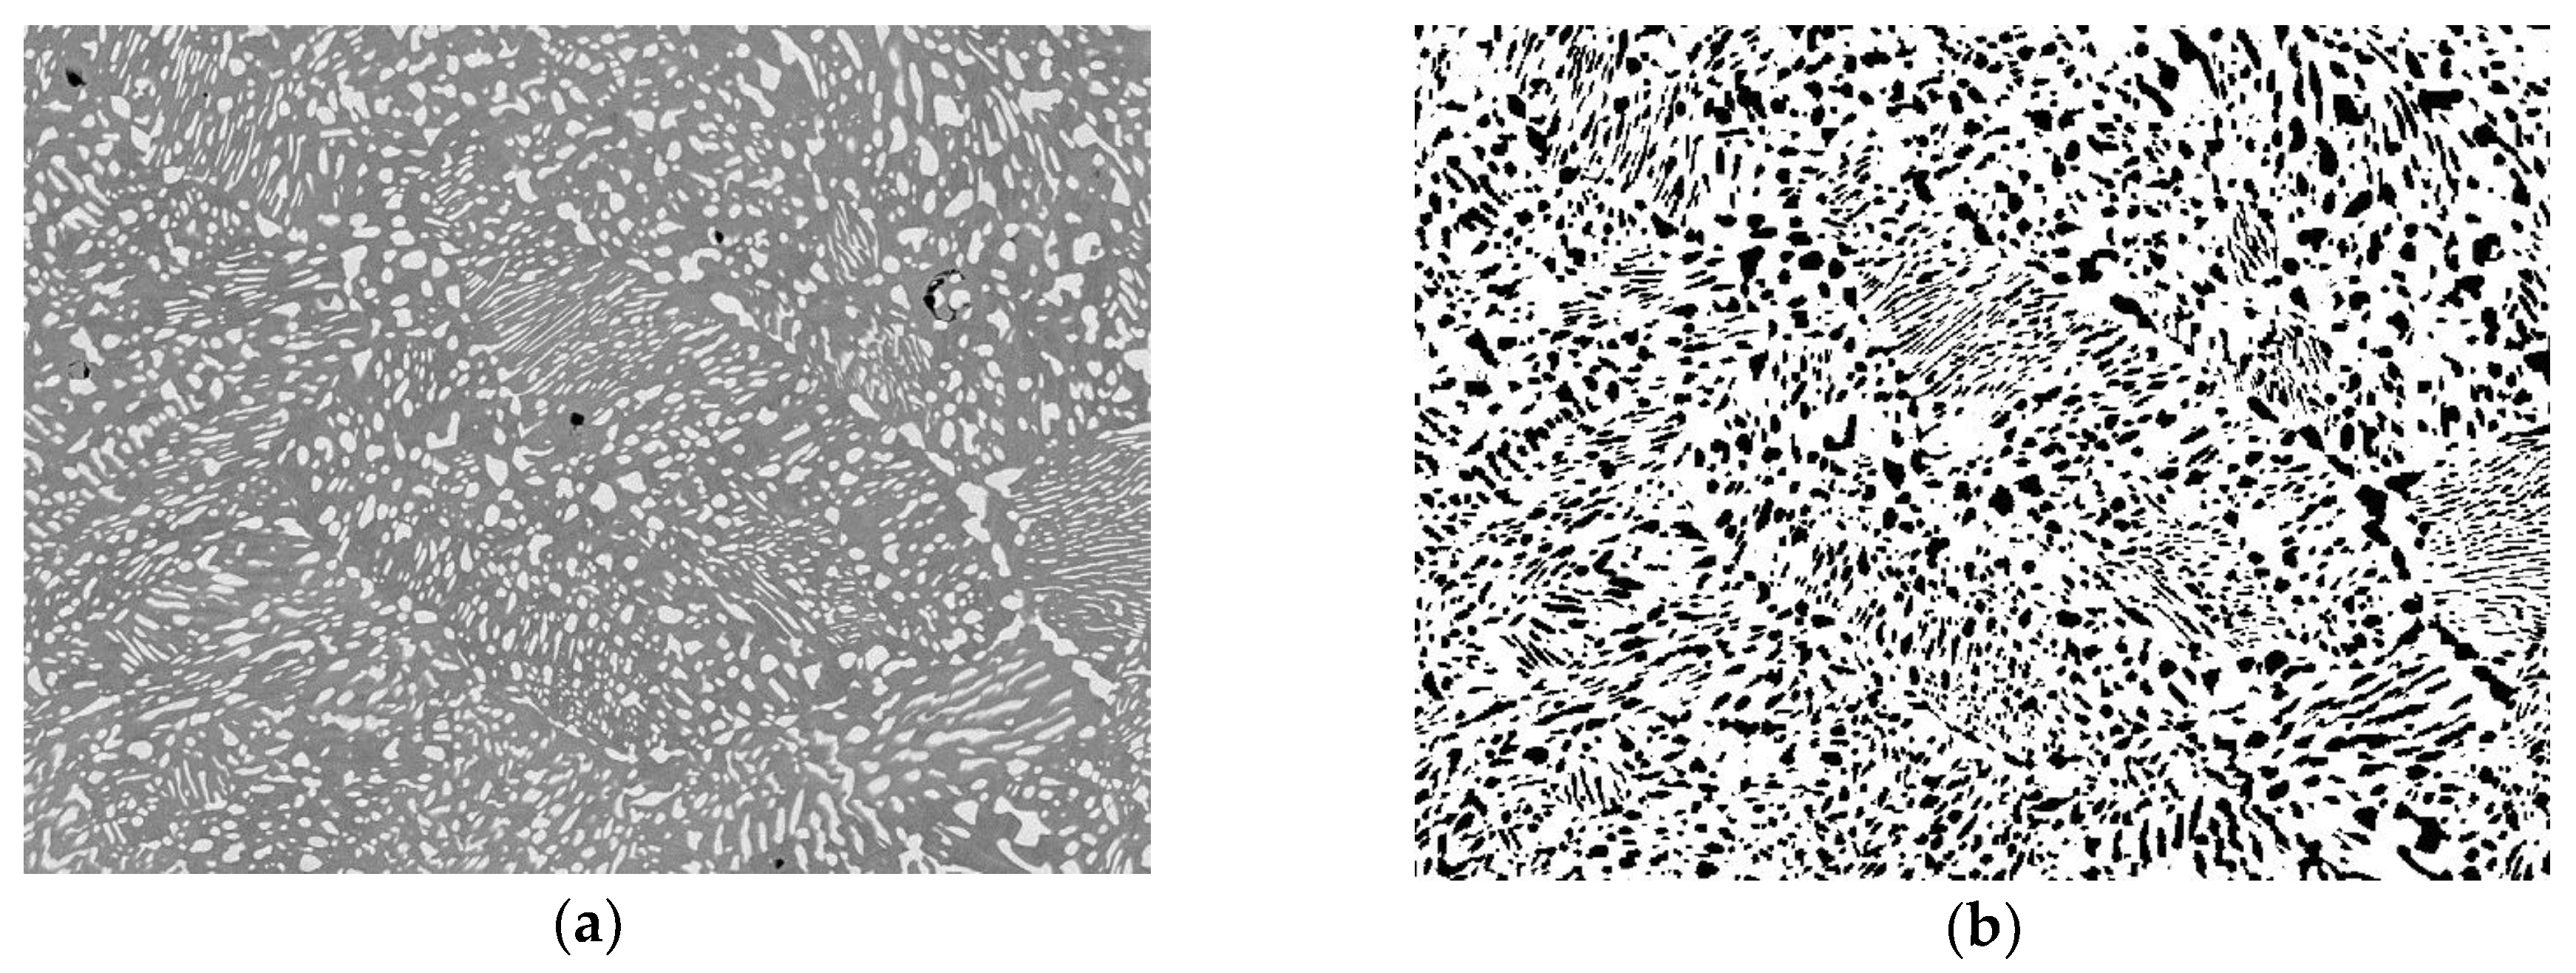
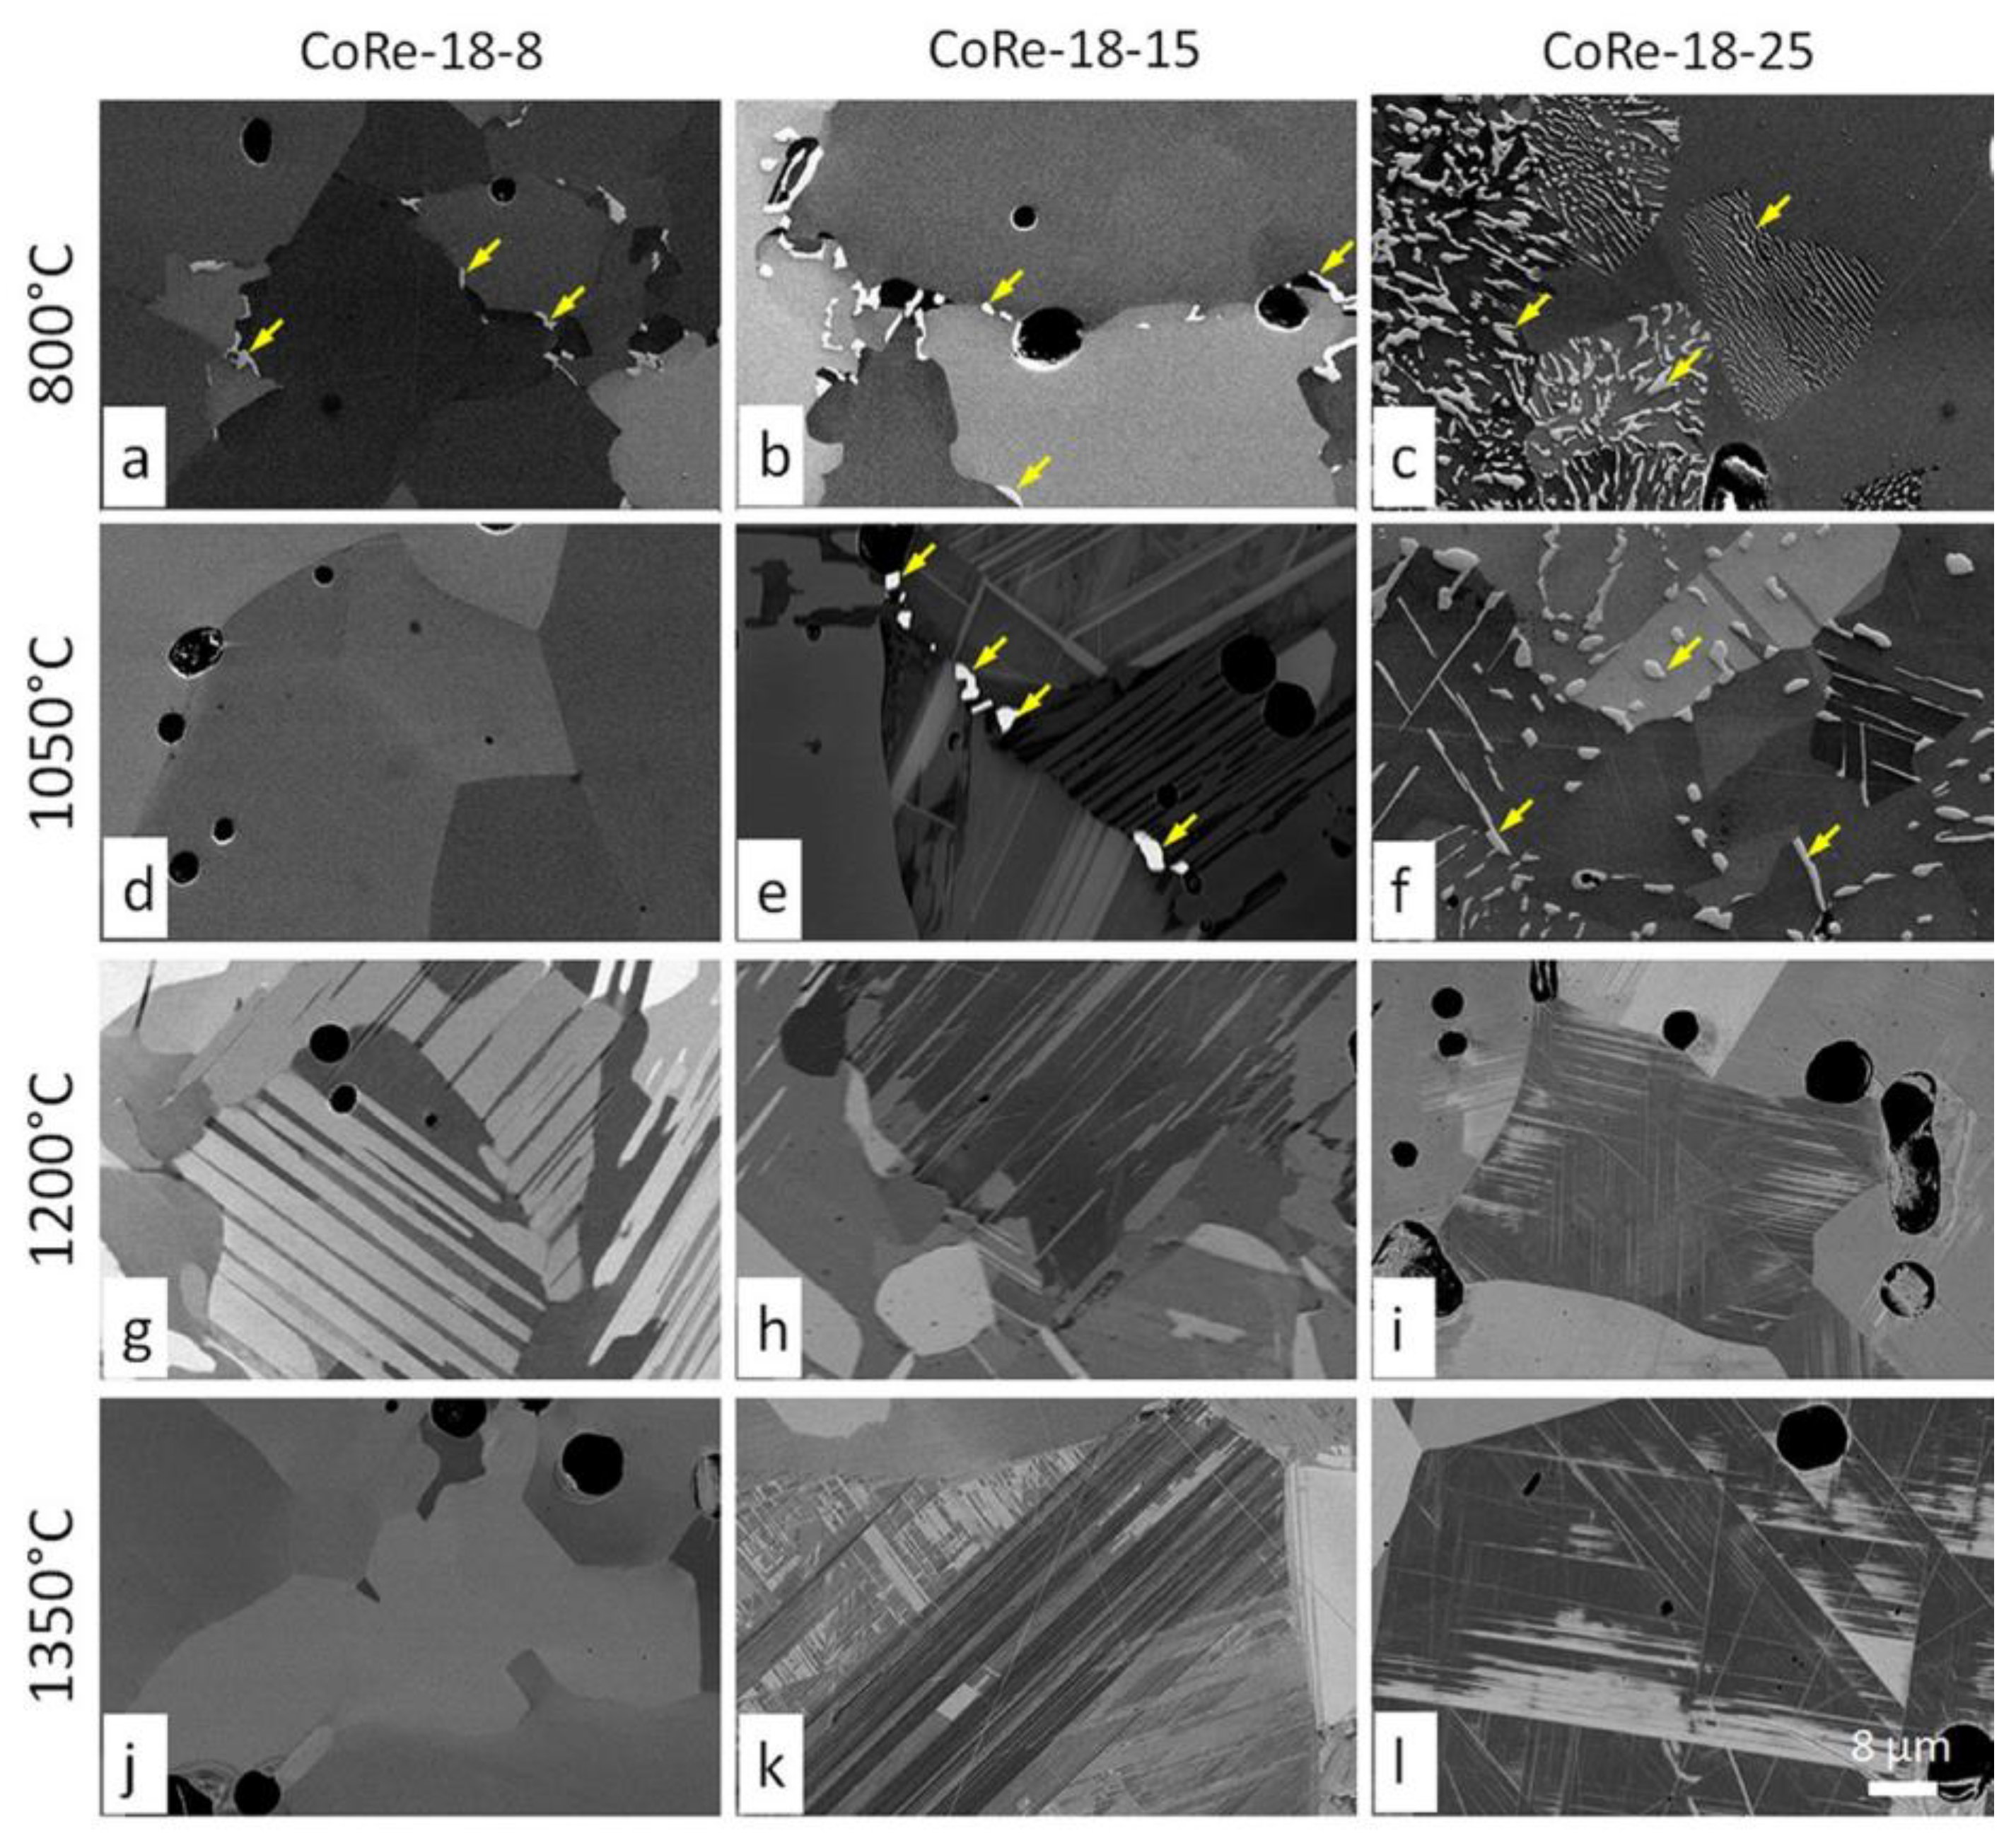
3.1. Microstructure Related to Alloy Composition and Heat Treatment

Typical microstructures of the low (18%) and high (23%) Cr alloys after various heat treatments are presented in Figure 4 and Figure 5, respectively. The microstructure in both alloy groups after heat treatment contains the Co matrix, which either shows single-phase grains or a lath structure within the grains, and σ phase particles. The morphology and amount of σ phase vary in differently heat-treated samples, but clearly its volume fraction is significantly lower in the 18Cr alloys compared to the 23Cr alloys. In fact, the σ phase is only present in some heat-treated conditions of the 18Cr alloys (marked in Figure 4 by arrows) but in all heat treatment conditions studied in the 23Cr alloys (Figure 5). Moreover, the σ phase is present in various morphologies depending on the alloy and the heat treatment. In the CoRe-18-8 and CoRe-18-15 alloys, only a few very small particles of σ are visible along grain boundaries after heat treatment at 800 °C. In contrast, the alloy CoRe-18-25 in the same 800 °C heat treatment condition shows a higher amount of lamellar σ phase growing from the grain boundaries into some grains, resulting from a discontinuous precipitation/cellular reaction (Figure 4c). Figure 4c further shows that the cellular reaction is incomplete and has only affected some grains. This σ phase morphology is termed cellular σ phase and is mostly lamellar, but may also contain globular particles. In contrast, larger faceted σ-particles can be seen at the grain boundaries and within the grains of the 18Cr alloys after 1050 °C heat treatment (Figure 4e,f). They are designated as blocky σ phase. In the low-Ni alloy (8Ni), after the same heat treatment (1050 °C), no σ phase can be seen (Figure 4d). With the increase in heat treatment temperature from 800 to 1050 °C, the amount of σ phase in CoRe-18-8 and CoRe-18-15 alloys decreases. The amount of σ phase is also decreased in the CoRe-18-25 alloy, but it now appears in every grain (Figure 4f). Although no grains are without σ phase in this microstructure, there are regions were only a blocky σ phase is observed along with the cellular σ in other regions. In the 18Cr alloys, σ phase in any form was not detected when the heat treatment temperature was 1200 °C or above.
On increasing the Cr amount from 18% to 23% in the alloy, the volume fraction of the σ phase increases. The σ amount also increases with increasing Ni content in the alloy and can be seen best after 800 °C by comparing the three 23Cr alloys (Figure 5a–c). The morphology of the σ phase in the higher Cr alloys is not much different than in the 18Cr alloys. Grains with and without cellular σ phase are seen after 800 °C in CoRe-23-8 and CoRe-23-15, like in CoRe-18-25. However, more areas contain cellular σ phase in the higher Cr alloys after the corresponding heat treatment. In the CoRe-23-25 alloy, the cellular reaction covers all grains and is homogenously distributed. All three alloys show σ phase in every grain above 1050 °C, whereby CoRe-23-8 alloy shows some grains without cellular σ phase, but having blocky σ particles and also a σ phase in needle-like morphology (such needles are also observed in CoRe-18-25 alloy after 1050 °C heat treatment: Figure 4f). The higher Cr content also increases the stability of the σ phase to higher temperatures. Figure 5 shows that σ is present even after heat treatment at 1350 °C in the 23Cr alloys. At lower temperatures (below 1200 °C), the morphology shows evidence of σ formation through discontinuous precipitation, while the σ particles at 1350 °C are large, faceted and mostly at grain boundaries—essentially blocky σ phase. The only exception to this observation is the CoRe-23-25 alloy after 1200 °C, which shows σ phase in the form of needles within the grains and small blocky σ particles decorating the grain boundaries (Figure 5i).
The extent of cellular reaction, as well as the total volume fraction of σ phase, is a function of both the alloy composition and the heat treatment temperature. While σ phase is not present in low Cr and low Ni alloys (CoRe-18-8 and CoRe-18-15) at temperatures above 800 °C and 1050 °C, respectively, it is not present at 1200 °C and above for all the Ni contents in 18Cr alloys. In the high Cr alloys, σ phase is present for all Ni content up to the highest heat treatment temperature (1350 °C), but the microstructure with respect to σ phase morphology changes from the low to high temperatures. At 1350 °C σ phase is present only as blocky σ, while at lower temperatures it forms through cellular reaction and is present in the microstructure in lamellar morphology. Moreover, with increasing amount of Ni the σ phase morphology is refined, the cellular σ phase becomes finer and the distance between the lamellae/particles decreases. Generally, however, the cellular σ is the coarser the higher the temperature is. The volume fraction of σ phase (all morphologies) was evaluated in all conditions using digital image analysis and is listed in Table 3. Mostly the volume fraction increases in both the 18% and 23% Cr alloys with the Ni content (with some exceptions, e.g., at 1200 °C and 1350 °C for the 23Cr alloys; see Table 3). Increasing the amount of Ni in the 23Cr alloys shifts the maximum of the σ volume fraction to higher values and to lower temperatures. The maximum is reached at 1200 °C for 8Ni alloy (15% σ), at 1050 °C for 15Ni (26% σ) and at 800 °C for 25Ni (35.2% σ). Also, the difference in σ fraction between the alloys with different Ni amount decreases with increasing temperature and reaches similar values of about 15% at 1200 °C and about 2% at 1350 °C.

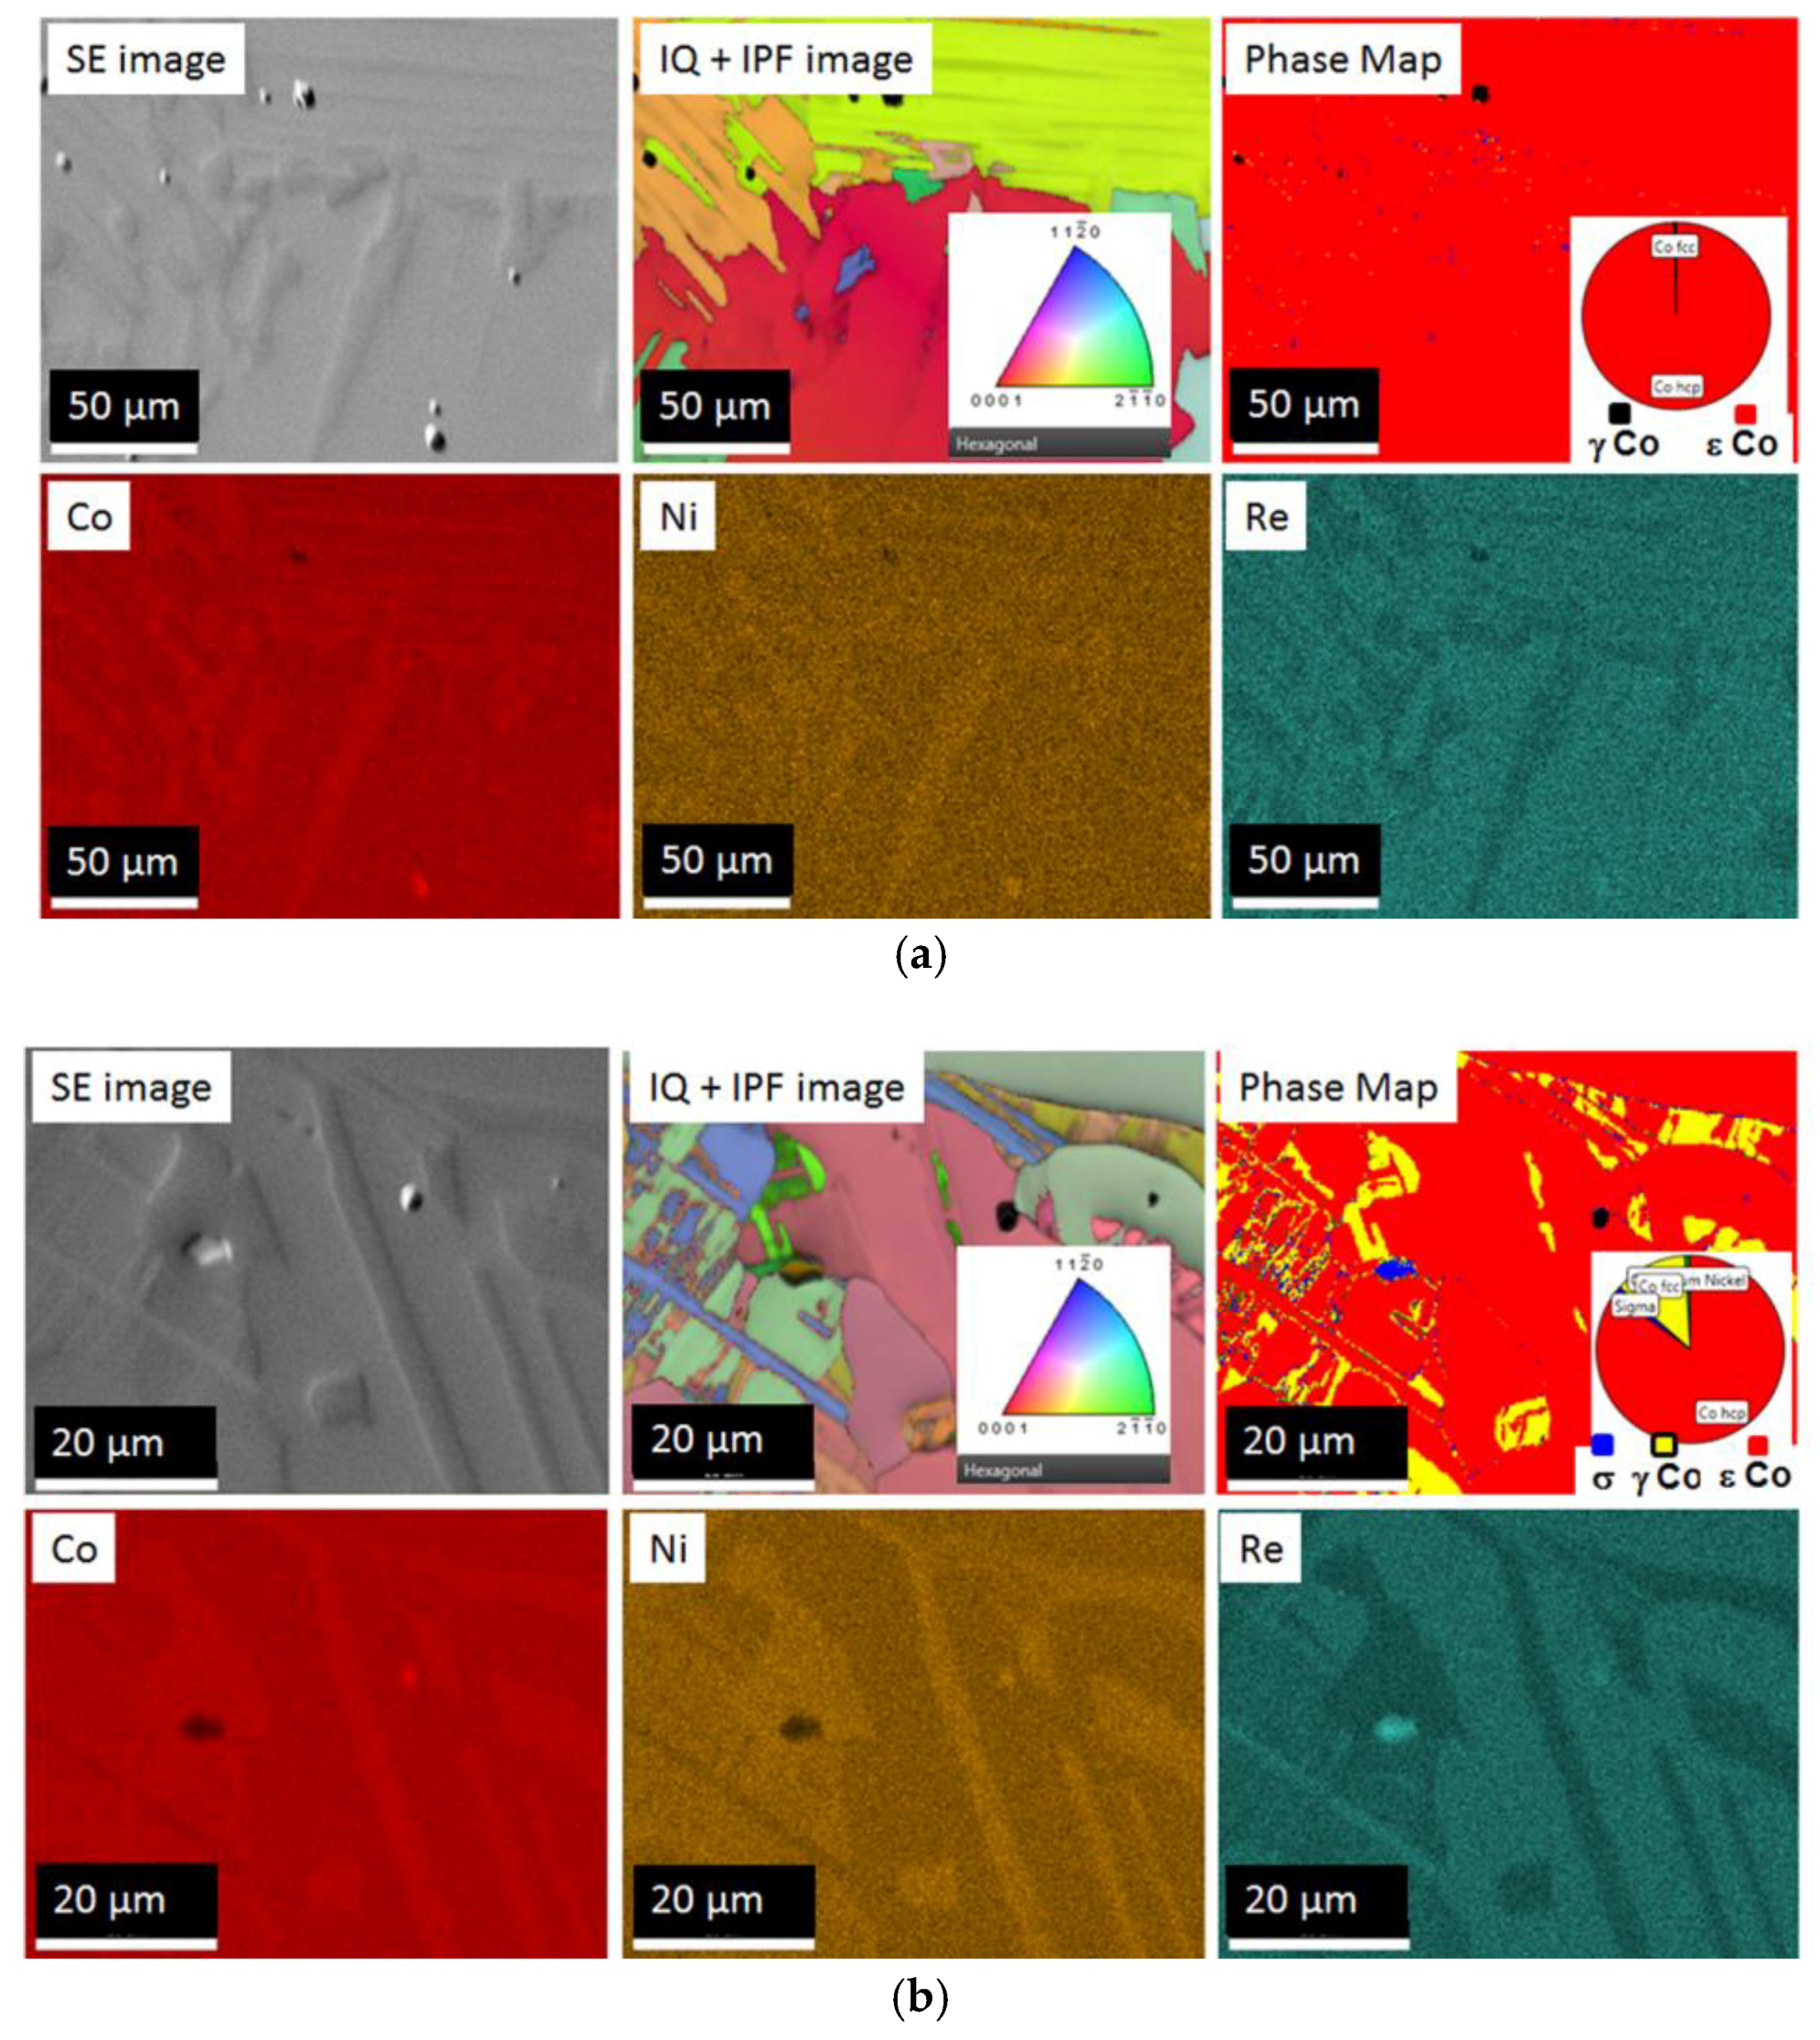
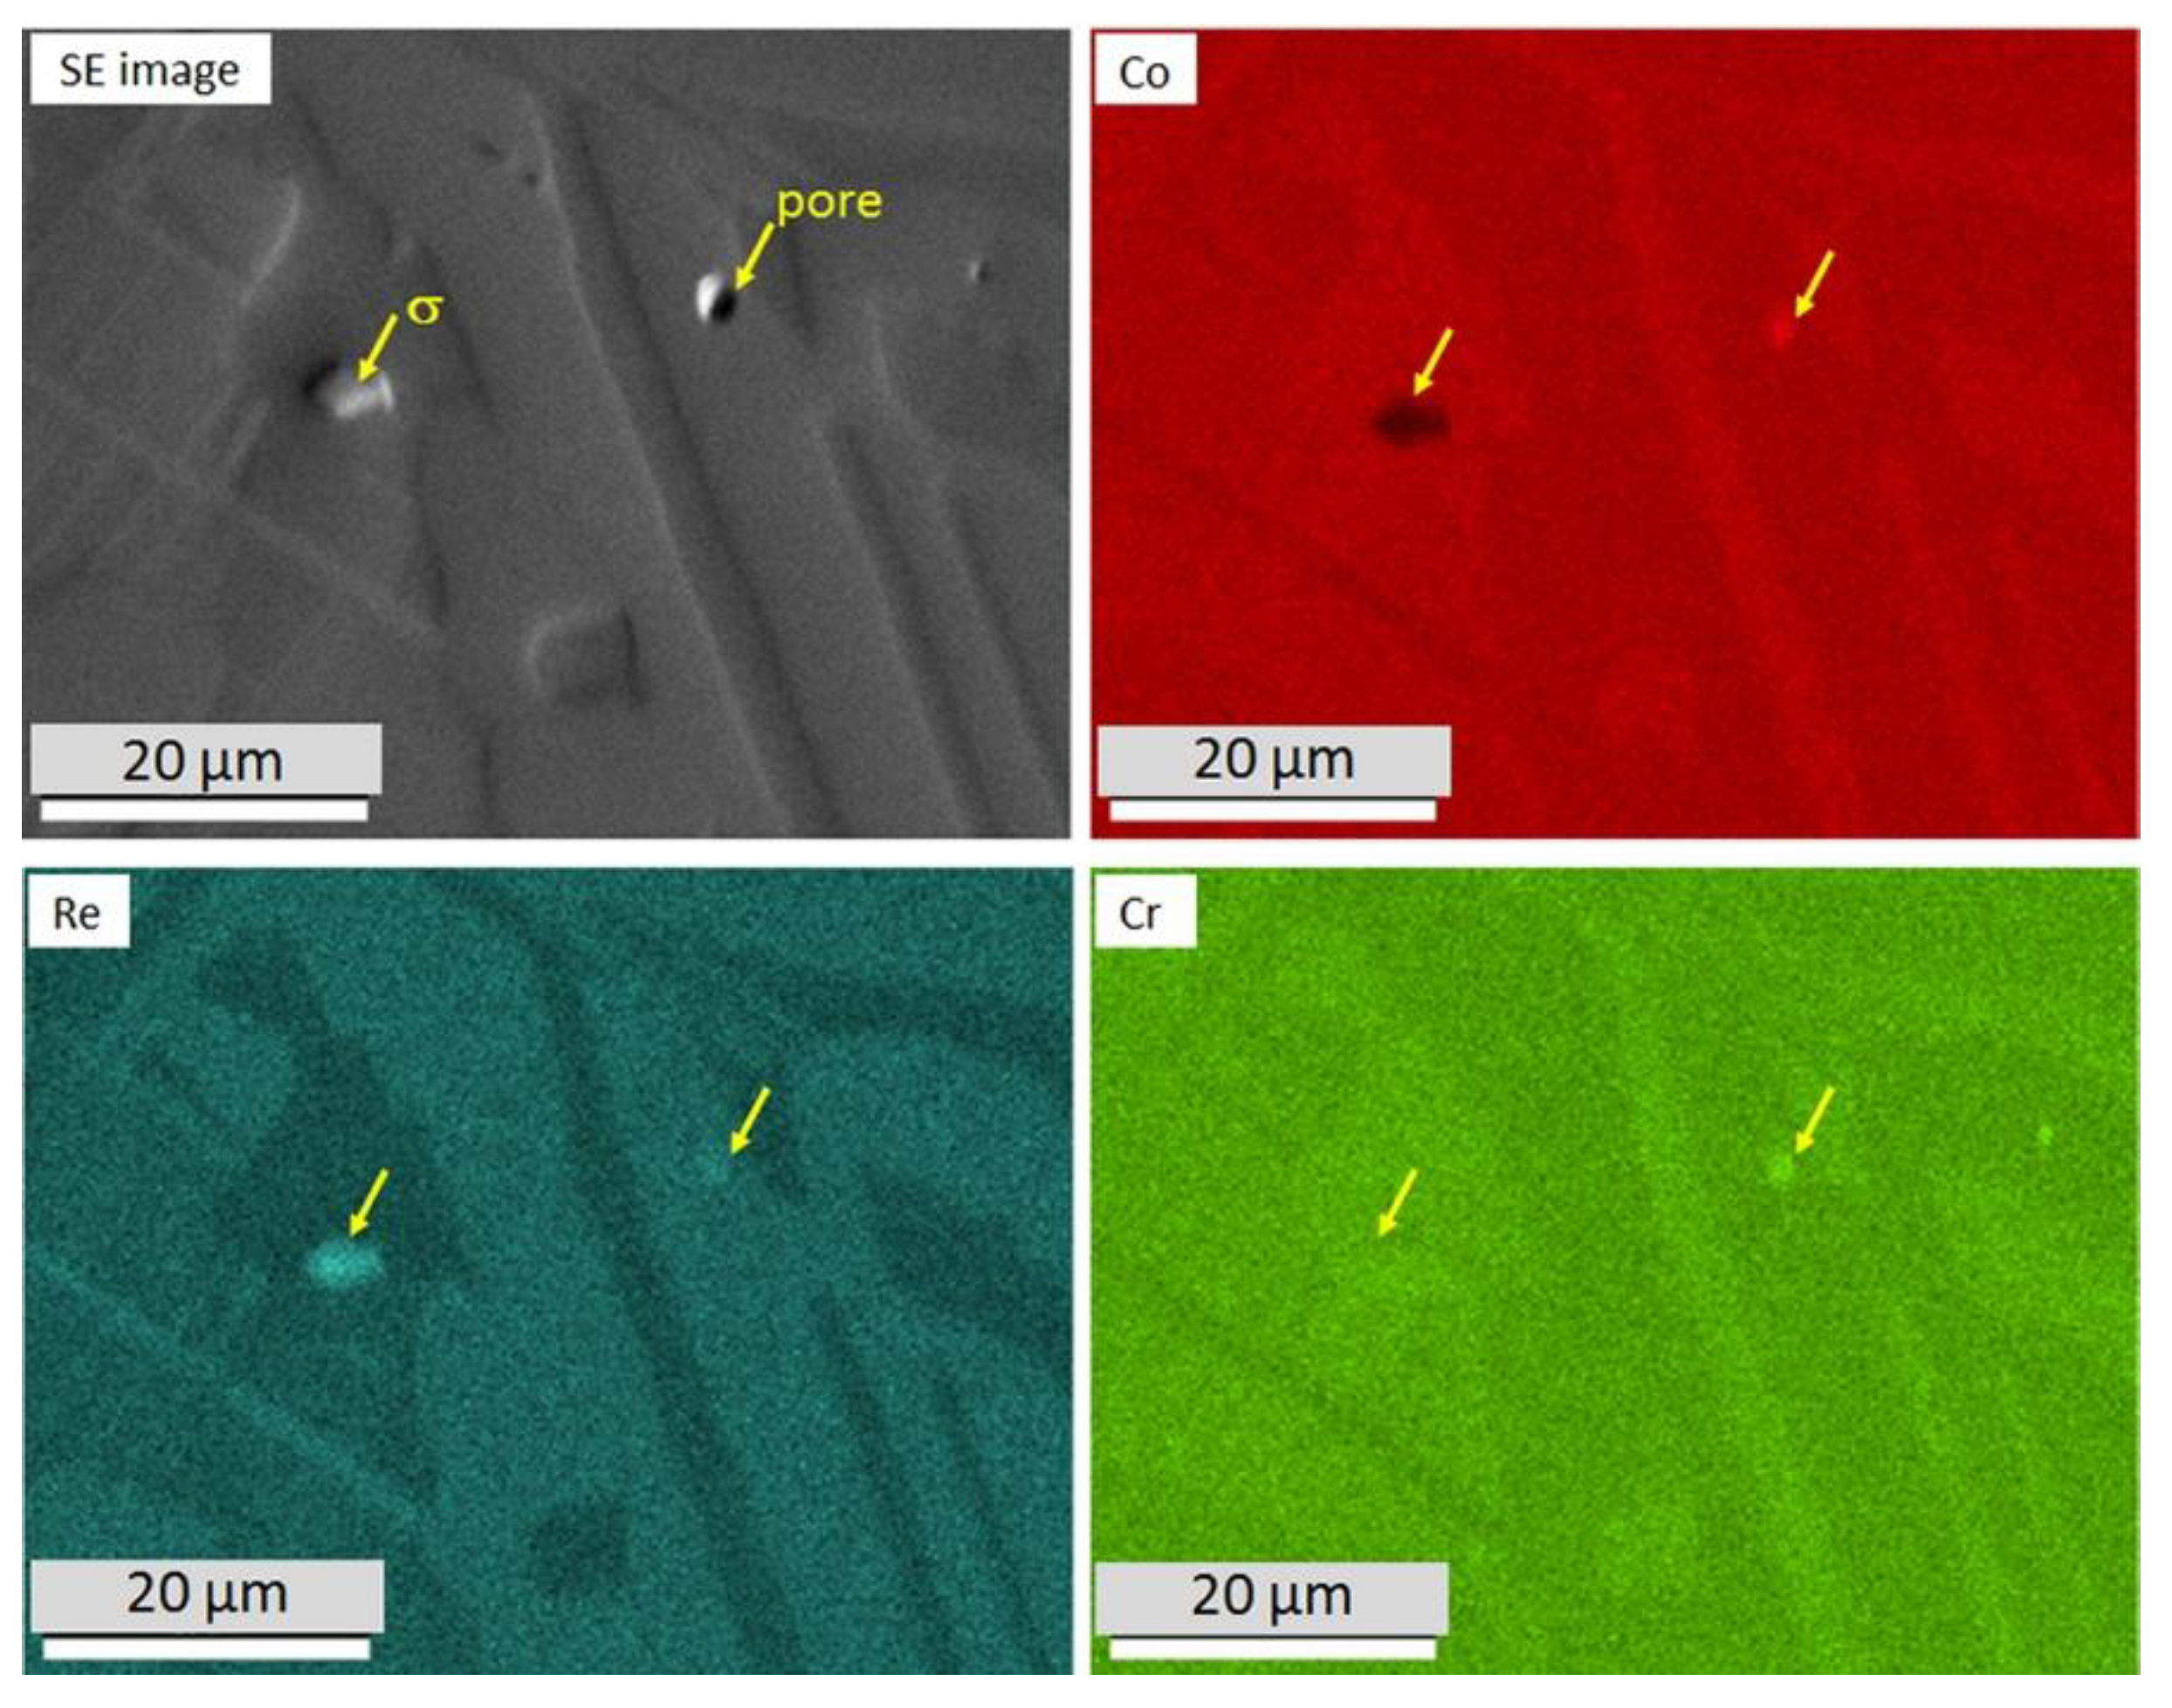
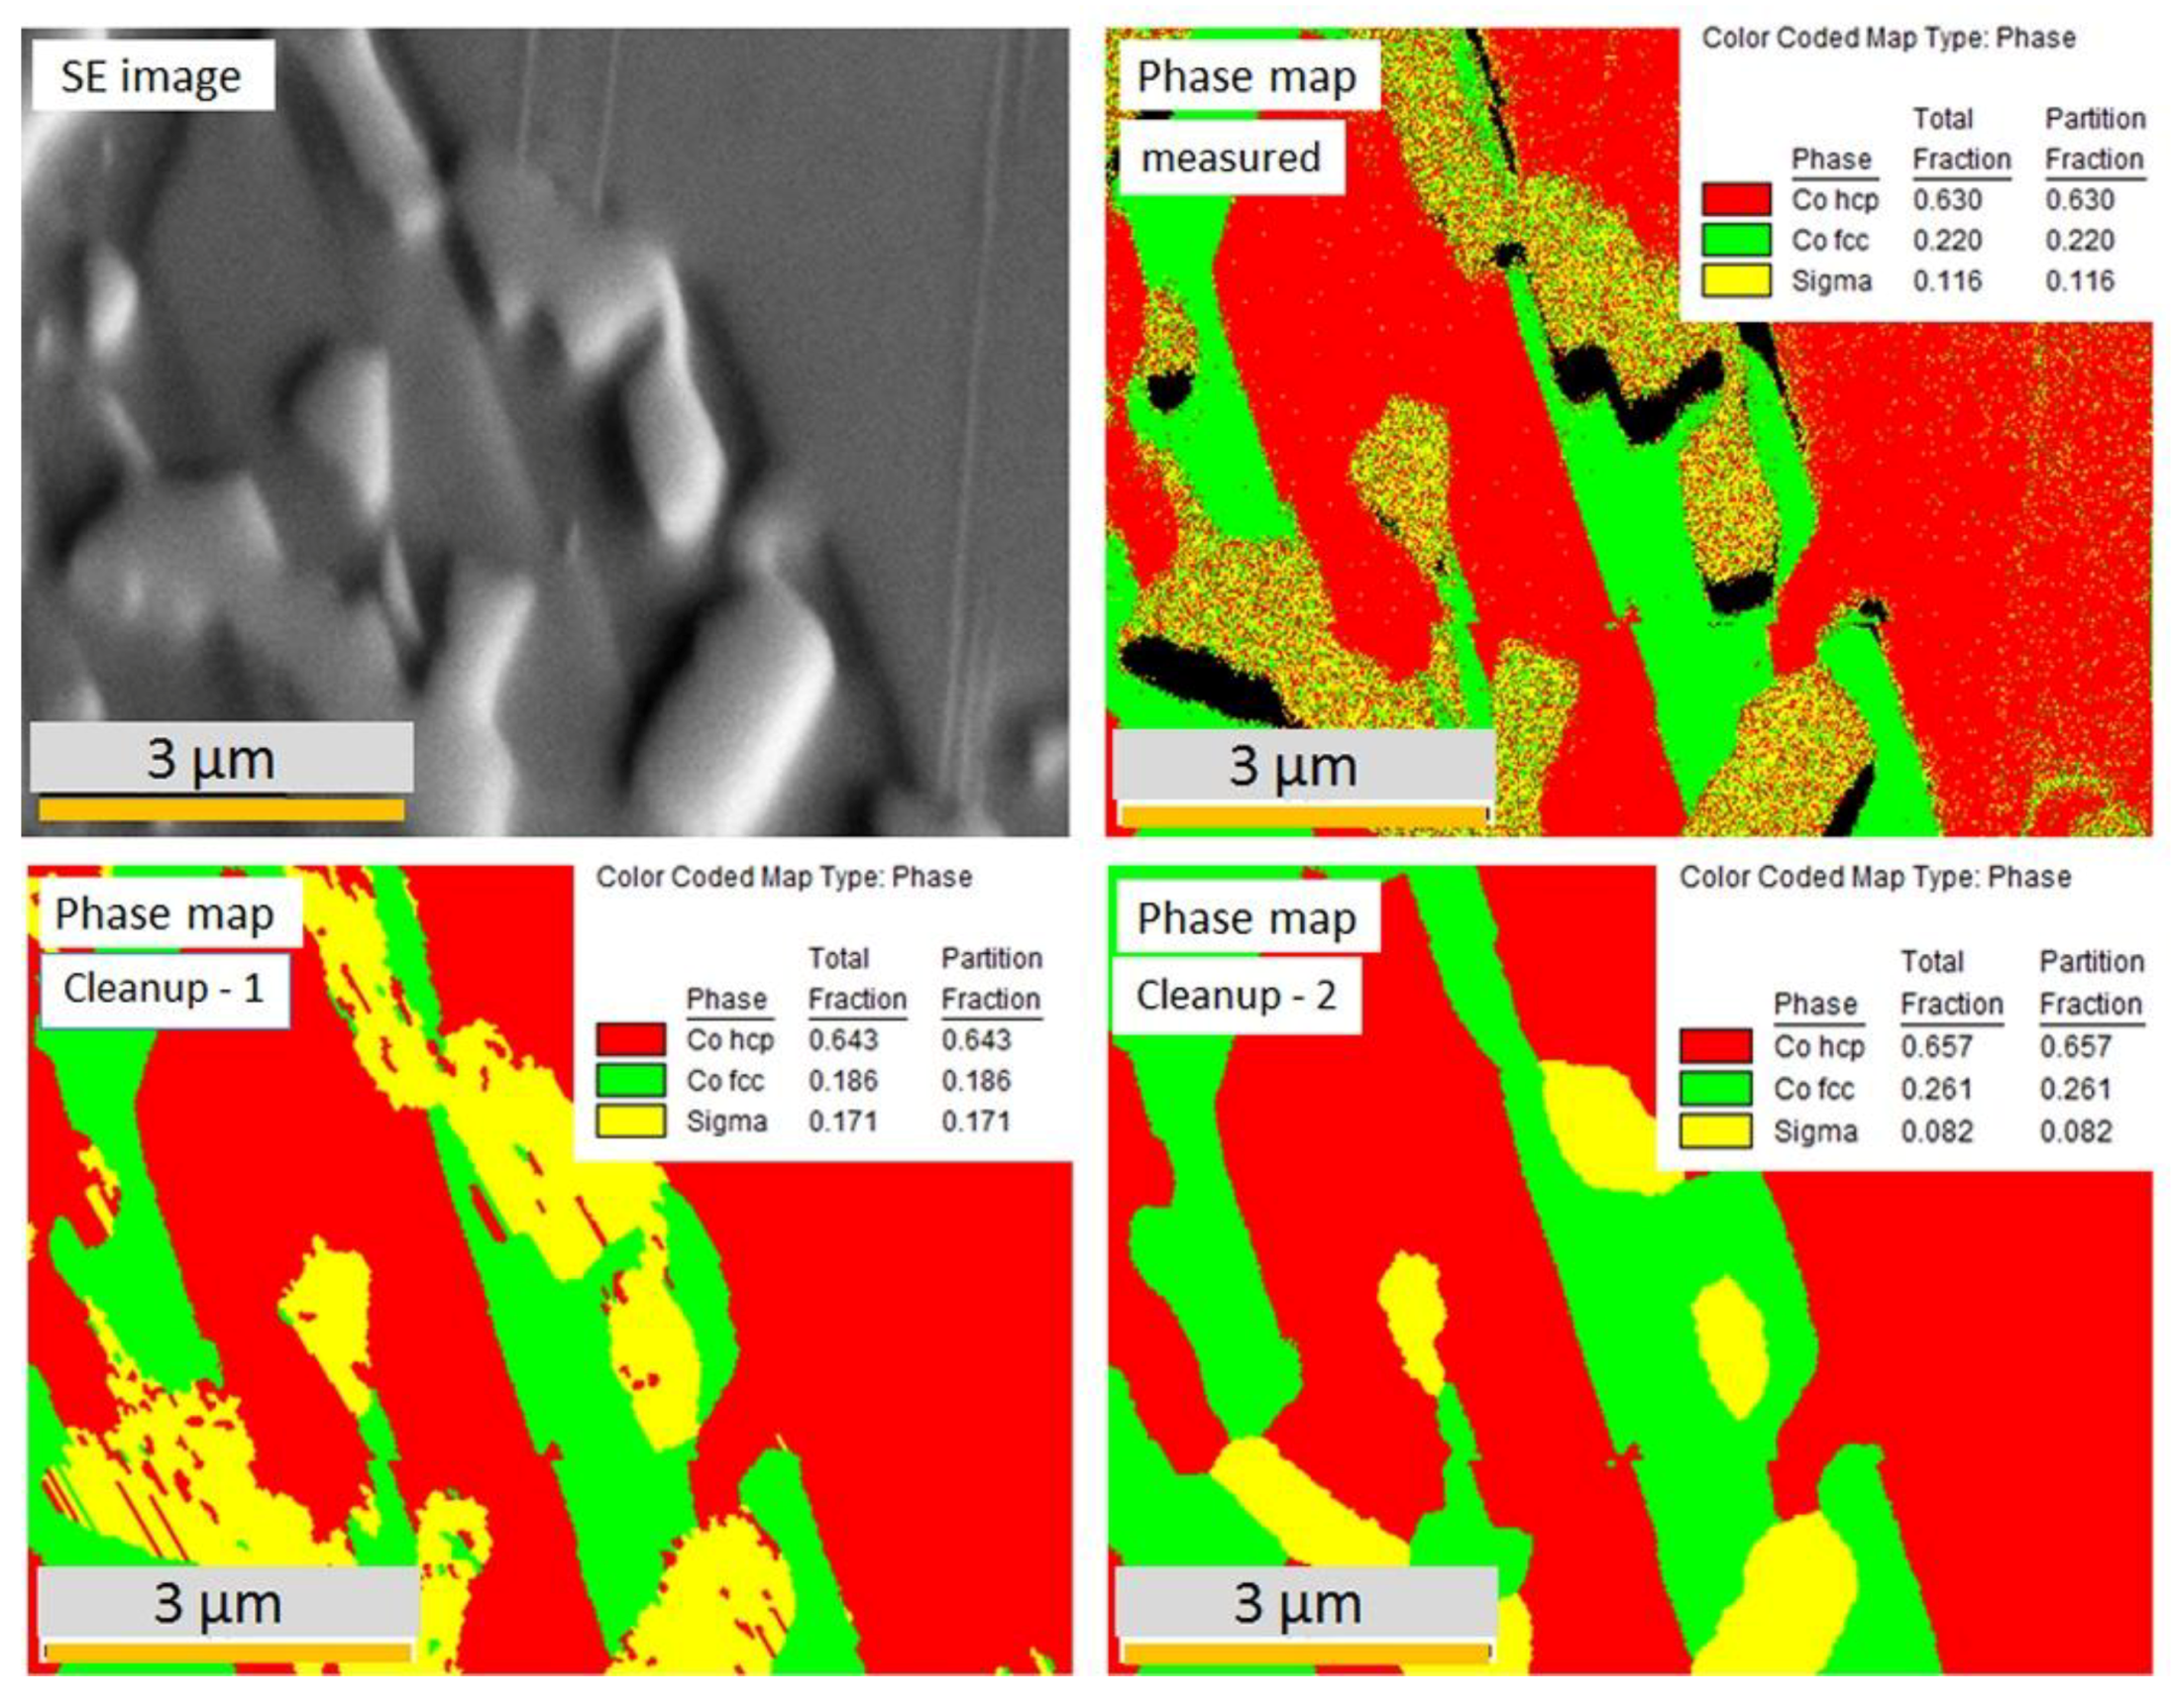
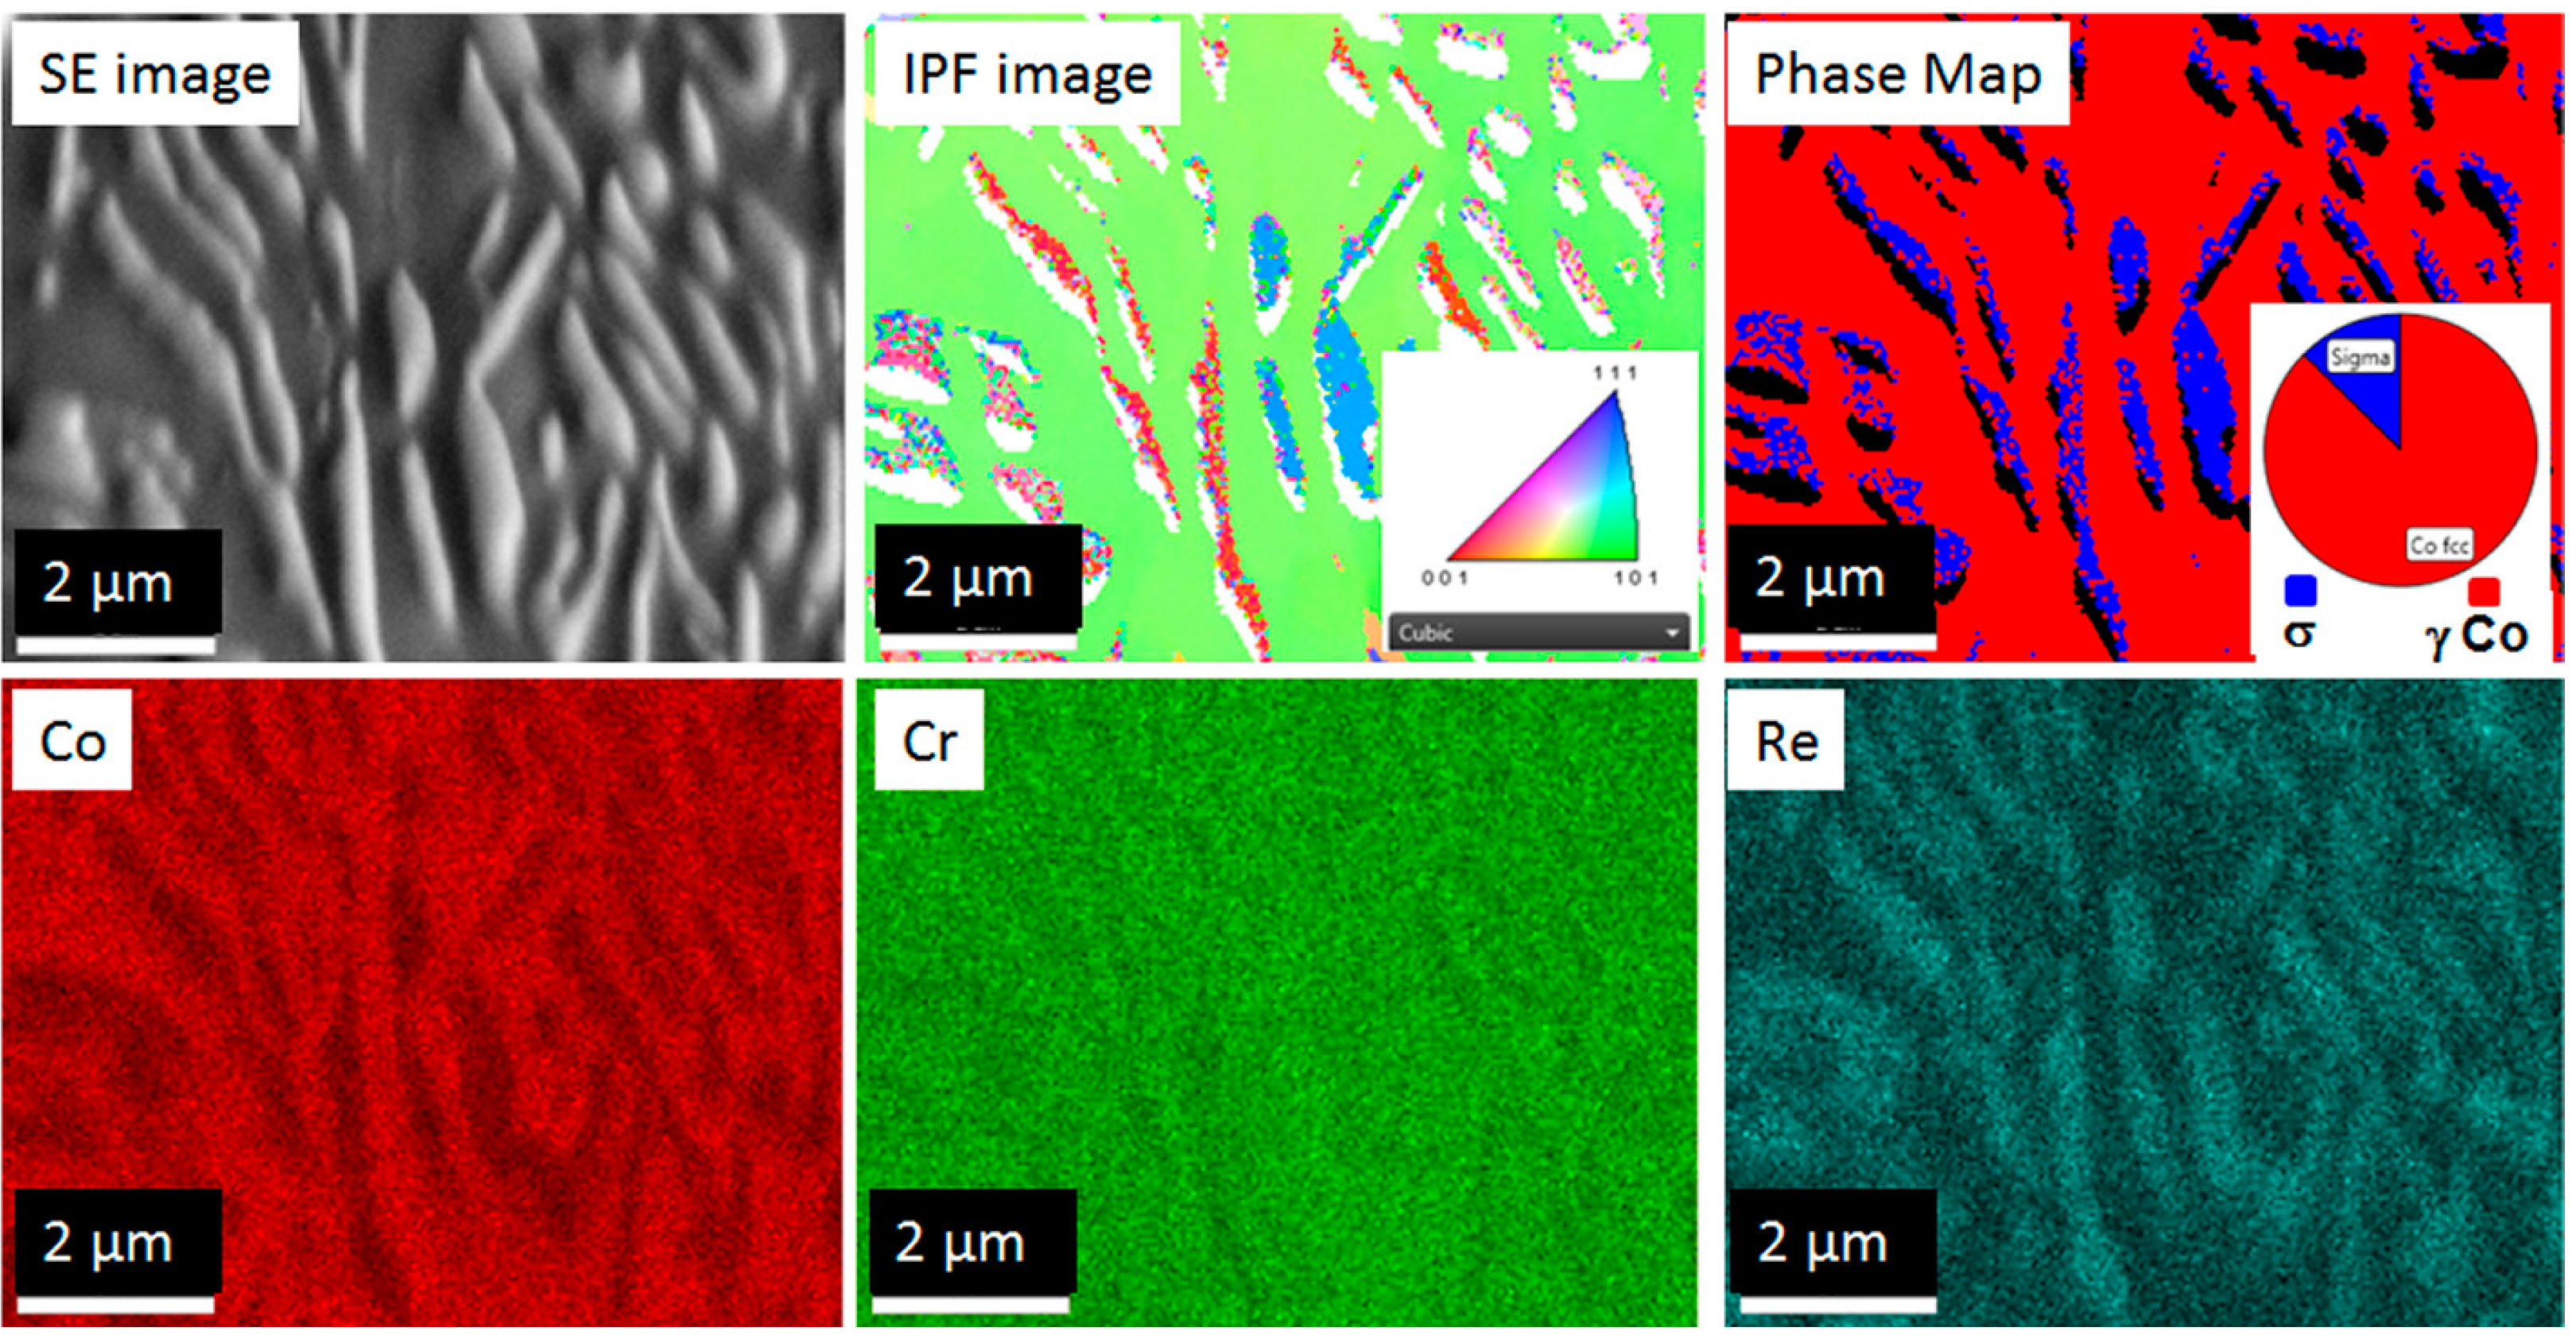
3.2. Combined EBSD and EDS Measurements
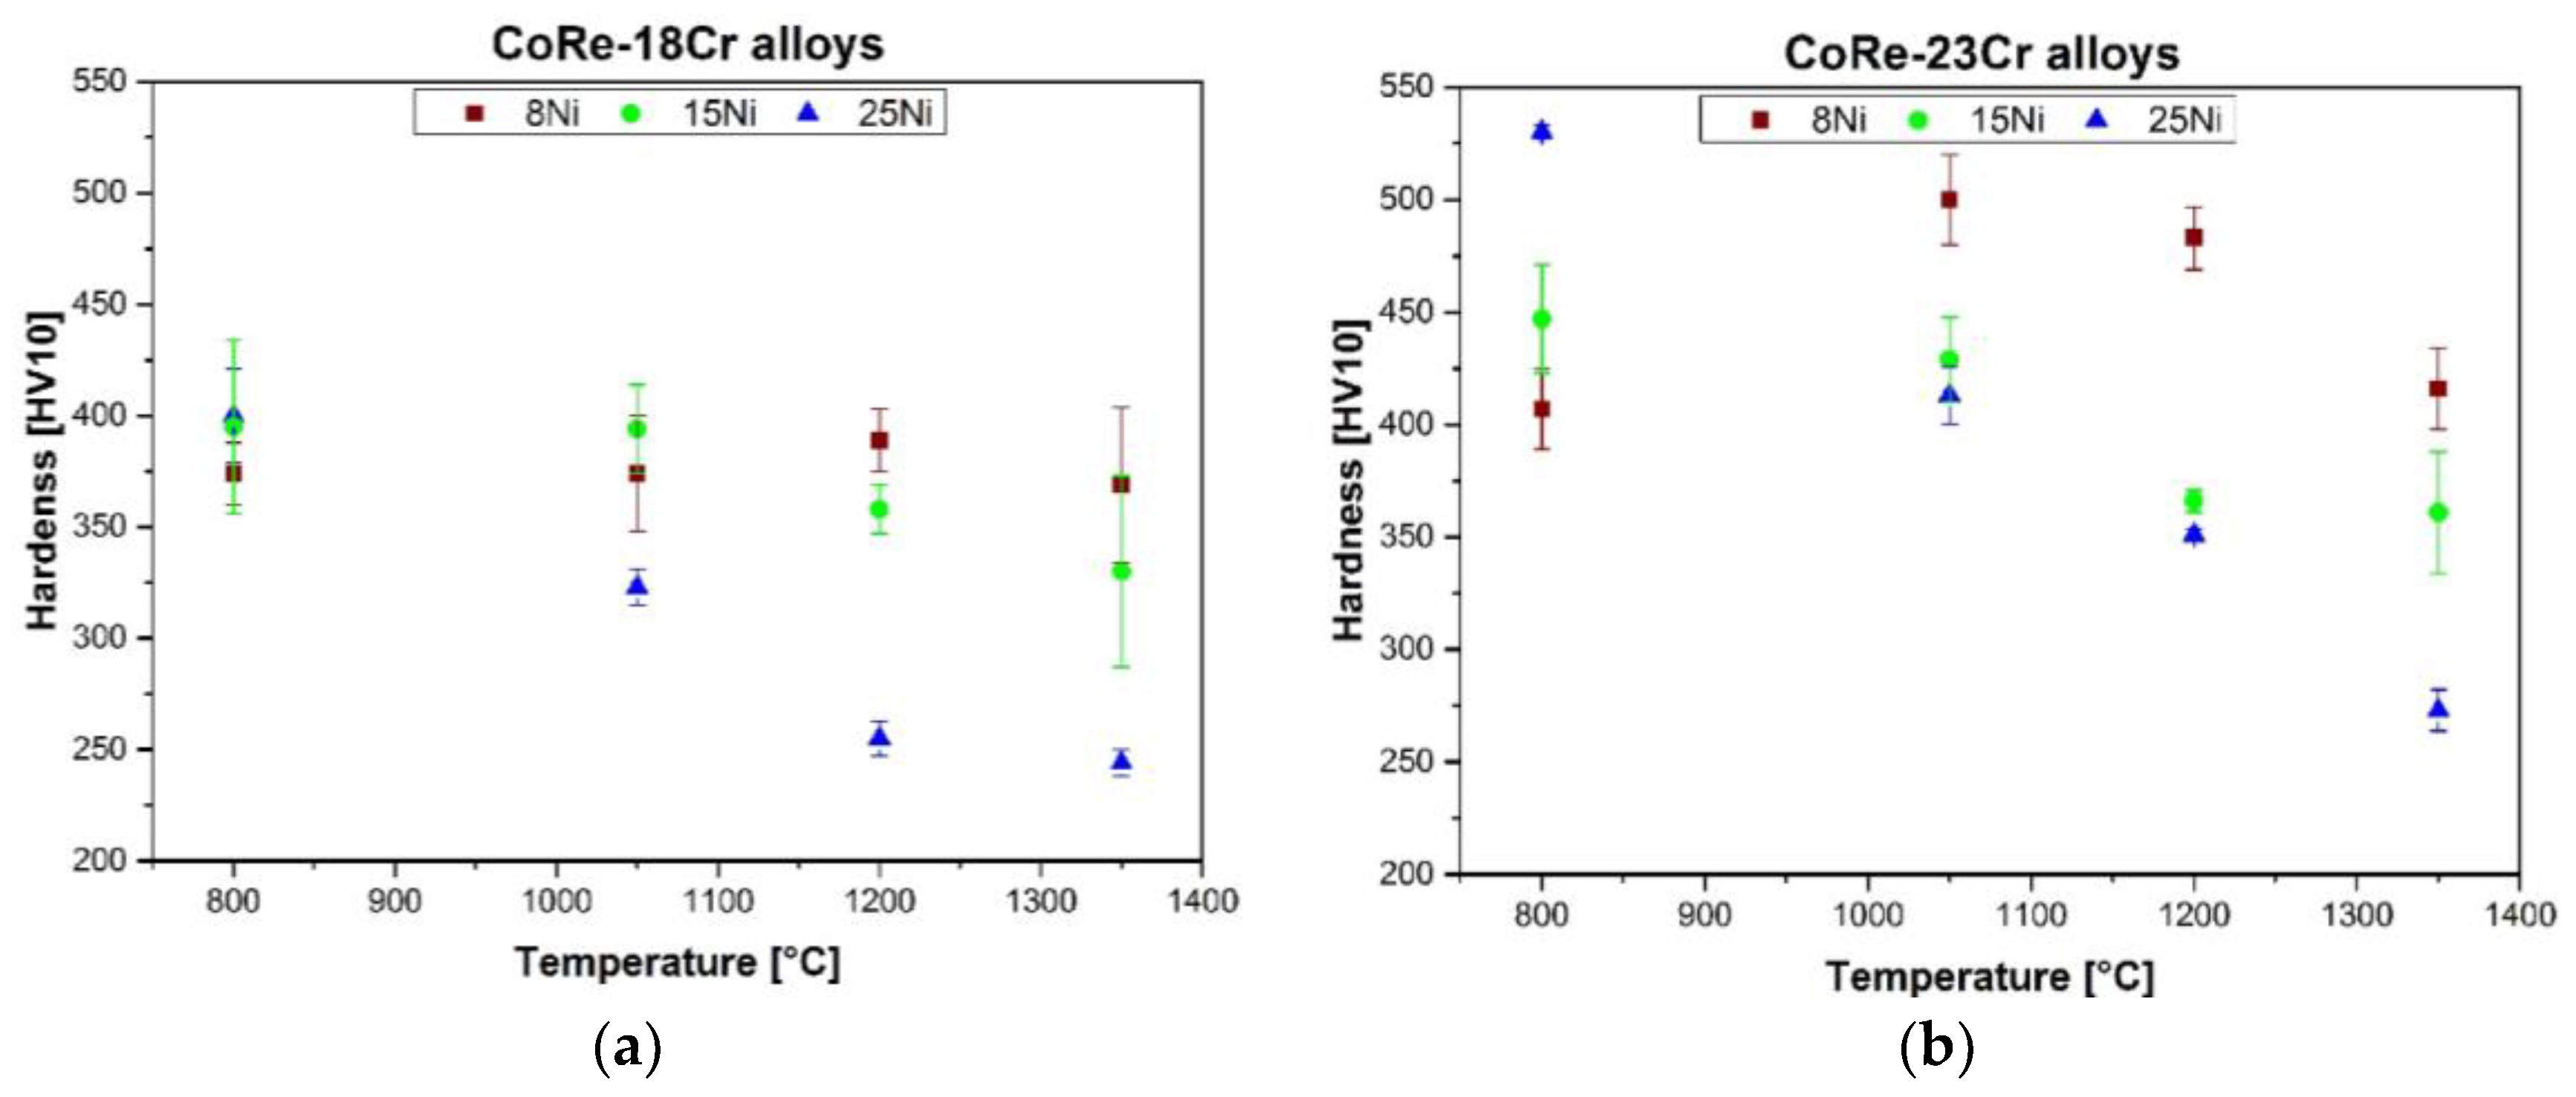
Other than the σ phase (morphology and volume) evolution, one other significant observation can be made after different heat treatments in the alloys with varying composition—i.e., the Co matrix microstructure, which shows an allotropic phase transformation from ε to γ Co leading to the formation of a lath structure (Figure 4 and Figure 5). In low Ni alloys, the matrix is single-phase irrespective of the Cr content, confirmed to be hcp ε Co by neutron diffraction [7]. At higher temperature and higher Ni content (15%) the matrix becomes a two-phase mixture of ε + γ Co. In the alloys with the highest Ni content (25%), the γ phase is retained at room temperature (RT) on cooling from the lower temperature, but partially transforms back to ε Co when cooled from a higher temperature (i.e., the structure is a mixture of ε + γ).
It is, however, important to note that phase transformation occurs both at high temperatures as well as during cooling from the heat treatment temperature. Although the microstructure is observed at room temperature by electron microscopy, drawing conclusions about the matrix phase fraction that existed at the heat treatment temperature is possible because the phase transformation is diffusion-controlled at high temperatures as opposed to the transformation during cooling, which is through a diffusionless martensitic process [8]. As a result of diffusion and the long holding time of 100 h, the ε and γ Co phases tend to reach equilibrium with respect to composition at the temperature of heat treatment (hcp ε is Re-rich and γ Co is Ni- and Co-rich). As a consequence, the hardness of the γ and ε laths that form at high temperature is different and thus the γ and ε laths polish differently during metallographic sample preparation, leading to surface topography. In contrast, γ and ε laths formed by martensitic transformation have similar composition and hardness and do not show any topographic features. Eventually, this makes it possible to distinguish the fraction that arises from transformation at high temperatures from those during cooling. When laths from the two phases (ε and γ) show associated topographic features, we can conclude that they form at high temperature, whereas those formed during cooling polish evenly and show no topography. The distinction can also be made from the EDS results, which show if the compositions of the laths are different or not.
The separation of the two-phase transformations (i.e., in situ at high temperature or during cooling) is clearly illustrated in Figure 6. Figure 6 presents combined EBSD + EDS analysis on two samples of CoRe-18-8 after 1200 °C heat treatment (Figure 6a) and CoRe-18-15 after 1050 °C heat treatment (Figure 6b). The SE images in both samples show the surface topography of the lath structure. However, the phase map shows that the matrix is single-phase ε Co in the 18-8 alloy (Figure 6a) and two-phase (ε + γ phases) in the 18-15 alloy (Figure 6b). The elemental map of Co, Ni and Re shows the partitioning of elements, which matches the surface topography of the lath structure. Some laths are rich in Co and Ni, which can therefore be associated with fcc γ Co, while the other laths are Re-rich and hcp ε Co. This elemental partitioning happened at the heat treatment temperature and the resulting hardness difference is responsible for the surface topography in the sample. In the CoRe-18-8 alloy, the γ Co is transformed back to ε Co on cooling from 1200 °C, but, this transformation being diffusionless, the composition differences in the lath at high temperature is retained at RT. On cooling, the γ laths transformed martensitically to ε phase. Consequently, the EBSD analysis only shows a single ε phase. The composition difference existing at high temperatures is still retained at RT and is responsible for the surface topography. In contrast, examining the CoRe-18-15 alloy shows that the laths/regions that were Co- and Ni-rich fcc phase at high temperature are only partially transformed during cooling to two-phase ε + γ regions. However, no composition difference between ε and γ is mapped in these laths, demonstrating that the phase transformation was diffusionless.
The Co matrix in the alloy containing 25% Ni is single-phase γ Co after heat treatment at lower temperatures. This is illustrated by the EBSD + EDS analysis on the CoRe-23-25 alloy after 800 °C heat treatment (Figure 7). In this image it is interesting to see that despite the different orientations of the cellular σ particles, the γ matrix has a single orientation, indicating no lath structure. The EBSD map accurately indexes the σ phase and the γ Co matrix and the elemental maps show the σ phase is rich in Re. A strong influence of Ni on stabilizing the fcc structure, despite high Cr content, is clear. Note, however, that the matrix is not single-phase γ when the alloy is cooled from a higher heat treatment temperature (1200 °C for CoRe-23-25 and 1200 °C or 1350 °C for CoRe-18-25). This can be attributed to a diminished content of the σ phase (compare with Table 3), thus releasing the hcp stabilizing elements Cr and Re into the matrix. The matrix phases identified at RT and those estimated to exist at high temperatures are listed in Table 4 for all sample conditions.
The constitution of phases in the Co matrix after cooling from the heat treatment temperature is schematically depicted in Table 4a. The information presented in this paper is mainly based on results of EBSD + EDS mapping performed on the samples at RT. It has also been generally confirmed by the neutron diffraction measurement [7], although small differences emerge in the two measurements as the cooling rates and hold times of the samples in the two experiments were different. It is slower in the in situ neutron experiment compared to the laboratory heat treatment, where samples were quenched in a vacuum with high-pressure argon gas. Moreover, the holding time at the high temperature is much shorter (10–15 h) for the in situ neutron diffraction, compared to the hold time (100 h) during the heat treatment.

3.3. Hardness

Figure 8a shows hardness plots of the 18Cr alloys after different heat treatments. The hardness of CoRe-18-8 remains more or less constant (~370 HV10) irrespective of the heat treatment temperature. In contrast, the hardness values in alloys with higher Ni contents decrease after high-temperature exposure. While the hardness in CoRe-18-15 alloy initially remains stable until 1050 °C and then slightly decreases with further increasing temperature, the hardness of the CoRe-18-25 alloy decreases continuously with increasing heat treatment temperature. The results further show that Ni has little influence on the hardness of the 18Cr alloy when heat-treated at low temperatures, but strongly influences the hardness of the alloy when heat treatment is performed at a higher temperature. This may be partly due to the influence of the Co matrix structure, ε or γ Co and their phase fraction in the microstructure, which is strongly influenced by the Ni content.
A similar plot of hardness as a function of Ni content and heat treatment temperature for the 23Cr alloys is displayed in Figure 8b. Firstly, the higher Cr alloys are generally stronger and, secondly, the hardness in the higher Cr alloys is more strongly affected by the heat treatment temperature. CoRe-23-8 shows a maximum in hardness for heat treatment at 1050 °C and (except for heat treatment at 800 °C) shows the highest hardness values amongst all Ni-containing alloys. After the 800 °C heat treatment, CoRe-23-25 shows the highest hardness (530 HV10), but the hardness decreases rapidly in this alloy with increasing heat treatment temperature, resulting in the lowest hardness (273 HV10) after exposure at 1350 °C. The hardness in the 23Cr-15 alloy is intermittent between the two alloys and decreases with increasing temperature above 1050 °C.

4. Discussion

4.1. Influence of Cr and Ni on the σ Phase

Increasing the Cr content in the alloy increases the volume fraction of the σ phase as expected, since the σ phase is a Cr- and Re-rich compound. However, the present microstructural investigation shows that both Cr and Ni promote formation of the σ phase (Figure 4 and Figure 5). Ni also refines the cellular σ phase morphology and lowers the interparticle distance.
The term σ phase designates an intermetallic compound showing up in 43 different binary systems [9], including three of the six binary systems associated with the Co-Re-Cr-Ni quaternary system under investigation. Of these, Co-Cr, Ni-Cr and Cr-Re show the presence of a stable σ phase, but Co-Ni, Co-Re and Ni-Re do not. The σ phase was first observed by Bain in 1923 as a hard non-magnetic intermediate phase that was formed during a long high-temperature annealing in the Fe-Cr alloy with a nearly equiatomic composition [10]. Primarily, Cr is an essential element for the σ phase formation in most systems and, in the Co-Re-Cr system, σ is a Cr- and Re-rich compound. Although the existence of the sigma phase in the Cr-Re system has been firmly established, there are considerable discrepancies about its ordering behaviour [11]. The σ phase forms in binary systems with the following characteristics of the A and B elements. Typically, A has a low number of d-electrons, a bcc crystal structure, a large atomic radius and a preference for sites with large coordination numbers (CN). B is richer in d-electrons, has an fcc or hcp crystal structure, a smaller atomic radius and a preference for sites with smaller CN. The σ phase pertains to the group of the Frank-Kasper phases and has a topologically closed packed structure, which is defined by a tetragonal unit cell (space group P42/mnm, sp.gp # 136) containing 30 atoms. As described by Kasper [12], the 30 atoms in the tetragonal unit cell of the σ phase occupy five crystallographically different types of sites: A’, B’, C’, D’ and E’, with two, four, eight, eight and eight atoms and coordination numbers of 12, 15, 14, 12 and 14, respectively. It is known that the nonequivalent σ phase sites are partially occupied by all the alloy components, but with certain preferences. Type A atoms preferentially occupy larger sites of CN = 15 (site B’), and type B atoms tend to occupy smaller sites of CN = 12 (sites A’ and D’). Sites of CN = 14 (sites C’ and E’) have both A and B type atoms in varying proportions, depending on the overall alloy composition. An inverse size relationship of the Cr-Re σ phase is much more pronounced but different studies have led to conflicting results for the site preference [11]. An ordered structure model (B)8(A)4(A,B)18 for the σ phase was proposed by Anderson and Sundman [13] and describes the Cr-Re σ phase best, with Cr as the A atom and Re as the B atom in the structure. Huang and Chang extended this (Re)8(Cr)4(Cr,Re)18 structure model to the Cr-Ni-Re ternary system [11]. Although there were no experimental data available for the ternary Cr-Ni-Re system, Huang et al. used a thermodynamic description of the ternary system by combining the thermodynamic descriptions of its three binary sub-systems and estimating some parameters for the σ phase. According to the thermodynamic description thus obtained, the Cr-Re σ phase can dissolve about 20 atomic % Ni at 1000 °C [11]. The results of the present study shows that Ni tends to stabilize the Cr-Re-rich σ phase, but with increasing heat treatment temperature Ni has less influence on the σ phase stability. In the alloys with 23% Cr, the σ phase volume fraction at 1200 °C is about 15%, independent of the Ni content, and diminishes to about 1% after 1350 °C. For the 18% Cr alloys, a significant amount of σ phase is only stable in the alloy with the highest Ni content (25% Ni) after low-temperature heat treatments. The σ phase is not stable at very high temperatures (above 1200 °C).

4.2. σ Phase Morphology and Its Influence on the Allotropic Transformation of the Co Matrix

The σ phase is present in the Co-Re-Cr-Ni alloy microstructure mainly in two different morphologies, depending on the alloy composition and the heat treatment temperature. For the high Cr alloys, blocky σ is present for all heat treatment temperatures except the lowest and is the only morphology at 1350 °C. In the low Cr alloys, blocky σ particles are not as common and σ phase in any morphology is not stable at high temperatures. The blocky σ particles are generally at the grain boundaries and, although the large σ particles themselves are brittle, they do not render the alloy brittle, as the Co matrix is relatively ductile [12]. This morphology of σ phase apparently has little influence on the Co matrix allotropic phase transformation.
A more interesting microstructure of the σ phase from the point of view of its influence on the alloy strength and the matrix phase transformation is the cellular σ phase. Cellular σ forms through a discontinuous precipitation in the Co-Re-Cr-Ni alloys. The σ phase precipitation in Co-Re-Cr-Ni alloys shows many similarities to the Fe-Cr σ phase precipitation in stainless steels. The precipitation of the σ, which is common under an elevated temperature environment in many stainless steels, is difficult to prevent when the Cr content in the alloy is above a certain level (generally above 20 weight % in stainless steels) [14]. The σ phase is also stabilized in Co-Re-Cr alloys with Cr content above 20 atomic % [15]; however, in the present study we find that σ phase precipitates also in 18Cr alloys but mainly for high Ni content.
Clearly, cellular σ precipitation occurs at high temperatures during the heat treatment and the transformation involves diffusion. The discontinuous precipitation (also known as cellular precipitation) starts at the grain boundaries, as seen in the high-Cr, low-Ni alloy at 800 °C (Figure 5a) from the presence of small σ precipitates at grain boundaries; one sees how precipitation of cellular σ progresses in the grain with the advancement of the moving cellular reaction front. In cellular precipitation, one of the phases remains the same (albeit with a different composition): γ’ → γ + σ. Moreover, all of the parent phase is eventually consumed by the transformation product. The transformation does not terminate by a gradual reduction in the growth rate, but by the impingement of adjacent cells growing with a constant velocity. In the above example, γ’ is the original supersaturated Co matrix, γ is the matrix phase after the transformation with a composition closer to equilibrium composition at the temperature and σ is the precipitate phase. A sudden change in composition across the moving reaction boundary is known to occur in the cellular precipitation. A consequence of the cellular σ precipitation is that the Co matrix in the Co-Re-Cr-Ni alloys is depleted in the hcp stabilizing elements (Cr and Re) and is more prone to form γ Co, which is the stable allotromorph of Co matrix at higher temperature. Thus the σ precipitation effectively shifts the matrix transformation temperature to a lower value.

4.3. Matrix Phase Transformation during Cooling

Table 4a shows that the matrix of the CoRe-23-25 alloy consists of γ Co after cooling from 1200 °C or a lower temperature, but not after cooling from 1350 °C, which has a two-phase ε + γ matrix structure. This is generally unexpected, because ε Co is the low-temperature phase and generally does not remain stable at 1350 °C, especially in the high-Ni alloy, since Ni is a fcc γ stabilizer. However, as explained above, the matrix composition is enriched in Re and Cr with diminished σ phase content at this temperature and stabilizes the ε phase on cooling to RT. A two-phase microstructure, as opposed to a single-phase microstructure, can be easily recognized by the presence of laths in the grain (Figure 4 and Figure 5). Moreover, the EBSD result could determine whether the crystal structure of the laths are ε or γ phase. Accordingly, the crystal structures of the Co matrix at RT after cooling from the different heat treatment temperatures are given in Table 4a. Further, as discussed above, the EBSD + EDS measurement is able to distinguish the ε + γ laths formed at high temperature from those formed during cooling. Thus, the phase constituents existing at heat treatment temperature were estimated in the alloys and are summarized in Table 4b.
The Co matrix structure is primarily single-phase hexagonal ε at RT for low Ni contents (8 and 15Ni), but may be single-phase γ in high Ni alloy (25Ni) depending on the temperature from which it is cooled. In the 8Ni alloys, the matrix is single-phase ε at room temperaturewhen cooled after the heat treatment, irrespective of the temperature it is cooled from. However, for the 15Ni alloys, it is single-phase ε only when cooled from 800 °C, but is two-phase ε + γ when cooled from higher temperatures. In the 25Ni alloys, the single-phase γ is stabilized at RT when cooled from low temperatures (in 18Cr alloy 1050 °C and below; in 23Cr alloy 1200 °C and below) and is two-phase (γ + ε) when cooled from a higher temperature (e.g., 1350 °C). On cooling from the high temperature, the σ phase formation is suppressed and the matrix composition is Re rich, favouring the stability of the hexagonal ε Co. In Co-Re-Cr alloys the ε phase is the thermodynamically stable phase at RT also with Ni additions. It is however, seen that an addition of 25% Ni is able to stabilize the high-temperature γ allotromorph of Co at RT. This is not surprising as Ni is an fcc γ stabilizer. Still, it is clear that the γ Co phase at RT is metastable in Co-Re-Cr alloys with up to 25% Ni, since it is known that about 30% Ni is needed in pure Co to fully stabilize the γ phase to RT [16]. So, for an alloy containing 17% Re and >18% Cr (both Re and Cr being hcp stabilizers), a much higher amount of Ni will be needed to retain the high-temperature γ Co phase in a thermodynamically stable state at RT.

4.4. Influence of the Microstructure on Alloy Hardness

The three constituent phases in Ni containing Co-Re-Cr-based alloys and their different morphologies have considerable influence on the alloy hardness. The influence of the Co matrix phases on the hardness can be seen best in the 18Cr alloys after 1350 °C, where the σ phase is not stable and its influence can be excluded (Figure 8a). CoRe-18-8 is the strongest alloy with a hardness of 369 HV10 and CoRe-18-25 has the lowest hardness with 244 HV10. CoRe-18-8 has a single-phase ε Co matrix and CoRe-18-15 and CoRe-18-25 a two-phase ε + γ Co matrix, with the CoRe-18-25 showing a higher amount of γ Co. From this it may be concluded that the hexagonal ε Co is harder than the cubic γ Co phase. This is also supported by the 23Cr alloys after 1200 °C and 1350 °C heat treatments, where the volume fraction of the σ phase is nearly the same. The 8Ni-containing alloy with ε Co matrix is harder than the 25Ni alloy, where the matrix is γ phase. Apparently, the composition of the phases also has a strong influence on the hardness of the matrix, possibly a stronger influence than their different crystal structures. The high amount of Re in the ε Co phase makes it harder than γ Co phase (rich in Ni). The hardness difference of the two phases also leads to surface topography in the two-phase lath structure (Figure 6).
The influence of the σ phase on the hardness can be seen best in the 23Cr alloys (Figure 8b), where the σ phase has high volume fractions and is stable up to 1350 °C. However, a direct correlation between hardness and σ volume fraction cannot be seen (compare Table 3 and Figure 8b), because the σ phase morphology is not always the same. That the σ phase morphology strongly influences the hardness can be seen in the CoRe-23-8 alloy. The alloy after heat treatment at 1350 °C has no cellular σ (but only blocky σ) and also has a lower hardness compared to heat treatments at lower temperature (Figure 8b), which produce a finer dispersion of σ phase precipitates in the form of cellular σ phase. However, even the correlation of the volume fraction of cellular σ and hardness is not direct as the hardness of the alloy is expected to be affected by the fineness of the σ phase and the Co matrix structure (ε or γ) as well. In the 23Cr alloys, generally high σ volume fractions (broadly 8–35%) show a strengthening effect and thus the alloys are harder after heat treatment at lower temperatures than when heat-treated at 1350 °C (only 1–2% σ phase). With increasing heat treatment temperature, the volume fraction of the σ phase and the hardness decrease. The σ phase is a hard and brittle phase and contains a high amount of Re. Due to its brittleness, efforts are generally made to avoid the σ phase in the microstructure of stainless steels and Ni-based superalloys [17]. However, it was shown that in Co-Re-Cr-Ni alloys, when the cellular σ phase is finely dispersed, it does not fracture in a brittle manner [12]. However, for strengthening at very high temperatures, the stability of the σ phase seems to be insufficient.

5. Conclusions

The addition of Cr and Ni in Co-Re-Cr-Ni alloys promotes the formation of the σ phase, and increasing the Ni content also refines the σ phase morphology. Microstructures of alloys with varying Cr (18–23%) and Ni (8–25%) contents were studied using electron microscopy. In addition to microscopy, in situ neutron diffraction measurements were done and published separately [7]; the results were also used to interpret the microscopy observations. The crystal structures and compositions of the existing phases were studied using combined EBSD + EDS measurements. The σ phase volume fraction was estimated by digital image analysis. The Co matrix in Co-Re-Cr-Ni alloys undergoes an allotropic phase transformation (ε to γ Co on heating) at temperatures higher than 1000 °C, but the exact transformation temperature depends on the alloy composition. The σ phase is mainly found in two morphologies in these alloys, where at high temperature only blocky σ phase is present at grain boundaries but cellular σ is formed through a discontinuous precipitation within the grains at lower heat treatment temperatures. The presence of fine cellular σ phase influences alloy hardness. Moreover, the σ precipitation, which depletes the matrix in Re, also influences the allotropic transformation of the Co matrix.

Author Contributions

Conceptualization, D.M., J.R. and H.-J.C.; Methodology, D.M., K.D. and J.R.; Microscopy and Other Experiments, K.D. and D.M.; Data Analysis, D.M. and K.D.; Discussion of Results, D.M., K.E., B.G., J.R. and H.-J.C.; Writing and Original Draft Preparation, K.D. and D.M.; Reviewing and Editing, J.R., H.-J.C., B.G. and K.E.

Acknowledgments

We would like to thank the German Research Foundation (DFG) for financial support for this research in the frame of the DFG Project No. RO 2045/31-1 “Erforschung des Nickeleffektes in Co-Re-Cr Hochtemperaturlegierungen”.

Conflicts of Interest

The authors declare no conflicts of interest.

References

  1. Rösler, J.; Mukherji, D.; Baranski, T. Co-Re-based alloys: A new class of high temperature materials? Adv. Eng. Mater. 2007, 9, 876–881. [Google Scholar] [CrossRef]
  2. Wang, L.; Gorr, B.; Christ, H.-J.; Mukherji, D.; Rösler, J. The effect of alloyed nickel on the short-term high temperature oxidation behaviour of Co-Re-Cr-based alloys. Corros. Sci. 2015, 93, 19–26. [Google Scholar] [CrossRef]
  3. Mukherji, D.; Rösler, J.; Fricke, T.; Pieger, S.; Schmitz, F. Materials for Advanced Power Engineering, Energy & Environment; Lecomte-Beckers, J., Contrepois, Q., Beck, T., Kuhn, B., Eds.; Jülich Forschungszentrum: Jülich, Germany, 2010; p. 633. [Google Scholar]
  4. Mukherji, D.; Strunz, P.; Gilles, R.; Hofmann, M.; Schmitz, F.; Rösler, J. Investigation of phase transformations by in-situ neutron diffraction in a Co-Re-based high temperature alloy. Mater. Lett. 2010, 64, 2608–2611. [Google Scholar] [CrossRef]
  5. Schneider, C.A.; Rasband, W.S.; Eliceiri, K.W. NIH Image to ImageJ: 25 years of image analysis. Nat. Methods 2012, 9, 671–675. [Google Scholar] [CrossRef] [PubMed] [Green Version]
  6. Lloyd, G.E. Atomic number and crystallographic contrast images with the SEM: A review of backscattered electron techniques. Mineral. Mag. 1987, 51, 3–19. [Google Scholar] [CrossRef]
  7. Beran, P.; Mukherji, D.; Strunz, P.; Gilles, R.; Hölzel, M.; Rösler, J. Coexistence of two cubic-lattice Co matrices at high temperatures in Co-Re-Cr-Ni alloy studied by neutron diffraction. Adv. Mater. Sci. Eng. 2018, 2018, 5410871. [Google Scholar] [CrossRef]
  8. Christian, J.W. A theory of the transformation in pure cobalt. Proc. R. Soc. A Math. Phys. Eng. Sci. 1951, 206, 51–64. [Google Scholar] [CrossRef]
  9. Joubert, J.-M. Crystal chemistry and Calphad modeling of the σ phase. Prog. Mater. Sci. 2008, 53, 528–583. [Google Scholar] [CrossRef]
  10. Kabliman, E.; Ruban, A.V.; Blaha, P.; Peil, O.; Schwarz, K. Ab initio study of lattice site occupancies in binary sigma phases using a single-site mean field model. Appl. Sci. 2012, 2, 654–668. [Google Scholar] [CrossRef]
  11. Huang, W.; Chang, Y.A. Thermodynamic analysis of the Cr-Re system and prediction of the Cr-Ni-Re system. J. Alloys Compd. 1998, 274, 209–216. [Google Scholar] [CrossRef]
  12. Kasper, J.S.; Waterstrat, R.M. Ordering of atoms in the σ phase. Acta Cryst. 1956, 9, 289–295. [Google Scholar] [CrossRef] [Green Version]
  13. Anderson, J.-O.; Fernández Guillermet, A.; Hillert, M.; Jansson, B.; Sundman, B. A compound-energy model of ordering in a phase with sites of different coordination numbers. Acta Metall. 1986, 34, 437–445. [Google Scholar] [CrossRef]
  14. Hsieh, C.-C.; Wu, W. Overview of intermetallic sigma (σ) phase precipitation in stainless steels. ISRN Metall. 2012, 2012, 732471. [Google Scholar] [CrossRef]
  15. Mukherji, D.; Rösler, J. Co-Re-based alloys for high temperature applications: Design considerations and strengthening mechanisms. J. Phys. Conf. Ser. 2010, 240, 012066. [Google Scholar] [CrossRef] [Green Version]
  16. Nishiyama, Z. Martensitic Transformation, 1st ed; Academic press: New York, NY, USA, 1978; p. 480. ISBN 9780323148818. [Google Scholar]
  17. Ross, E.W. René 100: A sigma-free turbine blade alloy. JOM 1967, 19, 12–14. [Google Scholar] [CrossRef]
Figure 1. Binarization of SEM micrograph for digital image analysis: (a) SEM grey level pixel image of σ phase, in the Co matrix; (b) binary image where the σ phase appears black and the Co matrix white.
Metals 08 00706 g001
Figure 2. EDS maps from a combined EBSD + EDS measurement with highly tilted sample showing artefact: SE image and elemental maps of Co, Re and Cr.
Metals 08 00706 g002
Figure 3. EBSD maps showing artefacts of clean-up procedure for correcting wrongly indexed phases: SE image of the selected area; measured EBSD map, Cleanup-1 procedure using Neighbour Phase Correlation plus Grain Dilation, Cleanup-2 procedure using Grain Dilation only.
Metals 08 00706 g003
Figure 4. Microstructure of the 18% Cr alloys with varying Ni content (8–25%) after heat treatments at different temperatures: (a) 8Ni-800 °C; (b) 15Ni-800 °C; (c) 25Ni-800 °C; (d) 8Ni-1050 °C; (e) 15Ni-1050 °C; (f) 25Ni-1050 °C; (g) 8Ni-1200 °C; (h) 15Ni-1200 °C; (i) 25Ni-1200 °C; (j) 8Ni-1350 °C; (k) 15Ni-1350 °C; (l) 25Ni-1350 °C. All heat treatments: duration 100 h.
Metals 08 00706 g004
Figure 5. Microstructure of the 23% Cr alloys with varying Ni content (8–25%) after heat treatments at different temperatures: (a) 8Ni-800 °C; (b) 15Ni-800 °C; (c) 25Ni-800 °C; (d) 8Ni-1050 °C; (e) 15Ni-1050 °C; (f) 25Ni-1050°C; (g) 8Ni-1200 °C; (h) 15Ni-1200 °C; (i) 25Ni-1200 °C; (j) 8Ni-1350 °C; (k) 15Ni-1350 °C; (l) 25Ni-1350 °C. All heat treatments: duration 100 h.
Metals 08 00706 g005
Figure 6. Combined EBSD + EDS measurement: (a) CoRe18-8 alloy after 1200 °C heat treatment; (b) CoRe-18-15 alloy after1050 °C heat treatment.
Metals 08 00706 g006
Figure 7. Combined EBSD + EDS measurement: CoRe23-25 alloy after 800 °C heat treatment.
Metals 08 00706 g007
Figure 8. Hardness of the Co-Re-Cr-Ni alloys after heat treatment at different temperatures: (a) 18% Cr alloy; (b) 23% Cr alloys.
Metals 08 00706 g008
Table 1. Nominal composition of alloys (in atomic %).
Alloy DesignationCoReCrNi
CoRe-18-8Rest17188
CoRe-18-15Rest171815
CoRe-18-25Rest171825
CoRe-23-8Rest17238
CoRe-23-15Rest172315
CoRe-23-25Rest172325
Table 2. Crystal structures of different phases present in Co-Re-Cr-Ni alloys and their lattice parameter values measured by neutron diffraction [7].
AlloyCoRe-23-15CoRe-23-25
Lattice parameter (nm)Measured by neutron diffraction
σ phase
Tetragonal: Pearson symbol tP30; [space group P42/mnm, sp.gp # 136]
a0.90100.9062
c0.46720.4691
ε phase
Hexagonal: Pearson symbol hP2; [space group P63/mmc, sp.gp # 194]
a0.25570.2559
c0.41450.41498
γ phase
Cubic: Pearson symbol cF4; [space group Fm-3m, sp.gp # 225]
a0.36050.36117
Table 3. Volume fraction of σ phase determined by digital image analysis.
Alloy Composition (atomic %)Volume Fraction of Phase (Primary + Secondary)
CrNiHeat Treatment Temperature
800 °C1050 °C1200 °C1350 °C
1880.4000
150.30 *00
2513.610.30 *0
2381.214.015.02.6
158.226.015.01.2
2535.227.314.91.2
* Amount of phase too low to be measured, but scattered particles exist.
Table 4. Constitution of phases in the Co matrix during and after the heat treatment: (a) at RT after cooling from heat treatment temperature; (b) at high temperature during heat treatment.
(a)
(a)
Heat Treatment TemperatureCoRe-18CoRe-23
8 Ni15 Ni25 Ni8 Ni15 Ni25 Ni
800 °Cεεγεεγ
1050 °Cε + γε + γ
1200 °Cε + γ
1350 °Cε + γ
(b)
(b)
Heat Treatment TemperatureCoRe-18CoRe-23
8 Ni15 Ni25 Ni8 Ni15 Ni25 Ni
800 °Cεε + γγεε + γγ
1050 °Cγ
1200 °Cε + γγ
1350 °Cγγ

