Article

Analyzing the Deformation and Fracture of Bioinert Titanium, Zirconium and Niobium Alloys in Different Structural States by the Use of Infrared Thermography

1
Institute of Strength Physics and Materials Science of the Siberian Branch of the Russian Academy of Sciences (ISPMS SB RAS), Tomsk 634055, Russia
2
National Research Tomsk Polytechnic University, Tomsk 634050, Russia
3
National Research Tomsk State University, Tomsk 634050, Russia
4
PJSC “ZVEZDA”, Saint-Petersburg 192012, Russia
*
Author to whom correspondence should be addressed.
Metals 2018, 8(9), 703; https://doi.org/10.3390/met8090703
Submission received: 8 August 2018 / Revised: 2 September 2018 / Accepted: 3 September 2018 / Published: 6 September 2018

Abstract

:
Bioinert metals are used for medical implants and in some industrial applications. This study was performed to detect and analyze peculiarities that appear in the temperature distributions during quasi-static tensile testing of bioinert alloys. These alloys include VT1-0 titanium, Zr-1%Nb and Ti-45%Nb in both coarse-grain (CG) and ultrafine-grain (UFG) states. The crystal structure, as well as the crystal domain and grain sizes of these alloys in the UFG state, may be different from the CG versions and identifying the thermal signatures that occur during their deformation and fracture is of interest, as it may lead to an understanding of physical processes that occur during loading. By comparing the surface temperature distributions of specimens undergoing deformation under tensile loading to the distributions at maximum temperatures it was found that the observed differences depend on the alloy type, the alloy structural state and the thermal properties of structural defects in the specimen. Macro-defects were found in some specimens of VT1-0 titanium, Zr-1Nb and Ti-45Nb alloys in both the CG and UFG states. The average tensile strength of specimens containing defects was lower than that of specimens with no defects. Infrared thermography documents change in the thermal patterns of specimens as they are deformed under tensile loading and when the load stops changing or the specimen breaks.

1. Introduction

In the last decade, the formation of ultrafine-grain (UFG) versions of alloys has been considered as a means to improve the mechanical properties of these materials. Developing UFG versions of bioinert alloys based on titanium, zirconium and niobium has of particular interest. These alloys are used in medical implants and in some industrial applications [1,2]. One means of producing the UFG state in metallic materials is to subject the material to severe plastic deformation (SPD), as this creates smaller crystalline domains [3]. Mechanical and physical properties of alloys in the UFG state may be predicted based on an understanding of the microcrystalline structure of the UFG state. Primarily, UFG alloys are body-centered cubic (BCC), face-centered cubic (FCC) or hexagonal close-packed (HCP) lattices [4].
The SPD treatment used to obtain UFG titanium and its alloys, as well as the microstructure and physical and mechanical properties of these materials have been thoroughly studied [3]; however, research continues [5]. The mechanisms of plastic deformation and the fracture of titanium alloys under various combinations and profiles of thermal and mechanical stresses are being studied [6,7,8].
Alloy systems of Zr-Nb and Ti-Nb, especially in the UFG state, are of a particular interest in medicine [9]. Some Ti-Nb alloys have a low elastic modulus comparable to that of dense cortical bone tissue [10]. Also, Ti-Nb and Zr-Nb alloys are bioinert and produce are not toxic to living tissues. There is a significant difference between the physical and mechanical properties of UFG materials and those of ordinary coarse-grained (CG) materials. This is due to the peculiarities of the CG structure, primarily their long grain boundaries and a high density of dislocations.
A lot of research is focused on the mechanisms of deformation and fracture of UFG metals and alloys using structure-sensitive methods [11,12,13]. Modern, high sensitivity infrared (IR) thermal imaging systems can provide non-contact, full-field temperature maps and measurements in studies of the formation of structural defects and these may be used to predict structural changes during both the deformation processes and early stages of fracture [11,14,15,16,17,18,19,20,21,22].
The goal of this work is to identify thermal signatures that predict the locations of deformation and fracture for individual bioinert materials in both the CG and UFG states. Also, we discuss the thermal effects and signatures that accompany the quasi-static stretching of specimens, especially those that deviate from “standard” specimens.

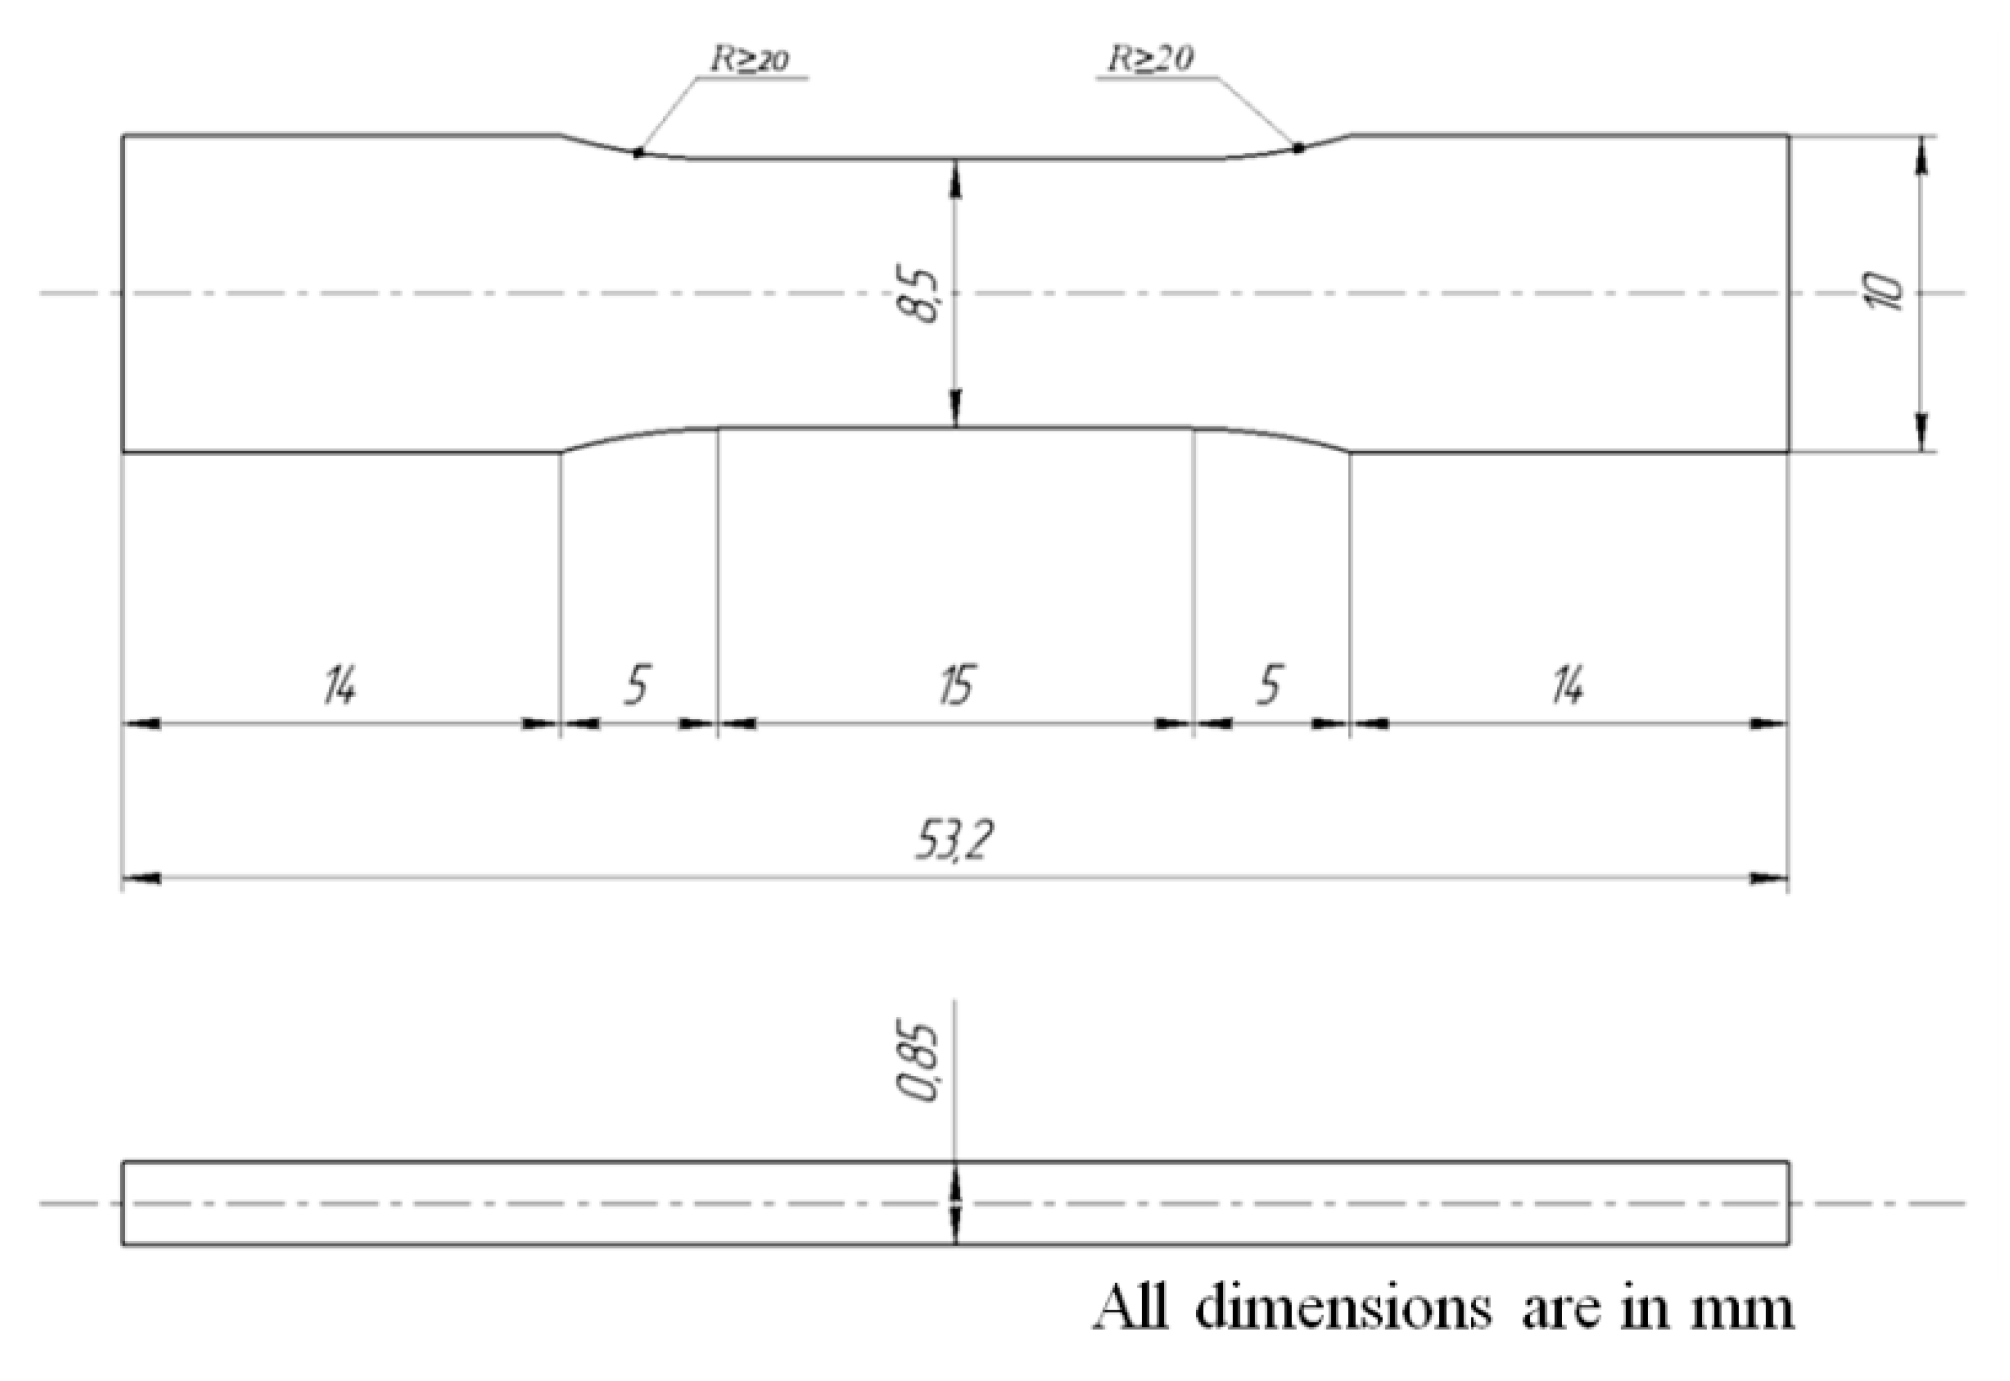
2. Specimens and Methods of Investigation

The alloys chosen in this study are those with different types of crystal lattice, namely, VT1-0 titanium (HCP-type: 99.58Ti, 0.12O, 0.18Fe, 0.07C, 0.04N, 0.01H wt. %), Zr-1%Nb (HCP-type) and Ti-45%Nb (BCC-type) alloys in both the CG and UFG states. In order to analyze the deformation behavior of alloys, we have used standard flat specimens manufactured in accordance with the Russian State Standard GOST 25.502, see Figure 1. The specimens were milled from 1.2 mm-thick strip-like blank parts of test alloys nanostructured by the SPD method [23] with the final sample thickness being 0.85 mm. For testing, we selected 17 specimens of titanium and Zr-1Nb alloy in the UFG state with the average size of structural elements (grains, sub-grains, fragments) of 0.2 μm and 21 specimens of Ti-45Nb alloy (average size of structural elements 0.3 μm). The specimens were also subjected to pre-crystallization annealing for 1 hour at the temperature of 300 °C in the atmosphere of argon. This process did not affect the structure of UFG alloys but enhanced their plasticity due to diminished internal stresses. Eight specimens made of VT1-0 titanium and Zr-1Nb alloys, as well as 11 specimens made of Ti-45Nb alloy, were transited into the CG state by recrystallization annealing [23].
Tensile tests of the specimens were carried out on an Instron VHS 40/50–20 servo-hydraulic high-rate test system (Instron European Headquarters, High Wycombe, UK) servo-hydraulic test bench at a given constant strain rate of 0.005 s−1. The Fast Track 800 Adaptive Loop Control was used in the deformation control modes to continuously update the control loop parameters. During the entire test period, correction of the control parameters was performed to compensate for changes in the stiffness of a specimen while it was passing the test. The force was recorded by means of a Dynacell load cell (2527–100 series) with measurement accuracy better than 0.2% of a reading. To ensure direct monitoring of the temperature, specimen elongation was evaluated not in the working area but by measuring the displacement of a movable clamp with a sensor which ensured the time resolution of 0.001 s and spatial resolution of 0.005 mm. Both clamp displacement and tensile forces were recorded simultaneously with IR thermographic acquisition of temperature distributions on specimen surface. The evolution of the temperature conditioned by dissipation of plastic deformation energy accompanying specimen tension was digitally recorded as sequences of IR thermograms by using a FLIR SC 7700M thermal imager (FLIR Systems, Nashua, NH, USA) (maximum acquisition rate 115 Hz, temperature sensitivity 20 mK and image format 640 × 512). The thermal imager was installed at the distance of 0.4 m from the specimens being tested. The IR system software allowing online recording of IR thermograms on a computer was synchronized with the test machine software. A specialized Altair program was used to analyze and process test results in the off-line mode by visualizing temperature distributions in the tabular and graphical forms. To improve the quality of IR imaging and diminishing noise caused by thermal reflections, the specimens were black-painted with a matte black acrylic dye (emissivity value 0.95) thus ensuring black body conditions.
The thermal imager allowed the detection of not only temperature distributions on the surface of the specimens but also a current configuration of the specimens undergoing deformation. The changes in the specimen cross-section and gauge length were determined by comparing the images of the specimens at the initial time and in the subsequent moments of testing. The obtained estimates were used to determine both true strains and true stresses of the specimens. It is important noting that direct measurement of specimen elongation by a contact strain extensometer was impossible because this made IR imaging of specimen working parts difficult. However, preliminary tests of similar specimens showed that the data obtained by using an extensometer (2630–105 series) practically coincided with the data obtained with a built-in displacement sensor in the servo hydraulic test bench Instron VHS 40/50-20. On the one hand, this was conditioned by using the Fast Track 800 control system (Version FastTrack 8800, Instron European Headquarters, High Wycombe, UK) and, on the other hand, by properly choosing geometric parameters of the specimens thus allowing plastic deformation to take place in their working parts. In fact, the tests were conducted by simultaneously recording forces, displacements and temperature in the specimens under tension.
For determining true stresses, 30 frames were chosen from the whole sequences of IR thermograms recorded during specimen deformation with the first image corresponding to the beginning of the process at the time τ0. This image served as a source of calibration when evaluating the specimen width at subsequent instants of time.
Several physico-mechanical properties were evaluated as a result of the experiments. The engineering stress σeng was determined by the following equation:
σ eng = F 0 S 0 ,
where F0 is the force applied to the specimen and S0 is the area of the gauge cross section of the specimen. Here
S 0 = a 0 × b 0 ,
where a0 and b0 are the cross-section width and thickness respectively.
The engineering strain εeng was determined by the equation:
ε eng = Δ l l 0 ,
where l0 and Δl are the initial length and elongation of the working part of the specimen. Respectively, the true stress σtrue was calculated as:
σ true = F ( 1 + ε eng ) S 0 ,
while the true stress in the “neck” region was calculated as:
σ true = F S i ,
where Si = ai × bi is the cross-sectional area in the “neck” of the specimen, ai and bi are the specimen width and thickness in the “neck” region (bi = b0·ai/a0). Note that Si, ai and bi values were evaluated by the i-th thermogram. Equation (4) has been used to determine true stresses during tensile testing of metal specimens according to recommendations from [24].
The true strain εtrue was determined as:
ε true = ln ( 1 + ε eng ) .
The specific work of strain under tensile loading was calculated by using the true strain curves:
A = 0 ε eng σ true d ε true .
The tests were performed at the room temperature T0 = 23 ± 3 °C. The surface morphology of fractured specimens was analyzed by applying the scanning electron microscopy (SEM) technique, EVO 50 microscope from Carl Zeiss AG (Jena, Germany) [25].

3. Results and Discussion

Figure 2 exhibits the engineering strain curves for titanium (a), Zr-1Nb (b) and Ti-45Nb (c) alloys in the CG (curves 1, 2) and UFG (curves 3, 4) states with high (curves 1, 3) and low (curves 2, 4) mechanical properties. The curves with the maximum (curves 1, 3) and minimum (curves 2, 4) values of the flow stress were selected in each group of materials. The “engineering stress-engineering strain” diagrams have a standard appearance. The flow curves have the rising parabolic section which transits into a decaying section characterized by a negative coefficient of strain hardening [26]. The following parameters were determined according to the “engineering stress-engineering strain” diagrams: the offset yield strength σ02, the ultimate tensile strength σuts and the maximum plastic deformation before fracture εp. Table 1 contains the maximum, minimum and mean values of these parameters obtained for the tested alloys in the CG and UFG states.
The obtained results indicate that, in the process of SPD, the grain refining leads to a significant improvement in mechanical properties of the alloys and affects the deformation behavior under quasi-static tension (see also [27]). The maximum increase of 100% in the ultimate tensile strength is observed for titanium when it transits into the UFG state. For Zr-1Nb alloy, this increase is 76%, while for Ti-45Nb alloy is 63%. In the UFG state, the value of the maximum plastic deformation before fracture is lower than that for the materials in the CG state by 2–3 times for titanium and Ti-45Nb alloys and 1.8 times for Zr-1Nb alloy.
Figure 3 shows the “true stress-true strain” diagrams calculated by taking into account the formation of a “neck” in the specimens under tensile loading. In the area of active “neck” formation, there is a significant increase of the true flow stress with a high coefficient of strain hardening. This is most evident for Zr-1Nb alloy, in both the CG and UFG states. The specific work of strain for specimens under quasi-static tension was determined by integrating the area under the indicated curves in the “true stress-true strain” diagrams (see data in Table 2). It is seen that the transition of the materials into the UFG state leads to a decrease in the specific work of strain in the tensile loading of titanium and Ti-45Nb alloys by 1.2 and 2 times respectively. On the contrary, in the case of the Zr-1Nb specimens, the specific work of strain under tension seems to be independent of the alloy structural state. Note that the observed decrease in true stresses (Figure 3a,c) is supposed to be related to dynamic recrystallization of the Ti and Ti-45Nb specimens occurring during their deformation in the UFG state.
Deformation-induced temperature patterns depend on a type of alloys, their structural state and mechanical properties [28]. Figure 4, Figure 5, Figure 6, Figure 7, Figure 8 and Figure 9 show IR thermograms recorded during specimen tensile loading. Note that the IR thermographic scales in Figure 4, Figure 5, Figure 6, Figure 7, Figure 8 and Figure 9 are given in excess temperatures, that is, above ambient. Thermographic temperature indications may slightly differ from true specimen temperatures because of some uncertainty in the accepted dye emissivity value (0.95 in all cases) and thermal reflections. In more details, this issue was considered in Reference [29].
When alloys pass into the UFG state, the deformation processes develop much faster due to the highly-stressed state of such materials [3]. The propagation of localized plastic deformation eventually results in fracture. In the UFG state, the formation of a “neck” is not so evident, and, unlike the CG state, the fracture occurs predominantly in a plane located at about 45° (Figure 5, Figure 7 and Figure 9).
When testing titanium and Zr-1Nb alloy in the CG state, plastic deformation (shear) bands start to appear in the plastic deformation zone as the sources of heat generation at the strain of 11.2% for the titanium VT1-0 specimens and 10.8% for the Zr-1Nb alloy [30]. These strains significantly exceed elastic strains for the investigated alloys. The directions of such shear bands correspond to the largest shear stresses (Figure 4 and Figure 6). Localization of shear bands and their development determine location of defects. These shear bands divide the specimens for blocks and their inclination angle in respect to the direction of the tensile force is close to 45°. In strain bands, the alloy is in a plasticity-activated state while in other areas the alloys work in the zone of elastic deformation. With growing flow stress, the width of shear bands increases being accompanied by a slow temperature rise and formation of strain centers. At the stage of plastic flow, the strain centers increase in size, unite and develops across the specimen in a form of a mainband. A discernible decrease of the specimen cross-section, that is the “neck” formation, occurs in the weakest point of the specimen under a maximum force. Further deformation and the highest temperature take place in this area, wherein the fracture of the material appears mainly in a horizontal plane.
The temperature changes associated with plastic deformation develop more slowly in Zr-1Nb alloy (in the CG state) than in titanium. The rate of change may be unique for each material. The deformation behavior of Ti-45Nb alloy is similar to that described above but strain bands are absent. In this case, the temperature distribution looks “spotty” because of a faster deformation process (Figure 8).
It is worth mentioning that, in all tested alloys characterized by low mechanical properties, shear bands develop in a 45° plane, where future material fracture will take place.
Figure 10 shows experimental IR thermographic data on the change in the maximum surface temperature (ΔT) during tension for specimens of titanium (a), Zr-1Nb (b) and Ti-45Nb (c) alloys in the CG (curves 1, 2) and UFG states (curves 3, 4) with high (curves 1, 3) and low (curves 2, 4) mechanical properties.
For all the investigated alloys, it is possible to distinguish three stages of deformation with the following features: the first stage reflects the state of elastic strains where small temperature changes occur; the second stage is the plastic deformation where the temperature increases throughout the specimen; the third stage is the fracture of a specimen accompanied by a sharp temperature jump in the vicinity of the fractured zone [17,31,32,33,34]. In the titanium specimens (CG state), the maximum temperature on the surface of a deformed specimen increases linearly before “neck” formation starts and then occurs a temperature jump (ΔT) by 5–10 °C (Figure 10a, curves 1, 2). When testing titanium specimens in the UFG state, a slight temperature drop has been observed in the elastic regime due to the well-known thermoelastic effect [35]. Thereafter, the temperature linearly grows up by 50–55 °C and this is the maximum surface temperature which remains constant for a certain period of time (Figure 10a, curve 3) and finally starts to decrease before fracture. This proves that titanium in the UFG state can effectively use structural channels of energy absorption appearing when the specimen is being deformed. However, the behavior of the titanium UFG specimens that contain structural defects differed from the behavior of specimens with no defects. In the defective specimens, there was a small drop in temperature at the end of the first stage of deformation, which was the plastic deformation. Next there was a jump in temperature followed by the appearance of a short temperature “plateau.” Finally, there was a drop in temperature just before fracture (see the difference between specimens with minimal (2, 4) and maximal (1, 3) characteristics in Figure 10a).
Structural defects in the working part of the specimens contributed to the formation of a localized shear band, followed by the formation of a crack at a certain angle to the direction of extension. This effect has been also observed in the notched specimens under tension. The phenomenon above was confirmed by means of fractography (a similar approach was described in [36]).
Almost a linear growth of the temperature of the Zr-1Nb alloy in the CG state is followed by a sharp temperature increase indicating the start of “neck” formation. The corresponding temperature signal ΔT in Zr–1Nb alloy reaches 15–20 °C (Figure 10b, curves 1, 2). It is worth mentioning that the maximal temperature signals which appear on the surface of the zirconium and titanium specimens under a stable localization of deformation are comparable and reach 45–50 °C.
IR thermograms of the Zr-1Nb specimens in the UFG and CG states are similar. However, in the CG specimens containing no structural defects, the 5–10 °C temperature jump starts at the level of the specimen excess temperature ΔT ~ 35 °C (Figure 10b, curve 3). This is explained by the fact that the maximum strain of the Zr-1Nb specimens in the UFG state before fracture is twice smaller compared to the CG state. Hence, the processes of deformation and fracture, as well as accompanying temperature phenomena, develop faster in these specimens.
As for the Ti-45Nb specimens in the CG and UFG states, the features of their deformation behavior are in many respects similar to those considered above. However, the temperature increase in the Ti-45Nb specimens (CG state), which occurs after the stage with a constant temperature characterizing the state of elastic strain, is smoother and the temperature jump specifying “neck” formation is not so sharp as observed in the Zr-1Nb alloy; in this case, the maximum specimen temperature rise (ΔT ~ 45 °C) is lower.
When testing the Ti-45Nb specimens in the UFG state, a practically linear increase of the maximum temperature was also observed after the stage with a constant temperature; then, a sharp jump ΔT ~ 40–45 °C occurred and followed by a slow temperature drop.
It should also be noted that for all the investigated alloys in both CG and UFG states, a faster fracture was observed for the specimens characterized by minimal values of the ultimate tensile strength. This can be explained by the presence of macro-defects to compare to “standard” specimens with maximal values of the ultimate tensile strength.
Figure 11 shows SEM images of fractured titanium (a,b,g), Zr-1Nb (c,d) and Ti-45Nb (d,e,h) alloys in the CG and UFG states after tensile loading. It is seen that the fracture of all the investigated alloys occurred along the grain boundaries. When testing alloys with minimal strength parameters, plentiful defects in their macro-structure were detected as chains of pores or individual pores (Figure 11f,h).
The evolution of temperature distributions on the surface of specimens under mechanical loading depends on thermal properties of alloys, such as thermal diffusivity and thermal conductivity. Thermal diffusivity a is an important parameter of dynamic thermal processes. The a values of titanium and its alloys are significantly lower than those of other alloys (aluminum and steel alloys, etc.) [37,38]. Table 3 shows thermal properties of Ti, Zr, Nb and the corresponding alloys: titanium, Zr-1Nb and Ti-45Nb. Thermal diffusivities were calculated by a = λ C p ρ , where λ is the thermal conductivity, ρ is the density, Cp is the heat capacity. Note that thermal properties of Ti-45Nb alloy were determined by using a weighting-based method applied to the particular ratio of Ti and Nb components in the metallic composition. It is worth indicating that the thermal properties of Ti-50Nb alloy reported in [39] are close to those presented in Table 3 for Ti-45Nb alloy.
Different values of diffusivities of the investigated alloys in the CG state mean that the rate of volumic heat diffusion is minimal in titanium and maximal in Ti-45Nb alloy.
It can be assumed that the presence of structural (pore-like) defects in the investigated alloys leads to decrease in their thermal diffusivity and deformation until fracture. This statement is supported by the fact known in literature that both thermal conductivity and thermal diffusivity decrease when materials pass into the UFG state [3]. In [40], the influence of the UFG structure on thermal diffusivity of Ti, Nb and Zr at high temperatures was investigated to prove that the formation of the UFG state in these materials diminishes their thermal conductivity and thermal diffusivity. In fact, it has been demonstrated that a UFG structure created in materials under study essentially influences on high-temperature thermal properties of these metals. This appears to be a consequence of the fact that the concentration of the boundaries between micro- and nanocrystallites in specimens with a deformation structure considerably exceeds such concentration in specimens with an ordinary microstructure. Therefore, in specimens with a UFG structure, the effect of the scattering of conduction electrons at the intercrystalline boundaries significantly increases.
Meanwhile, the use of different SPD deformation regimes determines structural properties of alloys thus changing their thermal properties. Therefore, one needs to carefully choose SPD schemes and modes of deformation of metals and alloys with low thermal diffusivity, such as titanium and its alloys.
Until now, in the literature, there is no data on thermal diffusivity of the investigated alloys in the UFG state. This is the subject for further experimental investigation.
To summarize, the development of plastic deformation in alloys, as well as the patterns of the corresponding temperature distributions in materials under mechanical loading and maximum temperatures on specimen surface depend on a type of alloys, alloy structural state and thermal properties and presence of structural defects in a primary material. Further research on the analysis of thermal indications that precede deformation and fracture in bioinert alloys is related to a deeper studying of formation of dissipative structures. This leads to a conclusion that changes in the temperature distributions are caused by structural features of alloys in different states.

4. Conclusions

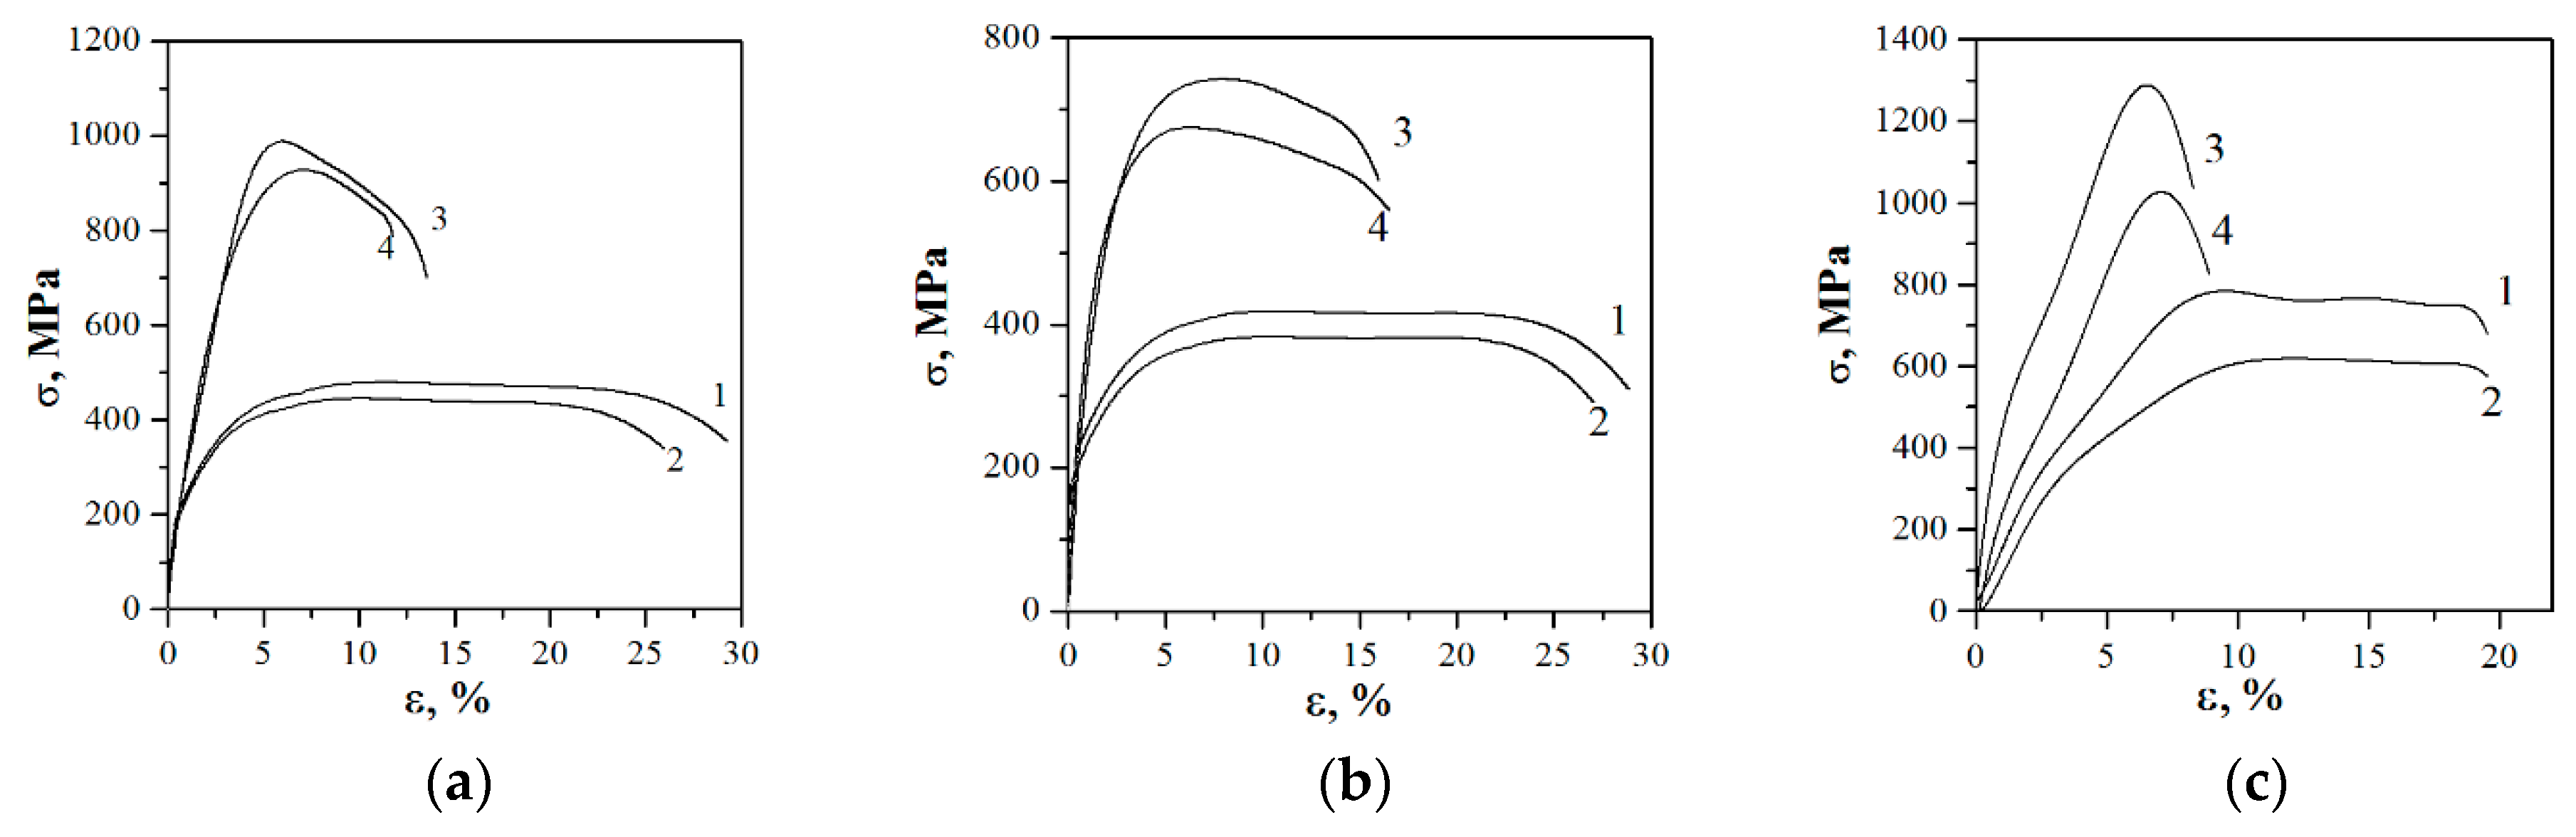
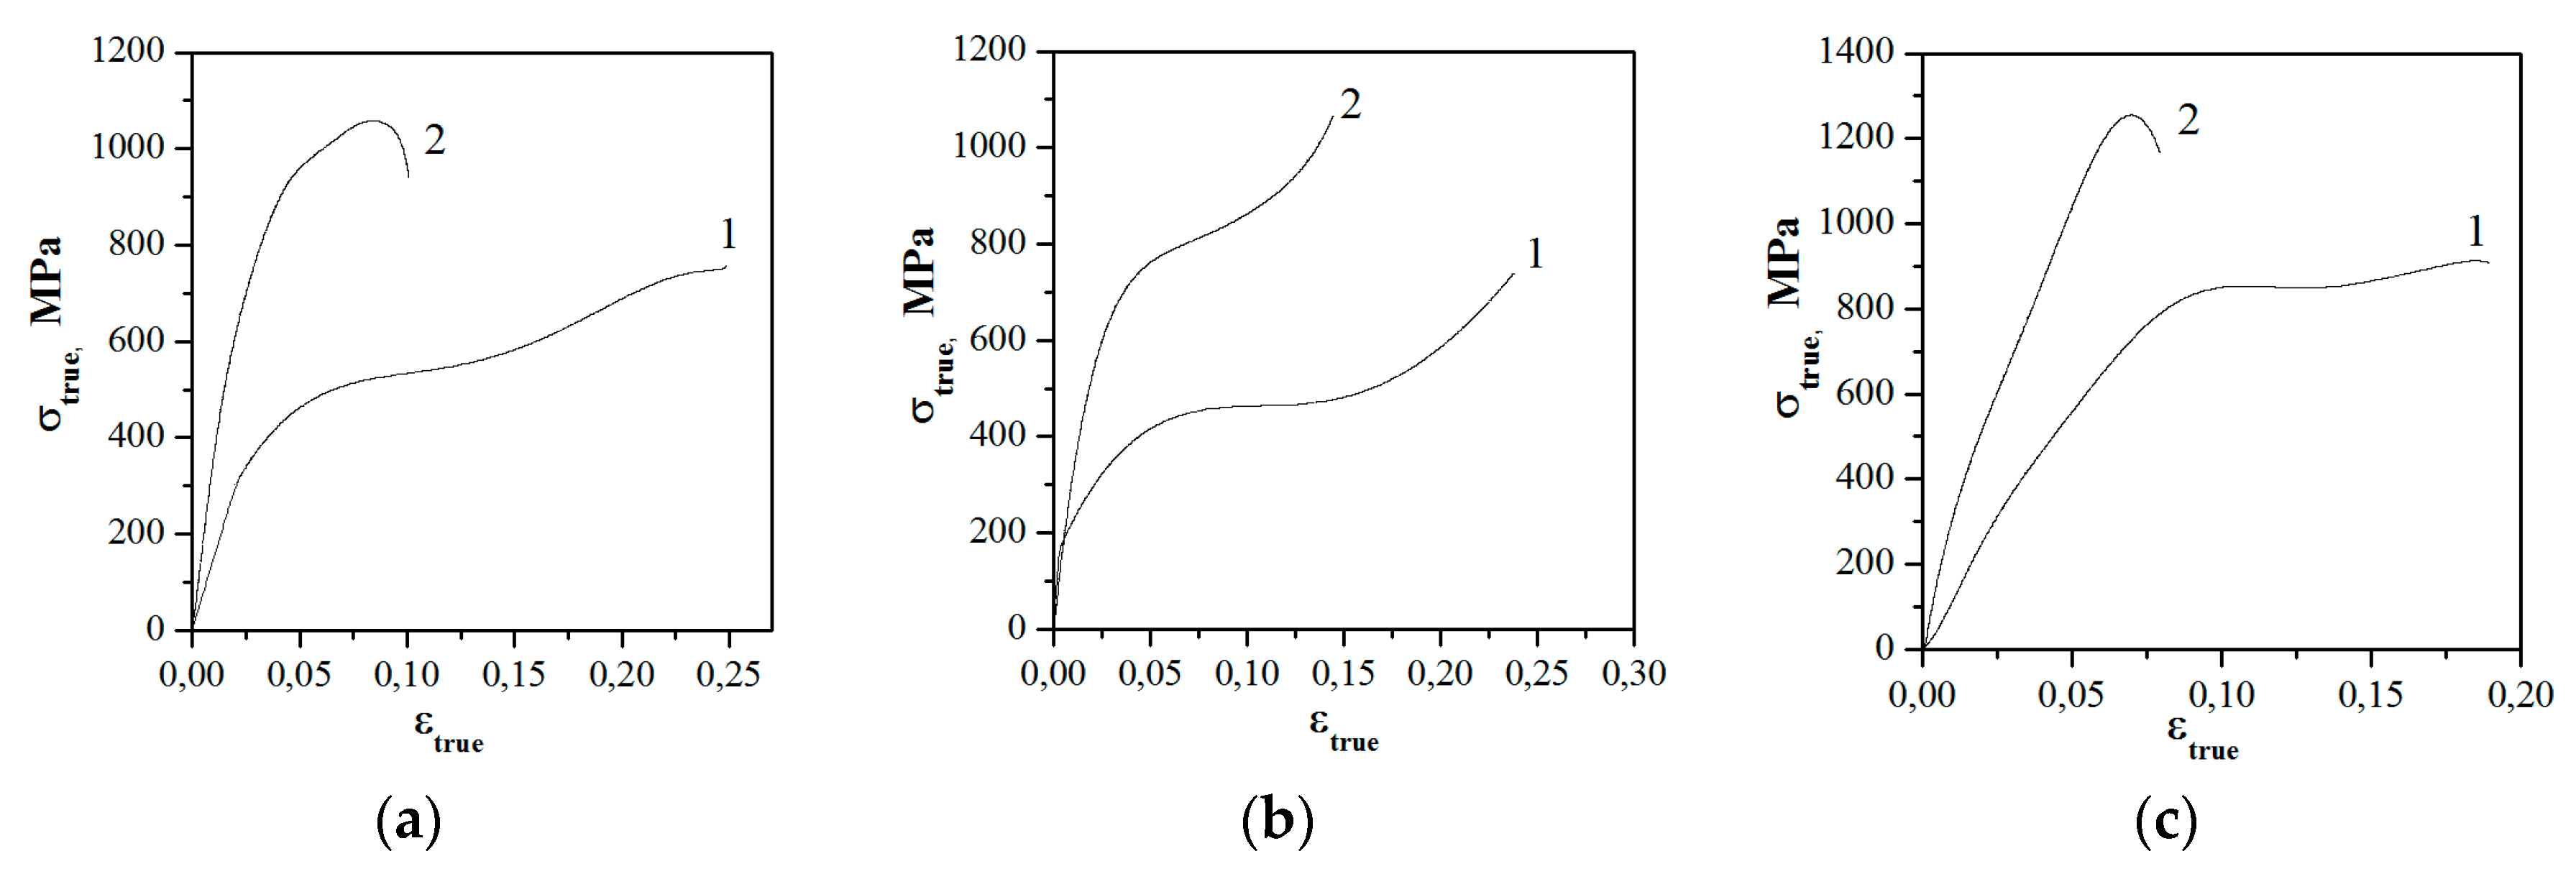
  • A UFG state was created by the severe plastic deformation of the investigated alloys and this has improved their mechanical properties. The ultimate tensile strength of the VT1-0 titanium, Zr-1Nb and Ti-45Nb alloys in the UFG state is 200%, 176% and 163%, of those in the CG state respectively. The ultimate strain before fracture of alloys in the UFG state is lower than in the CG state. For titanium and Ti-45Nb alloys, the ultimate strain before fracture is 43% of CG and for Zr-1Nb alloy the strain is 55.5% of CG. The transition of alloys into the UFG state leads to a decrease in the strain energy during deformation. For titanium and Ti-45Nb alloys, the strain energy decreases to 80% and 50% of CG respectively, while for the Zr-1Nb alloy it remains practically unchanged.
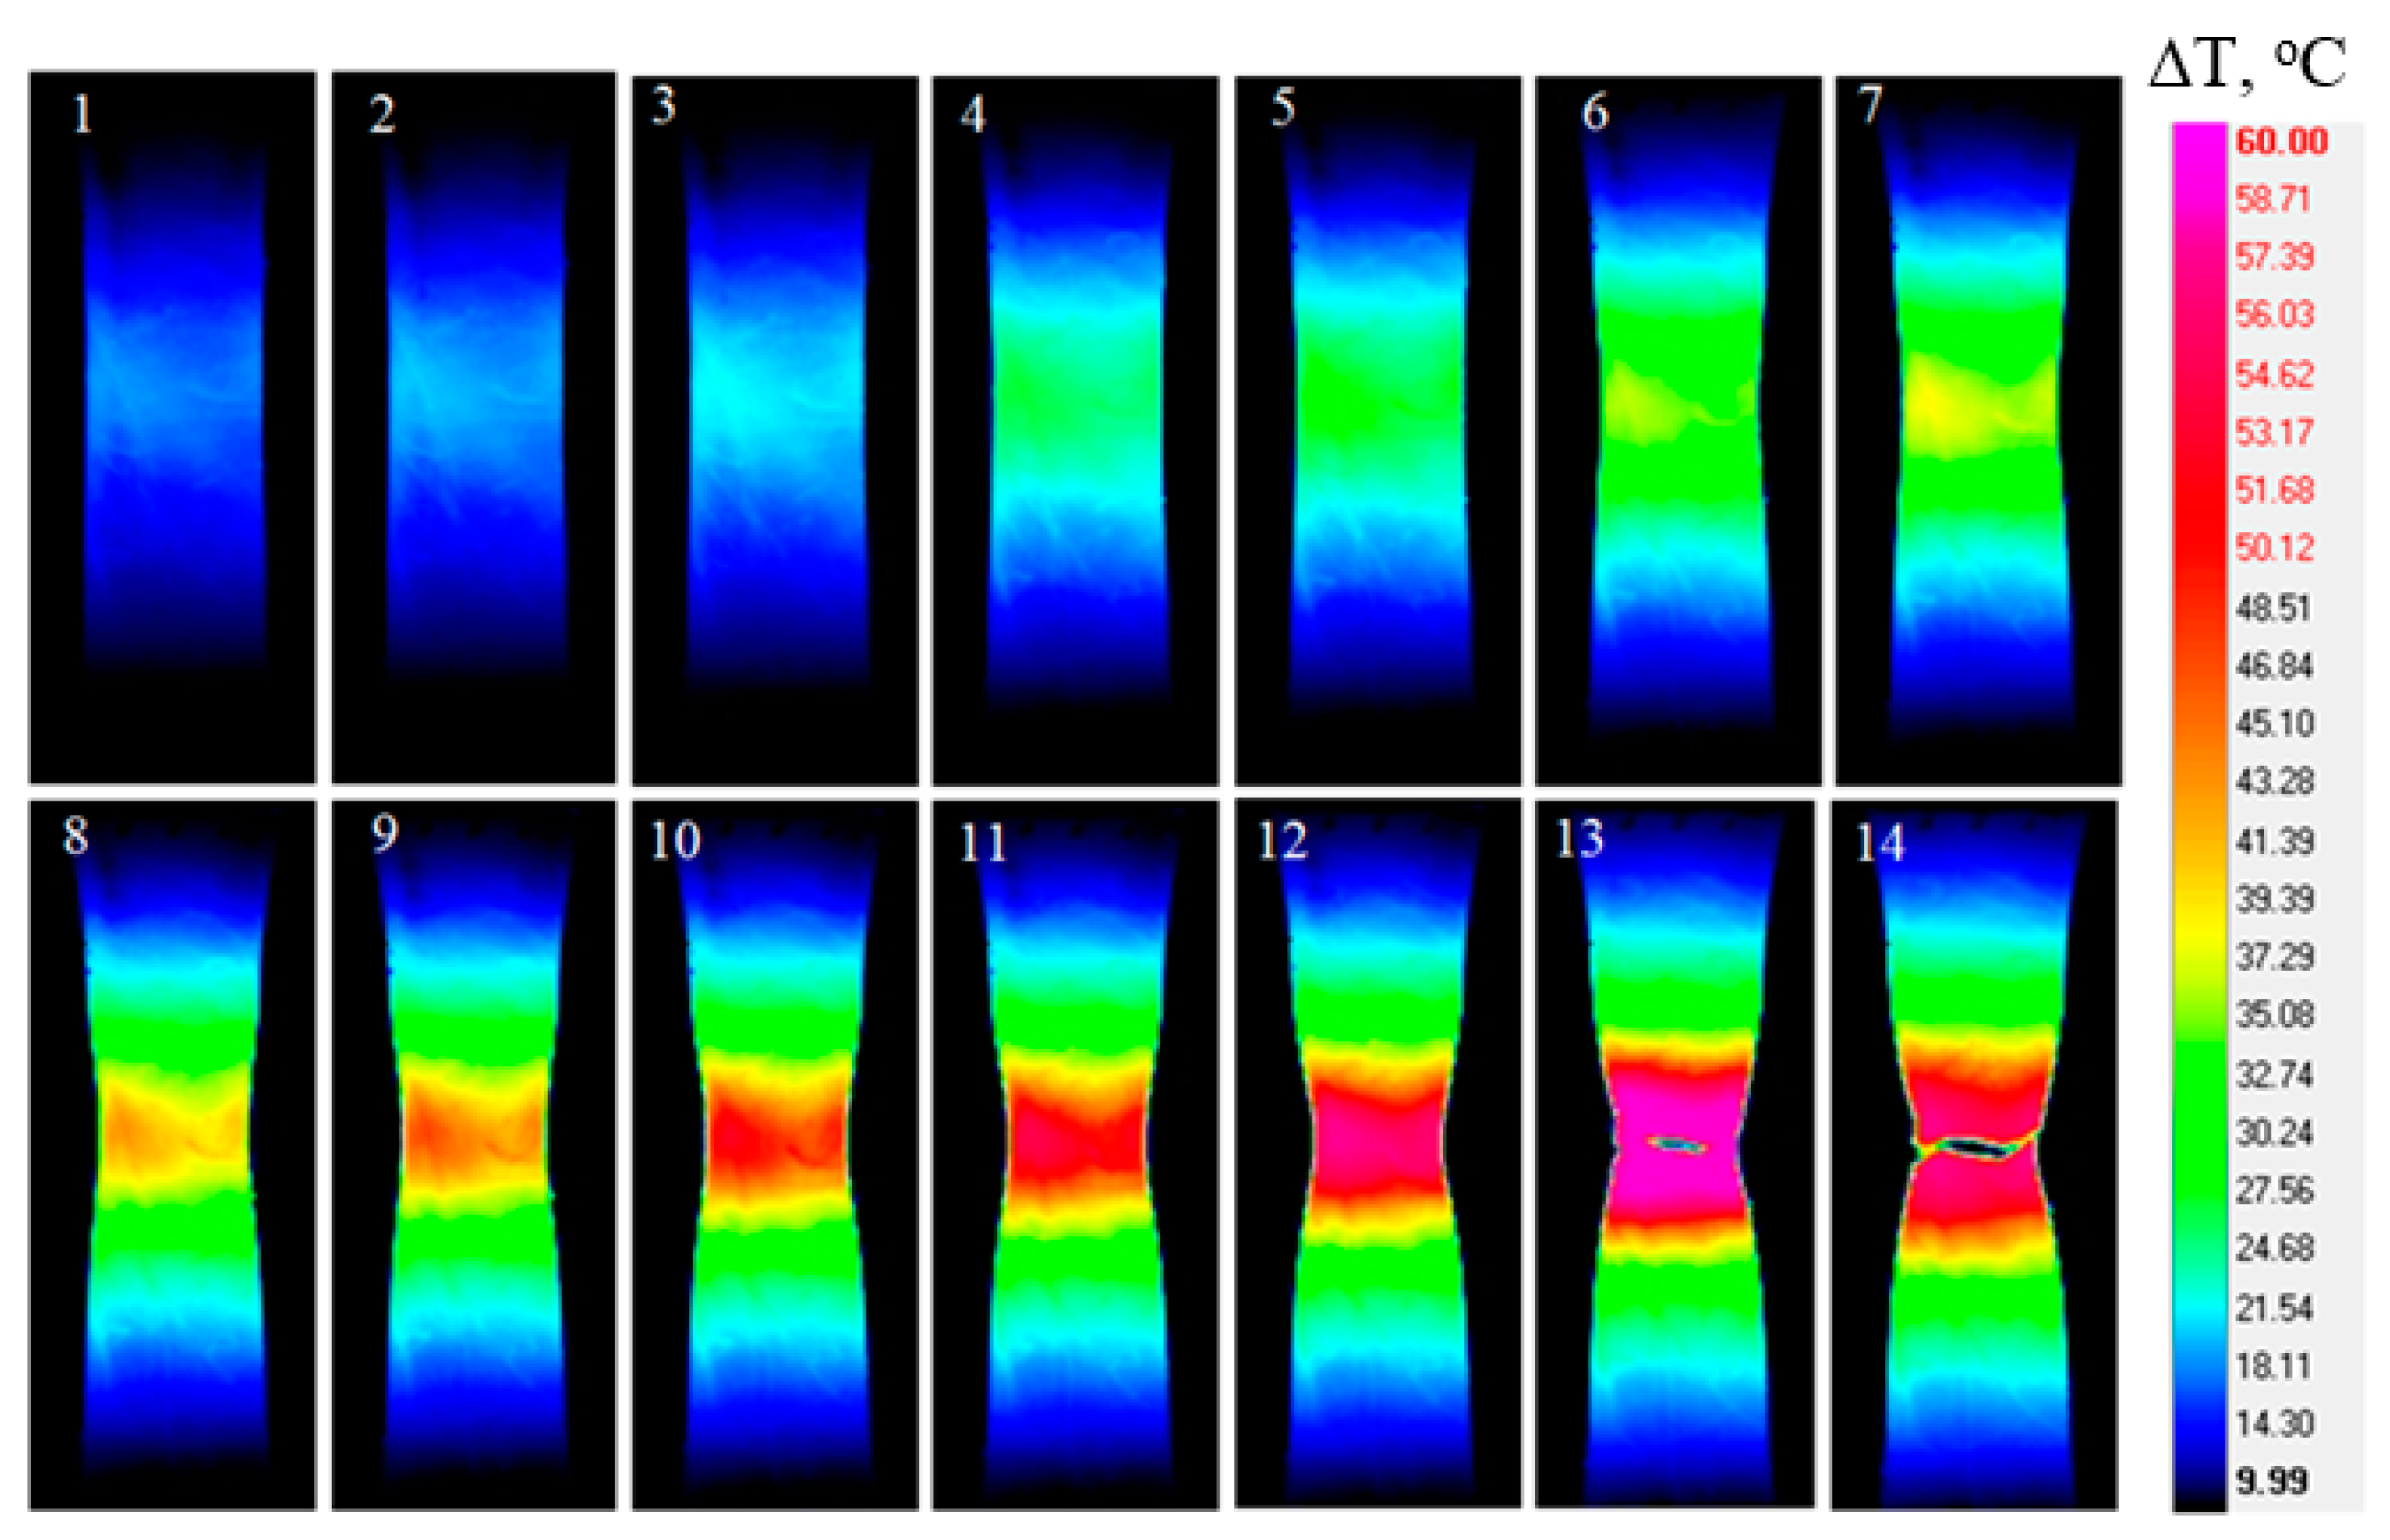
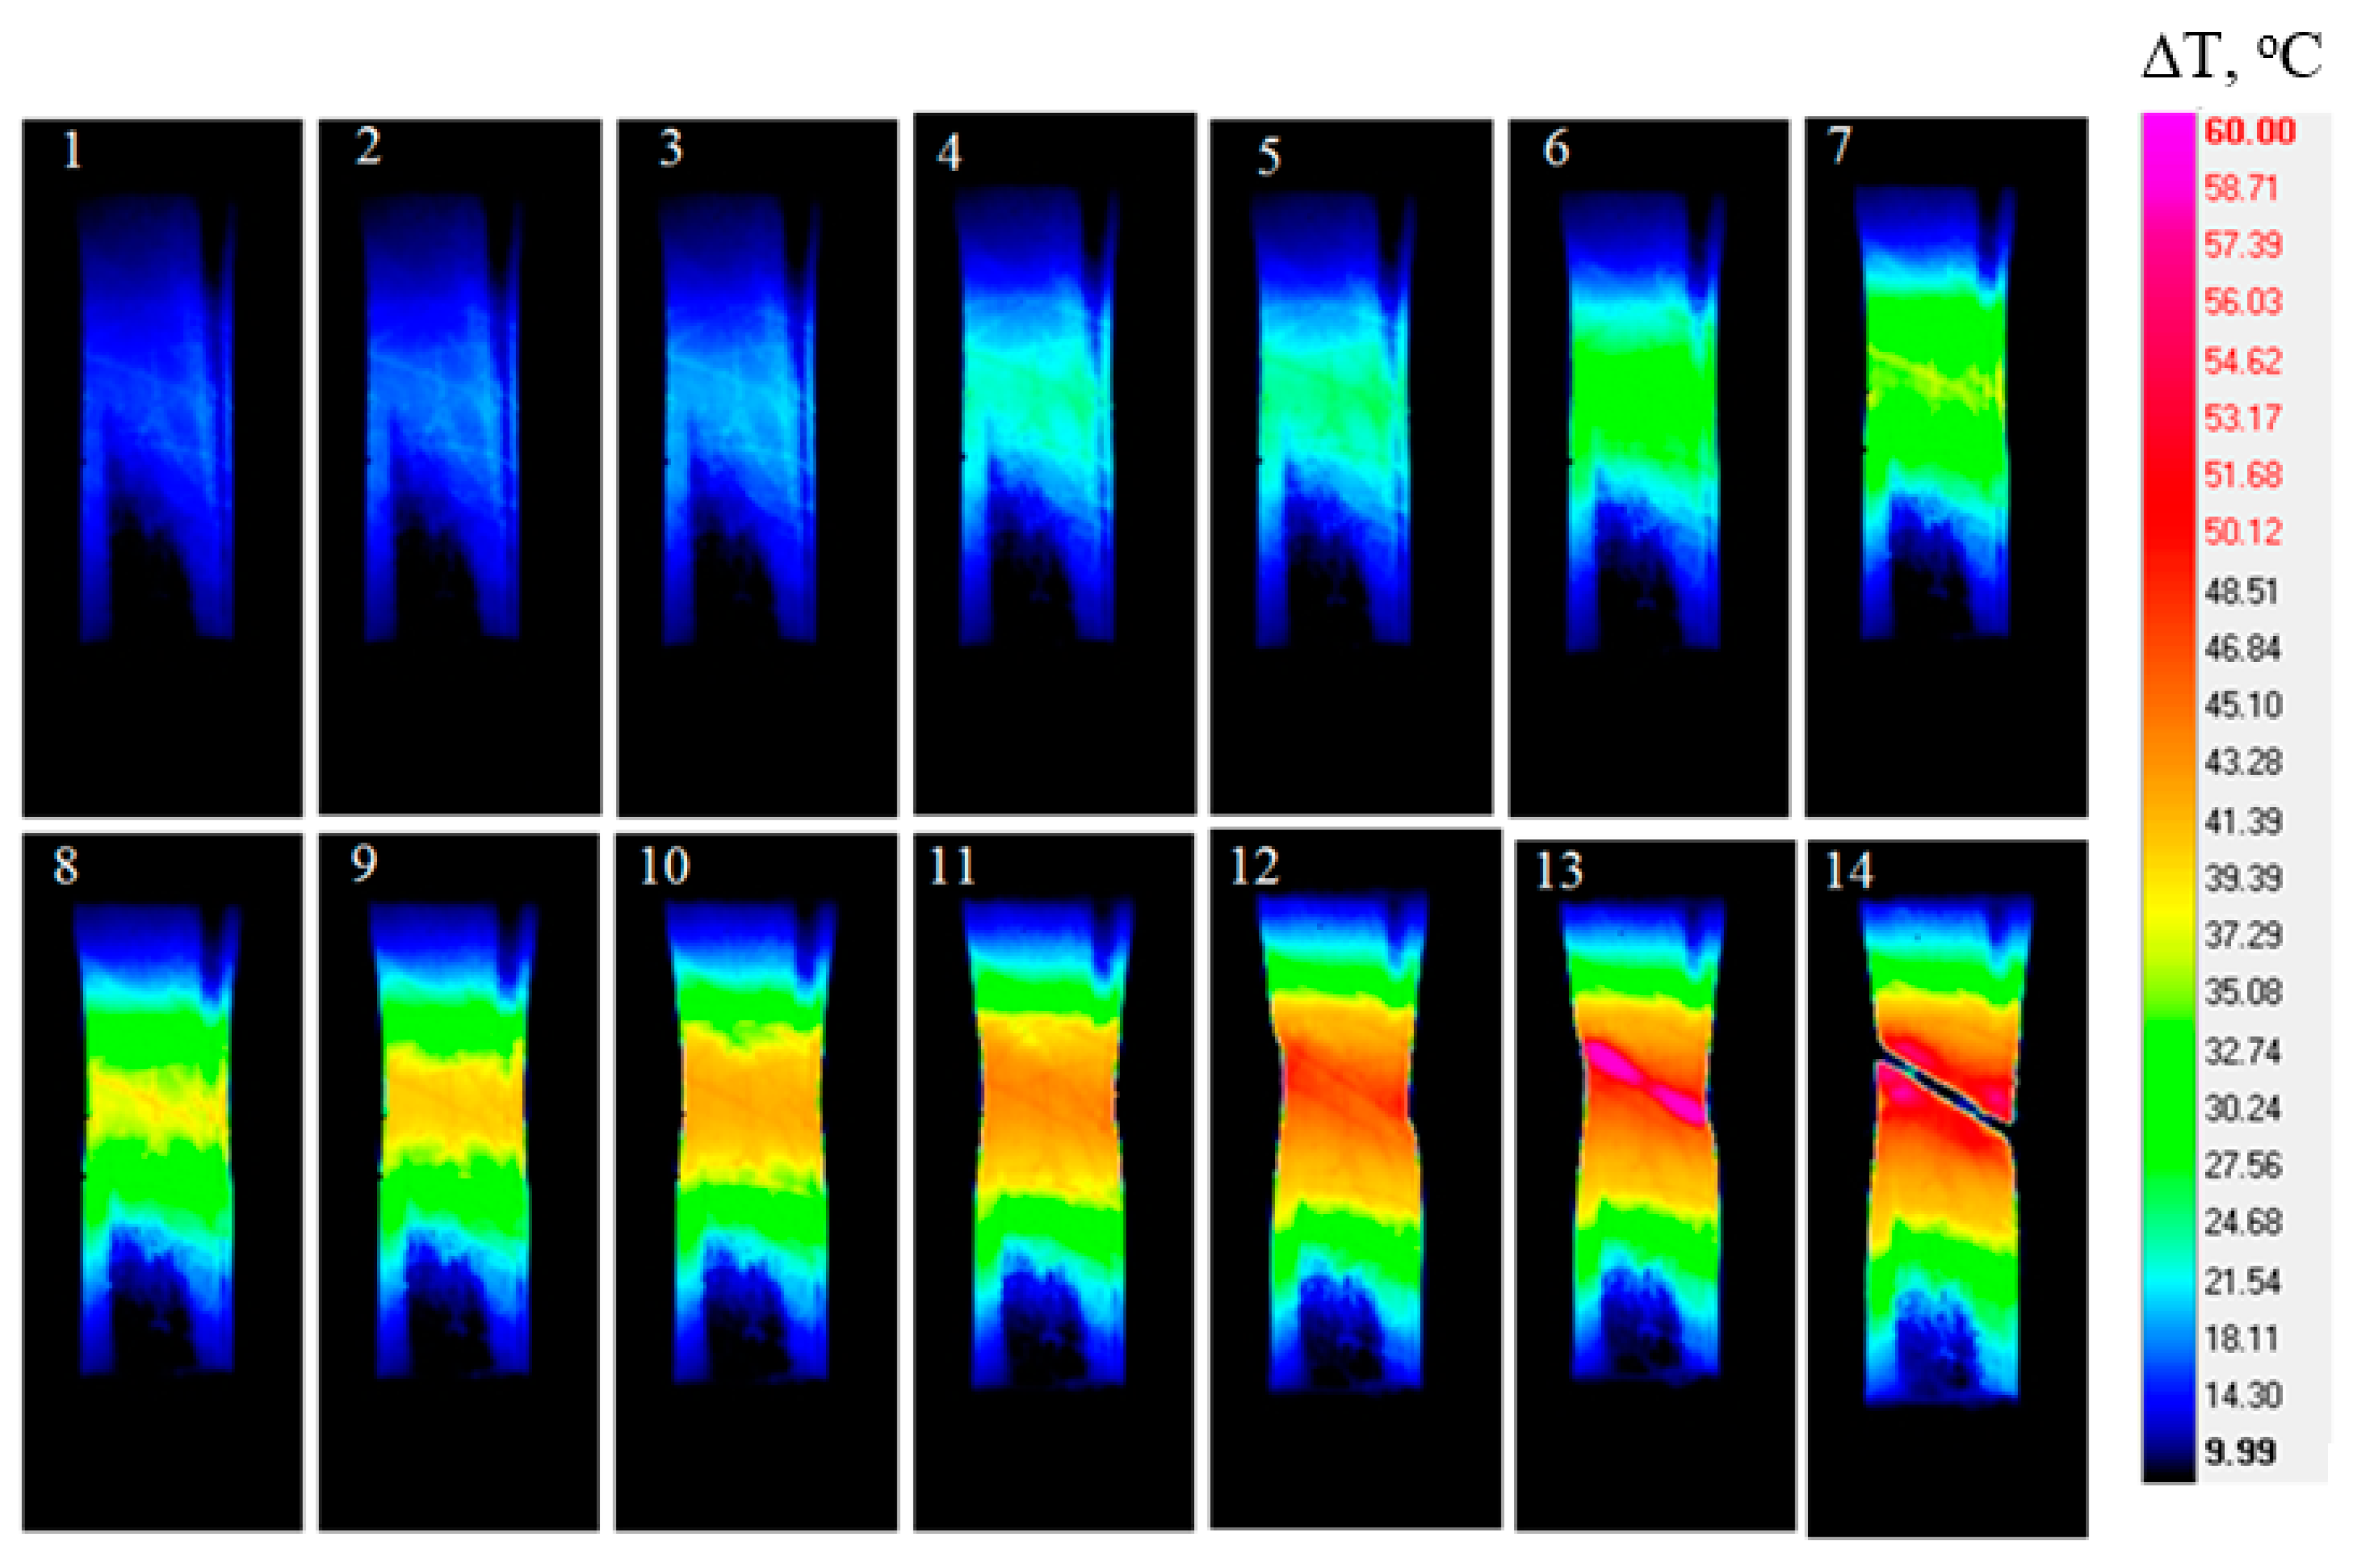
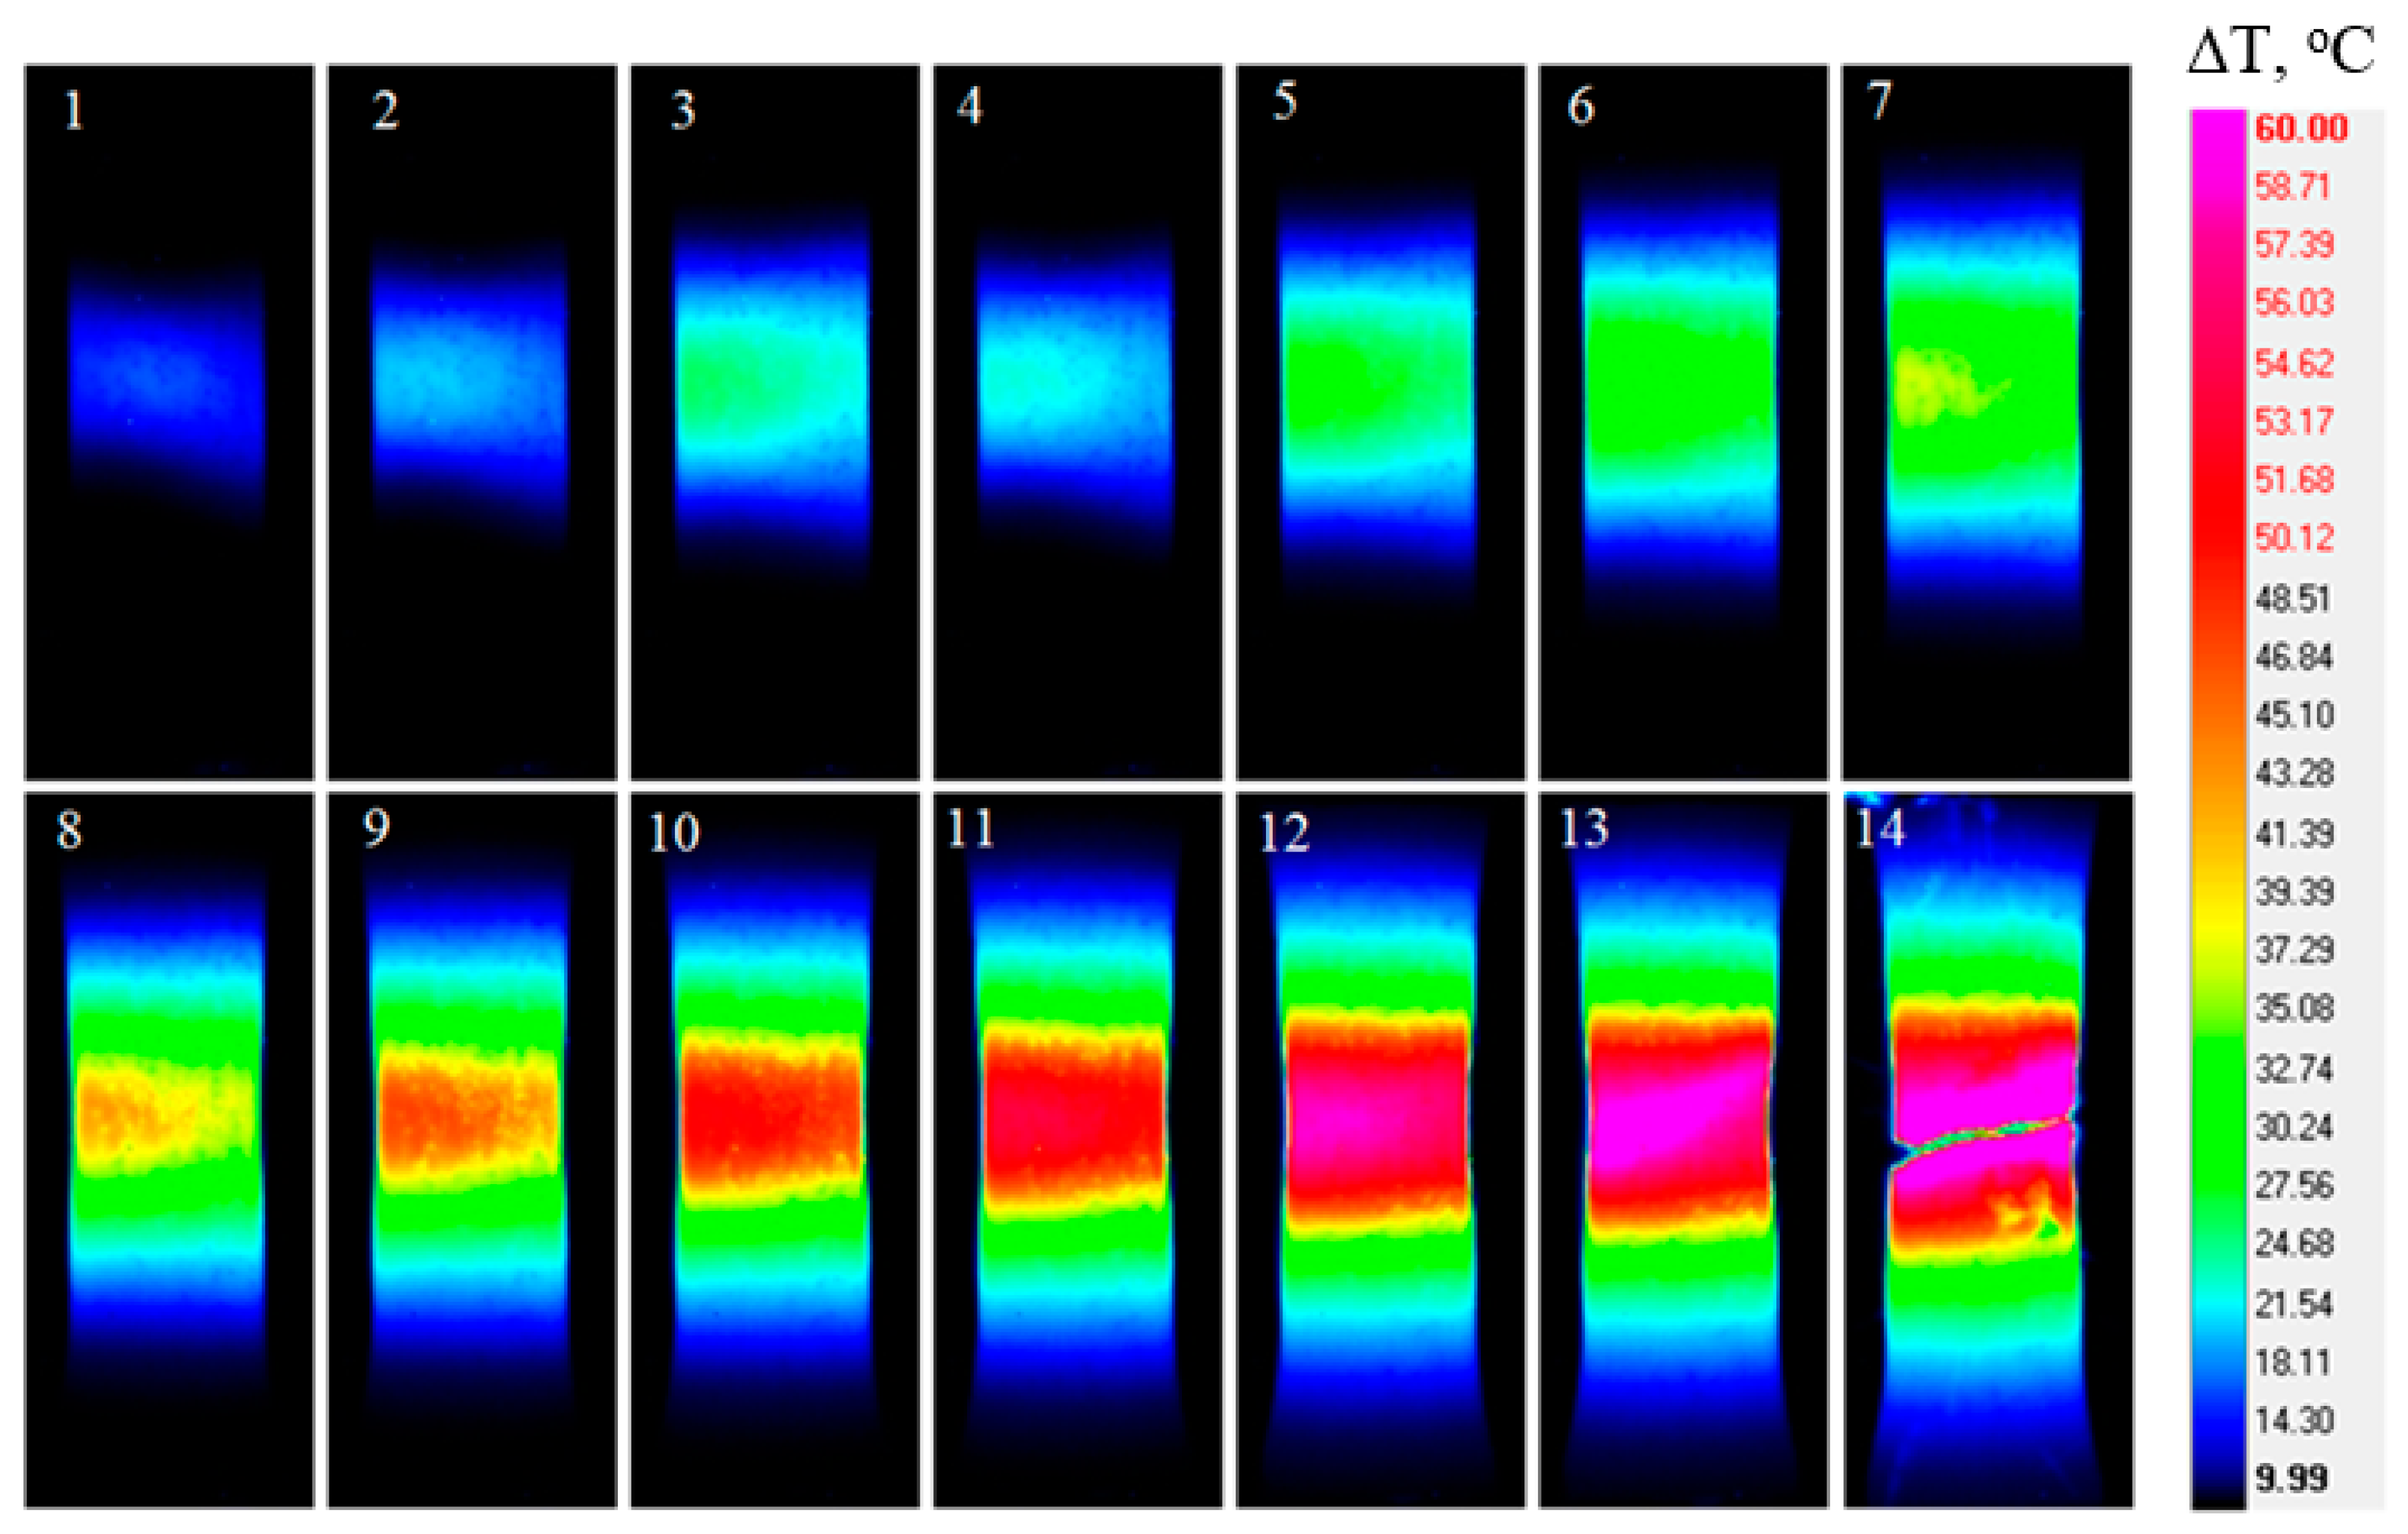
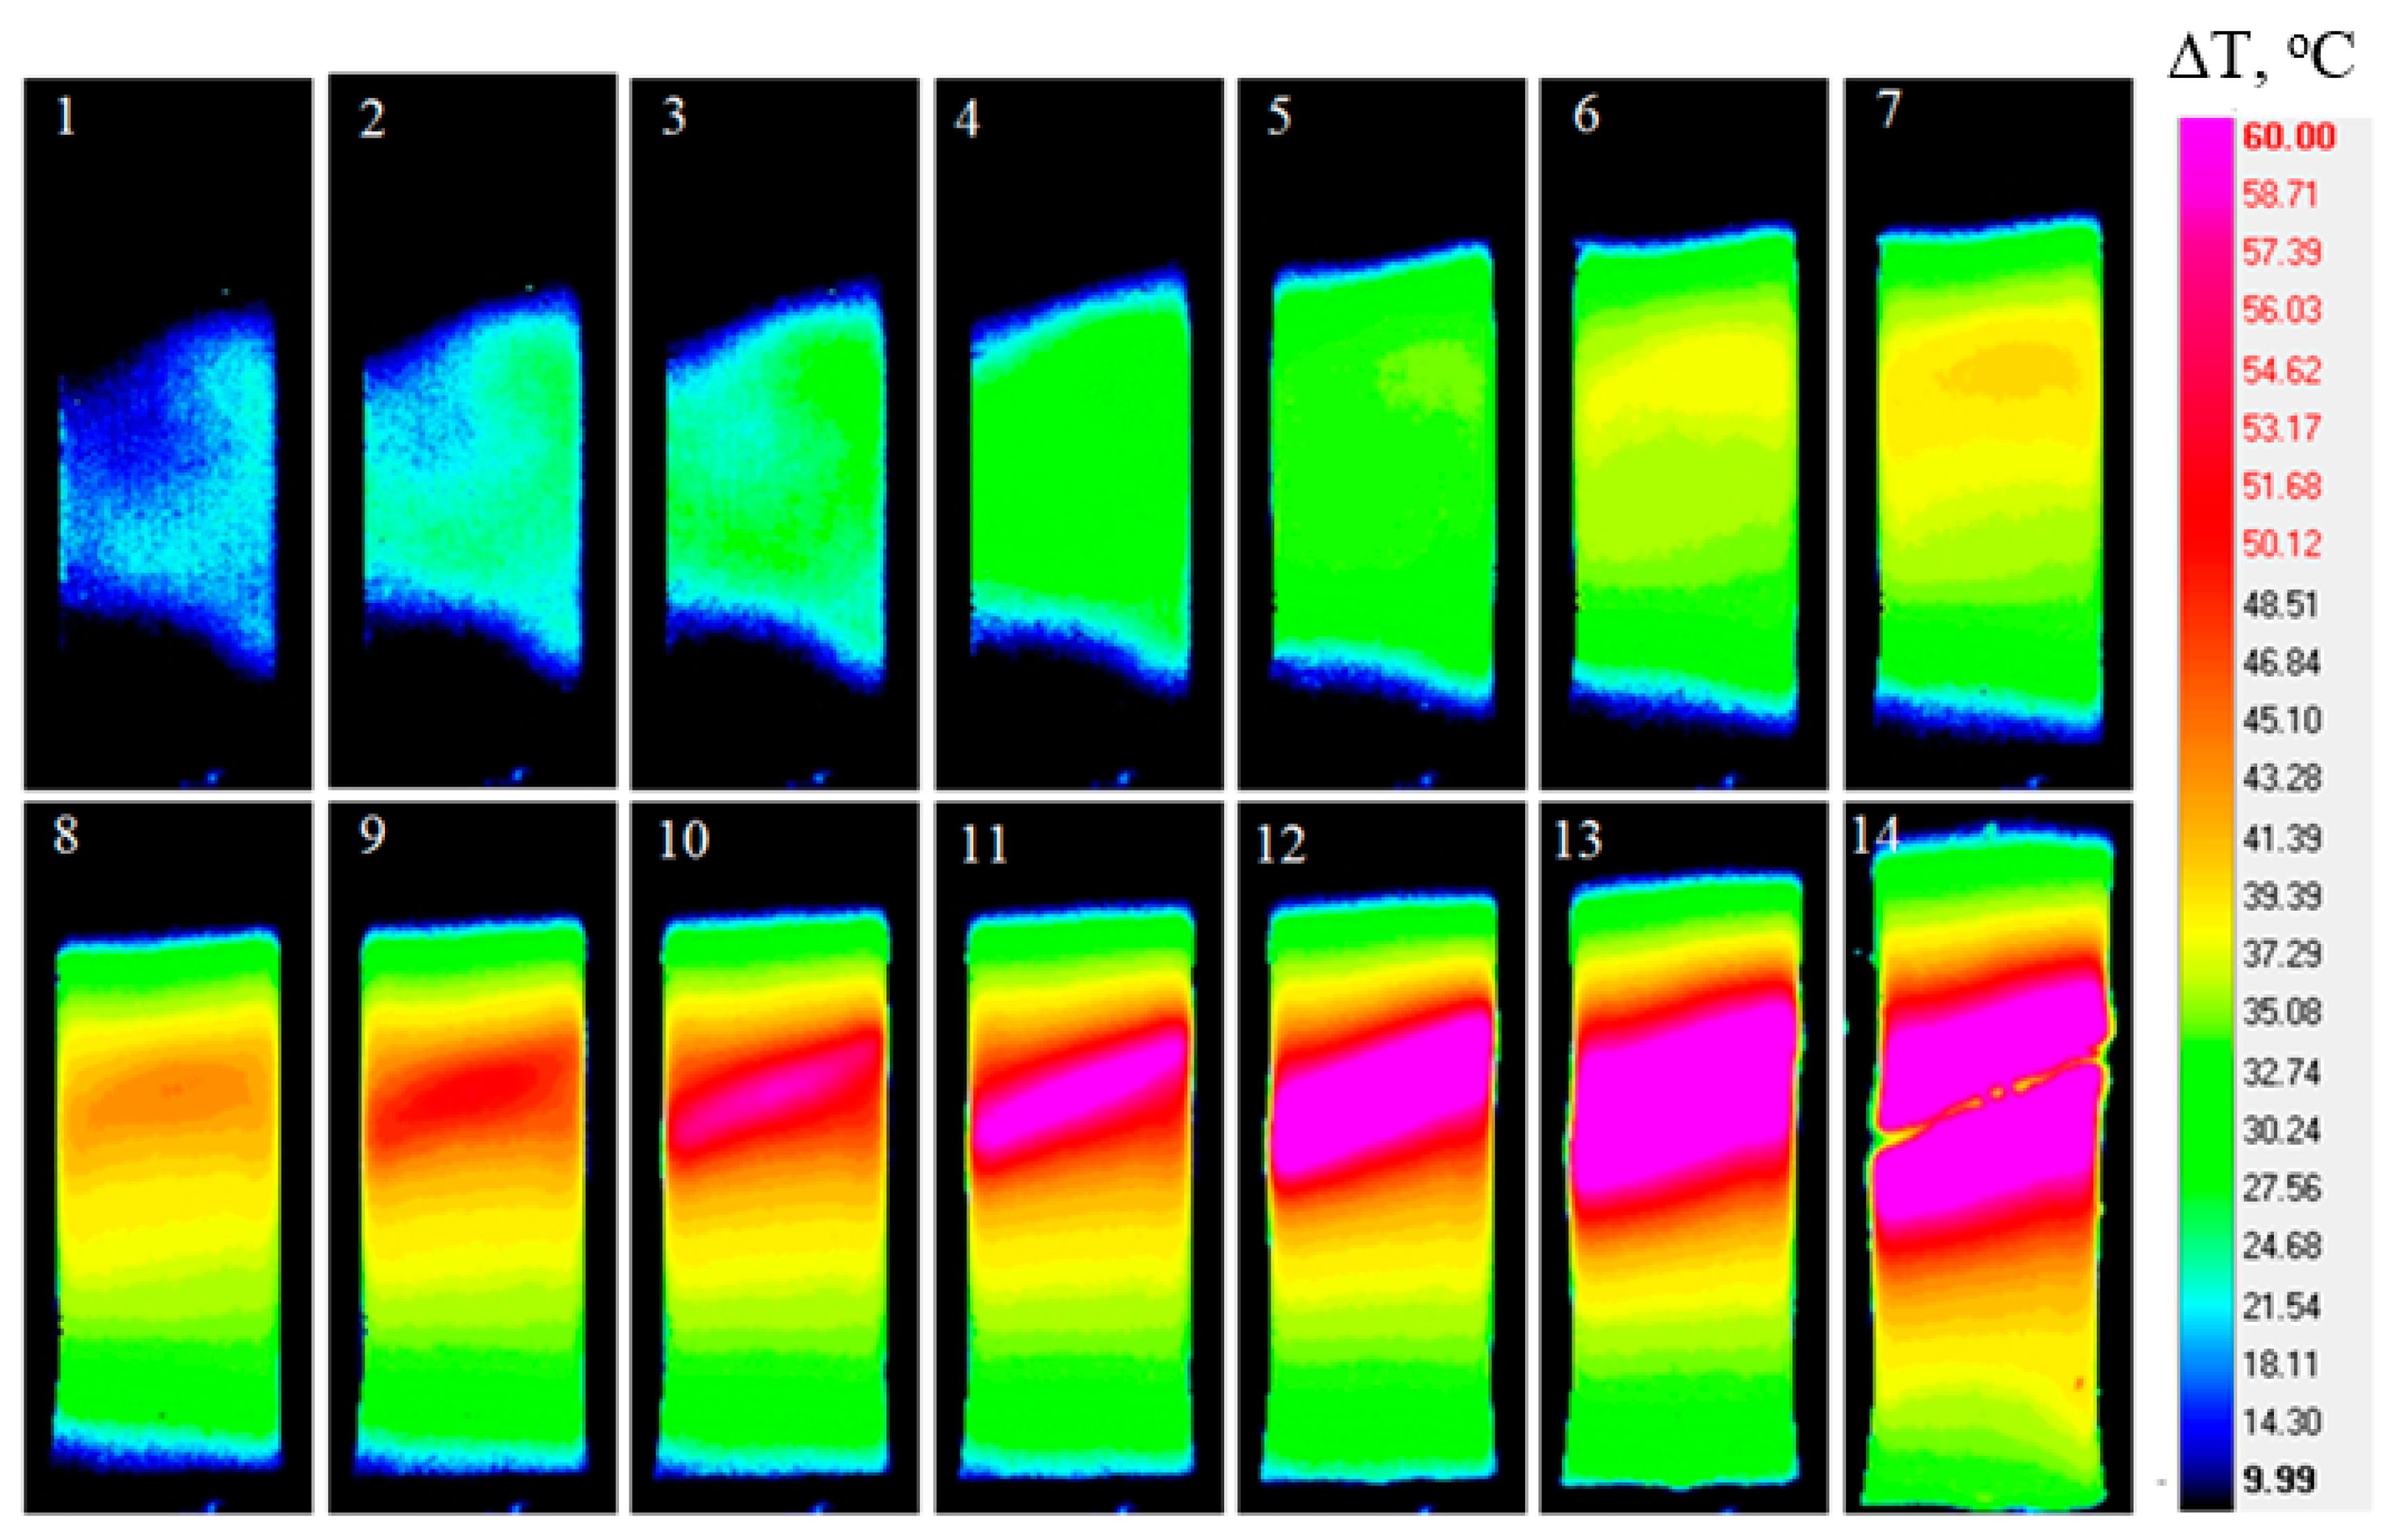
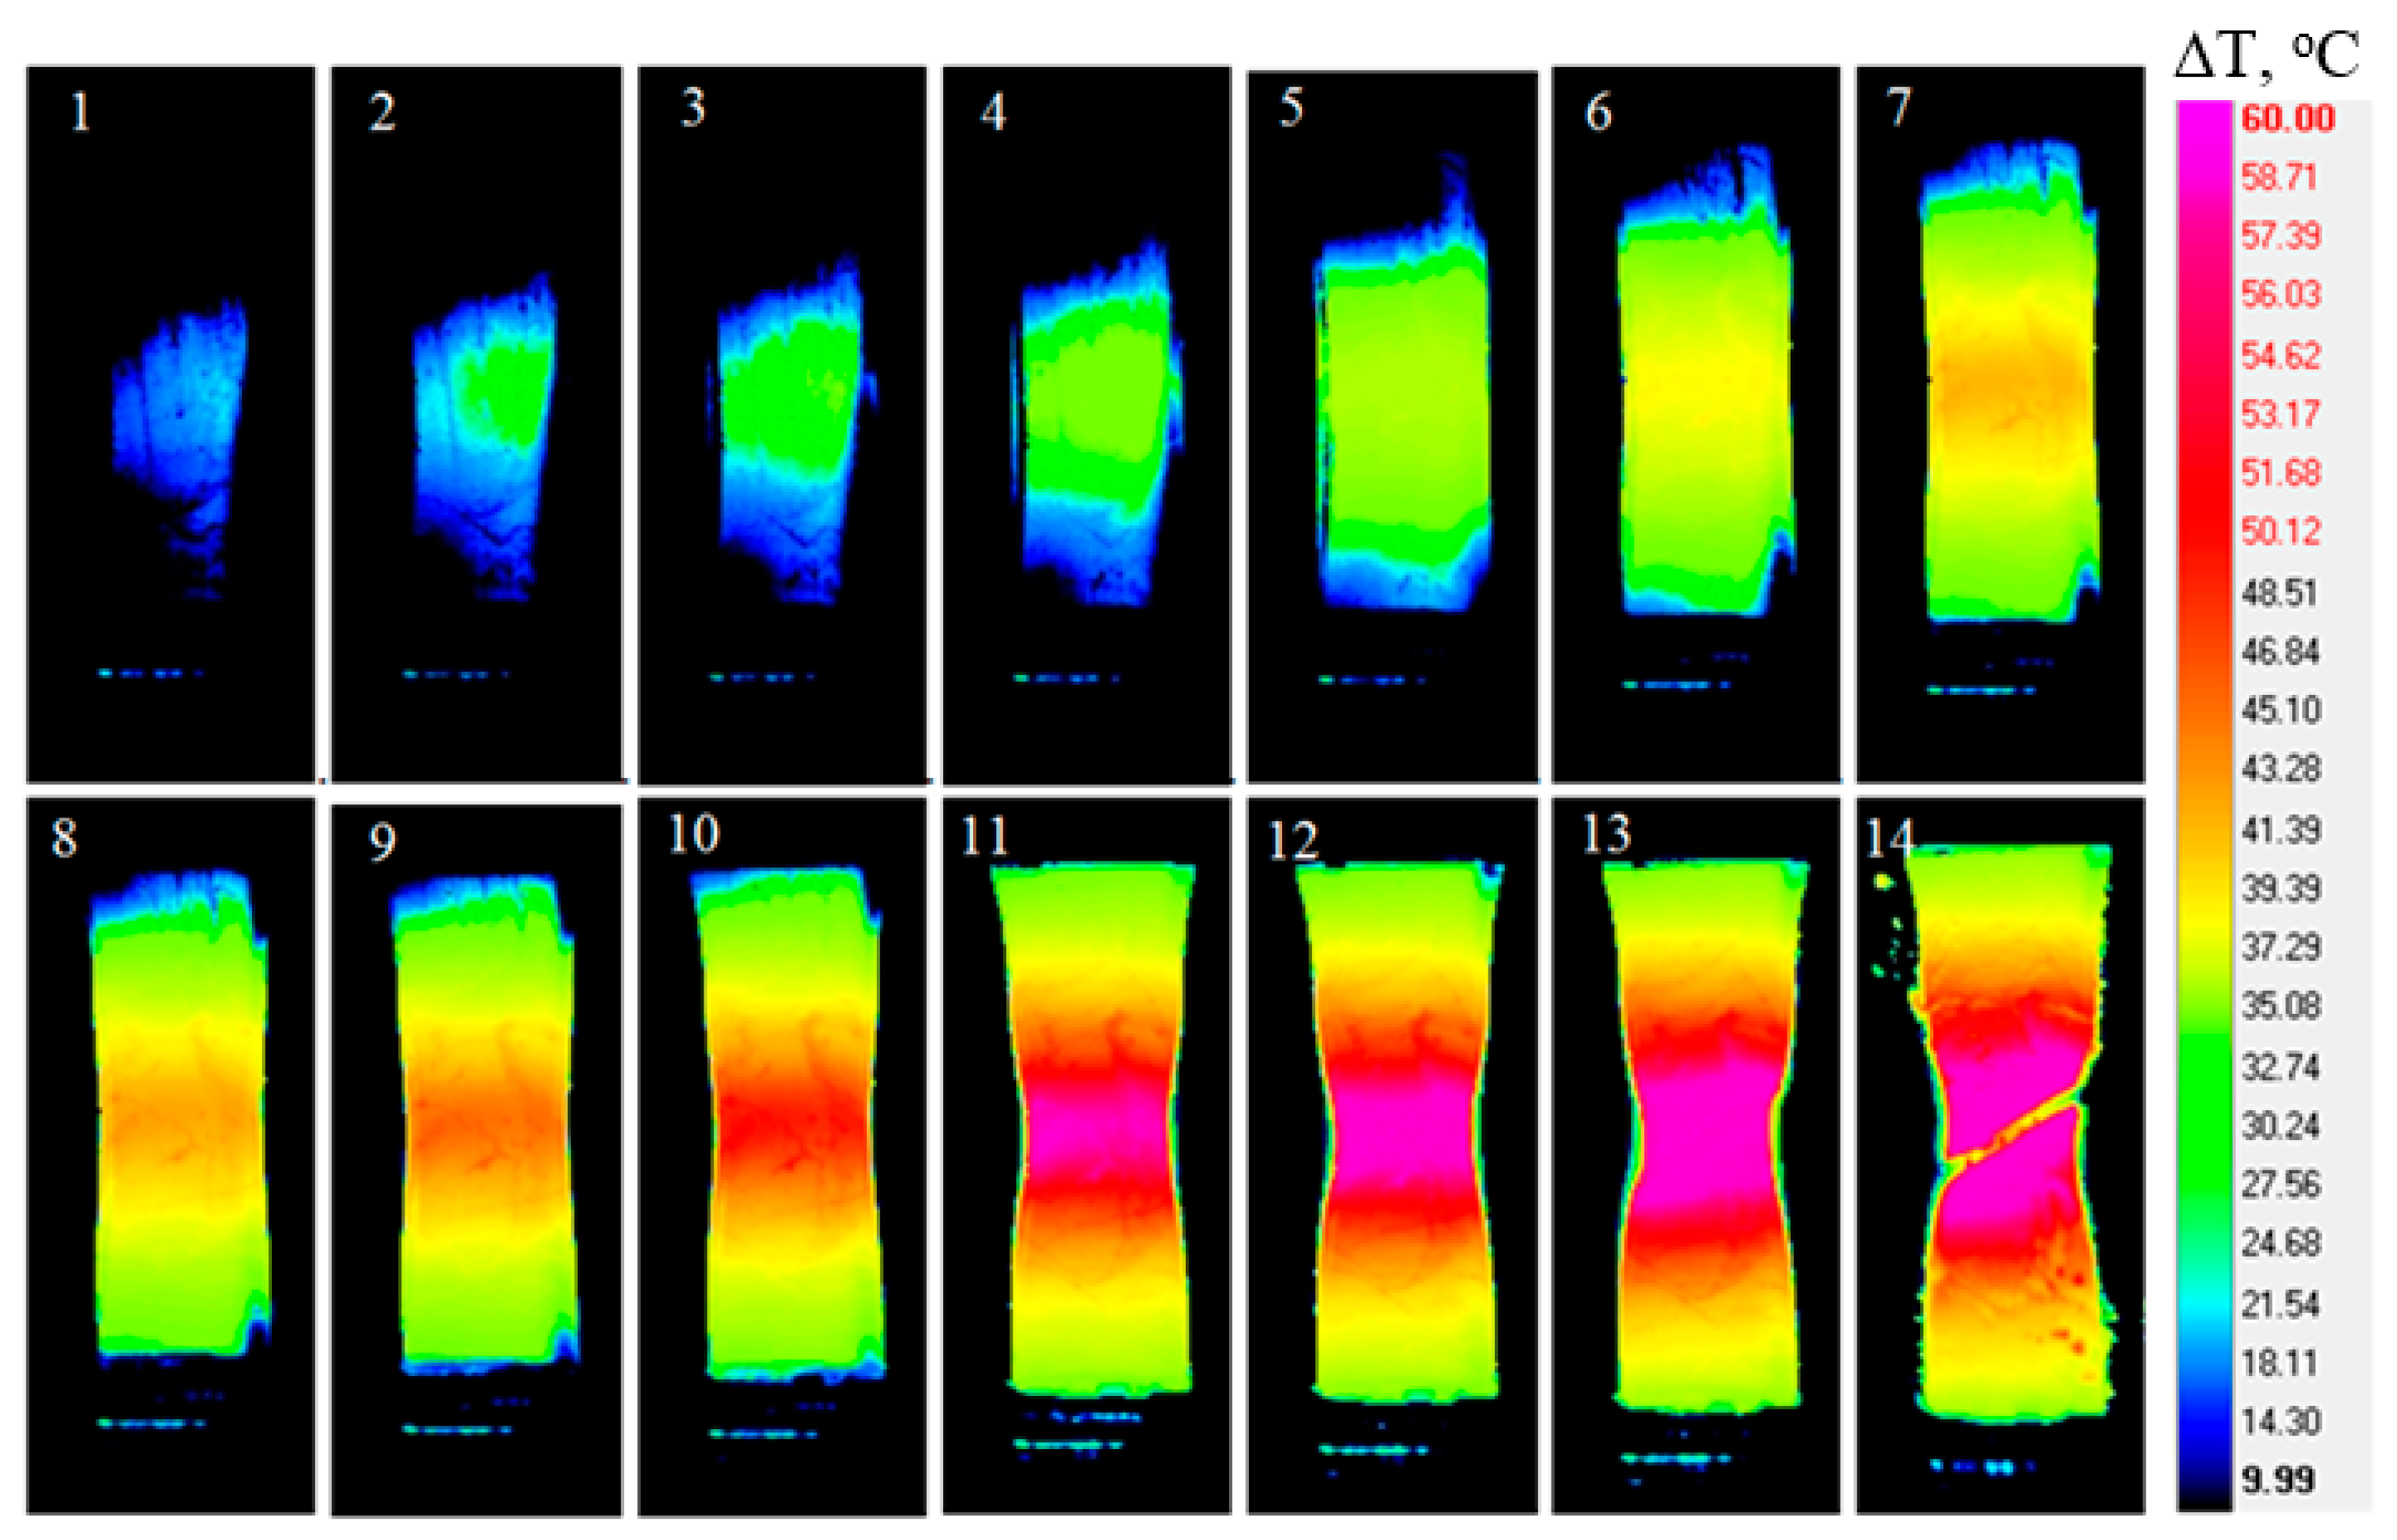
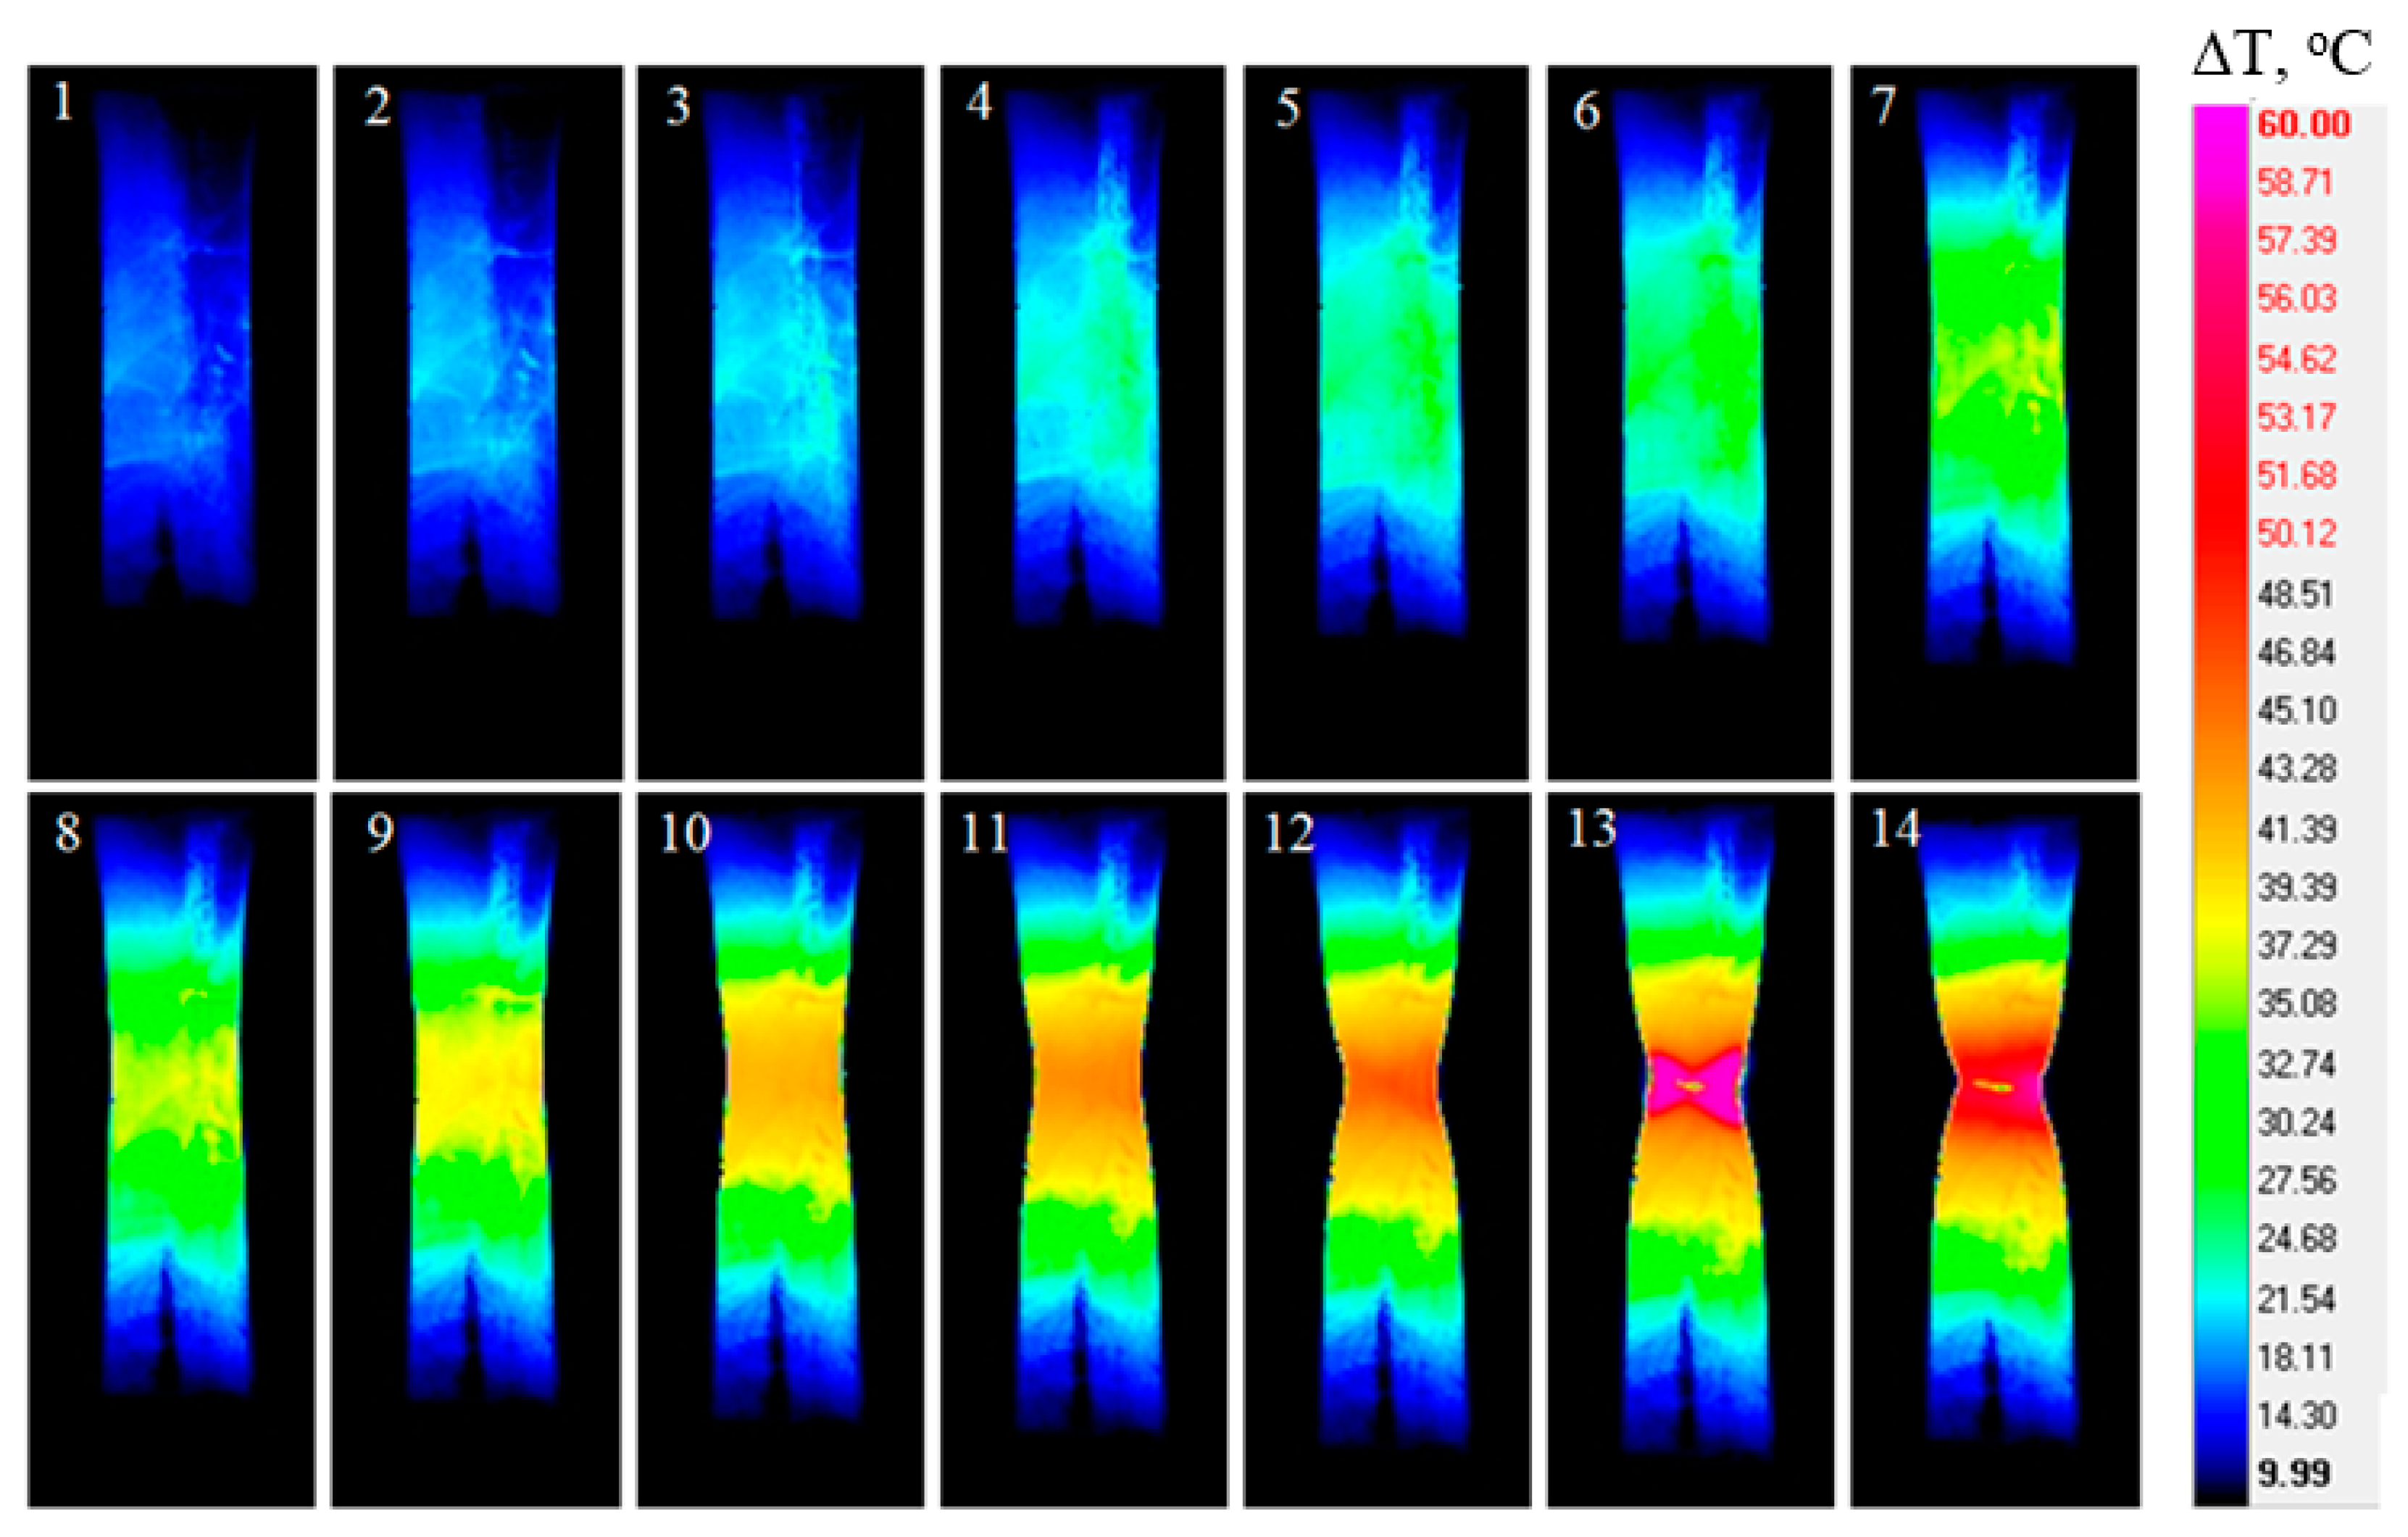
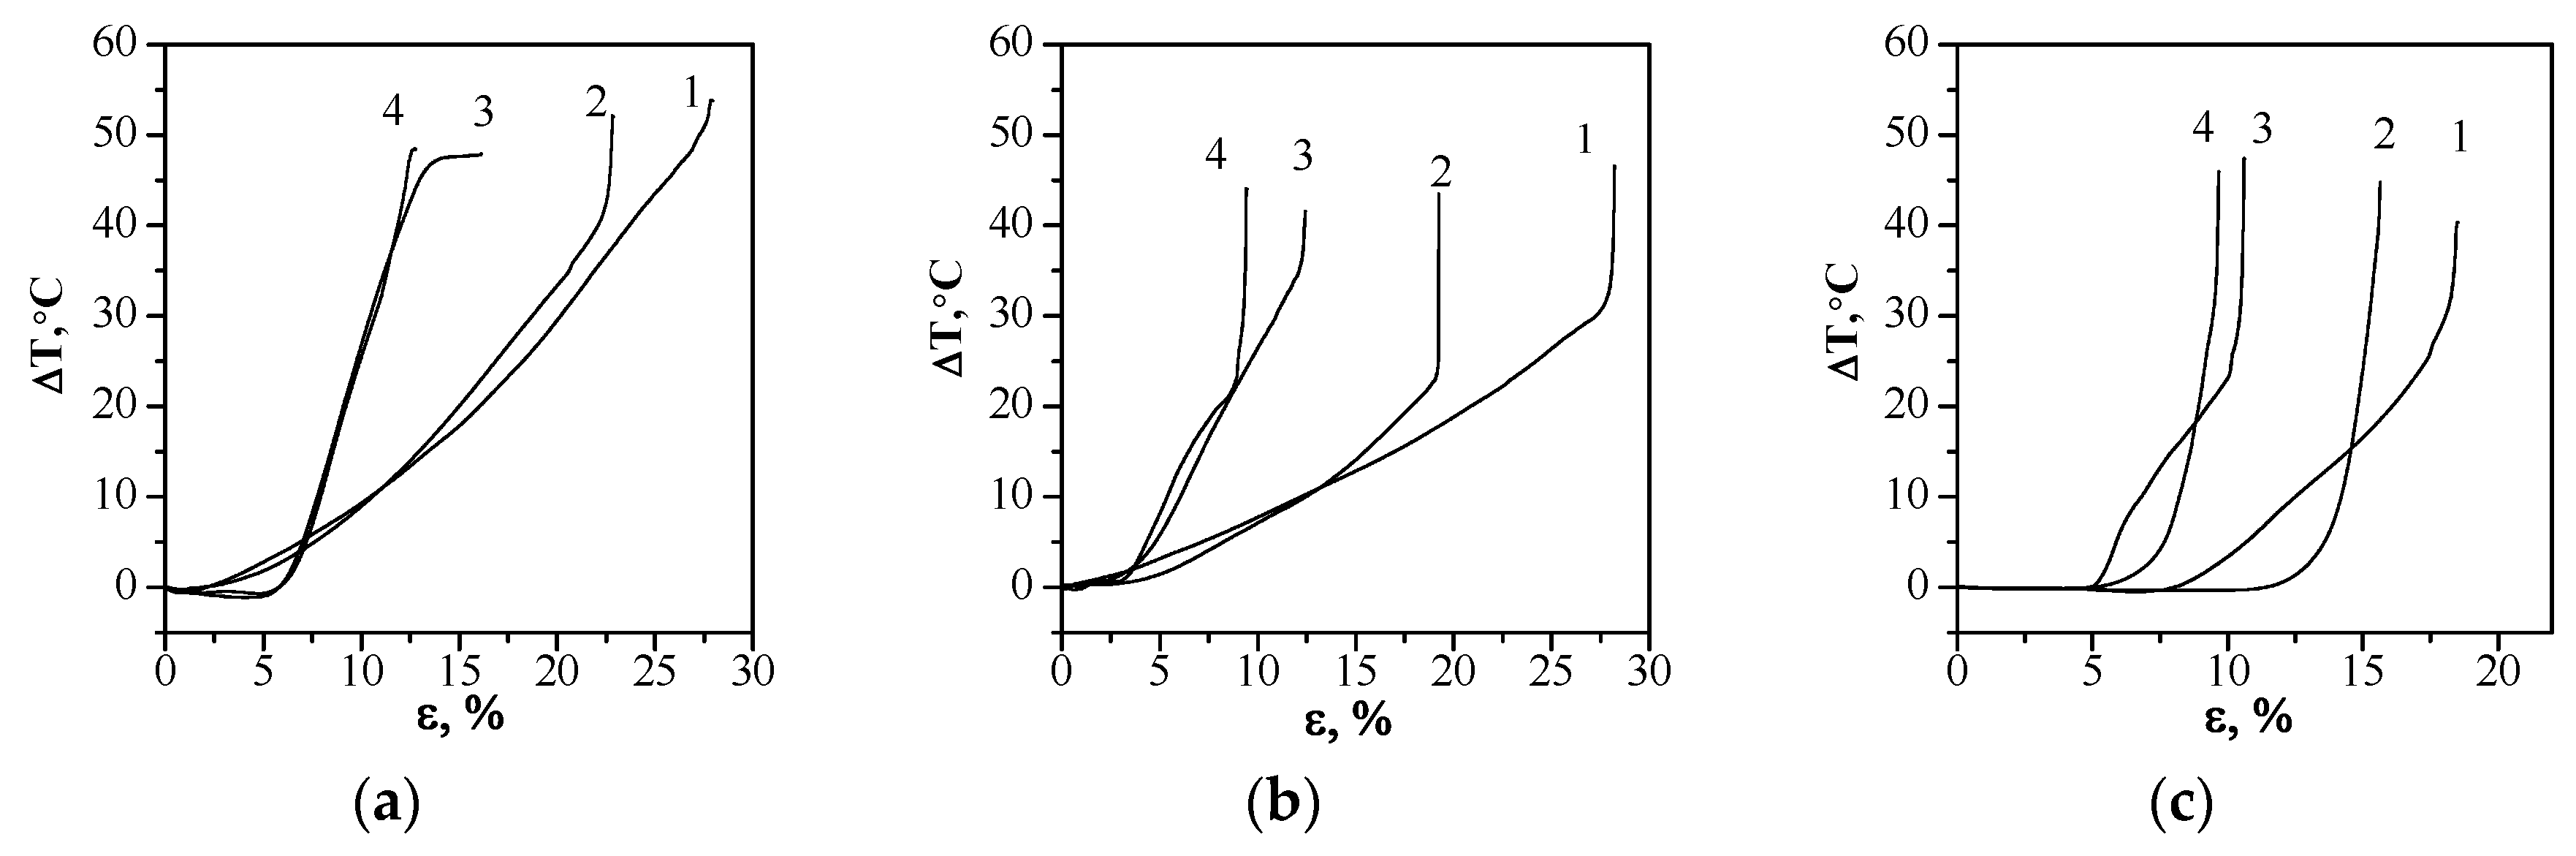
  • The temperature distributions that appear during a tensile test are unique for each alloy. These distributions depend on the material structure, the mechanical and thermal properties and the presence of defects in material. When applying a tensile load to UFG titanium and UFG Zr-1Nb, deformation bands arise within the elastic region of the specimens and the direction of the deformation corresponds to the maximum shear stresses. In UFG alloys, flow stresses are higher than that in CG state, thus causing more intensive energy dissipation. Therefore, when the alloys change to the UFG state, the deformation processes and the related temperature changes develop much faster due to the highly-stressed state of the UFG materials. This leads to a localization of plastic deformation in the strain zone and this subsequently leads to fracture. Unlike the CG state, the formation of a “neck” during the loading of all the UFG alloys is less evident and fracture predominantly occurs in a plane at an angle close to 45°. At low strain rates, the temperature distribution is caused not only by the effects of dissipation of mechanical energy but also by the ambient cooling of specimens. Hence, at low strain rates, the rate of temperature increase in the specimens is lower than at high strain rates.
  • The presence of defects in the structure of the studied alloys, which are in the highly-stressed UFG state, apparently causes a decrease in their thermal diffusivity and this leads to faster deformation and heat diffusion and causes specimen fracture to quasi-static tensile testing may allow the identification of the material structural state of a material before fracture.
  • Further research in the detection of thermal indications that precede deformation and fracture in bioinert alloys that are in different structural states and possess hidden structural macro-defects is related to a deeper study of the physics of formation of dissipative structures. This leads to a conclusion that changes in the temperature distributions are caused by microstructural features of alloys in different states.

Author Contributions

Conceptualization, Y.S.; Formal Analysis, V.V.; Investigation, A.C. and E.L.; Methodology, V.A.S. and V.V.S.; Resources, O.B. and A.E.; Software, A.K. and A.S.; Writing—original draft, M.K.

Funding

This study was performed under partial support of SB RAS Program of Fundamental Scientific Research for 2017-2020, No. III.23.2, project III.23.2.2 (tensile testing) and Tomsk Polytechnic University Competitiveness Enhancement Program (IR thermographic analysis).

Acknowledgments

The authors are grateful to A.I. Tolmachev for the preparation of alloy specimens in the UFG state.

Conflicts of Interest

The authors declare no conflict of interest.

References

  1. Zardiackas, L.D.; Kraay, M.J.; Freese, H.L. Titanium, Niobium, Zirconium, and Tantalum for Medical and Surgical Applications; ASTM Publ. STP 1471: Washington, WA, USA, 2006; p. 148. ISBN 0-8031-3497-5. [Google Scholar]
  2. Rechtin, J.; Torresani, E.; Ivanov, E.; Olevsky, E. Fabrication of titanium-niobium-zirconium-tantalium alloy (TNZT) bioimplant components with controllable porosity by spark plasma sintering. Materials 2018, 11, 181. [Google Scholar] [CrossRef] [PubMed]
  3. Valiev, R.Z.; Zhilyaev, A.P.; Langdon, T.G. Bulk Nanostructured Materials: Fundamentals and Applications; John Wiley & Sons: Hoboken, NJ, USA, 2014; p. 456. ISBN 9781118742679. [Google Scholar]
  4. Klevtsov, G.V.; Valiev, R.Z.; Klevtsova, N.A.; Zaripov, N.G.; Karavaeva, M.V. Strength and fracture mechanisms of nanostructured metallic materials under single kinds of loading. Met. Sci. Heat Treat. 2018, 59, 597–605. [Google Scholar] [CrossRef]
  5. Wu, H.; Jiang, J.; Liu, H.; Sun, J.; Gu, Y.; Tang, R.; Zhao, X.; Ma, A. Fabrication of an ultra-fine grained pure titanium with high strength and good ductility via ECAP plus cold rolling. Metals 2017, 7, 563. [Google Scholar] [CrossRef]
  6. Kwan, C.C.F.; Wang, Z. The cyclic deformation behavior of severe plastic deformation (SPD) metals and the influential factors. Metals 2012, 2, 41–55. [Google Scholar] [CrossRef]
  7. Jiang, Z.-H.; Li, N.; Zhang, H.-X.; Zhao, C.-Z. The effect of growth rate on the microstructure and tensile behavior of directionally solidified Ti-44Al-9Nb-1Cr-0.2W-0.2Y alloys. Metals 2018, 8, 535. [Google Scholar] [CrossRef]
  8. Wu, J.; Lü, Z.; Zhang, C.; Han, J.; Zhang, H.; Zhang, S.; Hayat, M.; Cao, P. Investigation of the deformation mechanism of a near titanium alloy through isothermal compression. Metals 2017, 7, 498. [Google Scholar] [CrossRef]
  9. Kolli, R.P.; Devaraj, A. A review of metastable beta titanium alloys. Metals 2018, 8, 506. [Google Scholar] [CrossRef]
  10. Niinomi, M.; Liu, Y.; Nakai, M.; Liu, H.; Li, H. Biomedical titanium alloys with Young’s moduli close to that of cortical bone. Regener. Biomater. 2016, 3, 173–185. [Google Scholar] [CrossRef] [PubMed] [Green Version]
  11. Fedorova, M.; Bannikova, A.; Terekhina, O.; Plekhov, O. Heat dissipation energy under fatigue based on infrared data processing. Qual. Infrared Thermogr. J. 2014, 11, 2–9. [Google Scholar] [CrossRef]
  12. Naimark, O.B.; Bayandin, Y.V.; Leontiev, V.A.; Panteleev, I.A.; Plekhov, O.A. Structural-scaling transitions and thermodynamic and kinetic effects in submicro-(nano-)crystalline bulk materials. Phys. Mesomech. 2009, 12, 239–248. [Google Scholar] [CrossRef]
  13. Milovanović, B.; Banjad Pečur, I. Review of active IR thermography for detection and characterization of defects in reinforced concrete. J. Imaging 2016, 2, 11. [Google Scholar] [CrossRef]
  14. Brock, L.M. Effects of thermoelasticity and a Von Mises condition in rapid steady-state quasi-brittle fracture. Int. J. Struct. 1996, 33, 4131–4142. [Google Scholar] [CrossRef]
  15. Grinzato, E.; Vavilov, V.; Bison, P.G.; Marinetti, S. Methodology of Processing Experimental Data in Transient Thermal NDT. In Proceedings of the Thermosense XVII: An International Conference on Thermal Sensing and Imaging Diagnostic Applications, Orlando, FL, USA, 19–21 April 1995; pp. 62–65. [Google Scholar]
  16. Moyseychik, E.A. Heat generation and fracture initiation in stretched steel plate with a process-induced structural defect. J. Appl. Mech. Tech. Phys. 2013, 54, 116–123. [Google Scholar] [CrossRef]
  17. Moyseychik, E.A.; Vavilov, V.P. Analyzing patterns of heat generated by the tensile loading of steel rods containing discontinuity-like defects. Int. J. Damage Mech. 2018, 27, 950–960. [Google Scholar] [CrossRef]
  18. Sharkeev, Y.P.; Vavilov, V.P.; Belyavskaya, O.A.; Skripnyak, V.A.; Nesteruk, D.A.; Kozulin, A.A.; Kim, V.M. Analyzing deformation and damage of VT1-0 titanium in different structural states by using infrared thermography. J. Nondestruct. Eval. 2016, 35, 42–47. [Google Scholar] [CrossRef]
  19. Sharkeev, Y.P.; Vavilov, V.P.; Skripnyak, V.A.; Klimenov, V.A.; Belyavskaya, O.A.; Nesteruk, D.A.; Kozulin, A.A.; Tolmachev, A.I. Evolution of the temperature field during deformation and fracture of specimens of coarse-grained and ultrafine-grained titanium. Russ. J. Nondestruct. Test. 2011, 47, 701–706. [Google Scholar] [CrossRef]
  20. Weichert, R.; Schönert, K. Heat generation at the tip of a moving crack. J. Mech. Phys. Solid 1978, 26, 151–161. [Google Scholar] [CrossRef]
  21. Pieczyska, E.A.; Maj, M.; Golasiński, K.; Staszczak, M.; Furuta, T.; Kuramoto, S. Thermomechanical studies of yielding and strain localization phenomena of gum metal under tension. Materials 2018, 11, 567. [Google Scholar] [CrossRef] [PubMed]
  22. Muc, A.; Chwał, M.; Romanowicz, P.; Stawiarski, A. Fatigue-damage evolution of notched composite multilayered structures under tensile loads. J. Compos. Sci. 2018, 2, 27. [Google Scholar] [CrossRef]
  23. Eroshenko, A.Y; Mairambekova, A.M.; Sharkeev, Y.P.; Kovalevskaya, Z.G.; Khimich, M.A.; Uvarkin, P.V. Structure, phase composition and mechanical properties in bioinert zirconium-based alloy after severe plastic deformation. Lett. Mater. 2017, 7, 469–472. [Google Scholar] [CrossRef] [Green Version]
  24. Davis, J.R. Introduction to tensile testing. In Tensile Testing, 2nd ed.; ASM International: Almere, The Netherlands, 2004; p. 283. ISBN 978-0-87170-806-9. [Google Scholar]
  25. Brandon, D.; Kaplan, W.D. Microstructural Characterization of Materials; John Wiley and Sons Ltd.: Haifa, Israel, 1999; p. 424. ISBN 0471 985015. [Google Scholar]
  26. Glezer, A.M.; Kozlov, E.V.; Koneva, N.A.; Popova, N.A.; Kurzina, I.A. Fundamentals of Plastic Deformation of Nanostructured Materials; FIZMATLIT: Moscow, Russia, 2016; p. 304. ISBN 978-5-9221-1689-3. (In Russian) [Google Scholar]
  27. Vu, Q.H.; Halm, D.; Nadot, Y. High cycle fatigue of 1045 steel under complex loading: Mechanisms map and damage modelling. Int. J. Damage Mech. 2014, 23, 377–410. [Google Scholar] [CrossRef]
  28. Lin, M.-R.; Wagoner, R.H. An experimental investigation of deformation induced heating during tensile testing. Metall. Mater. Trans. A 1987, 18, 1035–1042. [Google Scholar] [CrossRef]
  29. Robinson, A.F.; Dulieu-Barton, J.M.; Quinn, S.; Burguete, R.L. Paint coating characterization for thermoelastic stress analysis of metallic materials. Meas. Sci. Technol. 2010, 21, 085502. [Google Scholar] [CrossRef]
  30. Panin, V.E. Foundations of physical mesomechanics. Phys. Mesomech. 1998, 1, 5–20. [Google Scholar]
  31. Mroz, Z.; Oliferuk, W. Energy balance and identification of hardening moduli in plastic deformation processes. Int. J. Plast. 2002, 18, 379–397. [Google Scholar] [CrossRef]
  32. Farren, W.S.; Taylor, G.I. The heat developed during plastic extension of metals. Proc. R. Soc. Lond. 1925, 107, 422–451. [Google Scholar] [CrossRef]
  33. Amiri, M.; Naderi, M.; Khonsari, M.M. An experimental approach to evaluate the critical damage. Int. J. Damage Mech. 2011, 20, 89–112. [Google Scholar] [CrossRef]
  34. Plekhov, O.A.; Panteleev, I.A.; Naimark, O.B. Energy accumulation and dissipation in metals as a result of structural-scaling transitions in a mesodefect ensemble. Phys. Mesomech. 2007, 10, 294–301. [Google Scholar] [CrossRef]
  35. Hilarov, V.L.; Slutsker, A.I. Description of the thermoelastic effect in solids in a wide temperature range. Phys. Solid State 2014, 56, 2493–2495. [Google Scholar] [CrossRef]
  36. Sirinakorn, T.; Uthaisangsuk, V. Investigation of damage initiation in high-strength dual-phase steels using cohesive zone model. Int. J. Damage Mech. 2016, 27, 409–438. [Google Scholar] [CrossRef]
  37. Larikov, L.N.; Yurchenko, Y.F. Thermal Properties of Metals and Alloys. Handbook; Naukova Dumka: Kiev, Russia, 1985; p. 438. (In Russian) [Google Scholar]
  38. Kirillov, P.L.; Terentyeva, M.I.; Deniskina, N.B. Thermophysical properties of materials for nuclear engineering. In A Tutorial and Collection of Data; The IAEA: Vienna, Austria, 2008; p. 200. ISBN 978-92-0-106508-7. [Google Scholar]
  39. Kolmogorov, G.L.; Snigireva, M.V. Elastic and thermophysical properties of transversely isotropic superconducting composite materials. In Scientific Research and Innovations; Perm State Technical University: City of Perm, Russia, 2007; Volume 3, pp. 31–40. (In Russian) [Google Scholar]
  40. Gorbatov, V.I.; Polev, V.F.; Pilugin, V.P.; Korshunov, L.G.; Smirnov, A.L.; Talutz, S.G.; Brytkov, D.A. Thermal diffusivity of submicro- and nanocrystalline niobium, titanium, and zirconium at high temperatures. High Temp. 2013, 51, 482–485. [Google Scholar] [CrossRef]
Figure 1. Test specimen scheme.
Metals 08 00703 g001
Figure 2. “Engineering stress-engineering strain” diagrams for VT1-0 titanium (a), Zr-1Nb (b) and Ti-45Nb (c) alloys.
Metals 08 00703 g002
Figure 3. True stress-true strain diagrams for VT1-0 titanium (a), Zr-1Nb (b) and Ti-45Nb (c) alloys in the CG (curves 1) and UFG (curves 2) states.
Metals 08 00703 g003
Figure 4. IR thermograms of VT1-0 titanium in the CG state during tensile test: 1—ε = 11.2%, 2—ε = 11.9%, 3—ε = 13%, 4—ε = 15.4%, 5—ε = 16.9%, 6—ε = 18.6%, 7—ε = 19.4%, 8—ε = 20.7%, 9—ε = 21.5%, 10—ε = 22.8%, 11—ε = 24.2%, 12—ε = 25.2%, 13—ε = 25.4%, 14—ε = 25.5%.
Metals 08 00703 g004
Figure 5. IR thermograms of VT1-0 titanium in the UFG state during tensile test: 1—ε = 3.5%, 2—ε = 3.8%, 3—ε = 3.9%, 4—ε = 4.1%, 5—ε = 4.5%, 6—ε = 5.5%, 7—ε = 6.3%, 8—ε = 6.8%, 9—ε = 7.4%, 10—ε = 7.8%, 11—ε = 9.6%, 12—ε = 10.4%, 13—ε = 11%, 14—ε = 11.4%.
Metals 08 00703 g005
Figure 6. IR thermograms of Zr-1%Nb alloy in the CG state during tensile test: 1—ε = 10.8%, 2—ε = 11.7%, 3—ε = 12.6%, 4—ε = 13.5%, 5—ε = 15.2%, 6—ε = 16.6%, 7—ε = 18.3%, 8—ε = 19.2%, 9—ε = 20.6%, 10—ε = 22.7%, 11—ε = 24.1%, 12—ε = 25.8%, 13—ε = 26.6%, 14—ε = 27.2%.
Metals 08 00703 g006
Figure 7. IR thermograms of Zr-1Nb alloy in the UFG state during tensile test: 1—ε = 9.3%, 2—ε = 9.6%, 3—ε = 9.8%, 4—ε = 10.7%, 5—ε = 11%, 6—ε = 11.3%, 7—ε = 11.9%, 8—ε = 12.5%, 9—ε = 12.5%, 10—ε = 13.1%, 11—ε = 14.1%, 12—ε = 14.7%, 13—ε = 14.9%, 14—ε = 15%.
Metals 08 00703 g007
Figure 8. IR thermograms of Ti-45 Nb alloy in the CG state during tensile test: 1—ε = 4.6%, 2—ε = 4.8%, 3—ε = 5.2%, 4—ε = 6.1%, 5—ε = 7.1%, 6—ε = 7.9%, 7—ε = 8.8%, 8—ε = 9.8%, 9—ε = 10.5%, 10—ε = 11.6%, 11—ε = 12.3%, 12—ε = 14.2%, 13—ε = 14.5%, 14—ε = 14.8%.
Metals 08 00703 g008
Figure 9. IR thermograms of Ti-45Nb alloy in the UFG state during tensile test: 1—ε = 3.9%, 2—ε = 4%, 3—ε = 4.1%, 4—ε = 4.3%, 5—ε = 4.5%, 6—ε = 4.6%, 7—ε = 4.8%, 8—ε = 4.9%, 9—ε = 5%, 10—ε = 5.2%, 11—ε = 5.3%, 12—ε = 5.4%, 13—ε = 5.7%, 14—ε = 6%.
Metals 08 00703 g009
Figure 10. Temperature evolutions on surface of specimens subjected to tensile test: VT1-0 titanium (a), Zr-1Nb (b) and Ti-45Nb (c) alloys.
Metals 08 00703 g010
Figure 11. SEM images of the surface of the fracture specimens subjected to tensile test: VT1-0 titanium specimens (a,b,g), Zr-1 Nb (c) and Ti-45Nb (e,f) alloys in the CG (a,c,e) and UFG (b,d,f,g,h) states.
Metals 08 00703 g011aMetals 08 00703 g011b
Table 1. Mechanical properties of VT1-0 titanium, Zr-1Nb and Ti-45Nb alloys in different structural states subjected to tensile test.
MaterialYield Stress σ02, MPa
Mean ± SD */Min/Max (N **)
Ultimate Tensile Strength σuts, MPa
Mean ± SD/Min/Max (N)
Plastic Deformation εp, %
Mean ± SD/Min/Max (N)
VT1-0, CG337 ± 10/320/350 (8)476 ± 12/450/495 (8)24 ± 0.9/23/25 (8)
VT1-0, UFG728 ± 47/650/800 (9)974 ± 18/940/1000 (9)10 ± 0.6/9/11 (9)
Zr-1Nb, CG262 ± 8/255/275 (8)410 ± 10/390/425 (8)26.5 ± 0.8/25/27 (8)
Zr-1Nb, UFG503 ± 8/490/515 (9)714 ± 20/680/750 (9)15.5 ± 0.6/14,5/16 (9)
Ti-45Nb, CG345 ± 13/320/360 (11)707 ± 60/620/790 (11)14.5 ± 0.5/14/15 (11)
Ti-45Nb, UFG415 ± 58/300/500 (10)1155 ± 83/1020/1280 (10)6.5 ± 0.3/6/7 (10)
* SD—standard deviation; ** N—number of specimens tested.
Table 2. Specific work of strain in quasi-static tensile test.
MaterialSpecific Work of Strain for Samples with High Mechanical Properties, MJ/m3Specific Work of Strain for Samples with Low Mechanical Properties, MJ/m3
VT1-0, CG135109
VT1-0, UFG11183
Zr-1Nb, CG112108
Zr-1Nb, UFG111107
Ti-45Nb, CG129100
Ti-45Nb, UFG6460
Table 3. Thermal properties of alloys [37,38,39,40].
Metal/AlloyDensity, kg/m3Melting Temperature, °CHeat Capacity Cp, J/(kg·K) at 300 KThermal Conductivity λ, W/(mK) at 300 KThermal Diffusivity at 300 K, 10−6 m2/s
Ti4510167152220.08.5 *
Zr6510185027621.411.9 *
Nb8580250026853.023.0 *
Titanium VT1-04500172552019.38.3 *
Zr-1Nb6550183732018.08.6 * (10.3) **
Ti-45Nb6336 ***-406 ***44.5 ***17.4 ***
* Calculated by a = λ/(Cpρ). ** Value recommended in [38]. *** Calculated by alloy composition.

